Weissport East, PA Map & Demographics
Weissport East Map
Weissport East Overview
$31,911
PER CAPITA INCOME
$80,696
AVG FAMILY INCOME
$74,527
AVG HOUSEHOLD INCOME
0.32
INEQUALITY / GINI INDEX
1,551
TOTAL POPULATION
767
MALE POPULATION
784
FEMALE POPULATION
97.83
MALES / 100 FEMALES
102.22
FEMALES / 100 MALES
38.7
MEDIAN AGE
2.7
AVG FAMILY SIZE
2.1
AVG HOUSEHOLD SIZE
918
LABOR FORCE [ PEOPLE ]
74.3%
PERCENT IN LABOR FORCE
22.3%
UNEMPLOYMENT RATE
Income in Weissport East
Income Overview in Weissport East
Per Capita Income in Weissport East is $31,911, while median incomes of families and households are $80,696 and $74,527 respectively.
| Characteristic | Number | Measure |
| Per Capita Income | 1,551 | $31,911 |
| Median Family Income | 390 | $80,696 |
| Mean Family Income | 390 | $77,371 |
| Median Household Income | 734 | $74,527 |
| Mean Household Income | 734 | $68,127 |
| Income Deficit | 390 | $0 |
| Wage / Income Gap (%) | 1,551 | 0.00% |
| Wage / Income Gap ($) | 1,551 | 100.00¢ per $1 |
| Gini / Inequality Index | 1,551 | 0.32 |
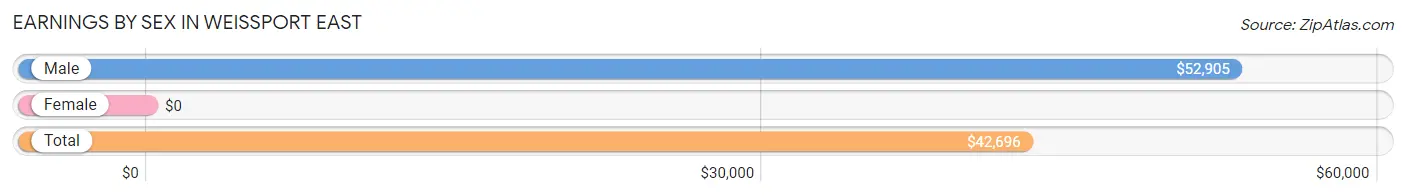
Earnings by Sex in Weissport East
| Sex | Number | Average Earnings |
| Male | 460 (50.9%) | $52,905 |
| Female | 443 (49.1%) | $0 |
| Total | 903 (100.0%) | $42,696 |
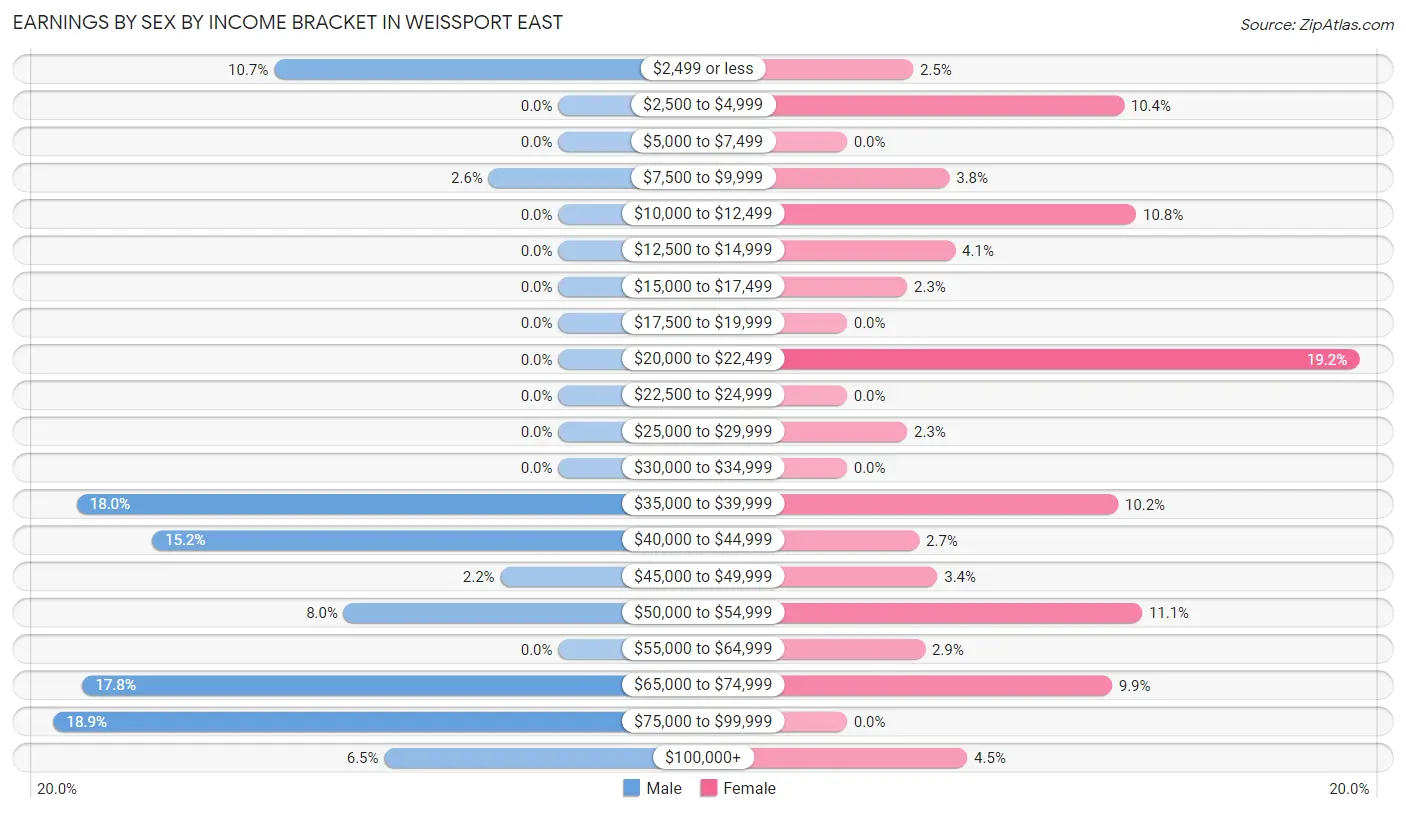
Earnings by Sex by Income Bracket in Weissport East
The most common earnings brackets in Weissport East are $75,000 to $99,999 for men (87 | 18.9%) and $20,000 to $22,499 for women (85 | 19.2%).
| Income | Male | Female |
| $2,499 or less | 49 (10.6%) | 11 (2.5%) |
| $2,500 to $4,999 | 0 (0.0%) | 46 (10.4%) |
| $5,000 to $7,499 | 0 (0.0%) | 0 (0.0%) |
| $7,500 to $9,999 | 12 (2.6%) | 17 (3.8%) |
| $10,000 to $12,499 | 0 (0.0%) | 48 (10.8%) |
| $12,500 to $14,999 | 0 (0.0%) | 18 (4.1%) |
| $15,000 to $17,499 | 0 (0.0%) | 10 (2.3%) |
| $17,500 to $19,999 | 0 (0.0%) | 0 (0.0%) |
| $20,000 to $22,499 | 0 (0.0%) | 85 (19.2%) |
| $22,500 to $24,999 | 0 (0.0%) | 0 (0.0%) |
| $25,000 to $29,999 | 0 (0.0%) | 10 (2.3%) |
| $30,000 to $34,999 | 0 (0.0%) | 0 (0.0%) |
| $35,000 to $39,999 | 83 (18.0%) | 45 (10.2%) |
| $40,000 to $44,999 | 70 (15.2%) | 12 (2.7%) |
| $45,000 to $49,999 | 10 (2.2%) | 15 (3.4%) |
| $50,000 to $54,999 | 37 (8.0%) | 49 (11.1%) |
| $55,000 to $64,999 | 0 (0.0%) | 13 (2.9%) |
| $65,000 to $74,999 | 82 (17.8%) | 44 (9.9%) |
| $75,000 to $99,999 | 87 (18.9%) | 0 (0.0%) |
| $100,000+ | 30 (6.5%) | 20 (4.5%) |
| Total | 460 (100.0%) | 443 (100.0%) |
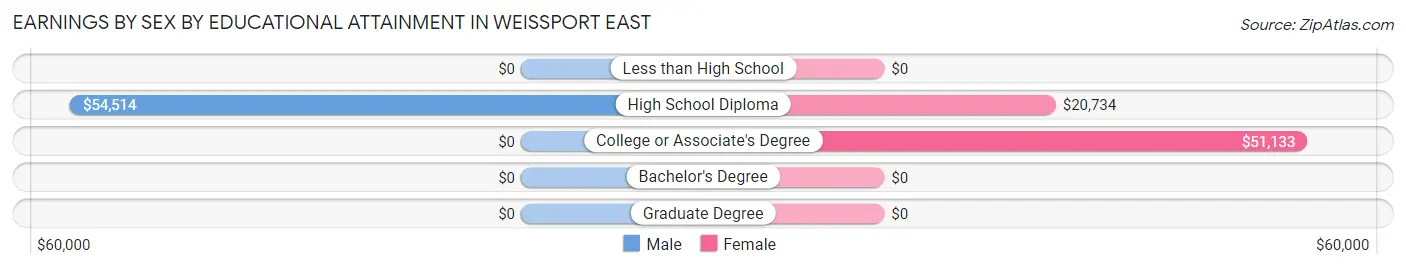
Earnings by Sex by Educational Attainment in Weissport East
| Educational Attainment | Male Income | Female Income |
| Less than High School | - | - |
| High School Diploma | $54,514 | $20,734 |
| College or Associate's Degree | - | - |
| Bachelor's Degree | - | - |
| Graduate Degree | - | - |
| Total | $52,905 | $0 |
Family Income in Weissport East
Family Income Brackets in Weissport East
According to the Weissport East family income data, there are 158 families falling into the $75,000 to $99,999 income range, which is the most common income bracket and makes up 40.5% of all families.
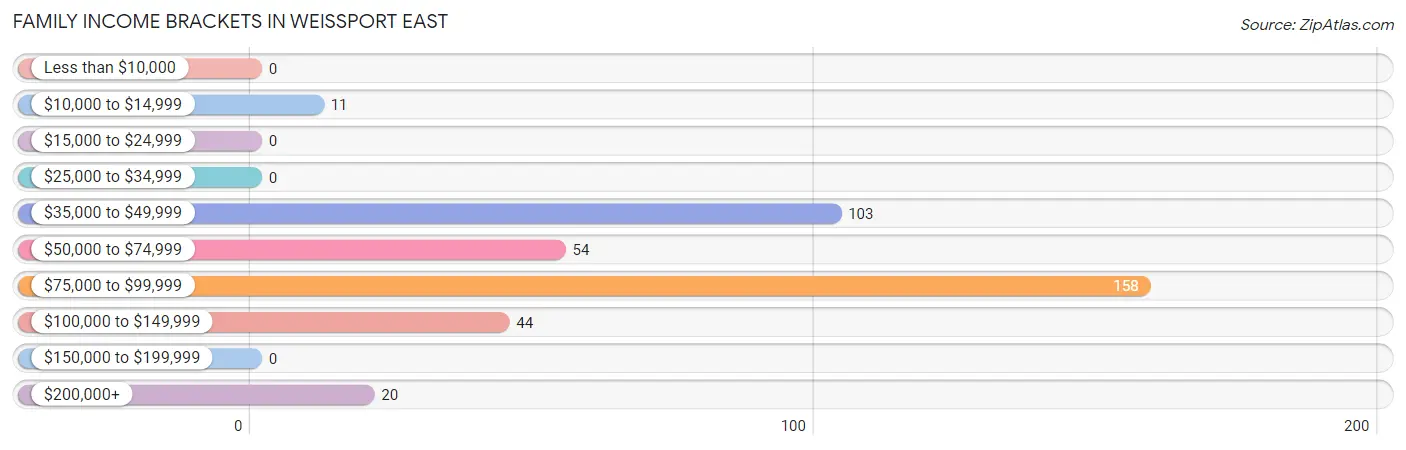
| Income Bracket | # Families | % Families |
| Less than $10,000 | 0 | 0.0% |
| $10,000 to $14,999 | 11 | 2.8% |
| $15,000 to $24,999 | 0 | 0.0% |
| $25,000 to $34,999 | 0 | 0.0% |
| $35,000 to $49,999 | 103 | 26.4% |
| $50,000 to $74,999 | 54 | 13.8% |
| $75,000 to $99,999 | 158 | 40.5% |
| $100,000 to $149,999 | 44 | 11.3% |
| $150,000 to $199,999 | 0 | 0.0% |
| $200,000+ | 20 | 5.1% |
Family Income by Famaliy Size in Weissport East
3-person families (89 | 22.8%) account for the highest median family income in Weissport East with $80,182 per family, while 2-person families (233 | 59.7%) have the highest median income of $29,958 per family member.
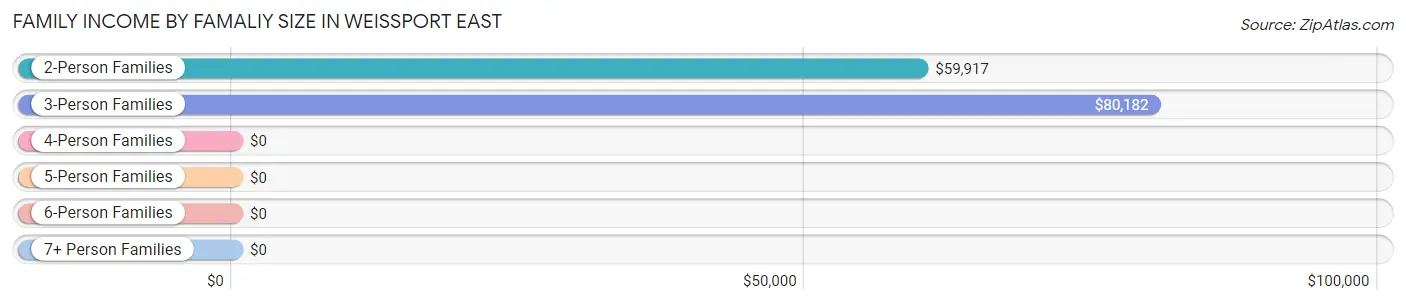
| Income Bracket | # Families | Median Income |
| 2-Person Families | 233 (59.7%) | $59,917 |
| 3-Person Families | 89 (22.8%) | $80,182 |
| 4-Person Families | 46 (11.8%) | $0 |
| 5-Person Families | 10 (2.6%) | $0 |
| 6-Person Families | 0 (0.0%) | $0 |
| 7+ Person Families | 12 (3.1%) | $0 |
| Total | 390 (100.0%) | $80,696 |
Family Income by Number of Earners in Weissport East
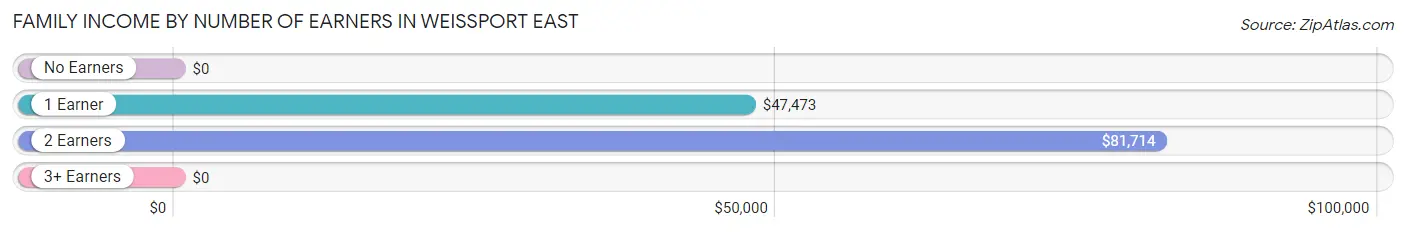
| Number of Earners | # Families | Median Income |
| No Earners | 22 (5.6%) | $0 |
| 1 Earner | 205 (52.6%) | $47,473 |
| 2 Earners | 133 (34.1%) | $81,714 |
| 3+ Earners | 30 (7.7%) | $0 |
| Total | 390 (100.0%) | $80,696 |
Household Income in Weissport East
Household Income Brackets in Weissport East
With 244 households falling in the category, the $75,000 to $99,999 income range is the most frequent in Weissport East, accounting for 33.2% of all households.
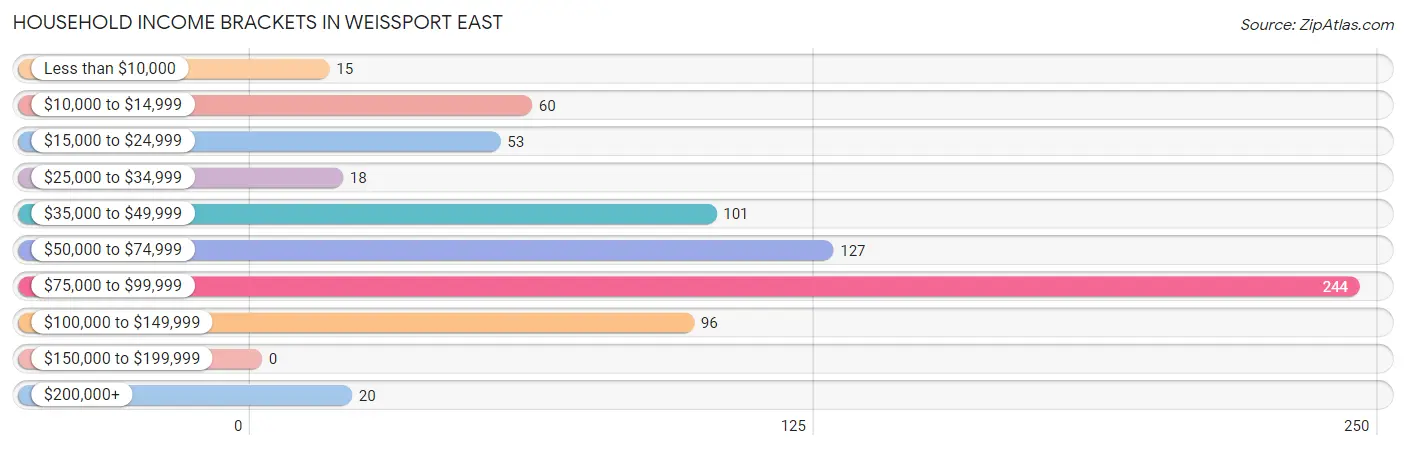
| Income Bracket | # Households | % Households |
| Less than $10,000 | 15 | 2.0% |
| $10,000 to $14,999 | 60 | 8.2% |
| $15,000 to $24,999 | 53 | 7.2% |
| $25,000 to $34,999 | 18 | 2.5% |
| $35,000 to $49,999 | 101 | 13.8% |
| $50,000 to $74,999 | 127 | 17.3% |
| $75,000 to $99,999 | 244 | 33.2% |
| $100,000 to $149,999 | 96 | 13.1% |
| $150,000 to $199,999 | 0 | 0.0% |
| $200,000+ | 20 | 2.7% |
Household Income by Householder Age in Weissport East
The median household income in Weissport East is $74,527, with the highest median household income of $81,120 found in the 25 to 44 years age bracket for the primary householder. A total of 365 households (49.7%) fall into this category.
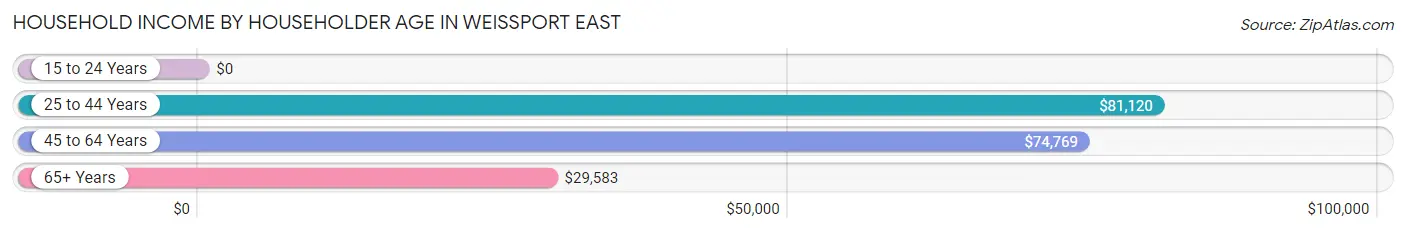
| Income Bracket | # Households | Median Income |
| 15 to 24 Years | 0 (0.0%) | $0 |
| 25 to 44 Years | 365 (49.7%) | $81,120 |
| 45 to 64 Years | 255 (34.7%) | $74,769 |
| 65+ Years | 114 (15.5%) | $29,583 |
| Total | 734 (100.0%) | $74,527 |
Poverty in Weissport East
Income Below Poverty by Sex and Age in Weissport East
With 7.8% poverty level for males and 9.4% for females among the residents of Weissport East, 75 year old and over males and 75 year old and over females are the most vulnerable to poverty, with 11 males (50.0%) and 26 females (59.1%) in their respective age groups living below the poverty level.
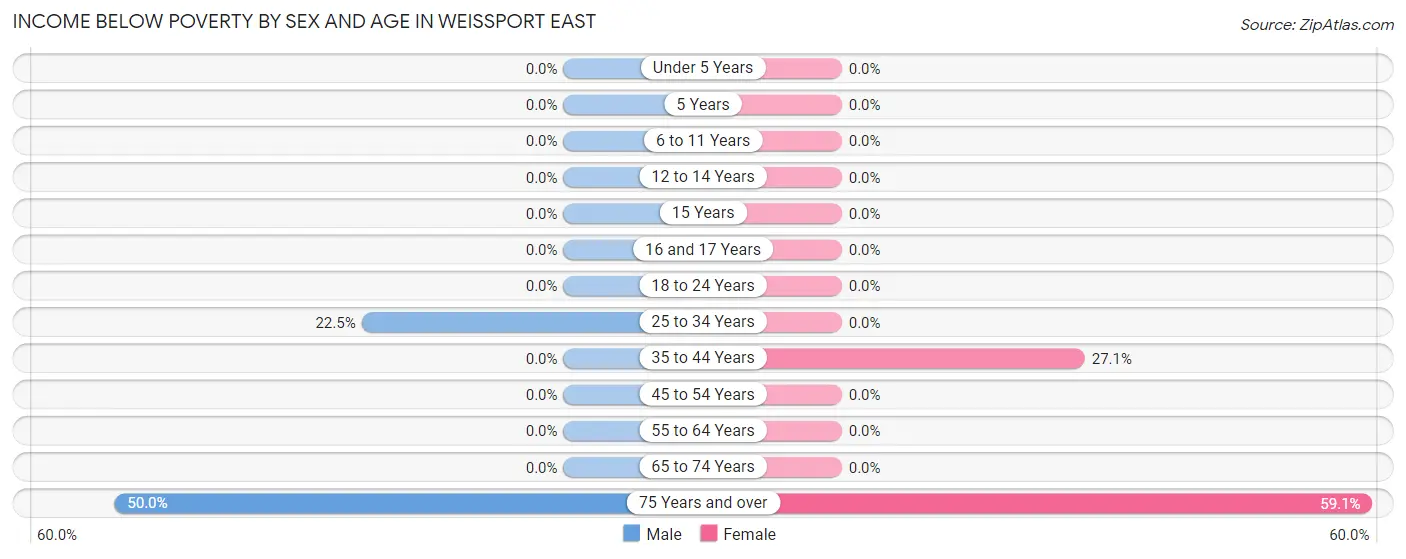
| Age Bracket | Male | Female |
| Under 5 Years | 0 (0.0%) | 0 (0.0%) |
| 5 Years | 0 (0.0%) | 0 (0.0%) |
| 6 to 11 Years | 0 (0.0%) | 0 (0.0%) |
| 12 to 14 Years | 0 (0.0%) | 0 (0.0%) |
| 15 Years | 0 (0.0%) | 0 (0.0%) |
| 16 and 17 Years | 0 (0.0%) | 0 (0.0%) |
| 18 to 24 Years | 0 (0.0%) | 0 (0.0%) |
| 25 to 34 Years | 49 (22.5%) | 0 (0.0%) |
| 35 to 44 Years | 0 (0.0%) | 46 (27.1%) |
| 45 to 54 Years | 0 (0.0%) | 0 (0.0%) |
| 55 to 64 Years | 0 (0.0%) | 0 (0.0%) |
| 65 to 74 Years | 0 (0.0%) | 0 (0.0%) |
| 75 Years and over | 11 (50.0%) | 26 (59.1%) |
| Total | 60 (7.8%) | 72 (9.4%) |
Income Above Poverty by Sex and Age in Weissport East
According to the poverty statistics in Weissport East, males aged under 5 years and females aged under 5 years are the age groups that are most secure financially, with 100.0% of males and 100.0% of females in these age groups living above the poverty line.
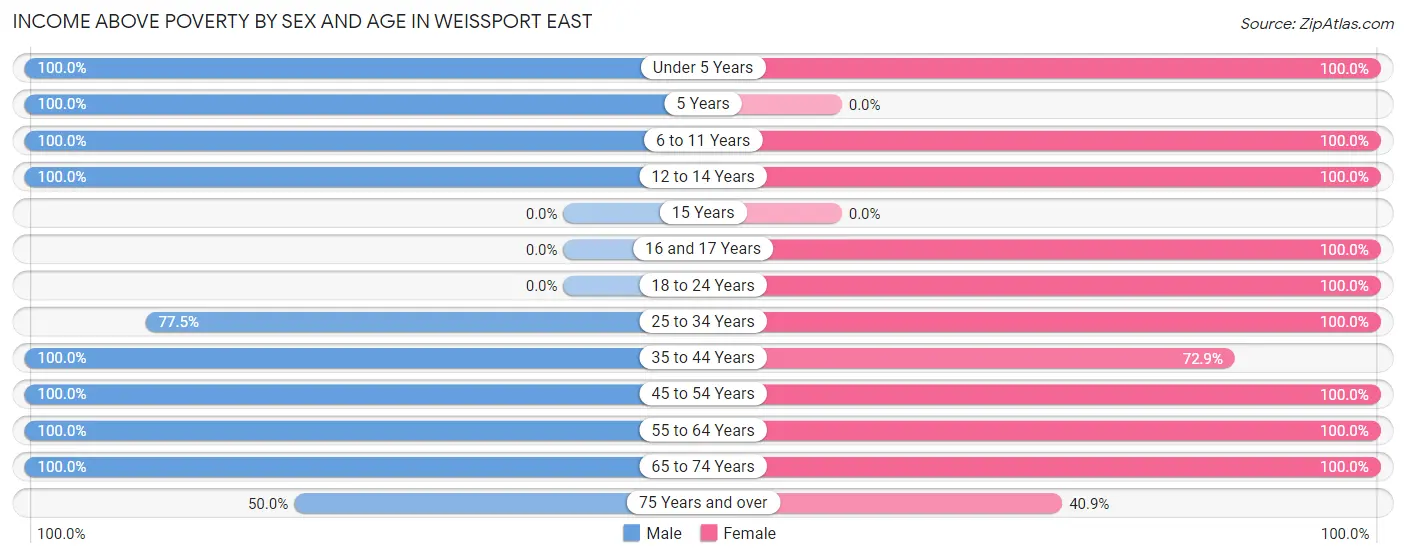
| Age Bracket | Male | Female |
| Under 5 Years | 57 (100.0%) | 40 (100.0%) |
| 5 Years | 19 (100.0%) | 0 (0.0%) |
| 6 to 11 Years | 73 (100.0%) | 72 (100.0%) |
| 12 to 14 Years | 24 (100.0%) | 11 (100.0%) |
| 15 Years | 0 (0.0%) | 0 (0.0%) |
| 16 and 17 Years | 0 (0.0%) | 11 (100.0%) |
| 18 to 24 Years | 0 (0.0%) | 18 (100.0%) |
| 25 to 34 Years | 169 (77.5%) | 112 (100.0%) |
| 35 to 44 Years | 123 (100.0%) | 124 (72.9%) |
| 45 to 54 Years | 94 (100.0%) | 58 (100.0%) |
| 55 to 64 Years | 65 (100.0%) | 180 (100.0%) |
| 65 to 74 Years | 72 (100.0%) | 48 (100.0%) |
| 75 Years and over | 11 (50.0%) | 18 (40.9%) |
| Total | 707 (92.2%) | 692 (90.6%) |
Income Below Poverty Among Married-Couple Families in Weissport East
The poverty statistics for married-couple families in Weissport East show that 3.5% or 11 of the total 312 families live below the poverty line. Families with no children have the highest poverty rate of 7.1%, comprising of 11 families. On the other hand, families with 1 or 2 children have the lowest poverty rate of 0.0%, which includes 0 families.
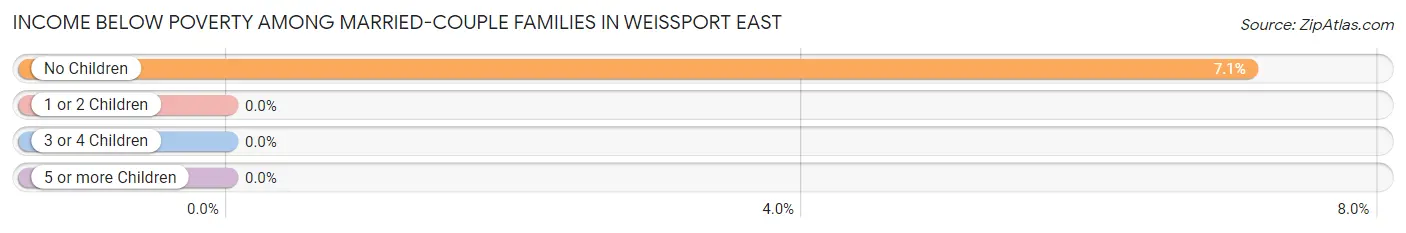
| Children | Above Poverty | Below Poverty |
| No Children | 144 (92.9%) | 11 (7.1%) |
| 1 or 2 Children | 135 (100.0%) | 0 (0.0%) |
| 3 or 4 Children | 22 (100.0%) | 0 (0.0%) |
| 5 or more Children | 0 (0.0%) | 0 (0.0%) |
| Total | 301 (96.5%) | 11 (3.5%) |
Income Below Poverty Among Single-Parent Households in Weissport East
| Children | Single Father | Single Mother |
| No Children | 0 (0.0%) | 0 (0.0%) |
| 1 or 2 Children | 0 (0.0%) | 0 (0.0%) |
| 3 or 4 Children | 0 (0.0%) | 0 (0.0%) |
| 5 or more Children | 0 (0.0%) | 0 (0.0%) |
| Total | 0 (0.0%) | 0 (0.0%) |
Income Below Poverty Among Married-Couple vs Single-Parent Households in Weissport East
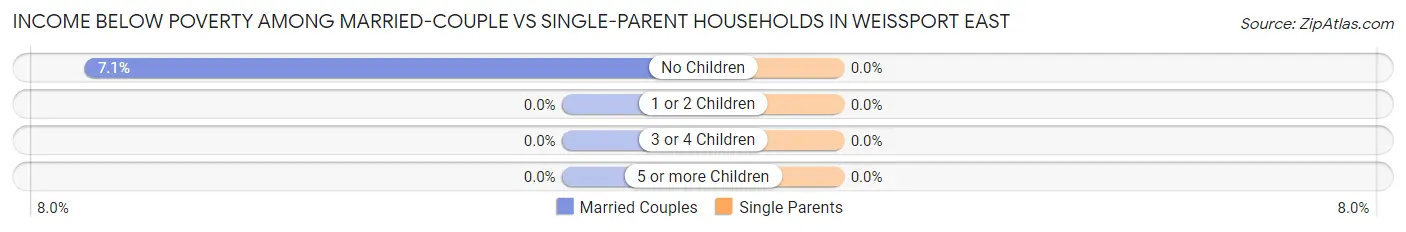
| Children | Married-Couple Families | Single-Parent Households |
| No Children | 11 (7.1%) | 0 (0.0%) |
| 1 or 2 Children | 0 (0.0%) | 0 (0.0%) |
| 3 or 4 Children | 0 (0.0%) | 0 (0.0%) |
| 5 or more Children | 0 (0.0%) | 0 (0.0%) |
| Total | 11 (3.5%) | 0 (0.0%) |
Race in Weissport East
The most populous races in Weissport East are White / Caucasian (1,475 | 95.1%), Hispanic or Latino (104 | 6.7%), and Two or more Races (54 | 3.5%).
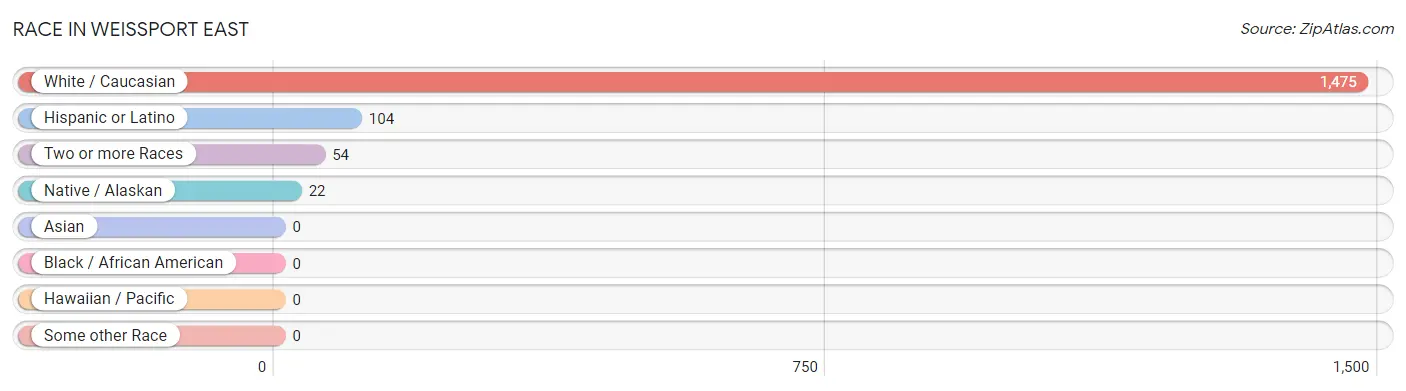
| Race | # Population | % Population |
| Asian | 0 | 0.0% |
| Black / African American | 0 | 0.0% |
| Hawaiian / Pacific | 0 | 0.0% |
| Hispanic or Latino | 104 | 6.7% |
| Native / Alaskan | 22 | 1.4% |
| White / Caucasian | 1,475 | 95.1% |
| Two or more Races | 54 | 3.5% |
| Some other Race | 0 | 0.0% |
| Total | 1,551 | 100.0% |
Ancestry in Weissport East
The most populous ancestries reported in Weissport East are German (729 | 47.0%), Irish (173 | 11.2%), English (161 | 10.4%), Italian (154 | 9.9%), and Czechoslovakian (104 | 6.7%), together accounting for 85.2% of all Weissport East residents.
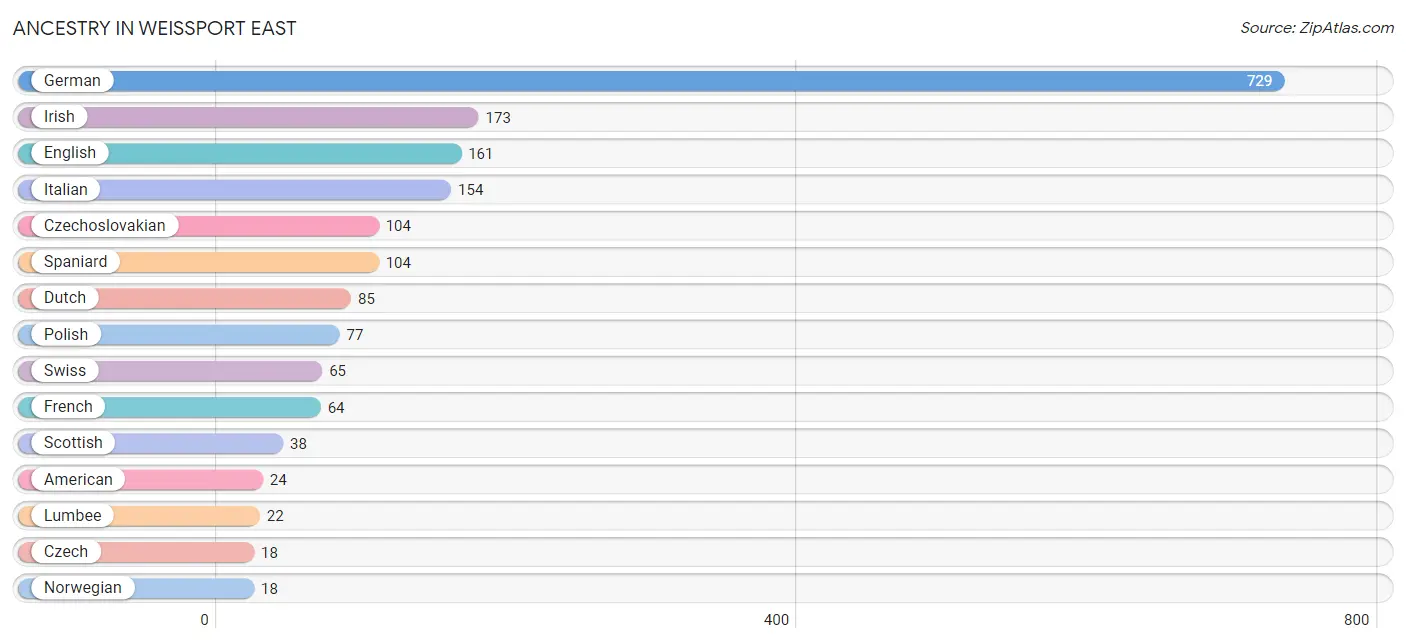
| Ancestry | # Population | % Population |
| American | 24 | 1.5% |
| Czech | 18 | 1.2% |
| Czechoslovakian | 104 | 6.7% |
| Dutch | 85 | 5.5% |
| Eastern European | 16 | 1.0% |
| English | 161 | 10.4% |
| French | 64 | 4.1% |
| French Canadian | 15 | 1.0% |
| German | 729 | 47.0% |
| Hungarian | 17 | 1.1% |
| Irish | 173 | 11.2% |
| Italian | 154 | 9.9% |
| Lumbee | 22 | 1.4% |
| Norwegian | 18 | 1.2% |
| Polish | 77 | 5.0% |
| Russian | 15 | 1.0% |
| Scottish | 38 | 2.5% |
| Slovak | 17 | 1.1% |
| Spaniard | 104 | 6.7% |
| Swiss | 65 | 4.2% |
| Welsh | 17 | 1.1% | View All 21 Rows |
Immigrants in Weissport East
The most numerous immigrant groups reported in Weissport East came from , and Canada (39 | 2.5%), together accounting for 2.5% of all Weissport East residents.

| Immigration Origin | # Population | % Population |
| Canada | 39 | 2.5% | View All 1 Rows |
Sex and Age in Weissport East
Sex and Age in Weissport East
The most populous age groups in Weissport East are 25 to 29 Years (120 | 15.7%) for men and 35 to 39 Years (107 | 13.7%) for women.
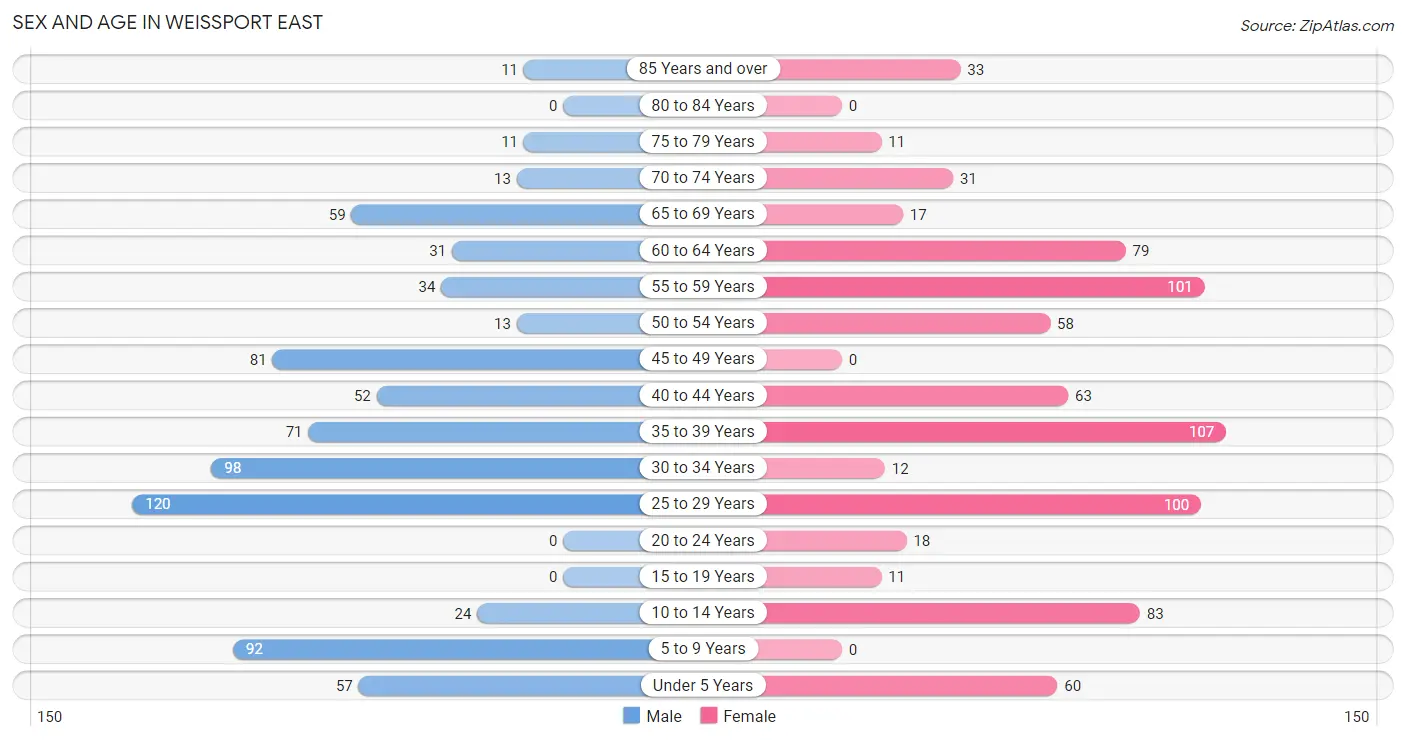
| Age Bracket | Male | Female |
| Under 5 Years | 57 (7.4%) | 60 (7.6%) |
| 5 to 9 Years | 92 (12.0%) | 0 (0.0%) |
| 10 to 14 Years | 24 (3.1%) | 83 (10.6%) |
| 15 to 19 Years | 0 (0.0%) | 11 (1.4%) |
| 20 to 24 Years | 0 (0.0%) | 18 (2.3%) |
| 25 to 29 Years | 120 (15.7%) | 100 (12.8%) |
| 30 to 34 Years | 98 (12.8%) | 12 (1.5%) |
| 35 to 39 Years | 71 (9.3%) | 107 (13.7%) |
| 40 to 44 Years | 52 (6.8%) | 63 (8.0%) |
| 45 to 49 Years | 81 (10.6%) | 0 (0.0%) |
| 50 to 54 Years | 13 (1.7%) | 58 (7.4%) |
| 55 to 59 Years | 34 (4.4%) | 101 (12.9%) |
| 60 to 64 Years | 31 (4.0%) | 79 (10.1%) |
| 65 to 69 Years | 59 (7.7%) | 17 (2.2%) |
| 70 to 74 Years | 13 (1.7%) | 31 (4.0%) |
| 75 to 79 Years | 11 (1.4%) | 11 (1.4%) |
| 80 to 84 Years | 0 (0.0%) | 0 (0.0%) |
| 85 Years and over | 11 (1.4%) | 33 (4.2%) |
| Total | 767 (100.0%) | 784 (100.0%) |
Families and Households in Weissport East
Median Family Size in Weissport East
The median family size in Weissport East is 2.71 persons per family, with married-couple families (312 | 80.0%) accounting for the largest median family size of 2.88 persons per family. On the other hand, single female/mother families (32 | 8.2%) represent the smallest median family size with 1.91 persons per family.
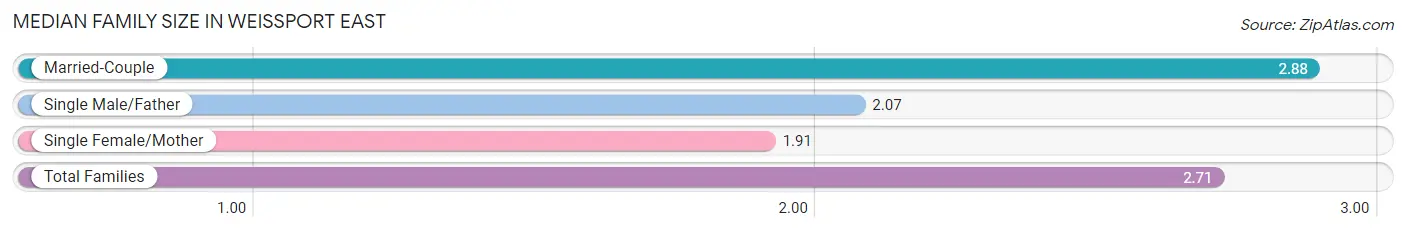
| Family Type | # Families | Family Size |
| Married-Couple | 312 (80.0%) | 2.88 |
| Single Male/Father | 46 (11.8%) | 2.07 |
| Single Female/Mother | 32 (8.2%) | 1.91 |
| Total Families | 390 (100.0%) | 2.71 |
Median Household Size in Weissport East
The median household size in Weissport East is 2.11 persons per household, with single male/father households (46 | 6.3%) accounting for the largest median household size of 3.07 persons per household. non-family households (344 | 46.9%) represent the smallest median household size with 1.19 persons per household.
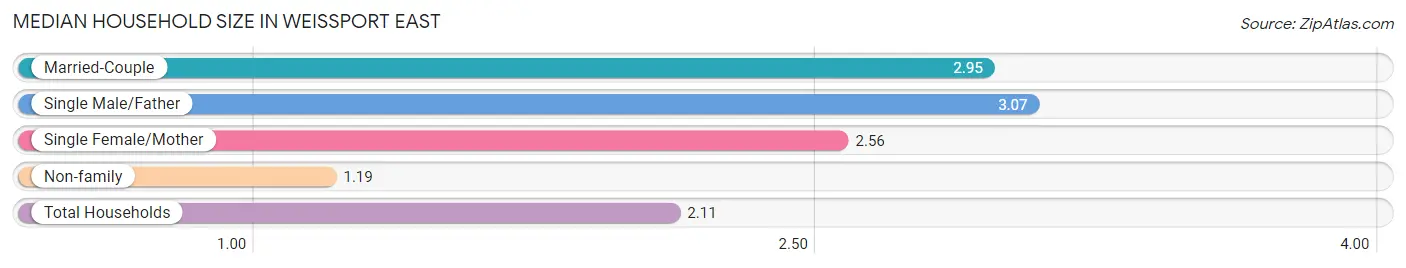
| Household Type | # Households | Household Size |
| Married-Couple | 312 (42.5%) | 2.95 |
| Single Male/Father | 46 (6.3%) | 3.07 |
| Single Female/Mother | 32 (4.4%) | 2.56 |
| Non-family | 344 (46.9%) | 1.19 |
| Total Households | 734 (100.0%) | 2.11 |
Household Size by Marriage Status in Weissport East
Out of a total of 734 households in Weissport East, 390 (53.1%) are family households, while 344 (46.9%) are nonfamily households. The most numerous type of family households are 3-person households, comprising 172, and the most common type of nonfamily households are 1-person households, comprising 276.
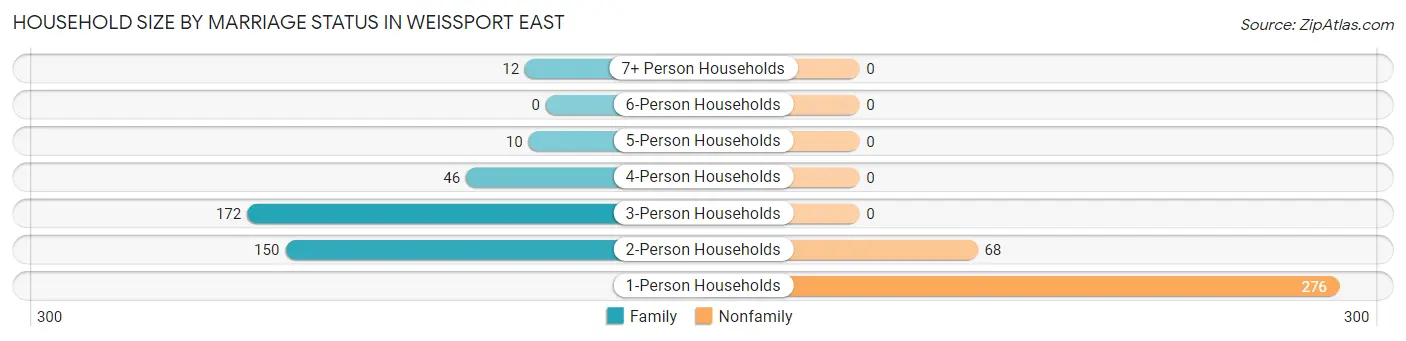
| Household Size | Family Households | Nonfamily Households |
| 1-Person Households | - | 276 (37.6%) |
| 2-Person Households | 150 (20.4%) | 68 (9.3%) |
| 3-Person Households | 172 (23.4%) | 0 (0.0%) |
| 4-Person Households | 46 (6.3%) | 0 (0.0%) |
| 5-Person Households | 10 (1.4%) | 0 (0.0%) |
| 6-Person Households | 0 (0.0%) | 0 (0.0%) |
| 7+ Person Households | 12 (1.6%) | 0 (0.0%) |
| Total | 390 (53.1%) | 344 (46.9%) |
Female Fertility in Weissport East
Fertility by Age in Weissport East
Average fertility rate in Weissport East is 225.0 births per 1,000 women. Women in the age bracket of 20 to 34 years have the highest fertility rate with 538.0 births per 1,000 women. Women in the age bracket of 20 to 34 years acount for 100.0% of all women with births.
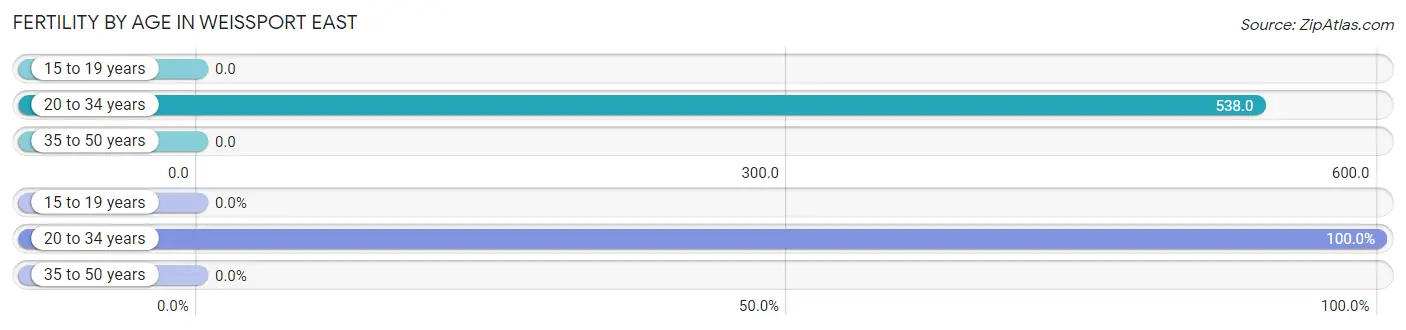
| Age Bracket | Women with Births | Births / 1,000 Women |
| 15 to 19 years | 0 (0.0%) | 0.0 |
| 20 to 34 years | 70 (100.0%) | 538.0 |
| 35 to 50 years | 0 (0.0%) | 0.0 |
| Total | 70 (100.0%) | 225.0 |
Fertility by Age by Marriage Status in Weissport East
68.6% of women with births (70) in Weissport East are married. The highest percentage of unmarried women with births falls into 20 to 34 years age bracket with 31.4% of them unmarried at the time of birth, while the lowest percentage of unmarried women with births belong to 20 to 34 years age bracket with 31.4% of them unmarried.
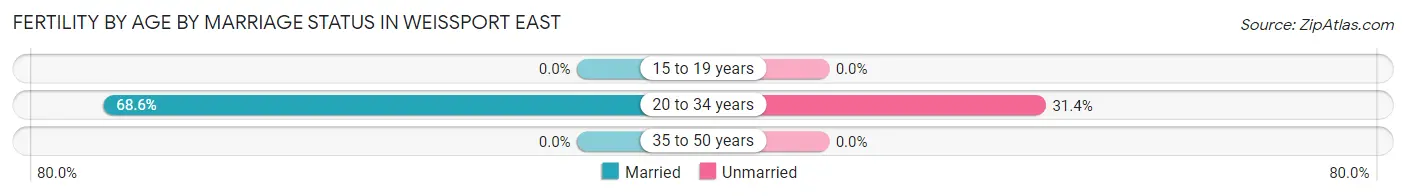
| Age Bracket | Married | Unmarried |
| 15 to 19 years | 0 (0.0%) | 0 (0.0%) |
| 20 to 34 years | 48 (68.6%) | 22 (31.4%) |
| 35 to 50 years | 0 (0.0%) | 0 (0.0%) |
| Total | 48 (68.6%) | 22 (31.4%) |
Fertility by Education in Weissport East
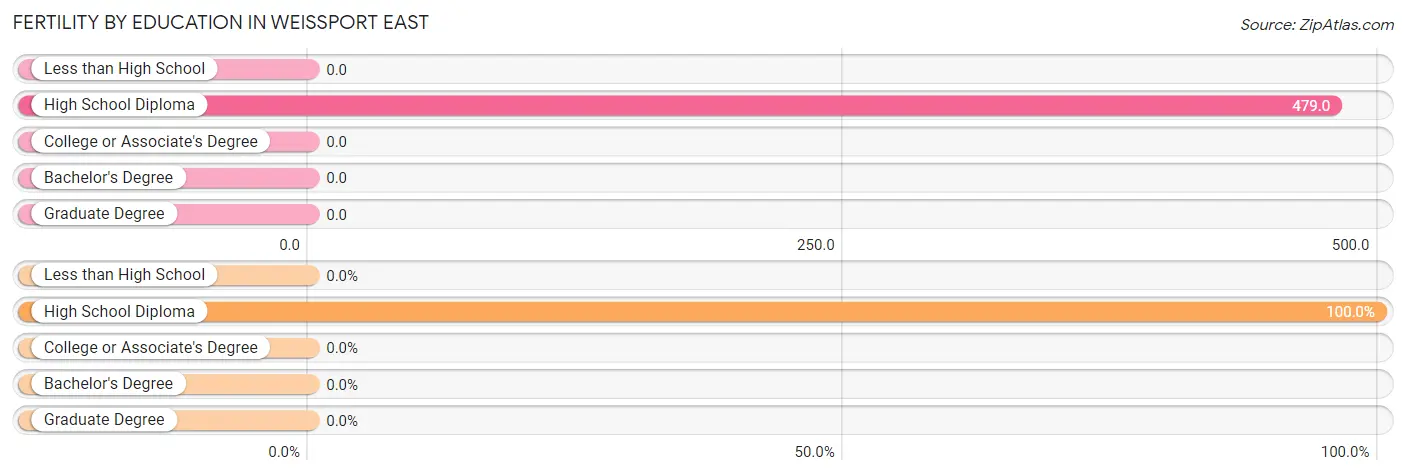
| Educational Attainment | Women with Births | Births / 1,000 Women |
| Less than High School | 0 (0.0%) | 0.0 |
| High School Diploma | 70 (100.0%) | 479.0 |
| College or Associate's Degree | 0 (0.0%) | 0.0 |
| Bachelor's Degree | 0 (0.0%) | 0.0 |
| Graduate Degree | 0 (0.0%) | 0.0 |
| Total | 70 (100.0%) | 225.0 |
Fertility by Education by Marriage Status in Weissport East
31.4% of women with births in Weissport East are unmarried. Women with the educational attainment of high school diploma are most likely to be married with 68.6% of them married at childbirth, while women with the educational attainment of high school diploma are least likely to be married with 31.4% of them unmarried at childbirth.
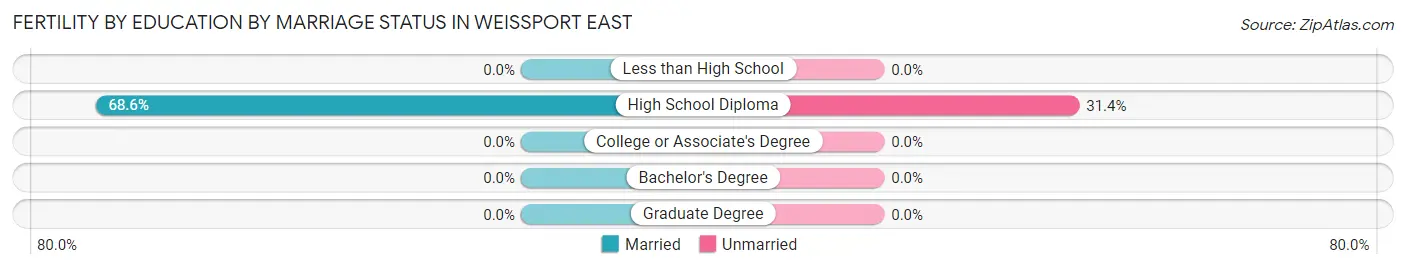
| Educational Attainment | Married | Unmarried |
| Less than High School | 0 (0.0%) | 0 (0.0%) |
| High School Diploma | 48 (68.6%) | 22 (31.4%) |
| College or Associate's Degree | 0 (0.0%) | 0 (0.0%) |
| Bachelor's Degree | 0 (0.0%) | 0 (0.0%) |
| Graduate Degree | 0 (0.0%) | 0 (0.0%) |
| Total | 48 (68.6%) | 22 (31.4%) |
Employment Characteristics in Weissport East
Employment by Class of Employer in Weissport East
Among the 695 employed individuals in Weissport East, private company employees (489 | 70.4%), not-for-profit organizations (51 | 7.3%), and local government employees (51 | 7.3%) make up the most common classes of employment.
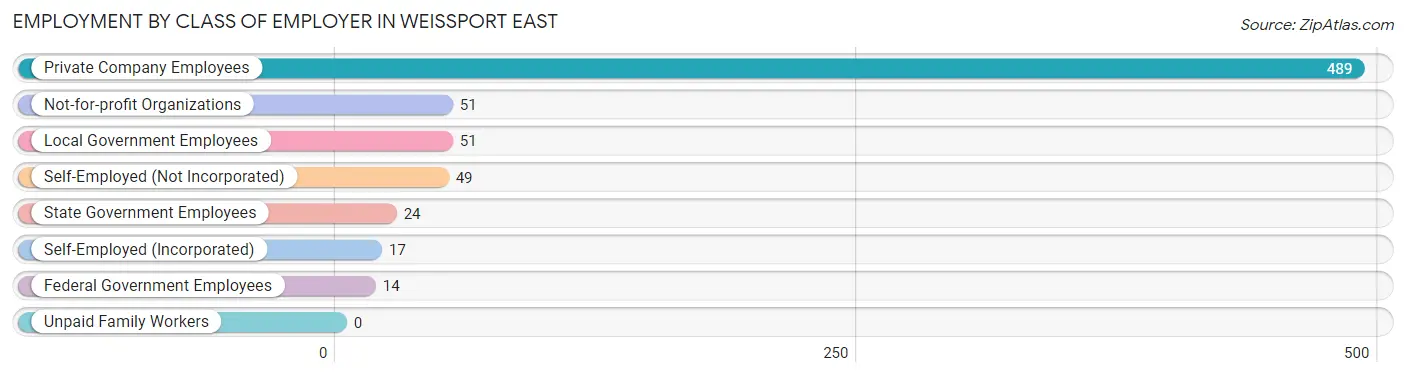
| Employer Class | # Employees | % Employees |
| Private Company Employees | 489 | 70.4% |
| Self-Employed (Incorporated) | 17 | 2.5% |
| Self-Employed (Not Incorporated) | 49 | 7.0% |
| Not-for-profit Organizations | 51 | 7.3% |
| Local Government Employees | 51 | 7.3% |
| State Government Employees | 24 | 3.5% |
| Federal Government Employees | 14 | 2.0% |
| Unpaid Family Workers | 0 | 0.0% |
| Total | 695 | 100.0% |
Employment Status by Age in Weissport East
According to the labor force statistics for Weissport East, out of the total population over 16 years of age (1,235), 74.3% or 918 individuals are in the labor force, with 22.3% or 205 of them unemployed. The age group with the highest labor force participation rate is 16 to 19 years, with 100.0% or 11 individuals in the labor force. Within the labor force, the 30 to 34 years age range has the highest percentage of unemployed individuals, with 56.3% or 49 of them being unemployed.
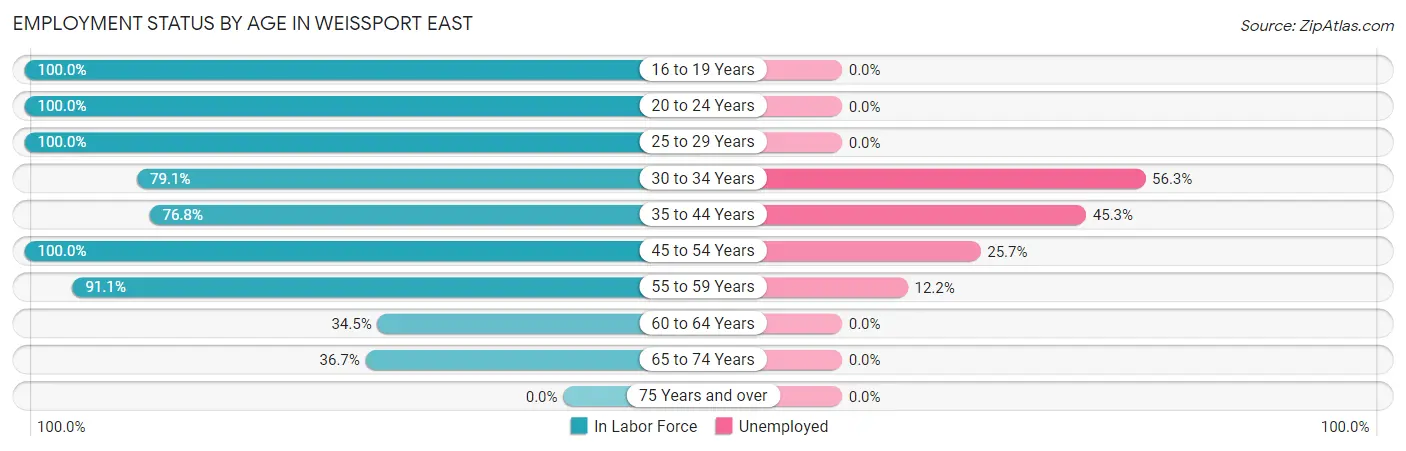
| Age Bracket | In Labor Force | Unemployed |
| 16 to 19 Years | 11 (100.0%) | 0 (0.0%) |
| 20 to 24 Years | 18 (100.0%) | 0 (0.0%) |
| 25 to 29 Years | 220 (100.0%) | 0 (0.0%) |
| 30 to 34 Years | 87 (79.1%) | 49 (56.3%) |
| 35 to 44 Years | 225 (76.8%) | 102 (45.3%) |
| 45 to 54 Years | 152 (100.0%) | 39 (25.7%) |
| 55 to 59 Years | 123 (91.1%) | 15 (12.2%) |
| 60 to 64 Years | 38 (34.5%) | 0 (0.0%) |
| 65 to 74 Years | 44 (36.7%) | 0 (0.0%) |
| 75 Years and over | 0 (0.0%) | 0 (0.0%) |
| Total | 918 (74.3%) | 205 (22.3%) |
Employment Status by Educational Attainment in Weissport East
According to labor force statistics for Weissport East, 82.8% of individuals (845) out of the total population between 25 and 64 years of age (1,020) are in the labor force, with 24.3% or 205 of them being unemployed. The group with the highest labor force participation rate are those with the educational attainment of college / associate degree, with 86.1% or 304 individuals in the labor force. Within the labor force, individuals with college / associate degree education have the highest percentage of unemployment, with 33.9% or 103 of them being unemployed.
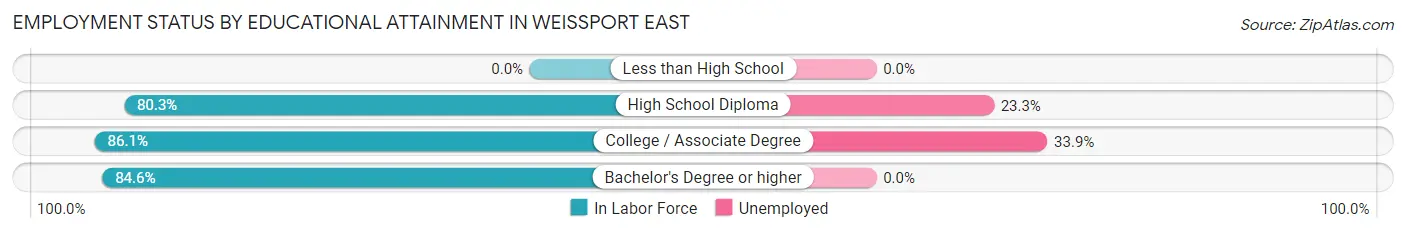
| Educational Attainment | In Labor Force | Unemployed |
| Less than High School | 0 (0.0%) | 0 (0.0%) |
| High School Diploma | 437 (80.3%) | 127 (23.3%) |
| College / Associate Degree | 304 (86.1%) | 120 (33.9%) |
| Bachelor's Degree or higher | 104 (84.6%) | 0 (0.0%) |
| Total | 845 (82.8%) | 248 (24.3%) |
Employment Occupations by Sex in Weissport East
Management, Business, Science and Arts Occupations
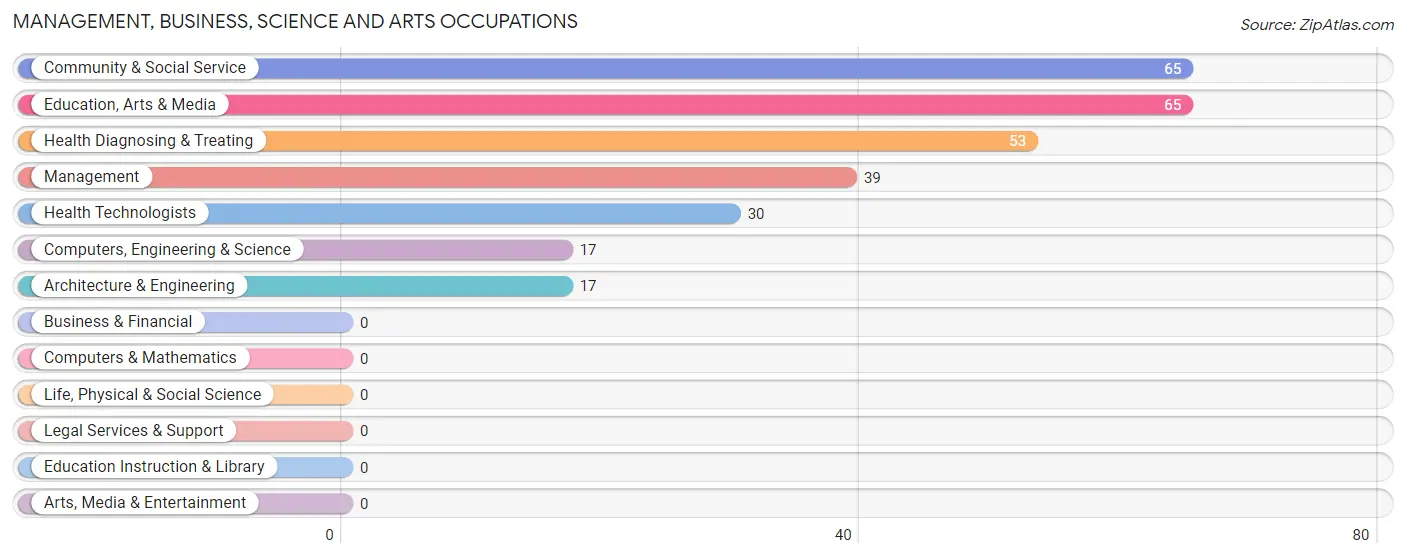
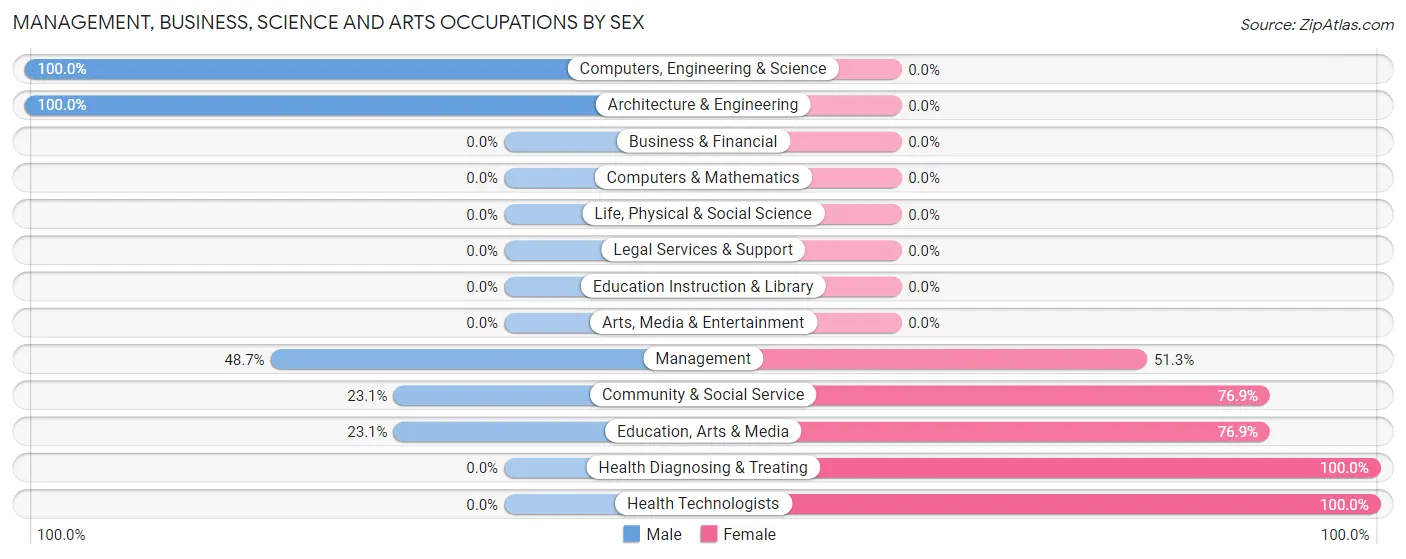
The most common Management, Business, Science and Arts occupations in Weissport East are Community & Social Service (65 | 9.1%), Education, Arts & Media (65 | 9.1%), Health Diagnosing & Treating (53 | 7.4%), Management (39 | 5.5%), and Health Technologists (30 | 4.2%).
Management, Business, Science and Arts Occupations by Sex
Within the Management, Business, Science and Arts occupations in Weissport East, the most male-oriented occupations are Computers, Engineering & Science (100.0%), Architecture & Engineering (100.0%), and Management (48.7%), while the most female-oriented occupations are Health Diagnosing & Treating (100.0%), Health Technologists (100.0%), and Community & Social Service (76.9%).
| Occupation | Male | Female |
| Management | 19 (48.7%) | 20 (51.3%) |
| Business & Financial | 0 (0.0%) | 0 (0.0%) |
| Computers, Engineering & Science | 17 (100.0%) | 0 (0.0%) |
| Computers & Mathematics | 0 (0.0%) | 0 (0.0%) |
| Architecture & Engineering | 17 (100.0%) | 0 (0.0%) |
| Life, Physical & Social Science | 0 (0.0%) | 0 (0.0%) |
| Community & Social Service | 15 (23.1%) | 50 (76.9%) |
| Education, Arts & Media | 15 (23.1%) | 50 (76.9%) |
| Legal Services & Support | 0 (0.0%) | 0 (0.0%) |
| Education Instruction & Library | 0 (0.0%) | 0 (0.0%) |
| Arts, Media & Entertainment | 0 (0.0%) | 0 (0.0%) |
| Health Diagnosing & Treating | 0 (0.0%) | 53 (100.0%) |
| Health Technologists | 0 (0.0%) | 30 (100.0%) |
| Total (Category) | 51 (29.3%) | 123 (70.7%) |
| Total (Overall) | 355 (49.8%) | 358 (50.2%) |
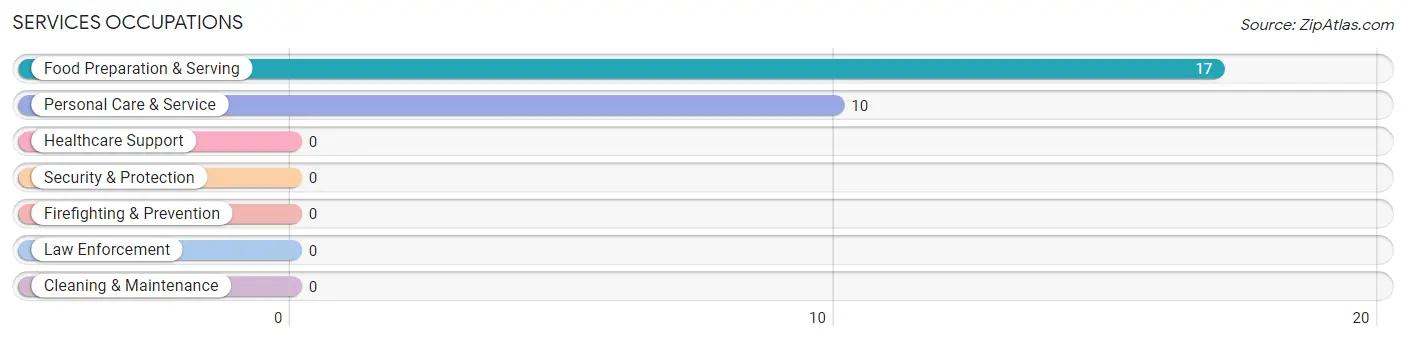
Services Occupations
The most common Services occupations in Weissport East are Food Preparation & Serving (17 | 2.4%), and Personal Care & Service (10 | 1.4%).
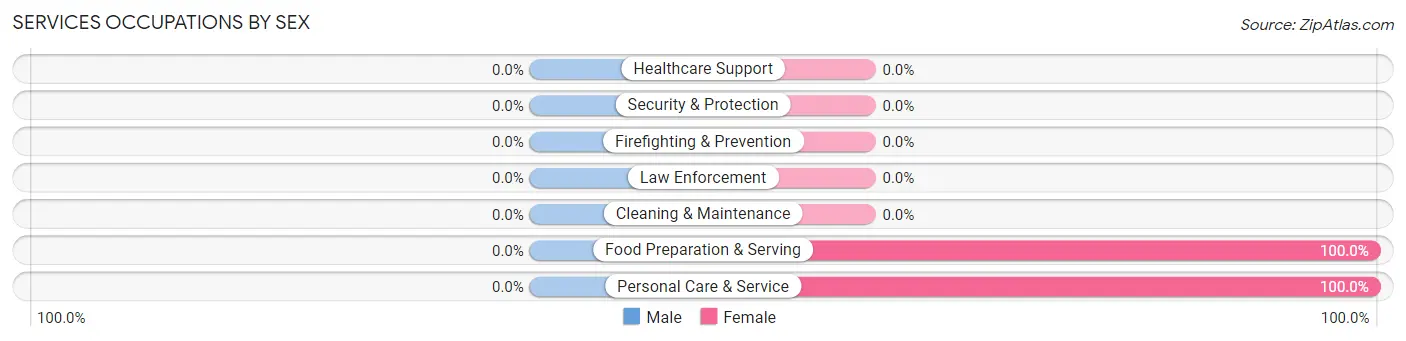
Services Occupations by Sex
| Occupation | Male | Female |
| Healthcare Support | 0 (0.0%) | 0 (0.0%) |
| Security & Protection | 0 (0.0%) | 0 (0.0%) |
| Firefighting & Prevention | 0 (0.0%) | 0 (0.0%) |
| Law Enforcement | 0 (0.0%) | 0 (0.0%) |
| Food Preparation & Serving | 0 (0.0%) | 17 (100.0%) |
| Cleaning & Maintenance | 0 (0.0%) | 0 (0.0%) |
| Personal Care & Service | 0 (0.0%) | 10 (100.0%) |
| Total (Category) | 0 (0.0%) | 27 (100.0%) |
| Total (Overall) | 355 (49.8%) | 358 (50.2%) |
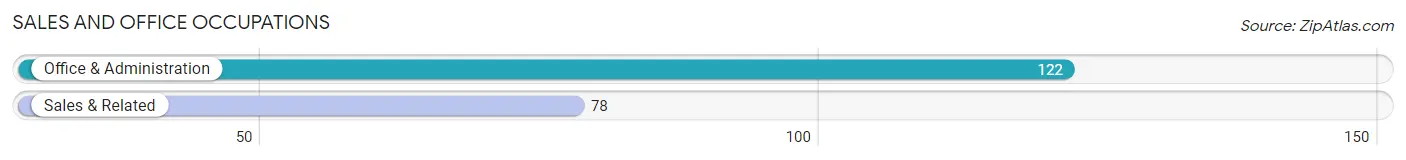
Sales and Office Occupations
The most common Sales and Office occupations in Weissport East are Office & Administration (122 | 17.1%), and Sales & Related (78 | 10.9%).
Sales and Office Occupations by Sex

| Occupation | Male | Female |
| Sales & Related | 12 (15.4%) | 66 (84.6%) |
| Office & Administration | 18 (14.7%) | 104 (85.3%) |
| Total (Category) | 30 (15.0%) | 170 (85.0%) |
| Total (Overall) | 355 (49.8%) | 358 (50.2%) |
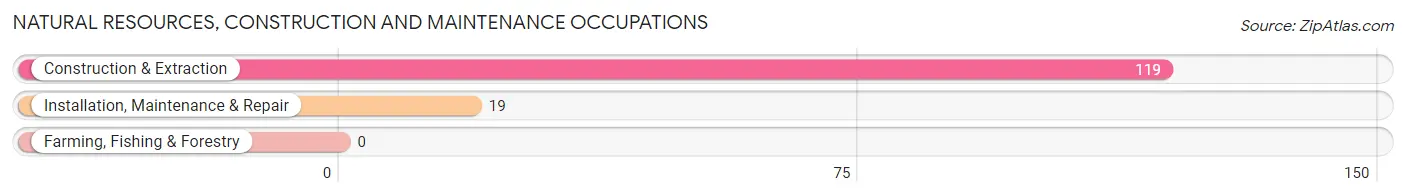
Natural Resources, Construction and Maintenance Occupations
The most common Natural Resources, Construction and Maintenance occupations in Weissport East are Construction & Extraction (119 | 16.7%), and Installation, Maintenance & Repair (19 | 2.7%).
Natural Resources, Construction and Maintenance Occupations by Sex
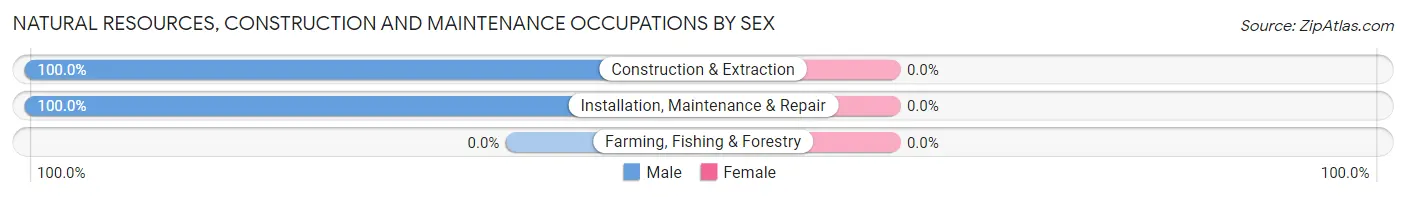
| Occupation | Male | Female |
| Farming, Fishing & Forestry | 0 (0.0%) | 0 (0.0%) |
| Construction & Extraction | 119 (100.0%) | 0 (0.0%) |
| Installation, Maintenance & Repair | 19 (100.0%) | 0 (0.0%) |
| Total (Category) | 138 (100.0%) | 0 (0.0%) |
| Total (Overall) | 355 (49.8%) | 358 (50.2%) |
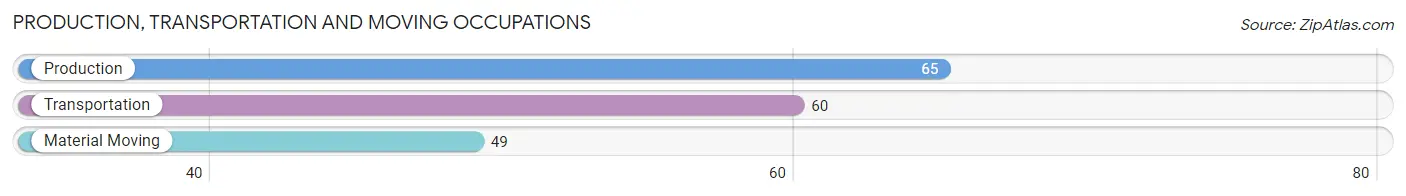
Production, Transportation and Moving Occupations
The most common Production, Transportation and Moving occupations in Weissport East are Production (65 | 9.1%), Transportation (60 | 8.4%), and Material Moving (49 | 6.9%).
Production, Transportation and Moving Occupations by Sex
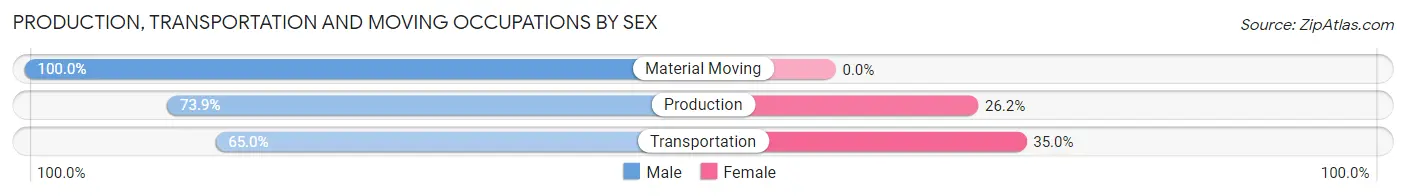
| Occupation | Male | Female |
| Production | 48 (73.9%) | 17 (26.2%) |
| Transportation | 39 (65.0%) | 21 (35.0%) |
| Material Moving | 49 (100.0%) | 0 (0.0%) |
| Total (Category) | 136 (78.2%) | 38 (21.8%) |
| Total (Overall) | 355 (49.8%) | 358 (50.2%) |
Employment Industries by Sex in Weissport East
Employment Industries in Weissport East
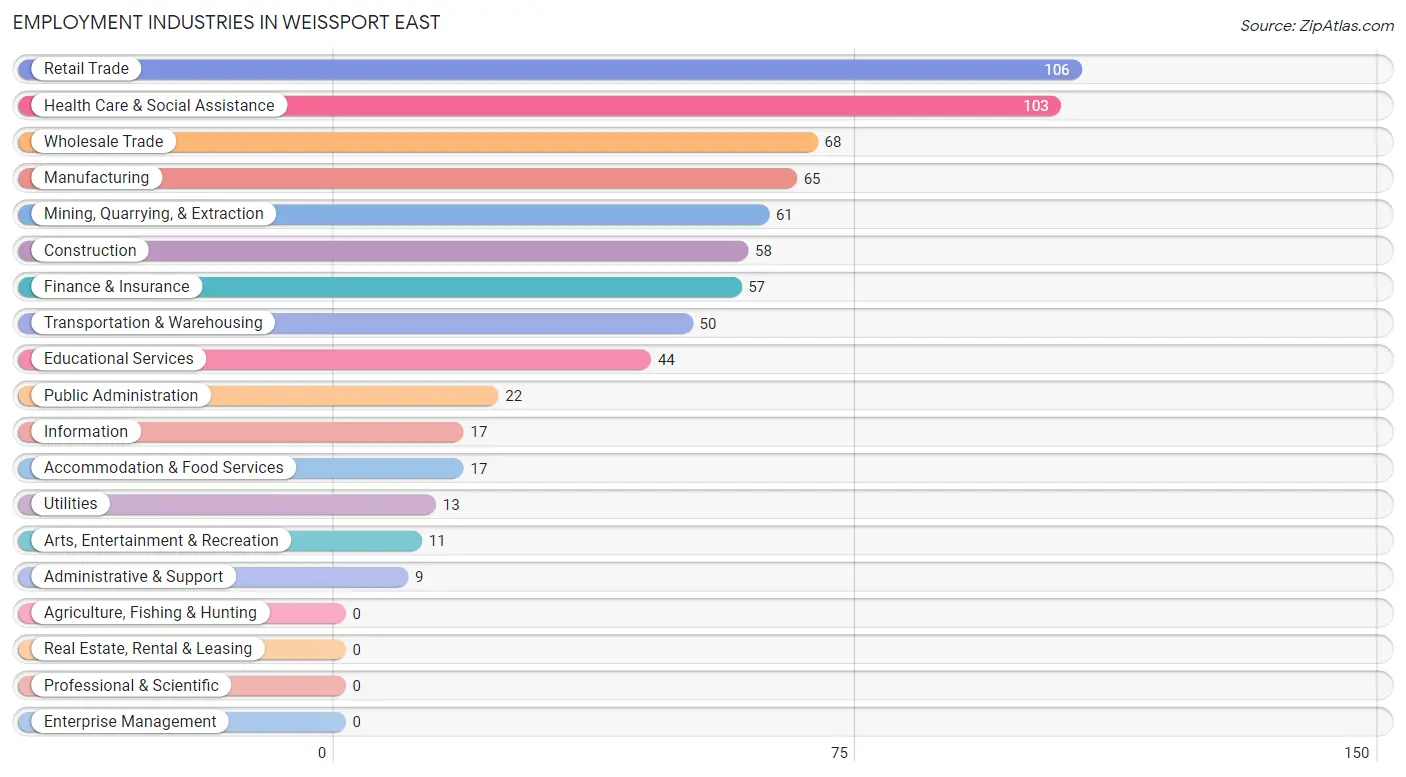
The major employment industries in Weissport East include Retail Trade (106 | 14.9%), Health Care & Social Assistance (103 | 14.4%), Wholesale Trade (68 | 9.5%), Manufacturing (65 | 9.1%), and Mining, Quarrying, & Extraction (61 | 8.6%).
Employment Industries by Sex in Weissport East
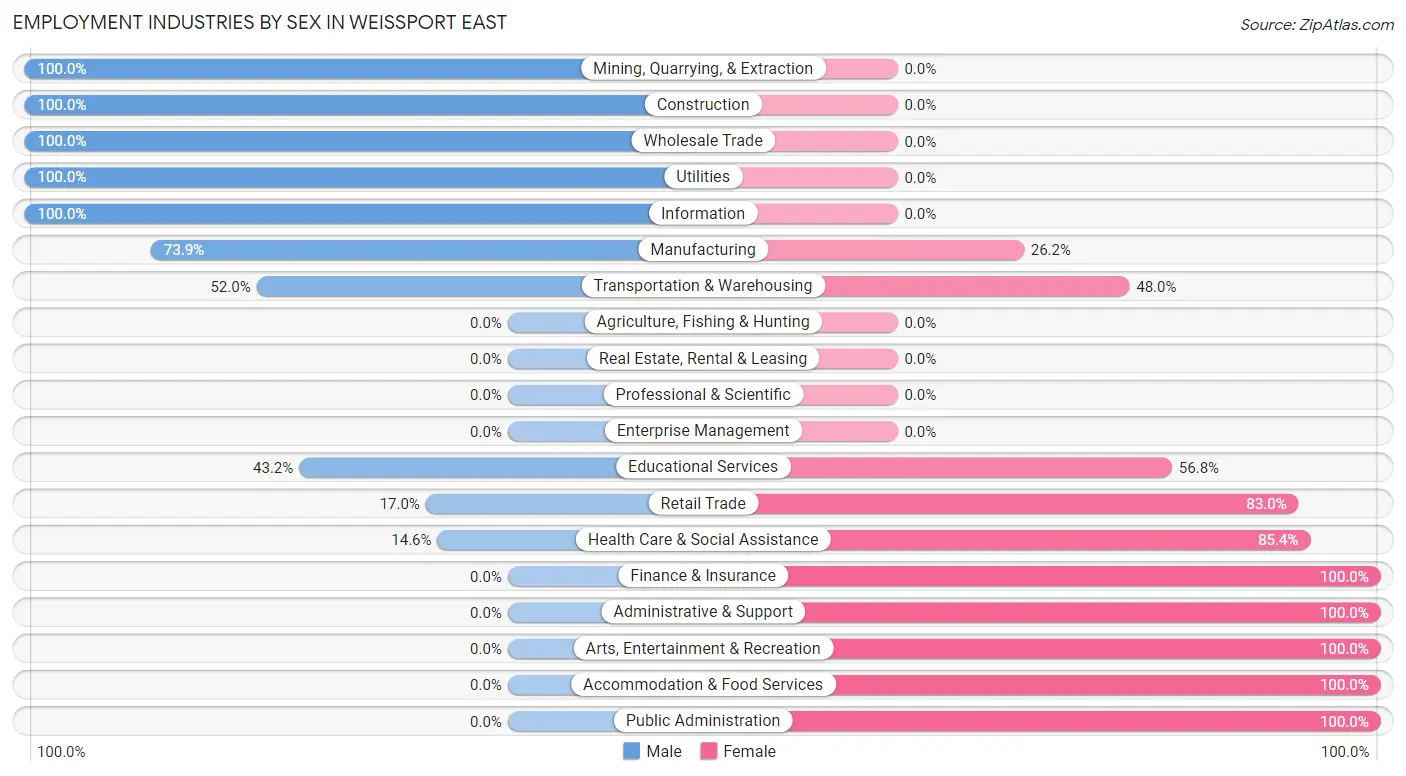
The Weissport East industries that see more men than women are Mining, Quarrying, & Extraction (100.0%), Construction (100.0%), and Wholesale Trade (100.0%), whereas the industries that tend to have a higher number of women are Finance & Insurance (100.0%), Administrative & Support (100.0%), and Arts, Entertainment & Recreation (100.0%).
| Industry | Male | Female |
| Agriculture, Fishing & Hunting | 0 (0.0%) | 0 (0.0%) |
| Mining, Quarrying, & Extraction | 61 (100.0%) | 0 (0.0%) |
| Construction | 58 (100.0%) | 0 (0.0%) |
| Manufacturing | 48 (73.9%) | 17 (26.2%) |
| Wholesale Trade | 68 (100.0%) | 0 (0.0%) |
| Retail Trade | 18 (17.0%) | 88 (83.0%) |
| Transportation & Warehousing | 26 (52.0%) | 24 (48.0%) |
| Utilities | 13 (100.0%) | 0 (0.0%) |
| Information | 17 (100.0%) | 0 (0.0%) |
| Finance & Insurance | 0 (0.0%) | 57 (100.0%) |
| Real Estate, Rental & Leasing | 0 (0.0%) | 0 (0.0%) |
| Professional & Scientific | 0 (0.0%) | 0 (0.0%) |
| Enterprise Management | 0 (0.0%) | 0 (0.0%) |
| Administrative & Support | 0 (0.0%) | 9 (100.0%) |
| Educational Services | 19 (43.2%) | 25 (56.8%) |
| Health Care & Social Assistance | 15 (14.6%) | 88 (85.4%) |
| Arts, Entertainment & Recreation | 0 (0.0%) | 11 (100.0%) |
| Accommodation & Food Services | 0 (0.0%) | 17 (100.0%) |
| Public Administration | 0 (0.0%) | 22 (100.0%) |
| Total | 355 (49.8%) | 358 (50.2%) |
Education in Weissport East
School Enrollment in Weissport East
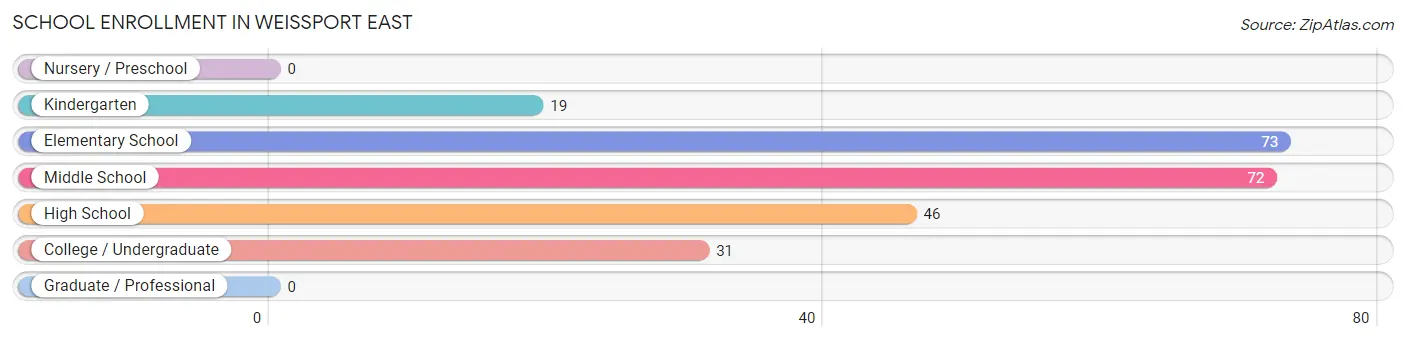
The most common levels of schooling among the 241 students in Weissport East are elementary school (73 | 30.3%), middle school (72 | 29.9%), and high school (46 | 19.1%).
| School Level | # Students | % Students |
| Nursery / Preschool | 0 | 0.0% |
| Kindergarten | 19 | 7.9% |
| Elementary School | 73 | 30.3% |
| Middle School | 72 | 29.9% |
| High School | 46 | 19.1% |
| College / Undergraduate | 31 | 12.9% |
| Graduate / Professional | 0 | 0.0% |
| Total | 241 | 100.0% |
School Enrollment by Age by Funding Source in Weissport East
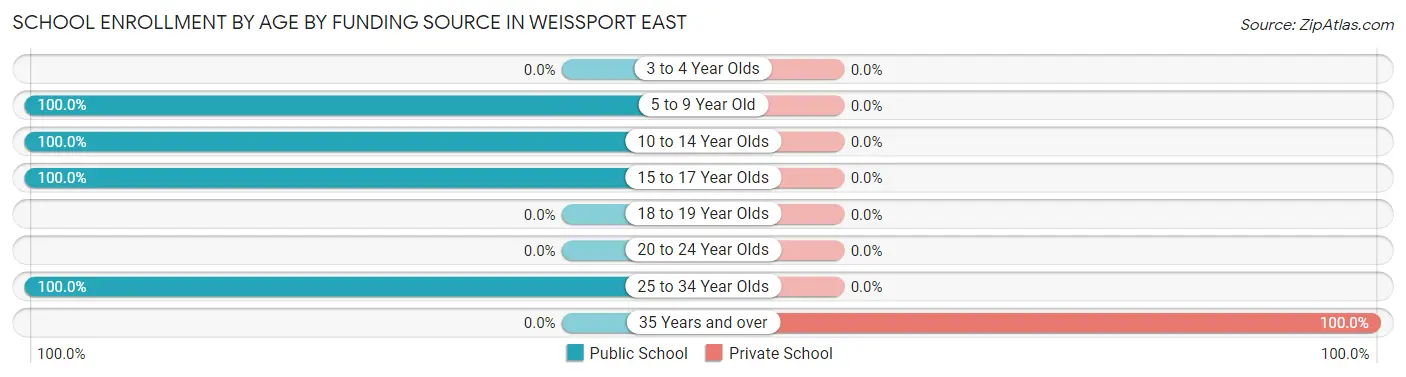
Out of a total of 241 students who are enrolled in schools in Weissport East, 10 (4.1%) attend a private institution, while the remaining 231 (95.9%) are enrolled in public schools. The age group of 35 years and over has the highest likelihood of being enrolled in private schools, with 10 (100.0% in the age bracket) enrolled. Conversely, the age group of 5 to 9 year old has the lowest likelihood of being enrolled in a private school, with 92 (100.0% in the age bracket) attending a public institution.
| Age Bracket | Public School | Private School |
| 3 to 4 Year Olds | 0 (0.0%) | 0 (0.0%) |
| 5 to 9 Year Old | 92 (100.0%) | 0 (0.0%) |
| 10 to 14 Year Olds | 107 (100.0%) | 0 (0.0%) |
| 15 to 17 Year Olds | 11 (100.0%) | 0 (0.0%) |
| 18 to 19 Year Olds | 0 (0.0%) | 0 (0.0%) |
| 20 to 24 Year Olds | 0 (0.0%) | 0 (0.0%) |
| 25 to 34 Year Olds | 21 (100.0%) | 0 (0.0%) |
| 35 Years and over | 0 (0.0%) | 10 (100.0%) |
| Total | 231 (95.9%) | 10 (4.1%) |
Educational Attainment by Field of Study in Weissport East
Business (49 | 35.5%), psychology (42 | 30.4%), computers & mathematics (17 | 12.3%), education (15 | 10.9%), and liberal arts & history (15 | 10.9%) are the most common fields of study among 138 individuals in Weissport East who have obtained a bachelor's degree or higher.
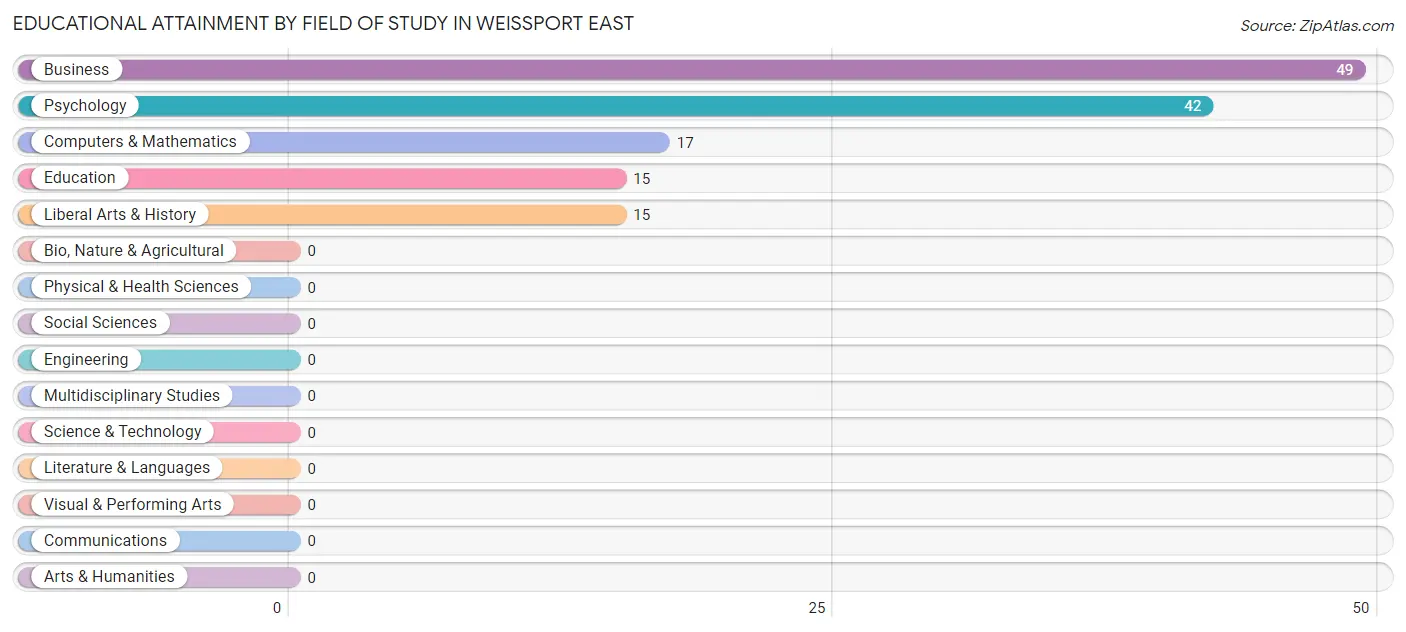
| Field of Study | # Graduates | % Graduates |
| Computers & Mathematics | 17 | 12.3% |
| Bio, Nature & Agricultural | 0 | 0.0% |
| Physical & Health Sciences | 0 | 0.0% |
| Psychology | 42 | 30.4% |
| Social Sciences | 0 | 0.0% |
| Engineering | 0 | 0.0% |
| Multidisciplinary Studies | 0 | 0.0% |
| Science & Technology | 0 | 0.0% |
| Business | 49 | 35.5% |
| Education | 15 | 10.9% |
| Literature & Languages | 0 | 0.0% |
| Liberal Arts & History | 15 | 10.9% |
| Visual & Performing Arts | 0 | 0.0% |
| Communications | 0 | 0.0% |
| Arts & Humanities | 0 | 0.0% |
| Total | 138 | 100.0% |
Transportation & Commute in Weissport East
Vehicle Availability by Sex in Weissport East
The most prevalent vehicle ownership categories in Weissport East are males with 3 vehicles (128, accounting for 36.1%) and females with 3 vehicles (157, making up 37.7%).
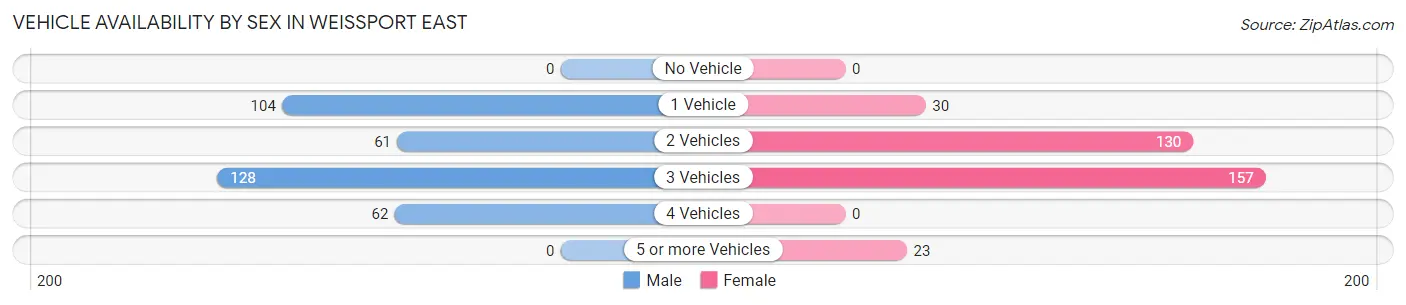
| Vehicles Available | Male | Female |
| No Vehicle | 0 (0.0%) | 0 (0.0%) |
| 1 Vehicle | 104 (29.3%) | 30 (8.8%) |
| 2 Vehicles | 61 (17.2%) | 130 (38.2%) |
| 3 Vehicles | 128 (36.1%) | 157 (46.2%) |
| 4 Vehicles | 62 (17.5%) | 0 (0.0%) |
| 5 or more Vehicles | 0 (0.0%) | 23 (6.8%) |
| Total | 355 (100.0%) | 340 (100.0%) |
Commute Time in Weissport East
The most frequently occuring commute durations in Weissport East are 30 to 34 minutes (215 commuters, 31.5%), 45 to 59 minutes (132 commuters, 19.4%), and 40 to 44 minutes (105 commuters, 15.4%).
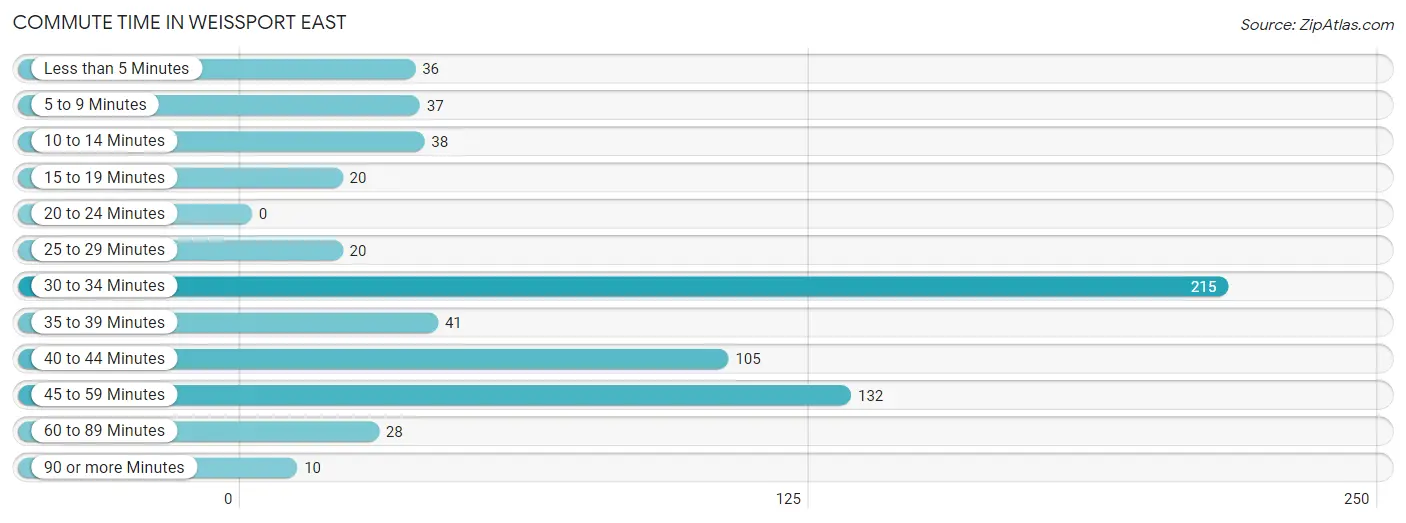
| Commute Time | # Commuters | % Commuters |
| Less than 5 Minutes | 36 | 5.3% |
| 5 to 9 Minutes | 37 | 5.4% |
| 10 to 14 Minutes | 38 | 5.6% |
| 15 to 19 Minutes | 20 | 2.9% |
| 20 to 24 Minutes | 0 | 0.0% |
| 25 to 29 Minutes | 20 | 2.9% |
| 30 to 34 Minutes | 215 | 31.5% |
| 35 to 39 Minutes | 41 | 6.0% |
| 40 to 44 Minutes | 105 | 15.4% |
| 45 to 59 Minutes | 132 | 19.4% |
| 60 to 89 Minutes | 28 | 4.1% |
| 90 or more Minutes | 10 | 1.5% |
Commute Time by Sex in Weissport East
The most common commute times in Weissport East are 30 to 34 minutes (128 commuters, 36.1%) for males and 30 to 34 minutes (87 commuters, 26.6%) for females.
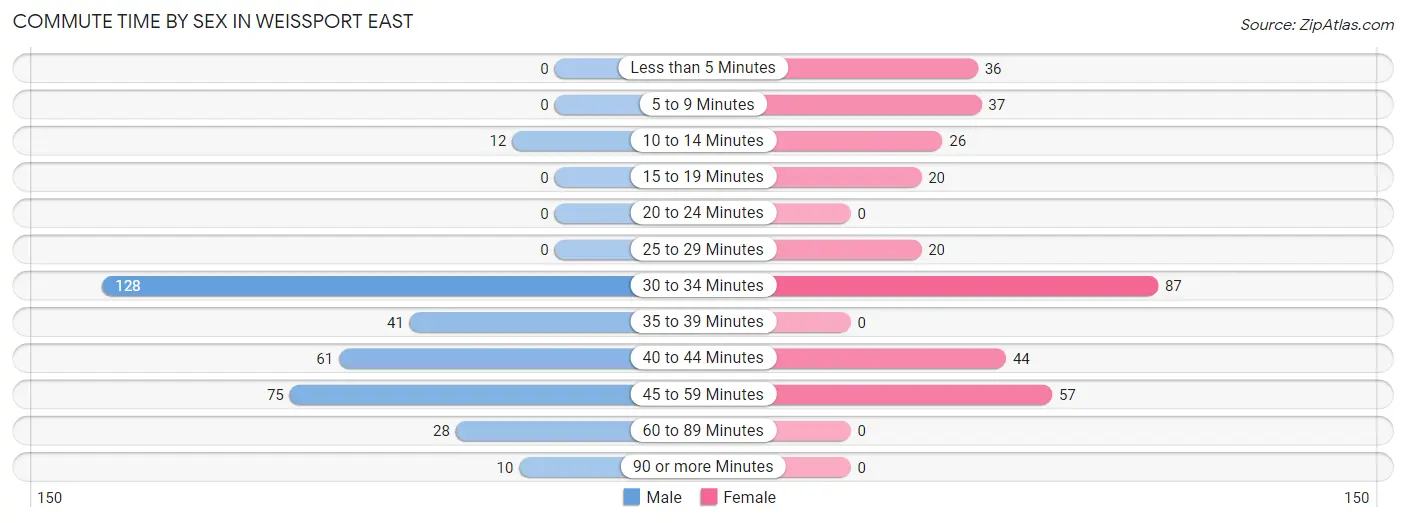
| Commute Time | Male | Female |
| Less than 5 Minutes | 0 (0.0%) | 36 (11.0%) |
| 5 to 9 Minutes | 0 (0.0%) | 37 (11.3%) |
| 10 to 14 Minutes | 12 (3.4%) | 26 (8.0%) |
| 15 to 19 Minutes | 0 (0.0%) | 20 (6.1%) |
| 20 to 24 Minutes | 0 (0.0%) | 0 (0.0%) |
| 25 to 29 Minutes | 0 (0.0%) | 20 (6.1%) |
| 30 to 34 Minutes | 128 (36.1%) | 87 (26.6%) |
| 35 to 39 Minutes | 41 (11.6%) | 0 (0.0%) |
| 40 to 44 Minutes | 61 (17.2%) | 44 (13.5%) |
| 45 to 59 Minutes | 75 (21.1%) | 57 (17.4%) |
| 60 to 89 Minutes | 28 (7.9%) | 0 (0.0%) |
| 90 or more Minutes | 10 (2.8%) | 0 (0.0%) |
Time of Departure to Work by Sex in Weissport East
The most frequent times of departure to work in Weissport East are 5:00 AM to 5:29 AM (70, 19.7%) for males and 7:00 AM to 7:29 AM (121, 37.0%) for females.
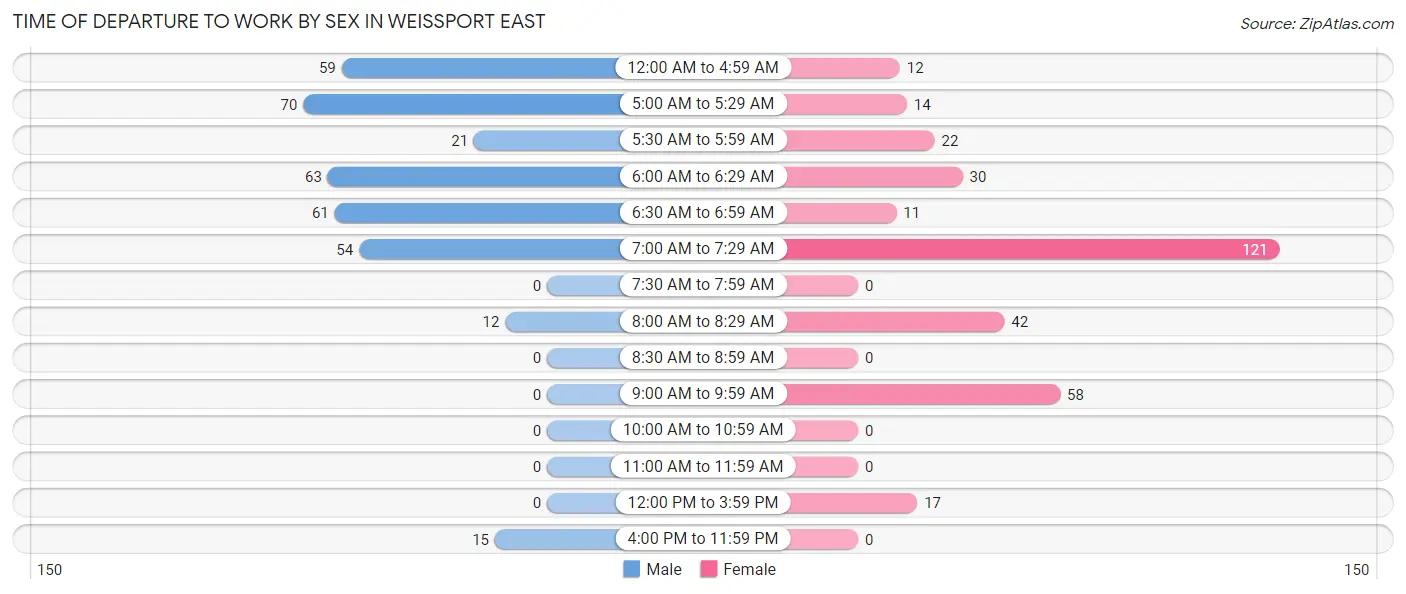
| Time of Departure | Male | Female |
| 12:00 AM to 4:59 AM | 59 (16.6%) | 12 (3.7%) |
| 5:00 AM to 5:29 AM | 70 (19.7%) | 14 (4.3%) |
| 5:30 AM to 5:59 AM | 21 (5.9%) | 22 (6.7%) |
| 6:00 AM to 6:29 AM | 63 (17.7%) | 30 (9.2%) |
| 6:30 AM to 6:59 AM | 61 (17.2%) | 11 (3.4%) |
| 7:00 AM to 7:29 AM | 54 (15.2%) | 121 (37.0%) |
| 7:30 AM to 7:59 AM | 0 (0.0%) | 0 (0.0%) |
| 8:00 AM to 8:29 AM | 12 (3.4%) | 42 (12.8%) |
| 8:30 AM to 8:59 AM | 0 (0.0%) | 0 (0.0%) |
| 9:00 AM to 9:59 AM | 0 (0.0%) | 58 (17.7%) |
| 10:00 AM to 10:59 AM | 0 (0.0%) | 0 (0.0%) |
| 11:00 AM to 11:59 AM | 0 (0.0%) | 0 (0.0%) |
| 12:00 PM to 3:59 PM | 0 (0.0%) | 17 (5.2%) |
| 4:00 PM to 11:59 PM | 15 (4.2%) | 0 (0.0%) |
| Total | 355 (100.0%) | 327 (100.0%) |
Housing Occupancy in Weissport East
Occupancy by Ownership in Weissport East
Of the total 734 dwellings in Weissport East, owner-occupied units account for 573 (78.1%), while renter-occupied units make up 161 (21.9%).
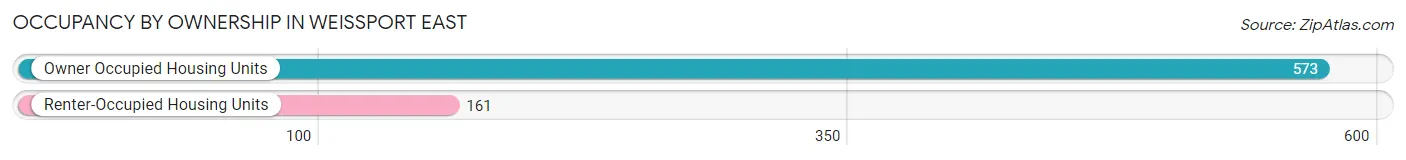
| Occupancy | # Housing Units | % Housing Units |
| Owner Occupied Housing Units | 573 | 78.1% |
| Renter-Occupied Housing Units | 161 | 21.9% |
| Total Occupied Housing Units | 734 | 100.0% |
Occupancy by Household Size in Weissport East
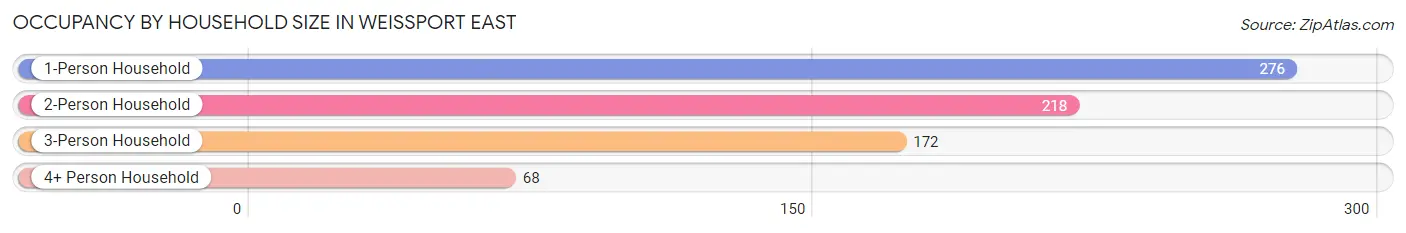
| Household Size | # Housing Units | % Housing Units |
| 1-Person Household | 276 | 37.6% |
| 2-Person Household | 218 | 29.7% |
| 3-Person Household | 172 | 23.4% |
| 4+ Person Household | 68 | 9.3% |
| Total Housing Units | 734 | 100.0% |
Occupancy by Ownership by Household Size in Weissport East
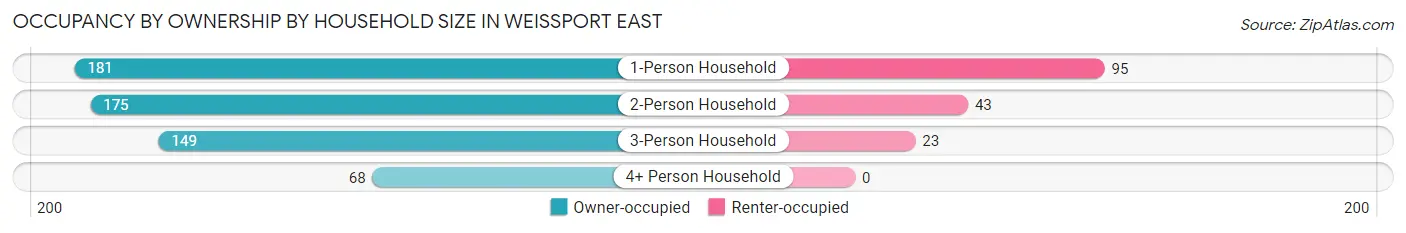
| Household Size | Owner-occupied | Renter-occupied |
| 1-Person Household | 181 (65.6%) | 95 (34.4%) |
| 2-Person Household | 175 (80.3%) | 43 (19.7%) |
| 3-Person Household | 149 (86.6%) | 23 (13.4%) |
| 4+ Person Household | 68 (100.0%) | 0 (0.0%) |
| Total Housing Units | 573 (78.1%) | 161 (21.9%) |
Occupancy by Educational Attainment in Weissport East
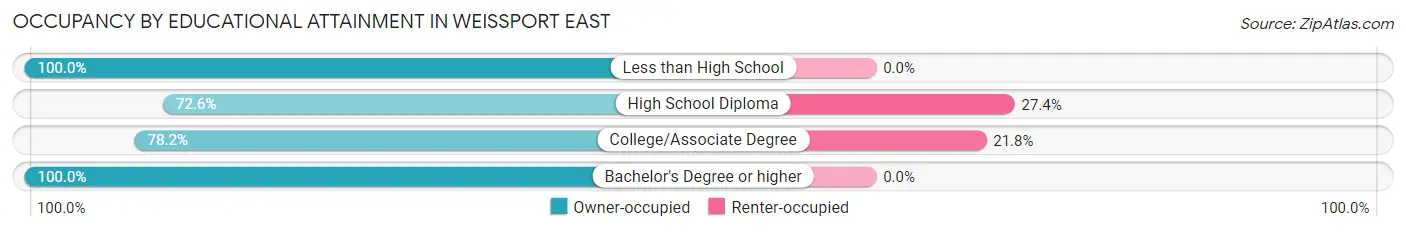
| Household Size | Owner-occupied | Renter-occupied |
| Less than High School | 11 (100.0%) | 0 (0.0%) |
| High School Diploma | 312 (72.6%) | 118 (27.4%) |
| College/Associate Degree | 154 (78.2%) | 43 (21.8%) |
| Bachelor's Degree or higher | 96 (100.0%) | 0 (0.0%) |
Occupancy by Age of Householder in Weissport East
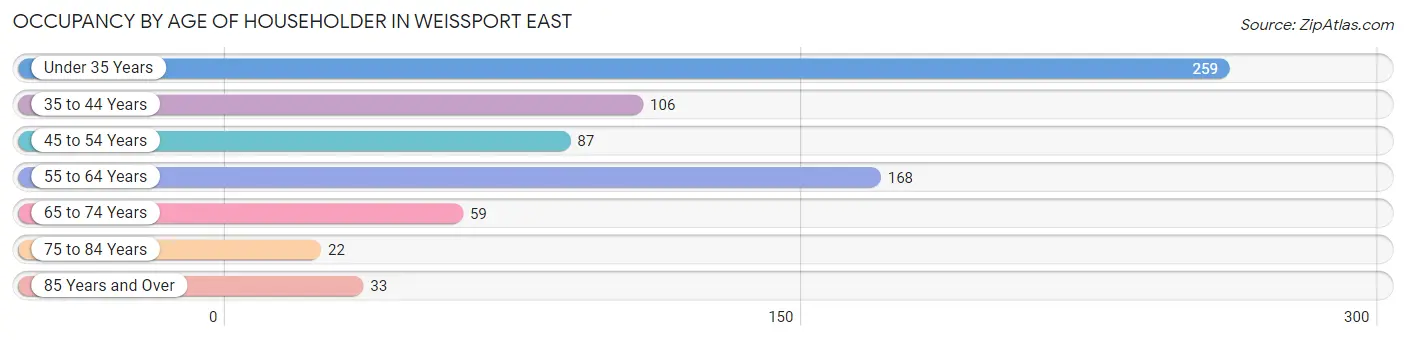
| Age Bracket | # Households | % Households |
| Under 35 Years | 259 | 35.3% |
| 35 to 44 Years | 106 | 14.4% |
| 45 to 54 Years | 87 | 11.8% |
| 55 to 64 Years | 168 | 22.9% |
| 65 to 74 Years | 59 | 8.0% |
| 75 to 84 Years | 22 | 3.0% |
| 85 Years and Over | 33 | 4.5% |
| Total | 734 | 100.0% |
Housing Finances in Weissport East
Median Income by Occupancy in Weissport East
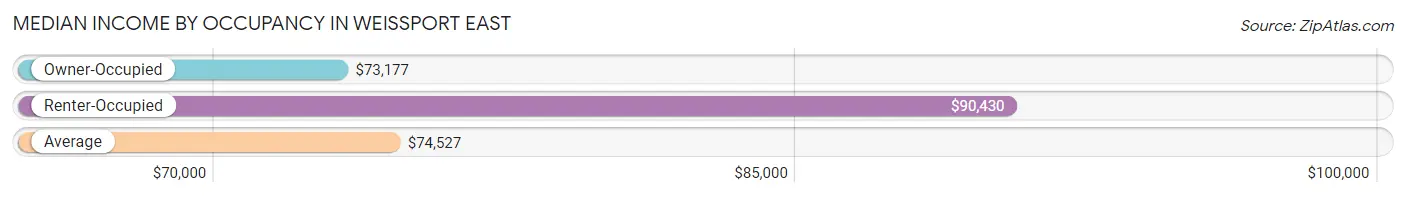
| Occupancy Type | # Households | Median Income |
| Owner-Occupied | 573 (78.1%) | $73,177 |
| Renter-Occupied | 161 (21.9%) | $90,430 |
| Average | 734 (100.0%) | $74,527 |
Occupancy by Householder Income Bracket in Weissport East
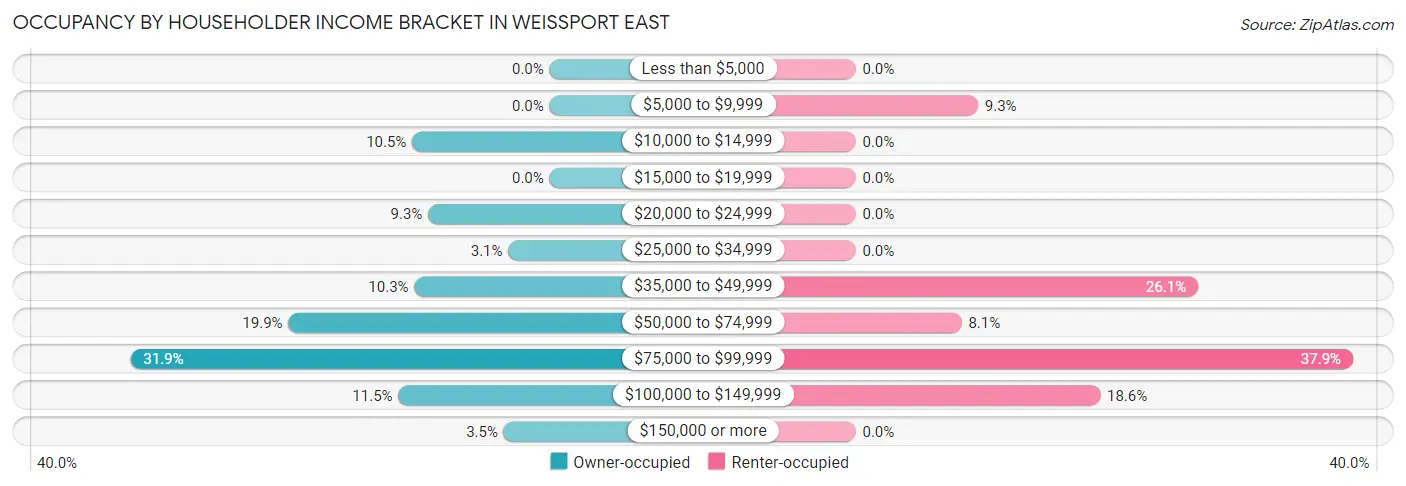
| Income Bracket | Owner-occupied | Renter-occupied |
| Less than $5,000 | 0 (0.0%) | 0 (0.0%) |
| $5,000 to $9,999 | 0 (0.0%) | 15 (9.3%) |
| $10,000 to $14,999 | 60 (10.5%) | 0 (0.0%) |
| $15,000 to $19,999 | 0 (0.0%) | 0 (0.0%) |
| $20,000 to $24,999 | 53 (9.2%) | 0 (0.0%) |
| $25,000 to $34,999 | 18 (3.1%) | 0 (0.0%) |
| $35,000 to $49,999 | 59 (10.3%) | 42 (26.1%) |
| $50,000 to $74,999 | 114 (19.9%) | 13 (8.1%) |
| $75,000 to $99,999 | 183 (31.9%) | 61 (37.9%) |
| $100,000 to $149,999 | 66 (11.5%) | 30 (18.6%) |
| $150,000 or more | 20 (3.5%) | 0 (0.0%) |
| Total | 573 (100.0%) | 161 (100.0%) |
Monthly Housing Cost Tiers in Weissport East
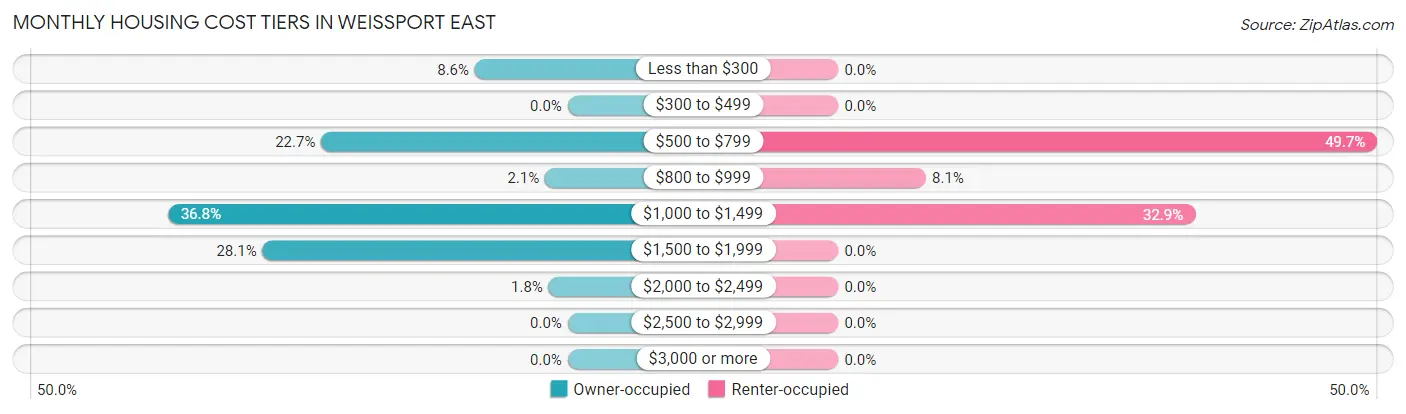
| Monthly Cost | Owner-occupied | Renter-occupied |
| Less than $300 | 49 (8.6%) | 0 (0.0%) |
| $300 to $499 | 0 (0.0%) | 0 (0.0%) |
| $500 to $799 | 130 (22.7%) | 80 (49.7%) |
| $800 to $999 | 12 (2.1%) | 13 (8.1%) |
| $1,000 to $1,499 | 211 (36.8%) | 53 (32.9%) |
| $1,500 to $1,999 | 161 (28.1%) | 0 (0.0%) |
| $2,000 to $2,499 | 10 (1.8%) | 0 (0.0%) |
| $2,500 to $2,999 | 0 (0.0%) | 0 (0.0%) |
| $3,000 or more | 0 (0.0%) | 0 (0.0%) |
| Total | 573 (100.0%) | 161 (100.0%) |
Physical Housing Characteristics in Weissport East
Housing Structures in Weissport East
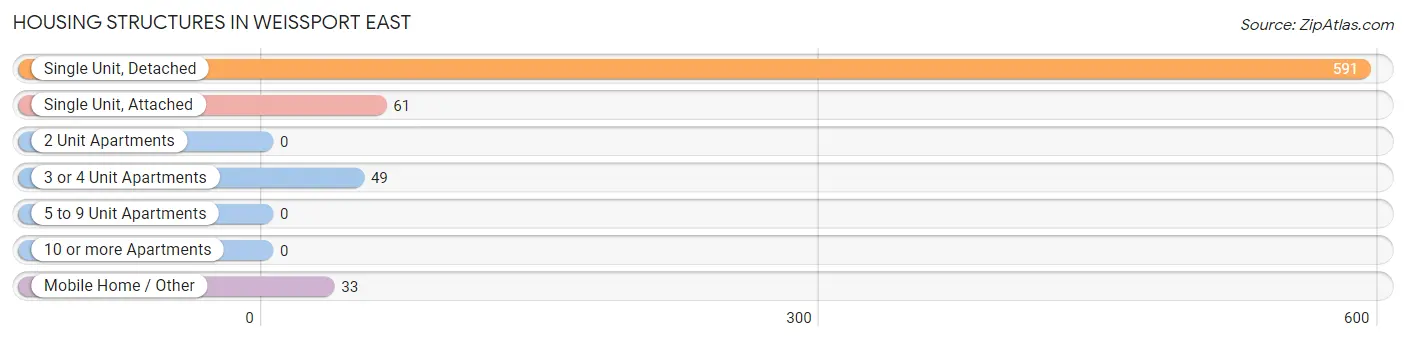
| Structure Type | # Housing Units | % Housing Units |
| Single Unit, Detached | 591 | 80.5% |
| Single Unit, Attached | 61 | 8.3% |
| 2 Unit Apartments | 0 | 0.0% |
| 3 or 4 Unit Apartments | 49 | 6.7% |
| 5 to 9 Unit Apartments | 0 | 0.0% |
| 10 or more Apartments | 0 | 0.0% |
| Mobile Home / Other | 33 | 4.5% |
| Total | 734 | 100.0% |
Housing Structures by Occupancy in Weissport East
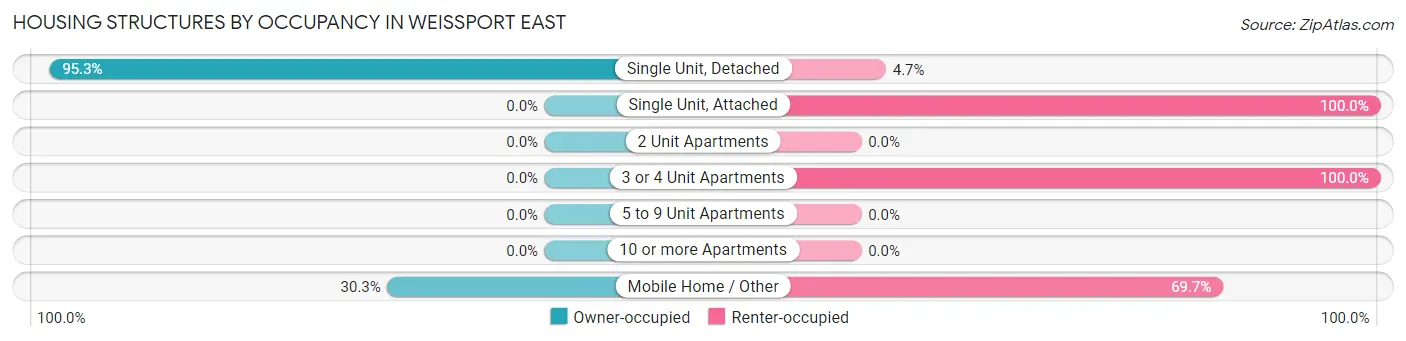
| Structure Type | Owner-occupied | Renter-occupied |
| Single Unit, Detached | 563 (95.3%) | 28 (4.7%) |
| Single Unit, Attached | 0 (0.0%) | 61 (100.0%) |
| 2 Unit Apartments | 0 (0.0%) | 0 (0.0%) |
| 3 or 4 Unit Apartments | 0 (0.0%) | 49 (100.0%) |
| 5 to 9 Unit Apartments | 0 (0.0%) | 0 (0.0%) |
| 10 or more Apartments | 0 (0.0%) | 0 (0.0%) |
| Mobile Home / Other | 10 (30.3%) | 23 (69.7%) |
| Total | 573 (78.1%) | 161 (21.9%) |
Housing Structures by Number of Rooms in Weissport East
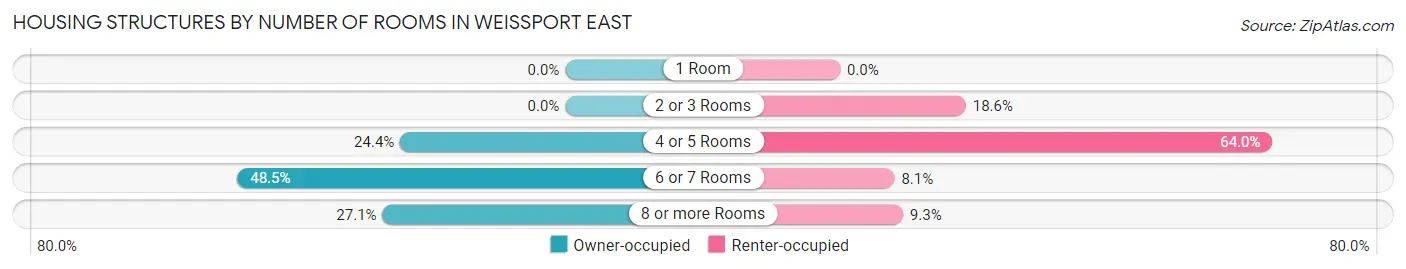
| Number of Rooms | Owner-occupied | Renter-occupied |
| 1 Room | 0 (0.0%) | 0 (0.0%) |
| 2 or 3 Rooms | 0 (0.0%) | 30 (18.6%) |
| 4 or 5 Rooms | 140 (24.4%) | 103 (64.0%) |
| 6 or 7 Rooms | 278 (48.5%) | 13 (8.1%) |
| 8 or more Rooms | 155 (27.1%) | 15 (9.3%) |
| Total | 573 (100.0%) | 161 (100.0%) |
Housing Structure by Heating Type in Weissport East
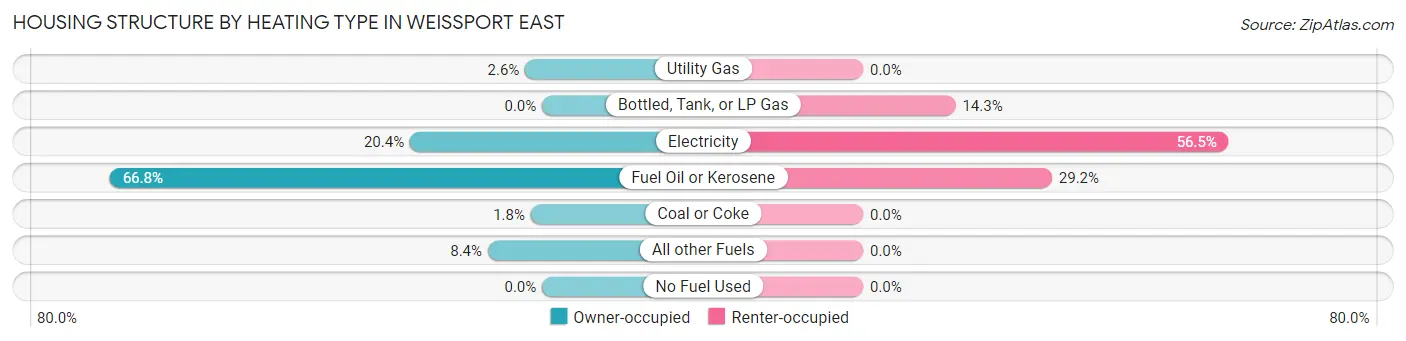
| Heating Type | Owner-occupied | Renter-occupied |
| Utility Gas | 15 (2.6%) | 0 (0.0%) |
| Bottled, Tank, or LP Gas | 0 (0.0%) | 23 (14.3%) |
| Electricity | 117 (20.4%) | 91 (56.5%) |
| Fuel Oil or Kerosene | 383 (66.8%) | 47 (29.2%) |
| Coal or Coke | 10 (1.8%) | 0 (0.0%) |
| All other Fuels | 48 (8.4%) | 0 (0.0%) |
| No Fuel Used | 0 (0.0%) | 0 (0.0%) |
| Total | 573 (100.0%) | 161 (100.0%) |
Household Vehicle Usage in Weissport East
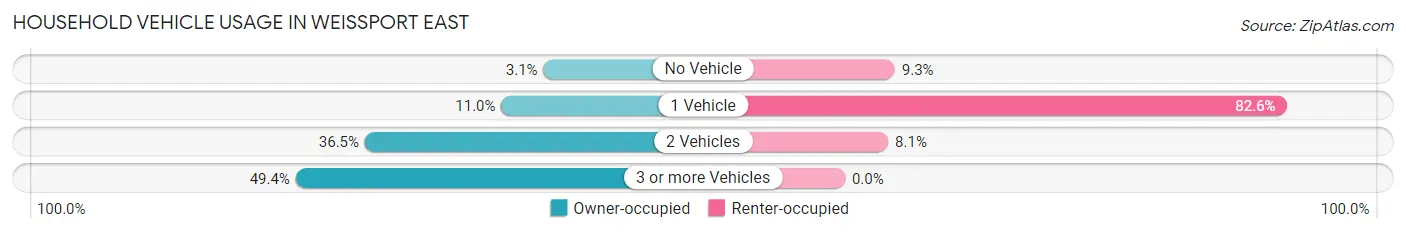
| Vehicles per Household | Owner-occupied | Renter-occupied |
| No Vehicle | 18 (3.1%) | 15 (9.3%) |
| 1 Vehicle | 63 (11.0%) | 133 (82.6%) |
| 2 Vehicles | 209 (36.5%) | 13 (8.1%) |
| 3 or more Vehicles | 283 (49.4%) | 0 (0.0%) |
| Total | 573 (100.0%) | 161 (100.0%) |
Real Estate & Mortgages in Weissport East
Real Estate and Mortgage Overview in Weissport East
| Characteristic | Without Mortgage | With Mortgage |
| Housing Units | 190 | 383 |
| Median Property Value | $201,200 | $180,000 |
| Median Household Income | $37,500 | $20 |
| Monthly Housing Costs | $545 | $0 |
| Real Estate Taxes | $1,489 | $0 |
Property Value by Mortgage Status in Weissport East
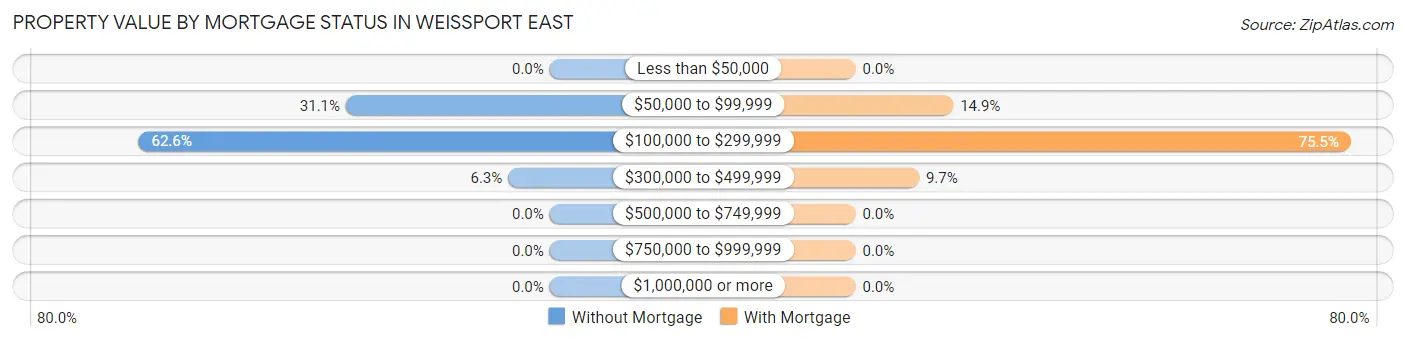
| Property Value | Without Mortgage | With Mortgage |
| Less than $50,000 | 0 (0.0%) | 0 (0.0%) |
| $50,000 to $99,999 | 59 (31.0%) | 57 (14.9%) |
| $100,000 to $299,999 | 119 (62.6%) | 289 (75.5%) |
| $300,000 to $499,999 | 12 (6.3%) | 37 (9.7%) |
| $500,000 to $749,999 | 0 (0.0%) | 0 (0.0%) |
| $750,000 to $999,999 | 0 (0.0%) | 0 (0.0%) |
| $1,000,000 or more | 0 (0.0%) | 0 (0.0%) |
| Total | 190 (100.0%) | 383 (100.0%) |
Household Income by Mortgage Status in Weissport East
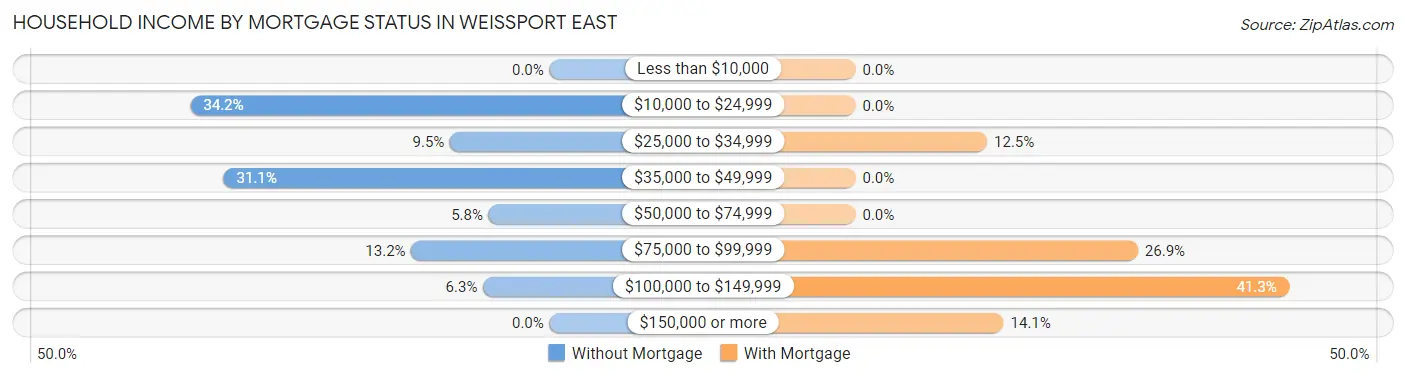
| Household Income | Without Mortgage | With Mortgage |
| Less than $10,000 | 0 (0.0%) | 0 (0.0%) |
| $10,000 to $24,999 | 65 (34.2%) | 0 (0.0%) |
| $25,000 to $34,999 | 18 (9.5%) | 48 (12.5%) |
| $35,000 to $49,999 | 59 (31.0%) | 0 (0.0%) |
| $50,000 to $74,999 | 11 (5.8%) | 0 (0.0%) |
| $75,000 to $99,999 | 25 (13.2%) | 103 (26.9%) |
| $100,000 to $149,999 | 12 (6.3%) | 158 (41.2%) |
| $150,000 or more | 0 (0.0%) | 54 (14.1%) |
| Total | 190 (100.0%) | 383 (100.0%) |
Property Value to Household Income Ratio in Weissport East
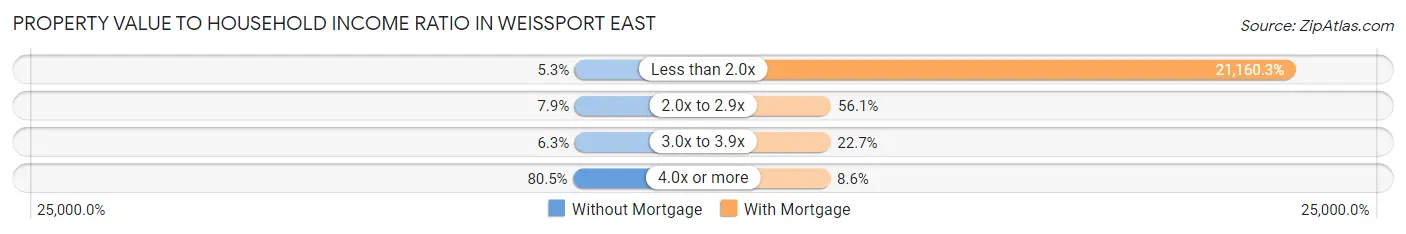
| Value-to-Income Ratio | Without Mortgage | With Mortgage |
| Less than 2.0x | 10 (5.3%) | 81,044 (21,160.3%) |
| 2.0x to 2.9x | 15 (7.9%) | 215 (56.1%) |
| 3.0x to 3.9x | 12 (6.3%) | 87 (22.7%) |
| 4.0x or more | 153 (80.5%) | 33 (8.6%) |
| Total | 190 (100.0%) | 383 (100.0%) |
Real Estate Taxes by Mortgage Status in Weissport East
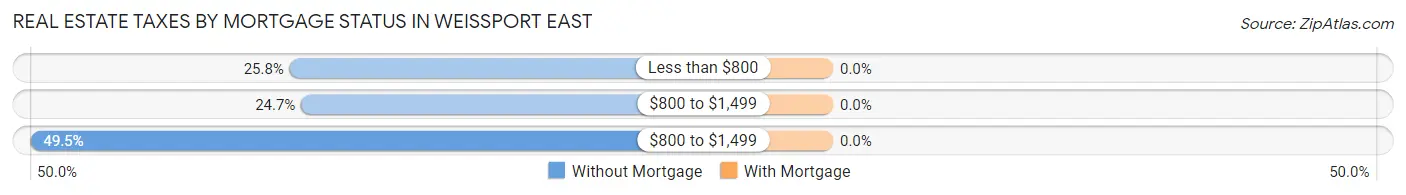
| Property Taxes | Without Mortgage | With Mortgage |
| Less than $800 | 49 (25.8%) | 0 (0.0%) |
| $800 to $1,499 | 47 (24.7%) | 0 (0.0%) |
| $800 to $1,499 | 94 (49.5%) | 0 (0.0%) |
| Total | 190 (100.0%) | 383 (100.0%) |
Health & Disability in Weissport East
Health Insurance Coverage by Age in Weissport East
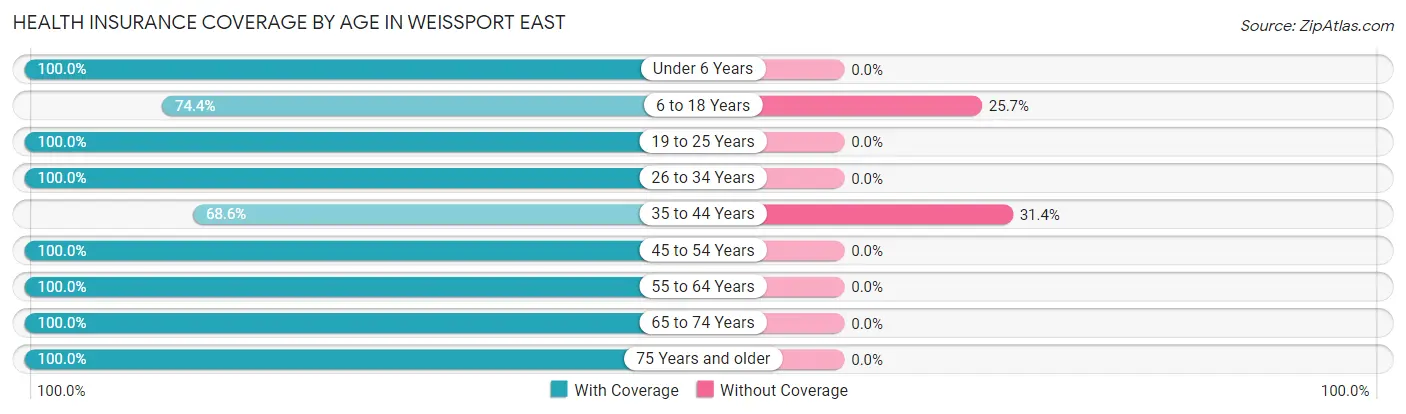
| Age Bracket | With Coverage | Without Coverage |
| Under 6 Years | 136 (100.0%) | 0 (0.0%) |
| 6 to 18 Years | 142 (74.4%) | 49 (25.7%) |
| 19 to 25 Years | 66 (100.0%) | 0 (0.0%) |
| 26 to 34 Years | 282 (100.0%) | 0 (0.0%) |
| 35 to 44 Years | 201 (68.6%) | 92 (31.4%) |
| 45 to 54 Years | 152 (100.0%) | 0 (0.0%) |
| 55 to 64 Years | 245 (100.0%) | 0 (0.0%) |
| 65 to 74 Years | 120 (100.0%) | 0 (0.0%) |
| 75 Years and older | 66 (100.0%) | 0 (0.0%) |
| Total | 1,410 (90.9%) | 141 (9.1%) |
Health Insurance Coverage by Citizenship Status in Weissport East
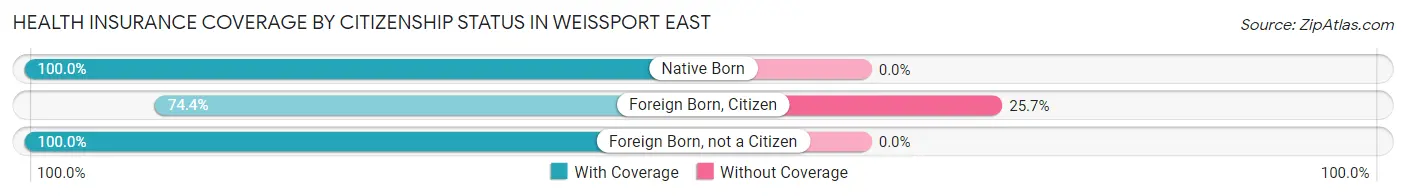
| Citizenship Status | With Coverage | Without Coverage |
| Native Born | 136 (100.0%) | 0 (0.0%) |
| Foreign Born, Citizen | 142 (74.4%) | 49 (25.7%) |
| Foreign Born, not a Citizen | 66 (100.0%) | 0 (0.0%) |
Health Insurance Coverage by Household Income in Weissport East
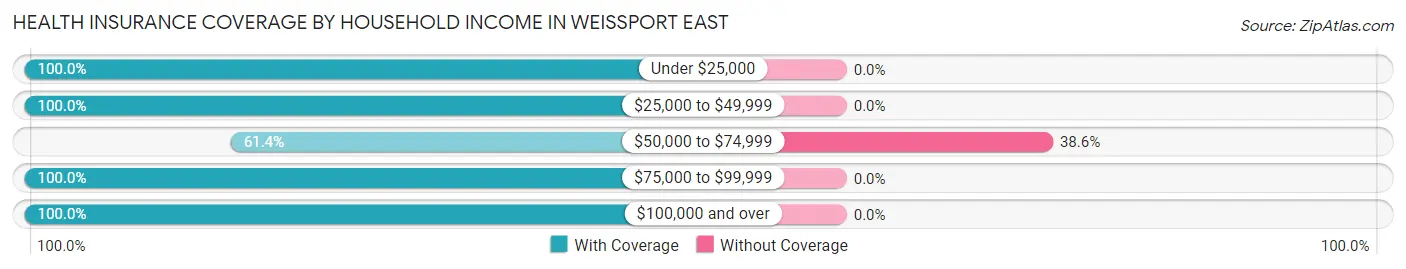
| Household Income | With Coverage | Without Coverage |
| Under $25,000 | 139 (100.0%) | 0 (0.0%) |
| $25,000 to $49,999 | 164 (100.0%) | 0 (0.0%) |
| $50,000 to $74,999 | 224 (61.4%) | 141 (38.6%) |
| $75,000 to $99,999 | 475 (100.0%) | 0 (0.0%) |
| $100,000 and over | 408 (100.0%) | 0 (0.0%) |
Public vs Private Health Insurance Coverage by Age in Weissport East
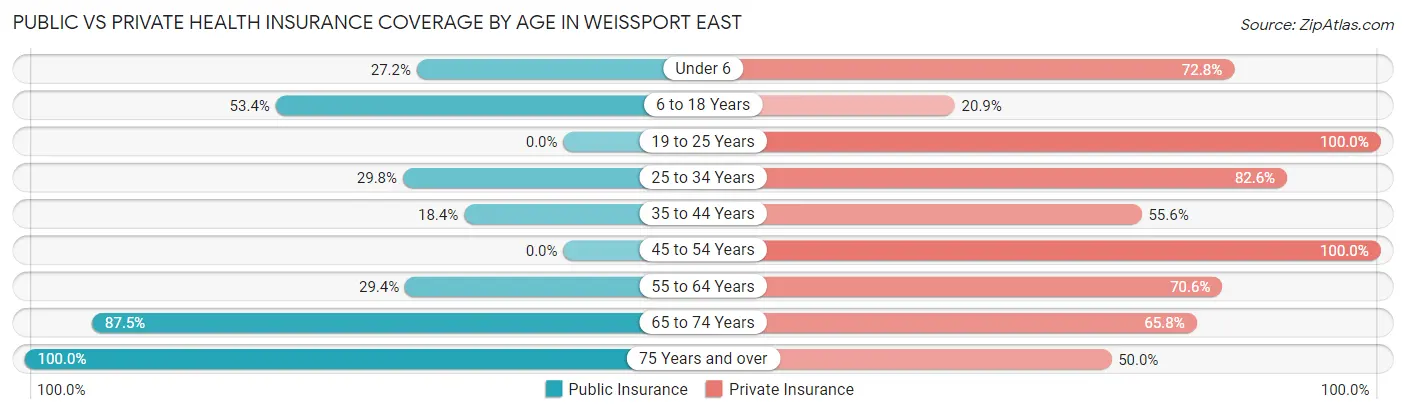
| Age Bracket | Public Insurance | Private Insurance |
| Under 6 | 37 (27.2%) | 99 (72.8%) |
| 6 to 18 Years | 102 (53.4%) | 40 (20.9%) |
| 19 to 25 Years | 0 (0.0%) | 66 (100.0%) |
| 25 to 34 Years | 84 (29.8%) | 233 (82.6%) |
| 35 to 44 Years | 54 (18.4%) | 163 (55.6%) |
| 45 to 54 Years | 0 (0.0%) | 152 (100.0%) |
| 55 to 64 Years | 72 (29.4%) | 173 (70.6%) |
| 65 to 74 Years | 105 (87.5%) | 79 (65.8%) |
| 75 Years and over | 66 (100.0%) | 33 (50.0%) |
| Total | 520 (33.5%) | 1,038 (66.9%) |
Disability Status by Sex by Age in Weissport East
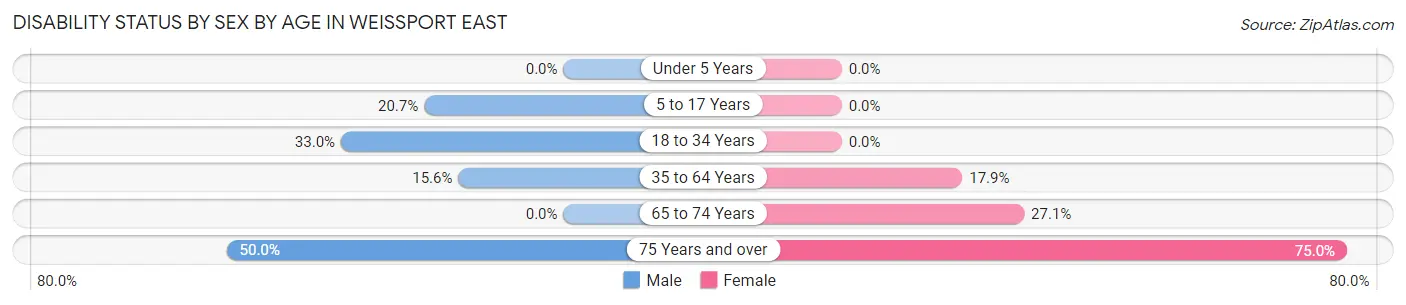
| Age Bracket | Male | Female |
| Under 5 Years | 0 (0.0%) | 0 (0.0%) |
| 5 to 17 Years | 24 (20.7%) | 0 (0.0%) |
| 18 to 34 Years | 72 (33.0%) | 0 (0.0%) |
| 35 to 64 Years | 44 (15.6%) | 73 (17.9%) |
| 65 to 74 Years | 0 (0.0%) | 13 (27.1%) |
| 75 Years and over | 11 (50.0%) | 33 (75.0%) |
Disability Class by Sex by Age in Weissport East
Disability Class: Hearing Difficulty
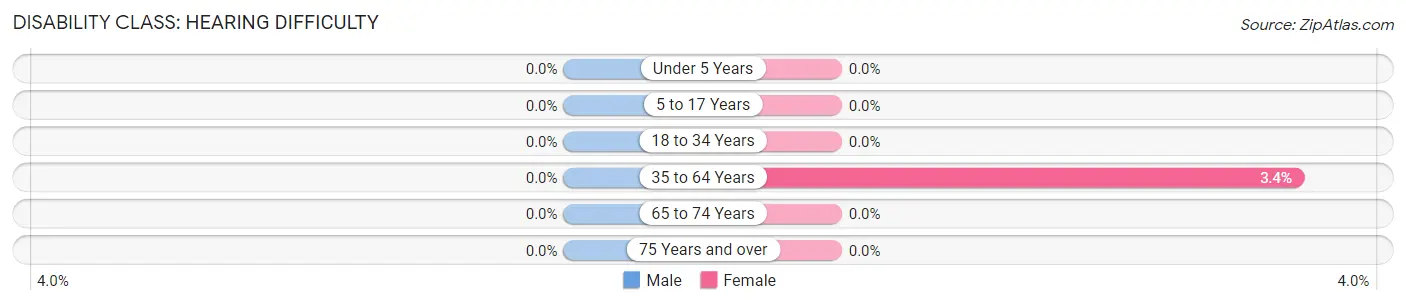
| Age Bracket | Male | Female |
| Under 5 Years | 0 (0.0%) | 0 (0.0%) |
| 5 to 17 Years | 0 (0.0%) | 0 (0.0%) |
| 18 to 34 Years | 0 (0.0%) | 0 (0.0%) |
| 35 to 64 Years | 0 (0.0%) | 14 (3.4%) |
| 65 to 74 Years | 0 (0.0%) | 0 (0.0%) |
| 75 Years and over | 0 (0.0%) | 0 (0.0%) |
Disability Class: Vision Difficulty
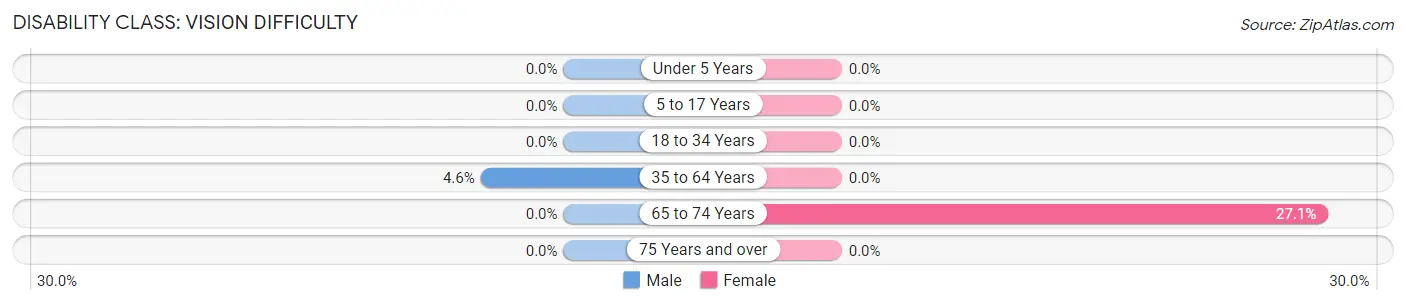
| Age Bracket | Male | Female |
| Under 5 Years | 0 (0.0%) | 0 (0.0%) |
| 5 to 17 Years | 0 (0.0%) | 0 (0.0%) |
| 18 to 34 Years | 0 (0.0%) | 0 (0.0%) |
| 35 to 64 Years | 13 (4.6%) | 0 (0.0%) |
| 65 to 74 Years | 0 (0.0%) | 13 (27.1%) |
| 75 Years and over | 0 (0.0%) | 0 (0.0%) |
Disability Class: Cognitive Difficulty
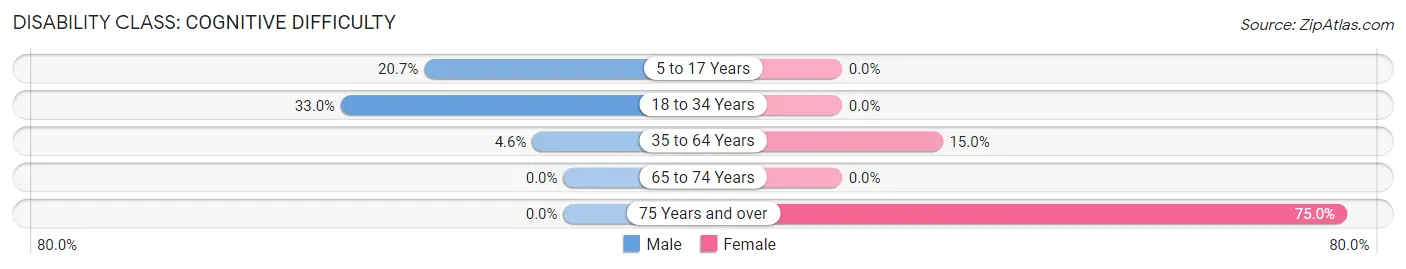
| Age Bracket | Male | Female |
| 5 to 17 Years | 24 (20.7%) | 0 (0.0%) |
| 18 to 34 Years | 72 (33.0%) | 0 (0.0%) |
| 35 to 64 Years | 13 (4.6%) | 61 (14.9%) |
| 65 to 74 Years | 0 (0.0%) | 0 (0.0%) |
| 75 Years and over | 0 (0.0%) | 33 (75.0%) |
Disability Class: Ambulatory Difficulty
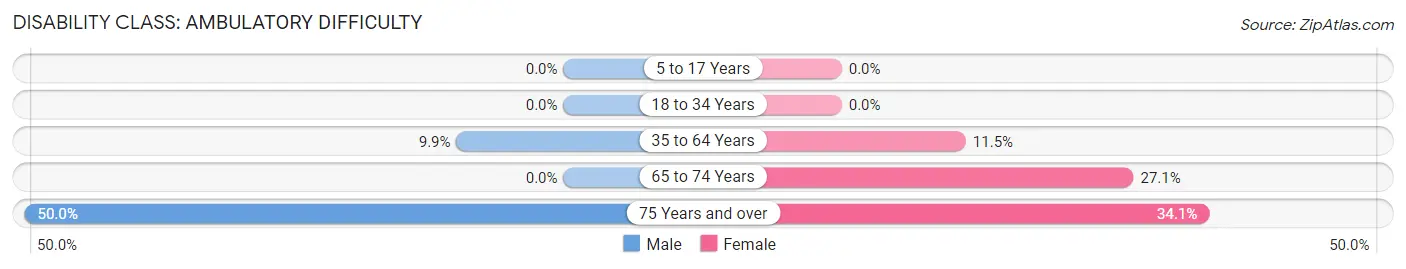
| Age Bracket | Male | Female |
| 5 to 17 Years | 0 (0.0%) | 0 (0.0%) |
| 18 to 34 Years | 0 (0.0%) | 0 (0.0%) |
| 35 to 64 Years | 28 (9.9%) | 47 (11.5%) |
| 65 to 74 Years | 0 (0.0%) | 13 (27.1%) |
| 75 Years and over | 11 (50.0%) | 15 (34.1%) |
Disability Class: Self-Care Difficulty
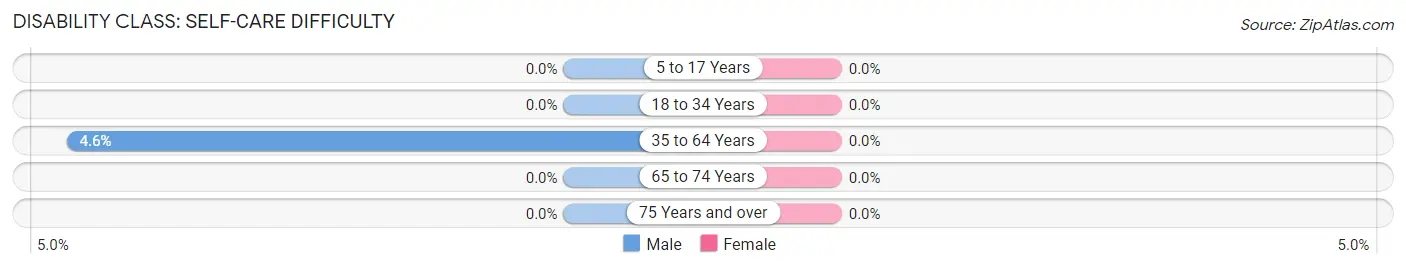
| Age Bracket | Male | Female |
| 5 to 17 Years | 0 (0.0%) | 0 (0.0%) |
| 18 to 34 Years | 0 (0.0%) | 0 (0.0%) |
| 35 to 64 Years | 13 (4.6%) | 0 (0.0%) |
| 65 to 74 Years | 0 (0.0%) | 0 (0.0%) |
| 75 Years and over | 0 (0.0%) | 0 (0.0%) |
Technology Access in Weissport East
Computing Device Access in Weissport East
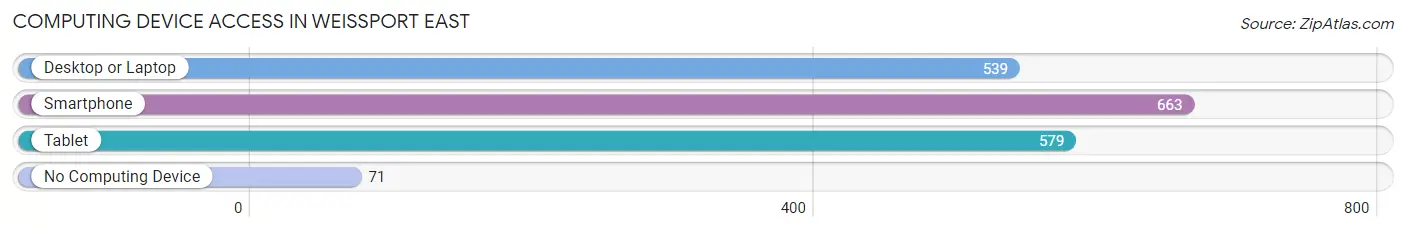
| Device Type | # Households | % Households |
| Desktop or Laptop | 539 | 73.4% |
| Smartphone | 663 | 90.3% |
| Tablet | 579 | 78.9% |
| No Computing Device | 71 | 9.7% |
| Total | 734 | 100.0% |
Internet Access in Weissport East
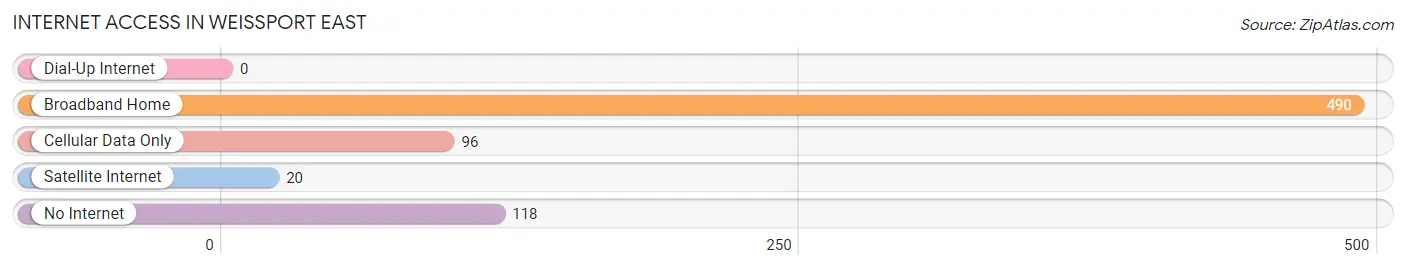
| Internet Type | # Households | % Households |
| Dial-Up Internet | 0 | 0.0% |
| Broadband Home | 490 | 66.8% |
| Cellular Data Only | 96 | 13.1% |
| Satellite Internet | 20 | 2.7% |
| No Internet | 118 | 16.1% |
| Total | 734 | 100.0% |
Weissport East Summary
Weissport East, PA is a small borough located in Carbon County, Pennsylvania. It is situated in the Lehigh Valley region of the state, and is part of the Lehighton Area School District. The population of Weissport East was 1,093 at the 2010 census.
Geography
Weissport East is located at 40°48'45" North, 75°41'45" West (40.8125, -75.6958). It is situated in the Lehigh Valley region of Pennsylvania, and is part of the Lehighton Area School District. The borough is located in the western part of Carbon County, and is bordered by the boroughs of Weissport West and Parryville to the north, and the townships of East Penn and Franklin to the south. The Lehigh River flows through the borough, and the Lehigh Canal runs along its western border.
The total area of Weissport East is 0.6 square miles, all of which is land. The borough is located in the Appalachian Mountains, and is surrounded by rolling hills and forests. The climate is humid continental, with cold winters and hot, humid summers.
Economy
The economy of Weissport East is largely based on tourism and recreation. The borough is home to several small businesses, including restaurants, shops, and a marina. The Lehigh Canal is a popular destination for fishing, boating, and other recreational activities. The borough also hosts several annual festivals and events, including the Weissport Canal Festival and the Weissport East Summer Festival.
Demographics
As of the 2010 census, the population of Weissport East was 1,093. The racial makeup of the borough was 97.2% White, 0.7% African American, 0.2% Native American, 0.2% Asian, 0.2% from other races, and 1.7% from two or more races. Hispanic or Latino of any race were 1.3% of the population.
The median household income in Weissport East was $41,250, and the median family income was $45,000. The per capita income was $19,845. About 8.3% of families and 10.2% of the population were below the poverty line, including 14.3% of those under age 18 and 8.3% of those age 65 or over.
Education
Weissport East is served by the Lehighton Area School District. The district operates three elementary schools, one middle school, and one high school. The borough is also home to several private schools, including the Weissport East Christian Academy and the Weissport East Montessori School.
Conclusion
Weissport East, PA is a small borough located in Carbon County, Pennsylvania. It is situated in the Lehigh Valley region of the state, and is part of the Lehighton Area School District. The economy of Weissport East is largely based on tourism and recreation, and the borough is home to several small businesses. The population of Weissport East was 1,093 at the 2010 census, and the median household income was $41,250. The borough is served by the Lehighton Area School District, and is home to several private schools.
Common Questions
What is Per Capita Income in Weissport East?
Per Capita income in Weissport East is $31,911.
What is the Median Family Income in Weissport East?
Median Family Income in Weissport East is $80,696.
What is the Median Household income in Weissport East?
Median Household Income in Weissport East is $74,527.
What is Inequality or Gini Index in Weissport East?
Inequality or Gini Index in Weissport East is 0.32.
What is the Total Population of Weissport East?
Total Population of Weissport East is 1,551.
What is the Total Male Population of Weissport East?
Total Male Population of Weissport East is 767.
What is the Total Female Population of Weissport East?
Total Female Population of Weissport East is 784.
What is the Ratio of Males per 100 Females in Weissport East?
There are 97.83 Males per 100 Females in Weissport East.
What is the Ratio of Females per 100 Males in Weissport East?
There are 102.22 Females per 100 Males in Weissport East.
What is the Median Population Age in Weissport East?
Median Population Age in Weissport East is 38.7 Years.
What is the Average Family Size in Weissport East
Average Family Size in Weissport East is 2.7 People.
What is the Average Household Size in Weissport East
Average Household Size in Weissport East is 2.1 People.
How Large is the Labor Force in Weissport East?
There are 918 People in the Labor Forcein in Weissport East.
What is the Percentage of People in the Labor Force in Weissport East?
74.3% of People are in the Labor Force in Weissport East.
What is the Unemployment Rate in Weissport East?
Unemployment Rate in Weissport East is 22.3%.