Bowmansville, PA Map & Demographics
Bowmansville Map
Bowmansville Overview
$38,676
PER CAPITA INCOME
$119,345
AVG FAMILY INCOME
$101,404
AVG HOUSEHOLD INCOME
24.6%
WAGE / INCOME GAP [ % ]
75.4¢/ $1
WAGE / INCOME GAP [ $ ]
0.30
INEQUALITY / GINI INDEX
2,965
TOTAL POPULATION
1,493
MALE POPULATION
1,472
FEMALE POPULATION
101.43
MALES / 100 FEMALES
98.59
FEMALES / 100 MALES
34.4
MEDIAN AGE
3.4
AVG FAMILY SIZE
3.0
AVG HOUSEHOLD SIZE
2,000
LABOR FORCE [ PEOPLE ]
85.7%
PERCENT IN LABOR FORCE
4.0%
UNEMPLOYMENT RATE
Bowmansville Zip Codes
Bowmansville Area Codes
Income in Bowmansville
Income Overview in Bowmansville
Per Capita Income in Bowmansville is $38,676, while median incomes of families and households are $119,345 and $101,404 respectively.
| Characteristic | Number | Measure |
| Per Capita Income | 2,965 | $38,676 |
| Median Family Income | 773 | $119,345 |
| Mean Family Income | 773 | $126,613 |
| Median Household Income | 1,004 | $101,404 |
| Mean Household Income | 1,004 | $112,333 |
| Income Deficit | 773 | $0 |
| Wage / Income Gap (%) | 2,965 | 24.62% |
| Wage / Income Gap ($) | 2,965 | 75.38¢ per $1 |
| Gini / Inequality Index | 2,965 | 0.30 |
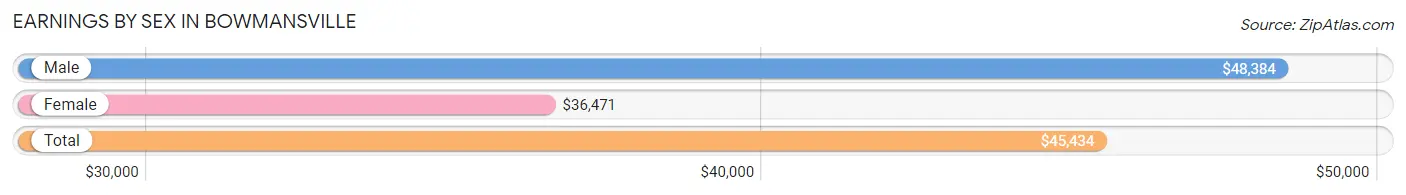
Earnings by Sex in Bowmansville
Average Earnings in Bowmansville are $45,434, $48,384 for men and $36,471 for women, a difference of 24.6%.
| Sex | Number | Average Earnings |
| Male | 1,089 (55.2%) | $48,384 |
| Female | 882 (44.8%) | $36,471 |
| Total | 1,971 (100.0%) | $45,434 |
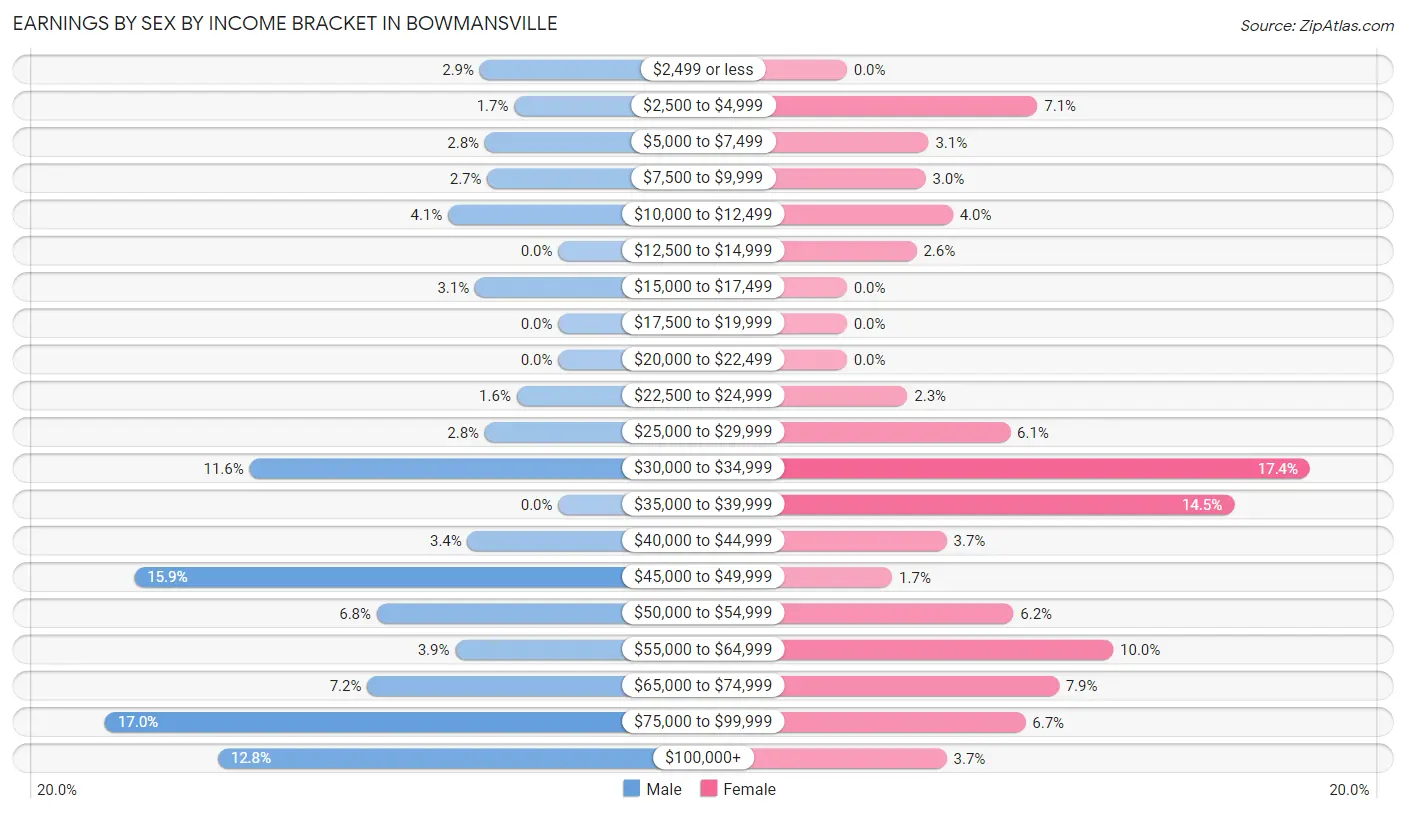
Earnings by Sex by Income Bracket in Bowmansville
The most common earnings brackets in Bowmansville are $75,000 to $99,999 for men (185 | 17.0%) and $30,000 to $34,999 for women (153 | 17.3%).
| Income | Male | Female |
| $2,499 or less | 32 (2.9%) | 0 (0.0%) |
| $2,500 to $4,999 | 18 (1.7%) | 63 (7.1%) |
| $5,000 to $7,499 | 30 (2.8%) | 27 (3.1%) |
| $7,500 to $9,999 | 29 (2.7%) | 26 (2.9%) |
| $10,000 to $12,499 | 45 (4.1%) | 35 (4.0%) |
| $12,500 to $14,999 | 0 (0.0%) | 23 (2.6%) |
| $15,000 to $17,499 | 34 (3.1%) | 0 (0.0%) |
| $17,500 to $19,999 | 0 (0.0%) | 0 (0.0%) |
| $20,000 to $22,499 | 0 (0.0%) | 0 (0.0%) |
| $22,500 to $24,999 | 17 (1.6%) | 20 (2.3%) |
| $25,000 to $29,999 | 30 (2.8%) | 54 (6.1%) |
| $30,000 to $34,999 | 126 (11.6%) | 153 (17.3%) |
| $35,000 to $39,999 | 0 (0.0%) | 128 (14.5%) |
| $40,000 to $44,999 | 37 (3.4%) | 33 (3.7%) |
| $45,000 to $49,999 | 173 (15.9%) | 15 (1.7%) |
| $50,000 to $54,999 | 74 (6.8%) | 55 (6.2%) |
| $55,000 to $64,999 | 42 (3.9%) | 88 (10.0%) |
| $65,000 to $74,999 | 78 (7.2%) | 70 (7.9%) |
| $75,000 to $99,999 | 185 (17.0%) | 59 (6.7%) |
| $100,000+ | 139 (12.8%) | 33 (3.7%) |
| Total | 1,089 (100.0%) | 882 (100.0%) |
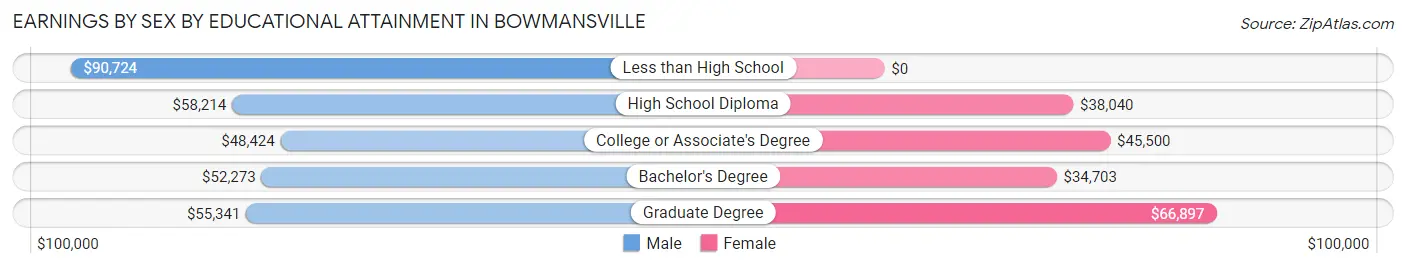
Earnings by Sex by Educational Attainment in Bowmansville
Average earnings in Bowmansville are $54,342 for men and $38,977 for women, a difference of 28.3%. Men with an educational attainment of less than high school enjoy the highest average annual earnings of $90,724, while those with college or associate's degree education earn the least with $48,424. Women with an educational attainment of graduate degree earn the most with the average annual earnings of $66,897, while those with bachelor's degree education have the smallest earnings of $34,703.
| Educational Attainment | Male Income | Female Income |
| Less than High School | $90,724 | $0 |
| High School Diploma | $58,214 | $38,040 |
| College or Associate's Degree | $48,424 | $45,500 |
| Bachelor's Degree | $52,273 | $34,703 |
| Graduate Degree | $55,341 | $66,897 |
| Total | $54,342 | $38,977 |
Family Income in Bowmansville
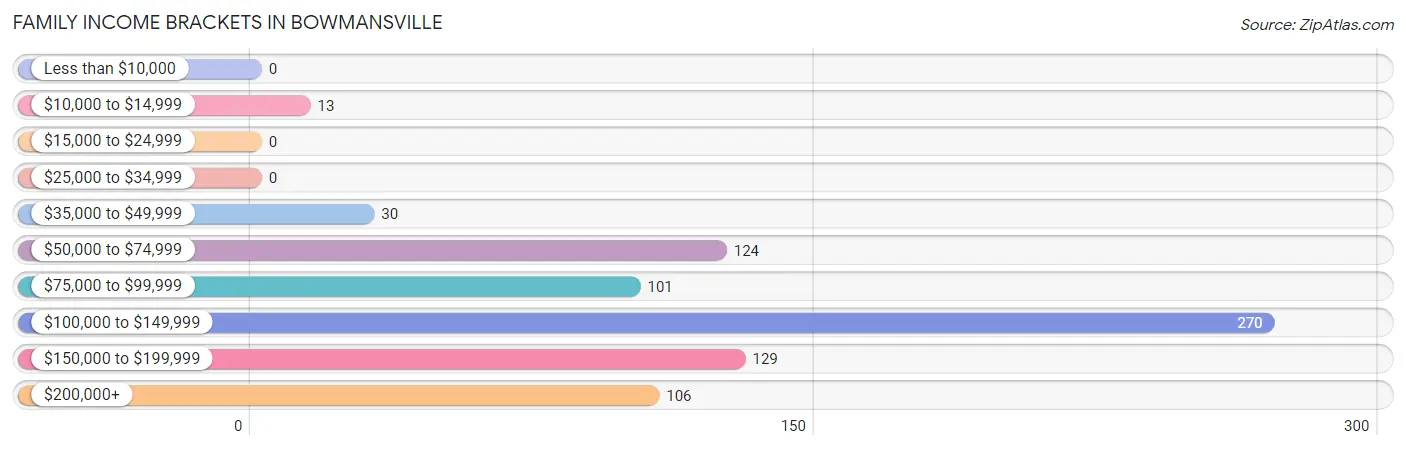
Family Income Brackets in Bowmansville
According to the Bowmansville family income data, there are 270 families falling into the $100,000 to $149,999 income range, which is the most common income bracket and makes up 34.9% of all families.
| Income Bracket | # Families | % Families |
| Less than $10,000 | 0 | 0.0% |
| $10,000 to $14,999 | 13 | 1.7% |
| $15,000 to $24,999 | 0 | 0.0% |
| $25,000 to $34,999 | 0 | 0.0% |
| $35,000 to $49,999 | 30 | 3.9% |
| $50,000 to $74,999 | 124 | 16.0% |
| $75,000 to $99,999 | 101 | 13.1% |
| $100,000 to $149,999 | 270 | 34.9% |
| $150,000 to $199,999 | 129 | 16.7% |
| $200,000+ | 106 | 13.7% |
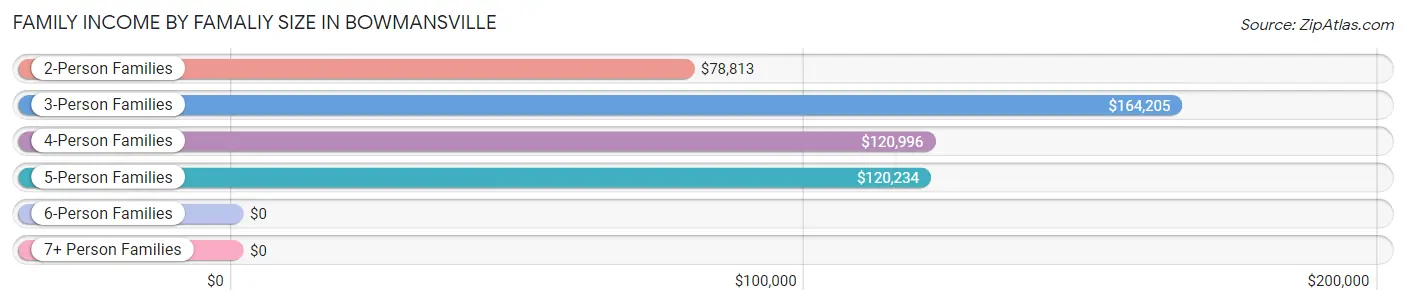
Family Income by Famaliy Size in Bowmansville
3-person families (189 | 24.4%) account for the highest median family income in Bowmansville with $164,205 per family, while 3-person families (189 | 24.4%) have the highest median income of $54,735 per family member.
| Income Bracket | # Families | Median Income |
| 2-Person Families | 281 (36.3%) | $78,813 |
| 3-Person Families | 189 (24.4%) | $164,205 |
| 4-Person Families | 173 (22.4%) | $120,996 |
| 5-Person Families | 55 (7.1%) | $120,234 |
| 6-Person Families | 59 (7.6%) | $0 |
| 7+ Person Families | 16 (2.1%) | $0 |
| Total | 773 (100.0%) | $119,345 |
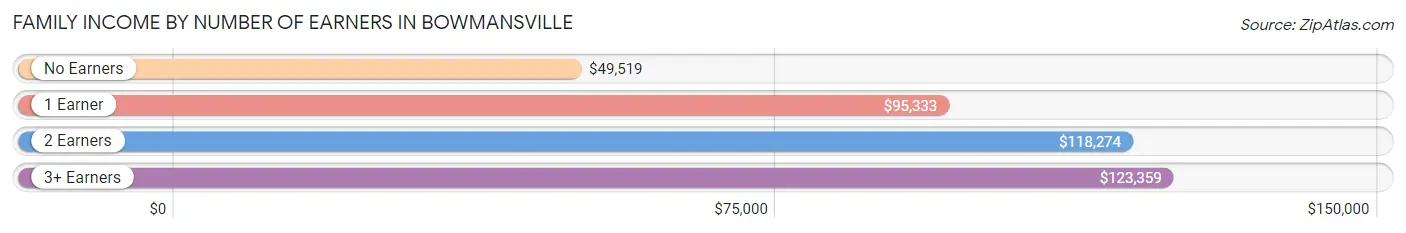
Family Income by Number of Earners in Bowmansville
The median family income in Bowmansville is $119,345, with families comprising 3+ earners (301) having the highest median family income of $123,359, while families with no earners (81) have the lowest median family income of $49,519, accounting for 38.9% and 10.5% of families, respectively.
| Number of Earners | # Families | Median Income |
| No Earners | 81 (10.5%) | $49,519 |
| 1 Earner | 76 (9.8%) | $95,333 |
| 2 Earners | 315 (40.7%) | $118,274 |
| 3+ Earners | 301 (38.9%) | $123,359 |
| Total | 773 (100.0%) | $119,345 |
Household Income in Bowmansville
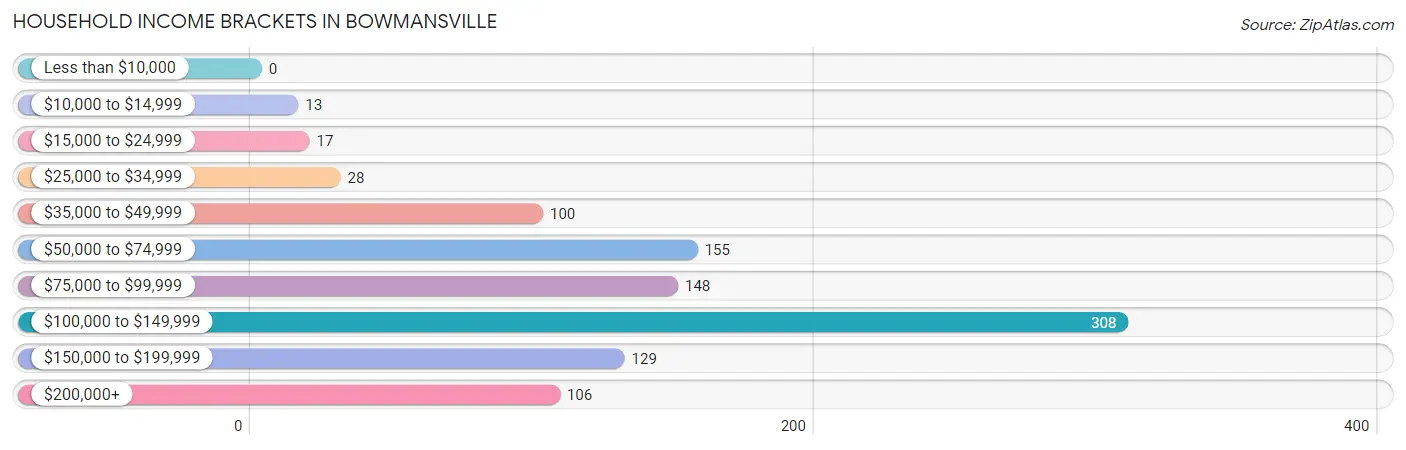
Household Income Brackets in Bowmansville
With 308 households falling in the category, the $100,000 to $149,999 income range is the most frequent in Bowmansville, accounting for 30.7% of all households.
| Income Bracket | # Households | % Households |
| Less than $10,000 | 0 | 0.0% |
| $10,000 to $14,999 | 13 | 1.3% |
| $15,000 to $24,999 | 17 | 1.7% |
| $25,000 to $34,999 | 28 | 2.8% |
| $35,000 to $49,999 | 100 | 10.0% |
| $50,000 to $74,999 | 155 | 15.4% |
| $75,000 to $99,999 | 148 | 14.7% |
| $100,000 to $149,999 | 308 | 30.7% |
| $150,000 to $199,999 | 129 | 12.8% |
| $200,000+ | 106 | 10.6% |
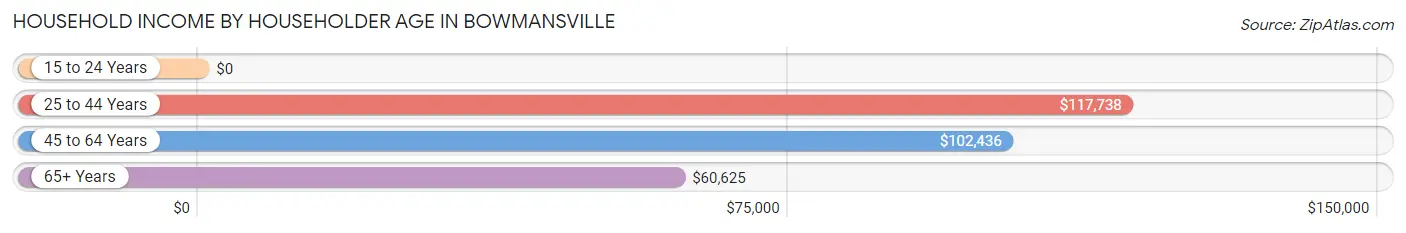
Household Income by Householder Age in Bowmansville
The median household income in Bowmansville is $101,404, with the highest median household income of $117,738 found in the 25 to 44 years age bracket for the primary householder. A total of 288 households (28.7%) fall into this category. Meanwhile, the 15 to 24 years age bracket for the primary householder has the lowest median household income of $0, with 86 households (8.6%) in this group.
| Income Bracket | # Households | Median Income |
| 15 to 24 Years | 86 (8.6%) | $0 |
| 25 to 44 Years | 288 (28.7%) | $117,738 |
| 45 to 64 Years | 479 (47.7%) | $102,436 |
| 65+ Years | 151 (15.0%) | $60,625 |
| Total | 1,004 (100.0%) | $101,404 |
Poverty in Bowmansville
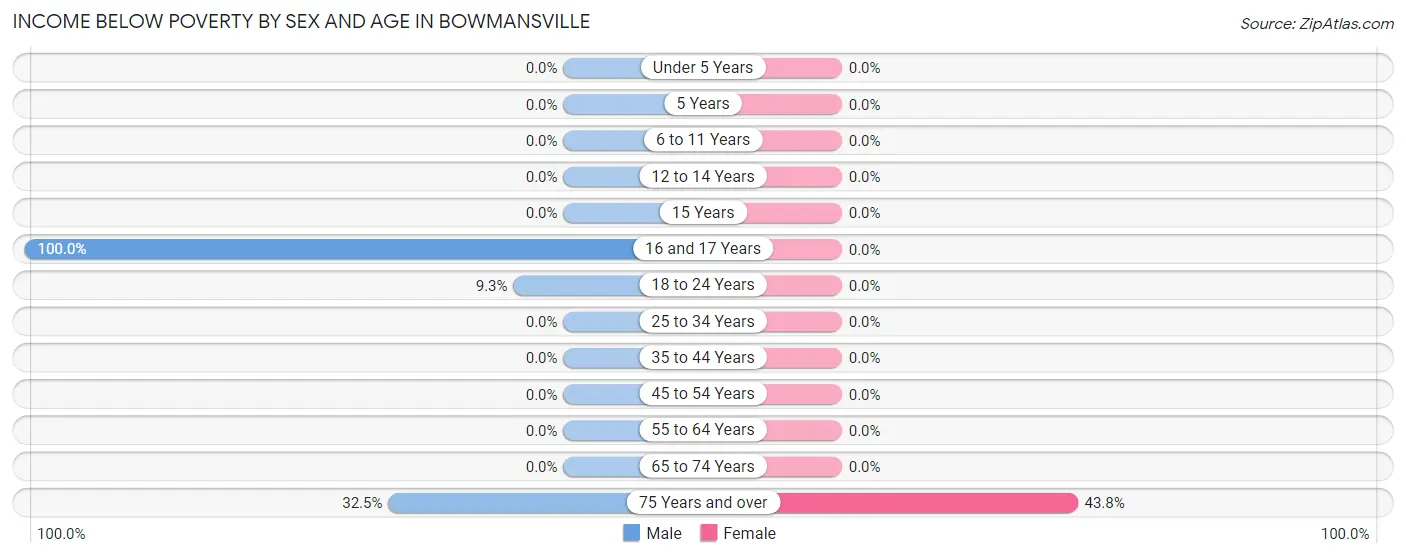
Income Below Poverty by Sex and Age in Bowmansville
With 3.2% poverty level for males and 0.9% for females among the residents of Bowmansville, 16 and 17 year old males and 75 year old and over females are the most vulnerable to poverty, with 12 males (100.0%) and 14 females (43.8%) in their respective age groups living below the poverty level.
| Age Bracket | Male | Female |
| Under 5 Years | 0 (0.0%) | 0 (0.0%) |
| 5 Years | 0 (0.0%) | 0 (0.0%) |
| 6 to 11 Years | 0 (0.0%) | 0 (0.0%) |
| 12 to 14 Years | 0 (0.0%) | 0 (0.0%) |
| 15 Years | 0 (0.0%) | 0 (0.0%) |
| 16 and 17 Years | 12 (100.0%) | 0 (0.0%) |
| 18 to 24 Years | 22 (9.3%) | 0 (0.0%) |
| 25 to 34 Years | 0 (0.0%) | 0 (0.0%) |
| 35 to 44 Years | 0 (0.0%) | 0 (0.0%) |
| 45 to 54 Years | 0 (0.0%) | 0 (0.0%) |
| 55 to 64 Years | 0 (0.0%) | 0 (0.0%) |
| 65 to 74 Years | 0 (0.0%) | 0 (0.0%) |
| 75 Years and over | 13 (32.5%) | 14 (43.8%) |
| Total | 47 (3.2%) | 14 (0.9%) |
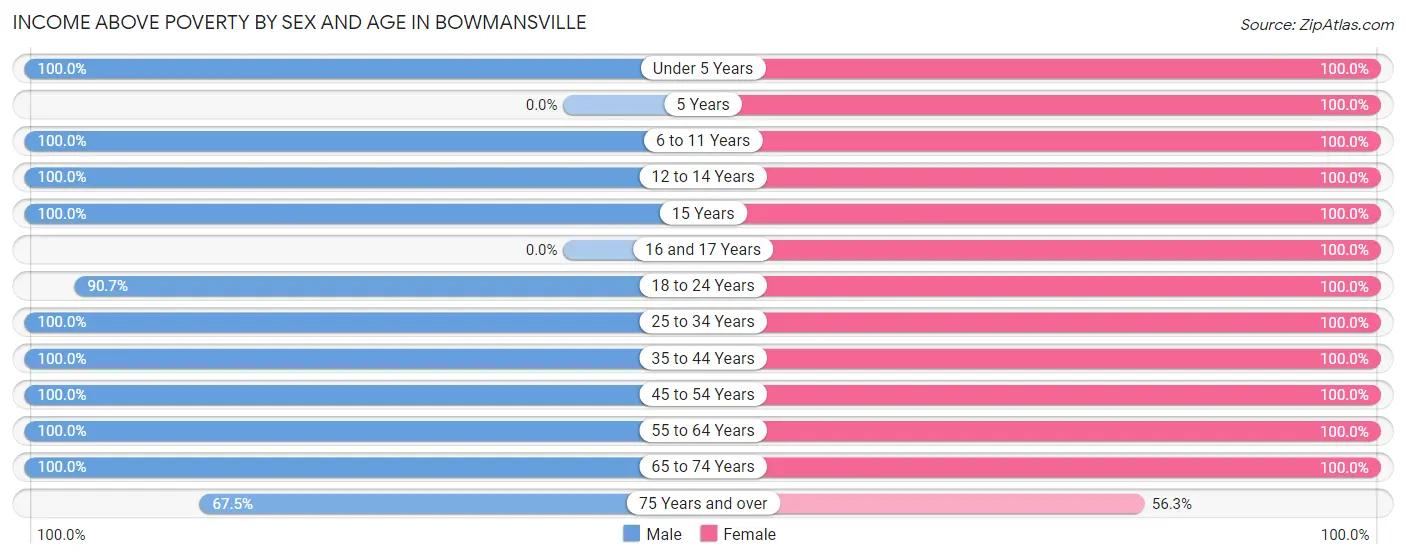
Income Above Poverty by Sex and Age in Bowmansville
According to the poverty statistics in Bowmansville, males aged under 5 years and females aged under 5 years are the age groups that are most secure financially, with 100.0% of males and 100.0% of females in these age groups living above the poverty line.
| Age Bracket | Male | Female |
| Under 5 Years | 102 (100.0%) | 92 (100.0%) |
| 5 Years | 0 (0.0%) | 30 (100.0%) |
| 6 to 11 Years | 117 (100.0%) | 152 (100.0%) |
| 12 to 14 Years | 51 (100.0%) | 17 (100.0%) |
| 15 Years | 23 (100.0%) | 47 (100.0%) |
| 16 and 17 Years | 0 (0.0%) | 46 (100.0%) |
| 18 to 24 Years | 215 (90.7%) | 204 (100.0%) |
| 25 to 34 Years | 210 (100.0%) | 157 (100.0%) |
| 35 to 44 Years | 144 (100.0%) | 221 (100.0%) |
| 45 to 54 Years | 210 (100.0%) | 127 (100.0%) |
| 55 to 64 Years | 250 (100.0%) | 268 (100.0%) |
| 65 to 74 Years | 97 (100.0%) | 79 (100.0%) |
| 75 Years and over | 27 (67.5%) | 18 (56.2%) |
| Total | 1,446 (96.9%) | 1,458 (99.1%) |
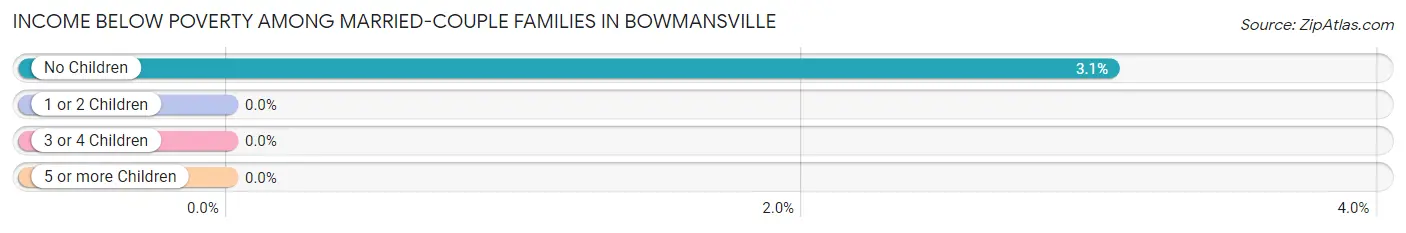
Income Below Poverty Among Married-Couple Families in Bowmansville
The poverty statistics for married-couple families in Bowmansville show that 1.9% or 13 of the total 693 families live below the poverty line. Families with no children have the highest poverty rate of 3.1%, comprising of 13 families. On the other hand, families with 1 or 2 children have the lowest poverty rate of 0.0%, which includes 0 families.
| Children | Above Poverty | Below Poverty |
| No Children | 411 (96.9%) | 13 (3.1%) |
| 1 or 2 Children | 238 (100.0%) | 0 (0.0%) |
| 3 or 4 Children | 15 (100.0%) | 0 (0.0%) |
| 5 or more Children | 16 (100.0%) | 0 (0.0%) |
| Total | 680 (98.1%) | 13 (1.9%) |
Income Below Poverty Among Single-Parent Households in Bowmansville
| Children | Single Father | Single Mother |
| No Children | 0 (0.0%) | 0 (0.0%) |
| 1 or 2 Children | 0 (0.0%) | 0 (0.0%) |
| 3 or 4 Children | 0 (0.0%) | 0 (0.0%) |
| 5 or more Children | 0 (0.0%) | 0 (0.0%) |
| Total | 0 (0.0%) | 0 (0.0%) |
Income Below Poverty Among Married-Couple vs Single-Parent Households in Bowmansville
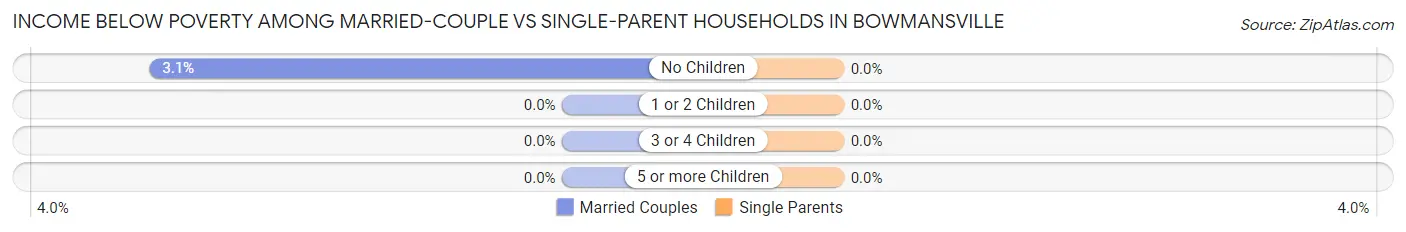
| Children | Married-Couple Families | Single-Parent Households |
| No Children | 13 (3.1%) | 0 (0.0%) |
| 1 or 2 Children | 0 (0.0%) | 0 (0.0%) |
| 3 or 4 Children | 0 (0.0%) | 0 (0.0%) |
| 5 or more Children | 0 (0.0%) | 0 (0.0%) |
| Total | 13 (1.9%) | 0 (0.0%) |
Race in Bowmansville
The most populous races in Bowmansville are White / Caucasian (2,964 | 100.0%), Hispanic or Latino (54 | 1.8%), and Two or more Races (1 | 0.0%).
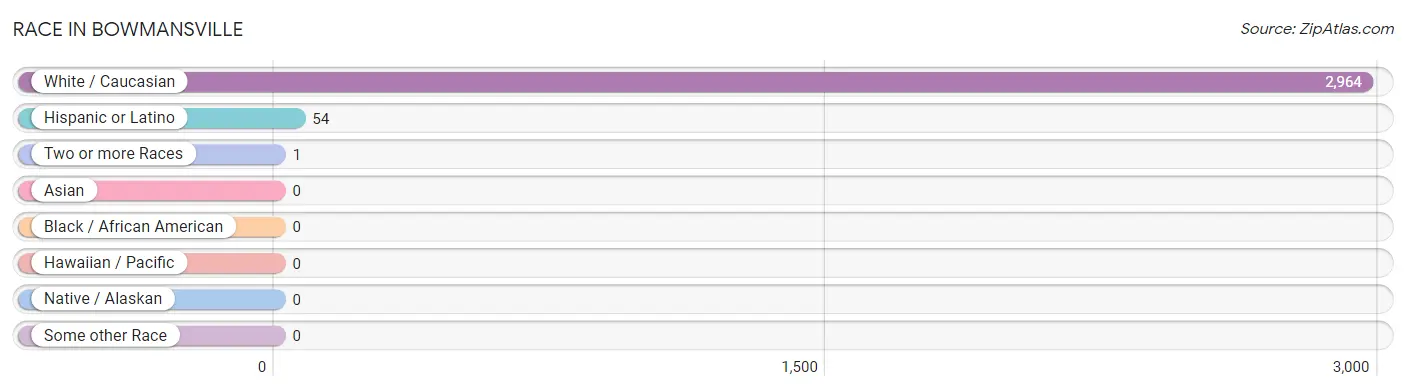
| Race | # Population | % Population |
| Asian | 0 | 0.0% |
| Black / African American | 0 | 0.0% |
| Hawaiian / Pacific | 0 | 0.0% |
| Hispanic or Latino | 54 | 1.8% |
| Native / Alaskan | 0 | 0.0% |
| White / Caucasian | 2,964 | 100.0% |
| Two or more Races | 1 | 0.0% |
| Some other Race | 0 | 0.0% |
| Total | 2,965 | 100.0% |
Ancestry in Bowmansville
The most populous ancestries reported in Bowmansville are German (827 | 27.9%), Italian (398 | 13.4%), English (359 | 12.1%), American (290 | 9.8%), and Irish (226 | 7.6%), together accounting for 70.8% of all Bowmansville residents.
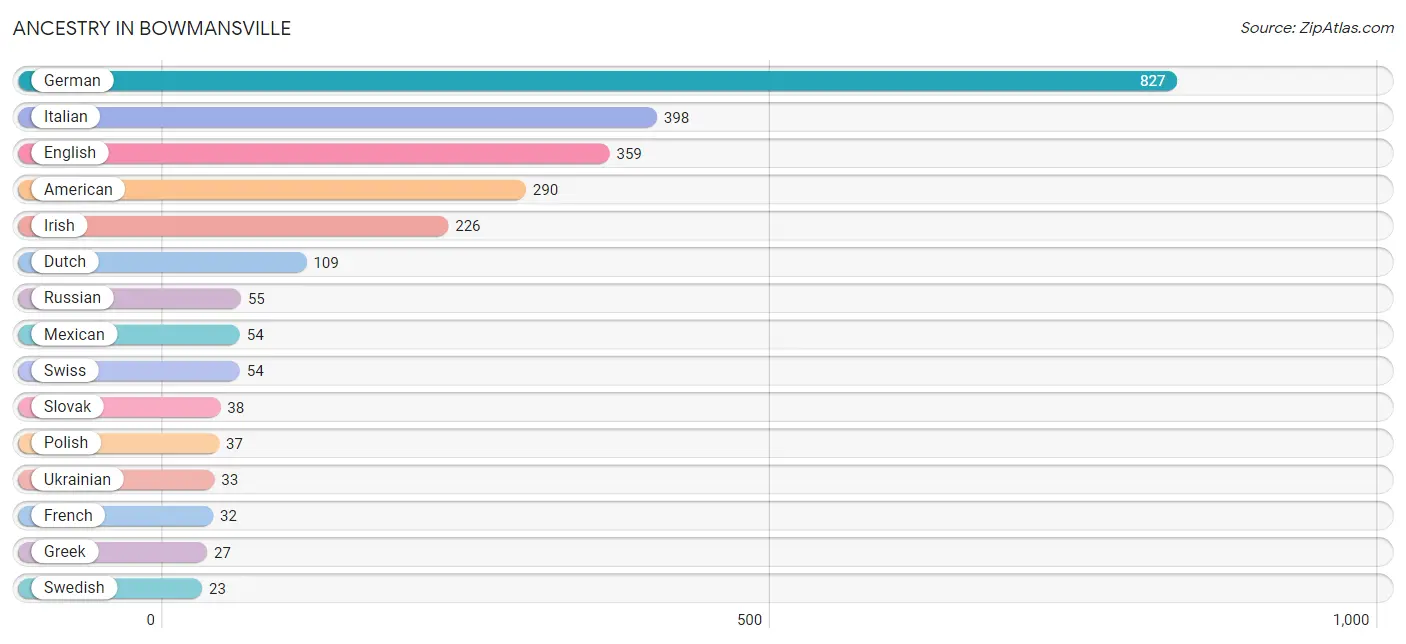
| Ancestry | # Population | % Population |
| American | 290 | 9.8% |
| Danish | 16 | 0.5% |
| Dutch | 109 | 3.7% |
| English | 359 | 12.1% |
| French | 32 | 1.1% |
| German | 827 | 27.9% |
| Greek | 27 | 0.9% |
| Irish | 226 | 7.6% |
| Italian | 398 | 13.4% |
| Mexican | 54 | 1.8% |
| Norwegian | 20 | 0.7% |
| Polish | 37 | 1.3% |
| Russian | 55 | 1.8% |
| Scotch-Irish | 16 | 0.5% |
| Scottish | 10 | 0.3% |
| Slovak | 38 | 1.3% |
| Swedish | 23 | 0.8% |
| Swiss | 54 | 1.8% |
| Ukrainian | 33 | 1.1% |
| Welsh | 8 | 0.3% | View All 20 Rows |
Immigrants in Bowmansville
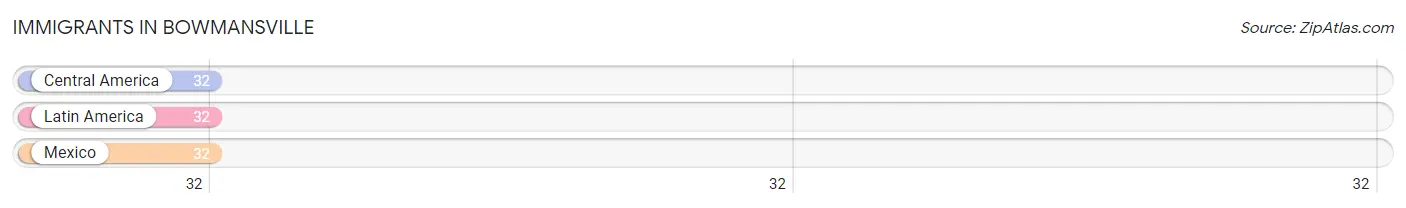
The most numerous immigrant groups reported in Bowmansville came from Central America (32 | 1.1%), Latin America (32 | 1.1%), and Mexico (32 | 1.1%), together accounting for 3.2% of all Bowmansville residents.
| Immigration Origin | # Population | % Population |
| Central America | 32 | 1.1% |
| Latin America | 32 | 1.1% |
| Mexico | 32 | 1.1% | View All 3 Rows |
Sex and Age in Bowmansville
Sex and Age in Bowmansville
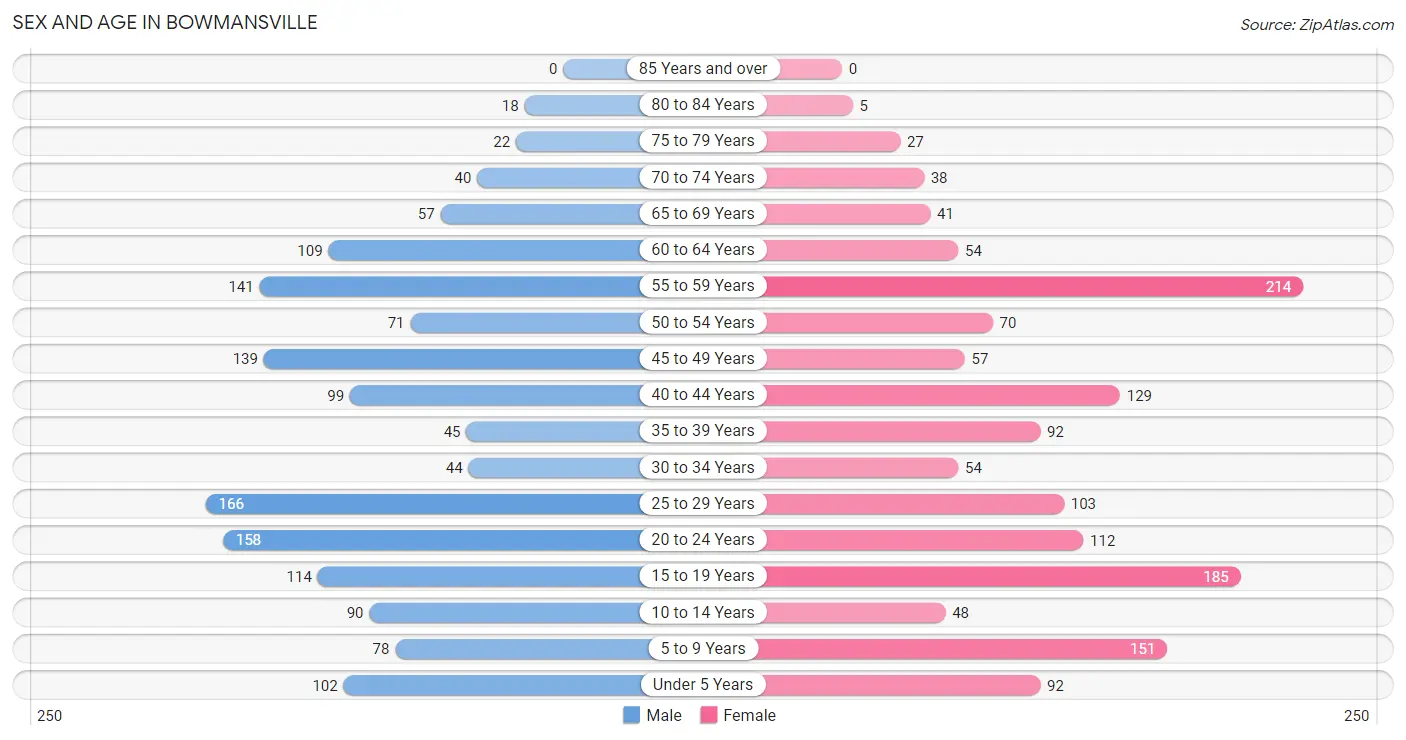
The most populous age groups in Bowmansville are 25 to 29 Years (166 | 11.1%) for men and 55 to 59 Years (214 | 14.5%) for women.
| Age Bracket | Male | Female |
| Under 5 Years | 102 (6.8%) | 92 (6.2%) |
| 5 to 9 Years | 78 (5.2%) | 151 (10.3%) |
| 10 to 14 Years | 90 (6.0%) | 48 (3.3%) |
| 15 to 19 Years | 114 (7.6%) | 185 (12.6%) |
| 20 to 24 Years | 158 (10.6%) | 112 (7.6%) |
| 25 to 29 Years | 166 (11.1%) | 103 (7.0%) |
| 30 to 34 Years | 44 (2.9%) | 54 (3.7%) |
| 35 to 39 Years | 45 (3.0%) | 92 (6.2%) |
| 40 to 44 Years | 99 (6.6%) | 129 (8.8%) |
| 45 to 49 Years | 139 (9.3%) | 57 (3.9%) |
| 50 to 54 Years | 71 (4.8%) | 70 (4.8%) |
| 55 to 59 Years | 141 (9.4%) | 214 (14.5%) |
| 60 to 64 Years | 109 (7.3%) | 54 (3.7%) |
| 65 to 69 Years | 57 (3.8%) | 41 (2.8%) |
| 70 to 74 Years | 40 (2.7%) | 38 (2.6%) |
| 75 to 79 Years | 22 (1.5%) | 27 (1.8%) |
| 80 to 84 Years | 18 (1.2%) | 5 (0.3%) |
| 85 Years and over | 0 (0.0%) | 0 (0.0%) |
| Total | 1,493 (100.0%) | 1,472 (100.0%) |
Families and Households in Bowmansville
Median Family Size in Bowmansville
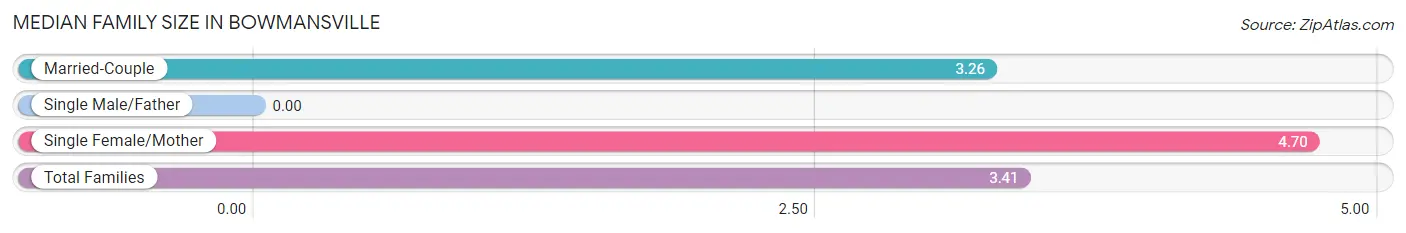
| Family Type | # Families | Family Size |
| Married-Couple | 693 (89.6%) | 3.26 |
| Single Male/Father | 0 (0.0%) | - |
| Single Female/Mother | 80 (10.3%) | 4.70 |
| Total Families | 773 (100.0%) | 3.41 |
Median Household Size in Bowmansville
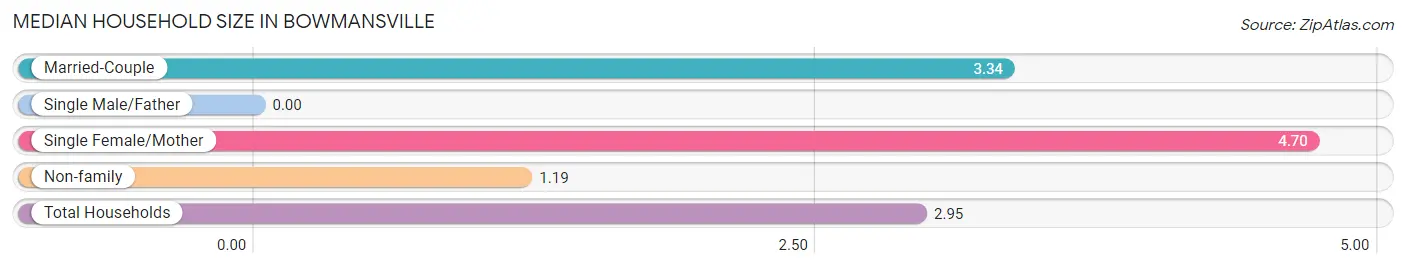
| Household Type | # Households | Household Size |
| Married-Couple | 693 (69.0%) | 3.34 |
| Single Male/Father | 0 (0.0%) | - |
| Single Female/Mother | 80 (8.0%) | 4.70 |
| Non-family | 231 (23.0%) | 1.19 |
| Total Households | 1,004 (100.0%) | 2.95 |
Household Size by Marriage Status in Bowmansville
Out of a total of 1,004 households in Bowmansville, 773 (77.0%) are family households, while 231 (23.0%) are nonfamily households. The most numerous type of family households are 2-person households, comprising 265, and the most common type of nonfamily households are 1-person households, comprising 188.
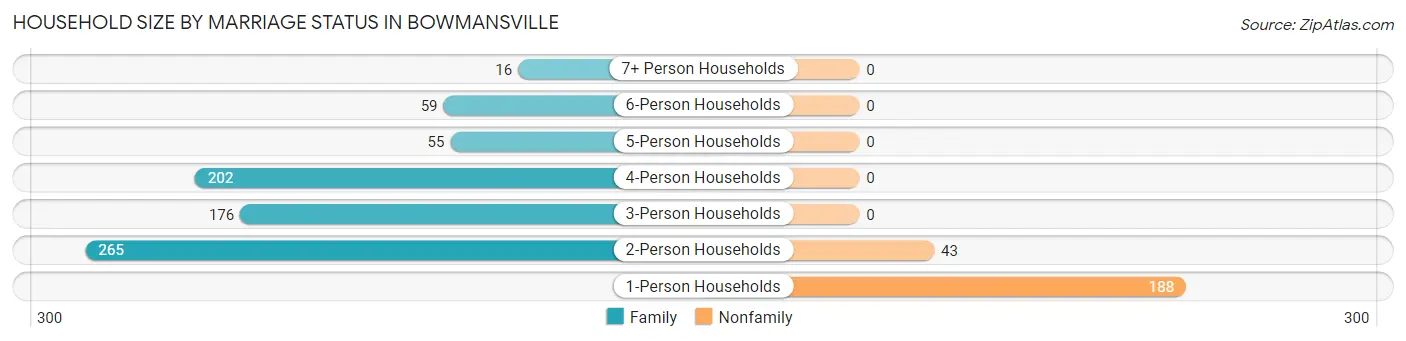
| Household Size | Family Households | Nonfamily Households |
| 1-Person Households | - | 188 (18.7%) |
| 2-Person Households | 265 (26.4%) | 43 (4.3%) |
| 3-Person Households | 176 (17.5%) | 0 (0.0%) |
| 4-Person Households | 202 (20.1%) | 0 (0.0%) |
| 5-Person Households | 55 (5.5%) | 0 (0.0%) |
| 6-Person Households | 59 (5.9%) | 0 (0.0%) |
| 7+ Person Households | 16 (1.6%) | 0 (0.0%) |
| Total | 773 (77.0%) | 231 (23.0%) |
Female Fertility in Bowmansville
Fertility by Age in Bowmansville
Average fertility rate in Bowmansville is 123.0 births per 1,000 women. Women in the age bracket of 20 to 34 years have the highest fertility rate with 335.0 births per 1,000 women. Women in the age bracket of 20 to 34 years acount for 100.0% of all women with births.
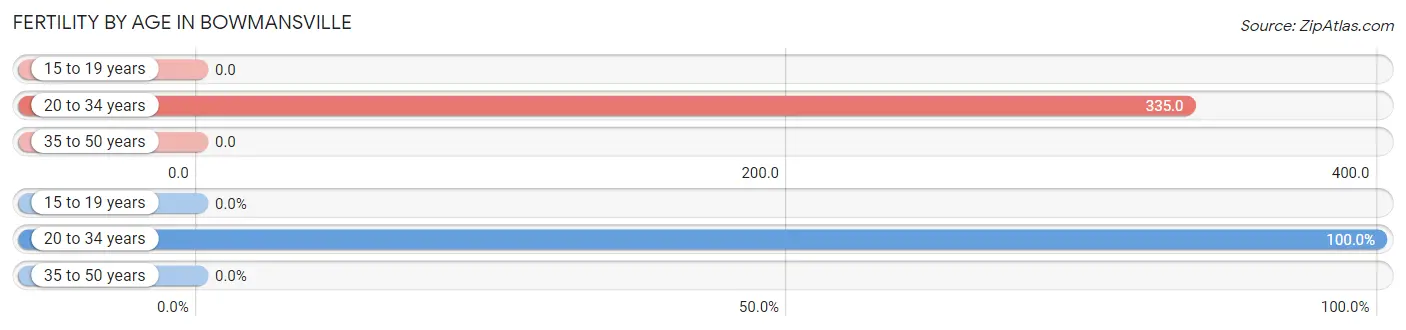
| Age Bracket | Women with Births | Births / 1,000 Women |
| 15 to 19 years | 0 (0.0%) | 0.0 |
| 20 to 34 years | 90 (100.0%) | 335.0 |
| 35 to 50 years | 0 (0.0%) | 0.0 |
| Total | 90 (100.0%) | 123.0 |
Fertility by Age by Marriage Status in Bowmansville
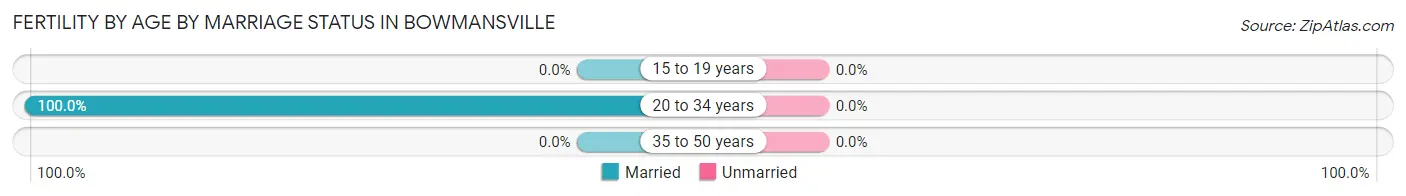
| Age Bracket | Married | Unmarried |
| 15 to 19 years | 0 (0.0%) | 0 (0.0%) |
| 20 to 34 years | 90 (100.0%) | 0 (0.0%) |
| 35 to 50 years | 0 (0.0%) | 0 (0.0%) |
| Total | 90 (100.0%) | 0 (0.0%) |
Fertility by Education in Bowmansville
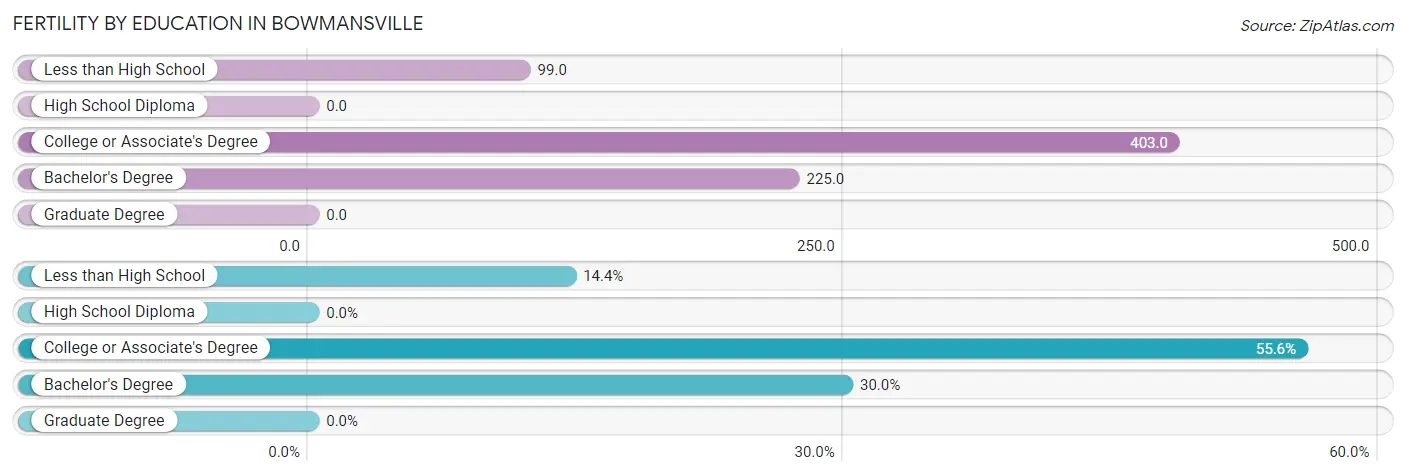
| Educational Attainment | Women with Births | Births / 1,000 Women |
| Less than High School | 13 (14.4%) | 99.0 |
| High School Diploma | 0 (0.0%) | 0.0 |
| College or Associate's Degree | 50 (55.6%) | 403.0 |
| Bachelor's Degree | 27 (30.0%) | 225.0 |
| Graduate Degree | 0 (0.0%) | 0.0 |
| Total | 90 (100.0%) | 123.0 |
Fertility by Education by Marriage Status in Bowmansville
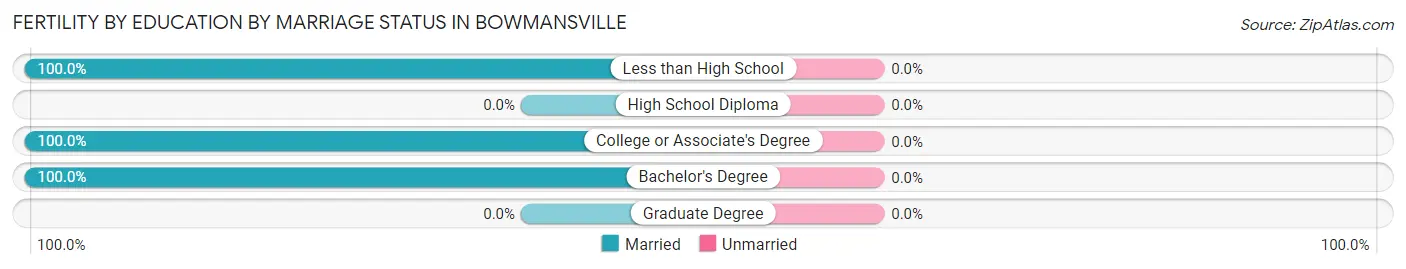
| Educational Attainment | Married | Unmarried |
| Less than High School | 13 (100.0%) | 0 (0.0%) |
| High School Diploma | 0 (0.0%) | 0 (0.0%) |
| College or Associate's Degree | 50 (100.0%) | 0 (0.0%) |
| Bachelor's Degree | 27 (100.0%) | 0 (0.0%) |
| Graduate Degree | 0 (0.0%) | 0 (0.0%) |
| Total | 90 (100.0%) | 0 (0.0%) |
Employment Characteristics in Bowmansville
Employment by Class of Employer in Bowmansville
Among the 1,831 employed individuals in Bowmansville, private company employees (1,403 | 76.6%), not-for-profit organizations (136 | 7.4%), and local government employees (95 | 5.2%) make up the most common classes of employment.
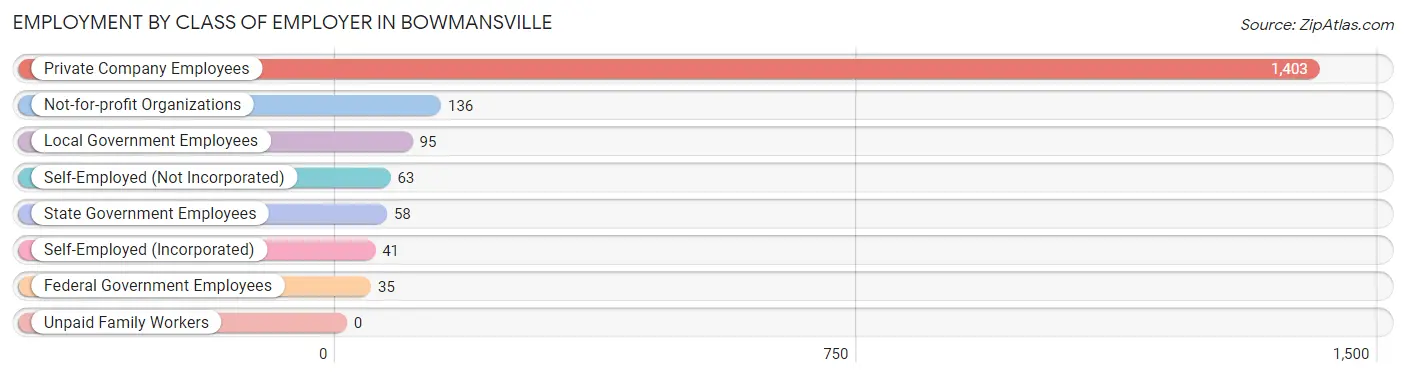
| Employer Class | # Employees | % Employees |
| Private Company Employees | 1,403 | 76.6% |
| Self-Employed (Incorporated) | 41 | 2.2% |
| Self-Employed (Not Incorporated) | 63 | 3.4% |
| Not-for-profit Organizations | 136 | 7.4% |
| Local Government Employees | 95 | 5.2% |
| State Government Employees | 58 | 3.2% |
| Federal Government Employees | 35 | 1.9% |
| Unpaid Family Workers | 0 | 0.0% |
| Total | 1,831 | 100.0% |
Employment Status by Age in Bowmansville
According to the labor force statistics for Bowmansville, out of the total population over 16 years of age (2,334), 85.7% or 2,000 individuals are in the labor force, with 4.0% or 80 of them unemployed. The age group with the highest labor force participation rate is 16 to 19 years, with 100.0% or 229 individuals in the labor force. Within the labor force, the 16 to 19 years age range has the highest percentage of unemployed individuals, with 29.7% or 68 of them being unemployed.
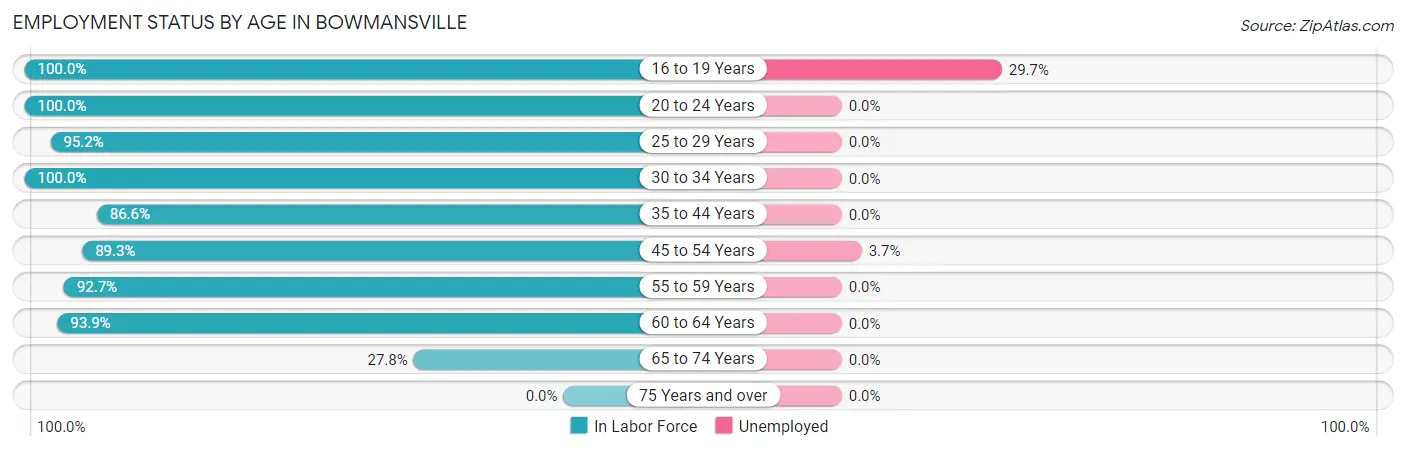
| Age Bracket | In Labor Force | Unemployed |
| 16 to 19 Years | 229 (100.0%) | 68 (29.7%) |
| 20 to 24 Years | 270 (100.0%) | 0 (0.0%) |
| 25 to 29 Years | 256 (95.2%) | 0 (0.0%) |
| 30 to 34 Years | 98 (100.0%) | 0 (0.0%) |
| 35 to 44 Years | 316 (86.6%) | 0 (0.0%) |
| 45 to 54 Years | 301 (89.3%) | 11 (3.7%) |
| 55 to 59 Years | 329 (92.7%) | 0 (0.0%) |
| 60 to 64 Years | 153 (93.9%) | 0 (0.0%) |
| 65 to 74 Years | 49 (27.8%) | 0 (0.0%) |
| 75 Years and over | 0 (0.0%) | 0 (0.0%) |
| Total | 2,000 (85.7%) | 80 (4.0%) |
Employment Status by Educational Attainment in Bowmansville
According to labor force statistics for Bowmansville, 91.6% of individuals (1,454) out of the total population between 25 and 64 years of age (1,587) are in the labor force, with 0.8% or 12 of them being unemployed. The group with the highest labor force participation rate are those with the educational attainment of college / associate degree, with 97.5% or 354 individuals in the labor force. Within the labor force, individuals with college / associate degree education have the highest percentage of unemployment, with 3.3% or 12 of them being unemployed.
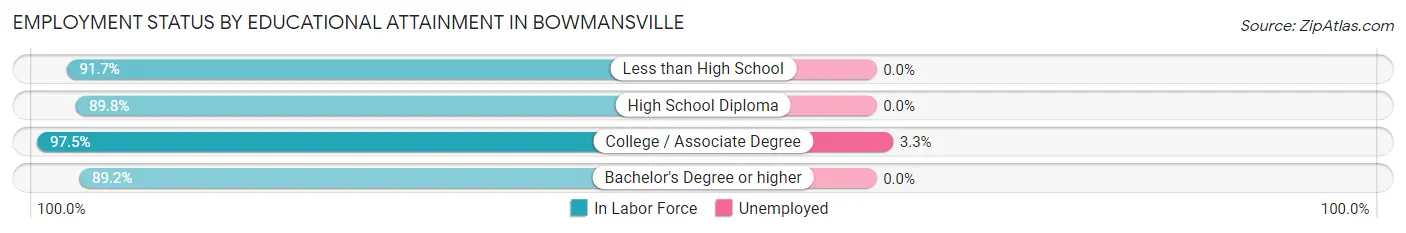
| Educational Attainment | In Labor Force | Unemployed |
| Less than High School | 143 (91.7%) | 0 (0.0%) |
| High School Diploma | 528 (89.8%) | 0 (0.0%) |
| College / Associate Degree | 354 (97.5%) | 12 (3.3%) |
| Bachelor's Degree or higher | 428 (89.2%) | 0 (0.0%) |
| Total | 1,454 (91.6%) | 13 (0.8%) |
Employment Occupations by Sex in Bowmansville
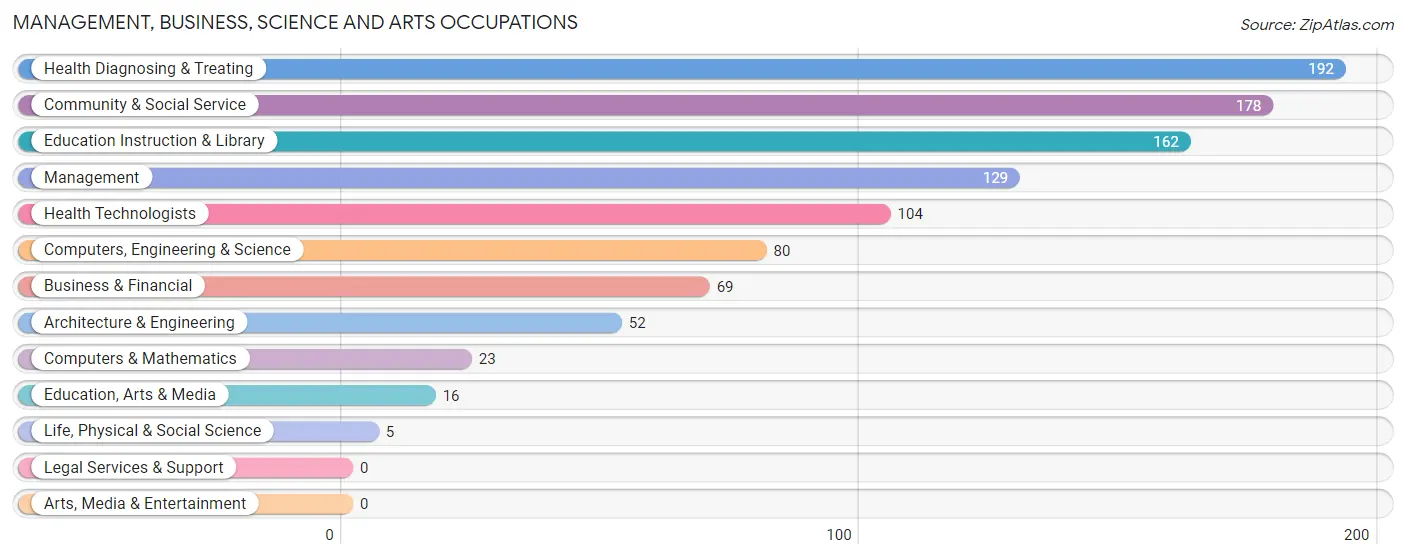
Management, Business, Science and Arts Occupations
The most common Management, Business, Science and Arts occupations in Bowmansville are Health Diagnosing & Treating (192 | 10.1%), Community & Social Service (178 | 9.4%), Education Instruction & Library (162 | 8.5%), Management (129 | 6.8%), and Health Technologists (104 | 5.5%).
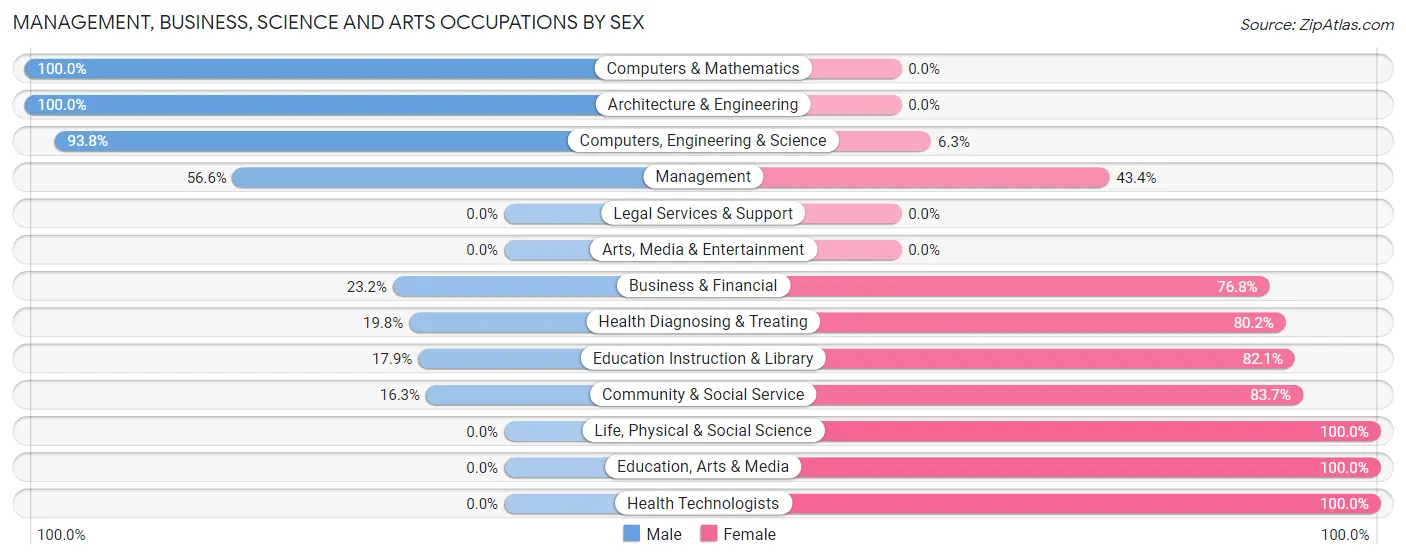
Management, Business, Science and Arts Occupations by Sex
Within the Management, Business, Science and Arts occupations in Bowmansville, the most male-oriented occupations are Computers & Mathematics (100.0%), Architecture & Engineering (100.0%), and Computers, Engineering & Science (93.8%), while the most female-oriented occupations are Life, Physical & Social Science (100.0%), Education, Arts & Media (100.0%), and Health Technologists (100.0%).
| Occupation | Male | Female |
| Management | 73 (56.6%) | 56 (43.4%) |
| Business & Financial | 16 (23.2%) | 53 (76.8%) |
| Computers, Engineering & Science | 75 (93.8%) | 5 (6.2%) |
| Computers & Mathematics | 23 (100.0%) | 0 (0.0%) |
| Architecture & Engineering | 52 (100.0%) | 0 (0.0%) |
| Life, Physical & Social Science | 0 (0.0%) | 5 (100.0%) |
| Community & Social Service | 29 (16.3%) | 149 (83.7%) |
| Education, Arts & Media | 0 (0.0%) | 16 (100.0%) |
| Legal Services & Support | 0 (0.0%) | 0 (0.0%) |
| Education Instruction & Library | 29 (17.9%) | 133 (82.1%) |
| Arts, Media & Entertainment | 0 (0.0%) | 0 (0.0%) |
| Health Diagnosing & Treating | 38 (19.8%) | 154 (80.2%) |
| Health Technologists | 0 (0.0%) | 104 (100.0%) |
| Total (Category) | 231 (35.6%) | 417 (64.3%) |
| Total (Overall) | 1,031 (54.2%) | 871 (45.8%) |
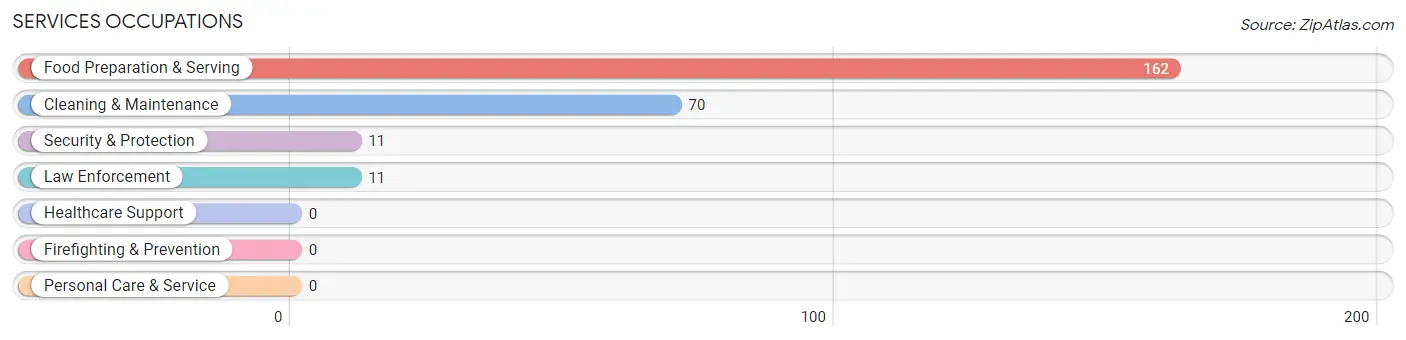
Services Occupations
The most common Services occupations in Bowmansville are Food Preparation & Serving (162 | 8.5%), Cleaning & Maintenance (70 | 3.7%), Security & Protection (11 | 0.6%), and Law Enforcement (11 | 0.6%).
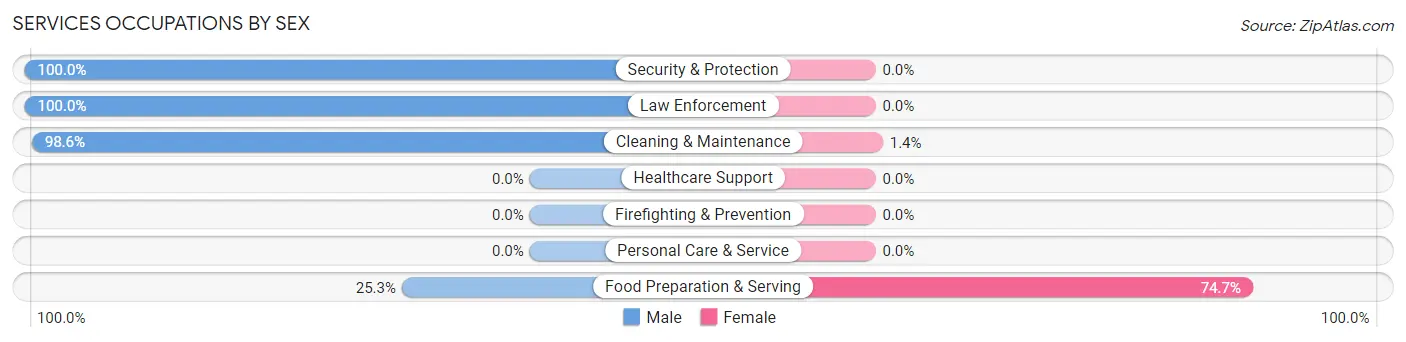
Services Occupations by Sex
Within the Services occupations in Bowmansville, the most male-oriented occupations are Security & Protection (100.0%), Law Enforcement (100.0%), and Cleaning & Maintenance (98.6%), while the most female-oriented occupations are Food Preparation & Serving (74.7%), and Cleaning & Maintenance (1.4%).
| Occupation | Male | Female |
| Healthcare Support | 0 (0.0%) | 0 (0.0%) |
| Security & Protection | 11 (100.0%) | 0 (0.0%) |
| Firefighting & Prevention | 0 (0.0%) | 0 (0.0%) |
| Law Enforcement | 11 (100.0%) | 0 (0.0%) |
| Food Preparation & Serving | 41 (25.3%) | 121 (74.7%) |
| Cleaning & Maintenance | 69 (98.6%) | 1 (1.4%) |
| Personal Care & Service | 0 (0.0%) | 0 (0.0%) |
| Total (Category) | 121 (49.8%) | 122 (50.2%) |
| Total (Overall) | 1,031 (54.2%) | 871 (45.8%) |
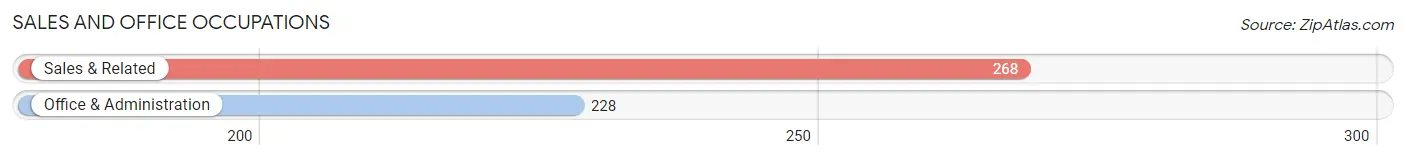
Sales and Office Occupations
The most common Sales and Office occupations in Bowmansville are Sales & Related (268 | 14.1%), and Office & Administration (228 | 12.0%).
Sales and Office Occupations by Sex
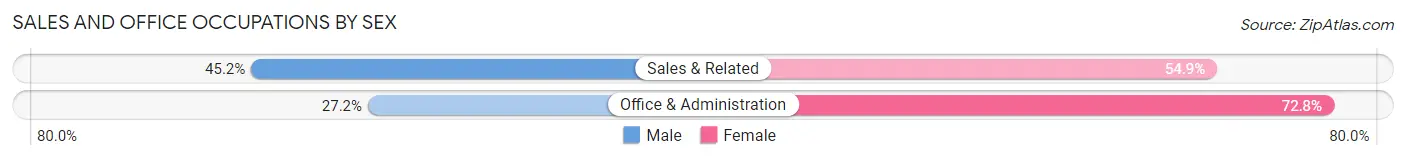
| Occupation | Male | Female |
| Sales & Related | 121 (45.2%) | 147 (54.8%) |
| Office & Administration | 62 (27.2%) | 166 (72.8%) |
| Total (Category) | 183 (36.9%) | 313 (63.1%) |
| Total (Overall) | 1,031 (54.2%) | 871 (45.8%) |
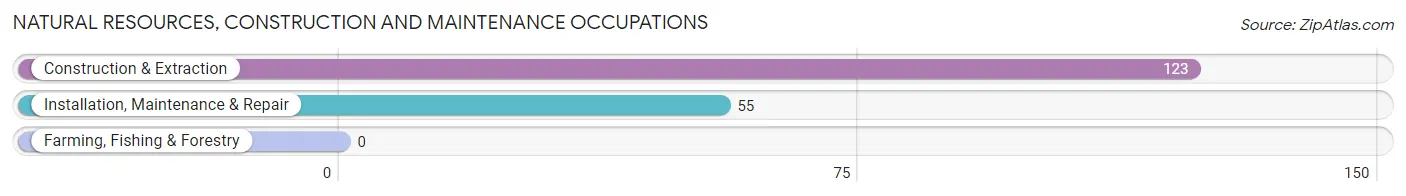
Natural Resources, Construction and Maintenance Occupations
The most common Natural Resources, Construction and Maintenance occupations in Bowmansville are Construction & Extraction (123 | 6.5%), and Installation, Maintenance & Repair (55 | 2.9%).
Natural Resources, Construction and Maintenance Occupations by Sex
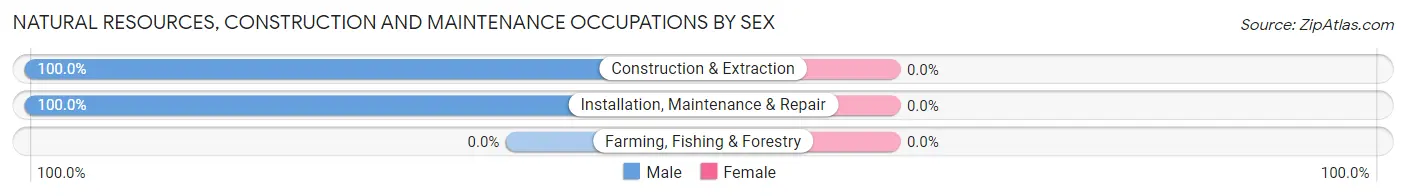
| Occupation | Male | Female |
| Farming, Fishing & Forestry | 0 (0.0%) | 0 (0.0%) |
| Construction & Extraction | 123 (100.0%) | 0 (0.0%) |
| Installation, Maintenance & Repair | 55 (100.0%) | 0 (0.0%) |
| Total (Category) | 178 (100.0%) | 0 (0.0%) |
| Total (Overall) | 1,031 (54.2%) | 871 (45.8%) |
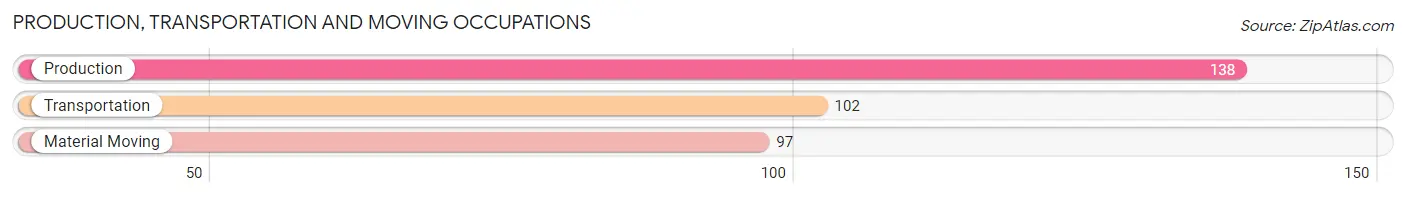
Production, Transportation and Moving Occupations
The most common Production, Transportation and Moving occupations in Bowmansville are Production (138 | 7.3%), Transportation (102 | 5.4%), and Material Moving (97 | 5.1%).
Production, Transportation and Moving Occupations by Sex
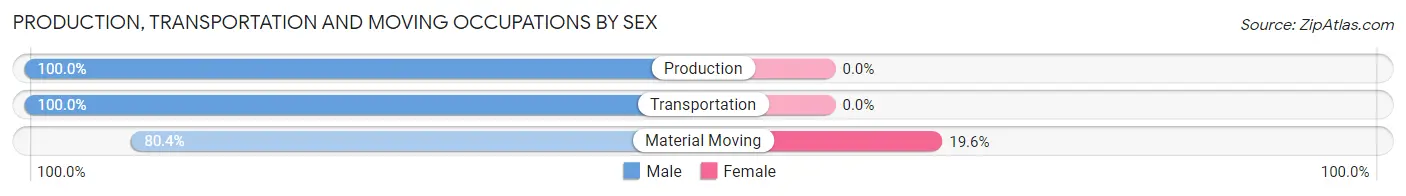
| Occupation | Male | Female |
| Production | 138 (100.0%) | 0 (0.0%) |
| Transportation | 102 (100.0%) | 0 (0.0%) |
| Material Moving | 78 (80.4%) | 19 (19.6%) |
| Total (Category) | 318 (94.4%) | 19 (5.6%) |
| Total (Overall) | 1,031 (54.2%) | 871 (45.8%) |
Employment Industries by Sex in Bowmansville
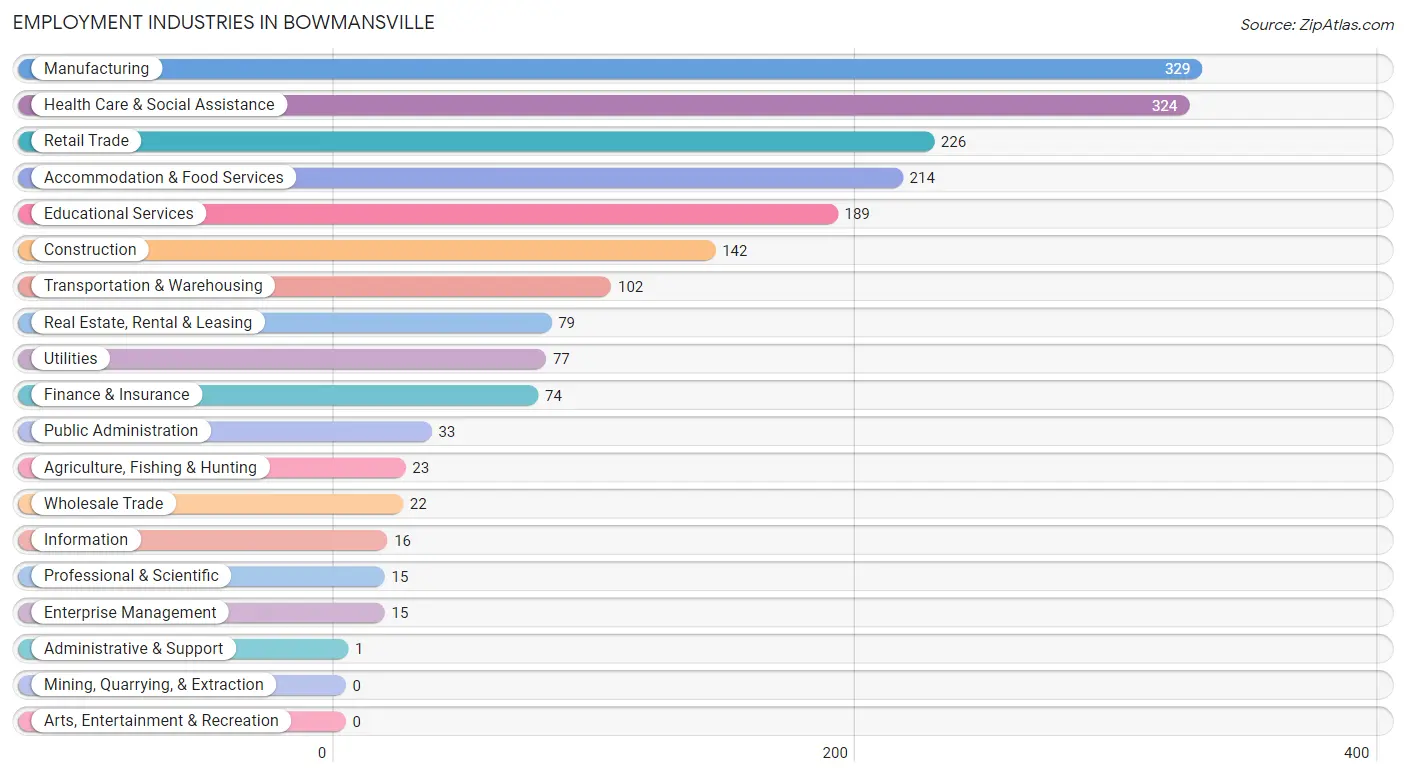
Employment Industries in Bowmansville
The major employment industries in Bowmansville include Manufacturing (329 | 17.3%), Health Care & Social Assistance (324 | 17.0%), Retail Trade (226 | 11.9%), Accommodation & Food Services (214 | 11.3%), and Educational Services (189 | 9.9%).
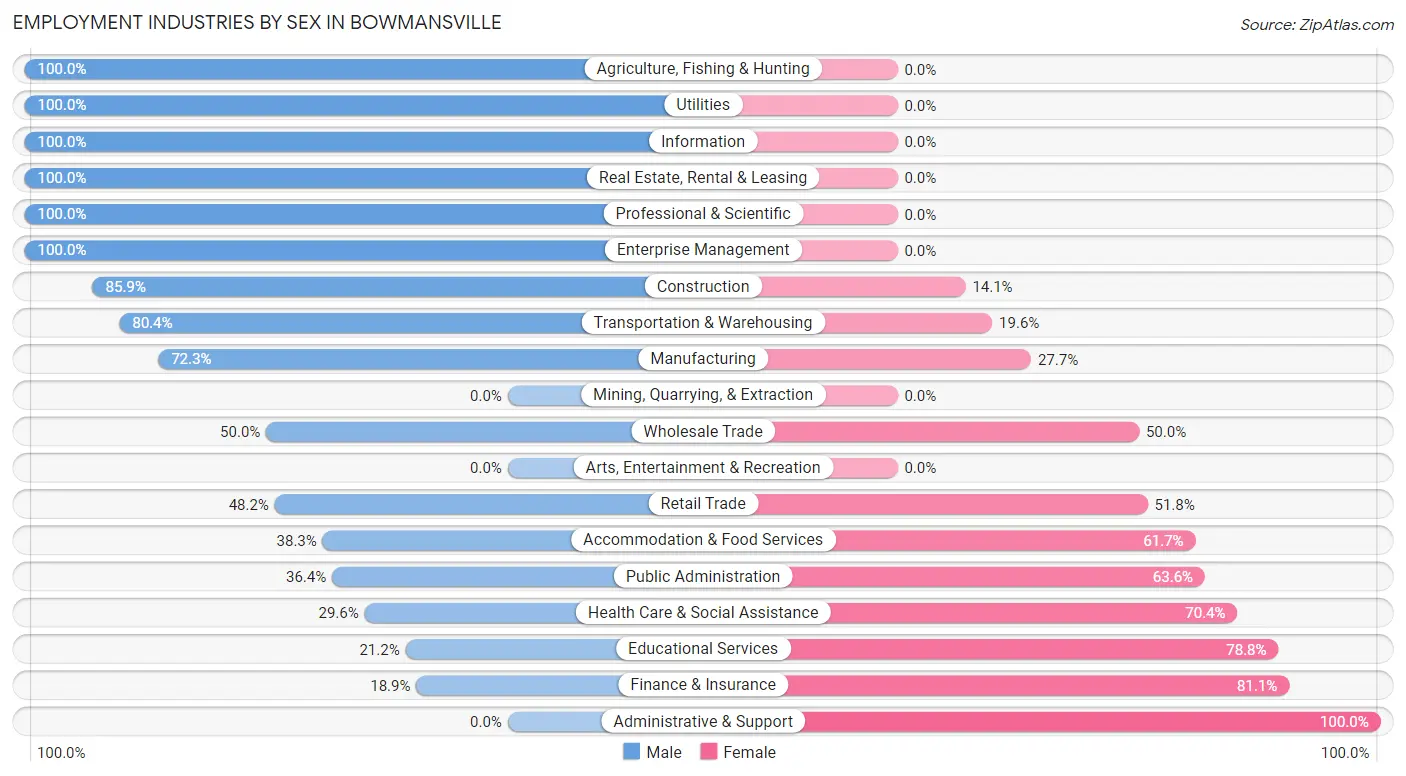
Employment Industries by Sex in Bowmansville
The Bowmansville industries that see more men than women are Agriculture, Fishing & Hunting (100.0%), Utilities (100.0%), and Information (100.0%), whereas the industries that tend to have a higher number of women are Administrative & Support (100.0%), Finance & Insurance (81.1%), and Educational Services (78.8%).
| Industry | Male | Female |
| Agriculture, Fishing & Hunting | 23 (100.0%) | 0 (0.0%) |
| Mining, Quarrying, & Extraction | 0 (0.0%) | 0 (0.0%) |
| Construction | 122 (85.9%) | 20 (14.1%) |
| Manufacturing | 238 (72.3%) | 91 (27.7%) |
| Wholesale Trade | 11 (50.0%) | 11 (50.0%) |
| Retail Trade | 109 (48.2%) | 117 (51.8%) |
| Transportation & Warehousing | 82 (80.4%) | 20 (19.6%) |
| Utilities | 77 (100.0%) | 0 (0.0%) |
| Information | 16 (100.0%) | 0 (0.0%) |
| Finance & Insurance | 14 (18.9%) | 60 (81.1%) |
| Real Estate, Rental & Leasing | 79 (100.0%) | 0 (0.0%) |
| Professional & Scientific | 15 (100.0%) | 0 (0.0%) |
| Enterprise Management | 15 (100.0%) | 0 (0.0%) |
| Administrative & Support | 0 (0.0%) | 1 (100.0%) |
| Educational Services | 40 (21.2%) | 149 (78.8%) |
| Health Care & Social Assistance | 96 (29.6%) | 228 (70.4%) |
| Arts, Entertainment & Recreation | 0 (0.0%) | 0 (0.0%) |
| Accommodation & Food Services | 82 (38.3%) | 132 (61.7%) |
| Public Administration | 12 (36.4%) | 21 (63.6%) |
| Total | 1,031 (54.2%) | 871 (45.8%) |
Education in Bowmansville
School Enrollment in Bowmansville
The most common levels of schooling among the 542 students in Bowmansville are elementary school (216 | 39.9%), high school (109 | 20.1%), and middle school (107 | 19.7%).
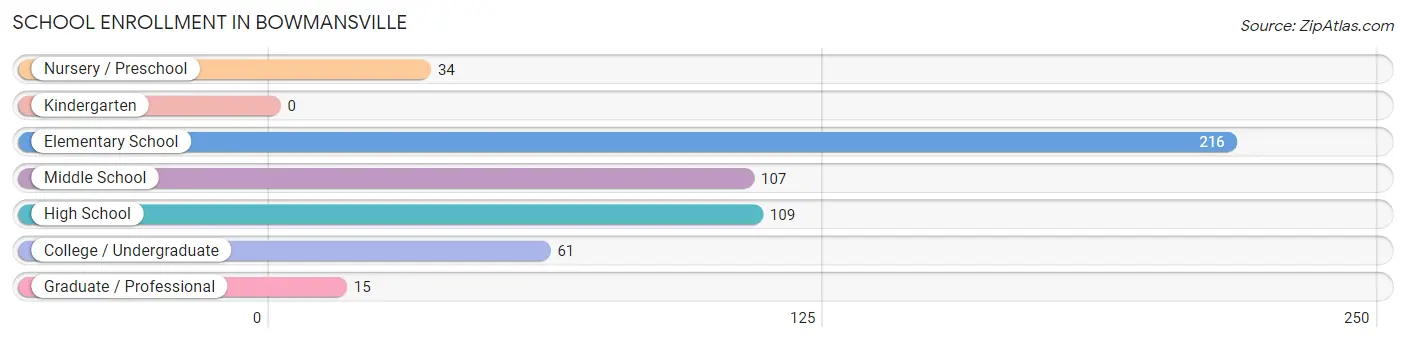
| School Level | # Students | % Students |
| Nursery / Preschool | 34 | 6.3% |
| Kindergarten | 0 | 0.0% |
| Elementary School | 216 | 39.9% |
| Middle School | 107 | 19.7% |
| High School | 109 | 20.1% |
| College / Undergraduate | 61 | 11.3% |
| Graduate / Professional | 15 | 2.8% |
| Total | 542 | 100.0% |
School Enrollment by Age by Funding Source in Bowmansville
Out of a total of 542 students who are enrolled in schools in Bowmansville, 152 (28.0%) attend a private institution, while the remaining 390 (72.0%) are enrolled in public schools. The age group of 3 to 4 year olds has the highest likelihood of being enrolled in private schools, with 34 (100.0% in the age bracket) enrolled. Conversely, the age group of 15 to 17 year olds has the lowest likelihood of being enrolled in a private school, with 109 (100.0% in the age bracket) attending a public institution.
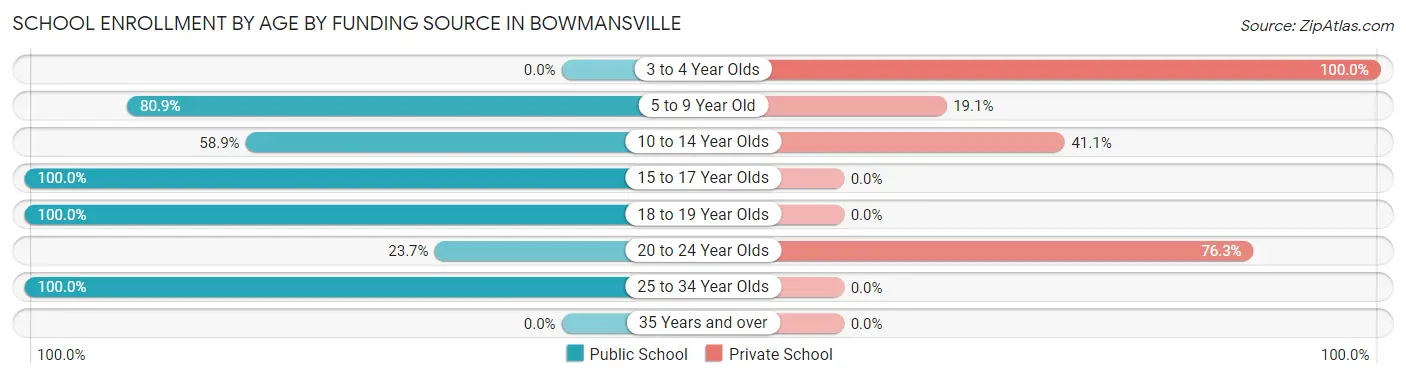
| Age Bracket | Public School | Private School |
| 3 to 4 Year Olds | 0 (0.0%) | 34 (100.0%) |
| 5 to 9 Year Old | 161 (80.9%) | 38 (19.1%) |
| 10 to 14 Year Olds | 73 (58.9%) | 51 (41.1%) |
| 15 to 17 Year Olds | 109 (100.0%) | 0 (0.0%) |
| 18 to 19 Year Olds | 18 (100.0%) | 0 (0.0%) |
| 20 to 24 Year Olds | 9 (23.7%) | 29 (76.3%) |
| 25 to 34 Year Olds | 20 (100.0%) | 0 (0.0%) |
| 35 Years and over | 0 (0.0%) | 0 (0.0%) |
| Total | 390 (72.0%) | 152 (28.0%) |
Educational Attainment by Field of Study in Bowmansville
Literature & languages (107 | 18.2%), business (73 | 12.4%), science & technology (72 | 12.2%), education (68 | 11.6%), and bio, nature & agricultural (67 | 11.4%) are the most common fields of study among 588 individuals in Bowmansville who have obtained a bachelor's degree or higher.
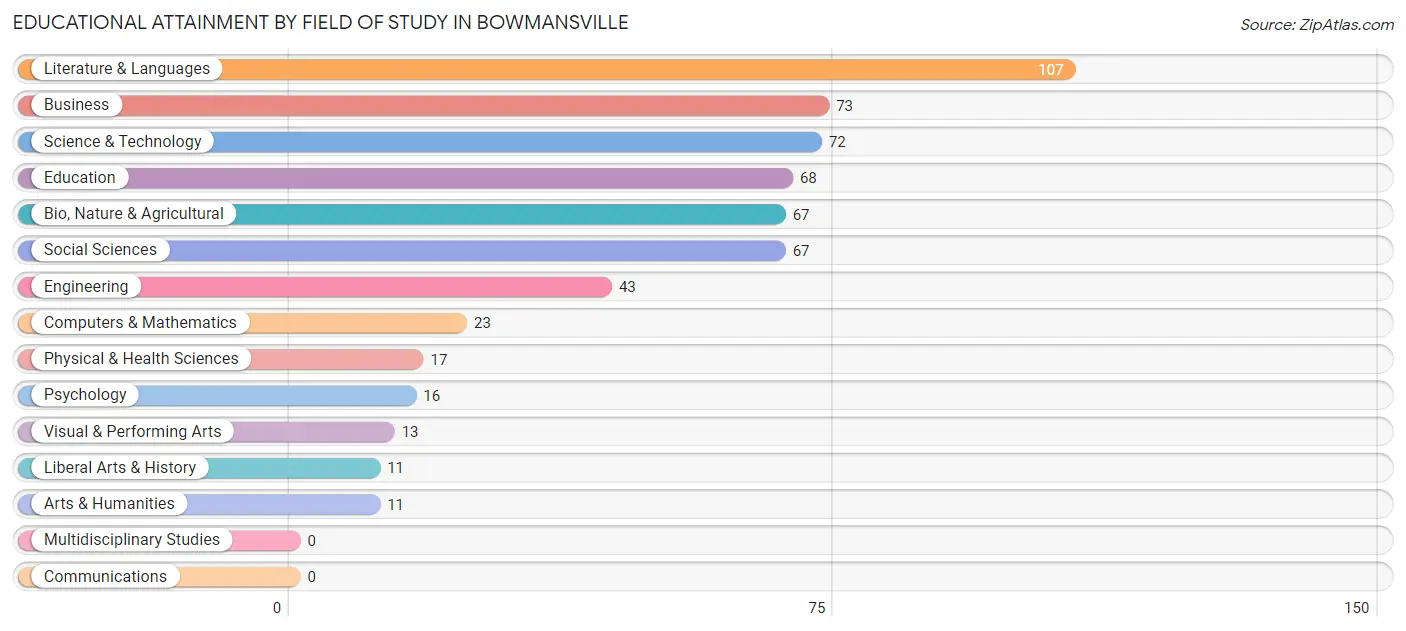
| Field of Study | # Graduates | % Graduates |
| Computers & Mathematics | 23 | 3.9% |
| Bio, Nature & Agricultural | 67 | 11.4% |
| Physical & Health Sciences | 17 | 2.9% |
| Psychology | 16 | 2.7% |
| Social Sciences | 67 | 11.4% |
| Engineering | 43 | 7.3% |
| Multidisciplinary Studies | 0 | 0.0% |
| Science & Technology | 72 | 12.2% |
| Business | 73 | 12.4% |
| Education | 68 | 11.6% |
| Literature & Languages | 107 | 18.2% |
| Liberal Arts & History | 11 | 1.9% |
| Visual & Performing Arts | 13 | 2.2% |
| Communications | 0 | 0.0% |
| Arts & Humanities | 11 | 1.9% |
| Total | 588 | 100.0% |
Transportation & Commute in Bowmansville
Vehicle Availability by Sex in Bowmansville
The most prevalent vehicle ownership categories in Bowmansville are males with 2 vehicles (332, accounting for 33.6%) and females with 2 vehicles (250, making up 39.3%).
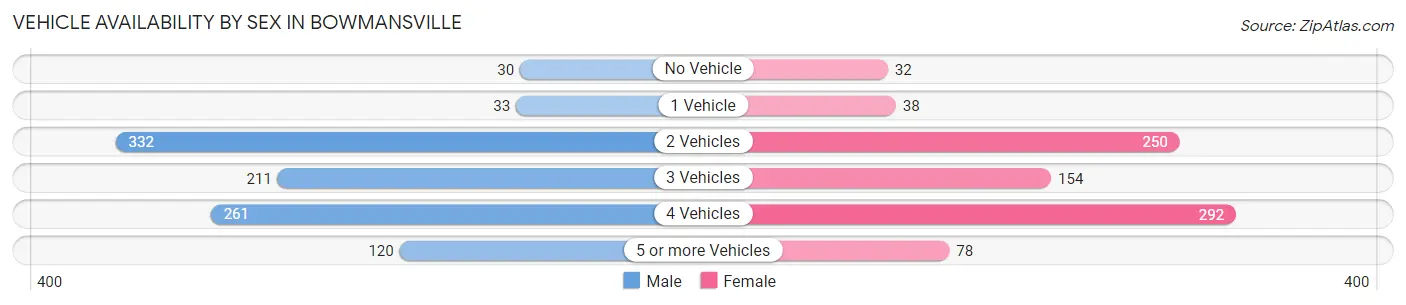
| Vehicles Available | Male | Female |
| No Vehicle | 30 (3.0%) | 32 (3.8%) |
| 1 Vehicle | 33 (3.3%) | 38 (4.5%) |
| 2 Vehicles | 332 (33.6%) | 250 (29.6%) |
| 3 Vehicles | 211 (21.4%) | 154 (18.2%) |
| 4 Vehicles | 261 (26.4%) | 292 (34.6%) |
| 5 or more Vehicles | 120 (12.2%) | 78 (9.2%) |
| Total | 987 (100.0%) | 844 (100.0%) |
Commute Time in Bowmansville
The most frequently occuring commute durations in Bowmansville are 20 to 24 minutes (434 commuters, 25.4%), 5 to 9 minutes (252 commuters, 14.7%), and 30 to 34 minutes (246 commuters, 14.4%).
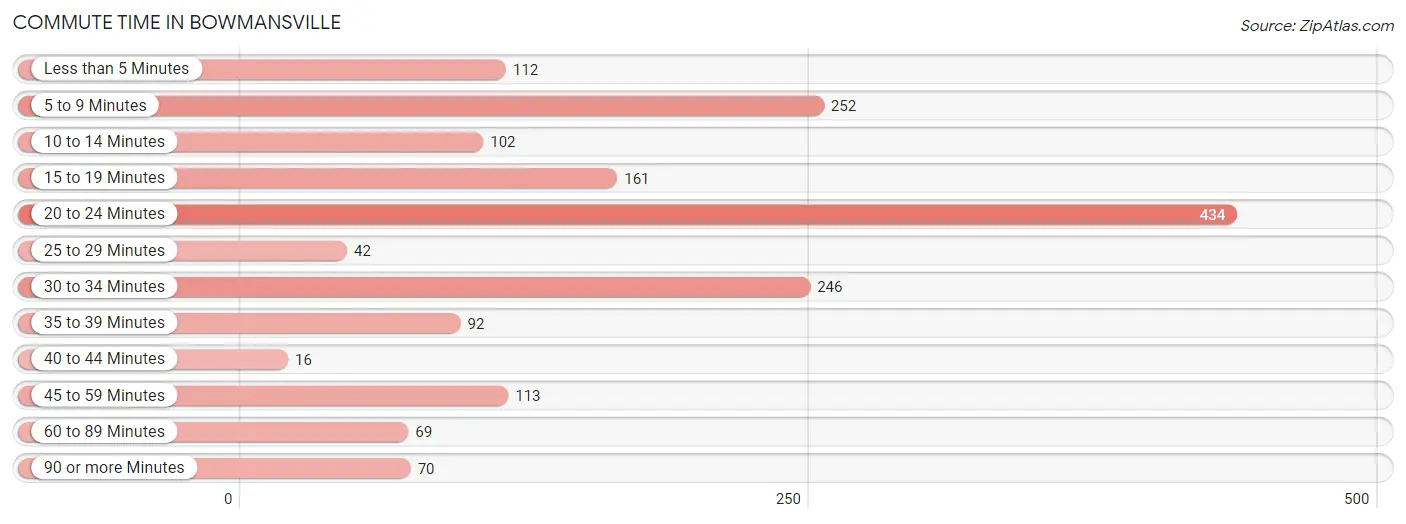
| Commute Time | # Commuters | % Commuters |
| Less than 5 Minutes | 112 | 6.6% |
| 5 to 9 Minutes | 252 | 14.7% |
| 10 to 14 Minutes | 102 | 6.0% |
| 15 to 19 Minutes | 161 | 9.4% |
| 20 to 24 Minutes | 434 | 25.4% |
| 25 to 29 Minutes | 42 | 2.5% |
| 30 to 34 Minutes | 246 | 14.4% |
| 35 to 39 Minutes | 92 | 5.4% |
| 40 to 44 Minutes | 16 | 0.9% |
| 45 to 59 Minutes | 113 | 6.6% |
| 60 to 89 Minutes | 69 | 4.0% |
| 90 or more Minutes | 70 | 4.1% |
Commute Time by Sex in Bowmansville
The most common commute times in Bowmansville are 20 to 24 minutes (268 commuters, 28.2%) for males and 20 to 24 minutes (166 commuters, 21.8%) for females.
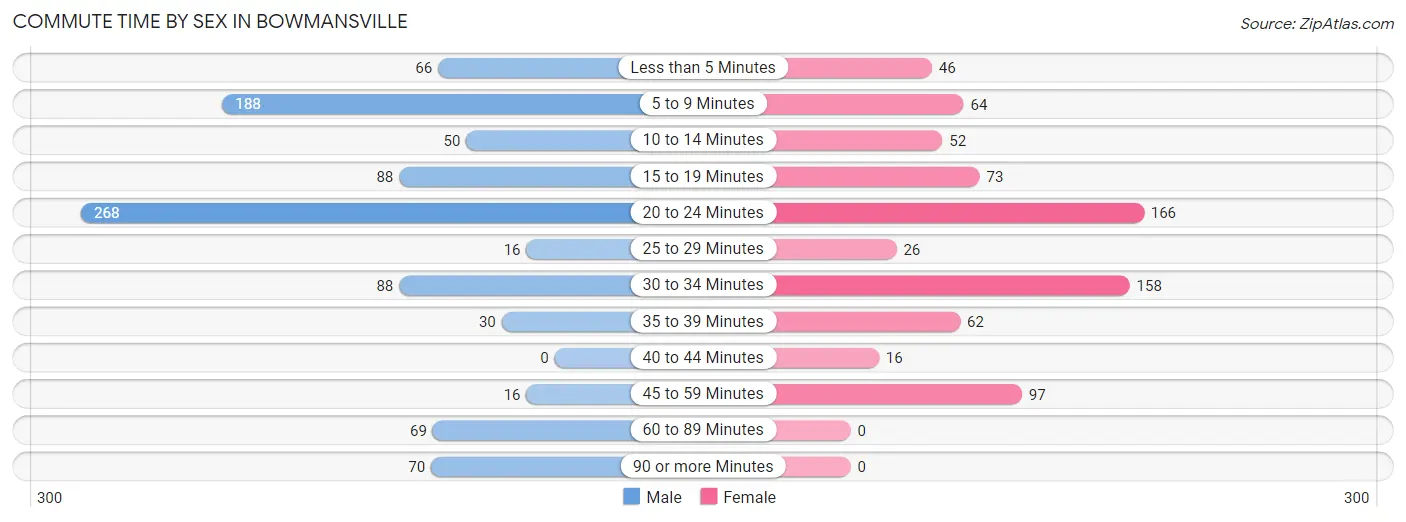
| Commute Time | Male | Female |
| Less than 5 Minutes | 66 (7.0%) | 46 (6.0%) |
| 5 to 9 Minutes | 188 (19.8%) | 64 (8.4%) |
| 10 to 14 Minutes | 50 (5.3%) | 52 (6.8%) |
| 15 to 19 Minutes | 88 (9.3%) | 73 (9.6%) |
| 20 to 24 Minutes | 268 (28.2%) | 166 (21.8%) |
| 25 to 29 Minutes | 16 (1.7%) | 26 (3.4%) |
| 30 to 34 Minutes | 88 (9.3%) | 158 (20.8%) |
| 35 to 39 Minutes | 30 (3.2%) | 62 (8.2%) |
| 40 to 44 Minutes | 0 (0.0%) | 16 (2.1%) |
| 45 to 59 Minutes | 16 (1.7%) | 97 (12.8%) |
| 60 to 89 Minutes | 69 (7.3%) | 0 (0.0%) |
| 90 or more Minutes | 70 (7.4%) | 0 (0.0%) |
Time of Departure to Work by Sex in Bowmansville
The most frequent times of departure to work in Bowmansville are 6:30 AM to 6:59 AM (159, 16.8%) for males and 7:00 AM to 7:29 AM (245, 32.2%) for females.
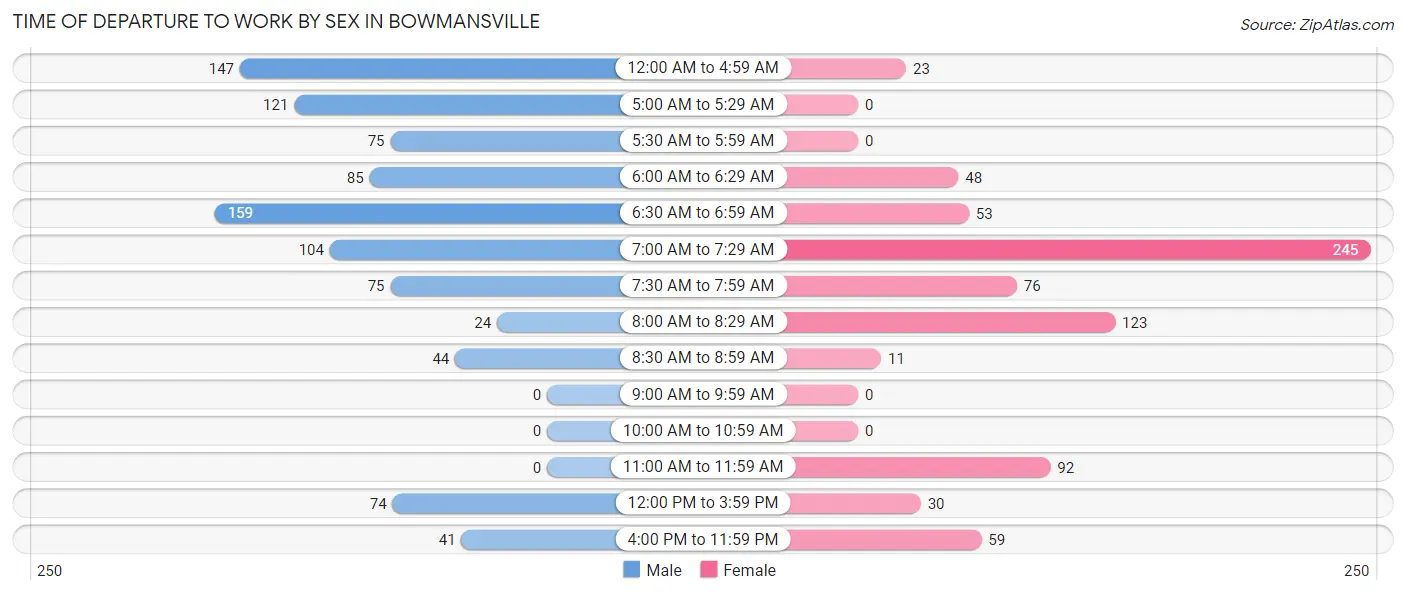
| Time of Departure | Male | Female |
| 12:00 AM to 4:59 AM | 147 (15.5%) | 23 (3.0%) |
| 5:00 AM to 5:29 AM | 121 (12.8%) | 0 (0.0%) |
| 5:30 AM to 5:59 AM | 75 (7.9%) | 0 (0.0%) |
| 6:00 AM to 6:29 AM | 85 (9.0%) | 48 (6.3%) |
| 6:30 AM to 6:59 AM | 159 (16.8%) | 53 (7.0%) |
| 7:00 AM to 7:29 AM | 104 (11.0%) | 245 (32.2%) |
| 7:30 AM to 7:59 AM | 75 (7.9%) | 76 (10.0%) |
| 8:00 AM to 8:29 AM | 24 (2.5%) | 123 (16.2%) |
| 8:30 AM to 8:59 AM | 44 (4.6%) | 11 (1.5%) |
| 9:00 AM to 9:59 AM | 0 (0.0%) | 0 (0.0%) |
| 10:00 AM to 10:59 AM | 0 (0.0%) | 0 (0.0%) |
| 11:00 AM to 11:59 AM | 0 (0.0%) | 92 (12.1%) |
| 12:00 PM to 3:59 PM | 74 (7.8%) | 30 (4.0%) |
| 4:00 PM to 11:59 PM | 41 (4.3%) | 59 (7.8%) |
| Total | 949 (100.0%) | 760 (100.0%) |
Housing Occupancy in Bowmansville
Occupancy by Ownership in Bowmansville
Of the total 1,004 dwellings in Bowmansville, owner-occupied units account for 815 (81.2%), while renter-occupied units make up 189 (18.8%).
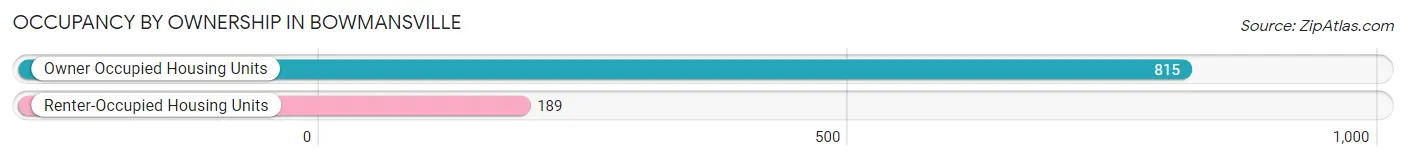
| Occupancy | # Housing Units | % Housing Units |
| Owner Occupied Housing Units | 815 | 81.2% |
| Renter-Occupied Housing Units | 189 | 18.8% |
| Total Occupied Housing Units | 1,004 | 100.0% |
Occupancy by Household Size in Bowmansville
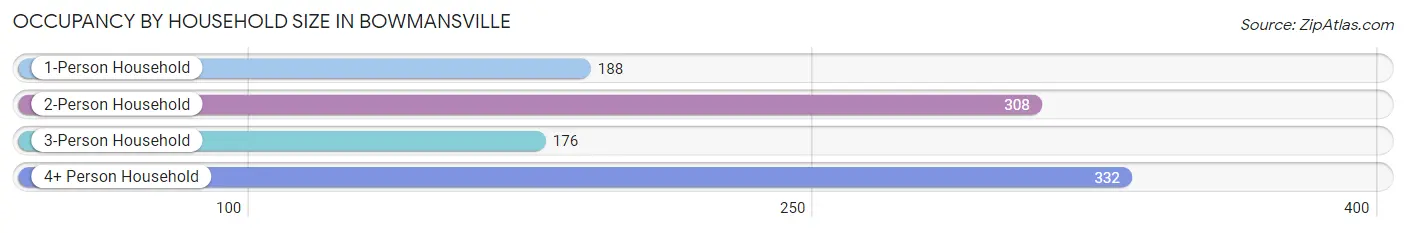
| Household Size | # Housing Units | % Housing Units |
| 1-Person Household | 188 | 18.7% |
| 2-Person Household | 308 | 30.7% |
| 3-Person Household | 176 | 17.5% |
| 4+ Person Household | 332 | 33.1% |
| Total Housing Units | 1,004 | 100.0% |
Occupancy by Ownership by Household Size in Bowmansville
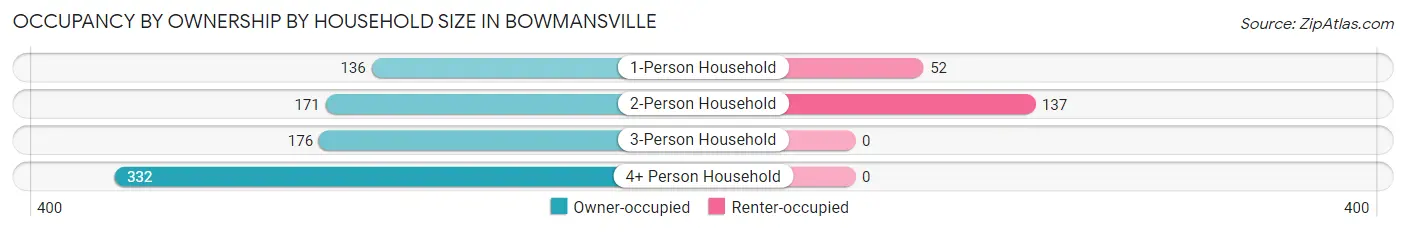
| Household Size | Owner-occupied | Renter-occupied |
| 1-Person Household | 136 (72.3%) | 52 (27.7%) |
| 2-Person Household | 171 (55.5%) | 137 (44.5%) |
| 3-Person Household | 176 (100.0%) | 0 (0.0%) |
| 4+ Person Household | 332 (100.0%) | 0 (0.0%) |
| Total Housing Units | 815 (81.2%) | 189 (18.8%) |
Occupancy by Educational Attainment in Bowmansville
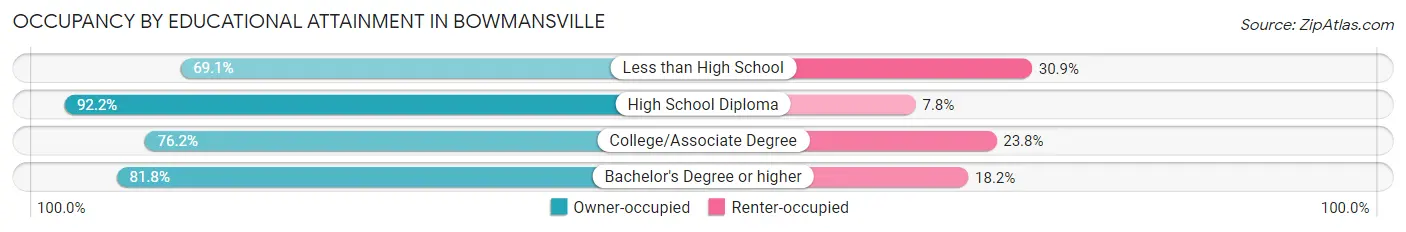
| Household Size | Owner-occupied | Renter-occupied |
| Less than High School | 121 (69.1%) | 54 (30.9%) |
| High School Diploma | 236 (92.2%) | 20 (7.8%) |
| College/Associate Degree | 144 (76.2%) | 45 (23.8%) |
| Bachelor's Degree or higher | 314 (81.8%) | 70 (18.2%) |
Occupancy by Age of Householder in Bowmansville
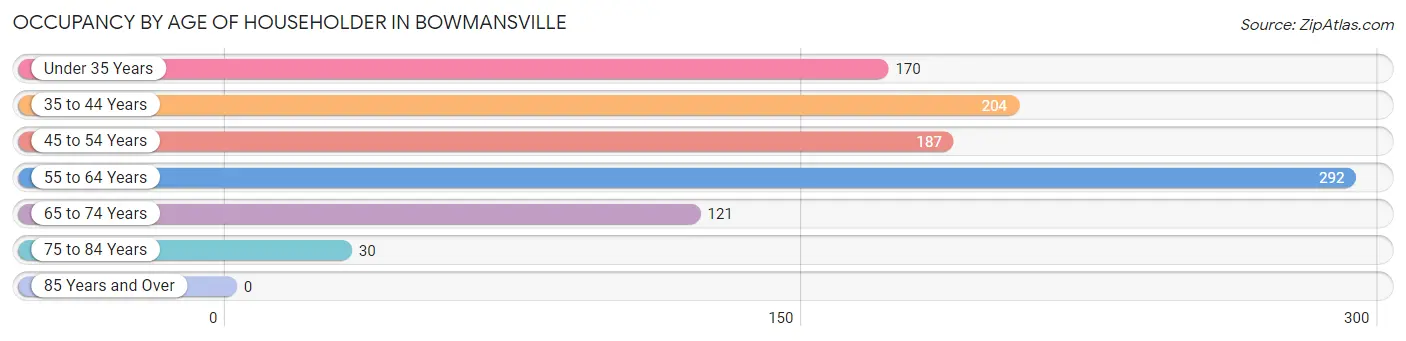
| Age Bracket | # Households | % Households |
| Under 35 Years | 170 | 16.9% |
| 35 to 44 Years | 204 | 20.3% |
| 45 to 54 Years | 187 | 18.6% |
| 55 to 64 Years | 292 | 29.1% |
| 65 to 74 Years | 121 | 12.0% |
| 75 to 84 Years | 30 | 3.0% |
| 85 Years and Over | 0 | 0.0% |
| Total | 1,004 | 100.0% |
Housing Finances in Bowmansville
Median Income by Occupancy in Bowmansville
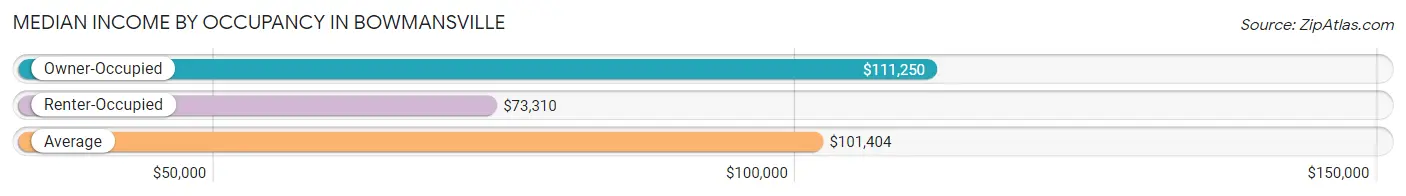
| Occupancy Type | # Households | Median Income |
| Owner-Occupied | 815 (81.2%) | $111,250 |
| Renter-Occupied | 189 (18.8%) | $73,310 |
| Average | 1,004 (100.0%) | $101,404 |
Occupancy by Householder Income Bracket in Bowmansville
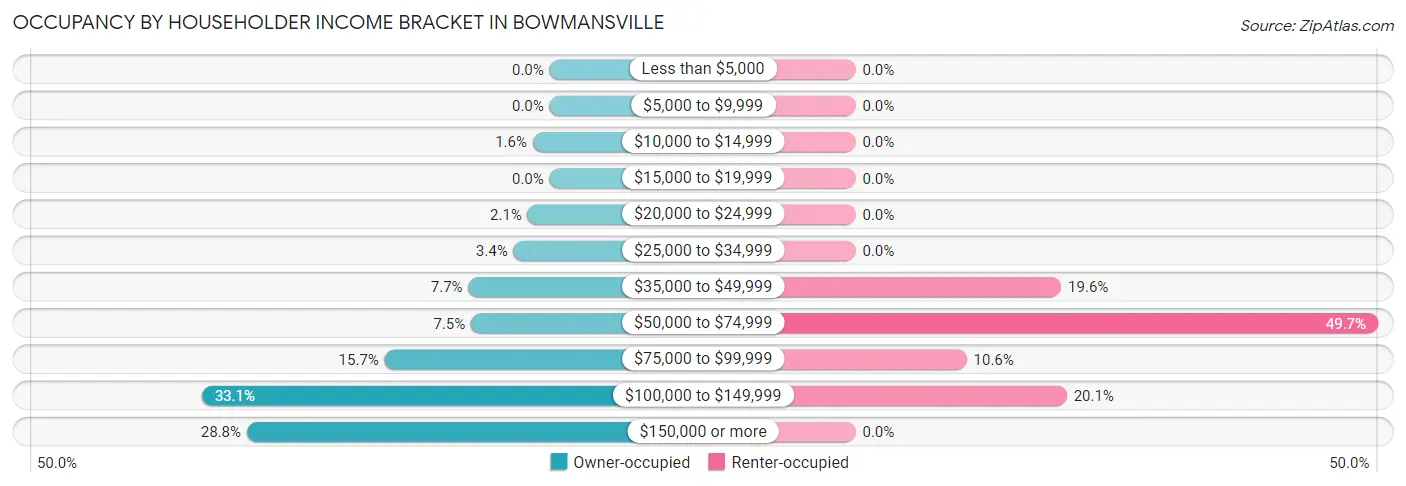
| Income Bracket | Owner-occupied | Renter-occupied |
| Less than $5,000 | 0 (0.0%) | 0 (0.0%) |
| $5,000 to $9,999 | 0 (0.0%) | 0 (0.0%) |
| $10,000 to $14,999 | 13 (1.6%) | 0 (0.0%) |
| $15,000 to $19,999 | 0 (0.0%) | 0 (0.0%) |
| $20,000 to $24,999 | 17 (2.1%) | 0 (0.0%) |
| $25,000 to $34,999 | 28 (3.4%) | 0 (0.0%) |
| $35,000 to $49,999 | 63 (7.7%) | 37 (19.6%) |
| $50,000 to $74,999 | 61 (7.5%) | 94 (49.7%) |
| $75,000 to $99,999 | 128 (15.7%) | 20 (10.6%) |
| $100,000 to $149,999 | 270 (33.1%) | 38 (20.1%) |
| $150,000 or more | 235 (28.8%) | 0 (0.0%) |
| Total | 815 (100.0%) | 189 (100.0%) |
Monthly Housing Cost Tiers in Bowmansville
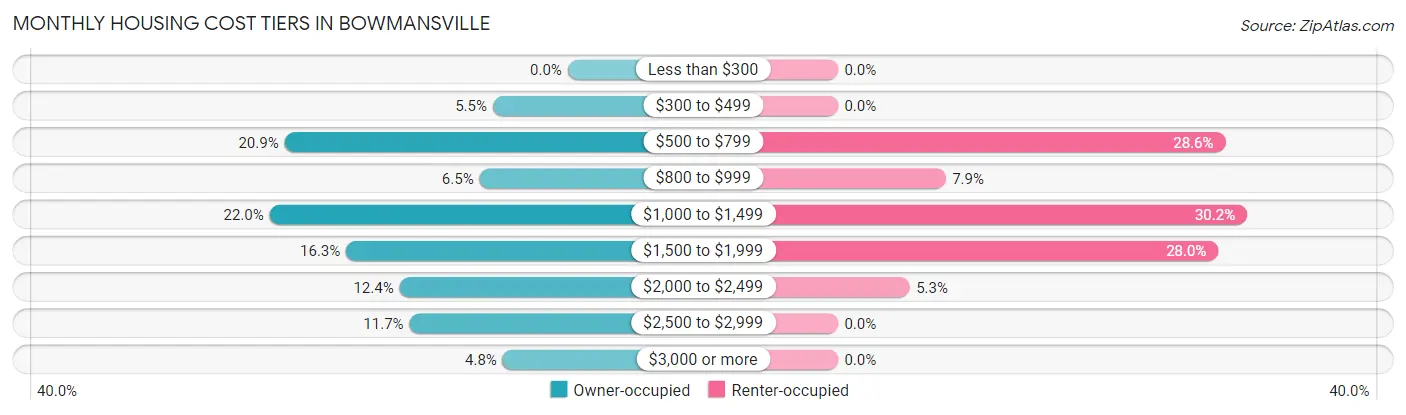
| Monthly Cost | Owner-occupied | Renter-occupied |
| Less than $300 | 0 (0.0%) | 0 (0.0%) |
| $300 to $499 | 45 (5.5%) | 0 (0.0%) |
| $500 to $799 | 170 (20.9%) | 54 (28.6%) |
| $800 to $999 | 53 (6.5%) | 15 (7.9%) |
| $1,000 to $1,499 | 179 (22.0%) | 57 (30.2%) |
| $1,500 to $1,999 | 133 (16.3%) | 53 (28.0%) |
| $2,000 to $2,499 | 101 (12.4%) | 10 (5.3%) |
| $2,500 to $2,999 | 95 (11.7%) | 0 (0.0%) |
| $3,000 or more | 39 (4.8%) | 0 (0.0%) |
| Total | 815 (100.0%) | 189 (100.0%) |
Physical Housing Characteristics in Bowmansville
Housing Structures in Bowmansville
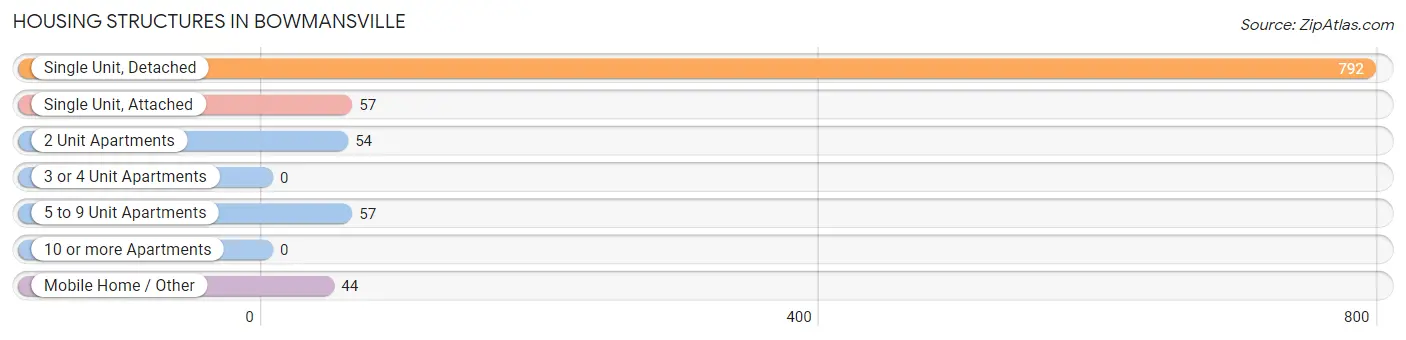
| Structure Type | # Housing Units | % Housing Units |
| Single Unit, Detached | 792 | 78.9% |
| Single Unit, Attached | 57 | 5.7% |
| 2 Unit Apartments | 54 | 5.4% |
| 3 or 4 Unit Apartments | 0 | 0.0% |
| 5 to 9 Unit Apartments | 57 | 5.7% |
| 10 or more Apartments | 0 | 0.0% |
| Mobile Home / Other | 44 | 4.4% |
| Total | 1,004 | 100.0% |
Housing Structures by Occupancy in Bowmansville
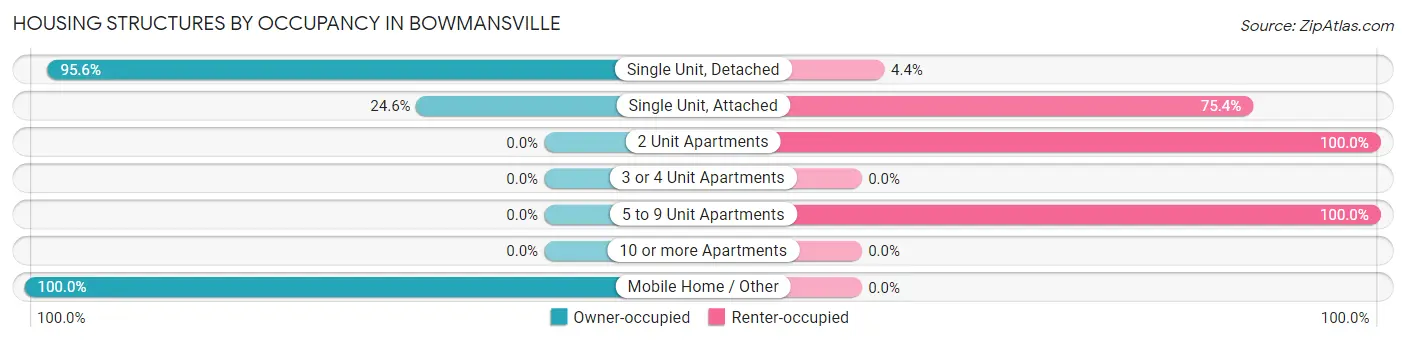
| Structure Type | Owner-occupied | Renter-occupied |
| Single Unit, Detached | 757 (95.6%) | 35 (4.4%) |
| Single Unit, Attached | 14 (24.6%) | 43 (75.4%) |
| 2 Unit Apartments | 0 (0.0%) | 54 (100.0%) |
| 3 or 4 Unit Apartments | 0 (0.0%) | 0 (0.0%) |
| 5 to 9 Unit Apartments | 0 (0.0%) | 57 (100.0%) |
| 10 or more Apartments | 0 (0.0%) | 0 (0.0%) |
| Mobile Home / Other | 44 (100.0%) | 0 (0.0%) |
| Total | 815 (81.2%) | 189 (18.8%) |
Housing Structures by Number of Rooms in Bowmansville
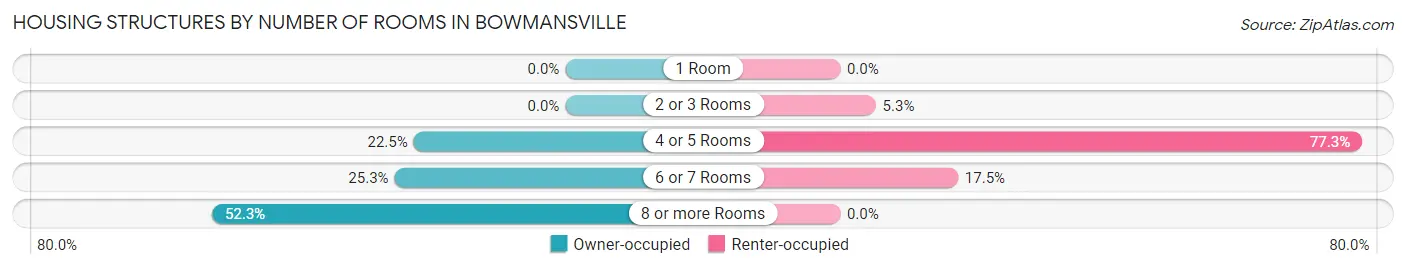
| Number of Rooms | Owner-occupied | Renter-occupied |
| 1 Room | 0 (0.0%) | 0 (0.0%) |
| 2 or 3 Rooms | 0 (0.0%) | 10 (5.3%) |
| 4 or 5 Rooms | 183 (22.5%) | 146 (77.2%) |
| 6 or 7 Rooms | 206 (25.3%) | 33 (17.5%) |
| 8 or more Rooms | 426 (52.3%) | 0 (0.0%) |
| Total | 815 (100.0%) | 189 (100.0%) |
Housing Structure by Heating Type in Bowmansville
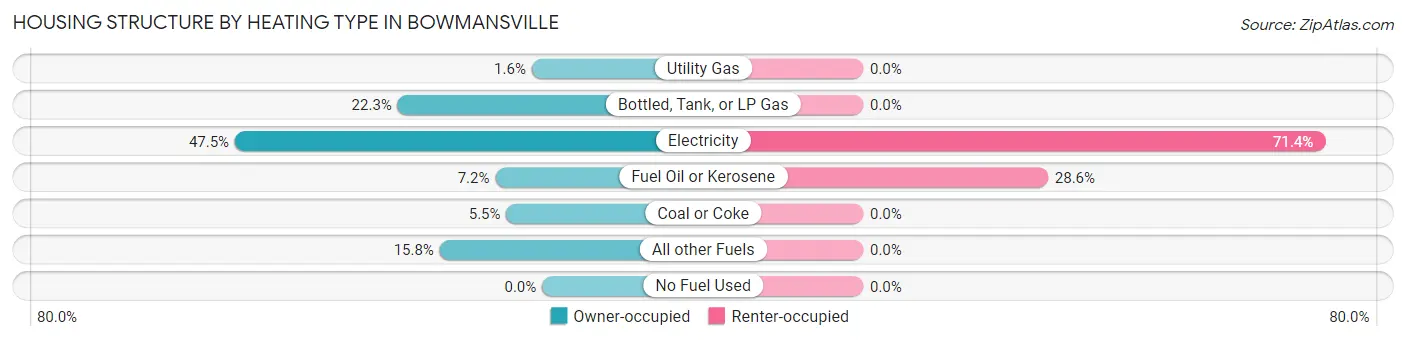
| Heating Type | Owner-occupied | Renter-occupied |
| Utility Gas | 13 (1.6%) | 0 (0.0%) |
| Bottled, Tank, or LP Gas | 182 (22.3%) | 0 (0.0%) |
| Electricity | 387 (47.5%) | 135 (71.4%) |
| Fuel Oil or Kerosene | 59 (7.2%) | 54 (28.6%) |
| Coal or Coke | 45 (5.5%) | 0 (0.0%) |
| All other Fuels | 129 (15.8%) | 0 (0.0%) |
| No Fuel Used | 0 (0.0%) | 0 (0.0%) |
| Total | 815 (100.0%) | 189 (100.0%) |
Household Vehicle Usage in Bowmansville
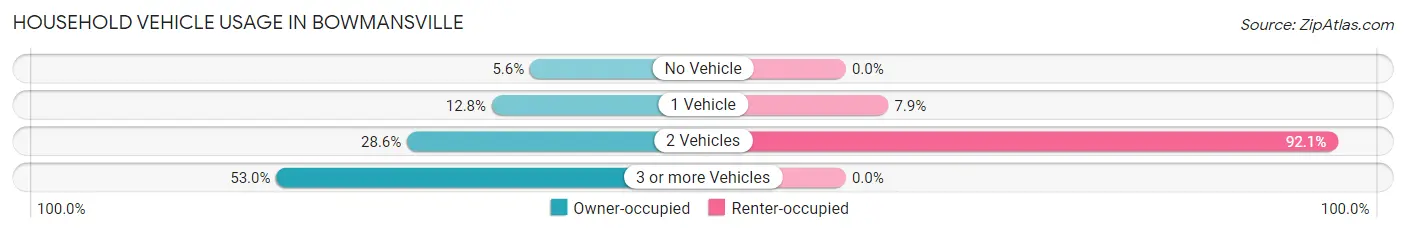
| Vehicles per Household | Owner-occupied | Renter-occupied |
| No Vehicle | 46 (5.6%) | 0 (0.0%) |
| 1 Vehicle | 104 (12.8%) | 15 (7.9%) |
| 2 Vehicles | 233 (28.6%) | 174 (92.1%) |
| 3 or more Vehicles | 432 (53.0%) | 0 (0.0%) |
| Total | 815 (100.0%) | 189 (100.0%) |
Real Estate & Mortgages in Bowmansville
Real Estate and Mortgage Overview in Bowmansville
| Characteristic | Without Mortgage | With Mortgage |
| Housing Units | 303 | 512 |
| Median Property Value | $304,900 | $253,500 |
| Median Household Income | $81,161 | $185 |
| Monthly Housing Costs | $730 | $39 |
| Real Estate Taxes | $3,717 | $0 |
Property Value by Mortgage Status in Bowmansville
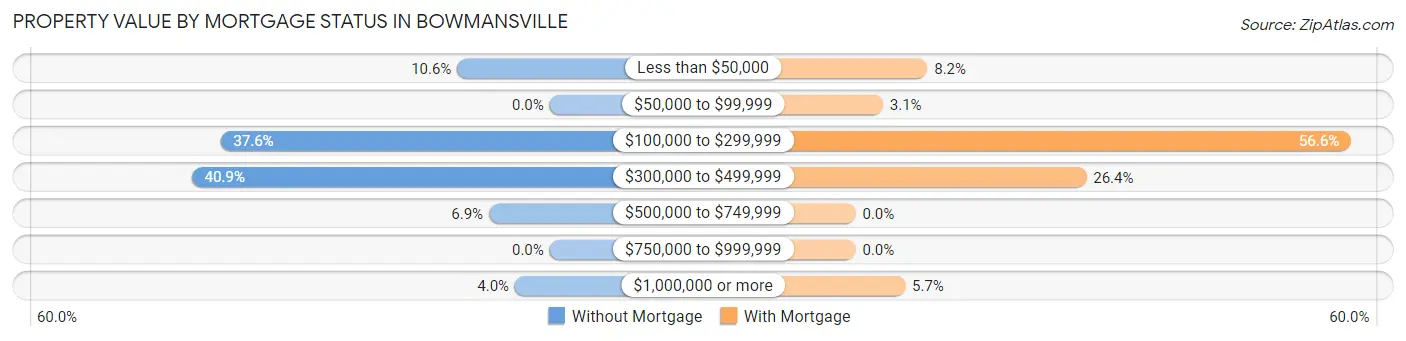
| Property Value | Without Mortgage | With Mortgage |
| Less than $50,000 | 32 (10.6%) | 42 (8.2%) |
| $50,000 to $99,999 | 0 (0.0%) | 16 (3.1%) |
| $100,000 to $299,999 | 114 (37.6%) | 290 (56.6%) |
| $300,000 to $499,999 | 124 (40.9%) | 135 (26.4%) |
| $500,000 to $749,999 | 21 (6.9%) | 0 (0.0%) |
| $750,000 to $999,999 | 0 (0.0%) | 0 (0.0%) |
| $1,000,000 or more | 12 (4.0%) | 29 (5.7%) |
| Total | 303 (100.0%) | 512 (100.0%) |
Household Income by Mortgage Status in Bowmansville
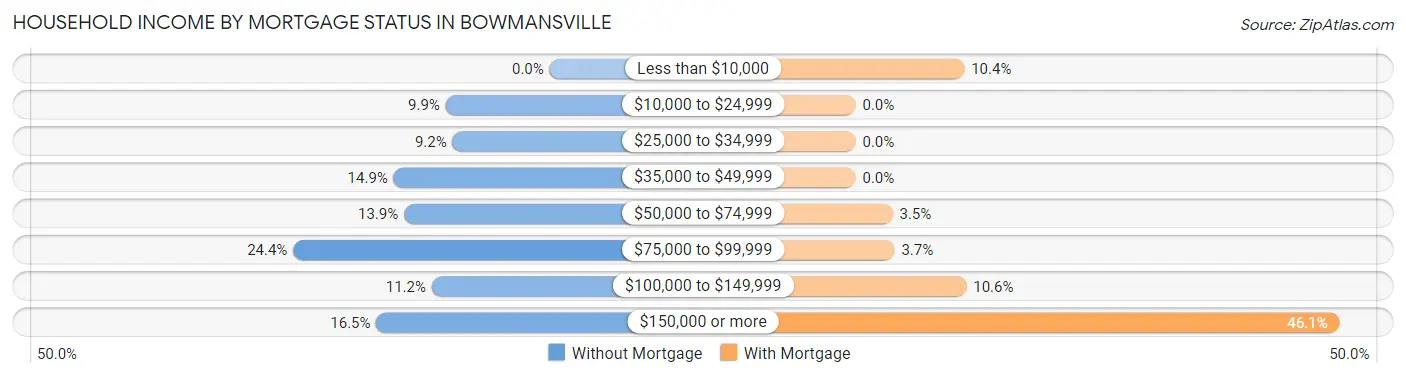
| Household Income | Without Mortgage | With Mortgage |
| Less than $10,000 | 0 (0.0%) | 53 (10.3%) |
| $10,000 to $24,999 | 30 (9.9%) | 0 (0.0%) |
| $25,000 to $34,999 | 28 (9.2%) | 0 (0.0%) |
| $35,000 to $49,999 | 45 (14.8%) | 0 (0.0%) |
| $50,000 to $74,999 | 42 (13.9%) | 18 (3.5%) |
| $75,000 to $99,999 | 74 (24.4%) | 19 (3.7%) |
| $100,000 to $149,999 | 34 (11.2%) | 54 (10.5%) |
| $150,000 or more | 50 (16.5%) | 236 (46.1%) |
| Total | 303 (100.0%) | 512 (100.0%) |
Property Value to Household Income Ratio in Bowmansville
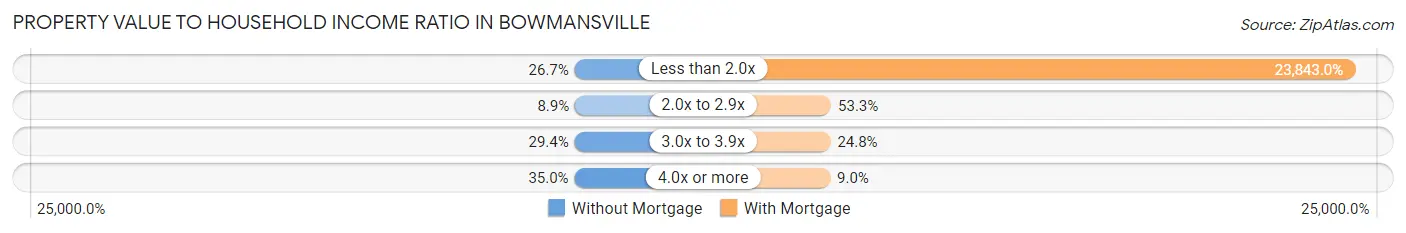
| Value-to-Income Ratio | Without Mortgage | With Mortgage |
| Less than 2.0x | 81 (26.7%) | 122,076 (23,843.0%) |
| 2.0x to 2.9x | 27 (8.9%) | 273 (53.3%) |
| 3.0x to 3.9x | 89 (29.4%) | 127 (24.8%) |
| 4.0x or more | 106 (35.0%) | 46 (9.0%) |
| Total | 303 (100.0%) | 512 (100.0%) |
Real Estate Taxes by Mortgage Status in Bowmansville
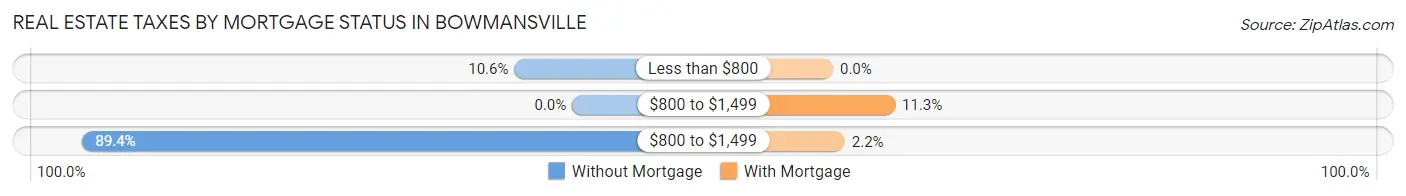
| Property Taxes | Without Mortgage | With Mortgage |
| Less than $800 | 32 (10.6%) | 0 (0.0%) |
| $800 to $1,499 | 0 (0.0%) | 58 (11.3%) |
| $800 to $1,499 | 271 (89.4%) | 11 (2.1%) |
| Total | 303 (100.0%) | 512 (100.0%) |
Health & Disability in Bowmansville
Health Insurance Coverage by Age in Bowmansville
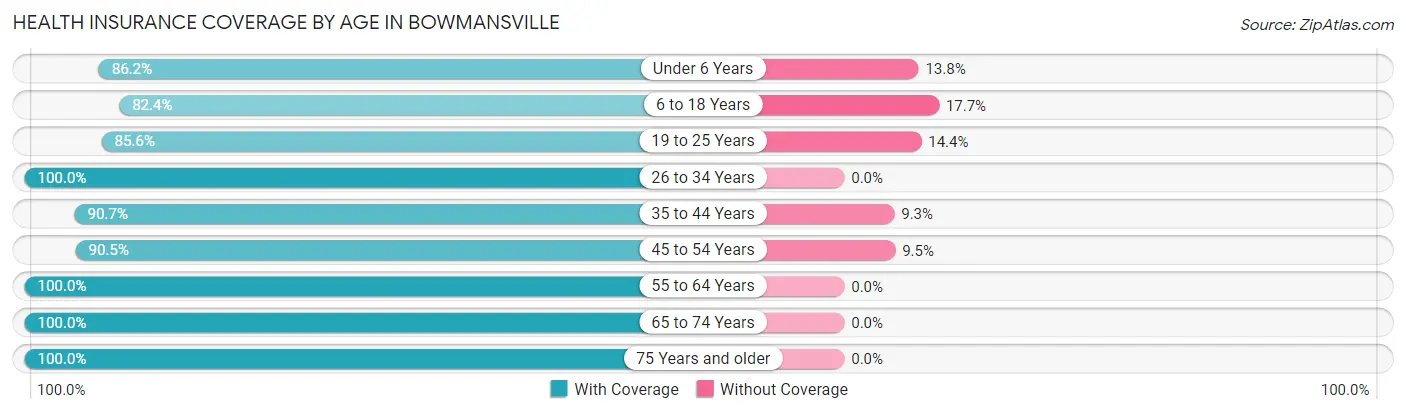
| Age Bracket | With Coverage | Without Coverage |
| Under 6 Years | 193 (86.2%) | 31 (13.8%) |
| 6 to 18 Years | 476 (82.4%) | 102 (17.6%) |
| 19 to 25 Years | 322 (85.6%) | 54 (14.4%) |
| 26 to 34 Years | 299 (100.0%) | 0 (0.0%) |
| 35 to 44 Years | 331 (90.7%) | 34 (9.3%) |
| 45 to 54 Years | 305 (90.5%) | 32 (9.5%) |
| 55 to 64 Years | 518 (100.0%) | 0 (0.0%) |
| 65 to 74 Years | 176 (100.0%) | 0 (0.0%) |
| 75 Years and older | 72 (100.0%) | 0 (0.0%) |
| Total | 2,692 (91.4%) | 253 (8.6%) |
Health Insurance Coverage by Citizenship Status in Bowmansville
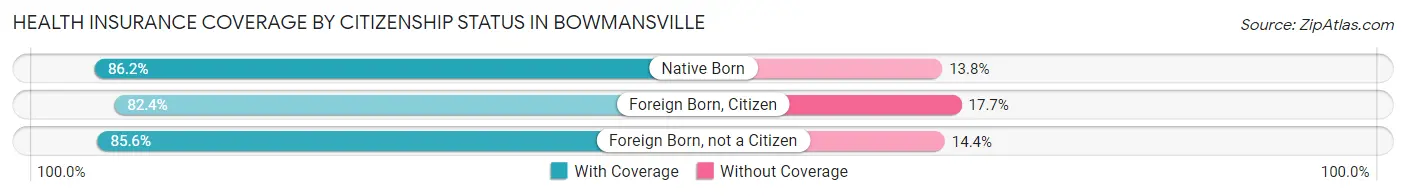
| Citizenship Status | With Coverage | Without Coverage |
| Native Born | 193 (86.2%) | 31 (13.8%) |
| Foreign Born, Citizen | 476 (82.4%) | 102 (17.6%) |
| Foreign Born, not a Citizen | 322 (85.6%) | 54 (14.4%) |
Health Insurance Coverage by Household Income in Bowmansville
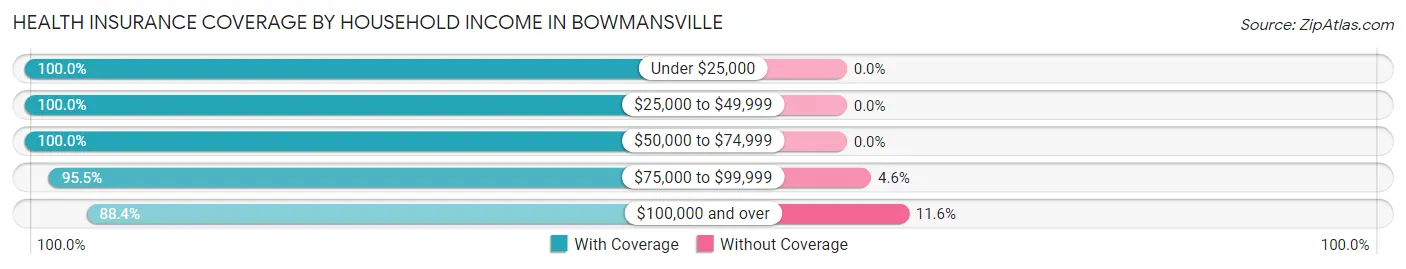
| Household Income | With Coverage | Without Coverage |
| Under $25,000 | 44 (100.0%) | 0 (0.0%) |
| $25,000 to $49,999 | 159 (100.0%) | 0 (0.0%) |
| $50,000 to $74,999 | 324 (100.0%) | 0 (0.0%) |
| $75,000 to $99,999 | 378 (95.5%) | 18 (4.5%) |
| $100,000 and over | 1,787 (88.4%) | 235 (11.6%) |
Public vs Private Health Insurance Coverage by Age in Bowmansville
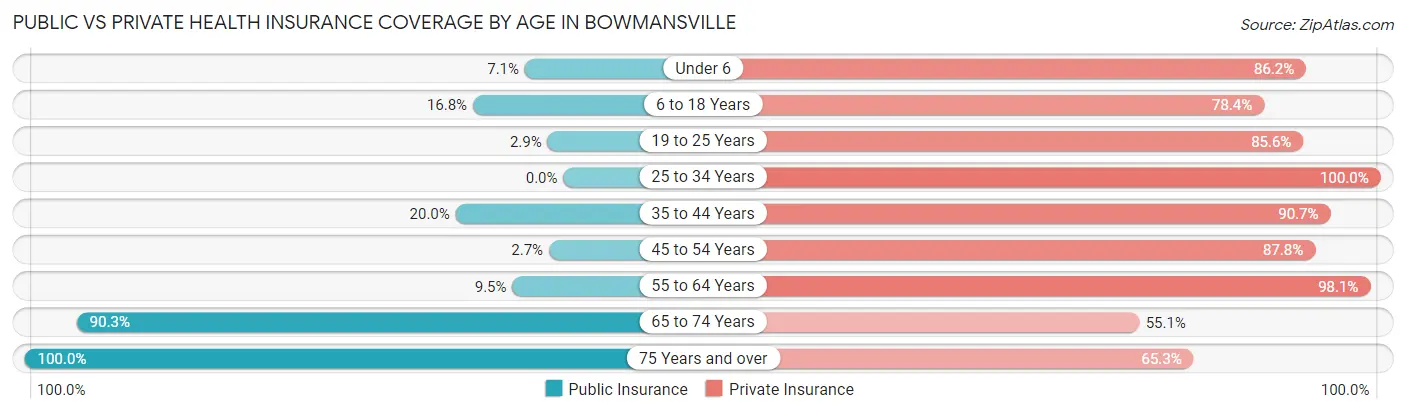
| Age Bracket | Public Insurance | Private Insurance |
| Under 6 | 16 (7.1%) | 193 (86.2%) |
| 6 to 18 Years | 97 (16.8%) | 453 (78.4%) |
| 19 to 25 Years | 11 (2.9%) | 322 (85.6%) |
| 25 to 34 Years | 0 (0.0%) | 299 (100.0%) |
| 35 to 44 Years | 73 (20.0%) | 331 (90.7%) |
| 45 to 54 Years | 9 (2.7%) | 296 (87.8%) |
| 55 to 64 Years | 49 (9.5%) | 508 (98.1%) |
| 65 to 74 Years | 159 (90.3%) | 97 (55.1%) |
| 75 Years and over | 72 (100.0%) | 47 (65.3%) |
| Total | 486 (16.5%) | 2,546 (86.5%) |
Disability Status by Sex by Age in Bowmansville
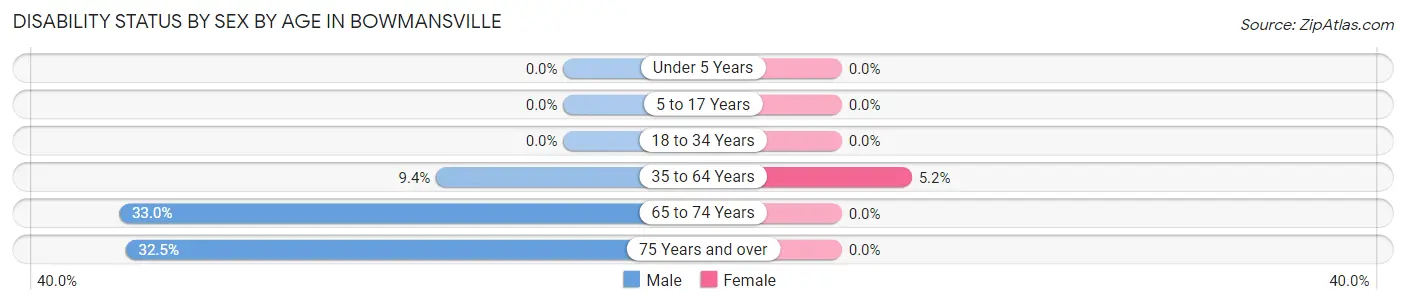
| Age Bracket | Male | Female |
| Under 5 Years | 0 (0.0%) | 0 (0.0%) |
| 5 to 17 Years | 0 (0.0%) | 0 (0.0%) |
| 18 to 34 Years | 0 (0.0%) | 0 (0.0%) |
| 35 to 64 Years | 57 (9.4%) | 32 (5.2%) |
| 65 to 74 Years | 32 (33.0%) | 0 (0.0%) |
| 75 Years and over | 13 (32.5%) | 0 (0.0%) |
Disability Class by Sex by Age in Bowmansville
Disability Class: Hearing Difficulty
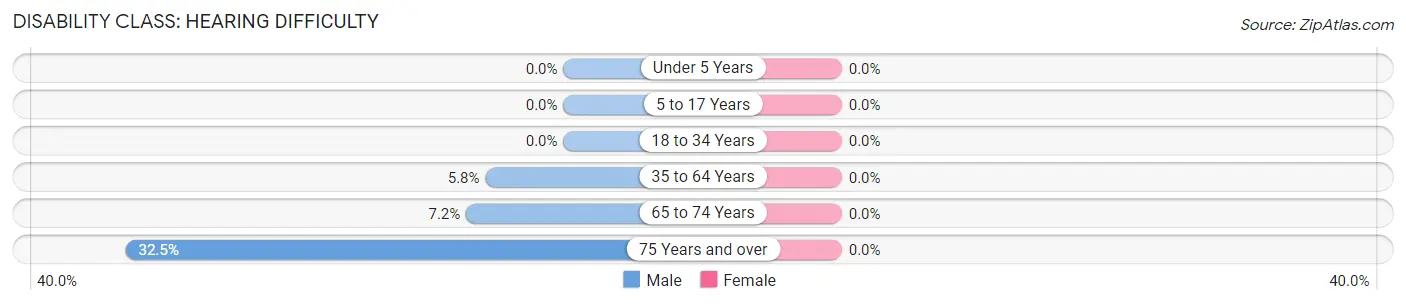
| Age Bracket | Male | Female |
| Under 5 Years | 0 (0.0%) | 0 (0.0%) |
| 5 to 17 Years | 0 (0.0%) | 0 (0.0%) |
| 18 to 34 Years | 0 (0.0%) | 0 (0.0%) |
| 35 to 64 Years | 35 (5.8%) | 0 (0.0%) |
| 65 to 74 Years | 7 (7.2%) | 0 (0.0%) |
| 75 Years and over | 13 (32.5%) | 0 (0.0%) |
Disability Class: Vision Difficulty
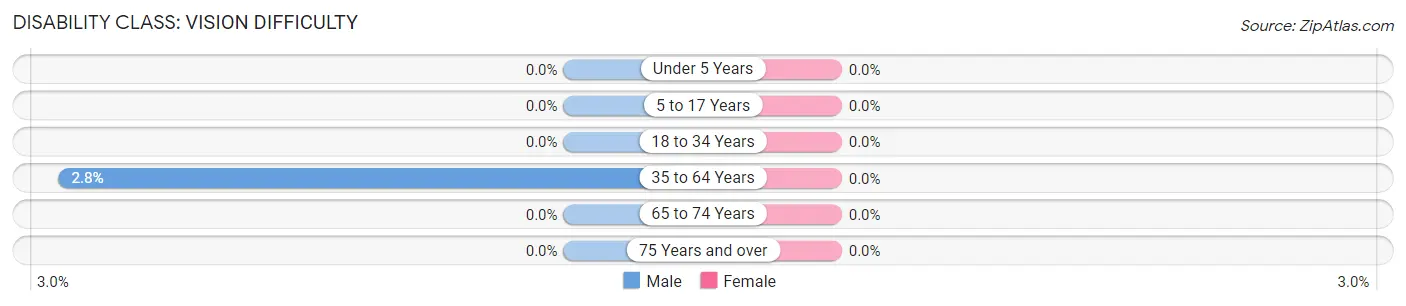
| Age Bracket | Male | Female |
| Under 5 Years | 0 (0.0%) | 0 (0.0%) |
| 5 to 17 Years | 0 (0.0%) | 0 (0.0%) |
| 18 to 34 Years | 0 (0.0%) | 0 (0.0%) |
| 35 to 64 Years | 17 (2.8%) | 0 (0.0%) |
| 65 to 74 Years | 0 (0.0%) | 0 (0.0%) |
| 75 Years and over | 0 (0.0%) | 0 (0.0%) |
Disability Class: Cognitive Difficulty
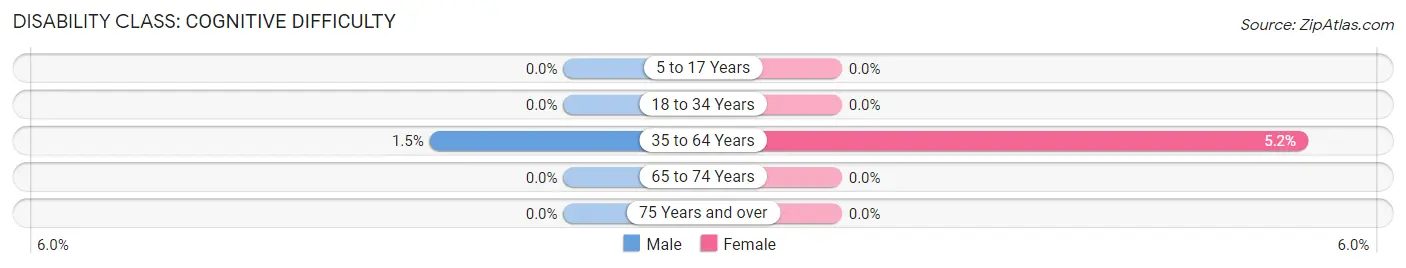
| Age Bracket | Male | Female |
| 5 to 17 Years | 0 (0.0%) | 0 (0.0%) |
| 18 to 34 Years | 0 (0.0%) | 0 (0.0%) |
| 35 to 64 Years | 9 (1.5%) | 32 (5.2%) |
| 65 to 74 Years | 0 (0.0%) | 0 (0.0%) |
| 75 Years and over | 0 (0.0%) | 0 (0.0%) |
Disability Class: Ambulatory Difficulty
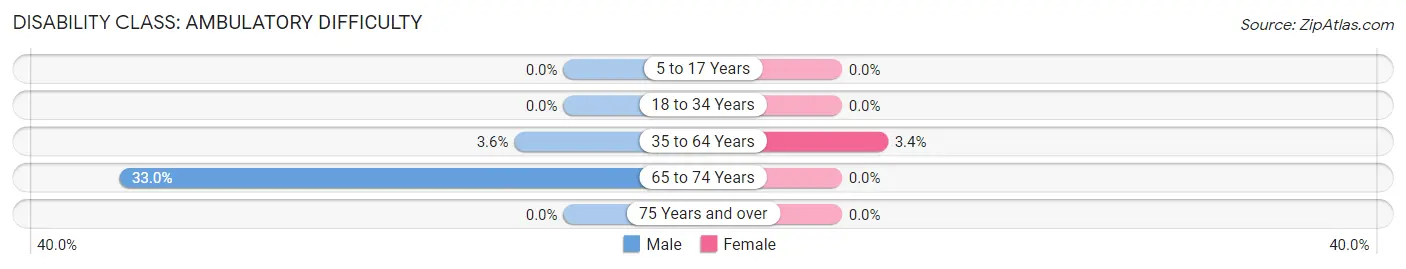
| Age Bracket | Male | Female |
| 5 to 17 Years | 0 (0.0%) | 0 (0.0%) |
| 18 to 34 Years | 0 (0.0%) | 0 (0.0%) |
| 35 to 64 Years | 22 (3.6%) | 21 (3.4%) |
| 65 to 74 Years | 32 (33.0%) | 0 (0.0%) |
| 75 Years and over | 0 (0.0%) | 0 (0.0%) |
Disability Class: Self-Care Difficulty
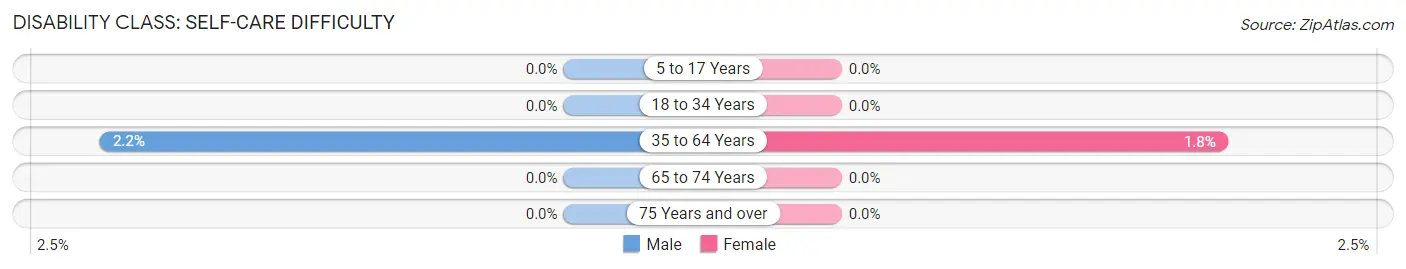
| Age Bracket | Male | Female |
| 5 to 17 Years | 0 (0.0%) | 0 (0.0%) |
| 18 to 34 Years | 0 (0.0%) | 0 (0.0%) |
| 35 to 64 Years | 13 (2.1%) | 11 (1.8%) |
| 65 to 74 Years | 0 (0.0%) | 0 (0.0%) |
| 75 Years and over | 0 (0.0%) | 0 (0.0%) |
Technology Access in Bowmansville
Computing Device Access in Bowmansville
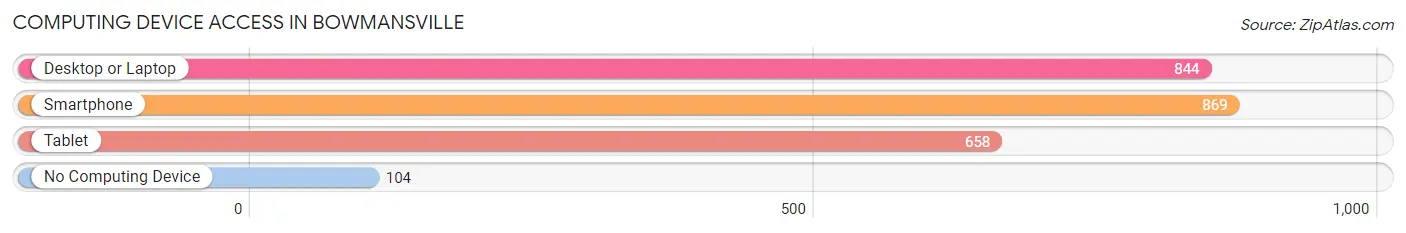
| Device Type | # Households | % Households |
| Desktop or Laptop | 844 | 84.1% |
| Smartphone | 869 | 86.6% |
| Tablet | 658 | 65.5% |
| No Computing Device | 104 | 10.4% |
| Total | 1,004 | 100.0% |
Internet Access in Bowmansville
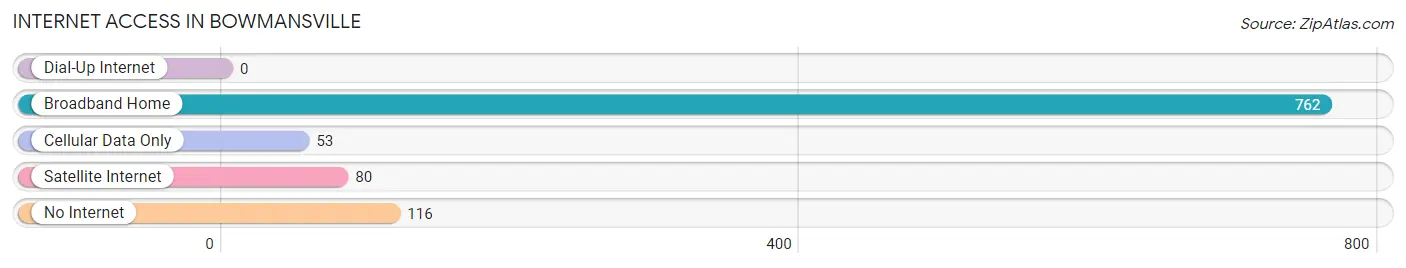
| Internet Type | # Households | % Households |
| Dial-Up Internet | 0 | 0.0% |
| Broadband Home | 762 | 75.9% |
| Cellular Data Only | 53 | 5.3% |
| Satellite Internet | 80 | 8.0% |
| No Internet | 116 | 11.6% |
| Total | 1,004 | 100.0% |
Bowmansville Summary
Bowmansville is a small borough located in Lancaster County, Pennsylvania. It is situated in the southeastern corner of the county, approximately 10 miles east of the city of Lancaster. The population of Bowmansville was 1,845 at the 2010 census.
History
Bowmansville was founded in 1737 by John Bowman, a German immigrant who had settled in the area. The town was originally known as "Bowman's Town" and was later changed to "Bowman'sville". The town was incorporated in 1851.
Bowmansville was a farming community for many years, but in the late 19th century, the town began to develop into a manufacturing center. The first industry to locate in the town was the Bowmansville Woolen Mill, which opened in 1876. The mill was followed by several other factories, including a paper mill, a brickyard, and a canning factory.
Geography
Bowmansville is located at 40°7'17" North, 76°14'45" West (40.1214, -76.2458). The borough is situated in the southeastern corner of Lancaster County, approximately 10 miles east of the city of Lancaster. The borough is bordered by East Cocalico Township to the north, West Cocalico Township to the east, Brecknock Township to the south, and East Earl Township to the west.
The borough has a total area of 0.7 square miles, all of which is land. The borough is located in the Conestoga Valley, which is part of the larger Susquehanna River Valley. The Conestoga River flows through the borough, and the borough is located in the Conestoga Valley Scenic Byway.
Economy
The economy of Bowmansville is largely based on manufacturing and agriculture. The town is home to several factories, including a paper mill, a brickyard, and a canning factory. The town is also home to several farms, which produce a variety of crops, including corn, soybeans, and wheat.
The town is also home to several small businesses, including restaurants, retail stores, and service providers. The town is also home to several churches, a library, and a post office.
Demographics
As of the 2010 census, the population of Bowmansville was 1,845. The racial makeup of the borough was 97.3% White, 0.7% African American, 0.2% Native American, 0.3% Asian, 0.2% from other races, and 1.3% from two or more races. Hispanic or Latino of any race were 1.2% of the population.
The median household income in Bowmansville was $50,938, and the median family income was $60,938. The per capita income for the borough was $22,938. About 4.3% of families and 5.7% of the population were below the poverty line, including 6.3% of those under age 18 and 4.3% of those age 65 or over.
Common Questions
What is Per Capita Income in Bowmansville?
Per Capita income in Bowmansville is $38,676.
What is the Median Family Income in Bowmansville?
Median Family Income in Bowmansville is $119,345.
What is the Median Household income in Bowmansville?
Median Household Income in Bowmansville is $101,404.
What is Income or Wage Gap in Bowmansville?
Income or Wage Gap in Bowmansville is 24.6%.
Women in Bowmansville earn 75.4 cents for every dollar earned by a man.
What is Inequality or Gini Index in Bowmansville?
Inequality or Gini Index in Bowmansville is 0.30.
What is the Total Population of Bowmansville?
Total Population of Bowmansville is 2,965.
What is the Total Male Population of Bowmansville?
Total Male Population of Bowmansville is 1,493.
What is the Total Female Population of Bowmansville?
Total Female Population of Bowmansville is 1,472.
What is the Ratio of Males per 100 Females in Bowmansville?
There are 101.43 Males per 100 Females in Bowmansville.
What is the Ratio of Females per 100 Males in Bowmansville?
There are 98.59 Females per 100 Males in Bowmansville.
What is the Median Population Age in Bowmansville?
Median Population Age in Bowmansville is 34.4 Years.
What is the Average Family Size in Bowmansville
Average Family Size in Bowmansville is 3.4 People.
What is the Average Household Size in Bowmansville
Average Household Size in Bowmansville is 3.0 People.
How Large is the Labor Force in Bowmansville?
There are 2,000 People in the Labor Forcein in Bowmansville.
What is the Percentage of People in the Labor Force in Bowmansville?
85.7% of People are in the Labor Force in Bowmansville.
What is the Unemployment Rate in Bowmansville?
Unemployment Rate in Bowmansville is 4.0%.