New Tripoli, PA Map & Demographics
New Tripoli Map
New Tripoli Overview
$33,836
PER CAPITA INCOME
$61,786
AVG FAMILY INCOME
$61,385
AVG HOUSEHOLD INCOME
19.0%
WAGE / INCOME GAP [ % ]
81.0¢/ $1
WAGE / INCOME GAP [ $ ]
0.28
INEQUALITY / GINI INDEX
681
TOTAL POPULATION
350
MALE POPULATION
331
FEMALE POPULATION
105.74
MALES / 100 FEMALES
94.57
FEMALES / 100 MALES
34.2
MEDIAN AGE
2.6
AVG FAMILY SIZE
2.0
AVG HOUSEHOLD SIZE
445
LABOR FORCE [ PEOPLE ]
82.1%
PERCENT IN LABOR FORCE
2.0%
UNEMPLOYMENT RATE
New Tripoli Zip Codes
Income in New Tripoli
Income Overview in New Tripoli
Per Capita Income in New Tripoli is $33,836, while median incomes of families and households are $61,786 and $61,385 respectively.
| Characteristic | Number | Measure |
| Per Capita Income | 681 | $33,836 |
| Median Family Income | 192 | $61,786 |
| Mean Family Income | 192 | $77,416 |
| Median Household Income | 339 | $61,385 |
| Mean Household Income | 339 | $69,624 |
| Income Deficit | 192 | $0 |
| Wage / Income Gap (%) | 681 | 18.96% |
| Wage / Income Gap ($) | 681 | 81.04¢ per $1 |
| Gini / Inequality Index | 681 | 0.28 |
Earnings by Sex in New Tripoli
Average Earnings in New Tripoli are $46,250, $41,026 for men and $50,625 for women, a difference of 19.0%.
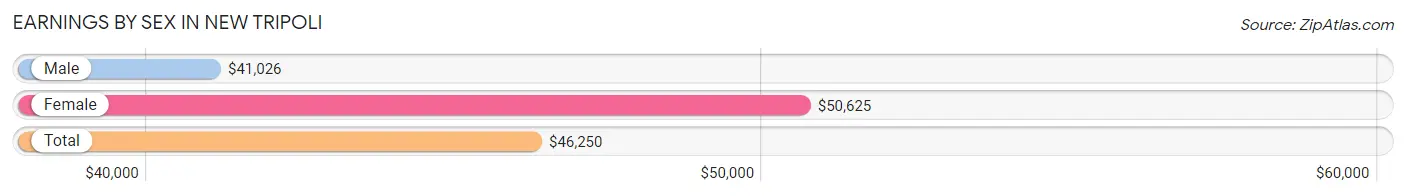
| Sex | Number | Average Earnings |
| Male | 220 (47.8%) | $41,026 |
| Female | 240 (52.2%) | $50,625 |
| Total | 460 (100.0%) | $46,250 |
Earnings by Sex by Income Bracket in New Tripoli
The most common earnings brackets in New Tripoli are $55,000 to $64,999 for men (50 | 22.7%) and $50,000 to $54,999 for women (56 | 23.3%).
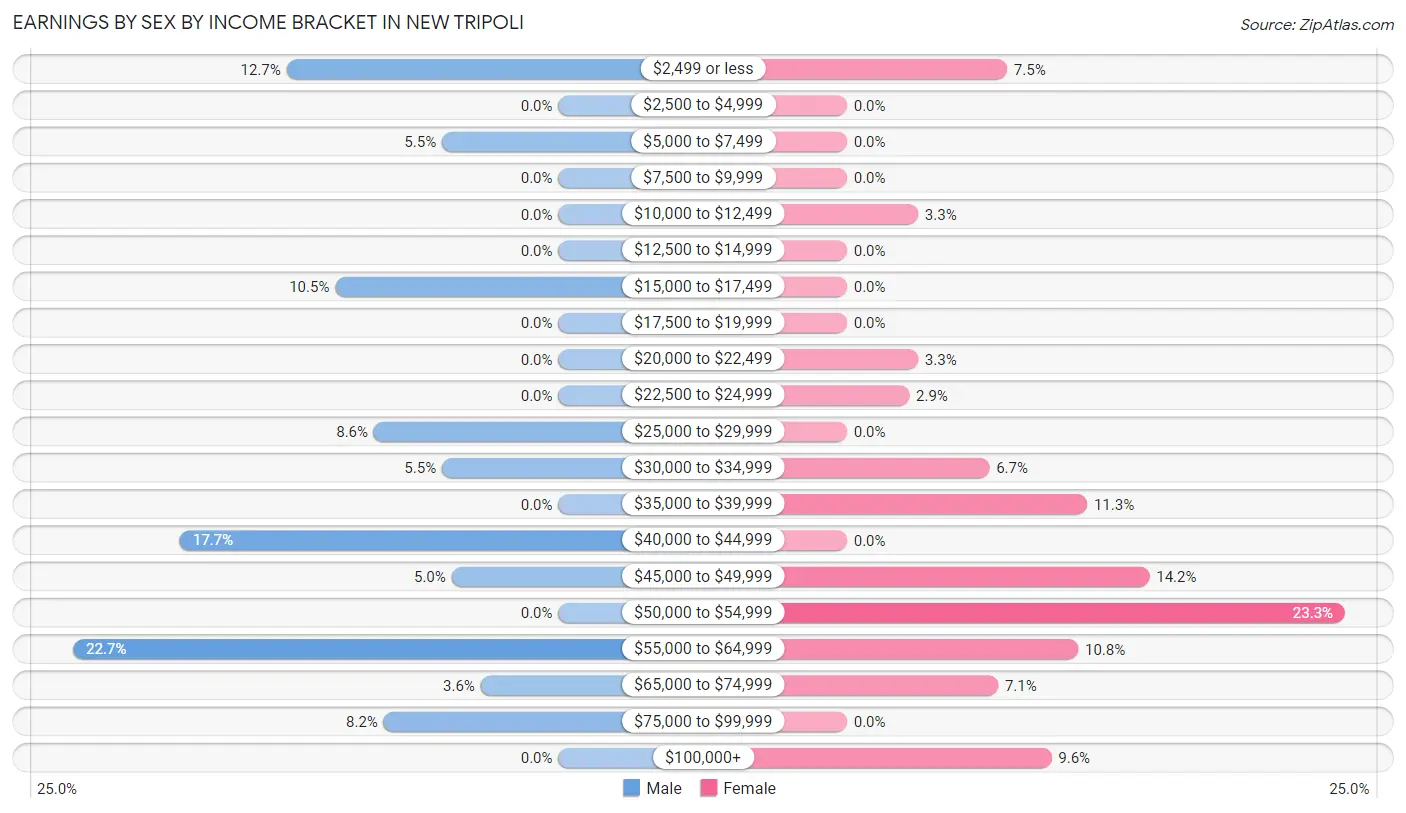
| Income | Male | Female |
| $2,499 or less | 28 (12.7%) | 18 (7.5%) |
| $2,500 to $4,999 | 0 (0.0%) | 0 (0.0%) |
| $5,000 to $7,499 | 12 (5.4%) | 0 (0.0%) |
| $7,500 to $9,999 | 0 (0.0%) | 0 (0.0%) |
| $10,000 to $12,499 | 0 (0.0%) | 8 (3.3%) |
| $12,500 to $14,999 | 0 (0.0%) | 0 (0.0%) |
| $15,000 to $17,499 | 23 (10.4%) | 0 (0.0%) |
| $17,500 to $19,999 | 0 (0.0%) | 0 (0.0%) |
| $20,000 to $22,499 | 0 (0.0%) | 8 (3.3%) |
| $22,500 to $24,999 | 0 (0.0%) | 7 (2.9%) |
| $25,000 to $29,999 | 19 (8.6%) | 0 (0.0%) |
| $30,000 to $34,999 | 12 (5.4%) | 16 (6.7%) |
| $35,000 to $39,999 | 0 (0.0%) | 27 (11.3%) |
| $40,000 to $44,999 | 39 (17.7%) | 0 (0.0%) |
| $45,000 to $49,999 | 11 (5.0%) | 34 (14.2%) |
| $50,000 to $54,999 | 0 (0.0%) | 56 (23.3%) |
| $55,000 to $64,999 | 50 (22.7%) | 26 (10.8%) |
| $65,000 to $74,999 | 8 (3.6%) | 17 (7.1%) |
| $75,000 to $99,999 | 18 (8.2%) | 0 (0.0%) |
| $100,000+ | 0 (0.0%) | 23 (9.6%) |
| Total | 220 (100.0%) | 240 (100.0%) |
Earnings by Sex by Educational Attainment in New Tripoli
Average earnings in New Tripoli are $41,923 for men and $51,406 for women, a difference of 18.4%. Men with an educational attainment of high school diploma enjoy the highest average annual earnings of $57,019, while those with college or associate's degree education earn the least with $41,314. Women with an educational attainment of high school diploma earn the most with the average annual earnings of $105,294, while those with graduate degree education have the smallest earnings of $32,188.
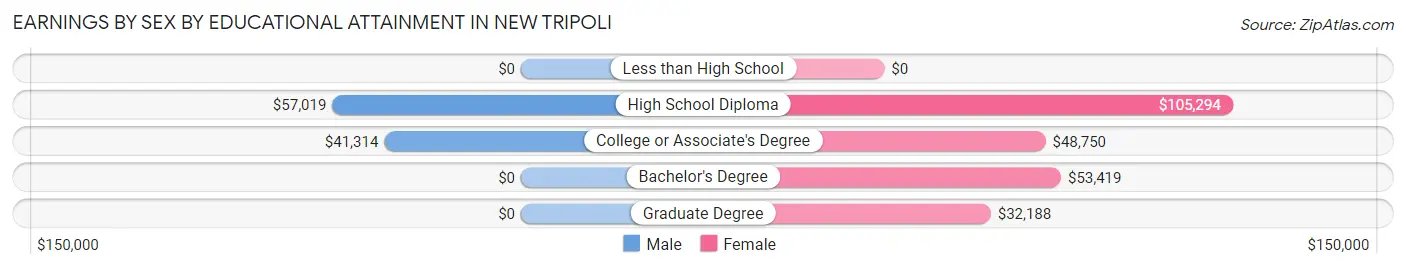
| Educational Attainment | Male Income | Female Income |
| Less than High School | - | - |
| High School Diploma | $57,019 | $105,294 |
| College or Associate's Degree | $41,314 | $48,750 |
| Bachelor's Degree | - | - |
| Graduate Degree | - | - |
| Total | $41,923 | $51,406 |
Family Income in New Tripoli
Family Income Brackets in New Tripoli
According to the New Tripoli family income data, there are 57 families falling into the $35,000 to $49,999 income range, which is the most common income bracket and makes up 29.7% of all families.
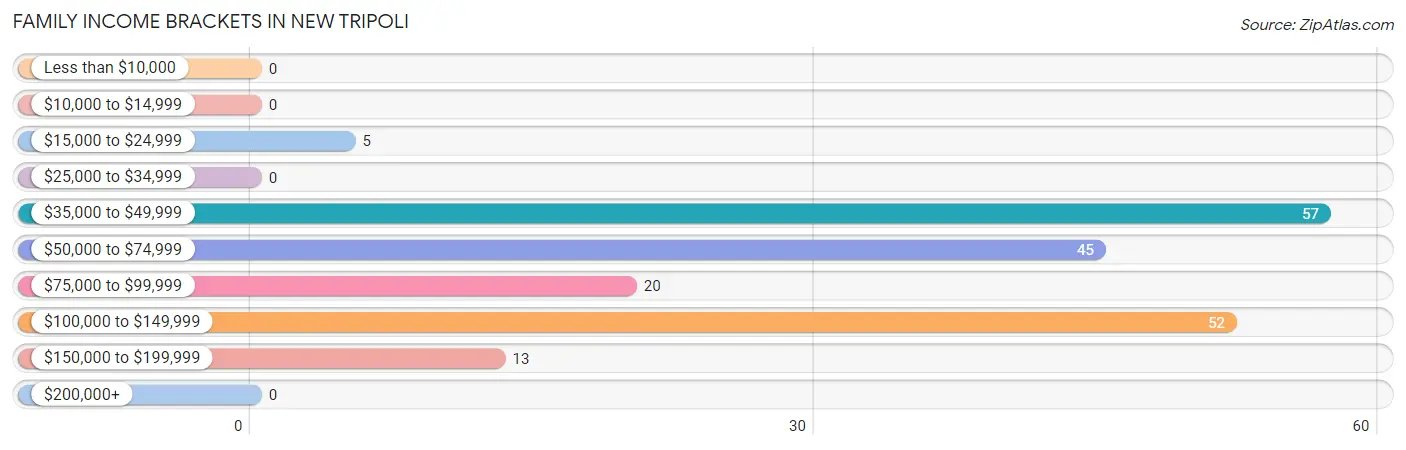
| Income Bracket | # Families | % Families |
| Less than $10,000 | 0 | 0.0% |
| $10,000 to $14,999 | 0 | 0.0% |
| $15,000 to $24,999 | 5 | 2.6% |
| $25,000 to $34,999 | 0 | 0.0% |
| $35,000 to $49,999 | 57 | 29.7% |
| $50,000 to $74,999 | 45 | 23.4% |
| $75,000 to $99,999 | 20 | 10.4% |
| $100,000 to $149,999 | 52 | 27.1% |
| $150,000 to $199,999 | 13 | 6.8% |
| $200,000+ | 0 | 0.0% |
Family Income by Famaliy Size in New Tripoli
2-person families (73 | 38.0%) account for the highest median family income in New Tripoli with $67,639 per family, while 2-person families (73 | 38.0%) have the highest median income of $33,820 per family member.
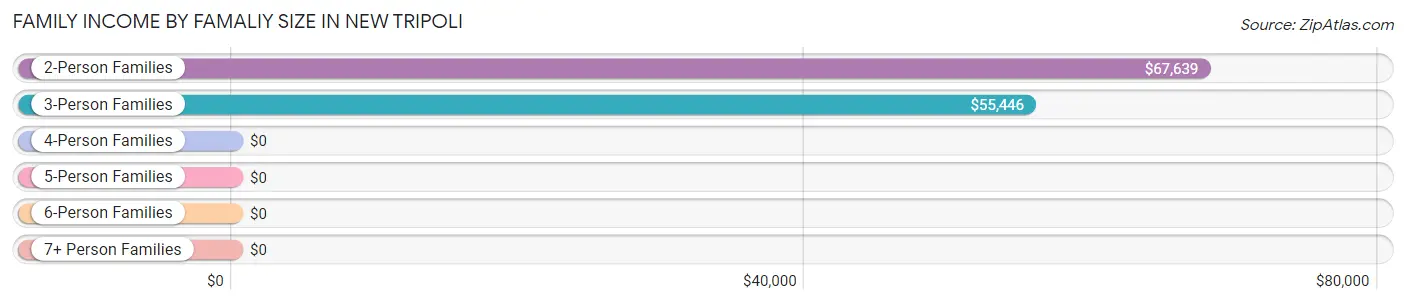
| Income Bracket | # Families | Median Income |
| 2-Person Families | 73 (38.0%) | $67,639 |
| 3-Person Families | 101 (52.6%) | $55,446 |
| 4-Person Families | 18 (9.4%) | $0 |
| 5-Person Families | 0 (0.0%) | $0 |
| 6-Person Families | 0 (0.0%) | $0 |
| 7+ Person Families | 0 (0.0%) | $0 |
| Total | 192 (100.0%) | $61,786 |
Family Income by Number of Earners in New Tripoli
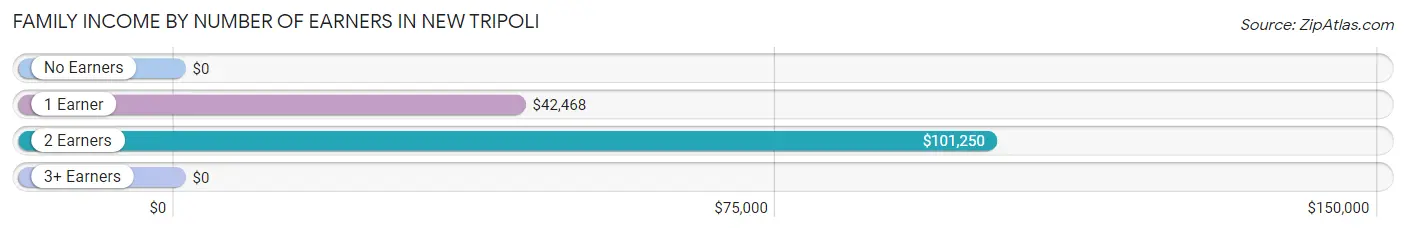
| Number of Earners | # Families | Median Income |
| No Earners | 0 (0.0%) | $0 |
| 1 Earner | 77 (40.1%) | $42,468 |
| 2 Earners | 110 (57.3%) | $101,250 |
| 3+ Earners | 5 (2.6%) | $0 |
| Total | 192 (100.0%) | $61,786 |
Household Income in New Tripoli
Household Income Brackets in New Tripoli
With 110 households falling in the category, the $50,000 to $74,999 income range is the most frequent in New Tripoli, accounting for 32.5% of all households.
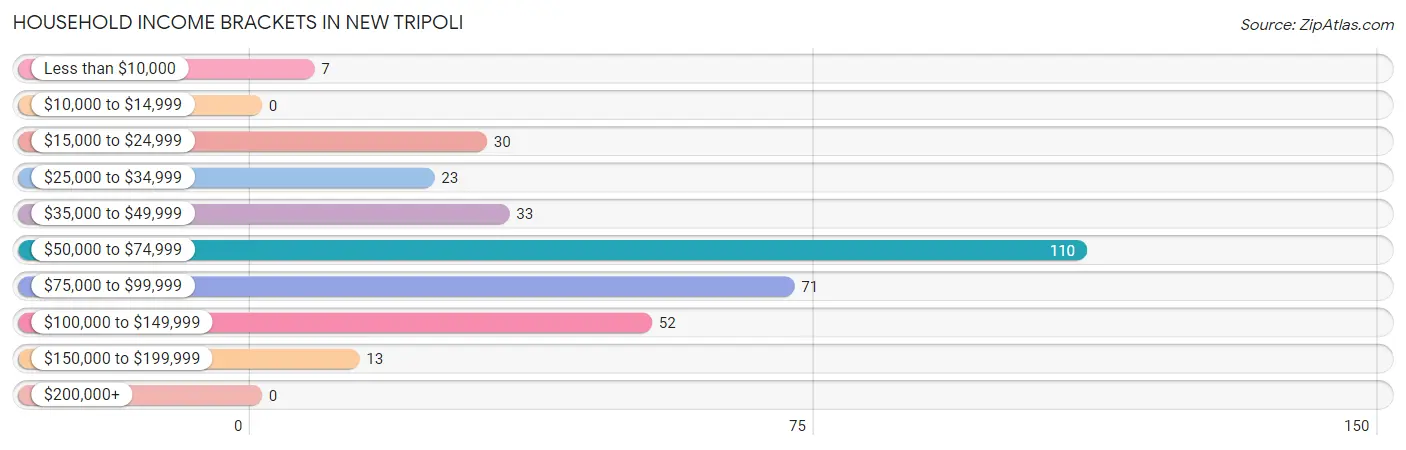
| Income Bracket | # Households | % Households |
| Less than $10,000 | 7 | 2.1% |
| $10,000 to $14,999 | 0 | 0.0% |
| $15,000 to $24,999 | 30 | 8.8% |
| $25,000 to $34,999 | 23 | 6.8% |
| $35,000 to $49,999 | 33 | 9.7% |
| $50,000 to $74,999 | 110 | 32.4% |
| $75,000 to $99,999 | 71 | 20.9% |
| $100,000 to $149,999 | 52 | 15.3% |
| $150,000 to $199,999 | 13 | 3.8% |
| $200,000+ | 0 | 0.0% |
Household Income by Householder Age in New Tripoli
The median household income in New Tripoli is $61,385, with the highest median household income of $77,656 found in the 45 to 64 years age bracket for the primary householder. A total of 89 households (26.3%) fall into this category. Meanwhile, the 15 to 24 years age bracket for the primary householder has the lowest median household income of $0, with 14 households (4.1%) in this group.
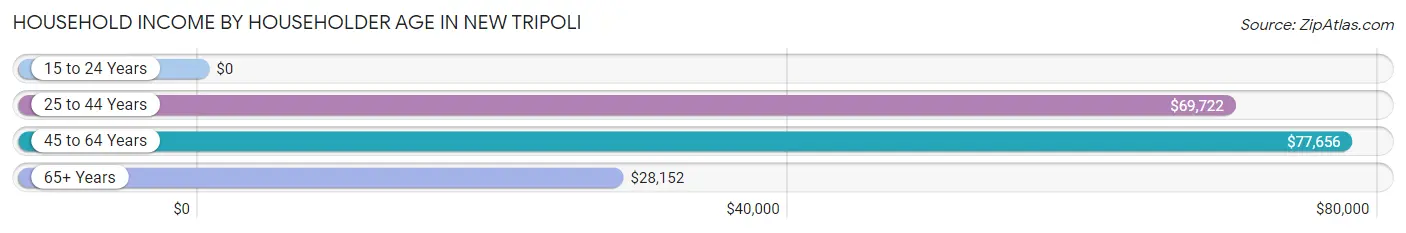
| Income Bracket | # Households | Median Income |
| 15 to 24 Years | 14 (4.1%) | $0 |
| 25 to 44 Years | 160 (47.2%) | $69,722 |
| 45 to 64 Years | 89 (26.3%) | $77,656 |
| 65+ Years | 76 (22.4%) | $28,152 |
| Total | 339 (100.0%) | $61,385 |
Poverty in New Tripoli
Income Below Poverty by Sex and Age in New Tripoli
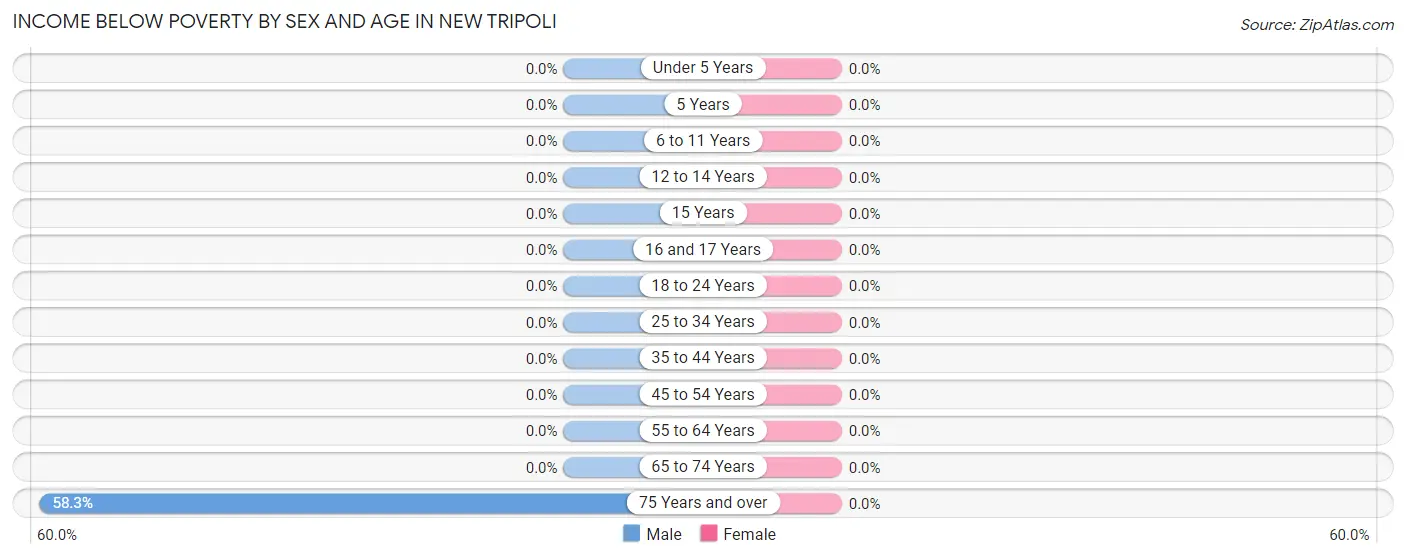
| Age Bracket | Male | Female |
| Under 5 Years | 0 (0.0%) | 0 (0.0%) |
| 5 Years | 0 (0.0%) | 0 (0.0%) |
| 6 to 11 Years | 0 (0.0%) | 0 (0.0%) |
| 12 to 14 Years | 0 (0.0%) | 0 (0.0%) |
| 15 Years | 0 (0.0%) | 0 (0.0%) |
| 16 and 17 Years | 0 (0.0%) | 0 (0.0%) |
| 18 to 24 Years | 0 (0.0%) | 0 (0.0%) |
| 25 to 34 Years | 0 (0.0%) | 0 (0.0%) |
| 35 to 44 Years | 0 (0.0%) | 0 (0.0%) |
| 45 to 54 Years | 0 (0.0%) | 0 (0.0%) |
| 55 to 64 Years | 0 (0.0%) | 0 (0.0%) |
| 65 to 74 Years | 0 (0.0%) | 0 (0.0%) |
| 75 Years and over | 7 (58.3%) | 0 (0.0%) |
| Total | 7 (2.0%) | 0 (0.0%) |
Income Above Poverty by Sex and Age in New Tripoli
According to the poverty statistics in New Tripoli, males aged under 5 years and females aged under 5 years are the age groups that are most secure financially, with 100.0% of males and 100.0% of females in these age groups living above the poverty line.
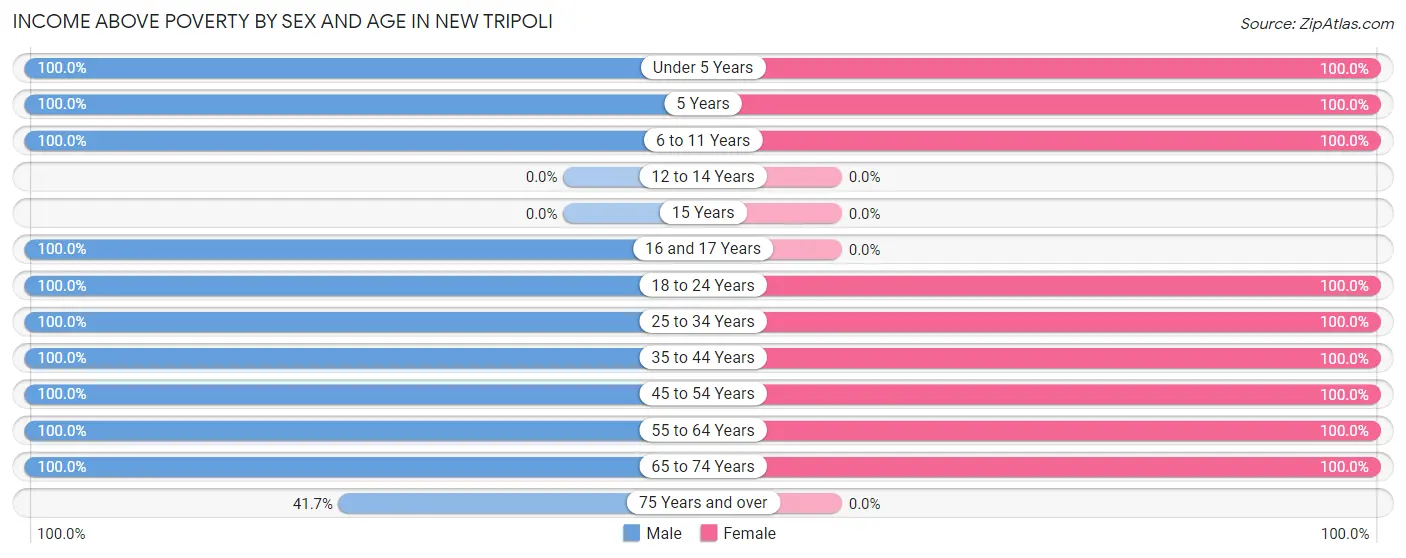
| Age Bracket | Male | Female |
| Under 5 Years | 44 (100.0%) | 55 (100.0%) |
| 5 Years | 17 (100.0%) | 12 (100.0%) |
| 6 to 11 Years | 7 (100.0%) | 4 (100.0%) |
| 12 to 14 Years | 0 (0.0%) | 0 (0.0%) |
| 15 Years | 0 (0.0%) | 0 (0.0%) |
| 16 and 17 Years | 19 (100.0%) | 0 (0.0%) |
| 18 to 24 Years | 9 (100.0%) | 33 (100.0%) |
| 25 to 34 Years | 115 (100.0%) | 59 (100.0%) |
| 35 to 44 Years | 31 (100.0%) | 56 (100.0%) |
| 45 to 54 Years | 18 (100.0%) | 55 (100.0%) |
| 55 to 64 Years | 30 (100.0%) | 28 (100.0%) |
| 65 to 74 Years | 48 (100.0%) | 29 (100.0%) |
| 75 Years and over | 5 (41.7%) | 0 (0.0%) |
| Total | 343 (98.0%) | 331 (100.0%) |
Income Below Poverty Among Married-Couple Families in New Tripoli
| Children | Above Poverty | Below Poverty |
| No Children | 37 (100.0%) | 0 (0.0%) |
| 1 or 2 Children | 47 (100.0%) | 0 (0.0%) |
| 3 or 4 Children | 0 (0.0%) | 0 (0.0%) |
| 5 or more Children | 0 (0.0%) | 0 (0.0%) |
| Total | 84 (100.0%) | 0 (0.0%) |
Income Below Poverty Among Single-Parent Households in New Tripoli
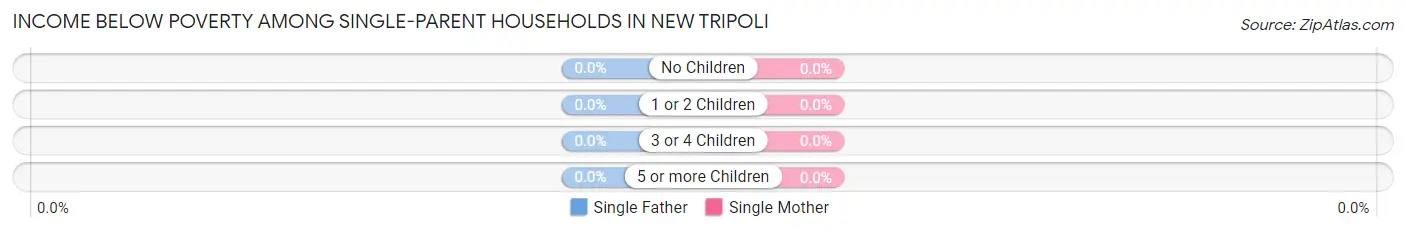
| Children | Single Father | Single Mother |
| No Children | 0 (0.0%) | 0 (0.0%) |
| 1 or 2 Children | 0 (0.0%) | 0 (0.0%) |
| 3 or 4 Children | 0 (0.0%) | 0 (0.0%) |
| 5 or more Children | 0 (0.0%) | 0 (0.0%) |
| Total | 0 (0.0%) | 0 (0.0%) |
Income Below Poverty Among Married-Couple vs Single-Parent Households in New Tripoli
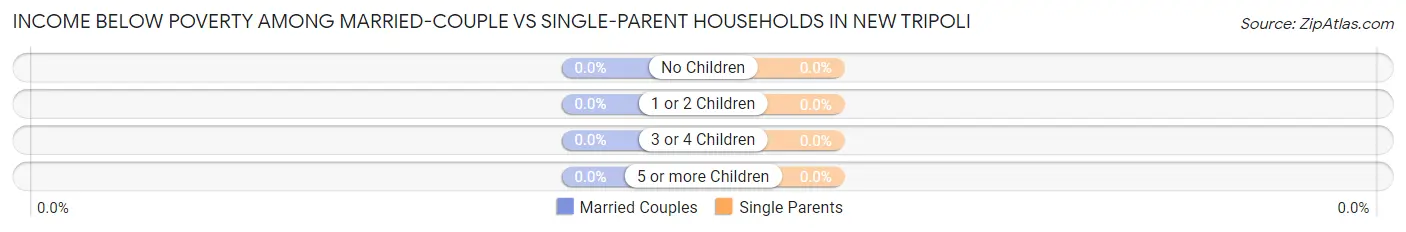
| Children | Married-Couple Families | Single-Parent Households |
| No Children | 0 (0.0%) | 0 (0.0%) |
| 1 or 2 Children | 0 (0.0%) | 0 (0.0%) |
| 3 or 4 Children | 0 (0.0%) | 0 (0.0%) |
| 5 or more Children | 0 (0.0%) | 0 (0.0%) |
| Total | 0 (0.0%) | 0 (0.0%) |
Race in New Tripoli
The most populous races in New Tripoli are White / Caucasian (565 | 83.0%), Two or more Races (93 | 13.7%), and Hispanic or Latino (67 | 9.8%).
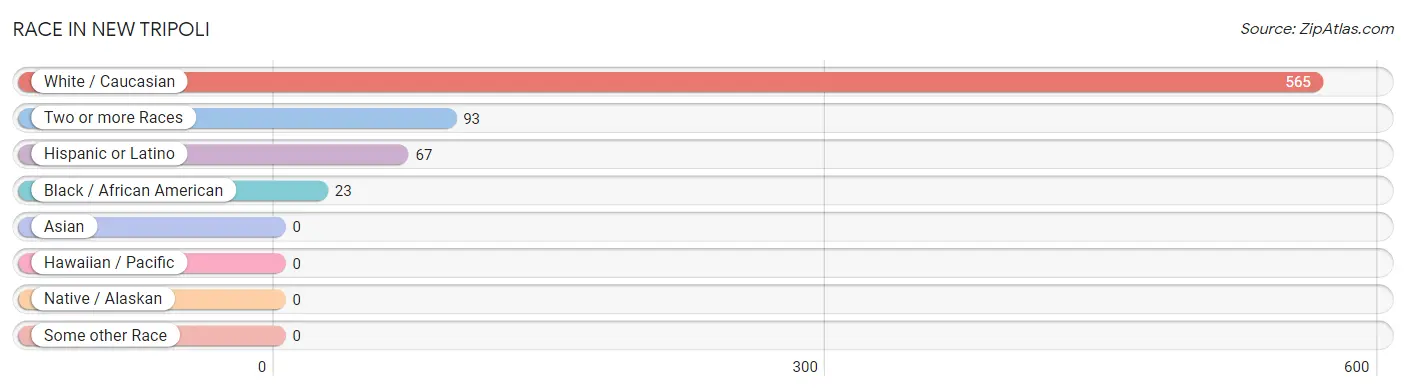
| Race | # Population | % Population |
| Asian | 0 | 0.0% |
| Black / African American | 23 | 3.4% |
| Hawaiian / Pacific | 0 | 0.0% |
| Hispanic or Latino | 67 | 9.8% |
| Native / Alaskan | 0 | 0.0% |
| White / Caucasian | 565 | 83.0% |
| Two or more Races | 93 | 13.7% |
| Some other Race | 0 | 0.0% |
| Total | 681 | 100.0% |
Ancestry in New Tripoli
The most populous ancestries reported in New Tripoli are German (281 | 41.3%), Trinidadian and Tobagonian (93 | 13.7%), Polish (74 | 10.9%), Italian (66 | 9.7%), and Pennsylvania German (53 | 7.8%), together accounting for 83.3% of all New Tripoli residents.
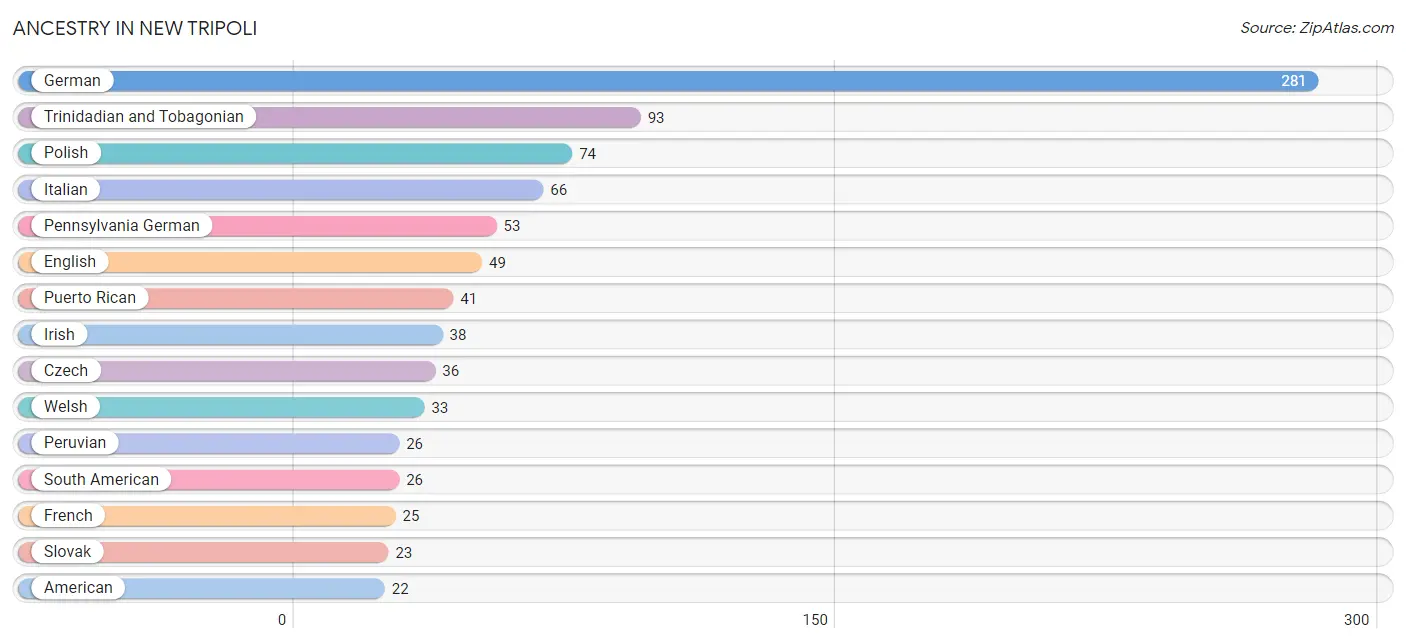
| Ancestry | # Population | % Population |
| American | 22 | 3.2% |
| Czech | 36 | 5.3% |
| Dutch | 7 | 1.0% |
| English | 49 | 7.2% |
| French | 25 | 3.7% |
| German | 281 | 41.3% |
| Irish | 38 | 5.6% |
| Italian | 66 | 9.7% |
| Pennsylvania German | 53 | 7.8% |
| Peruvian | 26 | 3.8% |
| Polish | 74 | 10.9% |
| Portuguese | 22 | 3.2% |
| Puerto Rican | 41 | 6.0% |
| Slovak | 23 | 3.4% |
| South American | 26 | 3.8% |
| Trinidadian and Tobagonian | 93 | 13.7% |
| Welsh | 33 | 4.9% | View All 17 Rows |
Immigrants in New Tripoli

| Immigration Origin | # Population | % Population | View All 0 Rows |
Sex and Age in New Tripoli
Sex and Age in New Tripoli
The most populous age groups in New Tripoli are 30 to 34 Years (76 | 21.7%) for men and Under 5 Years (55 | 16.6%) for women.
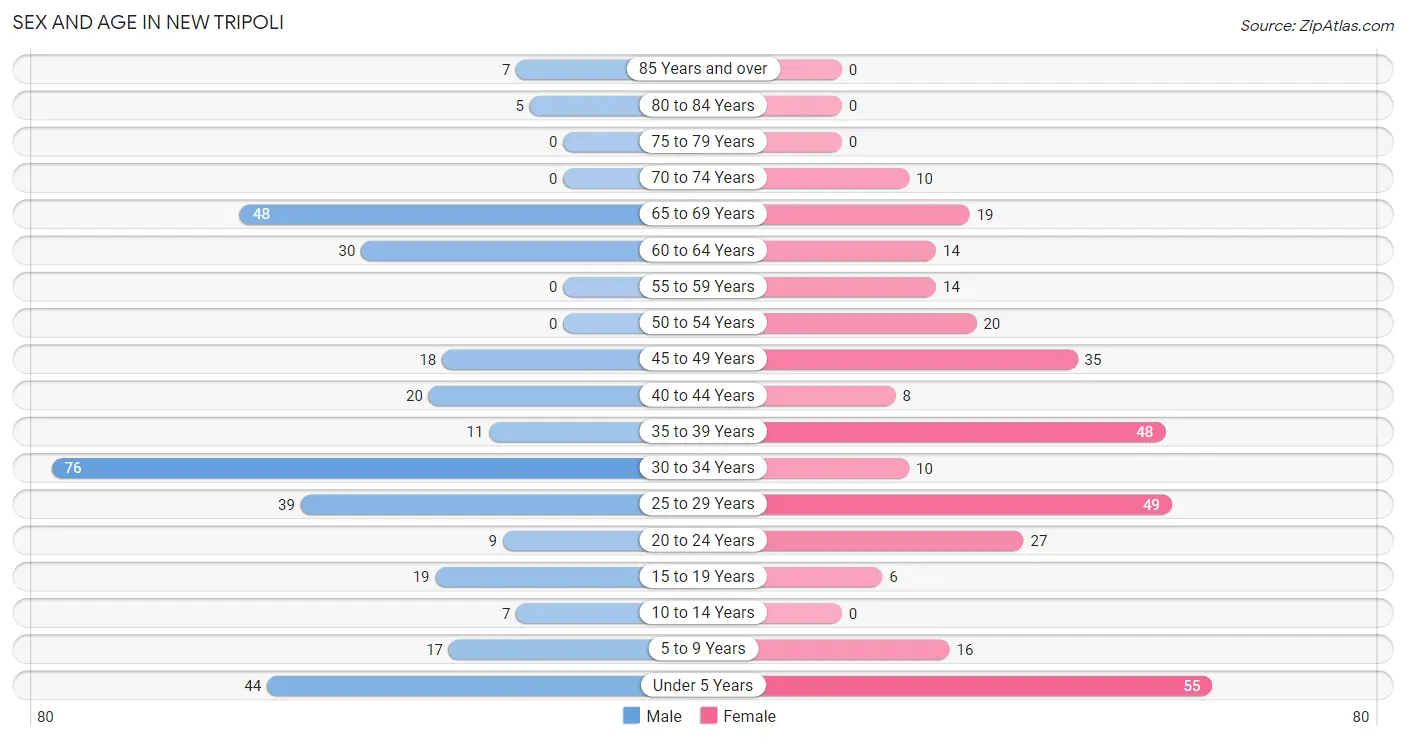
| Age Bracket | Male | Female |
| Under 5 Years | 44 (12.6%) | 55 (16.6%) |
| 5 to 9 Years | 17 (4.9%) | 16 (4.8%) |
| 10 to 14 Years | 7 (2.0%) | 0 (0.0%) |
| 15 to 19 Years | 19 (5.4%) | 6 (1.8%) |
| 20 to 24 Years | 9 (2.6%) | 27 (8.2%) |
| 25 to 29 Years | 39 (11.1%) | 49 (14.8%) |
| 30 to 34 Years | 76 (21.7%) | 10 (3.0%) |
| 35 to 39 Years | 11 (3.1%) | 48 (14.5%) |
| 40 to 44 Years | 20 (5.7%) | 8 (2.4%) |
| 45 to 49 Years | 18 (5.1%) | 35 (10.6%) |
| 50 to 54 Years | 0 (0.0%) | 20 (6.0%) |
| 55 to 59 Years | 0 (0.0%) | 14 (4.2%) |
| 60 to 64 Years | 30 (8.6%) | 14 (4.2%) |
| 65 to 69 Years | 48 (13.7%) | 19 (5.7%) |
| 70 to 74 Years | 0 (0.0%) | 10 (3.0%) |
| 75 to 79 Years | 0 (0.0%) | 0 (0.0%) |
| 80 to 84 Years | 5 (1.4%) | 0 (0.0%) |
| 85 Years and over | 7 (2.0%) | 0 (0.0%) |
| Total | 350 (100.0%) | 331 (100.0%) |
Families and Households in New Tripoli
Median Family Size in New Tripoli
The median family size in New Tripoli is 2.60 persons per family, with married-couple families (84 | 43.8%) accounting for the largest median family size of 2.8 persons per family. On the other hand, single male/father families (39 | 20.3%) represent the smallest median family size with 2.38 persons per family.
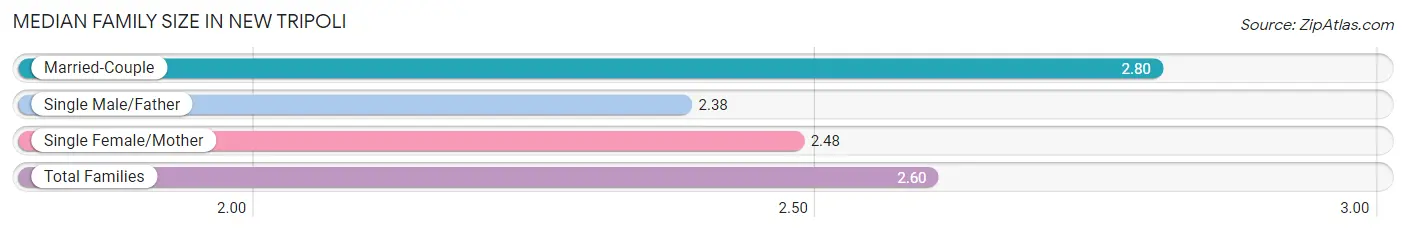
| Family Type | # Families | Family Size |
| Married-Couple | 84 (43.8%) | 2.80 |
| Single Male/Father | 39 (20.3%) | 2.38 |
| Single Female/Mother | 69 (35.9%) | 2.48 |
| Total Families | 192 (100.0%) | 2.60 |
Median Household Size in New Tripoli
The median household size in New Tripoli is 2.01 persons per household, with single male/father households (39 | 11.5%) accounting for the largest median household size of 3.05 persons per household. non-family households (147 | 43.4%) represent the smallest median household size with 1.06 persons per household.
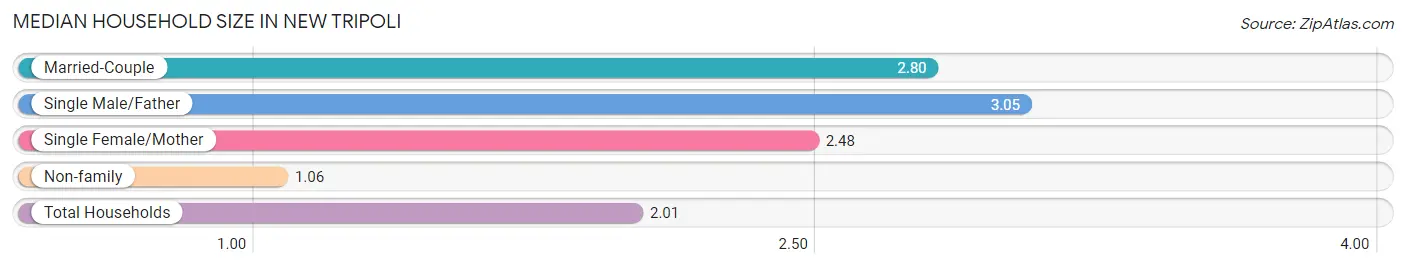
| Household Type | # Households | Household Size |
| Married-Couple | 84 (24.8%) | 2.80 |
| Single Male/Father | 39 (11.5%) | 3.05 |
| Single Female/Mother | 69 (20.3%) | 2.48 |
| Non-family | 147 (43.4%) | 1.06 |
| Total Households | 339 (100.0%) | 2.01 |
Household Size by Marriage Status in New Tripoli
Out of a total of 339 households in New Tripoli, 192 (56.6%) are family households, while 147 (43.4%) are nonfamily households. The most numerous type of family households are 2-person households, comprising 73, and the most common type of nonfamily households are 1-person households, comprising 135.
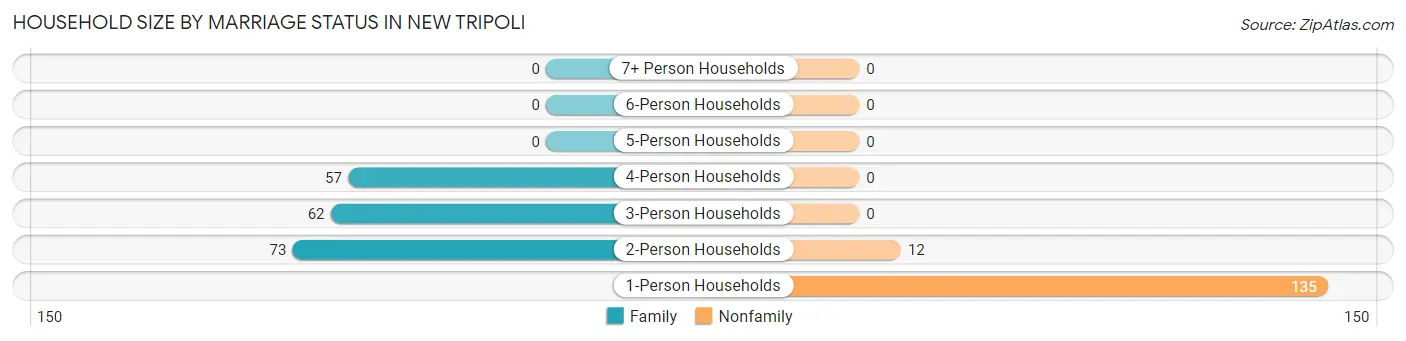
| Household Size | Family Households | Nonfamily Households |
| 1-Person Households | - | 135 (39.8%) |
| 2-Person Households | 73 (21.5%) | 12 (3.5%) |
| 3-Person Households | 62 (18.3%) | 0 (0.0%) |
| 4-Person Households | 57 (16.8%) | 0 (0.0%) |
| 5-Person Households | 0 (0.0%) | 0 (0.0%) |
| 6-Person Households | 0 (0.0%) | 0 (0.0%) |
| 7+ Person Households | 0 (0.0%) | 0 (0.0%) |
| Total | 192 (56.6%) | 147 (43.4%) |
Female Fertility in New Tripoli
Fertility by Age in New Tripoli
Average fertility rate in New Tripoli is 118.0 births per 1,000 women. Women in the age bracket of 35 to 50 years have the highest fertility rate with 223.0 births per 1,000 women. Women in the age bracket of 35 to 50 years acount for 100.0% of all women with births.
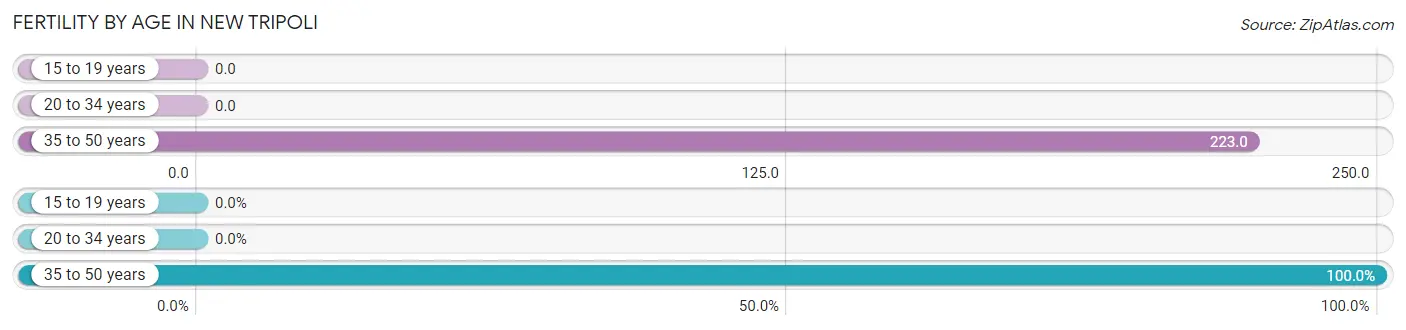
| Age Bracket | Women with Births | Births / 1,000 Women |
| 15 to 19 years | 0 (0.0%) | 0.0 |
| 20 to 34 years | 0 (0.0%) | 0.0 |
| 35 to 50 years | 23 (100.0%) | 223.0 |
| Total | 23 (100.0%) | 118.0 |
Fertility by Age by Marriage Status in New Tripoli
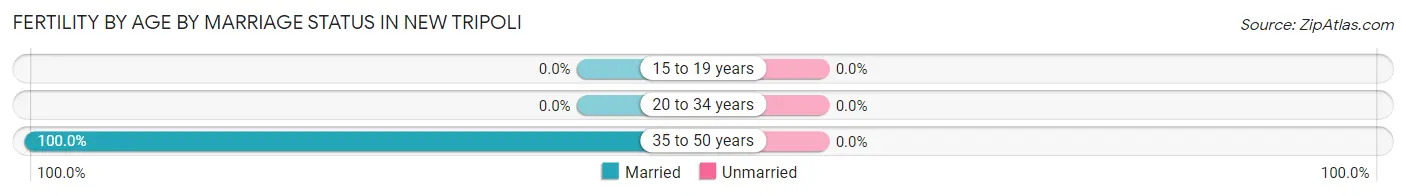
| Age Bracket | Married | Unmarried |
| 15 to 19 years | 0 (0.0%) | 0 (0.0%) |
| 20 to 34 years | 0 (0.0%) | 0 (0.0%) |
| 35 to 50 years | 23 (100.0%) | 0 (0.0%) |
| Total | 23 (100.0%) | 0 (0.0%) |
Fertility by Education in New Tripoli
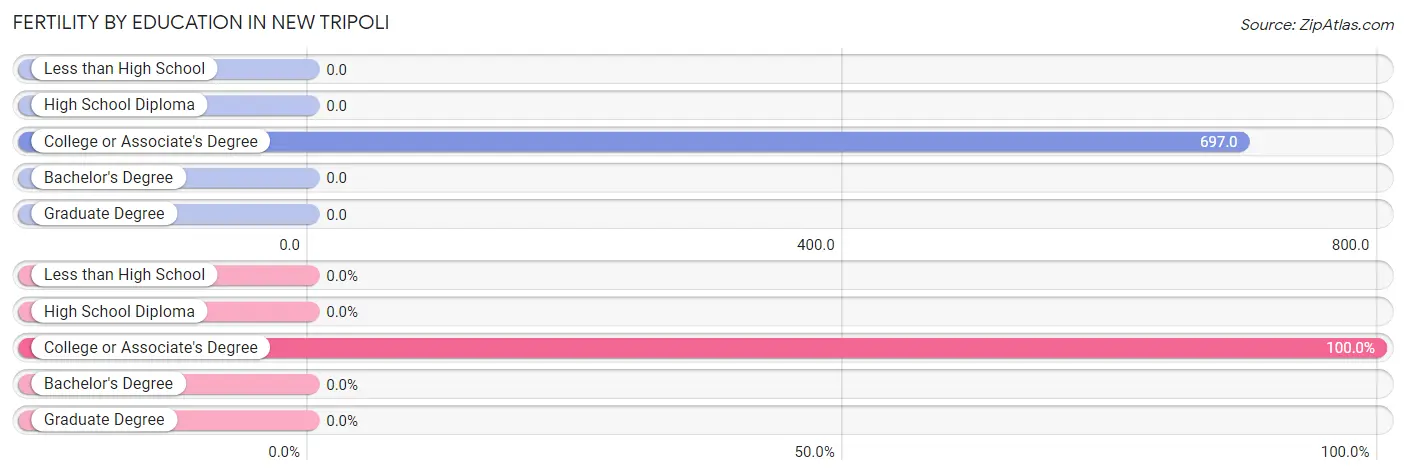
| Educational Attainment | Women with Births | Births / 1,000 Women |
| Less than High School | 0 (0.0%) | 0.0 |
| High School Diploma | 0 (0.0%) | 0.0 |
| College or Associate's Degree | 23 (100.0%) | 697.0 |
| Bachelor's Degree | 0 (0.0%) | 0.0 |
| Graduate Degree | 0 (0.0%) | 0.0 |
| Total | 23 (100.0%) | 118.0 |
Fertility by Education by Marriage Status in New Tripoli
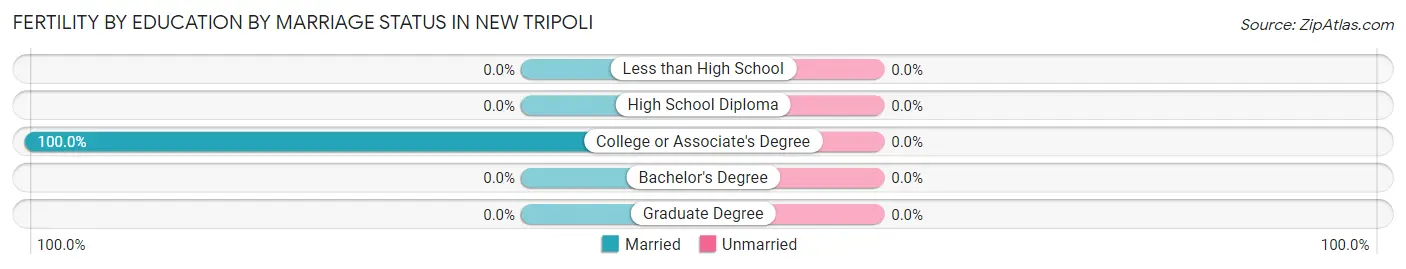
| Educational Attainment | Married | Unmarried |
| Less than High School | 0 (0.0%) | 0 (0.0%) |
| High School Diploma | 0 (0.0%) | 0 (0.0%) |
| College or Associate's Degree | 23 (100.0%) | 0 (0.0%) |
| Bachelor's Degree | 0 (0.0%) | 0 (0.0%) |
| Graduate Degree | 0 (0.0%) | 0 (0.0%) |
| Total | 23 (100.0%) | 0 (0.0%) |
Employment Characteristics in New Tripoli
Employment by Class of Employer in New Tripoli
Among the 436 employed individuals in New Tripoli, private company employees (369 | 84.6%), self-employed (not incorporated) (28 | 6.4%), and not-for-profit organizations (25 | 5.7%) make up the most common classes of employment.
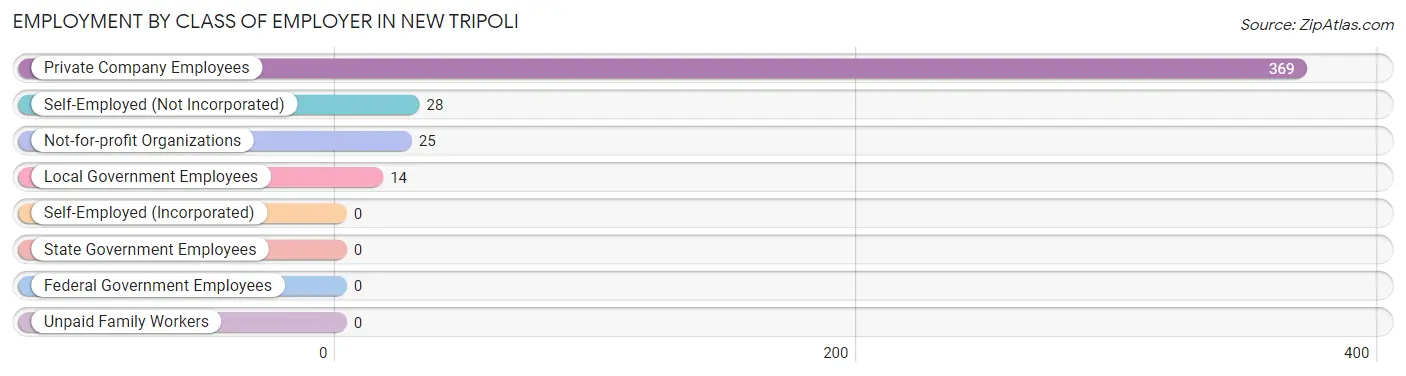
| Employer Class | # Employees | % Employees |
| Private Company Employees | 369 | 84.6% |
| Self-Employed (Incorporated) | 0 | 0.0% |
| Self-Employed (Not Incorporated) | 28 | 6.4% |
| Not-for-profit Organizations | 25 | 5.7% |
| Local Government Employees | 14 | 3.2% |
| State Government Employees | 0 | 0.0% |
| Federal Government Employees | 0 | 0.0% |
| Unpaid Family Workers | 0 | 0.0% |
| Total | 436 | 100.0% |
Employment Status by Age in New Tripoli
According to the labor force statistics for New Tripoli, out of the total population over 16 years of age (542), 82.1% or 445 individuals are in the labor force, with 2.0% or 9 of them unemployed. The age group with the highest labor force participation rate is 16 to 19 years, with 100.0% or 25 individuals in the labor force. Within the labor force, the 20 to 24 years age range has the highest percentage of unemployed individuals, with 29.0% or 9 of them being unemployed.
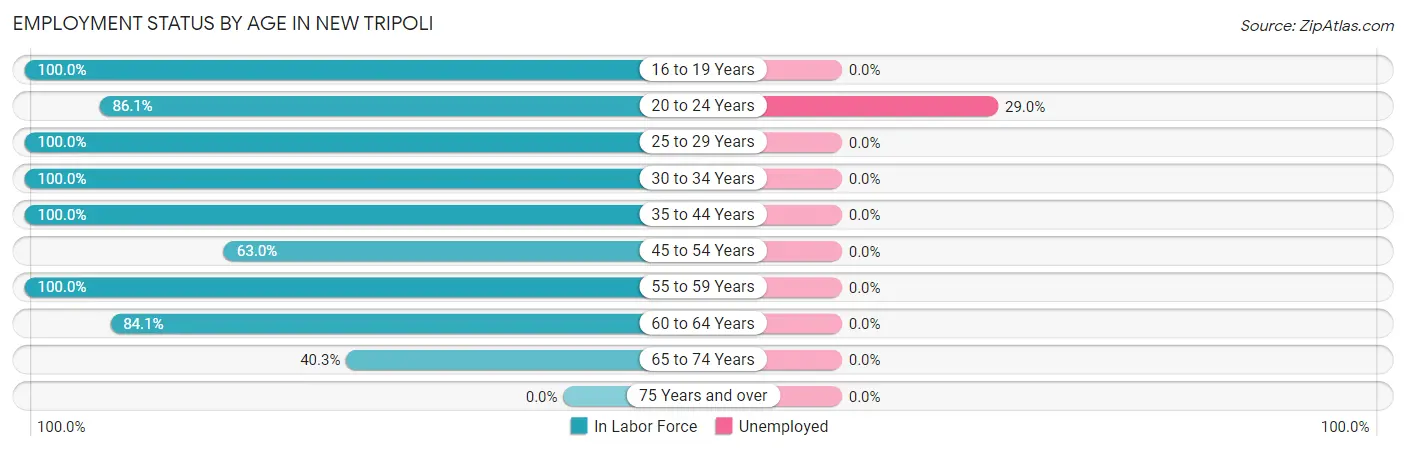
| Age Bracket | In Labor Force | Unemployed |
| 16 to 19 Years | 25 (100.0%) | 0 (0.0%) |
| 20 to 24 Years | 31 (86.1%) | 9 (29.0%) |
| 25 to 29 Years | 88 (100.0%) | 0 (0.0%) |
| 30 to 34 Years | 86 (100.0%) | 0 (0.0%) |
| 35 to 44 Years | 87 (100.0%) | 0 (0.0%) |
| 45 to 54 Years | 46 (63.0%) | 0 (0.0%) |
| 55 to 59 Years | 14 (100.0%) | 0 (0.0%) |
| 60 to 64 Years | 37 (84.1%) | 0 (0.0%) |
| 65 to 74 Years | 31 (40.3%) | 0 (0.0%) |
| 75 Years and over | 0 (0.0%) | 0 (0.0%) |
| Total | 445 (82.1%) | 9 (2.0%) |
Employment Status by Educational Attainment in New Tripoli
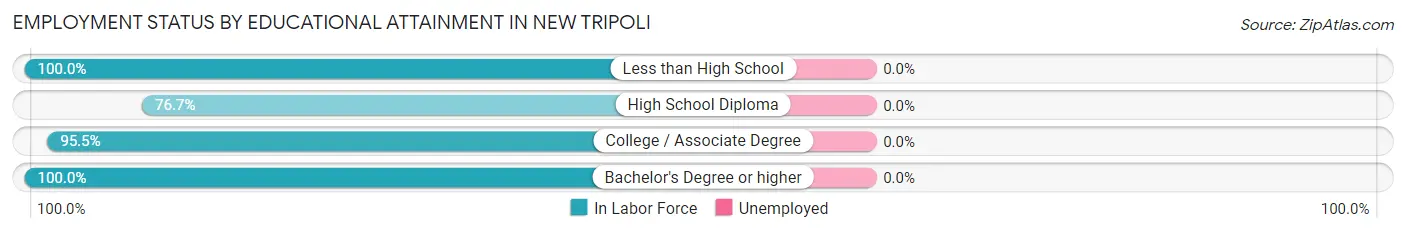
| Educational Attainment | In Labor Force | Unemployed |
| Less than High School | 4 (100.0%) | 0 (0.0%) |
| High School Diploma | 89 (76.7%) | 0 (0.0%) |
| College / Associate Degree | 147 (95.5%) | 0 (0.0%) |
| Bachelor's Degree or higher | 118 (100.0%) | 0 (0.0%) |
| Total | 358 (91.3%) | 0 (0.0%) |
Employment Occupations by Sex in New Tripoli
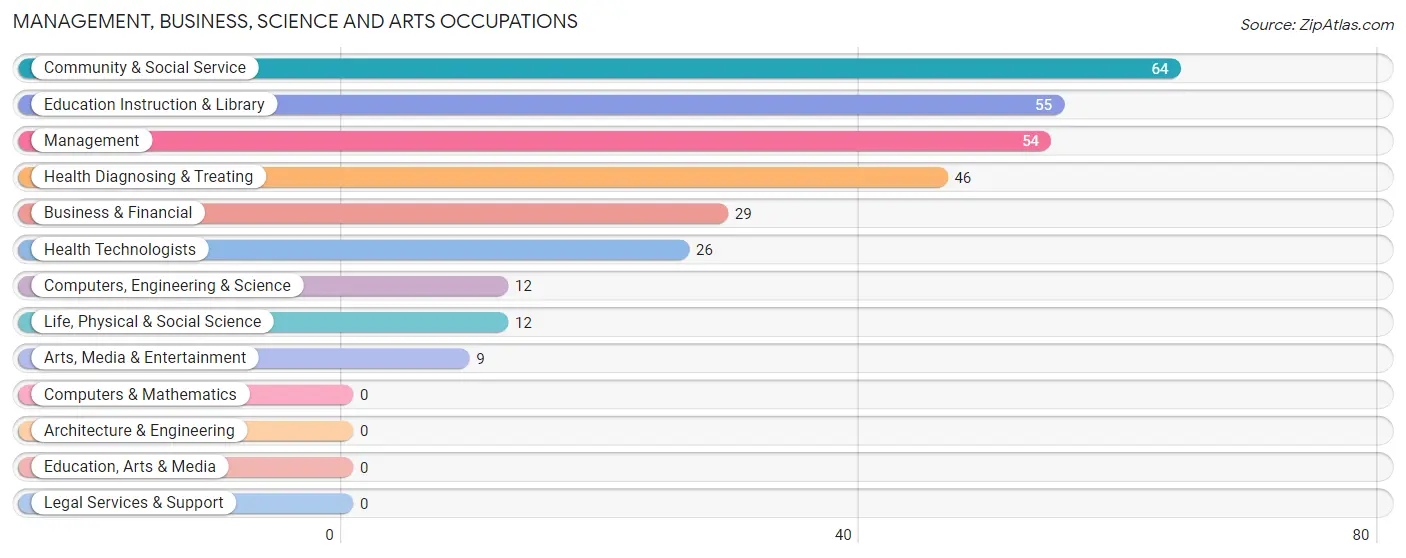
Management, Business, Science and Arts Occupations
The most common Management, Business, Science and Arts occupations in New Tripoli are Community & Social Service (64 | 14.7%), Education Instruction & Library (55 | 12.6%), Management (54 | 12.4%), Health Diagnosing & Treating (46 | 10.5%), and Business & Financial (29 | 6.7%).
Management, Business, Science and Arts Occupations by Sex
Within the Management, Business, Science and Arts occupations in New Tripoli, the most male-oriented occupations are Computers, Engineering & Science (100.0%), Life, Physical & Social Science (100.0%), and Business & Financial (72.4%), while the most female-oriented occupations are Management (100.0%), Arts, Media & Entertainment (100.0%), and Health Diagnosing & Treating (100.0%).
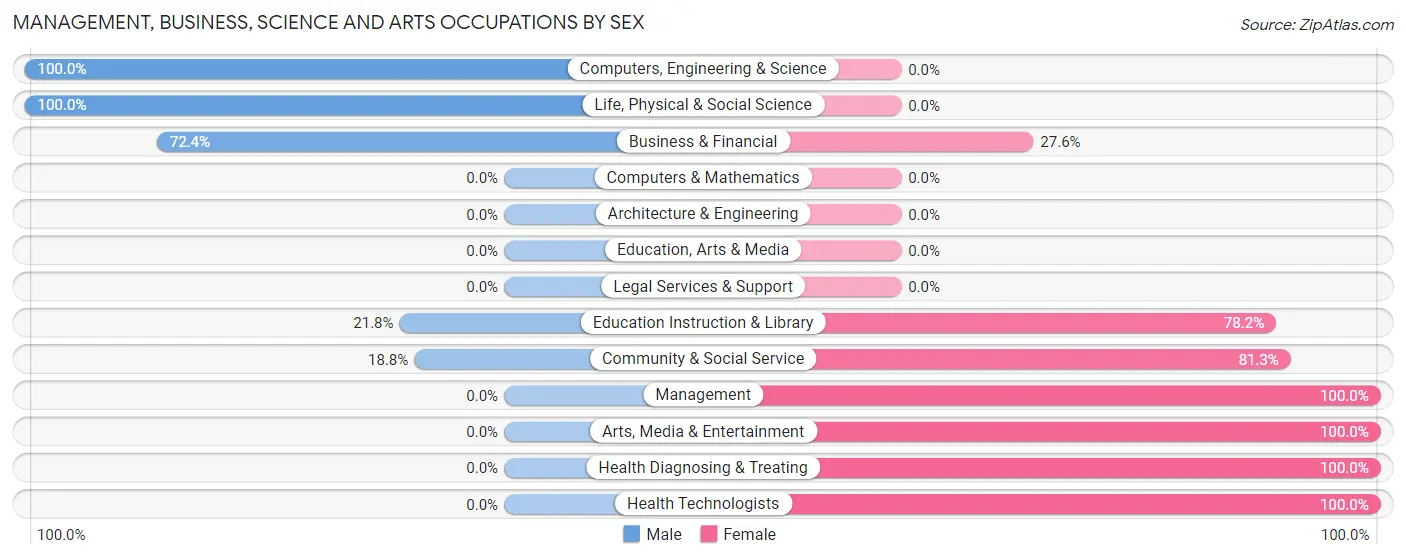
| Occupation | Male | Female |
| Management | 0 (0.0%) | 54 (100.0%) |
| Business & Financial | 21 (72.4%) | 8 (27.6%) |
| Computers, Engineering & Science | 12 (100.0%) | 0 (0.0%) |
| Computers & Mathematics | 0 (0.0%) | 0 (0.0%) |
| Architecture & Engineering | 0 (0.0%) | 0 (0.0%) |
| Life, Physical & Social Science | 12 (100.0%) | 0 (0.0%) |
| Community & Social Service | 12 (18.8%) | 52 (81.2%) |
| Education, Arts & Media | 0 (0.0%) | 0 (0.0%) |
| Legal Services & Support | 0 (0.0%) | 0 (0.0%) |
| Education Instruction & Library | 12 (21.8%) | 43 (78.2%) |
| Arts, Media & Entertainment | 0 (0.0%) | 9 (100.0%) |
| Health Diagnosing & Treating | 0 (0.0%) | 46 (100.0%) |
| Health Technologists | 0 (0.0%) | 26 (100.0%) |
| Total (Category) | 45 (22.0%) | 160 (78.0%) |
| Total (Overall) | 211 (48.4%) | 225 (51.6%) |
Services Occupations
The most common Services occupations in New Tripoli are , and Food Preparation & Serving (8 | 1.8%).
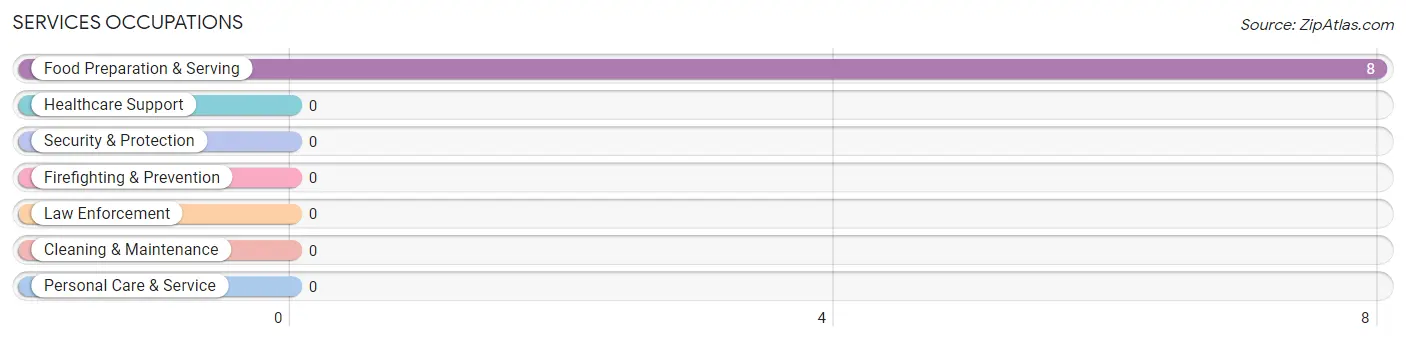
Services Occupations by Sex
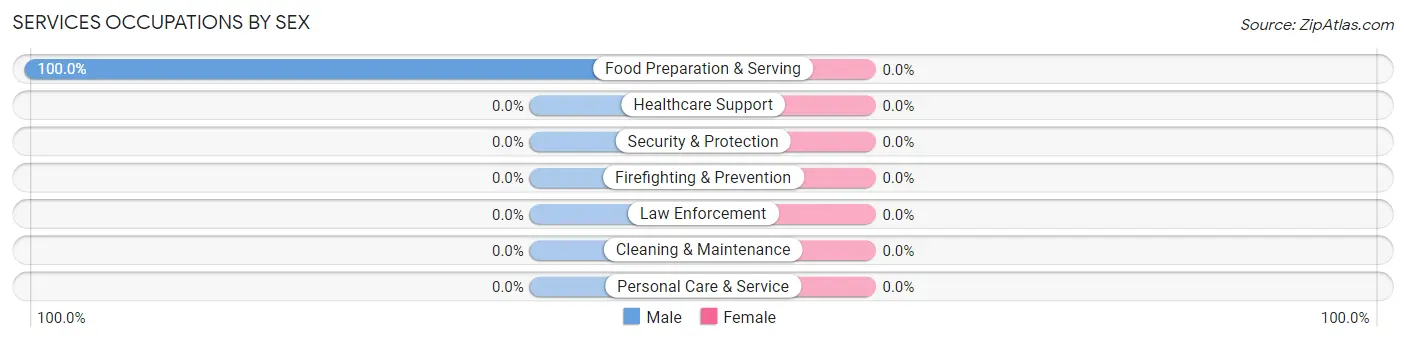
| Occupation | Male | Female |
| Healthcare Support | 0 (0.0%) | 0 (0.0%) |
| Security & Protection | 0 (0.0%) | 0 (0.0%) |
| Firefighting & Prevention | 0 (0.0%) | 0 (0.0%) |
| Law Enforcement | 0 (0.0%) | 0 (0.0%) |
| Food Preparation & Serving | 8 (100.0%) | 0 (0.0%) |
| Cleaning & Maintenance | 0 (0.0%) | 0 (0.0%) |
| Personal Care & Service | 0 (0.0%) | 0 (0.0%) |
| Total (Category) | 8 (100.0%) | 0 (0.0%) |
| Total (Overall) | 211 (48.4%) | 225 (51.6%) |
Sales and Office Occupations
The most common Sales and Office occupations in New Tripoli are Office & Administration (32 | 7.3%), and Sales & Related (30 | 6.9%).
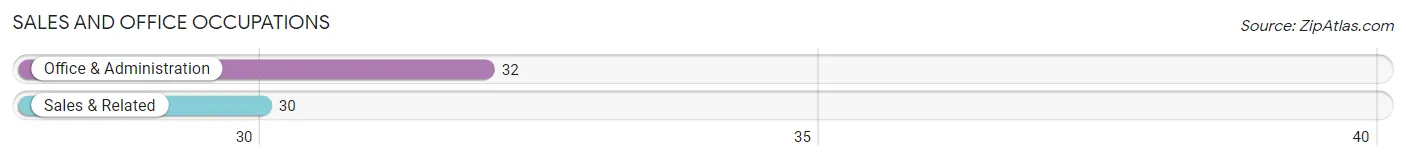
Sales and Office Occupations by Sex
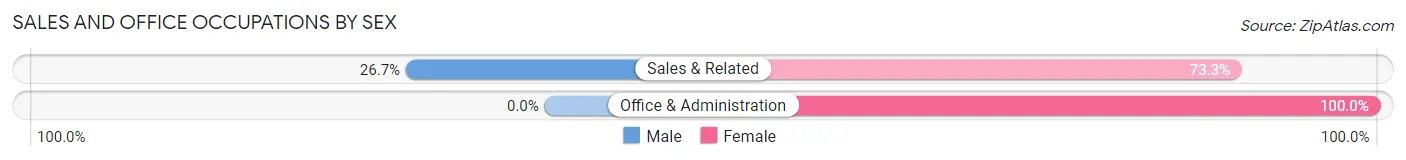
| Occupation | Male | Female |
| Sales & Related | 8 (26.7%) | 22 (73.3%) |
| Office & Administration | 0 (0.0%) | 32 (100.0%) |
| Total (Category) | 8 (12.9%) | 54 (87.1%) |
| Total (Overall) | 211 (48.4%) | 225 (51.6%) |
Natural Resources, Construction and Maintenance Occupations
The most common Natural Resources, Construction and Maintenance occupations in New Tripoli are Construction & Extraction (35 | 8.0%), and Installation, Maintenance & Repair (9 | 2.1%).
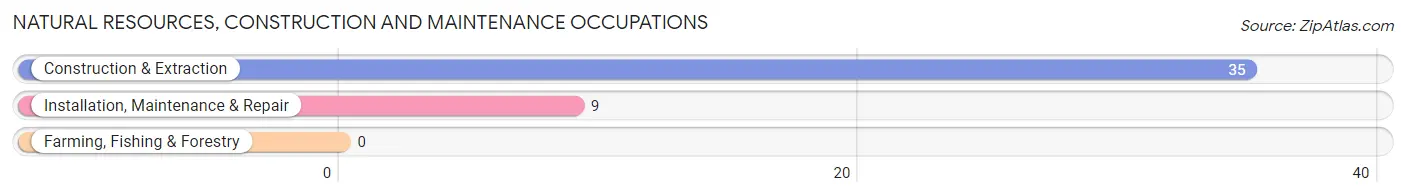
Natural Resources, Construction and Maintenance Occupations by Sex

| Occupation | Male | Female |
| Farming, Fishing & Forestry | 0 (0.0%) | 0 (0.0%) |
| Construction & Extraction | 35 (100.0%) | 0 (0.0%) |
| Installation, Maintenance & Repair | 9 (100.0%) | 0 (0.0%) |
| Total (Category) | 44 (100.0%) | 0 (0.0%) |
| Total (Overall) | 211 (48.4%) | 225 (51.6%) |
Production, Transportation and Moving Occupations
The most common Production, Transportation and Moving occupations in New Tripoli are Material Moving (55 | 12.6%), Production (49 | 11.2%), and Transportation (13 | 3.0%).
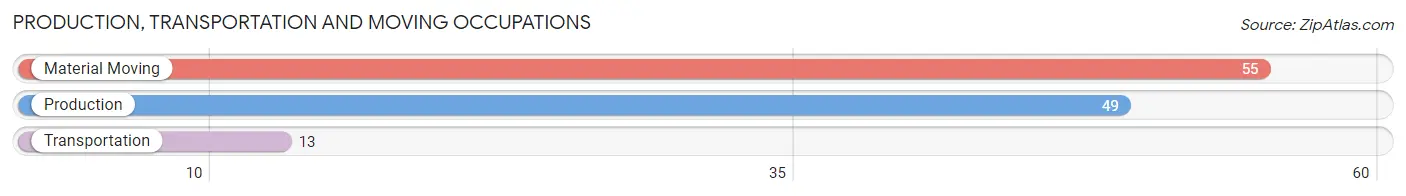
Production, Transportation and Moving Occupations by Sex
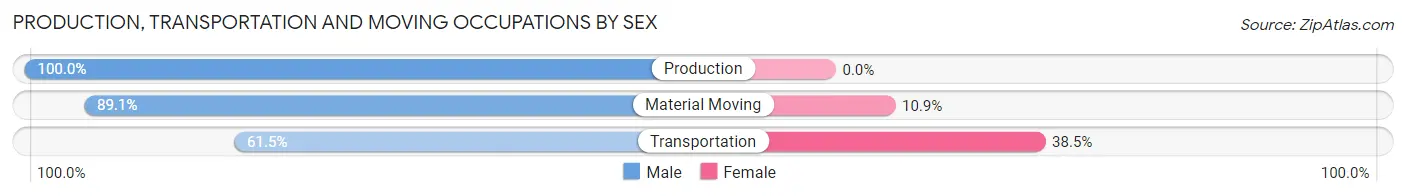
| Occupation | Male | Female |
| Production | 49 (100.0%) | 0 (0.0%) |
| Transportation | 8 (61.5%) | 5 (38.5%) |
| Material Moving | 49 (89.1%) | 6 (10.9%) |
| Total (Category) | 106 (90.6%) | 11 (9.4%) |
| Total (Overall) | 211 (48.4%) | 225 (51.6%) |
Employment Industries by Sex in New Tripoli
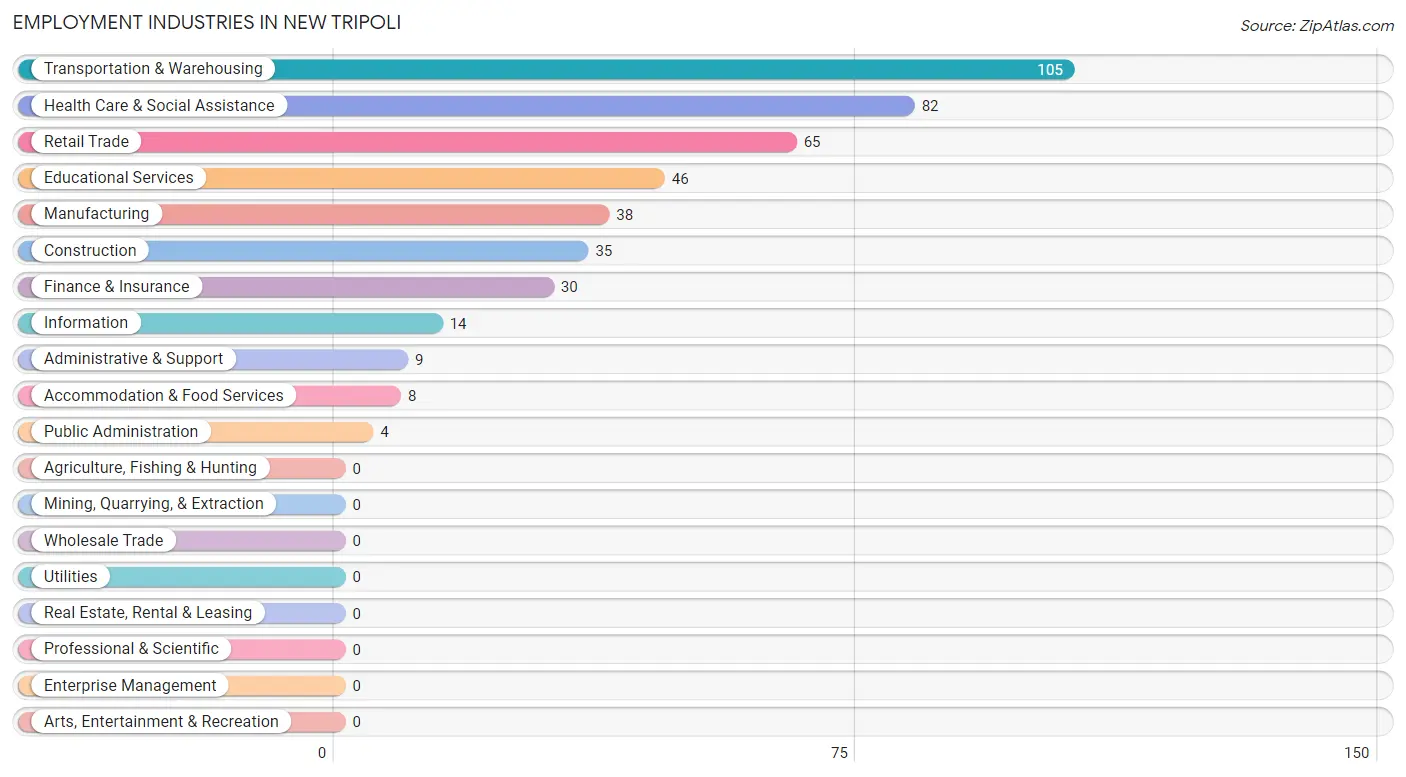
Employment Industries in New Tripoli
The major employment industries in New Tripoli include Transportation & Warehousing (105 | 24.1%), Health Care & Social Assistance (82 | 18.8%), Retail Trade (65 | 14.9%), Educational Services (46 | 10.5%), and Manufacturing (38 | 8.7%).
Employment Industries by Sex in New Tripoli
The New Tripoli industries that see more men than women are Construction (100.0%), Accommodation & Food Services (100.0%), and Transportation & Warehousing (95.2%), whereas the industries that tend to have a higher number of women are Information (100.0%), Finance & Insurance (100.0%), and Administrative & Support (100.0%).
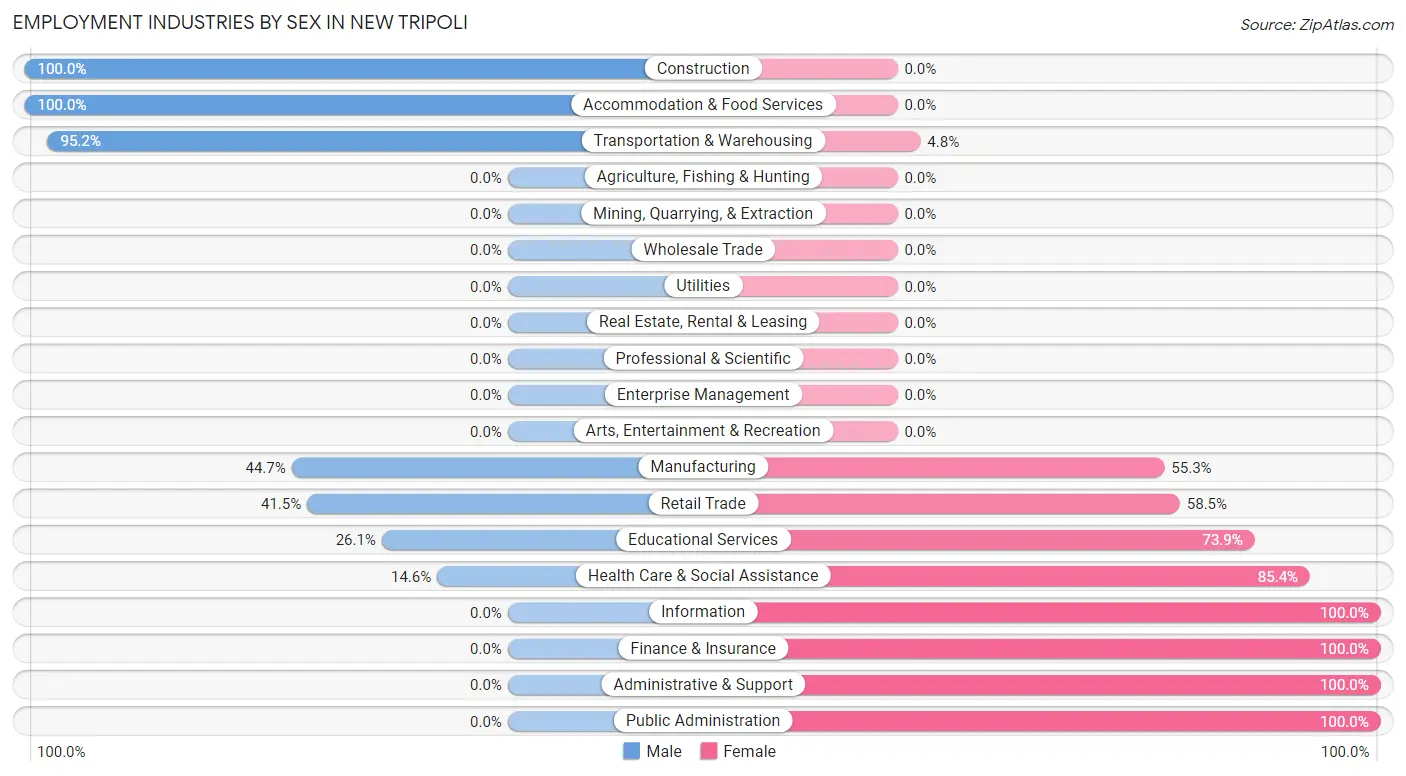
| Industry | Male | Female |
| Agriculture, Fishing & Hunting | 0 (0.0%) | 0 (0.0%) |
| Mining, Quarrying, & Extraction | 0 (0.0%) | 0 (0.0%) |
| Construction | 35 (100.0%) | 0 (0.0%) |
| Manufacturing | 17 (44.7%) | 21 (55.3%) |
| Wholesale Trade | 0 (0.0%) | 0 (0.0%) |
| Retail Trade | 27 (41.5%) | 38 (58.5%) |
| Transportation & Warehousing | 100 (95.2%) | 5 (4.8%) |
| Utilities | 0 (0.0%) | 0 (0.0%) |
| Information | 0 (0.0%) | 14 (100.0%) |
| Finance & Insurance | 0 (0.0%) | 30 (100.0%) |
| Real Estate, Rental & Leasing | 0 (0.0%) | 0 (0.0%) |
| Professional & Scientific | 0 (0.0%) | 0 (0.0%) |
| Enterprise Management | 0 (0.0%) | 0 (0.0%) |
| Administrative & Support | 0 (0.0%) | 9 (100.0%) |
| Educational Services | 12 (26.1%) | 34 (73.9%) |
| Health Care & Social Assistance | 12 (14.6%) | 70 (85.4%) |
| Arts, Entertainment & Recreation | 0 (0.0%) | 0 (0.0%) |
| Accommodation & Food Services | 8 (100.0%) | 0 (0.0%) |
| Public Administration | 0 (0.0%) | 4 (100.0%) |
| Total | 211 (48.4%) | 225 (51.6%) |
Education in New Tripoli
School Enrollment in New Tripoli
The most common levels of schooling among the 96 students in New Tripoli are nursery / preschool (29 | 30.2%), high school (22 | 22.9%), and college / undergraduate (20 | 20.8%).
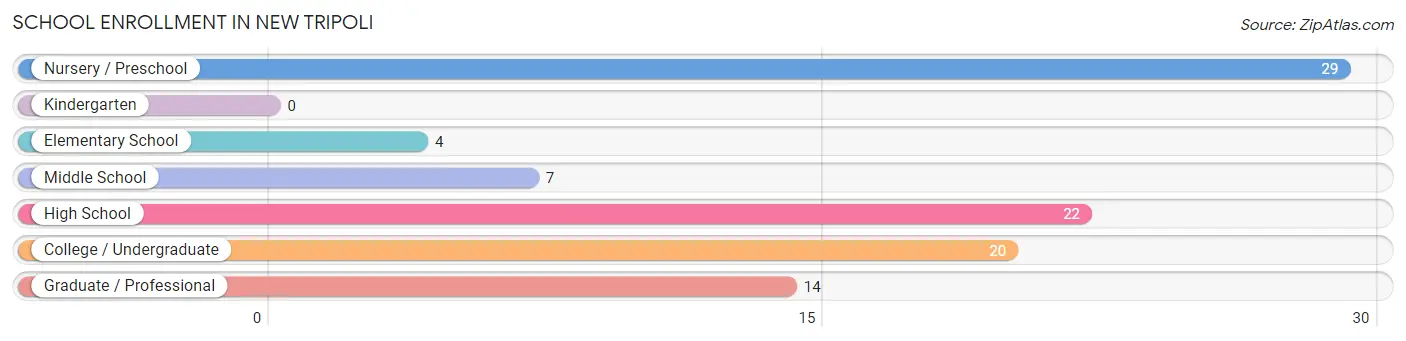
| School Level | # Students | % Students |
| Nursery / Preschool | 29 | 30.2% |
| Kindergarten | 0 | 0.0% |
| Elementary School | 4 | 4.2% |
| Middle School | 7 | 7.3% |
| High School | 22 | 22.9% |
| College / Undergraduate | 20 | 20.8% |
| Graduate / Professional | 14 | 14.6% |
| Total | 96 | 100.0% |
School Enrollment by Age by Funding Source in New Tripoli
Out of a total of 96 students who are enrolled in schools in New Tripoli, 46 (47.9%) attend a private institution, while the remaining 50 (52.1%) are enrolled in public schools. The age group of 18 to 19 year olds has the highest likelihood of being enrolled in private schools, with 3 (100.0% in the age bracket) enrolled. Conversely, the age group of 10 to 14 year olds has the lowest likelihood of being enrolled in a private school, with 7 (100.0% in the age bracket) attending a public institution.
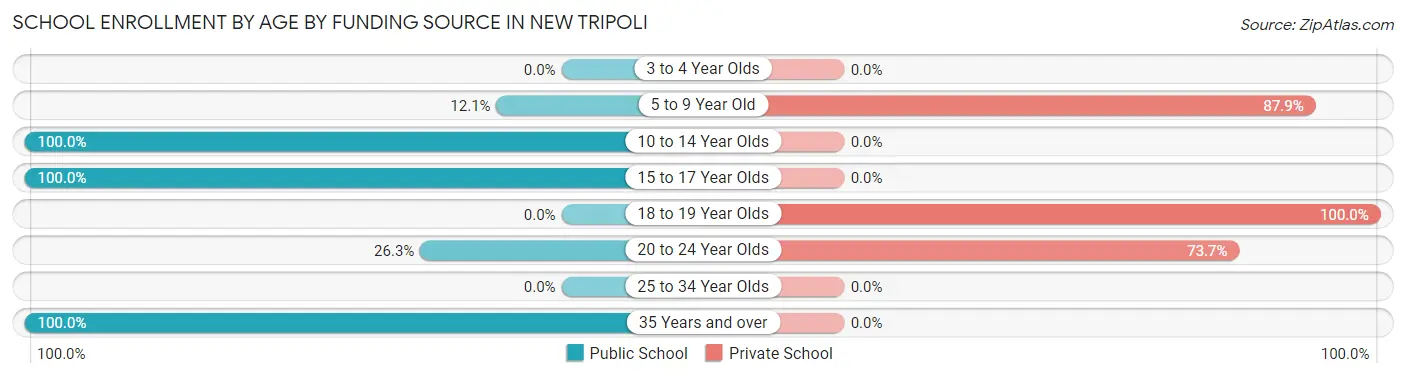
| Age Bracket | Public School | Private School |
| 3 to 4 Year Olds | 0 (0.0%) | 0 (0.0%) |
| 5 to 9 Year Old | 4 (12.1%) | 29 (87.9%) |
| 10 to 14 Year Olds | 7 (100.0%) | 0 (0.0%) |
| 15 to 17 Year Olds | 19 (100.0%) | 0 (0.0%) |
| 18 to 19 Year Olds | 0 (0.0%) | 3 (100.0%) |
| 20 to 24 Year Olds | 5 (26.3%) | 14 (73.7%) |
| 25 to 34 Year Olds | 0 (0.0%) | 0 (0.0%) |
| 35 Years and over | 15 (100.0%) | 0 (0.0%) |
| Total | 50 (52.1%) | 46 (47.9%) |
Educational Attainment by Field of Study in New Tripoli
Business (41 | 30.1%), education (32 | 23.5%), psychology (24 | 17.6%), science & technology (14 | 10.3%), and arts & humanities (9 | 6.6%) are the most common fields of study among 136 individuals in New Tripoli who have obtained a bachelor's degree or higher.
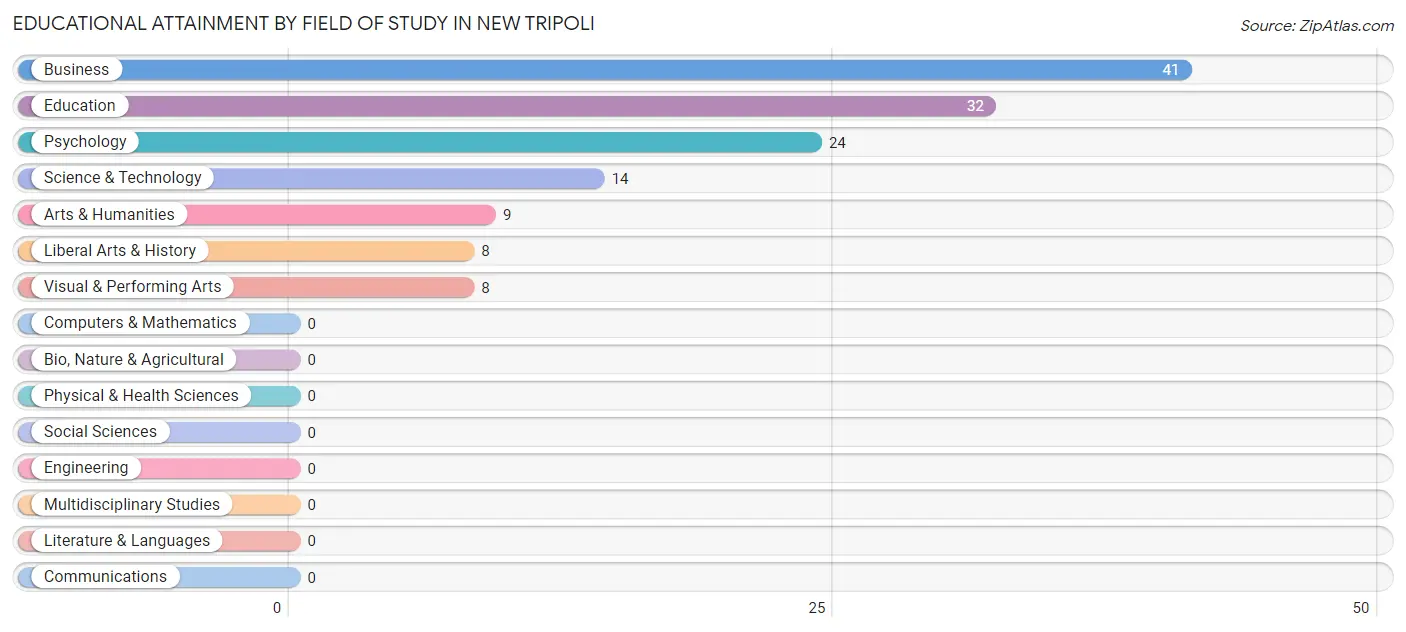
| Field of Study | # Graduates | % Graduates |
| Computers & Mathematics | 0 | 0.0% |
| Bio, Nature & Agricultural | 0 | 0.0% |
| Physical & Health Sciences | 0 | 0.0% |
| Psychology | 24 | 17.6% |
| Social Sciences | 0 | 0.0% |
| Engineering | 0 | 0.0% |
| Multidisciplinary Studies | 0 | 0.0% |
| Science & Technology | 14 | 10.3% |
| Business | 41 | 30.1% |
| Education | 32 | 23.5% |
| Literature & Languages | 0 | 0.0% |
| Liberal Arts & History | 8 | 5.9% |
| Visual & Performing Arts | 8 | 5.9% |
| Communications | 0 | 0.0% |
| Arts & Humanities | 9 | 6.6% |
| Total | 136 | 100.0% |
Transportation & Commute in New Tripoli
Vehicle Availability by Sex in New Tripoli
The most prevalent vehicle ownership categories in New Tripoli are males with 2 vehicles (90, accounting for 42.6%) and females with 2 vehicles (110, making up 40.0%).
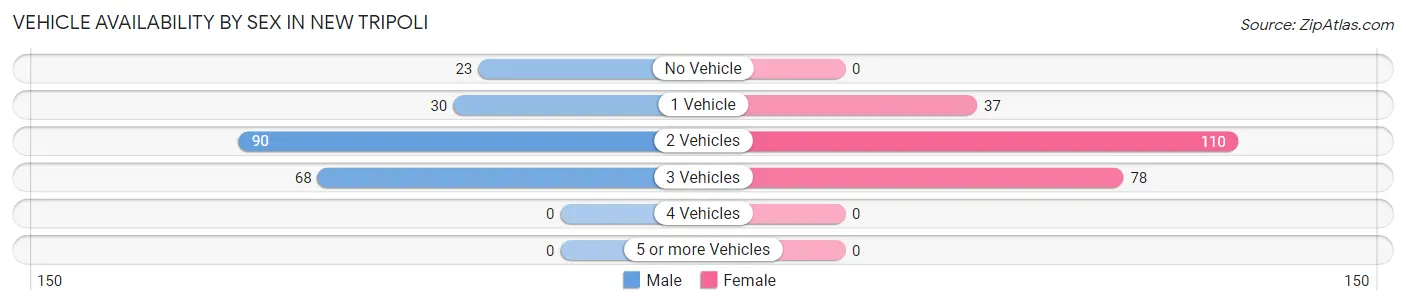
| Vehicles Available | Male | Female |
| No Vehicle | 23 (10.9%) | 0 (0.0%) |
| 1 Vehicle | 30 (14.2%) | 37 (16.4%) |
| 2 Vehicles | 90 (42.6%) | 110 (48.9%) |
| 3 Vehicles | 68 (32.2%) | 78 (34.7%) |
| 4 Vehicles | 0 (0.0%) | 0 (0.0%) |
| 5 or more Vehicles | 0 (0.0%) | 0 (0.0%) |
| Total | 211 (100.0%) | 225 (100.0%) |
Commute Time in New Tripoli
The most frequently occuring commute durations in New Tripoli are 30 to 34 minutes (115 commuters, 29.4%), 45 to 59 minutes (73 commuters, 18.7%), and 20 to 24 minutes (53 commuters, 13.6%).
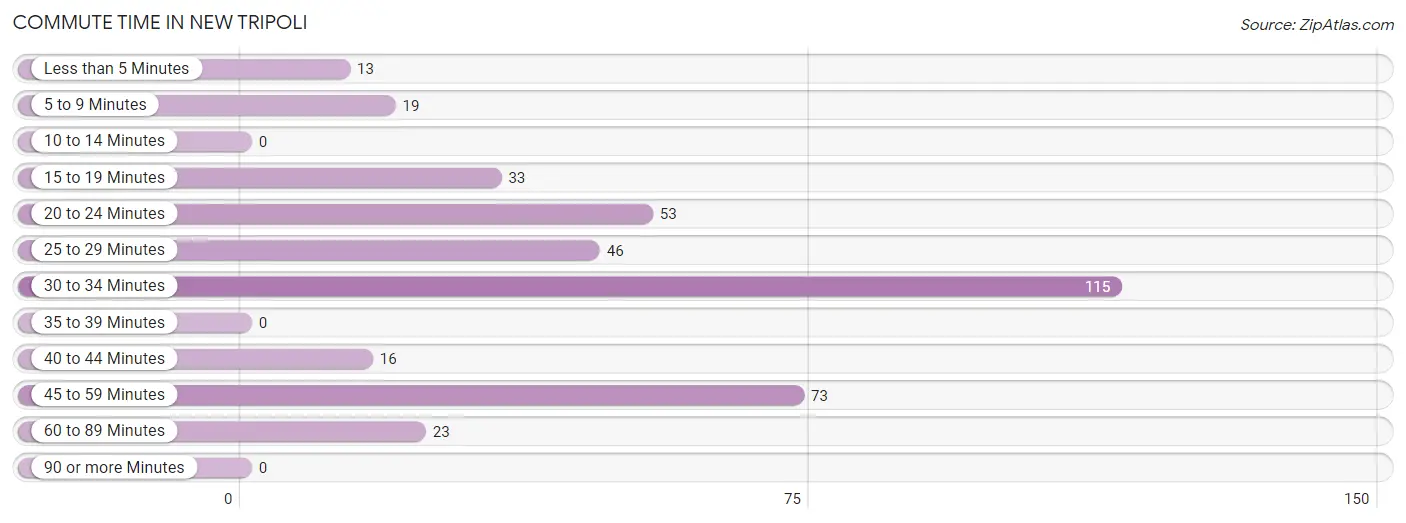
| Commute Time | # Commuters | % Commuters |
| Less than 5 Minutes | 13 | 3.3% |
| 5 to 9 Minutes | 19 | 4.9% |
| 10 to 14 Minutes | 0 | 0.0% |
| 15 to 19 Minutes | 33 | 8.4% |
| 20 to 24 Minutes | 53 | 13.6% |
| 25 to 29 Minutes | 46 | 11.8% |
| 30 to 34 Minutes | 115 | 29.4% |
| 35 to 39 Minutes | 0 | 0.0% |
| 40 to 44 Minutes | 16 | 4.1% |
| 45 to 59 Minutes | 73 | 18.7% |
| 60 to 89 Minutes | 23 | 5.9% |
| 90 or more Minutes | 0 | 0.0% |
Commute Time by Sex in New Tripoli
The most common commute times in New Tripoli are 45 to 59 minutes (51 commuters, 24.2%) for males and 30 to 34 minutes (86 commuters, 47.8%) for females.
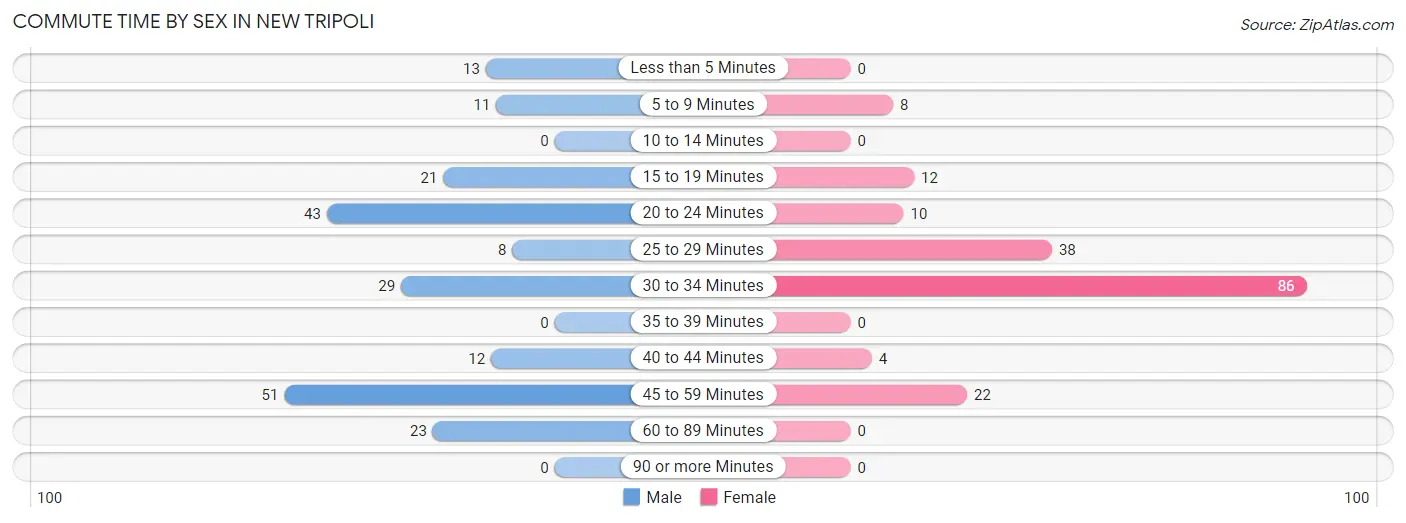
| Commute Time | Male | Female |
| Less than 5 Minutes | 13 (6.2%) | 0 (0.0%) |
| 5 to 9 Minutes | 11 (5.2%) | 8 (4.4%) |
| 10 to 14 Minutes | 0 (0.0%) | 0 (0.0%) |
| 15 to 19 Minutes | 21 (10.0%) | 12 (6.7%) |
| 20 to 24 Minutes | 43 (20.4%) | 10 (5.6%) |
| 25 to 29 Minutes | 8 (3.8%) | 38 (21.1%) |
| 30 to 34 Minutes | 29 (13.7%) | 86 (47.8%) |
| 35 to 39 Minutes | 0 (0.0%) | 0 (0.0%) |
| 40 to 44 Minutes | 12 (5.7%) | 4 (2.2%) |
| 45 to 59 Minutes | 51 (24.2%) | 22 (12.2%) |
| 60 to 89 Minutes | 23 (10.9%) | 0 (0.0%) |
| 90 or more Minutes | 0 (0.0%) | 0 (0.0%) |
Time of Departure to Work by Sex in New Tripoli
The most frequent times of departure to work in New Tripoli are 7:00 AM to 7:29 AM (79, 37.4%) for males and 6:30 AM to 6:59 AM (57, 31.7%) for females.
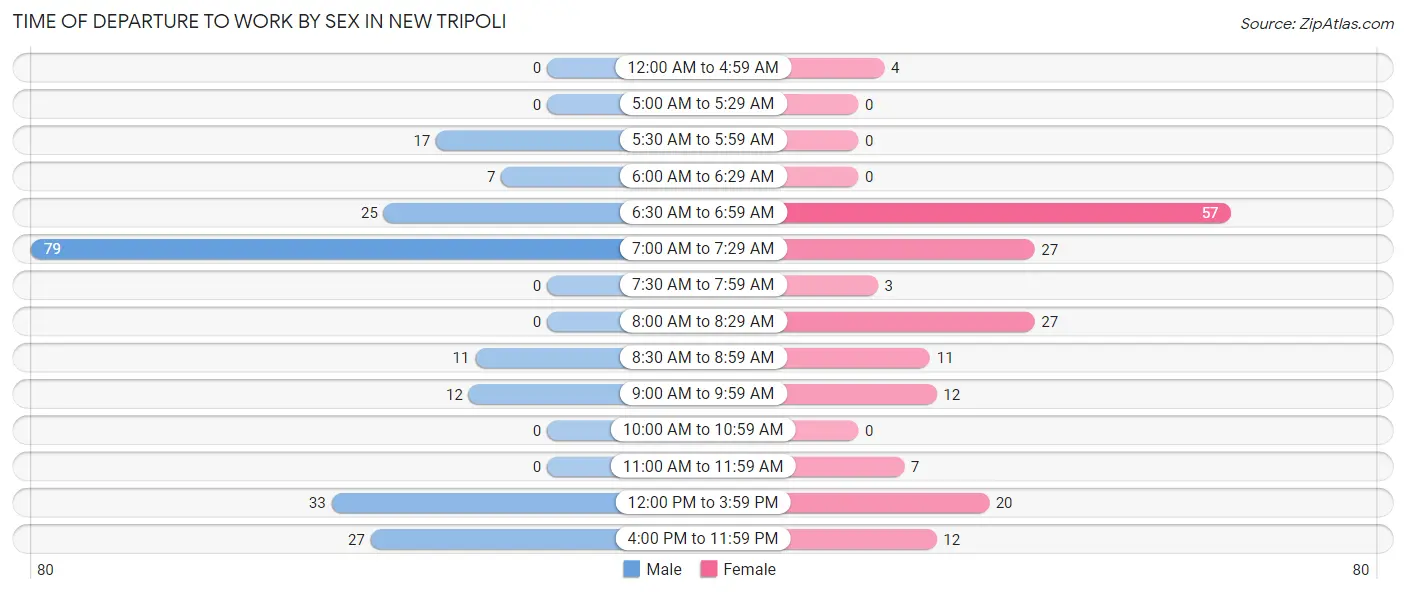
| Time of Departure | Male | Female |
| 12:00 AM to 4:59 AM | 0 (0.0%) | 4 (2.2%) |
| 5:00 AM to 5:29 AM | 0 (0.0%) | 0 (0.0%) |
| 5:30 AM to 5:59 AM | 17 (8.1%) | 0 (0.0%) |
| 6:00 AM to 6:29 AM | 7 (3.3%) | 0 (0.0%) |
| 6:30 AM to 6:59 AM | 25 (11.8%) | 57 (31.7%) |
| 7:00 AM to 7:29 AM | 79 (37.4%) | 27 (15.0%) |
| 7:30 AM to 7:59 AM | 0 (0.0%) | 3 (1.7%) |
| 8:00 AM to 8:29 AM | 0 (0.0%) | 27 (15.0%) |
| 8:30 AM to 8:59 AM | 11 (5.2%) | 11 (6.1%) |
| 9:00 AM to 9:59 AM | 12 (5.7%) | 12 (6.7%) |
| 10:00 AM to 10:59 AM | 0 (0.0%) | 0 (0.0%) |
| 11:00 AM to 11:59 AM | 0 (0.0%) | 7 (3.9%) |
| 12:00 PM to 3:59 PM | 33 (15.6%) | 20 (11.1%) |
| 4:00 PM to 11:59 PM | 27 (12.8%) | 12 (6.7%) |
| Total | 211 (100.0%) | 180 (100.0%) |
Housing Occupancy in New Tripoli
Occupancy by Ownership in New Tripoli
Of the total 339 dwellings in New Tripoli, owner-occupied units account for 235 (69.3%), while renter-occupied units make up 104 (30.7%).
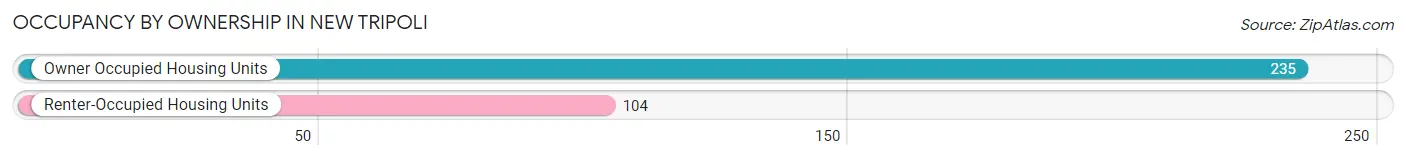
| Occupancy | # Housing Units | % Housing Units |
| Owner Occupied Housing Units | 235 | 69.3% |
| Renter-Occupied Housing Units | 104 | 30.7% |
| Total Occupied Housing Units | 339 | 100.0% |
Occupancy by Household Size in New Tripoli
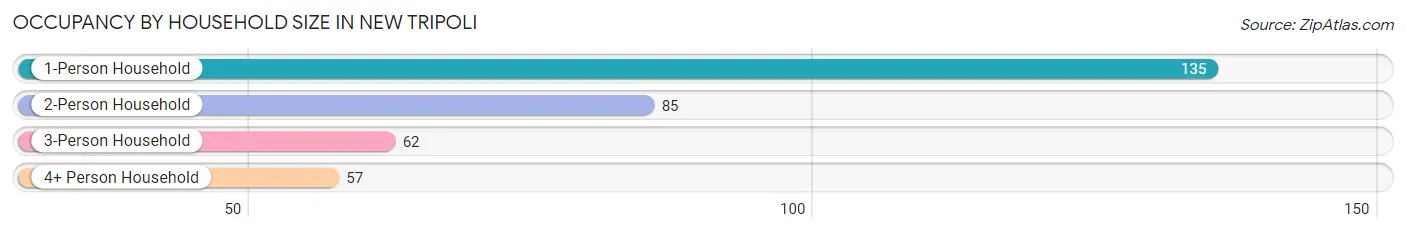
| Household Size | # Housing Units | % Housing Units |
| 1-Person Household | 135 | 39.8% |
| 2-Person Household | 85 | 25.1% |
| 3-Person Household | 62 | 18.3% |
| 4+ Person Household | 57 | 16.8% |
| Total Housing Units | 339 | 100.0% |
Occupancy by Ownership by Household Size in New Tripoli
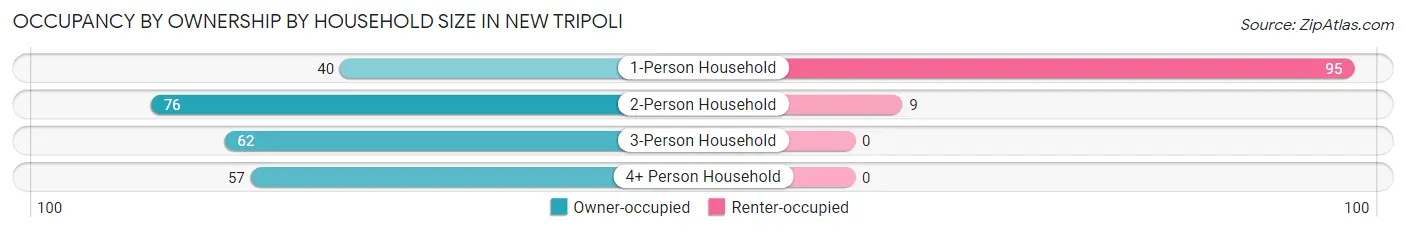
| Household Size | Owner-occupied | Renter-occupied |
| 1-Person Household | 40 (29.6%) | 95 (70.4%) |
| 2-Person Household | 76 (89.4%) | 9 (10.6%) |
| 3-Person Household | 62 (100.0%) | 0 (0.0%) |
| 4+ Person Household | 57 (100.0%) | 0 (0.0%) |
| Total Housing Units | 235 (69.3%) | 104 (30.7%) |
Occupancy by Educational Attainment in New Tripoli
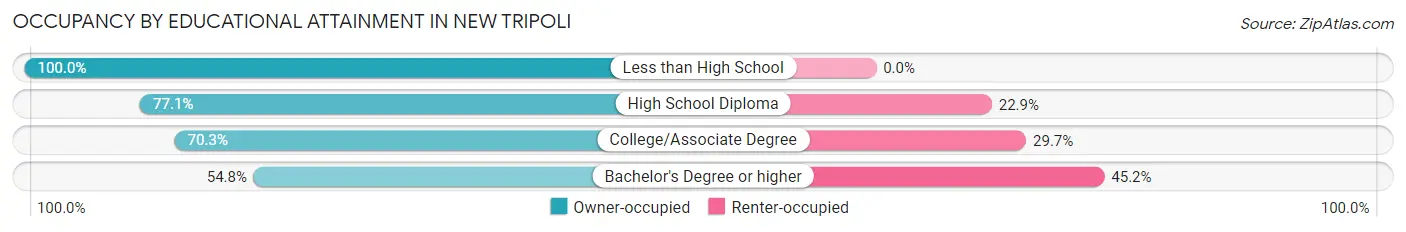
| Household Size | Owner-occupied | Renter-occupied |
| Less than High School | 11 (100.0%) | 0 (0.0%) |
| High School Diploma | 74 (77.1%) | 22 (22.9%) |
| College/Associate Degree | 104 (70.3%) | 44 (29.7%) |
| Bachelor's Degree or higher | 46 (54.8%) | 38 (45.2%) |
Occupancy by Age of Householder in New Tripoli
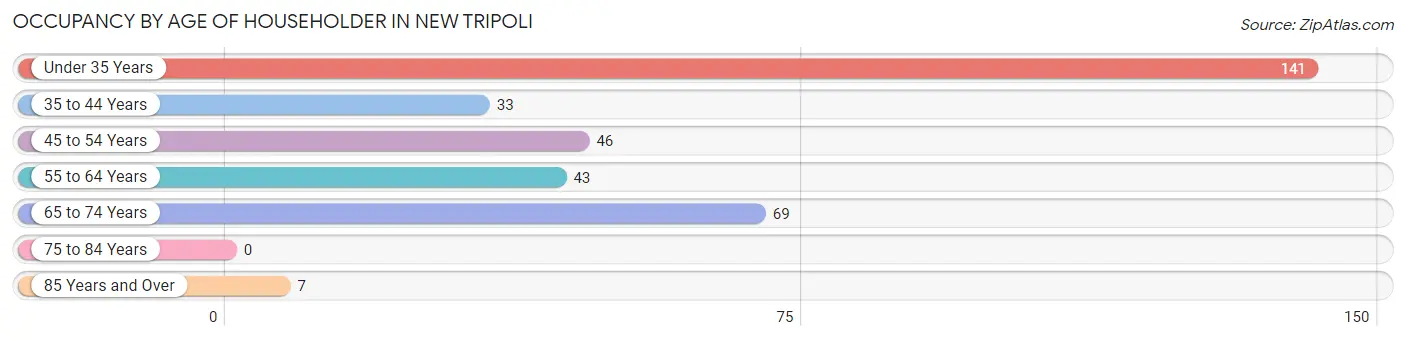
| Age Bracket | # Households | % Households |
| Under 35 Years | 141 | 41.6% |
| 35 to 44 Years | 33 | 9.7% |
| 45 to 54 Years | 46 | 13.6% |
| 55 to 64 Years | 43 | 12.7% |
| 65 to 74 Years | 69 | 20.3% |
| 75 to 84 Years | 0 | 0.0% |
| 85 Years and Over | 7 | 2.1% |
| Total | 339 | 100.0% |
Housing Finances in New Tripoli
Median Income by Occupancy in New Tripoli
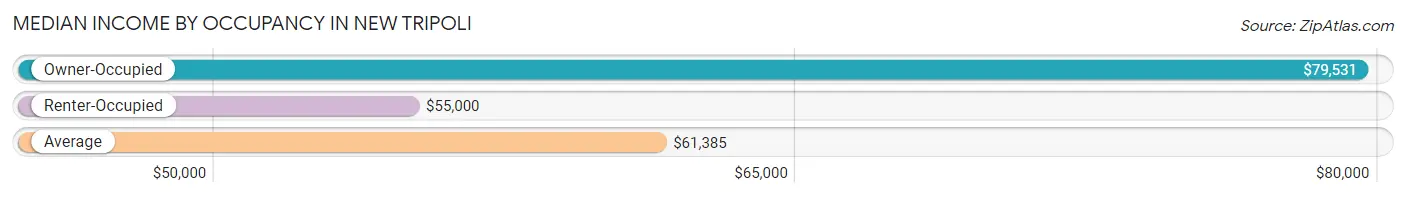
| Occupancy Type | # Households | Median Income |
| Owner-Occupied | 235 (69.3%) | $79,531 |
| Renter-Occupied | 104 (30.7%) | $55,000 |
| Average | 339 (100.0%) | $61,385 |
Occupancy by Householder Income Bracket in New Tripoli
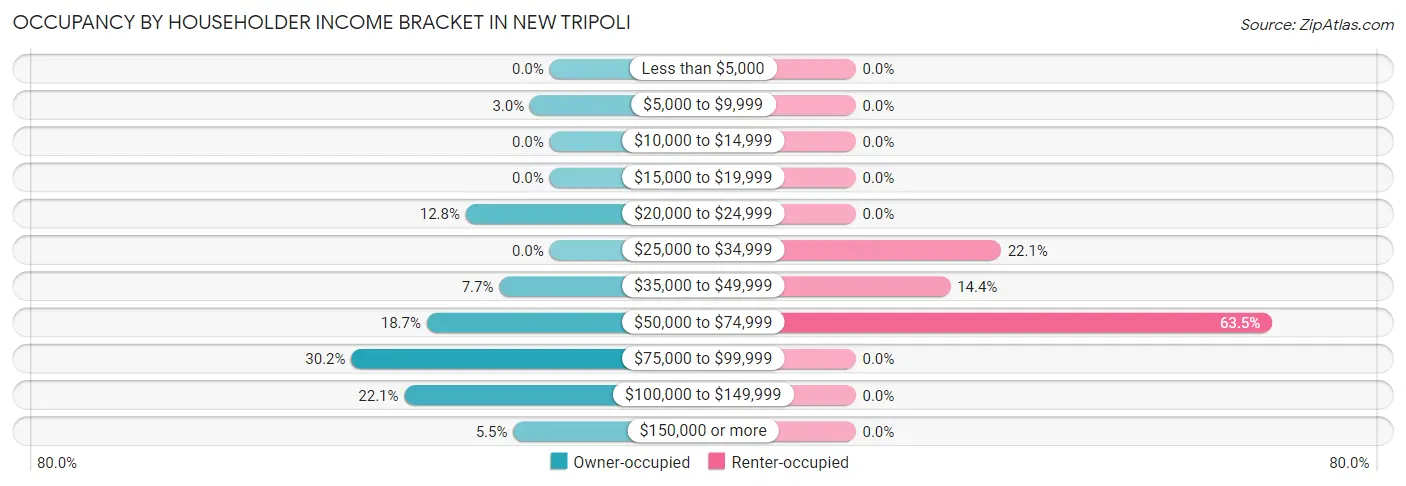
| Income Bracket | Owner-occupied | Renter-occupied |
| Less than $5,000 | 0 (0.0%) | 0 (0.0%) |
| $5,000 to $9,999 | 7 (3.0%) | 0 (0.0%) |
| $10,000 to $14,999 | 0 (0.0%) | 0 (0.0%) |
| $15,000 to $19,999 | 0 (0.0%) | 0 (0.0%) |
| $20,000 to $24,999 | 30 (12.8%) | 0 (0.0%) |
| $25,000 to $34,999 | 0 (0.0%) | 23 (22.1%) |
| $35,000 to $49,999 | 18 (7.7%) | 15 (14.4%) |
| $50,000 to $74,999 | 44 (18.7%) | 66 (63.5%) |
| $75,000 to $99,999 | 71 (30.2%) | 0 (0.0%) |
| $100,000 to $149,999 | 52 (22.1%) | 0 (0.0%) |
| $150,000 or more | 13 (5.5%) | 0 (0.0%) |
| Total | 235 (100.0%) | 104 (100.0%) |
Monthly Housing Cost Tiers in New Tripoli
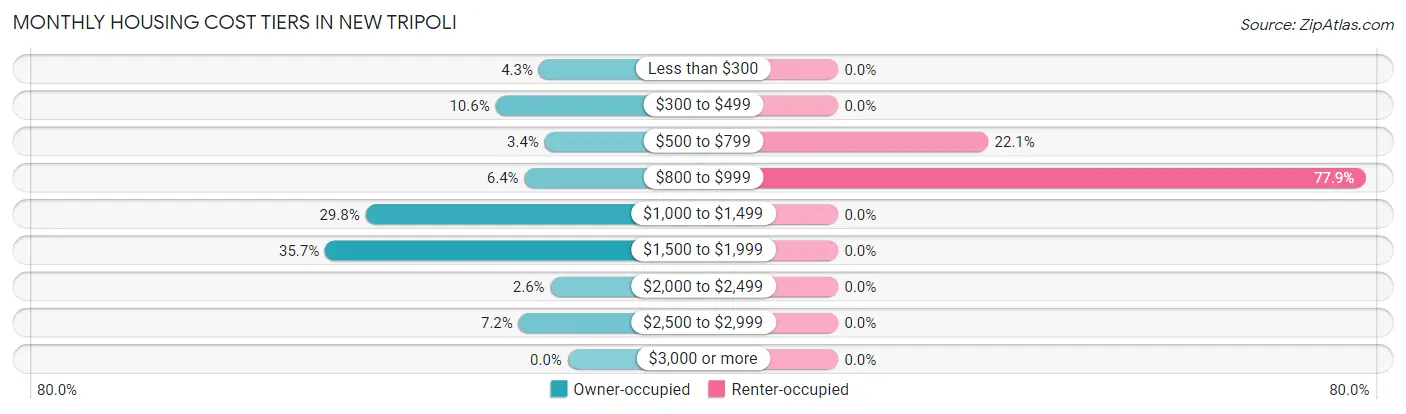
| Monthly Cost | Owner-occupied | Renter-occupied |
| Less than $300 | 10 (4.3%) | 0 (0.0%) |
| $300 to $499 | 25 (10.6%) | 0 (0.0%) |
| $500 to $799 | 8 (3.4%) | 23 (22.1%) |
| $800 to $999 | 15 (6.4%) | 81 (77.9%) |
| $1,000 to $1,499 | 70 (29.8%) | 0 (0.0%) |
| $1,500 to $1,999 | 84 (35.7%) | 0 (0.0%) |
| $2,000 to $2,499 | 6 (2.5%) | 0 (0.0%) |
| $2,500 to $2,999 | 17 (7.2%) | 0 (0.0%) |
| $3,000 or more | 0 (0.0%) | 0 (0.0%) |
| Total | 235 (100.0%) | 104 (100.0%) |
Physical Housing Characteristics in New Tripoli
Housing Structures in New Tripoli
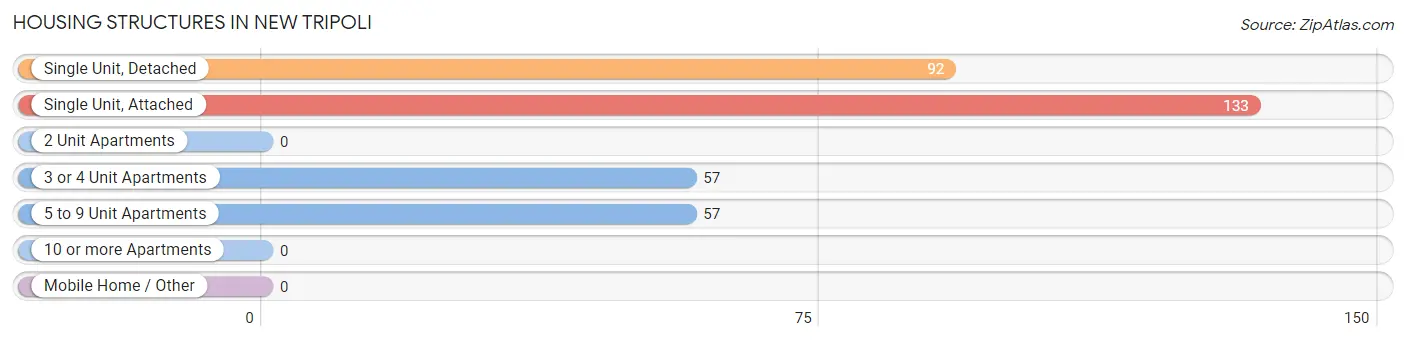
| Structure Type | # Housing Units | % Housing Units |
| Single Unit, Detached | 92 | 27.1% |
| Single Unit, Attached | 133 | 39.2% |
| 2 Unit Apartments | 0 | 0.0% |
| 3 or 4 Unit Apartments | 57 | 16.8% |
| 5 to 9 Unit Apartments | 57 | 16.8% |
| 10 or more Apartments | 0 | 0.0% |
| Mobile Home / Other | 0 | 0.0% |
| Total | 339 | 100.0% |
Housing Structures by Occupancy in New Tripoli
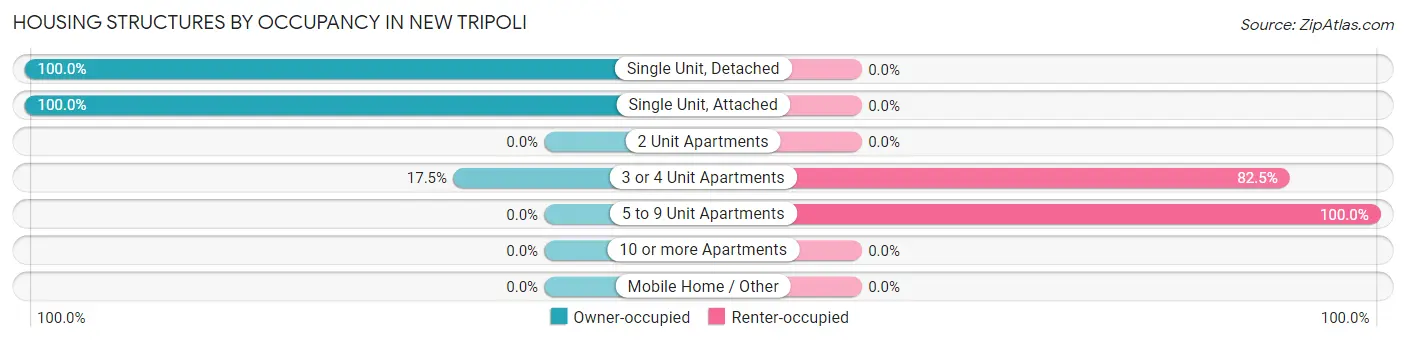
| Structure Type | Owner-occupied | Renter-occupied |
| Single Unit, Detached | 92 (100.0%) | 0 (0.0%) |
| Single Unit, Attached | 133 (100.0%) | 0 (0.0%) |
| 2 Unit Apartments | 0 (0.0%) | 0 (0.0%) |
| 3 or 4 Unit Apartments | 10 (17.5%) | 47 (82.5%) |
| 5 to 9 Unit Apartments | 0 (0.0%) | 57 (100.0%) |
| 10 or more Apartments | 0 (0.0%) | 0 (0.0%) |
| Mobile Home / Other | 0 (0.0%) | 0 (0.0%) |
| Total | 235 (69.3%) | 104 (30.7%) |
Housing Structures by Number of Rooms in New Tripoli
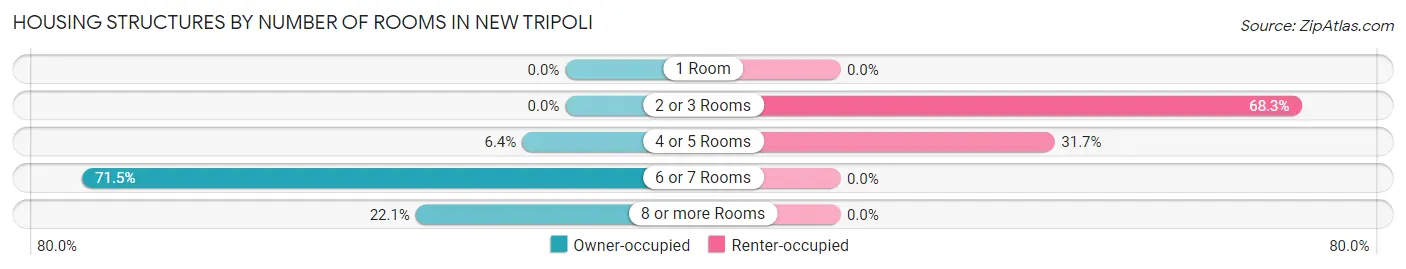
| Number of Rooms | Owner-occupied | Renter-occupied |
| 1 Room | 0 (0.0%) | 0 (0.0%) |
| 2 or 3 Rooms | 0 (0.0%) | 71 (68.3%) |
| 4 or 5 Rooms | 15 (6.4%) | 33 (31.7%) |
| 6 or 7 Rooms | 168 (71.5%) | 0 (0.0%) |
| 8 or more Rooms | 52 (22.1%) | 0 (0.0%) |
| Total | 235 (100.0%) | 104 (100.0%) |
Housing Structure by Heating Type in New Tripoli
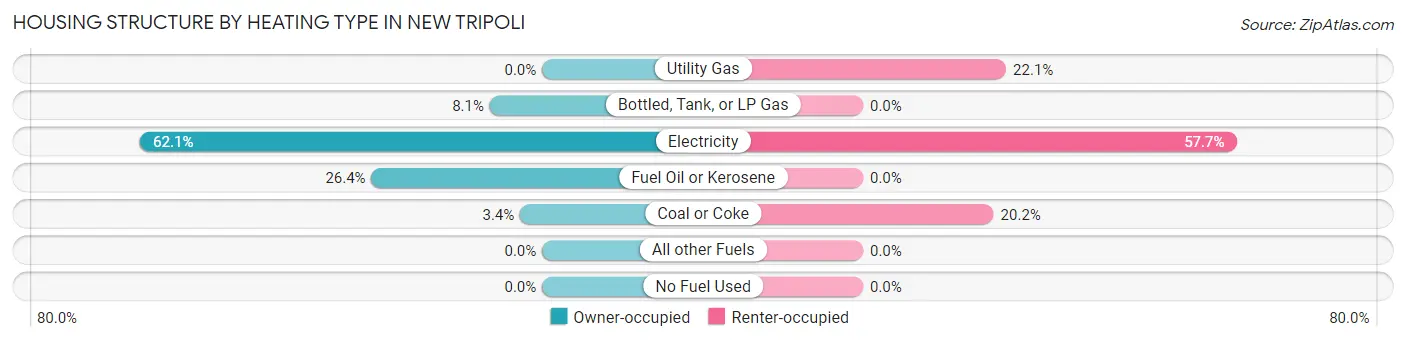
| Heating Type | Owner-occupied | Renter-occupied |
| Utility Gas | 0 (0.0%) | 23 (22.1%) |
| Bottled, Tank, or LP Gas | 19 (8.1%) | 0 (0.0%) |
| Electricity | 146 (62.1%) | 60 (57.7%) |
| Fuel Oil or Kerosene | 62 (26.4%) | 0 (0.0%) |
| Coal or Coke | 8 (3.4%) | 21 (20.2%) |
| All other Fuels | 0 (0.0%) | 0 (0.0%) |
| No Fuel Used | 0 (0.0%) | 0 (0.0%) |
| Total | 235 (100.0%) | 104 (100.0%) |
Household Vehicle Usage in New Tripoli
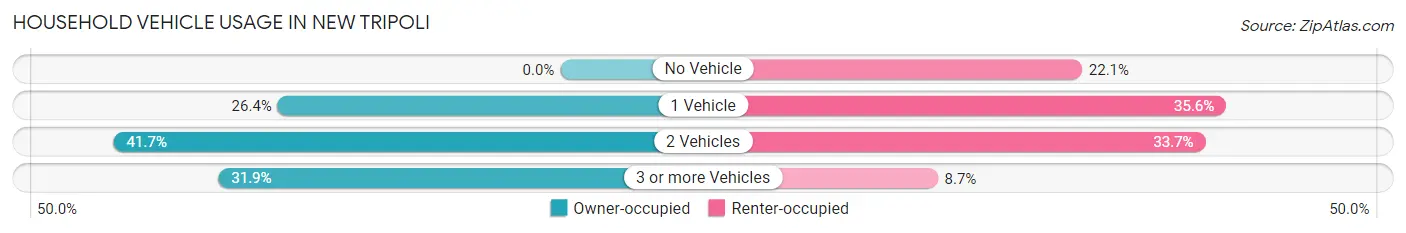
| Vehicles per Household | Owner-occupied | Renter-occupied |
| No Vehicle | 0 (0.0%) | 23 (22.1%) |
| 1 Vehicle | 62 (26.4%) | 37 (35.6%) |
| 2 Vehicles | 98 (41.7%) | 35 (33.7%) |
| 3 or more Vehicles | 75 (31.9%) | 9 (8.6%) |
| Total | 235 (100.0%) | 104 (100.0%) |
Real Estate & Mortgages in New Tripoli
Real Estate and Mortgage Overview in New Tripoli
| Characteristic | Without Mortgage | With Mortgage |
| Housing Units | 50 | 185 |
| Median Property Value | $165,000 | $189,800 |
| Median Household Income | - | - |
| Monthly Housing Costs | $460 | $0 |
| Real Estate Taxes | $2,520 | $0 |
Property Value by Mortgage Status in New Tripoli
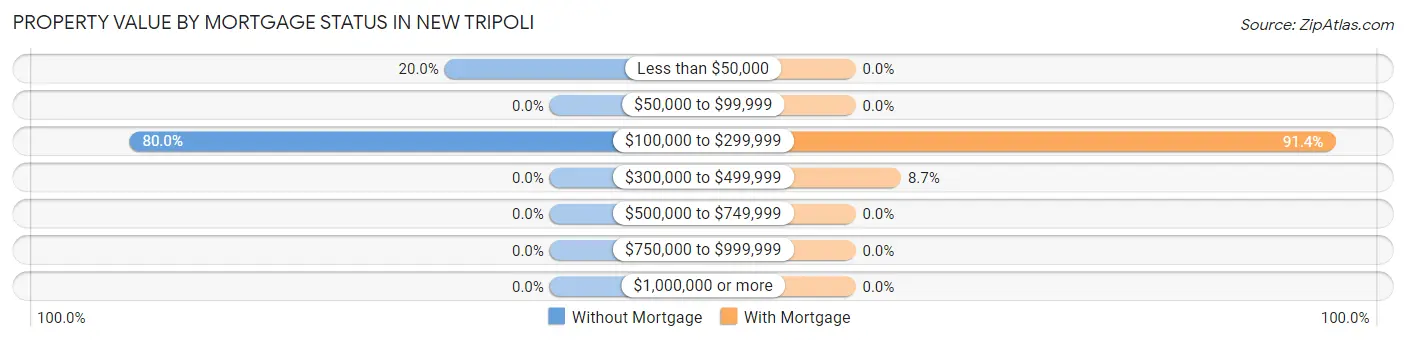
| Property Value | Without Mortgage | With Mortgage |
| Less than $50,000 | 10 (20.0%) | 0 (0.0%) |
| $50,000 to $99,999 | 0 (0.0%) | 0 (0.0%) |
| $100,000 to $299,999 | 40 (80.0%) | 169 (91.3%) |
| $300,000 to $499,999 | 0 (0.0%) | 16 (8.6%) |
| $500,000 to $749,999 | 0 (0.0%) | 0 (0.0%) |
| $750,000 to $999,999 | 0 (0.0%) | 0 (0.0%) |
| $1,000,000 or more | 0 (0.0%) | 0 (0.0%) |
| Total | 50 (100.0%) | 185 (100.0%) |
Household Income by Mortgage Status in New Tripoli
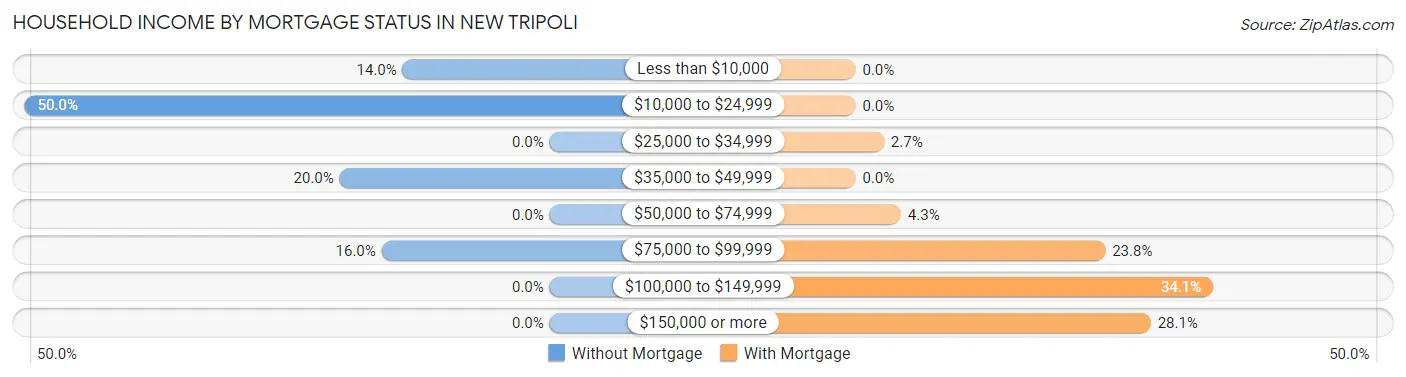
| Household Income | Without Mortgage | With Mortgage |
| Less than $10,000 | 7 (14.0%) | 0 (0.0%) |
| $10,000 to $24,999 | 25 (50.0%) | 0 (0.0%) |
| $25,000 to $34,999 | 0 (0.0%) | 5 (2.7%) |
| $35,000 to $49,999 | 10 (20.0%) | 0 (0.0%) |
| $50,000 to $74,999 | 0 (0.0%) | 8 (4.3%) |
| $75,000 to $99,999 | 8 (16.0%) | 44 (23.8%) |
| $100,000 to $149,999 | 0 (0.0%) | 63 (34.1%) |
| $150,000 or more | 0 (0.0%) | 52 (28.1%) |
| Total | 50 (100.0%) | 185 (100.0%) |
Property Value to Household Income Ratio in New Tripoli
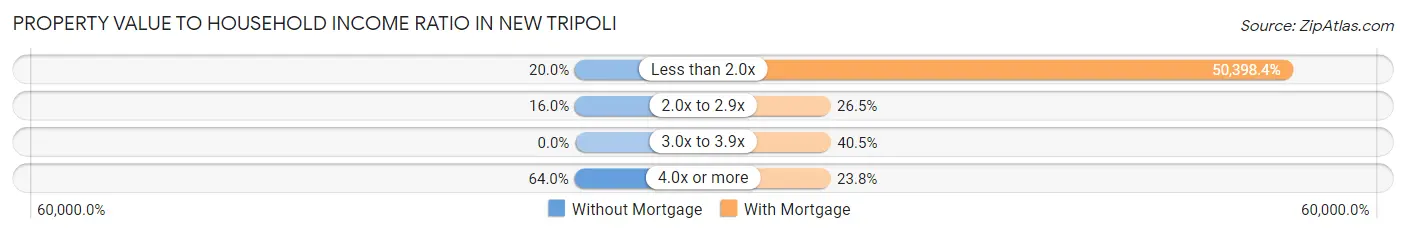
| Value-to-Income Ratio | Without Mortgage | With Mortgage |
| Less than 2.0x | 10 (20.0%) | 93,237 (50,398.4%) |
| 2.0x to 2.9x | 8 (16.0%) | 49 (26.5%) |
| 3.0x to 3.9x | 0 (0.0%) | 75 (40.5%) |
| 4.0x or more | 32 (64.0%) | 44 (23.8%) |
| Total | 50 (100.0%) | 185 (100.0%) |
Real Estate Taxes by Mortgage Status in New Tripoli
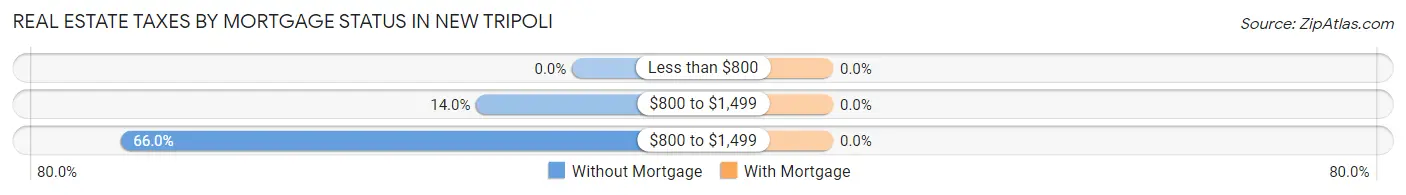
| Property Taxes | Without Mortgage | With Mortgage |
| Less than $800 | 0 (0.0%) | 0 (0.0%) |
| $800 to $1,499 | 7 (14.0%) | 0 (0.0%) |
| $800 to $1,499 | 33 (66.0%) | 0 (0.0%) |
| Total | 50 (100.0%) | 185 (100.0%) |
Health & Disability in New Tripoli
Health Insurance Coverage by Age in New Tripoli
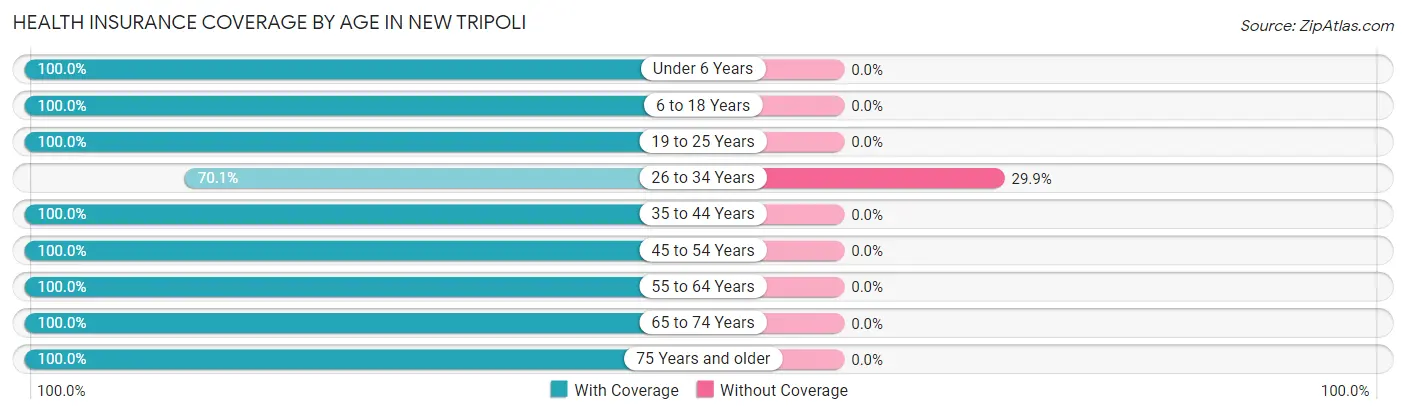
| Age Bracket | With Coverage | Without Coverage |
| Under 6 Years | 128 (100.0%) | 0 (0.0%) |
| 6 to 18 Years | 36 (100.0%) | 0 (0.0%) |
| 19 to 25 Years | 36 (100.0%) | 0 (0.0%) |
| 26 to 34 Years | 122 (70.1%) | 52 (29.9%) |
| 35 to 44 Years | 87 (100.0%) | 0 (0.0%) |
| 45 to 54 Years | 73 (100.0%) | 0 (0.0%) |
| 55 to 64 Years | 58 (100.0%) | 0 (0.0%) |
| 65 to 74 Years | 77 (100.0%) | 0 (0.0%) |
| 75 Years and older | 12 (100.0%) | 0 (0.0%) |
| Total | 629 (92.4%) | 52 (7.6%) |
Health Insurance Coverage by Citizenship Status in New Tripoli
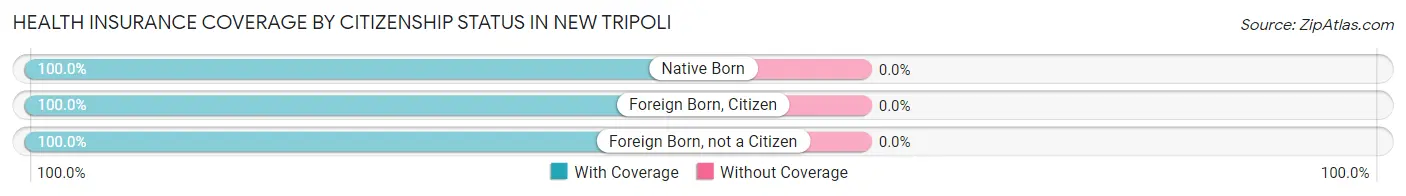
| Citizenship Status | With Coverage | Without Coverage |
| Native Born | 128 (100.0%) | 0 (0.0%) |
| Foreign Born, Citizen | 36 (100.0%) | 0 (0.0%) |
| Foreign Born, not a Citizen | 36 (100.0%) | 0 (0.0%) |
Health Insurance Coverage by Household Income in New Tripoli
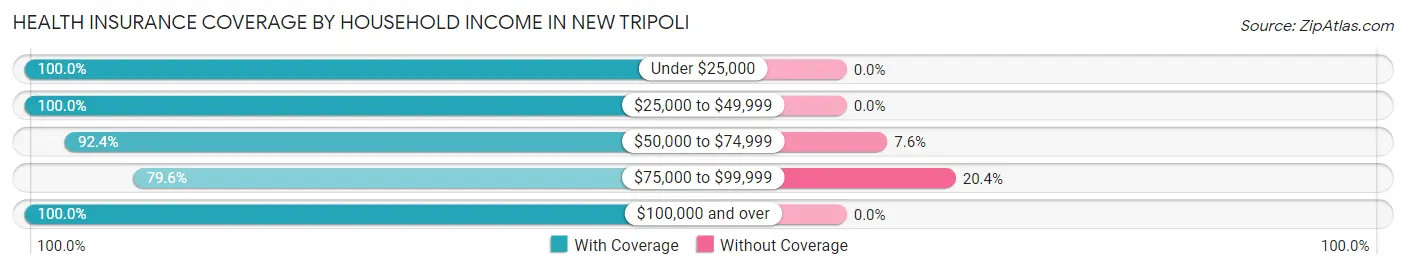
| Household Income | With Coverage | Without Coverage |
| Under $25,000 | 45 (100.0%) | 0 (0.0%) |
| $25,000 to $49,999 | 77 (100.0%) | 0 (0.0%) |
| $50,000 to $74,999 | 158 (92.4%) | 13 (7.6%) |
| $75,000 to $99,999 | 152 (79.6%) | 39 (20.4%) |
| $100,000 and over | 197 (100.0%) | 0 (0.0%) |
Public vs Private Health Insurance Coverage by Age in New Tripoli
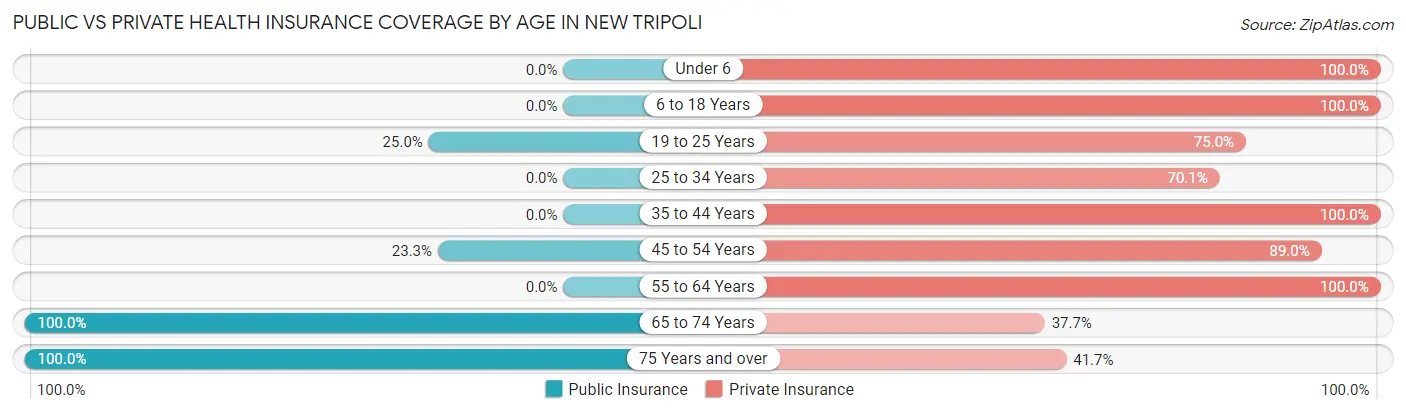
| Age Bracket | Public Insurance | Private Insurance |
| Under 6 | 0 (0.0%) | 128 (100.0%) |
| 6 to 18 Years | 0 (0.0%) | 36 (100.0%) |
| 19 to 25 Years | 9 (25.0%) | 27 (75.0%) |
| 25 to 34 Years | 0 (0.0%) | 122 (70.1%) |
| 35 to 44 Years | 0 (0.0%) | 87 (100.0%) |
| 45 to 54 Years | 17 (23.3%) | 65 (89.0%) |
| 55 to 64 Years | 0 (0.0%) | 58 (100.0%) |
| 65 to 74 Years | 77 (100.0%) | 29 (37.7%) |
| 75 Years and over | 12 (100.0%) | 5 (41.7%) |
| Total | 115 (16.9%) | 557 (81.8%) |
Disability Status by Sex by Age in New Tripoli
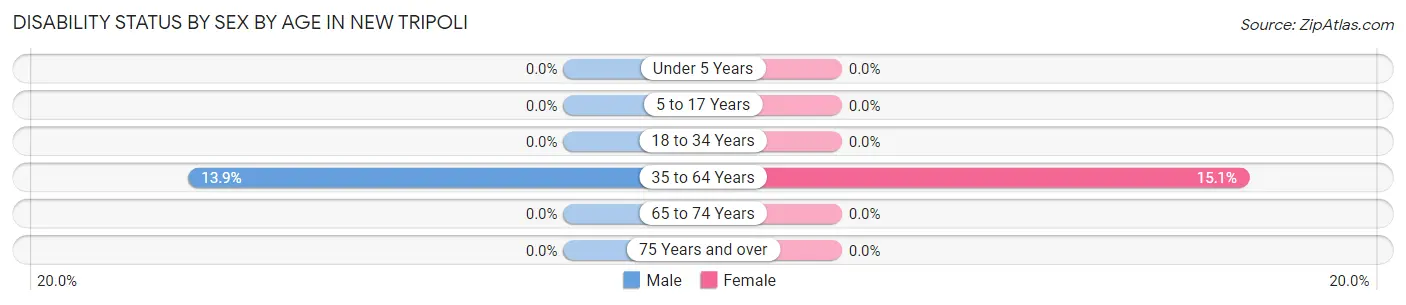
| Age Bracket | Male | Female |
| Under 5 Years | 0 (0.0%) | 0 (0.0%) |
| 5 to 17 Years | 0 (0.0%) | 0 (0.0%) |
| 18 to 34 Years | 0 (0.0%) | 0 (0.0%) |
| 35 to 64 Years | 11 (13.9%) | 21 (15.1%) |
| 65 to 74 Years | 0 (0.0%) | 0 (0.0%) |
| 75 Years and over | 0 (0.0%) | 0 (0.0%) |
Disability Class by Sex by Age in New Tripoli
Disability Class: Hearing Difficulty
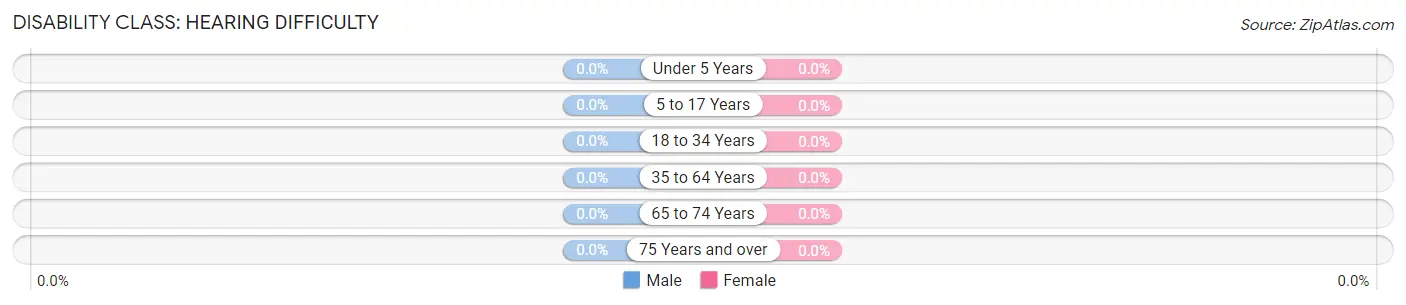
| Age Bracket | Male | Female |
| Under 5 Years | 0 (0.0%) | 0 (0.0%) |
| 5 to 17 Years | 0 (0.0%) | 0 (0.0%) |
| 18 to 34 Years | 0 (0.0%) | 0 (0.0%) |
| 35 to 64 Years | 0 (0.0%) | 0 (0.0%) |
| 65 to 74 Years | 0 (0.0%) | 0 (0.0%) |
| 75 Years and over | 0 (0.0%) | 0 (0.0%) |
Disability Class: Vision Difficulty
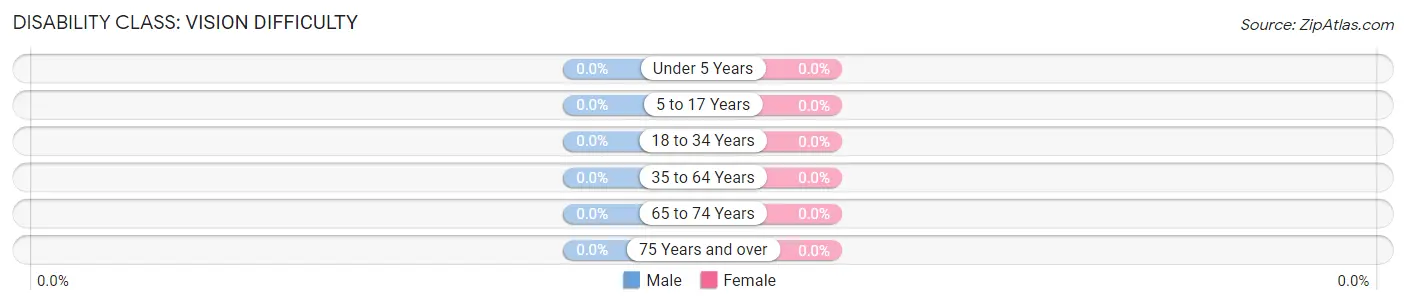
| Age Bracket | Male | Female |
| Under 5 Years | 0 (0.0%) | 0 (0.0%) |
| 5 to 17 Years | 0 (0.0%) | 0 (0.0%) |
| 18 to 34 Years | 0 (0.0%) | 0 (0.0%) |
| 35 to 64 Years | 0 (0.0%) | 0 (0.0%) |
| 65 to 74 Years | 0 (0.0%) | 0 (0.0%) |
| 75 Years and over | 0 (0.0%) | 0 (0.0%) |
Disability Class: Cognitive Difficulty
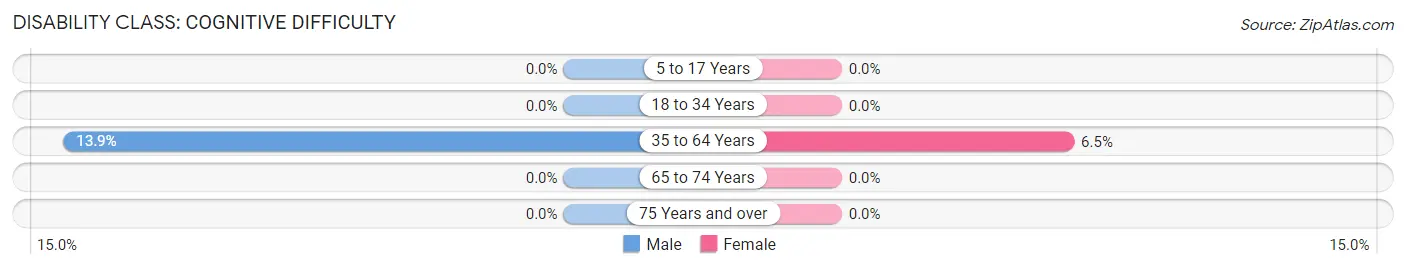
| Age Bracket | Male | Female |
| 5 to 17 Years | 0 (0.0%) | 0 (0.0%) |
| 18 to 34 Years | 0 (0.0%) | 0 (0.0%) |
| 35 to 64 Years | 11 (13.9%) | 9 (6.5%) |
| 65 to 74 Years | 0 (0.0%) | 0 (0.0%) |
| 75 Years and over | 0 (0.0%) | 0 (0.0%) |
Disability Class: Ambulatory Difficulty
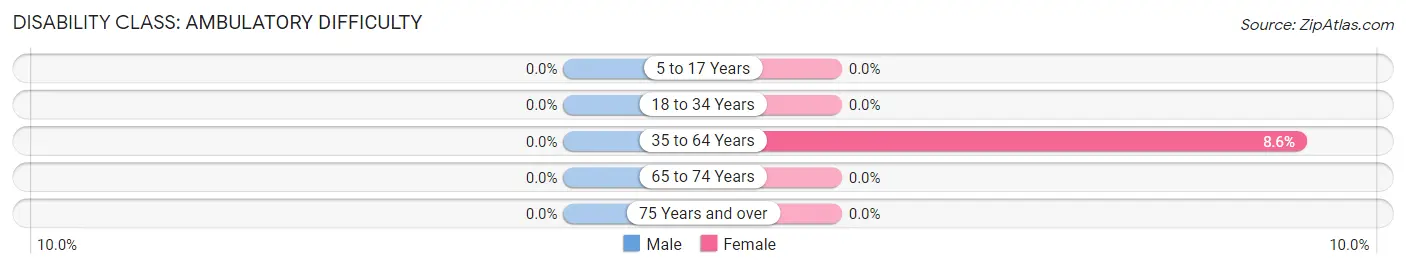
| Age Bracket | Male | Female |
| 5 to 17 Years | 0 (0.0%) | 0 (0.0%) |
| 18 to 34 Years | 0 (0.0%) | 0 (0.0%) |
| 35 to 64 Years | 0 (0.0%) | 12 (8.6%) |
| 65 to 74 Years | 0 (0.0%) | 0 (0.0%) |
| 75 Years and over | 0 (0.0%) | 0 (0.0%) |
Disability Class: Self-Care Difficulty
| Age Bracket | Male | Female |
| 5 to 17 Years | 0 (0.0%) | 0 (0.0%) |
| 18 to 34 Years | 0 (0.0%) | 0 (0.0%) |
| 35 to 64 Years | 0 (0.0%) | 0 (0.0%) |
| 65 to 74 Years | 0 (0.0%) | 0 (0.0%) |
| 75 Years and over | 0 (0.0%) | 0 (0.0%) |
Technology Access in New Tripoli
Computing Device Access in New Tripoli
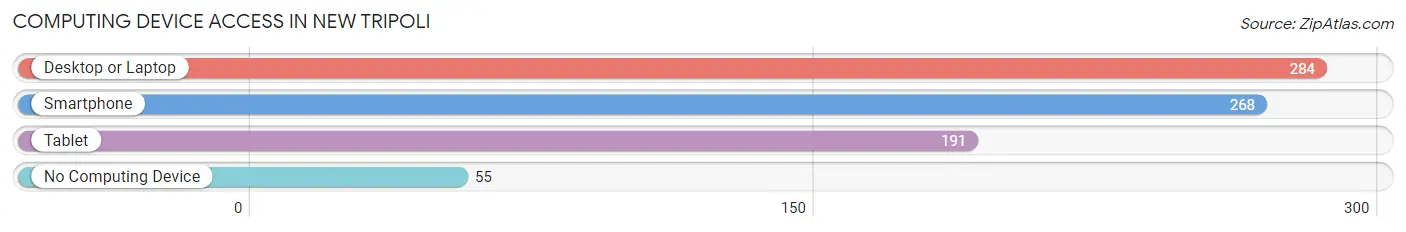
| Device Type | # Households | % Households |
| Desktop or Laptop | 284 | 83.8% |
| Smartphone | 268 | 79.1% |
| Tablet | 191 | 56.3% |
| No Computing Device | 55 | 16.2% |
| Total | 339 | 100.0% |
Internet Access in New Tripoli
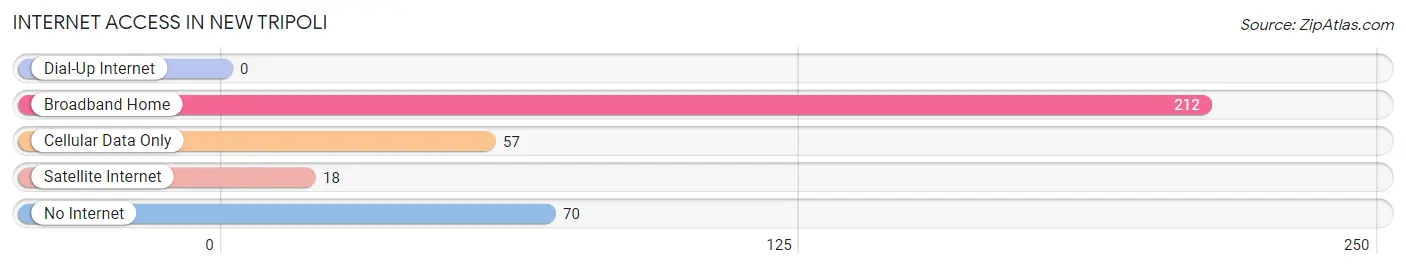
| Internet Type | # Households | % Households |
| Dial-Up Internet | 0 | 0.0% |
| Broadband Home | 212 | 62.5% |
| Cellular Data Only | 57 | 16.8% |
| Satellite Internet | 18 | 5.3% |
| No Internet | 70 | 20.6% |
| Total | 339 | 100.0% |
New Tripoli Summary
History
New Tripoli is a small unincorporated community located in Lehigh County, Pennsylvania. It is situated in the Northwestern part of the county, approximately 10 miles from the city of Allentown. The area was first settled in the late 1700s by German immigrants who were attracted to the area by its rich soil and abundant natural resources. The first settlers were mostly farmers, but the area soon became a center for industry, with several small businesses and factories being established in the area.
The town was officially established in 1845 and was named after the city of Tripoli in North Africa. The town was originally known as “Tripoli” but was later changed to “New Tripoli” to avoid confusion with the city in North Africa. The town grew steadily throughout the 19th century and by the early 20th century, it had become a thriving community with a population of over 1,000 people.
Geography
New Tripoli is located in Northwestern Lehigh County, Pennsylvania. It is situated in the foothills of the Appalachian Mountains and is surrounded by rolling hills and lush forests. The town is located approximately 10 miles from the city of Allentown and is easily accessible by car or public transportation.
The town is situated at an elevation of 830 feet above sea level and has a total area of 1.2 square miles. The climate in New Tripoli is classified as humid continental, with hot summers and cold winters. The average annual temperature is around 50 degrees Fahrenheit and the average annual precipitation is around 40 inches.
Economy
New Tripoli’s economy is largely based on agriculture and light industry. The town is home to several small businesses, including a few restaurants, a grocery store, and a few small shops. The town also has a few small factories that produce a variety of products, including furniture, clothing, and electronics.
The town is also home to several farms, which produce a variety of crops, including corn, soybeans, and wheat. The town also has a few wineries, which produce a variety of wines.
Demographics
As of the 2010 census, the population of New Tripoli was 1,845. The racial makeup of the town was 97.3% White, 0.7% African American, 0.2% Native American, 0.3% Asian, 0.1% Pacific Islander, 0.4% from other races, and 1.0% from two or more races. Hispanic or Latino of any race were 1.3% of the population.
The median income for a household in New Tripoli was $50,972, and the median income for a family was $60,972. The per capita income for the town was $25,972. About 4.3% of families and 5.7% of the population were below the poverty line, including 6.3% of those under age 18 and 4.3% of those age 65 or over.
New Tripoli is a small, rural community with a rich history and a strong sense of community. The town is home to a variety of businesses and industries, and its residents enjoy a high quality of life. The town is a great place to live, work, and raise a family.
Common Questions
What is Per Capita Income in New Tripoli?
Per Capita income in New Tripoli is $33,836.
What is the Median Family Income in New Tripoli?
Median Family Income in New Tripoli is $61,786.
What is the Median Household income in New Tripoli?
Median Household Income in New Tripoli is $61,385.
What is Income or Wage Gap in New Tripoli?
Income or Wage Gap in New Tripoli is 19.0%.
Women in New Tripoli earn 81.0 cents for every dollar earned by a man.
What is Inequality or Gini Index in New Tripoli?
Inequality or Gini Index in New Tripoli is 0.28.
What is the Total Population of New Tripoli?
Total Population of New Tripoli is 681.
What is the Total Male Population of New Tripoli?
Total Male Population of New Tripoli is 350.
What is the Total Female Population of New Tripoli?
Total Female Population of New Tripoli is 331.
What is the Ratio of Males per 100 Females in New Tripoli?
There are 105.74 Males per 100 Females in New Tripoli.
What is the Ratio of Females per 100 Males in New Tripoli?
There are 94.57 Females per 100 Males in New Tripoli.
What is the Median Population Age in New Tripoli?
Median Population Age in New Tripoli is 34.2 Years.
What is the Average Family Size in New Tripoli
Average Family Size in New Tripoli is 2.6 People.
What is the Average Household Size in New Tripoli
Average Household Size in New Tripoli is 2.0 People.
How Large is the Labor Force in New Tripoli?
There are 445 People in the Labor Forcein in New Tripoli.
What is the Percentage of People in the Labor Force in New Tripoli?
82.1% of People are in the Labor Force in New Tripoli.
What is the Unemployment Rate in New Tripoli?
Unemployment Rate in New Tripoli is 2.0%.