Mocanaqua, PA Map & Demographics
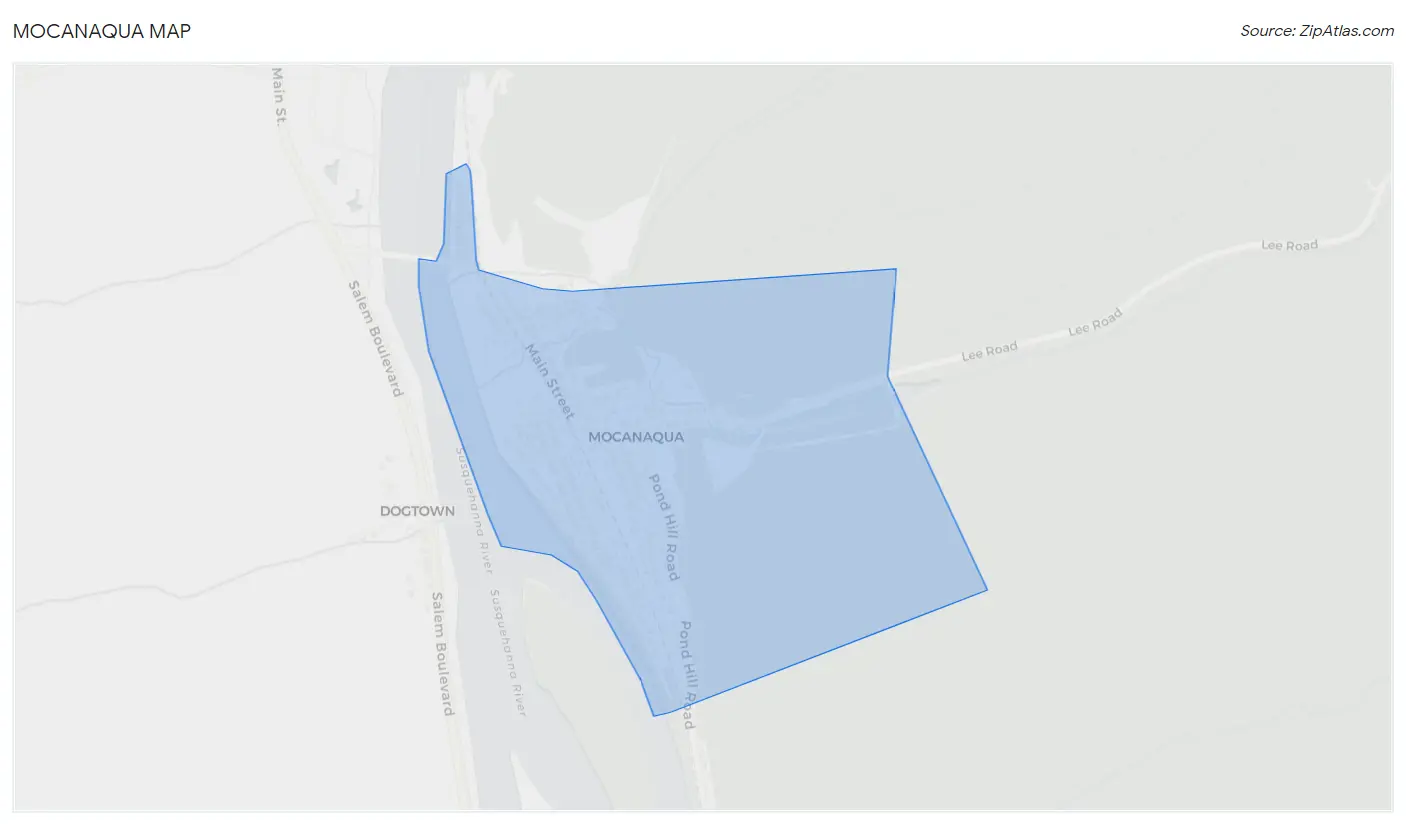
Mocanaqua Map
Mocanaqua Overview
$30,277
PER CAPITA INCOME
$81,932
AVG FAMILY INCOME
$56,719
AVG HOUSEHOLD INCOME
21.8%
WAGE / INCOME GAP [ % ]
78.2¢/ $1
WAGE / INCOME GAP [ $ ]
0.43
INEQUALITY / GINI INDEX
612
TOTAL POPULATION
329
MALE POPULATION
283
FEMALE POPULATION
116.25
MALES / 100 FEMALES
86.02
FEMALES / 100 MALES
41.0
MEDIAN AGE
3.1
AVG FAMILY SIZE
2.5
AVG HOUSEHOLD SIZE
337
LABOR FORCE [ PEOPLE ]
64.1%
PERCENT IN LABOR FORCE
5.6%
UNEMPLOYMENT RATE
Mocanaqua Area Codes
Income in Mocanaqua
Income Overview in Mocanaqua
Per Capita Income in Mocanaqua is $30,277, while median incomes of families and households are $81,932 and $56,719 respectively.
| Characteristic | Number | Measure |
| Per Capita Income | 612 | $30,277 |
| Median Family Income | 155 | $81,932 |
| Mean Family Income | 155 | $94,169 |
| Median Household Income | 249 | $56,719 |
| Mean Household Income | 249 | $73,296 |
| Income Deficit | 155 | $0 |
| Wage / Income Gap (%) | 612 | 21.80% |
| Wage / Income Gap ($) | 612 | 78.20¢ per $1 |
| Gini / Inequality Index | 612 | 0.43 |
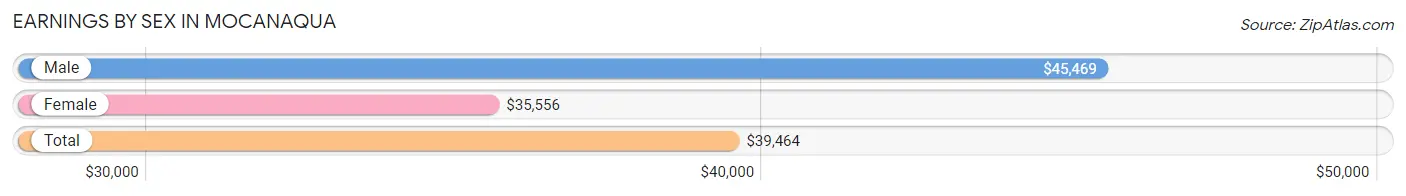
Earnings by Sex in Mocanaqua
Average Earnings in Mocanaqua are $39,464, $45,469 for men and $35,556 for women, a difference of 21.8%.
| Sex | Number | Average Earnings |
| Male | 220 (63.6%) | $45,469 |
| Female | 126 (36.4%) | $35,556 |
| Total | 346 (100.0%) | $39,464 |
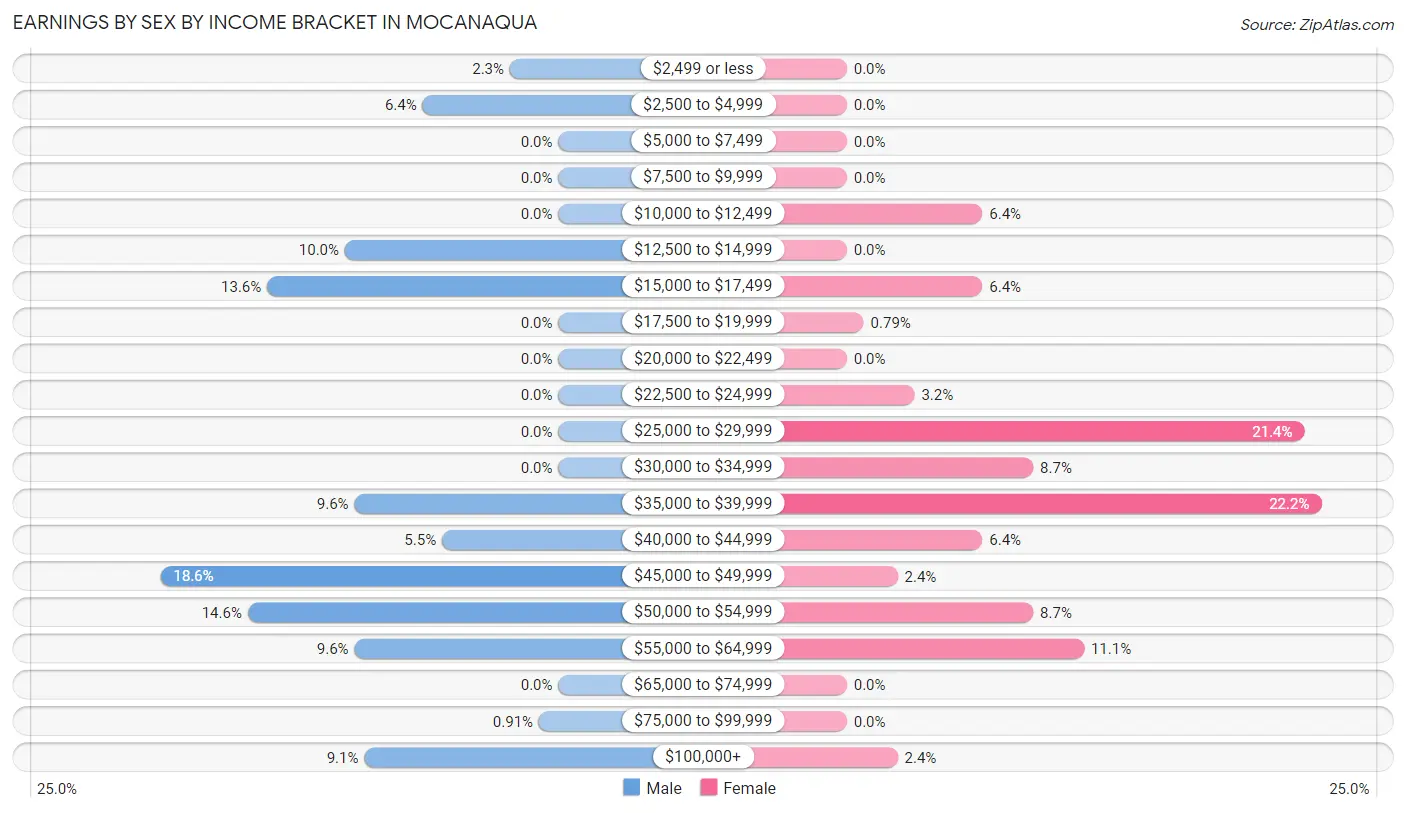
Earnings by Sex by Income Bracket in Mocanaqua
The most common earnings brackets in Mocanaqua are $45,000 to $49,999 for men (41 | 18.6%) and $35,000 to $39,999 for women (28 | 22.2%).
| Income | Male | Female |
| $2,499 or less | 5 (2.3%) | 0 (0.0%) |
| $2,500 to $4,999 | 14 (6.4%) | 0 (0.0%) |
| $5,000 to $7,499 | 0 (0.0%) | 0 (0.0%) |
| $7,500 to $9,999 | 0 (0.0%) | 0 (0.0%) |
| $10,000 to $12,499 | 0 (0.0%) | 8 (6.4%) |
| $12,500 to $14,999 | 22 (10.0%) | 0 (0.0%) |
| $15,000 to $17,499 | 30 (13.6%) | 8 (6.4%) |
| $17,500 to $19,999 | 0 (0.0%) | 1 (0.8%) |
| $20,000 to $22,499 | 0 (0.0%) | 0 (0.0%) |
| $22,500 to $24,999 | 0 (0.0%) | 4 (3.2%) |
| $25,000 to $29,999 | 0 (0.0%) | 27 (21.4%) |
| $30,000 to $34,999 | 0 (0.0%) | 11 (8.7%) |
| $35,000 to $39,999 | 21 (9.6%) | 28 (22.2%) |
| $40,000 to $44,999 | 12 (5.4%) | 8 (6.4%) |
| $45,000 to $49,999 | 41 (18.6%) | 3 (2.4%) |
| $50,000 to $54,999 | 32 (14.5%) | 11 (8.7%) |
| $55,000 to $64,999 | 21 (9.6%) | 14 (11.1%) |
| $65,000 to $74,999 | 0 (0.0%) | 0 (0.0%) |
| $75,000 to $99,999 | 2 (0.9%) | 0 (0.0%) |
| $100,000+ | 20 (9.1%) | 3 (2.4%) |
| Total | 220 (100.0%) | 126 (100.0%) |
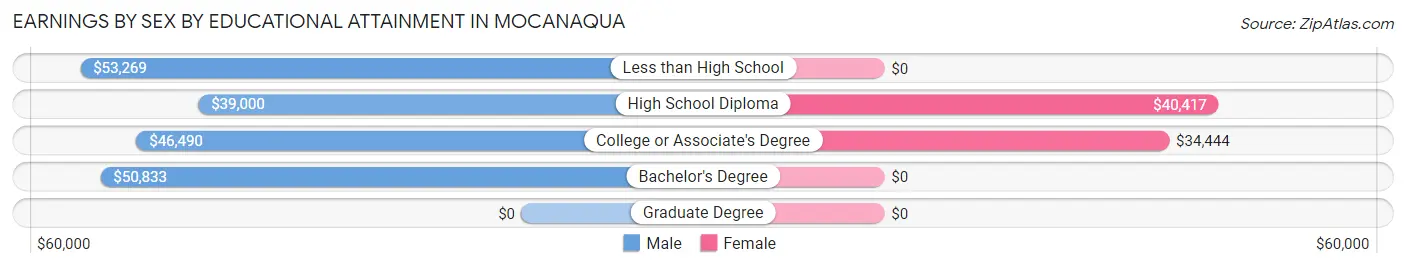
Earnings by Sex by Educational Attainment in Mocanaqua
Average earnings in Mocanaqua are $46,595 for men and $35,417 for women, a difference of 24.0%. Men with an educational attainment of less than high school enjoy the highest average annual earnings of $53,269, while those with high school diploma education earn the least with $39,000. Women with an educational attainment of high school diploma earn the most with the average annual earnings of $40,417, while those with college or associate's degree education have the smallest earnings of $34,444.
| Educational Attainment | Male Income | Female Income |
| Less than High School | $53,269 | $0 |
| High School Diploma | $39,000 | $40,417 |
| College or Associate's Degree | $46,490 | $34,444 |
| Bachelor's Degree | $50,833 | $0 |
| Graduate Degree | - | - |
| Total | $46,595 | $35,417 |
Family Income in Mocanaqua
Family Income Brackets in Mocanaqua
According to the Mocanaqua family income data, there are 28 families falling into the $75,000 to $99,999 income range, which is the most common income bracket and makes up 18.1% of all families. Conversely, the $15,000 to $24,999 income bracket is the least frequent group with only 1 families (0.6%) belonging to this category.
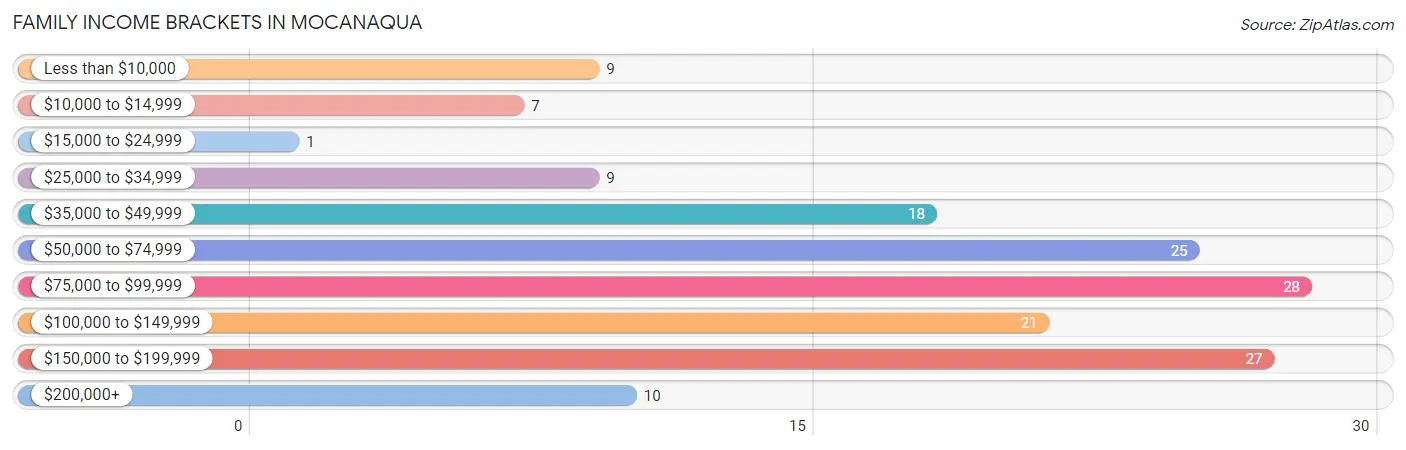
| Income Bracket | # Families | % Families |
| Less than $10,000 | 9 | 5.8% |
| $10,000 to $14,999 | 7 | 4.5% |
| $15,000 to $24,999 | 1 | 0.6% |
| $25,000 to $34,999 | 9 | 5.8% |
| $35,000 to $49,999 | 18 | 11.6% |
| $50,000 to $74,999 | 25 | 16.1% |
| $75,000 to $99,999 | 28 | 18.1% |
| $100,000 to $149,999 | 21 | 13.5% |
| $150,000 to $199,999 | 27 | 17.4% |
| $200,000+ | 10 | 6.5% |
Family Income by Famaliy Size in Mocanaqua
3-person families (12 | 7.7%) account for the highest median family income in Mocanaqua with $107,500 per family, while 3-person families (12 | 7.7%) have the highest median income of $35,833 per family member.
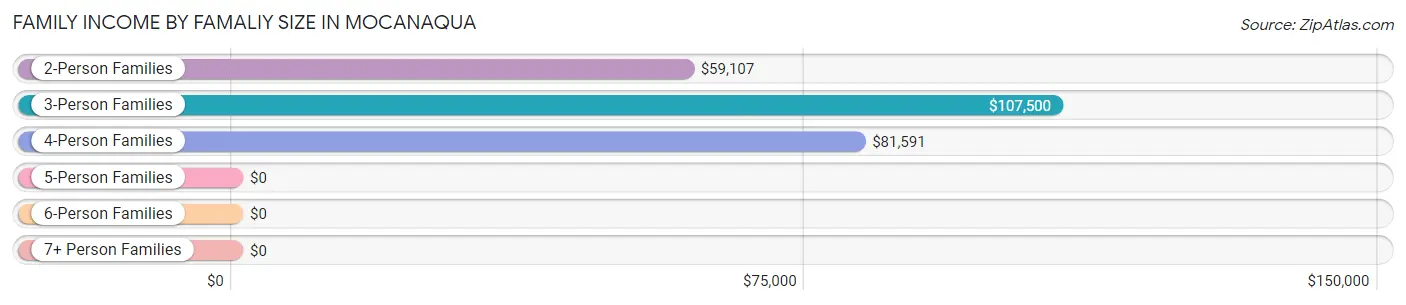
| Income Bracket | # Families | Median Income |
| 2-Person Families | 99 (63.9%) | $59,107 |
| 3-Person Families | 12 (7.7%) | $107,500 |
| 4-Person Families | 14 (9.0%) | $81,591 |
| 5-Person Families | 10 (6.5%) | $0 |
| 6-Person Families | 0 (0.0%) | $0 |
| 7+ Person Families | 20 (12.9%) | $0 |
| Total | 155 (100.0%) | $81,932 |
Family Income by Number of Earners in Mocanaqua
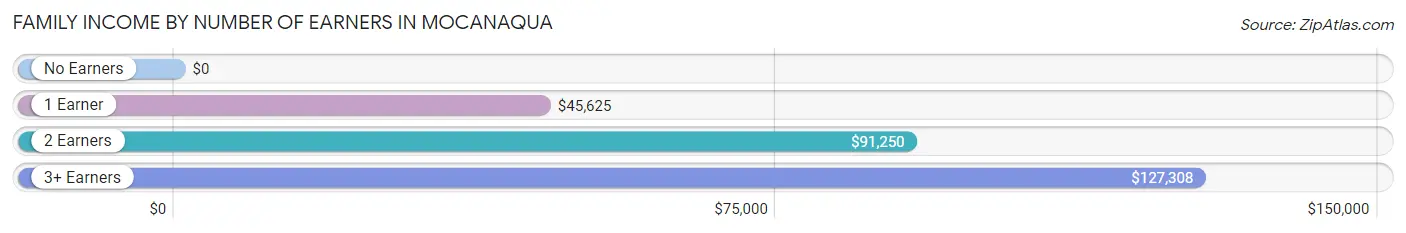
| Number of Earners | # Families | Median Income |
| No Earners | 18 (11.6%) | $0 |
| 1 Earner | 46 (29.7%) | $45,625 |
| 2 Earners | 67 (43.2%) | $91,250 |
| 3+ Earners | 24 (15.5%) | $127,308 |
| Total | 155 (100.0%) | $81,932 |
Household Income in Mocanaqua
Household Income Brackets in Mocanaqua
With 44 households falling in the category, the $50,000 to $74,999 income range is the most frequent in Mocanaqua, accounting for 17.7% of all households. In contrast, only 8 households (3.2%) fall into the $15,000 to $24,999 income bracket, making it the least populous group.
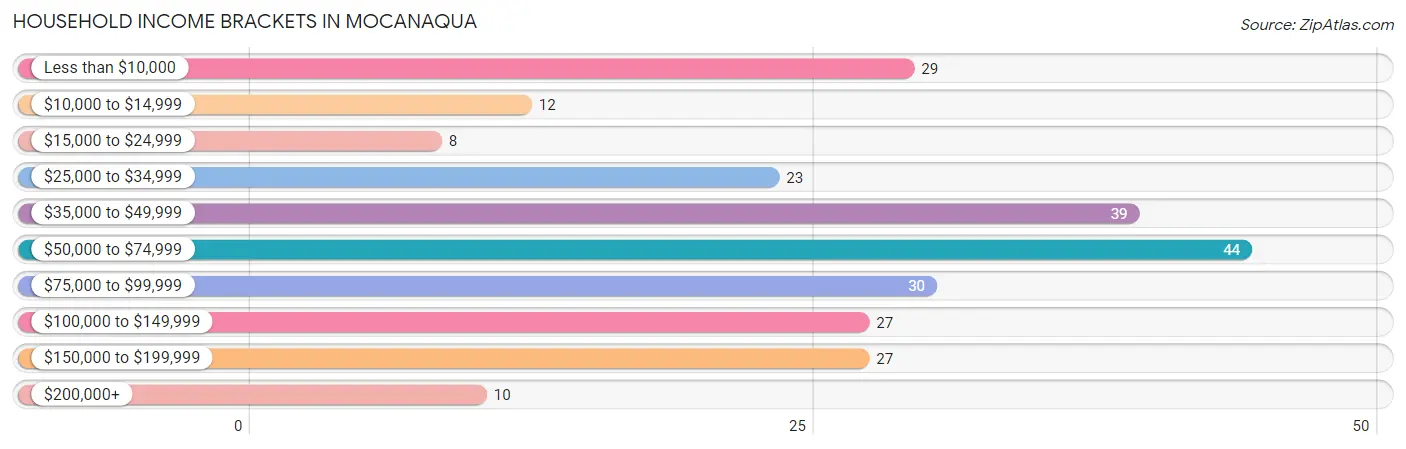
| Income Bracket | # Households | % Households |
| Less than $10,000 | 29 | 11.6% |
| $10,000 to $14,999 | 12 | 4.8% |
| $15,000 to $24,999 | 8 | 3.2% |
| $25,000 to $34,999 | 23 | 9.2% |
| $35,000 to $49,999 | 39 | 15.7% |
| $50,000 to $74,999 | 44 | 17.7% |
| $75,000 to $99,999 | 30 | 12.0% |
| $100,000 to $149,999 | 27 | 10.8% |
| $150,000 to $199,999 | 27 | 10.8% |
| $200,000+ | 10 | 4.0% |
Household Income by Householder Age in Mocanaqua
The median household income in Mocanaqua is $56,719, with the highest median household income of $91,528 found in the 25 to 44 years age bracket for the primary householder. A total of 79 households (31.7%) fall into this category.
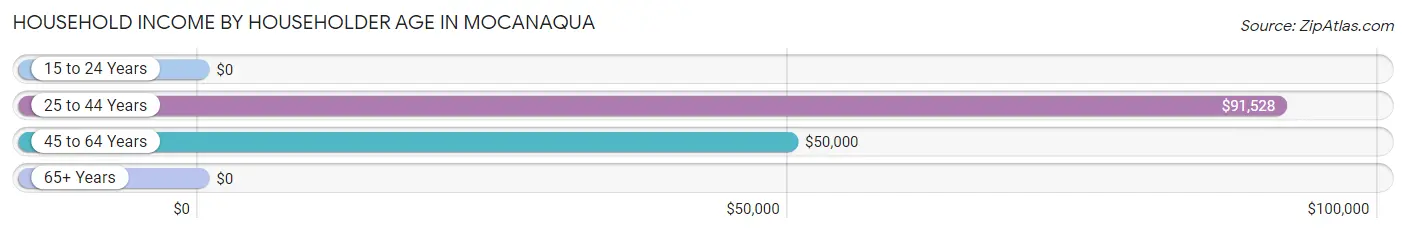
| Income Bracket | # Households | Median Income |
| 15 to 24 Years | 0 (0.0%) | $0 |
| 25 to 44 Years | 79 (31.7%) | $91,528 |
| 45 to 64 Years | 108 (43.4%) | $50,000 |
| 65+ Years | 62 (24.9%) | $0 |
| Total | 249 (100.0%) | $56,719 |
Poverty in Mocanaqua
Income Below Poverty by Sex and Age in Mocanaqua
With 14.9% poverty level for males and 23.3% for females among the residents of Mocanaqua, 15 year old males and under 5 year old females are the most vulnerable to poverty, with 7 males (100.0%) and 7 females (100.0%) in their respective age groups living below the poverty level.
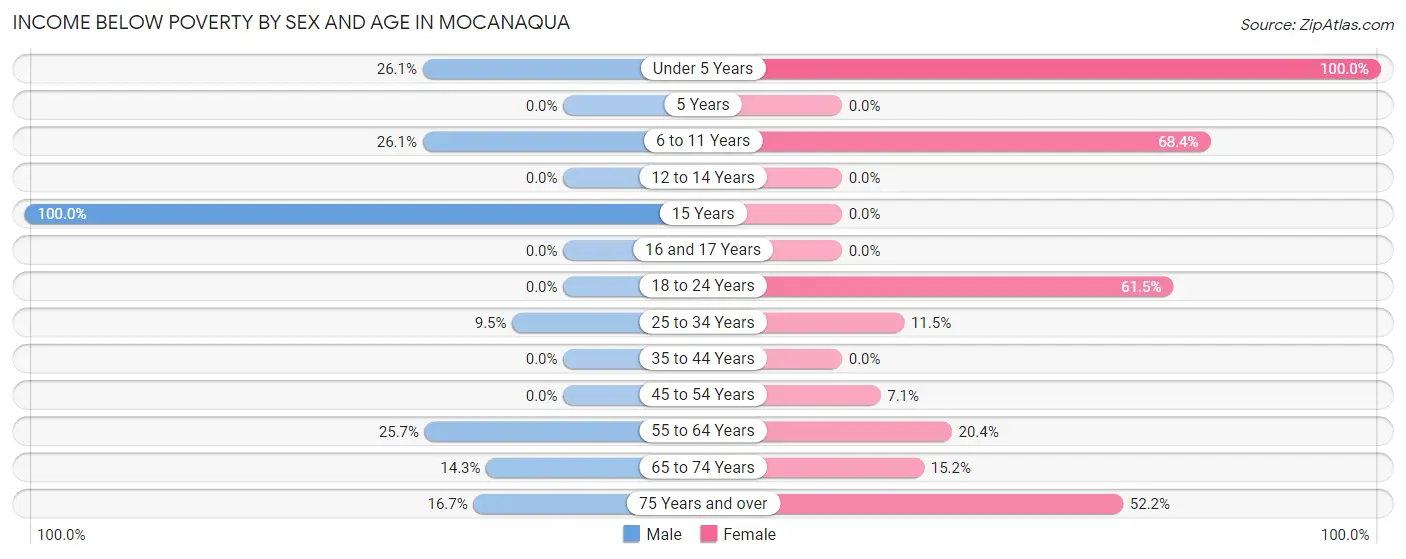
| Age Bracket | Male | Female |
| Under 5 Years | 6 (26.1%) | 7 (100.0%) |
| 5 Years | 0 (0.0%) | 0 (0.0%) |
| 6 to 11 Years | 6 (26.1%) | 13 (68.4%) |
| 12 to 14 Years | 0 (0.0%) | 0 (0.0%) |
| 15 Years | 7 (100.0%) | 0 (0.0%) |
| 16 and 17 Years | 0 (0.0%) | 0 (0.0%) |
| 18 to 24 Years | 0 (0.0%) | 8 (61.5%) |
| 25 to 34 Years | 7 (9.5%) | 6 (11.5%) |
| 35 to 44 Years | 0 (0.0%) | 0 (0.0%) |
| 45 to 54 Years | 0 (0.0%) | 2 (7.1%) |
| 55 to 64 Years | 18 (25.7%) | 11 (20.4%) |
| 65 to 74 Years | 3 (14.3%) | 7 (15.2%) |
| 75 Years and over | 2 (16.7%) | 12 (52.2%) |
| Total | 49 (14.9%) | 66 (23.3%) |
Income Above Poverty by Sex and Age in Mocanaqua
According to the poverty statistics in Mocanaqua, males aged 5 years and females aged 16 and 17 years are the age groups that are most secure financially, with 100.0% of males and 100.0% of females in these age groups living above the poverty line.
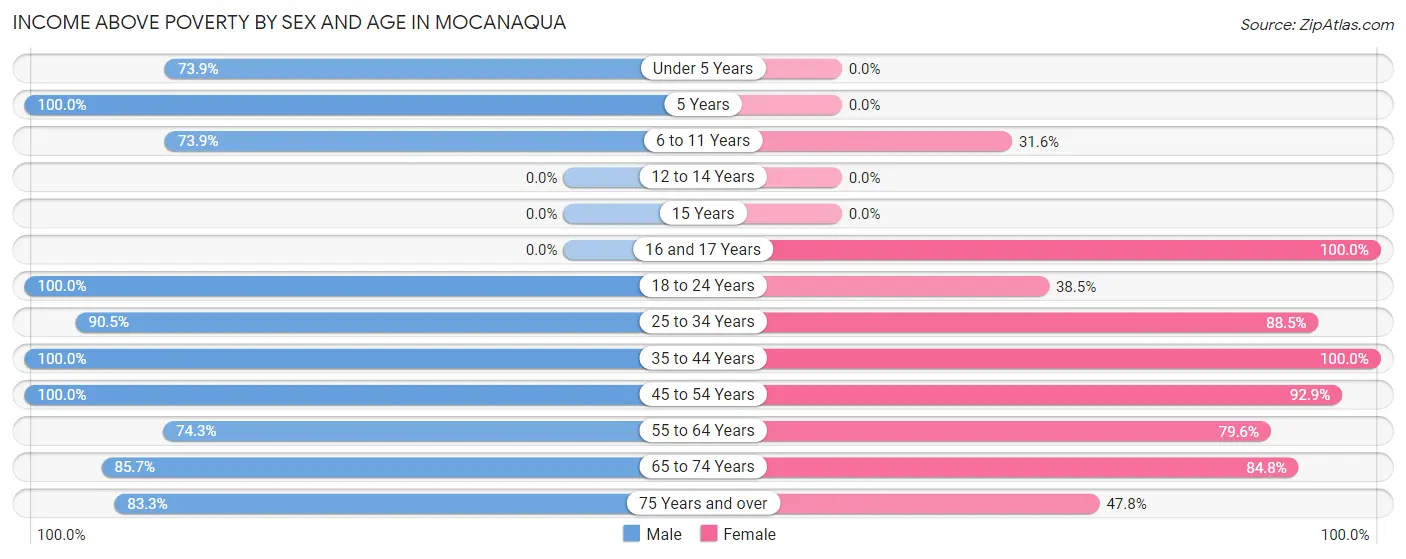
| Age Bracket | Male | Female |
| Under 5 Years | 17 (73.9%) | 0 (0.0%) |
| 5 Years | 7 (100.0%) | 0 (0.0%) |
| 6 to 11 Years | 17 (73.9%) | 6 (31.6%) |
| 12 to 14 Years | 0 (0.0%) | 0 (0.0%) |
| 15 Years | 0 (0.0%) | 0 (0.0%) |
| 16 and 17 Years | 0 (0.0%) | 9 (100.0%) |
| 18 to 24 Years | 35 (100.0%) | 5 (38.5%) |
| 25 to 34 Years | 67 (90.5%) | 46 (88.5%) |
| 35 to 44 Years | 36 (100.0%) | 32 (100.0%) |
| 45 to 54 Years | 21 (100.0%) | 26 (92.9%) |
| 55 to 64 Years | 52 (74.3%) | 43 (79.6%) |
| 65 to 74 Years | 18 (85.7%) | 39 (84.8%) |
| 75 Years and over | 10 (83.3%) | 11 (47.8%) |
| Total | 280 (85.1%) | 217 (76.7%) |
Income Below Poverty Among Married-Couple Families in Mocanaqua
The poverty statistics for married-couple families in Mocanaqua show that 2.0% or 2 of the total 100 families live below the poverty line. Families with no children have the highest poverty rate of 2.6%, comprising of 2 families. On the other hand, families with 1 or 2 children have the lowest poverty rate of 0.0%, which includes 0 families.
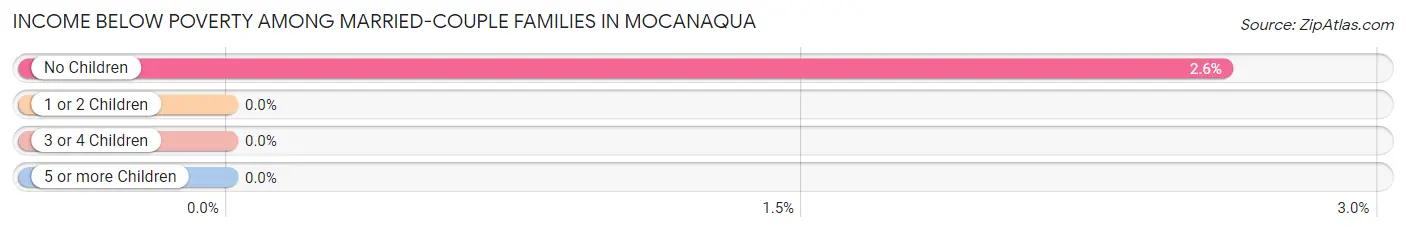
| Children | Above Poverty | Below Poverty |
| No Children | 75 (97.4%) | 2 (2.6%) |
| 1 or 2 Children | 23 (100.0%) | 0 (0.0%) |
| 3 or 4 Children | 0 (0.0%) | 0 (0.0%) |
| 5 or more Children | 0 (0.0%) | 0 (0.0%) |
| Total | 98 (98.0%) | 2 (2.0%) |
Income Below Poverty Among Single-Parent Households in Mocanaqua
According to the poverty data in Mocanaqua, 46.7% or 7 single-father households and 17.5% or 7 single-mother households are living below the poverty line. Among single-father households, those with 5 or more children have the highest poverty rate, with 7 households (100.0%) experiencing poverty. Likewise, among single-mother households, those with no children have the highest poverty rate, with 7 households (46.7%) falling below the poverty line.
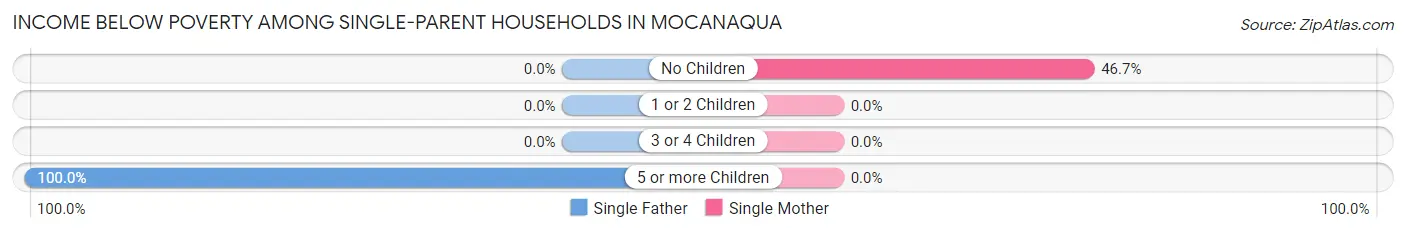
| Children | Single Father | Single Mother |
| No Children | 0 (0.0%) | 7 (46.7%) |
| 1 or 2 Children | 0 (0.0%) | 0 (0.0%) |
| 3 or 4 Children | 0 (0.0%) | 0 (0.0%) |
| 5 or more Children | 7 (100.0%) | 0 (0.0%) |
| Total | 7 (46.7%) | 7 (17.5%) |
Income Below Poverty Among Married-Couple vs Single-Parent Households in Mocanaqua
The poverty data for Mocanaqua shows that 2 of the married-couple family households (2.0%) and 14 of the single-parent households (25.5%) are living below the poverty level. Within the married-couple family households, those with no children have the highest poverty rate, with 2 households (2.6%) falling below the poverty line. Among the single-parent households, those with 5 or more children have the highest poverty rate, with 7 household (100.0%) living below poverty.
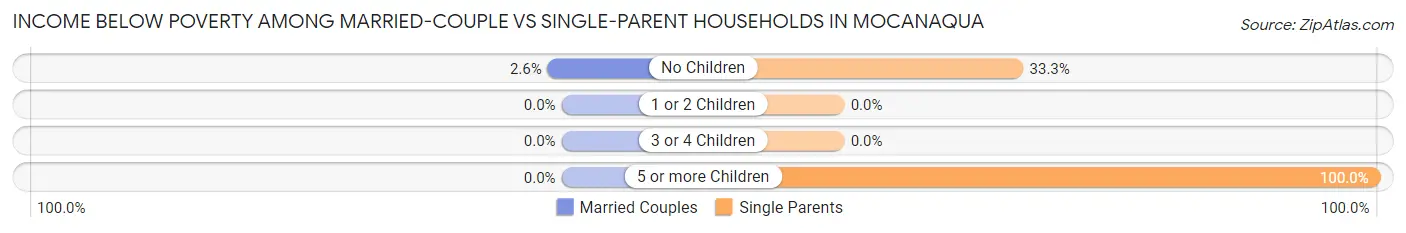
| Children | Married-Couple Families | Single-Parent Households |
| No Children | 2 (2.6%) | 7 (33.3%) |
| 1 or 2 Children | 0 (0.0%) | 0 (0.0%) |
| 3 or 4 Children | 0 (0.0%) | 0 (0.0%) |
| 5 or more Children | 0 (0.0%) | 7 (100.0%) |
| Total | 2 (2.0%) | 14 (25.5%) |
Race in Mocanaqua
The most populous races in Mocanaqua are White / Caucasian (566 | 92.5%), Two or more Races (30 | 4.9%), and Hispanic or Latino (12 | 2.0%).
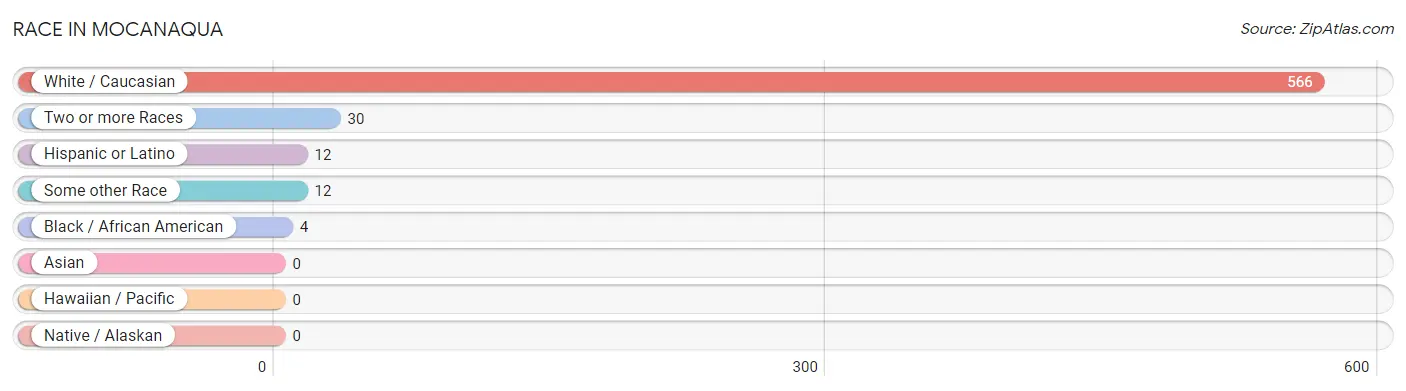
| Race | # Population | % Population |
| Asian | 0 | 0.0% |
| Black / African American | 4 | 0.6% |
| Hawaiian / Pacific | 0 | 0.0% |
| Hispanic or Latino | 12 | 2.0% |
| Native / Alaskan | 0 | 0.0% |
| White / Caucasian | 566 | 92.5% |
| Two or more Races | 30 | 4.9% |
| Some other Race | 12 | 2.0% |
| Total | 612 | 100.0% |
Ancestry in Mocanaqua
The most populous ancestries reported in Mocanaqua are Polish (170 | 27.8%), German (114 | 18.6%), Italian (74 | 12.1%), Irish (58 | 9.5%), and English (24 | 3.9%), together accounting for 71.9% of all Mocanaqua residents.
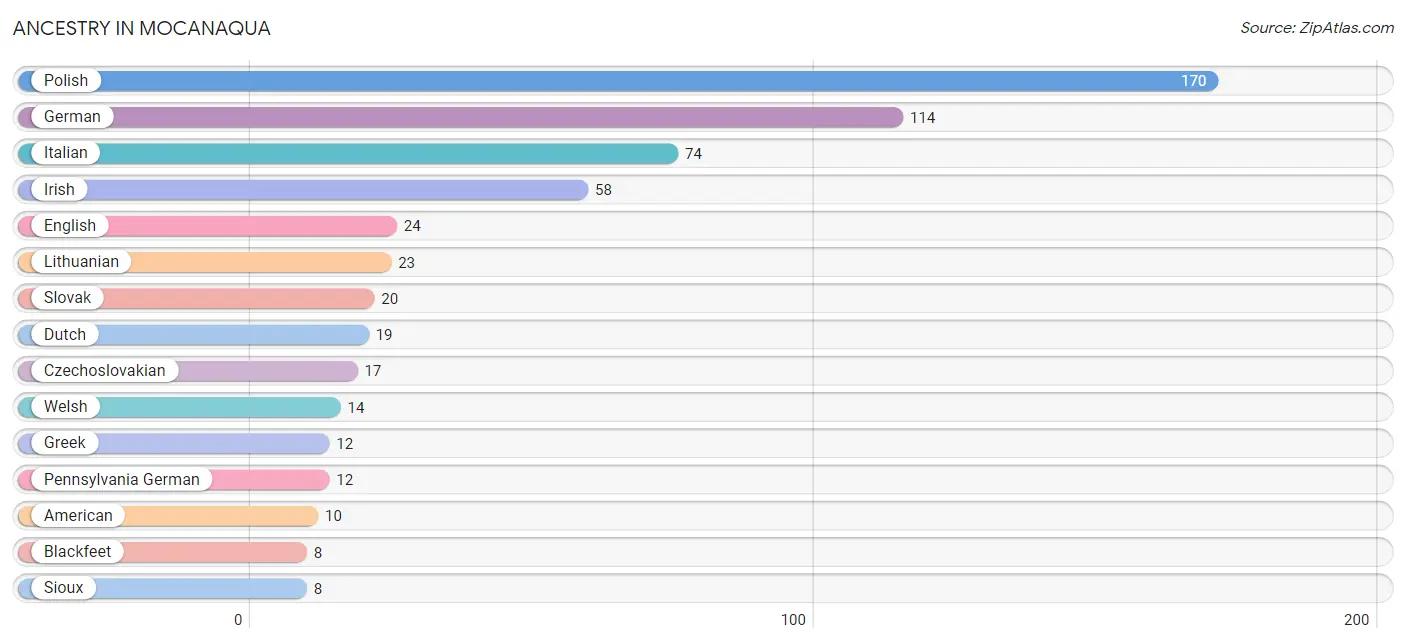
| Ancestry | # Population | % Population |
| American | 10 | 1.6% |
| Arab | 3 | 0.5% |
| Blackfeet | 8 | 1.3% |
| Czechoslovakian | 17 | 2.8% |
| Danish | 2 | 0.3% |
| Dominican | 6 | 1.0% |
| Dutch | 19 | 3.1% |
| English | 24 | 3.9% |
| German | 114 | 18.6% |
| Greek | 12 | 2.0% |
| Irish | 58 | 9.5% |
| Italian | 74 | 12.1% |
| Lithuanian | 23 | 3.8% |
| Mexican | 3 | 0.5% |
| Pennsylvania German | 12 | 2.0% |
| Polish | 170 | 27.8% |
| Puerto Rican | 3 | 0.5% |
| Scottish | 4 | 0.6% |
| Sioux | 8 | 1.3% |
| Slovak | 20 | 3.3% |
| Welsh | 14 | 2.3% |
| Yugoslavian | 3 | 0.5% | View All 22 Rows |
Immigrants in Mocanaqua
The most numerous immigrant groups reported in Mocanaqua came from Europe (14 | 2.3%), Germany (8 | 1.3%), Western Europe (8 | 1.3%), Canada (4 | 0.6%), and Eastern Europe (3 | 0.5%), together accounting for 6.1% of all Mocanaqua residents.
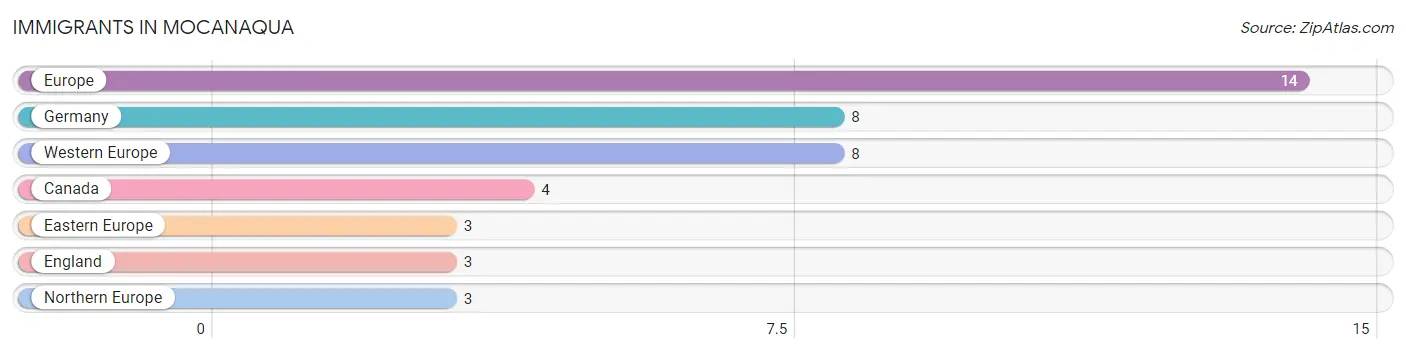
| Immigration Origin | # Population | % Population |
| Canada | 4 | 0.6% |
| Eastern Europe | 3 | 0.5% |
| England | 3 | 0.5% |
| Europe | 14 | 2.3% |
| Germany | 8 | 1.3% |
| Northern Europe | 3 | 0.5% |
| Western Europe | 8 | 1.3% | View All 7 Rows |
Sex and Age in Mocanaqua
Sex and Age in Mocanaqua
The most populous age groups in Mocanaqua are 25 to 29 Years (44 | 13.4%) for men and 65 to 69 Years (41 | 14.5%) for women.
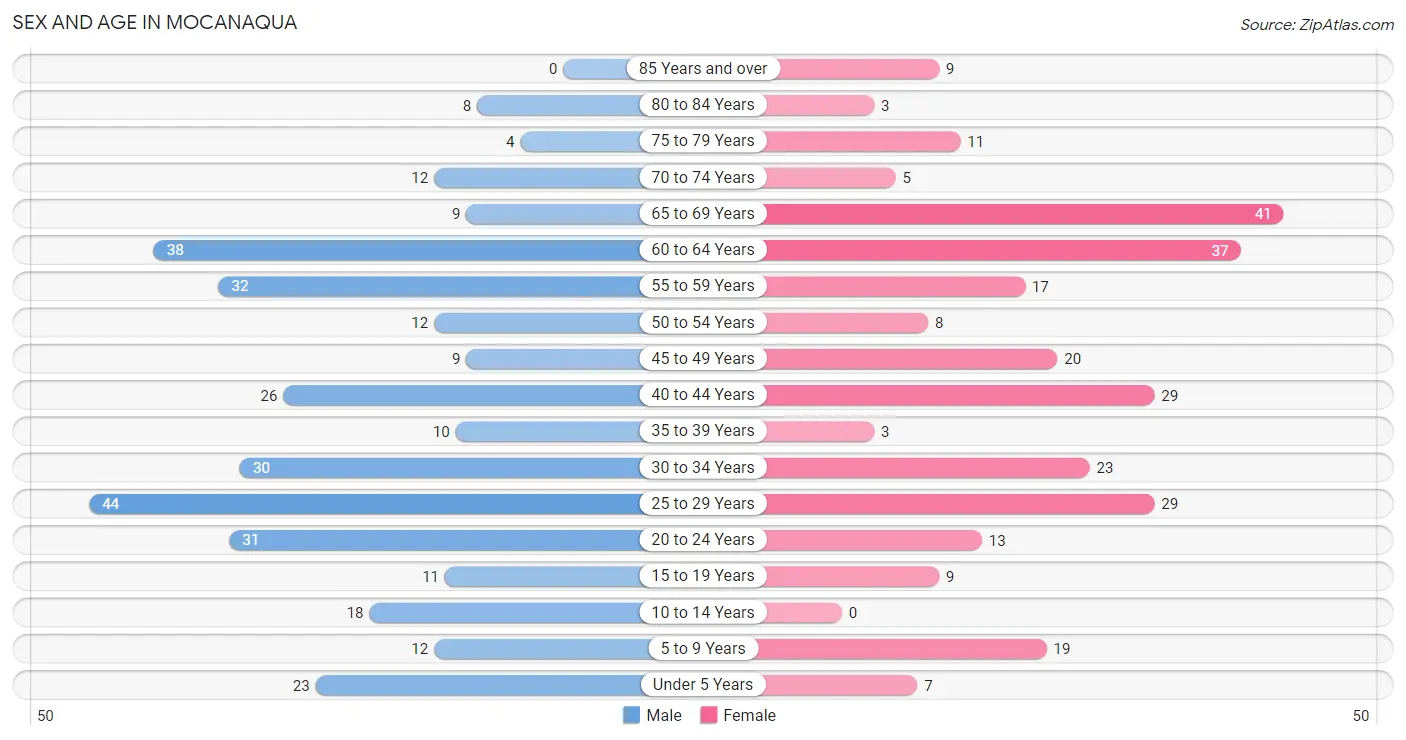
| Age Bracket | Male | Female |
| Under 5 Years | 23 (7.0%) | 7 (2.5%) |
| 5 to 9 Years | 12 (3.6%) | 19 (6.7%) |
| 10 to 14 Years | 18 (5.5%) | 0 (0.0%) |
| 15 to 19 Years | 11 (3.3%) | 9 (3.2%) |
| 20 to 24 Years | 31 (9.4%) | 13 (4.6%) |
| 25 to 29 Years | 44 (13.4%) | 29 (10.2%) |
| 30 to 34 Years | 30 (9.1%) | 23 (8.1%) |
| 35 to 39 Years | 10 (3.0%) | 3 (1.1%) |
| 40 to 44 Years | 26 (7.9%) | 29 (10.2%) |
| 45 to 49 Years | 9 (2.7%) | 20 (7.1%) |
| 50 to 54 Years | 12 (3.6%) | 8 (2.8%) |
| 55 to 59 Years | 32 (9.7%) | 17 (6.0%) |
| 60 to 64 Years | 38 (11.6%) | 37 (13.1%) |
| 65 to 69 Years | 9 (2.7%) | 41 (14.5%) |
| 70 to 74 Years | 12 (3.6%) | 5 (1.8%) |
| 75 to 79 Years | 4 (1.2%) | 11 (3.9%) |
| 80 to 84 Years | 8 (2.4%) | 3 (1.1%) |
| 85 Years and over | 0 (0.0%) | 9 (3.2%) |
| Total | 329 (100.0%) | 283 (100.0%) |
Families and Households in Mocanaqua
Median Family Size in Mocanaqua
The median family size in Mocanaqua is 3.15 persons per family, with single male/father families (15 | 9.7%) accounting for the largest median family size of 4.93 persons per family. On the other hand, single female/mother families (40 | 25.8%) represent the smallest median family size with 2.58 persons per family.
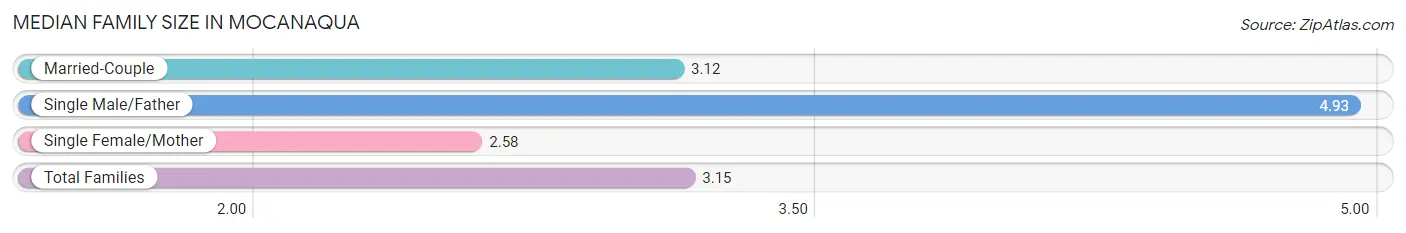
| Family Type | # Families | Family Size |
| Married-Couple | 100 (64.5%) | 3.12 |
| Single Male/Father | 15 (9.7%) | 4.93 |
| Single Female/Mother | 40 (25.8%) | 2.58 |
| Total Families | 155 (100.0%) | 3.15 |
Median Household Size in Mocanaqua
The median household size in Mocanaqua is 2.46 persons per household, with single male/father households (15 | 6.0%) accounting for the largest median household size of 5.6 persons per household. non-family households (94 | 37.8%) represent the smallest median household size with 1.16 persons per household.
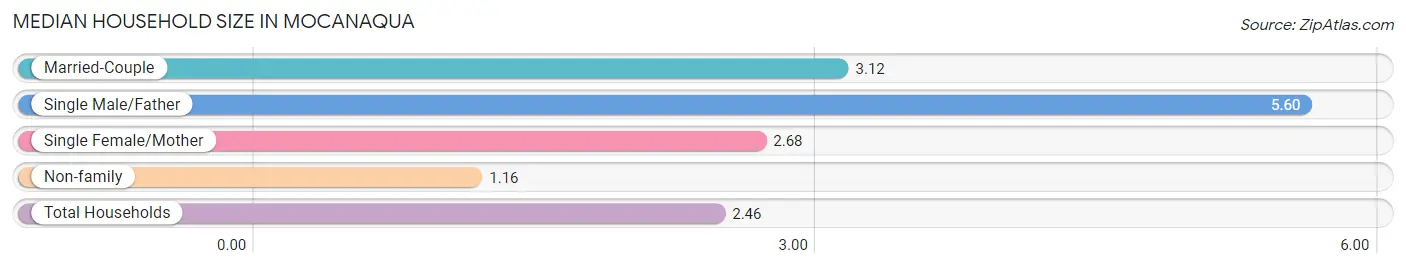
| Household Type | # Households | Household Size |
| Married-Couple | 100 (40.2%) | 3.12 |
| Single Male/Father | 15 (6.0%) | 5.60 |
| Single Female/Mother | 40 (16.1%) | 2.68 |
| Non-family | 94 (37.8%) | 1.16 |
| Total Households | 249 (100.0%) | 2.46 |
Household Size by Marriage Status in Mocanaqua
Out of a total of 249 households in Mocanaqua, 155 (62.3%) are family households, while 94 (37.8%) are nonfamily households. The most numerous type of family households are 2-person households, comprising 95, and the most common type of nonfamily households are 1-person households, comprising 78.
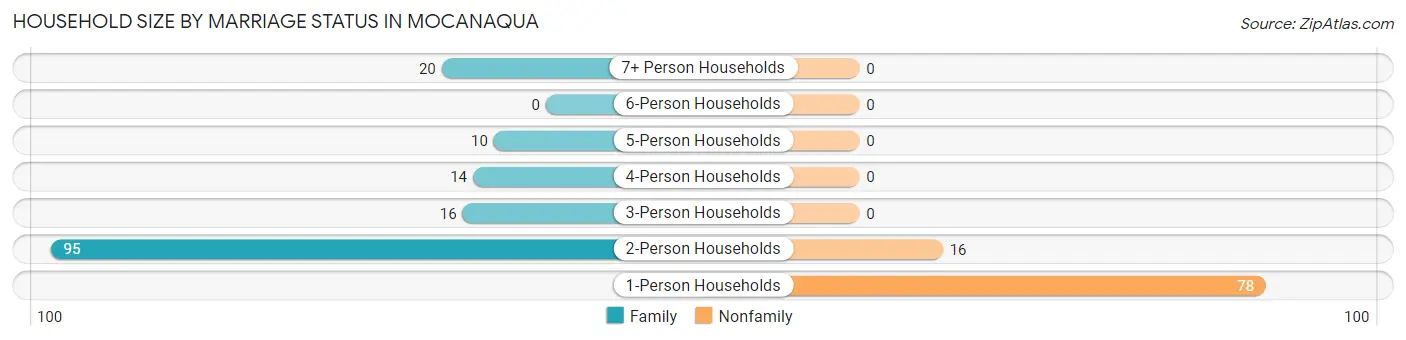
| Household Size | Family Households | Nonfamily Households |
| 1-Person Households | - | 78 (31.3%) |
| 2-Person Households | 95 (38.2%) | 16 (6.4%) |
| 3-Person Households | 16 (6.4%) | 0 (0.0%) |
| 4-Person Households | 14 (5.6%) | 0 (0.0%) |
| 5-Person Households | 10 (4.0%) | 0 (0.0%) |
| 6-Person Households | 0 (0.0%) | 0 (0.0%) |
| 7+ Person Households | 20 (8.0%) | 0 (0.0%) |
| Total | 155 (62.3%) | 94 (37.8%) |
Female Fertility in Mocanaqua
Fertility by Age in Mocanaqua
Average fertility rate in Mocanaqua is 68.0 births per 1,000 women. Women in the age bracket of 20 to 34 years have the highest fertility rate with 138.0 births per 1,000 women. Women in the age bracket of 20 to 34 years acount for 100.0% of all women with births.
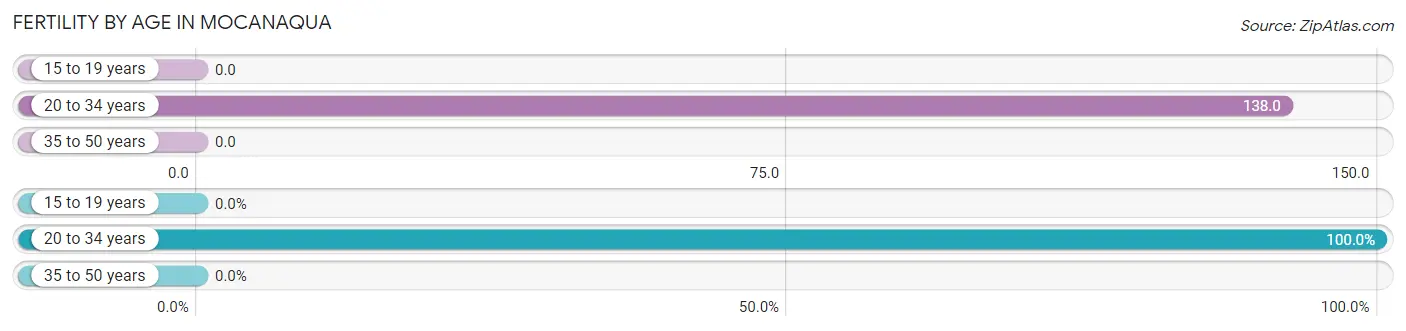
| Age Bracket | Women with Births | Births / 1,000 Women |
| 15 to 19 years | 0 (0.0%) | 0.0 |
| 20 to 34 years | 9 (100.0%) | 138.0 |
| 35 to 50 years | 0 (0.0%) | 0.0 |
| Total | 9 (100.0%) | 68.0 |
Fertility by Age by Marriage Status in Mocanaqua
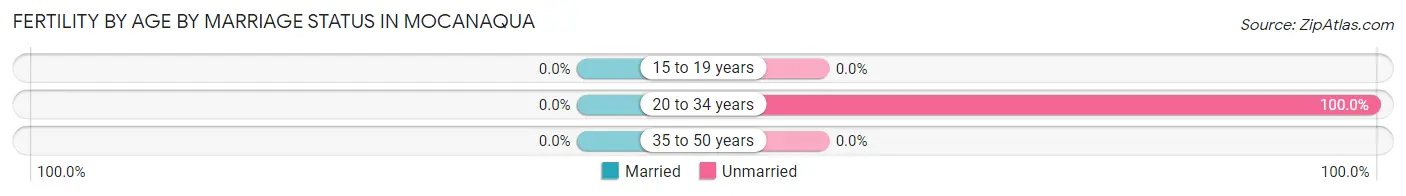
| Age Bracket | Married | Unmarried |
| 15 to 19 years | 0 (0.0%) | 0 (0.0%) |
| 20 to 34 years | 0 (0.0%) | 9 (100.0%) |
| 35 to 50 years | 0 (0.0%) | 0 (0.0%) |
| Total | 0 (0.0%) | 9 (100.0%) |
Fertility by Education in Mocanaqua
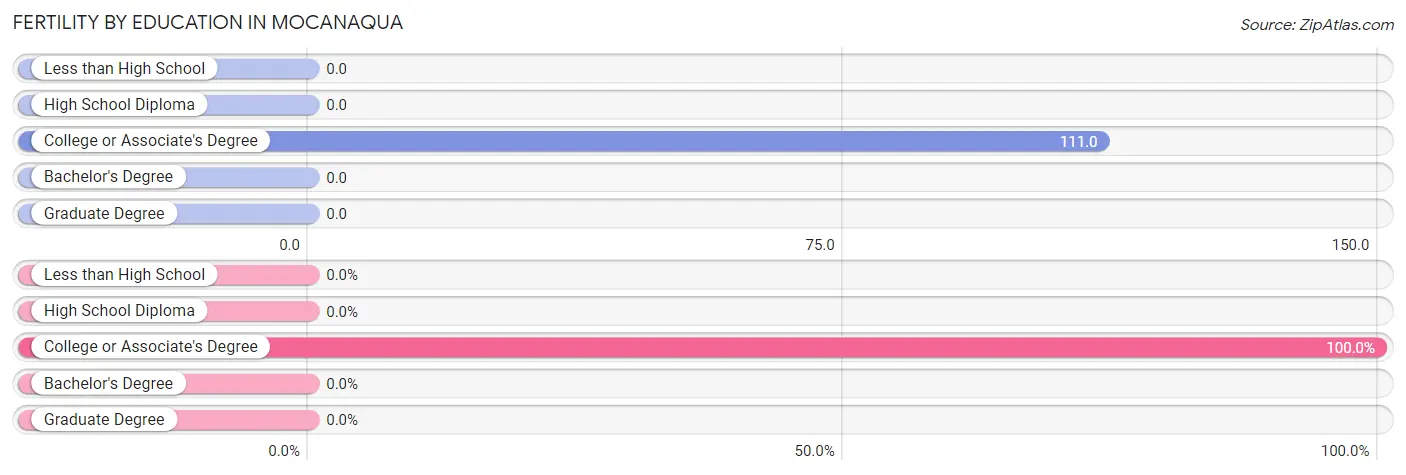
| Educational Attainment | Women with Births | Births / 1,000 Women |
| Less than High School | 0 (0.0%) | 0.0 |
| High School Diploma | 0 (0.0%) | 0.0 |
| College or Associate's Degree | 9 (100.0%) | 111.0 |
| Bachelor's Degree | 0 (0.0%) | 0.0 |
| Graduate Degree | 0 (0.0%) | 0.0 |
| Total | 9 (100.0%) | 68.0 |
Fertility by Education by Marriage Status in Mocanaqua
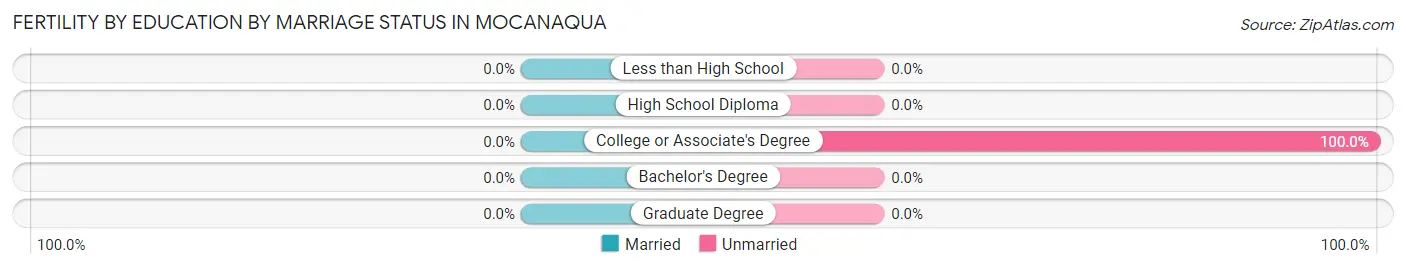
| Educational Attainment | Married | Unmarried |
| Less than High School | 0 (0.0%) | 0 (0.0%) |
| High School Diploma | 0 (0.0%) | 0 (0.0%) |
| College or Associate's Degree | 0 (0.0%) | 9 (100.0%) |
| Bachelor's Degree | 0 (0.0%) | 0 (0.0%) |
| Graduate Degree | 0 (0.0%) | 0 (0.0%) |
| Total | 0 (0.0%) | 9 (100.0%) |
Employment Characteristics in Mocanaqua
Employment by Class of Employer in Mocanaqua
Among the 315 employed individuals in Mocanaqua, private company employees (293 | 93.0%), not-for-profit organizations (10 | 3.2%), and state government employees (7 | 2.2%) make up the most common classes of employment.
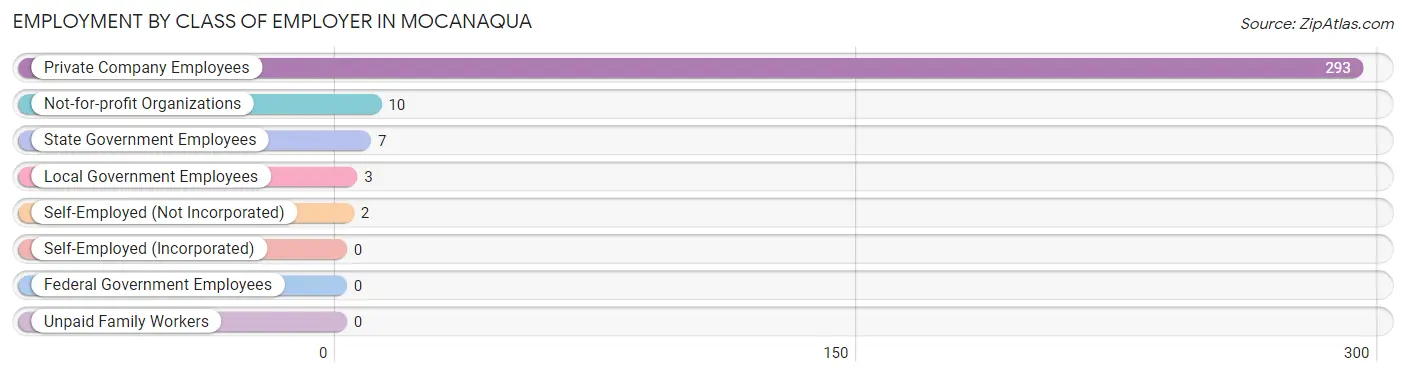
| Employer Class | # Employees | % Employees |
| Private Company Employees | 293 | 93.0% |
| Self-Employed (Incorporated) | 0 | 0.0% |
| Self-Employed (Not Incorporated) | 2 | 0.6% |
| Not-for-profit Organizations | 10 | 3.2% |
| Local Government Employees | 3 | 0.9% |
| State Government Employees | 7 | 2.2% |
| Federal Government Employees | 0 | 0.0% |
| Unpaid Family Workers | 0 | 0.0% |
| Total | 315 | 100.0% |
Employment Status by Age in Mocanaqua
According to the labor force statistics for Mocanaqua, out of the total population over 16 years of age (526), 64.1% or 337 individuals are in the labor force, with 5.6% or 19 of them unemployed. The age group with the highest labor force participation rate is 35 to 44 years, with 94.1% or 64 individuals in the labor force. Within the labor force, the 45 to 54 years age range has the highest percentage of unemployed individuals, with 14.3% or 5 of them being unemployed.
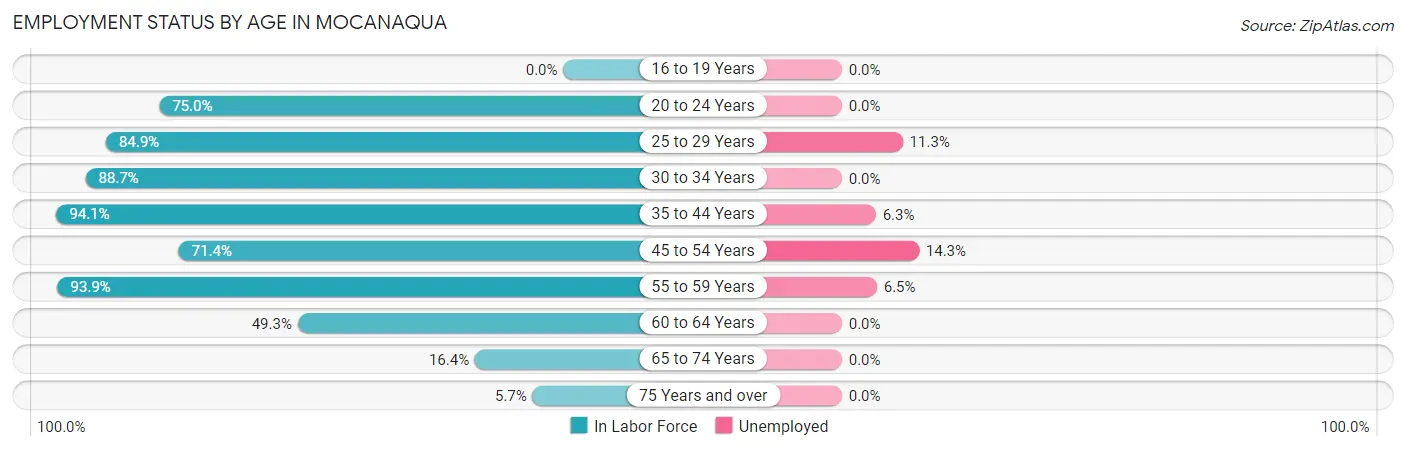
| Age Bracket | In Labor Force | Unemployed |
| 16 to 19 Years | 0 (0.0%) | 0 (0.0%) |
| 20 to 24 Years | 33 (75.0%) | 0 (0.0%) |
| 25 to 29 Years | 62 (84.9%) | 7 (11.3%) |
| 30 to 34 Years | 47 (88.7%) | 0 (0.0%) |
| 35 to 44 Years | 64 (94.1%) | 4 (6.3%) |
| 45 to 54 Years | 35 (71.4%) | 5 (14.3%) |
| 55 to 59 Years | 46 (93.9%) | 3 (6.5%) |
| 60 to 64 Years | 37 (49.3%) | 0 (0.0%) |
| 65 to 74 Years | 11 (16.4%) | 0 (0.0%) |
| 75 Years and over | 2 (5.7%) | 0 (0.0%) |
| Total | 337 (64.1%) | 19 (5.6%) |
Employment Status by Educational Attainment in Mocanaqua
According to labor force statistics for Mocanaqua, 79.3% of individuals (291) out of the total population between 25 and 64 years of age (367) are in the labor force, with 6.5% or 19 of them being unemployed. The group with the highest labor force participation rate are those with the educational attainment of college / associate degree, with 87.3% or 165 individuals in the labor force. Within the labor force, individuals with high school diploma education have the highest percentage of unemployment, with 12.2% or 11 of them being unemployed.
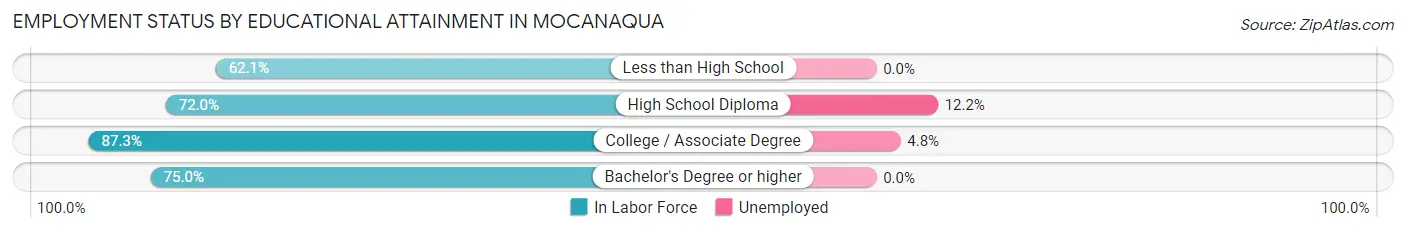
| Educational Attainment | In Labor Force | Unemployed |
| Less than High School | 18 (62.1%) | 0 (0.0%) |
| High School Diploma | 90 (72.0%) | 15 (12.2%) |
| College / Associate Degree | 165 (87.3%) | 9 (4.8%) |
| Bachelor's Degree or higher | 18 (75.0%) | 0 (0.0%) |
| Total | 291 (79.3%) | 24 (6.5%) |
Employment Occupations by Sex in Mocanaqua
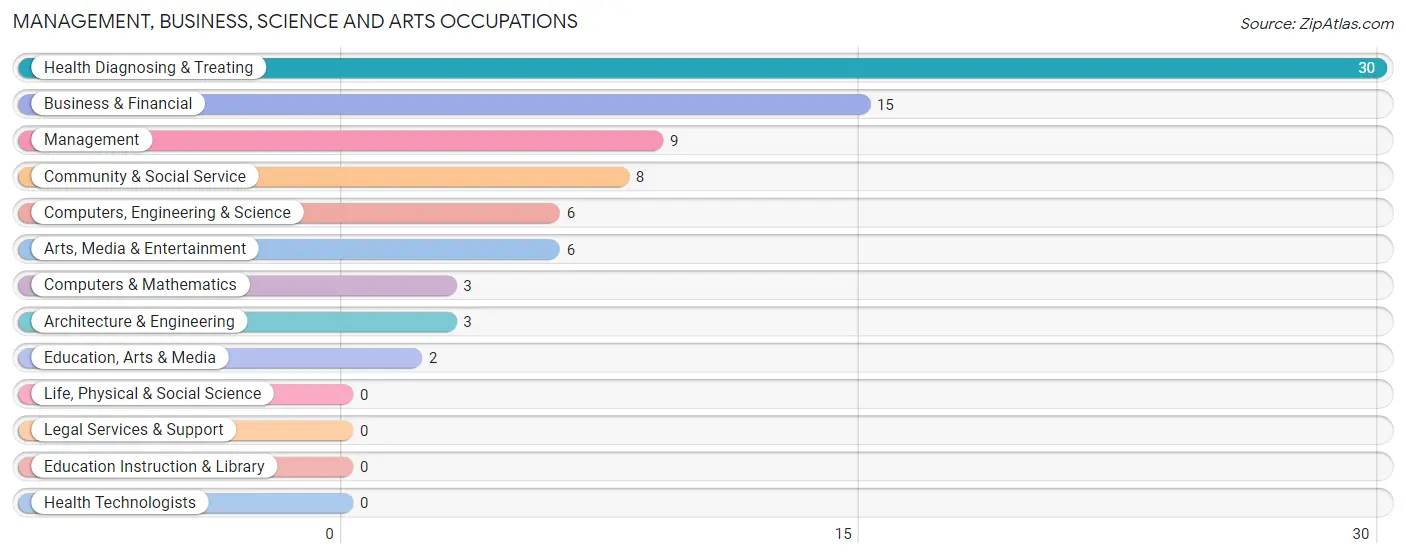
Management, Business, Science and Arts Occupations
The most common Management, Business, Science and Arts occupations in Mocanaqua are Health Diagnosing & Treating (30 | 9.4%), Business & Financial (15 | 4.7%), Management (9 | 2.8%), Community & Social Service (8 | 2.5%), and Computers, Engineering & Science (6 | 1.9%).
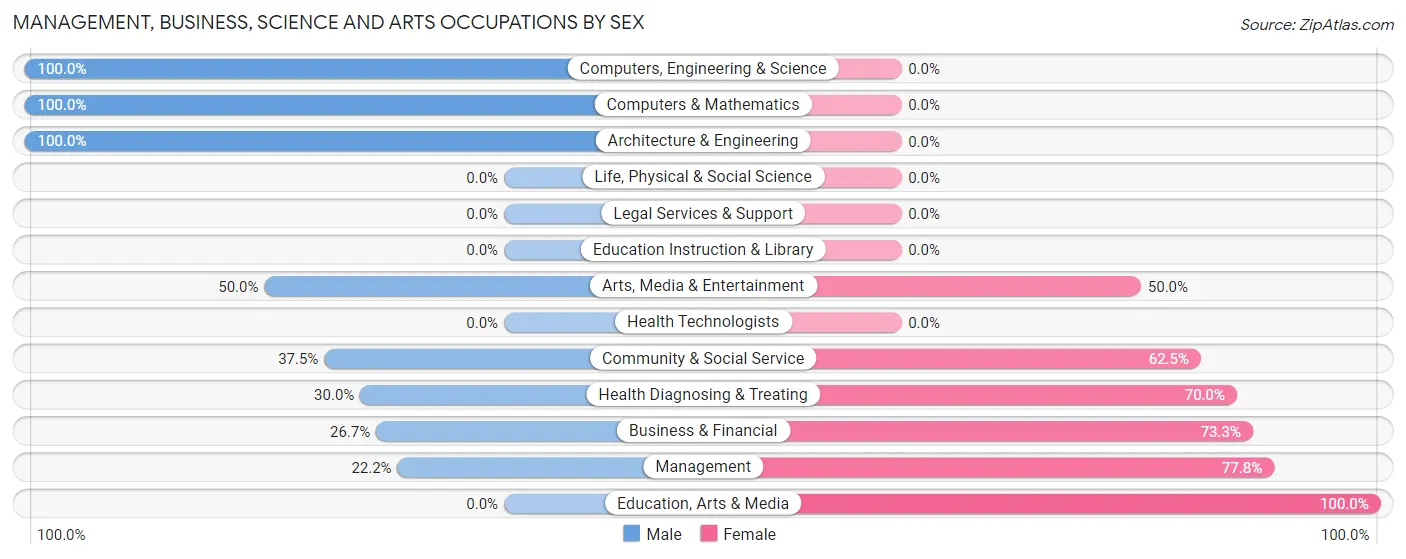
Management, Business, Science and Arts Occupations by Sex
Within the Management, Business, Science and Arts occupations in Mocanaqua, the most male-oriented occupations are Computers, Engineering & Science (100.0%), Computers & Mathematics (100.0%), and Architecture & Engineering (100.0%), while the most female-oriented occupations are Education, Arts & Media (100.0%), Management (77.8%), and Business & Financial (73.3%).
| Occupation | Male | Female |
| Management | 2 (22.2%) | 7 (77.8%) |
| Business & Financial | 4 (26.7%) | 11 (73.3%) |
| Computers, Engineering & Science | 6 (100.0%) | 0 (0.0%) |
| Computers & Mathematics | 3 (100.0%) | 0 (0.0%) |
| Architecture & Engineering | 3 (100.0%) | 0 (0.0%) |
| Life, Physical & Social Science | 0 (0.0%) | 0 (0.0%) |
| Community & Social Service | 3 (37.5%) | 5 (62.5%) |
| Education, Arts & Media | 0 (0.0%) | 2 (100.0%) |
| Legal Services & Support | 0 (0.0%) | 0 (0.0%) |
| Education Instruction & Library | 0 (0.0%) | 0 (0.0%) |
| Arts, Media & Entertainment | 3 (50.0%) | 3 (50.0%) |
| Health Diagnosing & Treating | 9 (30.0%) | 21 (70.0%) |
| Health Technologists | 0 (0.0%) | 0 (0.0%) |
| Total (Category) | 24 (35.3%) | 44 (64.7%) |
| Total (Overall) | 199 (62.6%) | 119 (37.4%) |
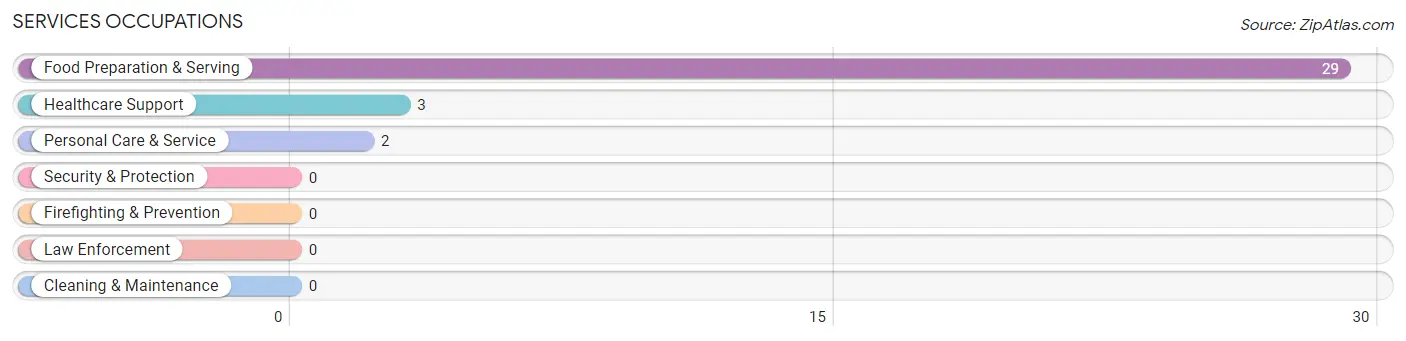
Services Occupations
The most common Services occupations in Mocanaqua are Food Preparation & Serving (29 | 9.1%), Healthcare Support (3 | 0.9%), and Personal Care & Service (2 | 0.6%).
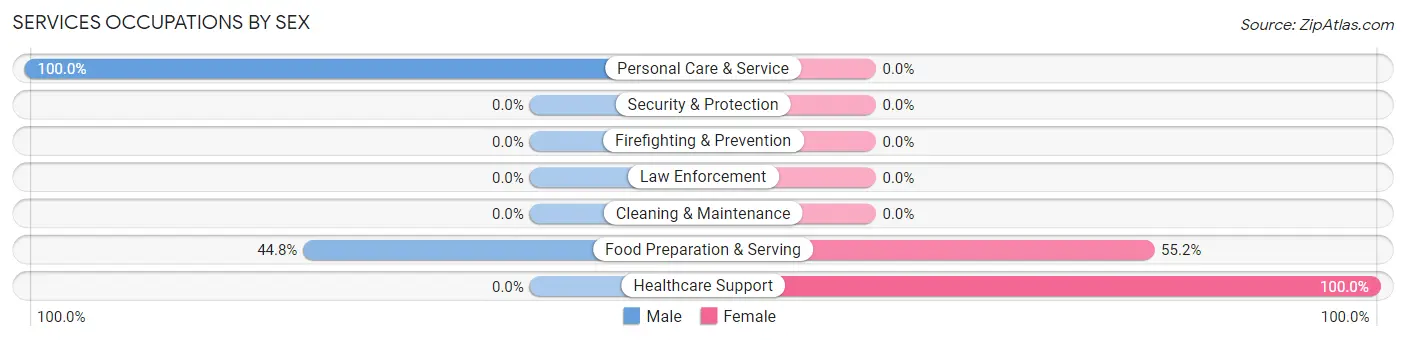
Services Occupations by Sex
Within the Services occupations in Mocanaqua, the most male-oriented occupations are Personal Care & Service (100.0%), and Food Preparation & Serving (44.8%), while the most female-oriented occupations are Healthcare Support (100.0%), and Food Preparation & Serving (55.2%).
| Occupation | Male | Female |
| Healthcare Support | 0 (0.0%) | 3 (100.0%) |
| Security & Protection | 0 (0.0%) | 0 (0.0%) |
| Firefighting & Prevention | 0 (0.0%) | 0 (0.0%) |
| Law Enforcement | 0 (0.0%) | 0 (0.0%) |
| Food Preparation & Serving | 13 (44.8%) | 16 (55.2%) |
| Cleaning & Maintenance | 0 (0.0%) | 0 (0.0%) |
| Personal Care & Service | 2 (100.0%) | 0 (0.0%) |
| Total (Category) | 15 (44.1%) | 19 (55.9%) |
| Total (Overall) | 199 (62.6%) | 119 (37.4%) |
Sales and Office Occupations
The most common Sales and Office occupations in Mocanaqua are Sales & Related (31 | 9.8%), and Office & Administration (24 | 7.5%).
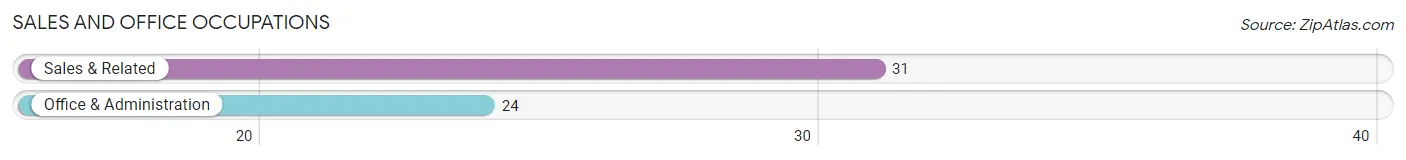
Sales and Office Occupations by Sex
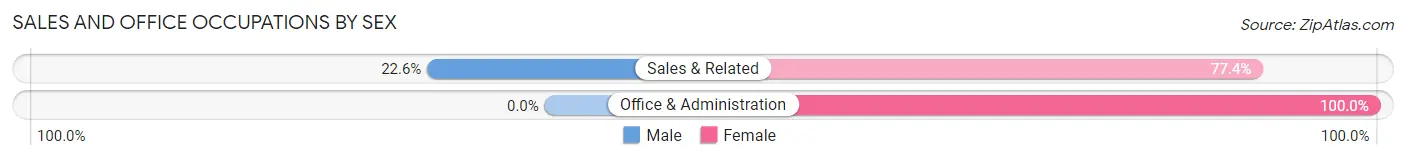
| Occupation | Male | Female |
| Sales & Related | 7 (22.6%) | 24 (77.4%) |
| Office & Administration | 0 (0.0%) | 24 (100.0%) |
| Total (Category) | 7 (12.7%) | 48 (87.3%) |
| Total (Overall) | 199 (62.6%) | 119 (37.4%) |
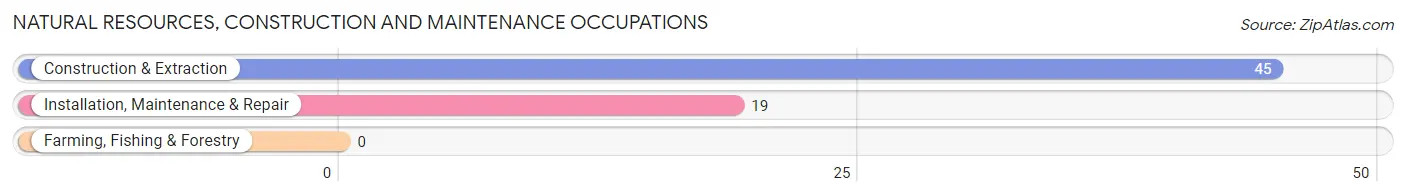
Natural Resources, Construction and Maintenance Occupations
The most common Natural Resources, Construction and Maintenance occupations in Mocanaqua are Construction & Extraction (45 | 14.1%), and Installation, Maintenance & Repair (19 | 6.0%).
Natural Resources, Construction and Maintenance Occupations by Sex
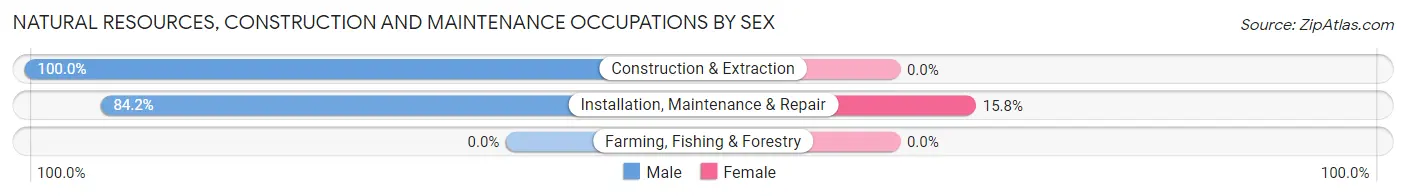
| Occupation | Male | Female |
| Farming, Fishing & Forestry | 0 (0.0%) | 0 (0.0%) |
| Construction & Extraction | 45 (100.0%) | 0 (0.0%) |
| Installation, Maintenance & Repair | 16 (84.2%) | 3 (15.8%) |
| Total (Category) | 61 (95.3%) | 3 (4.7%) |
| Total (Overall) | 199 (62.6%) | 119 (37.4%) |
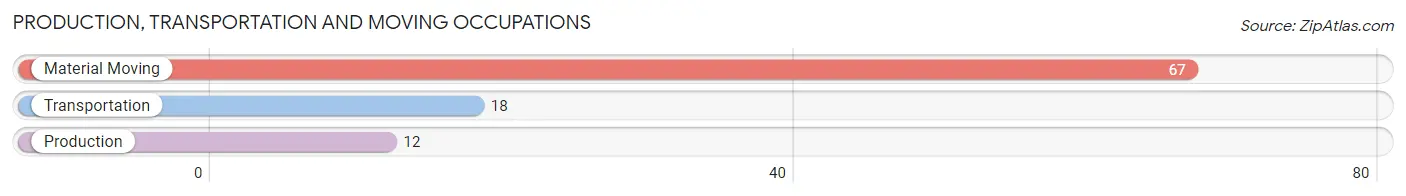
Production, Transportation and Moving Occupations
The most common Production, Transportation and Moving occupations in Mocanaqua are Material Moving (67 | 21.1%), Transportation (18 | 5.7%), and Production (12 | 3.8%).
Production, Transportation and Moving Occupations by Sex
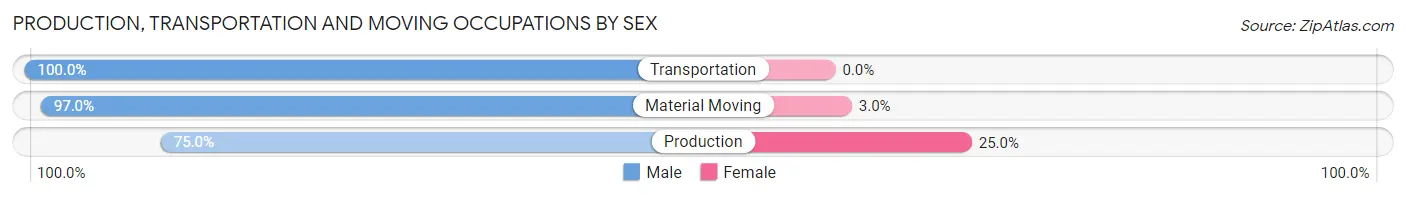
| Occupation | Male | Female |
| Production | 9 (75.0%) | 3 (25.0%) |
| Transportation | 18 (100.0%) | 0 (0.0%) |
| Material Moving | 65 (97.0%) | 2 (3.0%) |
| Total (Category) | 92 (94.9%) | 5 (5.1%) |
| Total (Overall) | 199 (62.6%) | 119 (37.4%) |
Employment Industries by Sex in Mocanaqua
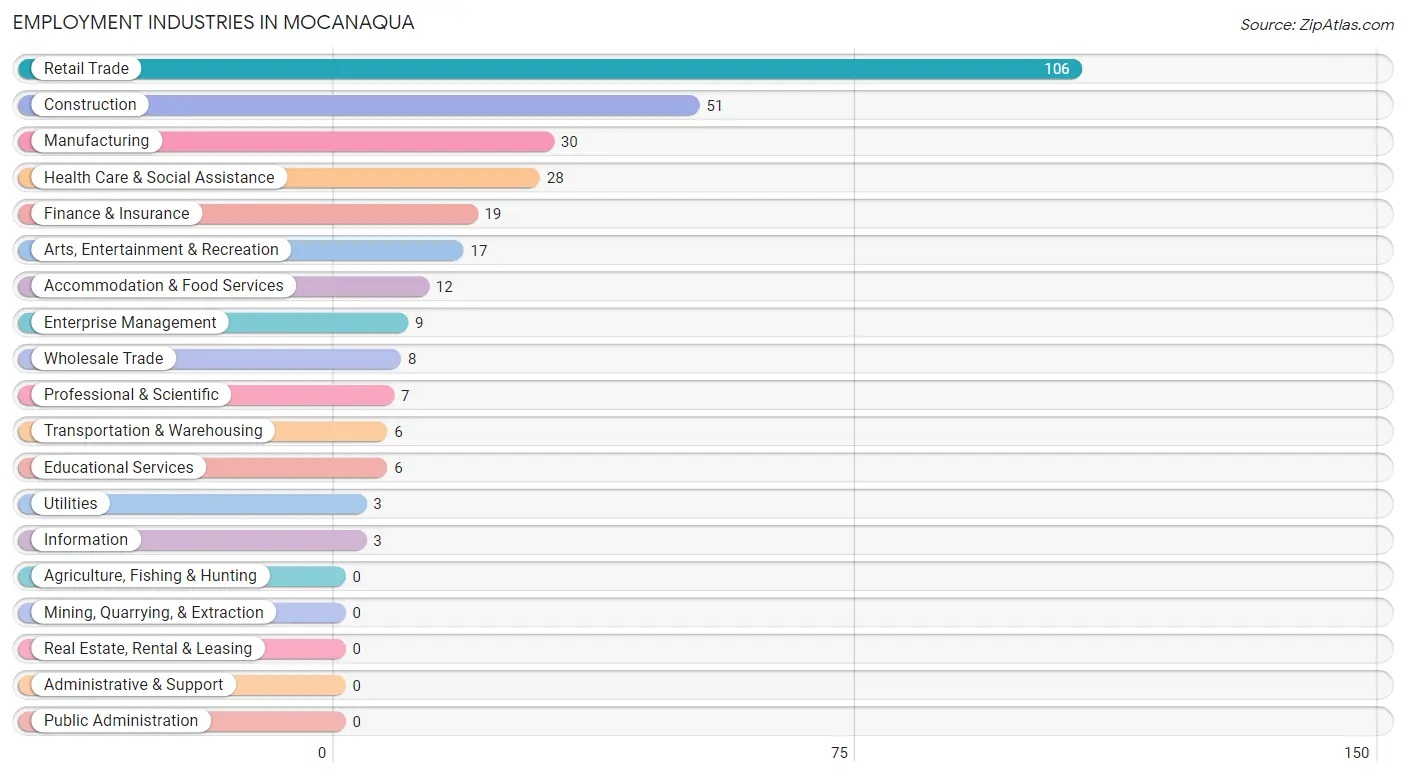
Employment Industries in Mocanaqua
The major employment industries in Mocanaqua include Retail Trade (106 | 33.3%), Construction (51 | 16.0%), Manufacturing (30 | 9.4%), Health Care & Social Assistance (28 | 8.8%), and Finance & Insurance (19 | 6.0%).
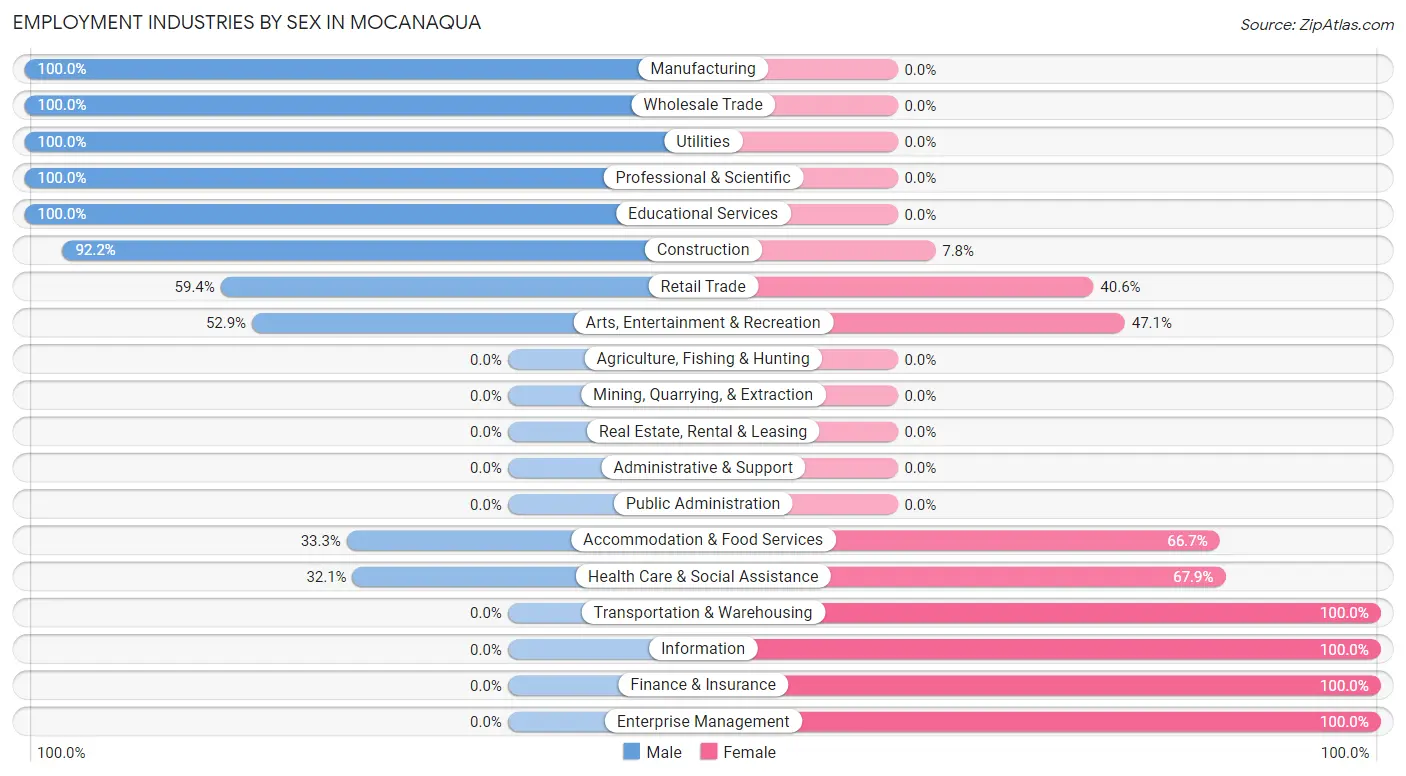
Employment Industries by Sex in Mocanaqua
The Mocanaqua industries that see more men than women are Manufacturing (100.0%), Wholesale Trade (100.0%), and Utilities (100.0%), whereas the industries that tend to have a higher number of women are Transportation & Warehousing (100.0%), Information (100.0%), and Finance & Insurance (100.0%).
| Industry | Male | Female |
| Agriculture, Fishing & Hunting | 0 (0.0%) | 0 (0.0%) |
| Mining, Quarrying, & Extraction | 0 (0.0%) | 0 (0.0%) |
| Construction | 47 (92.2%) | 4 (7.8%) |
| Manufacturing | 30 (100.0%) | 0 (0.0%) |
| Wholesale Trade | 8 (100.0%) | 0 (0.0%) |
| Retail Trade | 63 (59.4%) | 43 (40.6%) |
| Transportation & Warehousing | 0 (0.0%) | 6 (100.0%) |
| Utilities | 3 (100.0%) | 0 (0.0%) |
| Information | 0 (0.0%) | 3 (100.0%) |
| Finance & Insurance | 0 (0.0%) | 19 (100.0%) |
| Real Estate, Rental & Leasing | 0 (0.0%) | 0 (0.0%) |
| Professional & Scientific | 7 (100.0%) | 0 (0.0%) |
| Enterprise Management | 0 (0.0%) | 9 (100.0%) |
| Administrative & Support | 0 (0.0%) | 0 (0.0%) |
| Educational Services | 6 (100.0%) | 0 (0.0%) |
| Health Care & Social Assistance | 9 (32.1%) | 19 (67.9%) |
| Arts, Entertainment & Recreation | 9 (52.9%) | 8 (47.1%) |
| Accommodation & Food Services | 4 (33.3%) | 8 (66.7%) |
| Public Administration | 0 (0.0%) | 0 (0.0%) |
| Total | 199 (62.6%) | 119 (37.4%) |
Education in Mocanaqua
School Enrollment in Mocanaqua
The most common levels of schooling among the 74 students in Mocanaqua are elementary school (18 | 24.3%), high school (16 | 21.6%), and college / undergraduate (16 | 21.6%).
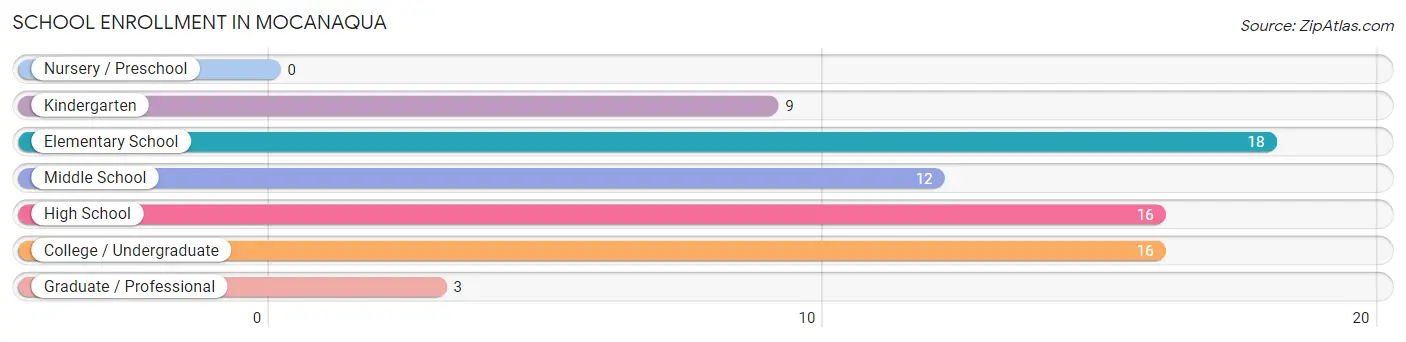
| School Level | # Students | % Students |
| Nursery / Preschool | 0 | 0.0% |
| Kindergarten | 9 | 12.2% |
| Elementary School | 18 | 24.3% |
| Middle School | 12 | 16.2% |
| High School | 16 | 21.6% |
| College / Undergraduate | 16 | 21.6% |
| Graduate / Professional | 3 | 4.1% |
| Total | 74 | 100.0% |
School Enrollment by Age by Funding Source in Mocanaqua
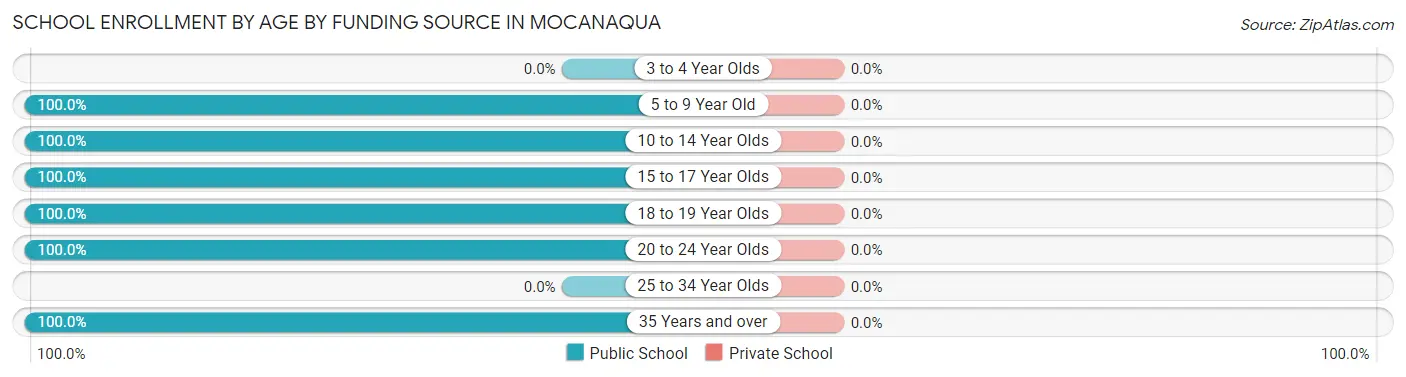
| Age Bracket | Public School | Private School |
| 3 to 4 Year Olds | 0 (0.0%) | 0 (0.0%) |
| 5 to 9 Year Old | 21 (100.0%) | 0 (0.0%) |
| 10 to 14 Year Olds | 18 (100.0%) | 0 (0.0%) |
| 15 to 17 Year Olds | 16 (100.0%) | 0 (0.0%) |
| 18 to 19 Year Olds | 4 (100.0%) | 0 (0.0%) |
| 20 to 24 Year Olds | 3 (100.0%) | 0 (0.0%) |
| 25 to 34 Year Olds | 0 (0.0%) | 0 (0.0%) |
| 35 Years and over | 12 (100.0%) | 0 (0.0%) |
| Total | 74 (100.0%) | 0 (0.0%) |
Educational Attainment by Field of Study in Mocanaqua
Education (16 | 48.5%), arts & humanities (11 | 33.3%), social sciences (4 | 12.1%), and business (2 | 6.1%) are the most common fields of study among 33 individuals in Mocanaqua who have obtained a bachelor's degree or higher.
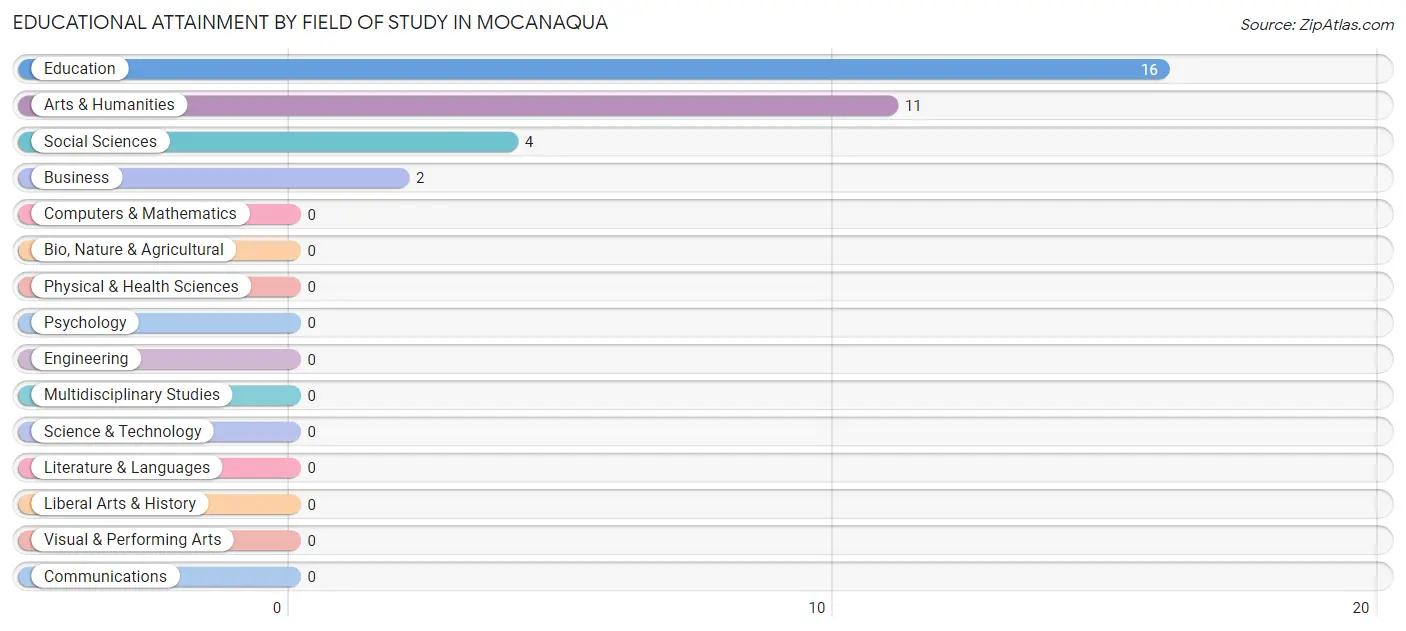
| Field of Study | # Graduates | % Graduates |
| Computers & Mathematics | 0 | 0.0% |
| Bio, Nature & Agricultural | 0 | 0.0% |
| Physical & Health Sciences | 0 | 0.0% |
| Psychology | 0 | 0.0% |
| Social Sciences | 4 | 12.1% |
| Engineering | 0 | 0.0% |
| Multidisciplinary Studies | 0 | 0.0% |
| Science & Technology | 0 | 0.0% |
| Business | 2 | 6.1% |
| Education | 16 | 48.5% |
| Literature & Languages | 0 | 0.0% |
| Liberal Arts & History | 0 | 0.0% |
| Visual & Performing Arts | 0 | 0.0% |
| Communications | 0 | 0.0% |
| Arts & Humanities | 11 | 33.3% |
| Total | 33 | 100.0% |
Transportation & Commute in Mocanaqua
Vehicle Availability by Sex in Mocanaqua
The most prevalent vehicle ownership categories in Mocanaqua are males with 2 vehicles (65, accounting for 32.7%) and females with 2 vehicles (45, making up 56.0%).
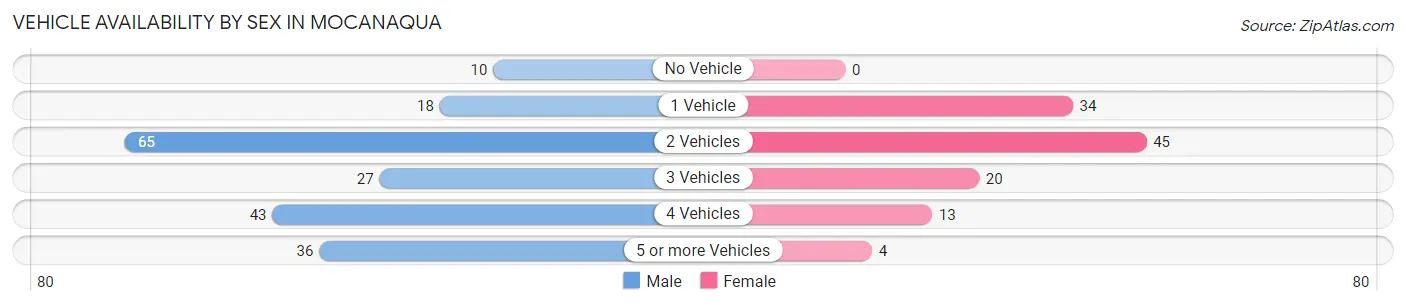
| Vehicles Available | Male | Female |
| No Vehicle | 10 (5.0%) | 0 (0.0%) |
| 1 Vehicle | 18 (9.0%) | 34 (29.3%) |
| 2 Vehicles | 65 (32.7%) | 45 (38.8%) |
| 3 Vehicles | 27 (13.6%) | 20 (17.2%) |
| 4 Vehicles | 43 (21.6%) | 13 (11.2%) |
| 5 or more Vehicles | 36 (18.1%) | 4 (3.5%) |
| Total | 199 (100.0%) | 116 (100.0%) |
Commute Time in Mocanaqua
The most frequently occuring commute durations in Mocanaqua are 30 to 34 minutes (126 commuters, 42.3%), 20 to 24 minutes (37 commuters, 12.4%), and 45 to 59 minutes (37 commuters, 12.4%).
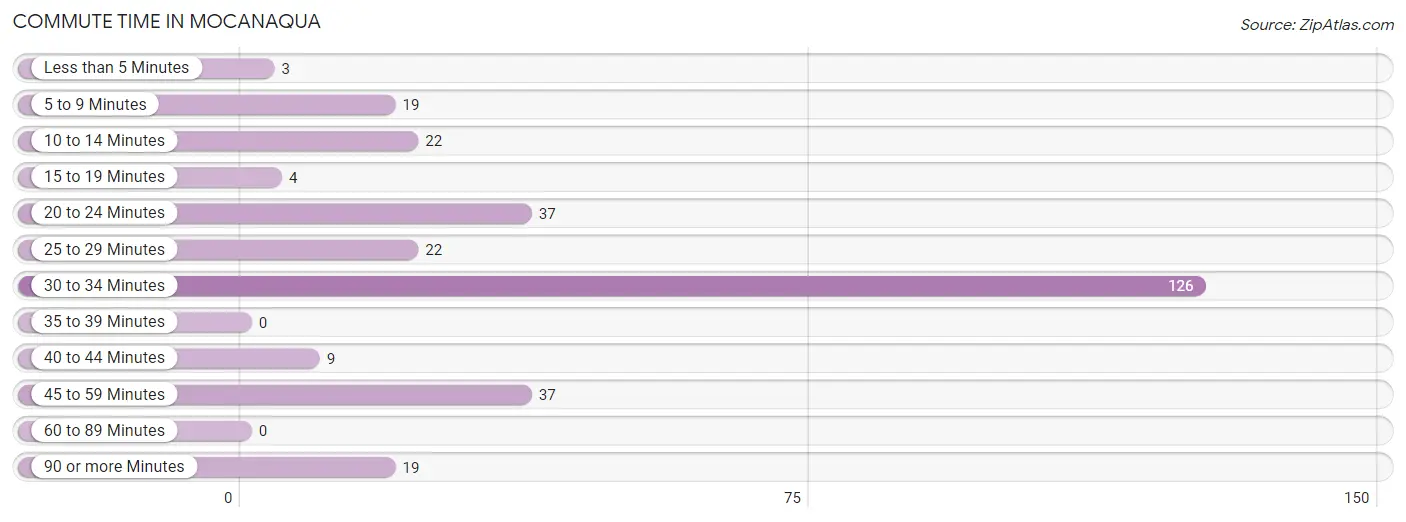
| Commute Time | # Commuters | % Commuters |
| Less than 5 Minutes | 3 | 1.0% |
| 5 to 9 Minutes | 19 | 6.4% |
| 10 to 14 Minutes | 22 | 7.4% |
| 15 to 19 Minutes | 4 | 1.3% |
| 20 to 24 Minutes | 37 | 12.4% |
| 25 to 29 Minutes | 22 | 7.4% |
| 30 to 34 Minutes | 126 | 42.3% |
| 35 to 39 Minutes | 0 | 0.0% |
| 40 to 44 Minutes | 9 | 3.0% |
| 45 to 59 Minutes | 37 | 12.4% |
| 60 to 89 Minutes | 0 | 0.0% |
| 90 or more Minutes | 19 | 6.4% |
Commute Time by Sex in Mocanaqua
The most common commute times in Mocanaqua are 30 to 34 minutes (81 commuters, 42.0%) for males and 30 to 34 minutes (45 commuters, 42.9%) for females.
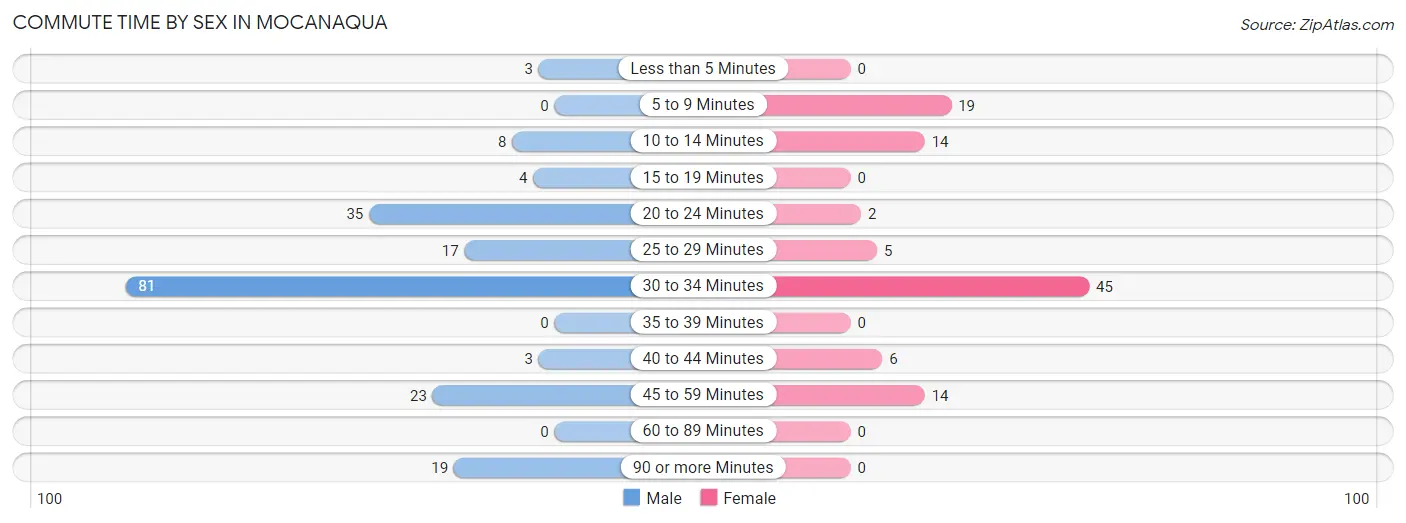
| Commute Time | Male | Female |
| Less than 5 Minutes | 3 (1.5%) | 0 (0.0%) |
| 5 to 9 Minutes | 0 (0.0%) | 19 (18.1%) |
| 10 to 14 Minutes | 8 (4.2%) | 14 (13.3%) |
| 15 to 19 Minutes | 4 (2.1%) | 0 (0.0%) |
| 20 to 24 Minutes | 35 (18.1%) | 2 (1.9%) |
| 25 to 29 Minutes | 17 (8.8%) | 5 (4.8%) |
| 30 to 34 Minutes | 81 (42.0%) | 45 (42.9%) |
| 35 to 39 Minutes | 0 (0.0%) | 0 (0.0%) |
| 40 to 44 Minutes | 3 (1.5%) | 6 (5.7%) |
| 45 to 59 Minutes | 23 (11.9%) | 14 (13.3%) |
| 60 to 89 Minutes | 0 (0.0%) | 0 (0.0%) |
| 90 or more Minutes | 19 (9.8%) | 0 (0.0%) |
Time of Departure to Work by Sex in Mocanaqua
The most frequent times of departure to work in Mocanaqua are 4:00 PM to 11:59 PM (50, 25.9%) for males and 7:00 AM to 7:29 AM (33, 31.4%) for females.
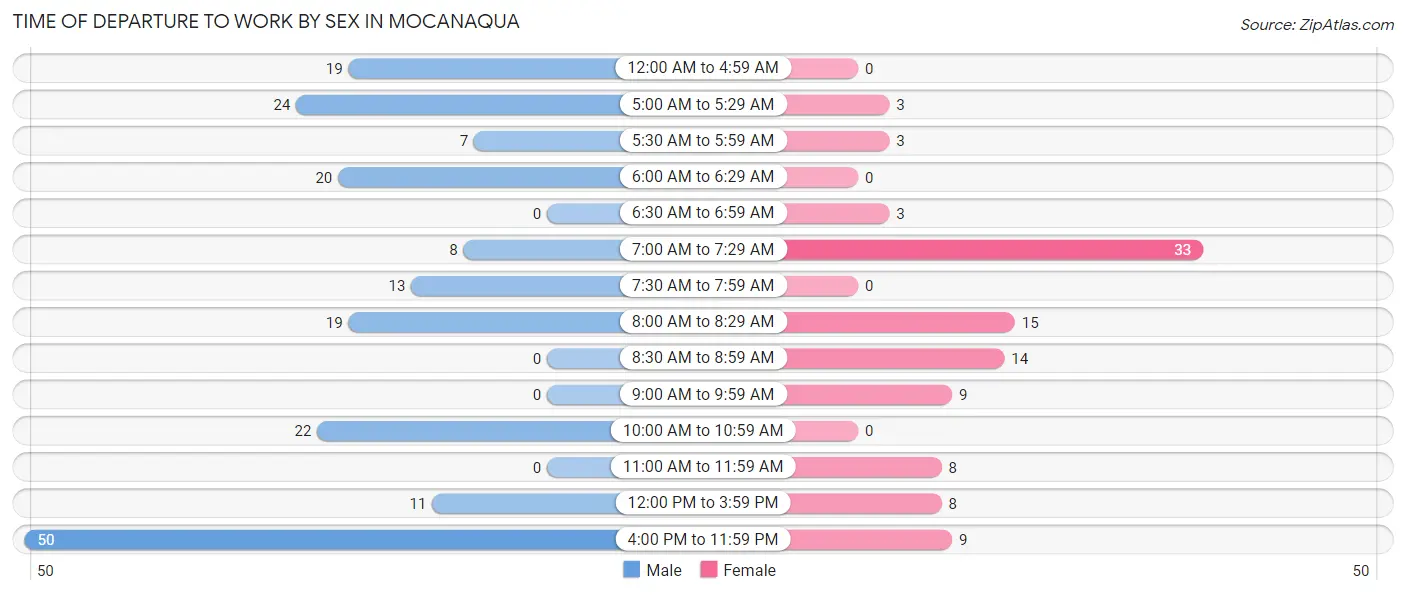
| Time of Departure | Male | Female |
| 12:00 AM to 4:59 AM | 19 (9.8%) | 0 (0.0%) |
| 5:00 AM to 5:29 AM | 24 (12.4%) | 3 (2.9%) |
| 5:30 AM to 5:59 AM | 7 (3.6%) | 3 (2.9%) |
| 6:00 AM to 6:29 AM | 20 (10.4%) | 0 (0.0%) |
| 6:30 AM to 6:59 AM | 0 (0.0%) | 3 (2.9%) |
| 7:00 AM to 7:29 AM | 8 (4.2%) | 33 (31.4%) |
| 7:30 AM to 7:59 AM | 13 (6.7%) | 0 (0.0%) |
| 8:00 AM to 8:29 AM | 19 (9.8%) | 15 (14.3%) |
| 8:30 AM to 8:59 AM | 0 (0.0%) | 14 (13.3%) |
| 9:00 AM to 9:59 AM | 0 (0.0%) | 9 (8.6%) |
| 10:00 AM to 10:59 AM | 22 (11.4%) | 0 (0.0%) |
| 11:00 AM to 11:59 AM | 0 (0.0%) | 8 (7.6%) |
| 12:00 PM to 3:59 PM | 11 (5.7%) | 8 (7.6%) |
| 4:00 PM to 11:59 PM | 50 (25.9%) | 9 (8.6%) |
| Total | 193 (100.0%) | 105 (100.0%) |
Housing Occupancy in Mocanaqua
Occupancy by Ownership in Mocanaqua
Of the total 249 dwellings in Mocanaqua, owner-occupied units account for 143 (57.4%), while renter-occupied units make up 106 (42.6%).
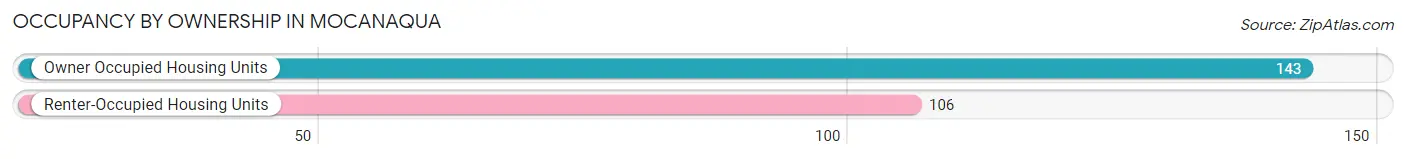
| Occupancy | # Housing Units | % Housing Units |
| Owner Occupied Housing Units | 143 | 57.4% |
| Renter-Occupied Housing Units | 106 | 42.6% |
| Total Occupied Housing Units | 249 | 100.0% |
Occupancy by Household Size in Mocanaqua
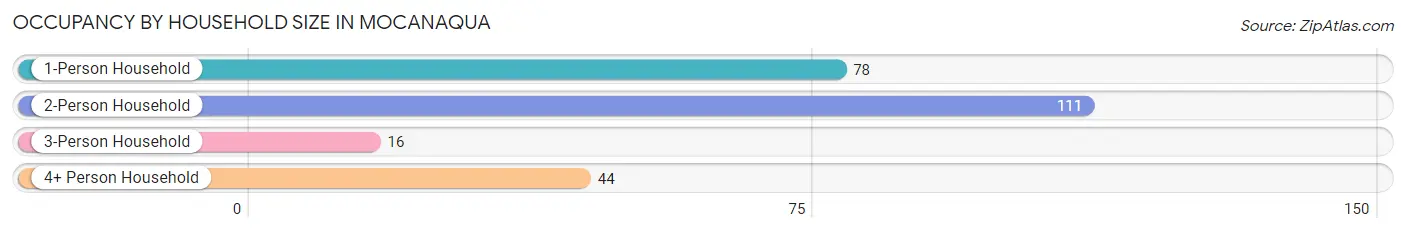
| Household Size | # Housing Units | % Housing Units |
| 1-Person Household | 78 | 31.3% |
| 2-Person Household | 111 | 44.6% |
| 3-Person Household | 16 | 6.4% |
| 4+ Person Household | 44 | 17.7% |
| Total Housing Units | 249 | 100.0% |
Occupancy by Ownership by Household Size in Mocanaqua
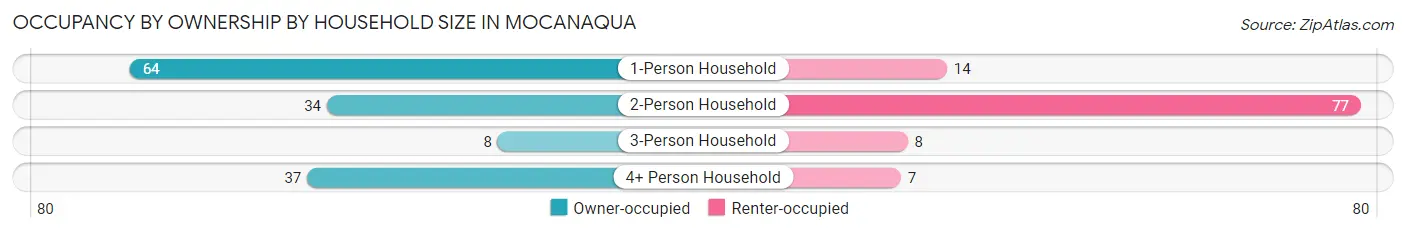
| Household Size | Owner-occupied | Renter-occupied |
| 1-Person Household | 64 (82.1%) | 14 (17.9%) |
| 2-Person Household | 34 (30.6%) | 77 (69.4%) |
| 3-Person Household | 8 (50.0%) | 8 (50.0%) |
| 4+ Person Household | 37 (84.1%) | 7 (15.9%) |
| Total Housing Units | 143 (57.4%) | 106 (42.6%) |
Occupancy by Educational Attainment in Mocanaqua
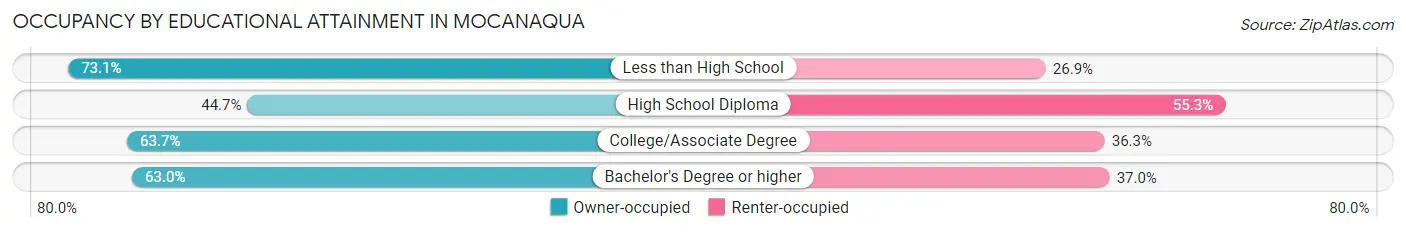
| Household Size | Owner-occupied | Renter-occupied |
| Less than High School | 19 (73.1%) | 7 (26.9%) |
| High School Diploma | 42 (44.7%) | 52 (55.3%) |
| College/Associate Degree | 65 (63.7%) | 37 (36.3%) |
| Bachelor's Degree or higher | 17 (63.0%) | 10 (37.0%) |
Occupancy by Age of Householder in Mocanaqua
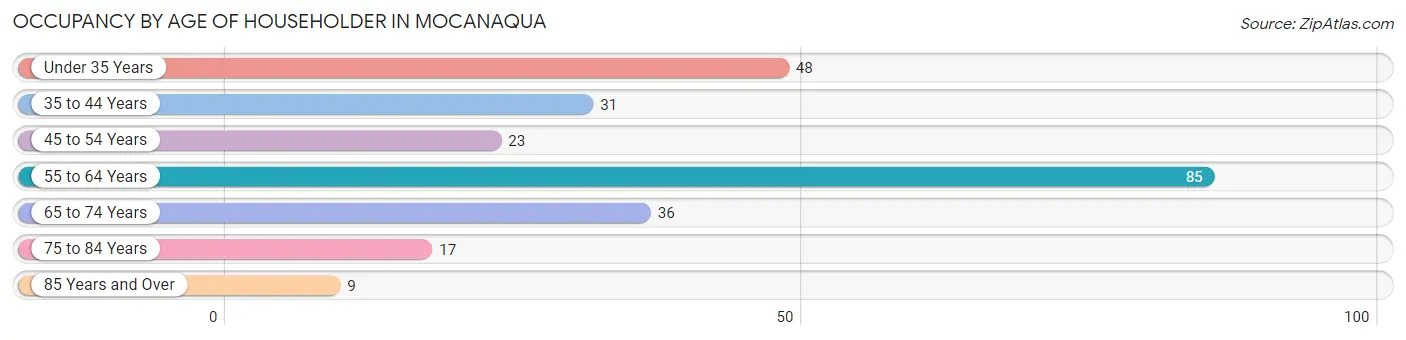
| Age Bracket | # Households | % Households |
| Under 35 Years | 48 | 19.3% |
| 35 to 44 Years | 31 | 12.4% |
| 45 to 54 Years | 23 | 9.2% |
| 55 to 64 Years | 85 | 34.1% |
| 65 to 74 Years | 36 | 14.5% |
| 75 to 84 Years | 17 | 6.8% |
| 85 Years and Over | 9 | 3.6% |
| Total | 249 | 100.0% |
Housing Finances in Mocanaqua
Median Income by Occupancy in Mocanaqua
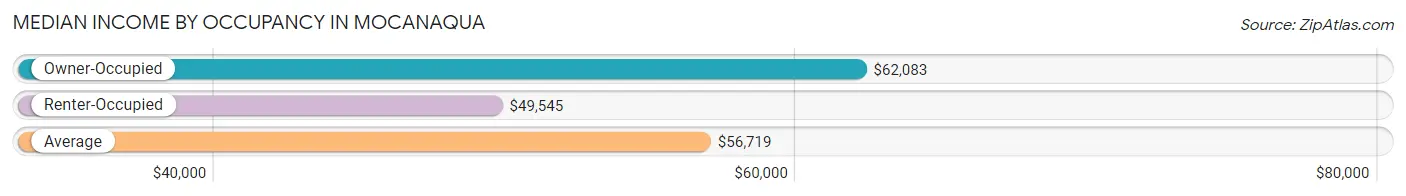
| Occupancy Type | # Households | Median Income |
| Owner-Occupied | 143 (57.4%) | $62,083 |
| Renter-Occupied | 106 (42.6%) | $49,545 |
| Average | 249 (100.0%) | $56,719 |
Occupancy by Householder Income Bracket in Mocanaqua
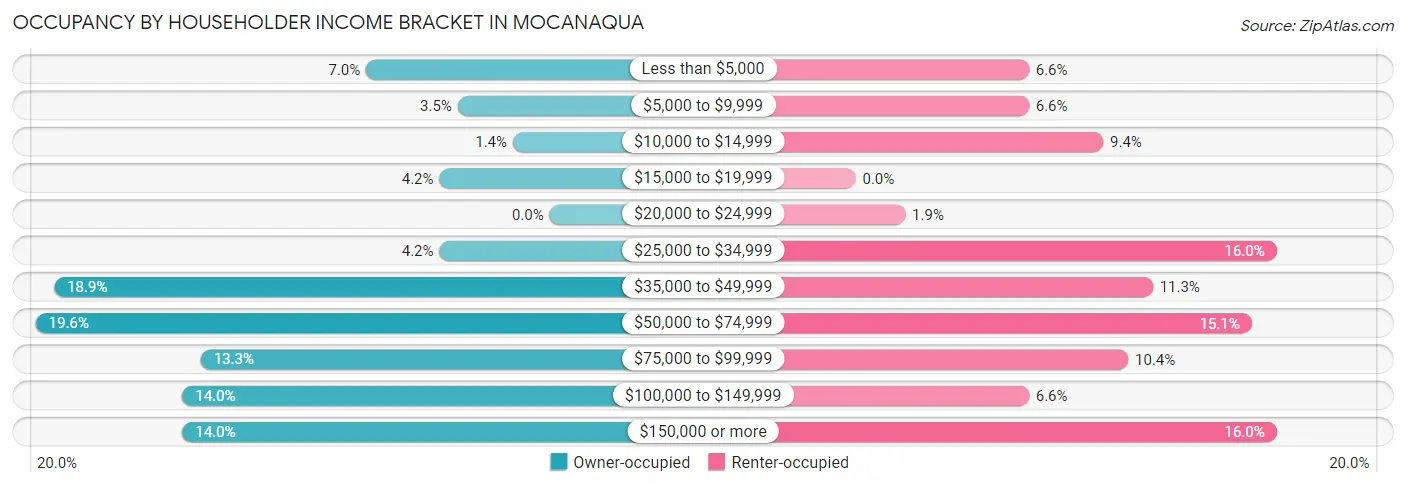
| Income Bracket | Owner-occupied | Renter-occupied |
| Less than $5,000 | 10 (7.0%) | 7 (6.6%) |
| $5,000 to $9,999 | 5 (3.5%) | 7 (6.6%) |
| $10,000 to $14,999 | 2 (1.4%) | 10 (9.4%) |
| $15,000 to $19,999 | 6 (4.2%) | 0 (0.0%) |
| $20,000 to $24,999 | 0 (0.0%) | 2 (1.9%) |
| $25,000 to $34,999 | 6 (4.2%) | 17 (16.0%) |
| $35,000 to $49,999 | 27 (18.9%) | 12 (11.3%) |
| $50,000 to $74,999 | 28 (19.6%) | 16 (15.1%) |
| $75,000 to $99,999 | 19 (13.3%) | 11 (10.4%) |
| $100,000 to $149,999 | 20 (14.0%) | 7 (6.6%) |
| $150,000 or more | 20 (14.0%) | 17 (16.0%) |
| Total | 143 (100.0%) | 106 (100.0%) |
Monthly Housing Cost Tiers in Mocanaqua
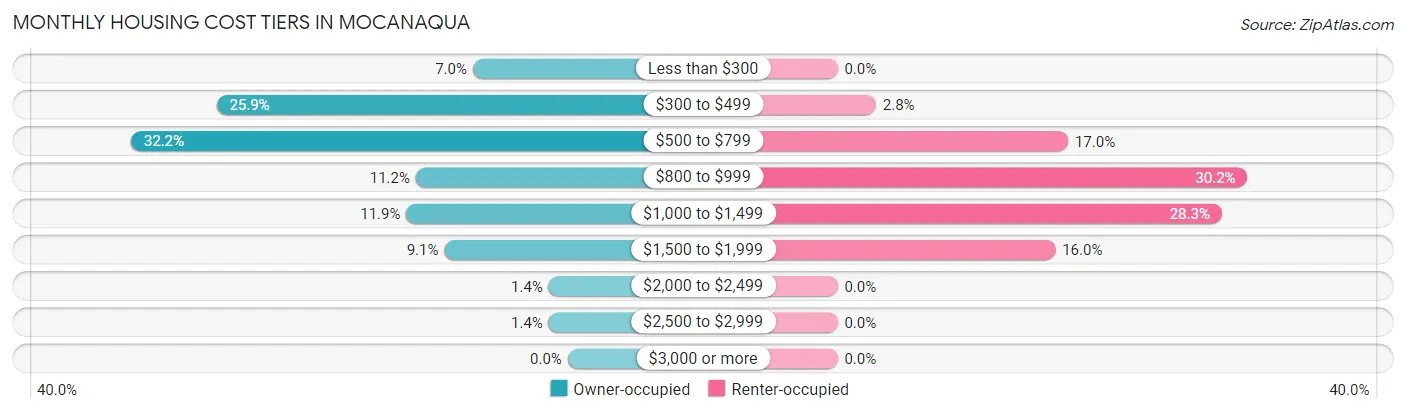
| Monthly Cost | Owner-occupied | Renter-occupied |
| Less than $300 | 10 (7.0%) | 0 (0.0%) |
| $300 to $499 | 37 (25.9%) | 3 (2.8%) |
| $500 to $799 | 46 (32.2%) | 18 (17.0%) |
| $800 to $999 | 16 (11.2%) | 32 (30.2%) |
| $1,000 to $1,499 | 17 (11.9%) | 30 (28.3%) |
| $1,500 to $1,999 | 13 (9.1%) | 17 (16.0%) |
| $2,000 to $2,499 | 2 (1.4%) | 0 (0.0%) |
| $2,500 to $2,999 | 2 (1.4%) | 0 (0.0%) |
| $3,000 or more | 0 (0.0%) | 0 (0.0%) |
| Total | 143 (100.0%) | 106 (100.0%) |
Physical Housing Characteristics in Mocanaqua
Housing Structures in Mocanaqua
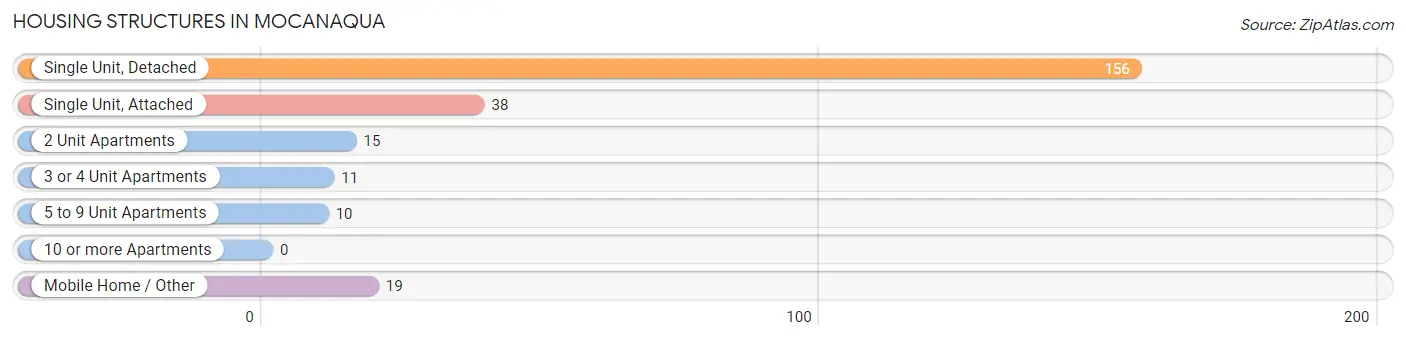
| Structure Type | # Housing Units | % Housing Units |
| Single Unit, Detached | 156 | 62.6% |
| Single Unit, Attached | 38 | 15.3% |
| 2 Unit Apartments | 15 | 6.0% |
| 3 or 4 Unit Apartments | 11 | 4.4% |
| 5 to 9 Unit Apartments | 10 | 4.0% |
| 10 or more Apartments | 0 | 0.0% |
| Mobile Home / Other | 19 | 7.6% |
| Total | 249 | 100.0% |
Housing Structures by Occupancy in Mocanaqua
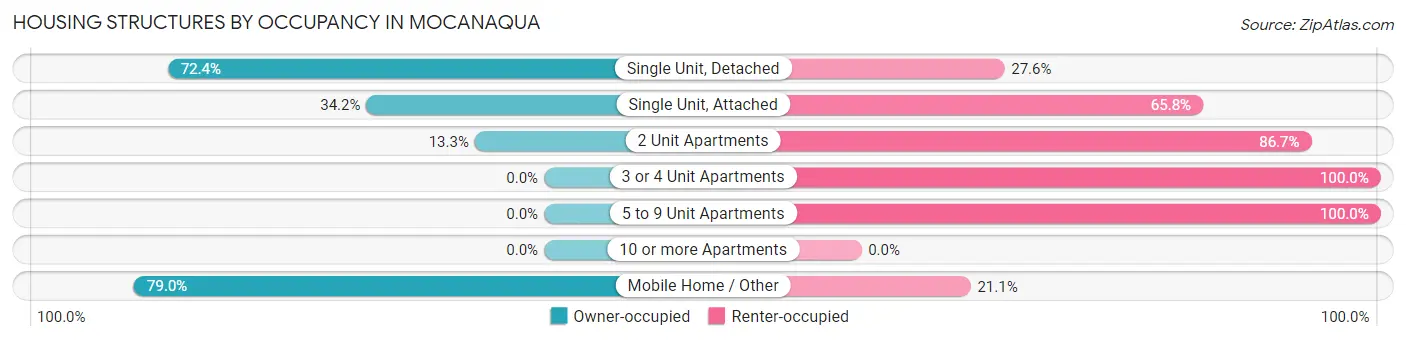
| Structure Type | Owner-occupied | Renter-occupied |
| Single Unit, Detached | 113 (72.4%) | 43 (27.6%) |
| Single Unit, Attached | 13 (34.2%) | 25 (65.8%) |
| 2 Unit Apartments | 2 (13.3%) | 13 (86.7%) |
| 3 or 4 Unit Apartments | 0 (0.0%) | 11 (100.0%) |
| 5 to 9 Unit Apartments | 0 (0.0%) | 10 (100.0%) |
| 10 or more Apartments | 0 (0.0%) | 0 (0.0%) |
| Mobile Home / Other | 15 (78.9%) | 4 (21.0%) |
| Total | 143 (57.4%) | 106 (42.6%) |
Housing Structures by Number of Rooms in Mocanaqua
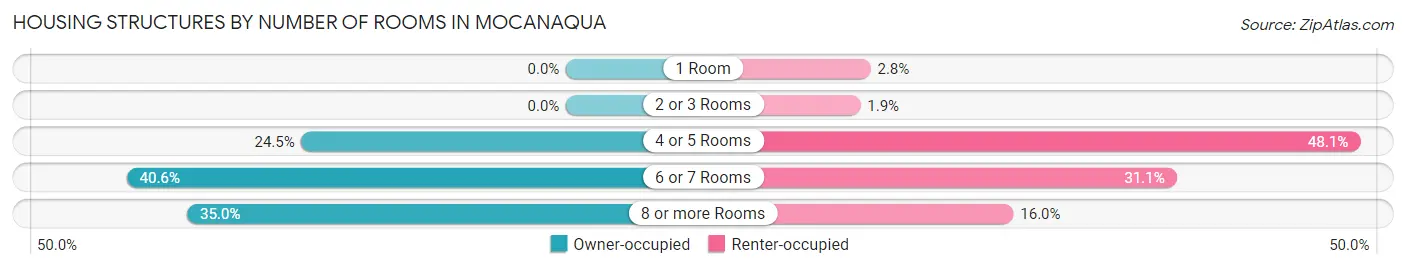
| Number of Rooms | Owner-occupied | Renter-occupied |
| 1 Room | 0 (0.0%) | 3 (2.8%) |
| 2 or 3 Rooms | 0 (0.0%) | 2 (1.9%) |
| 4 or 5 Rooms | 35 (24.5%) | 51 (48.1%) |
| 6 or 7 Rooms | 58 (40.6%) | 33 (31.1%) |
| 8 or more Rooms | 50 (35.0%) | 17 (16.0%) |
| Total | 143 (100.0%) | 106 (100.0%) |
Housing Structure by Heating Type in Mocanaqua
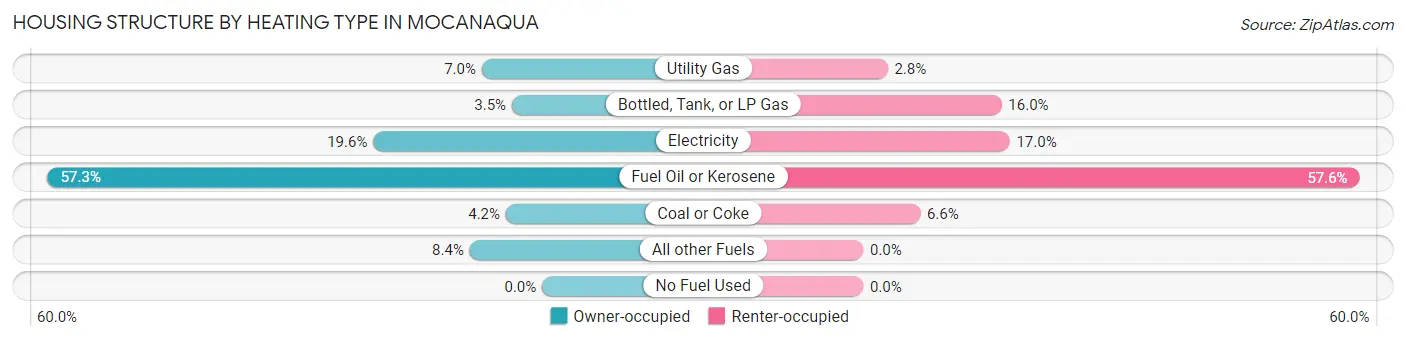
| Heating Type | Owner-occupied | Renter-occupied |
| Utility Gas | 10 (7.0%) | 3 (2.8%) |
| Bottled, Tank, or LP Gas | 5 (3.5%) | 17 (16.0%) |
| Electricity | 28 (19.6%) | 18 (17.0%) |
| Fuel Oil or Kerosene | 82 (57.3%) | 61 (57.6%) |
| Coal or Coke | 6 (4.2%) | 7 (6.6%) |
| All other Fuels | 12 (8.4%) | 0 (0.0%) |
| No Fuel Used | 0 (0.0%) | 0 (0.0%) |
| Total | 143 (100.0%) | 106 (100.0%) |
Household Vehicle Usage in Mocanaqua
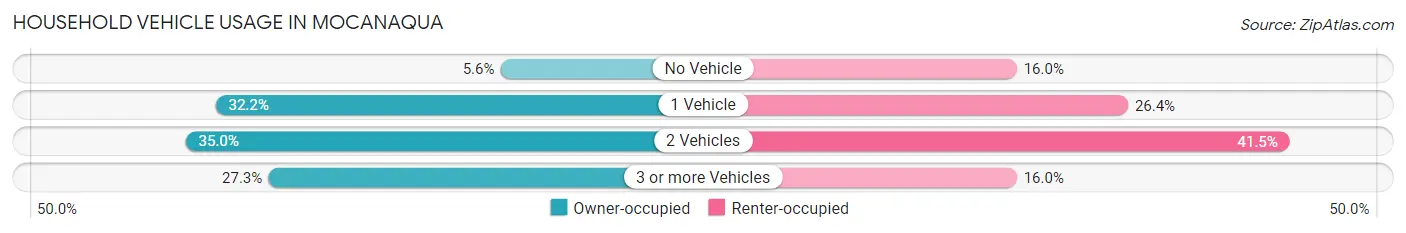
| Vehicles per Household | Owner-occupied | Renter-occupied |
| No Vehicle | 8 (5.6%) | 17 (16.0%) |
| 1 Vehicle | 46 (32.2%) | 28 (26.4%) |
| 2 Vehicles | 50 (35.0%) | 44 (41.5%) |
| 3 or more Vehicles | 39 (27.3%) | 17 (16.0%) |
| Total | 143 (100.0%) | 106 (100.0%) |
Real Estate & Mortgages in Mocanaqua
Real Estate and Mortgage Overview in Mocanaqua
| Characteristic | Without Mortgage | With Mortgage |
| Housing Units | 90 | 53 |
| Median Property Value | $81,100 | $97,300 |
| Median Household Income | $47,917 | $13 |
| Monthly Housing Costs | $493 | $0 |
| Real Estate Taxes | $1,438 | $0 |
Property Value by Mortgage Status in Mocanaqua
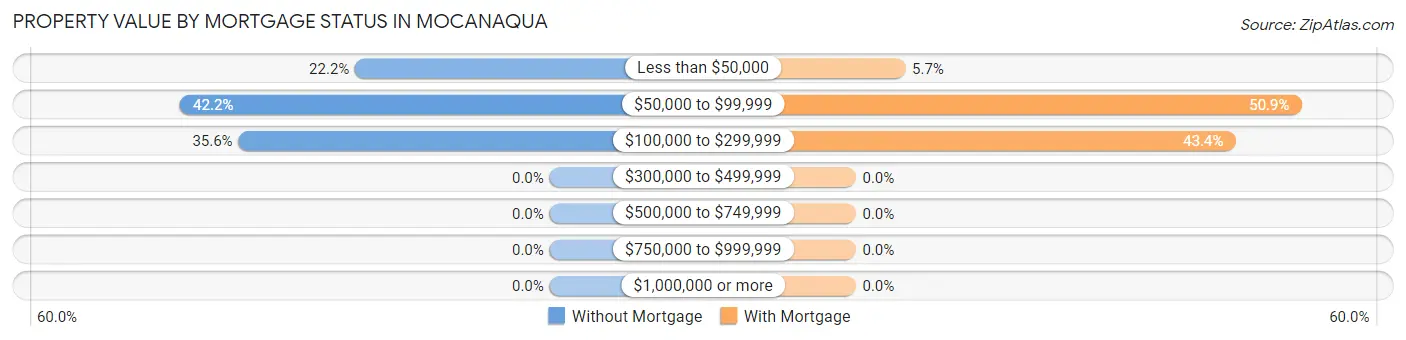
| Property Value | Without Mortgage | With Mortgage |
| Less than $50,000 | 20 (22.2%) | 3 (5.7%) |
| $50,000 to $99,999 | 38 (42.2%) | 27 (50.9%) |
| $100,000 to $299,999 | 32 (35.6%) | 23 (43.4%) |
| $300,000 to $499,999 | 0 (0.0%) | 0 (0.0%) |
| $500,000 to $749,999 | 0 (0.0%) | 0 (0.0%) |
| $750,000 to $999,999 | 0 (0.0%) | 0 (0.0%) |
| $1,000,000 or more | 0 (0.0%) | 0 (0.0%) |
| Total | 90 (100.0%) | 53 (100.0%) |
Household Income by Mortgage Status in Mocanaqua
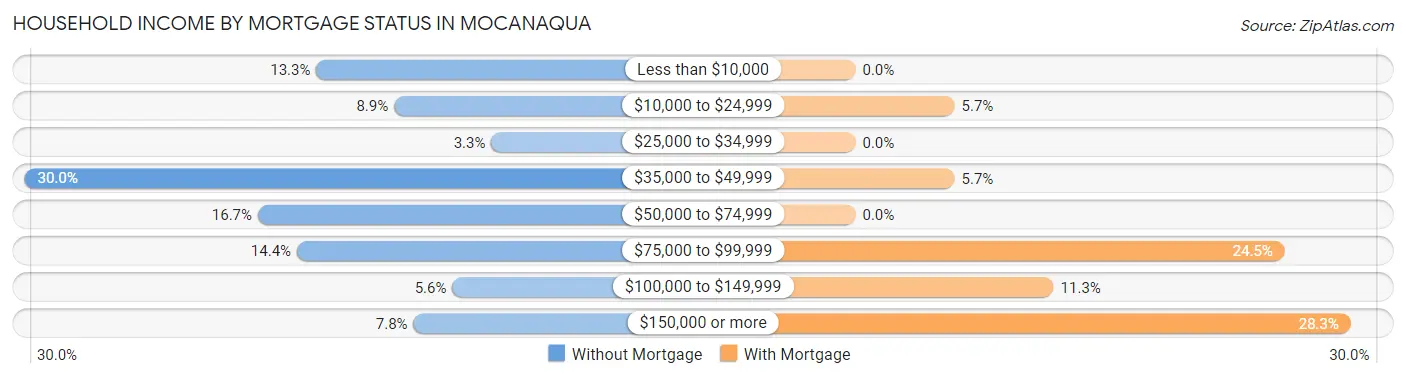
| Household Income | Without Mortgage | With Mortgage |
| Less than $10,000 | 12 (13.3%) | 0 (0.0%) |
| $10,000 to $24,999 | 8 (8.9%) | 3 (5.7%) |
| $25,000 to $34,999 | 3 (3.3%) | 0 (0.0%) |
| $35,000 to $49,999 | 27 (30.0%) | 3 (5.7%) |
| $50,000 to $74,999 | 15 (16.7%) | 0 (0.0%) |
| $75,000 to $99,999 | 13 (14.4%) | 13 (24.5%) |
| $100,000 to $149,999 | 5 (5.6%) | 6 (11.3%) |
| $150,000 or more | 7 (7.8%) | 15 (28.3%) |
| Total | 90 (100.0%) | 53 (100.0%) |
Property Value to Household Income Ratio in Mocanaqua
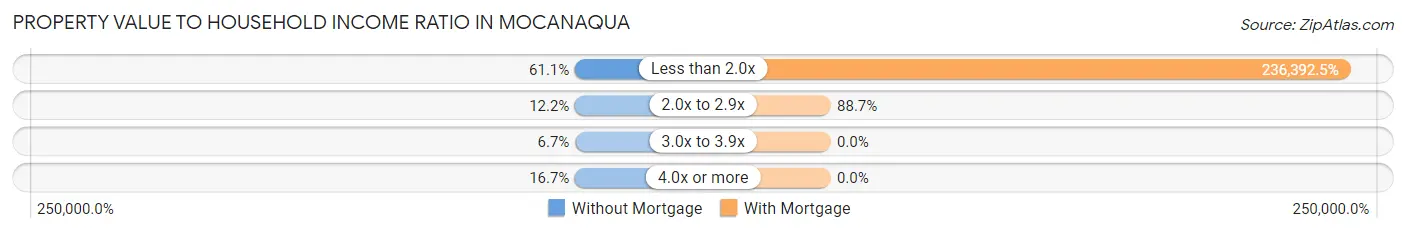
| Value-to-Income Ratio | Without Mortgage | With Mortgage |
| Less than 2.0x | 55 (61.1%) | 125,288 (236,392.5%) |
| 2.0x to 2.9x | 11 (12.2%) | 47 (88.7%) |
| 3.0x to 3.9x | 6 (6.7%) | 0 (0.0%) |
| 4.0x or more | 15 (16.7%) | 0 (0.0%) |
| Total | 90 (100.0%) | 53 (100.0%) |
Real Estate Taxes by Mortgage Status in Mocanaqua
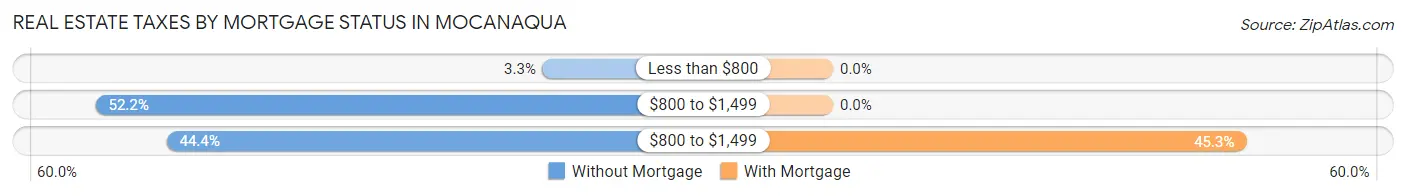
| Property Taxes | Without Mortgage | With Mortgage |
| Less than $800 | 3 (3.3%) | 0 (0.0%) |
| $800 to $1,499 | 47 (52.2%) | 0 (0.0%) |
| $800 to $1,499 | 40 (44.4%) | 24 (45.3%) |
| Total | 90 (100.0%) | 53 (100.0%) |
Health & Disability in Mocanaqua
Health Insurance Coverage by Age in Mocanaqua
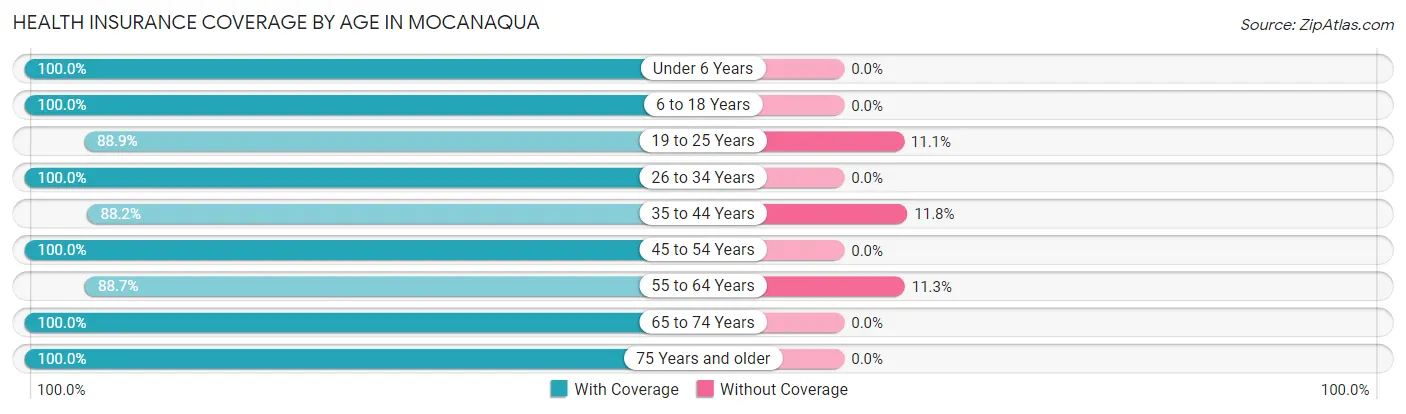
| Age Bracket | With Coverage | Without Coverage |
| Under 6 Years | 37 (100.0%) | 0 (0.0%) |
| 6 to 18 Years | 62 (100.0%) | 0 (0.0%) |
| 19 to 25 Years | 56 (88.9%) | 7 (11.1%) |
| 26 to 34 Years | 107 (100.0%) | 0 (0.0%) |
| 35 to 44 Years | 60 (88.2%) | 8 (11.8%) |
| 45 to 54 Years | 49 (100.0%) | 0 (0.0%) |
| 55 to 64 Years | 110 (88.7%) | 14 (11.3%) |
| 65 to 74 Years | 67 (100.0%) | 0 (0.0%) |
| 75 Years and older | 35 (100.0%) | 0 (0.0%) |
| Total | 583 (95.3%) | 29 (4.7%) |
Health Insurance Coverage by Citizenship Status in Mocanaqua
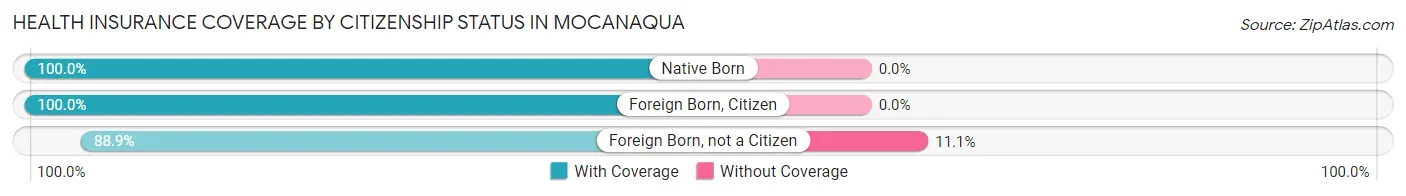
| Citizenship Status | With Coverage | Without Coverage |
| Native Born | 37 (100.0%) | 0 (0.0%) |
| Foreign Born, Citizen | 62 (100.0%) | 0 (0.0%) |
| Foreign Born, not a Citizen | 56 (88.9%) | 7 (11.1%) |
Health Insurance Coverage by Household Income in Mocanaqua
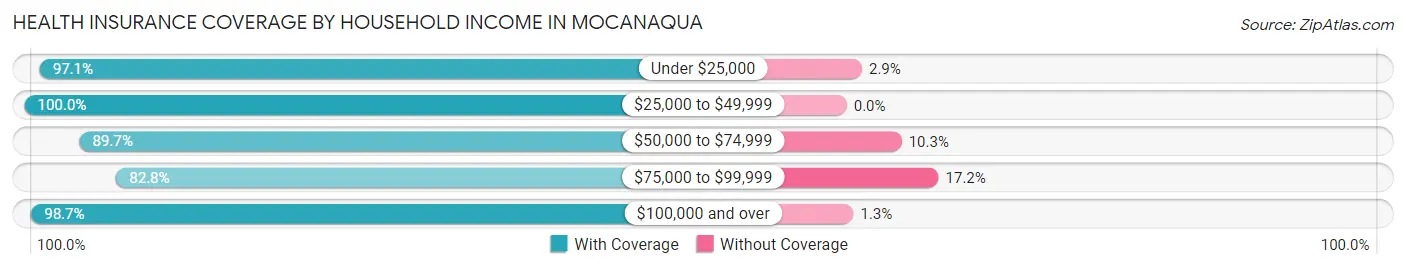
| Household Income | With Coverage | Without Coverage |
| Under $25,000 | 102 (97.1%) | 3 (2.9%) |
| $25,000 to $49,999 | 108 (100.0%) | 0 (0.0%) |
| $50,000 to $74,999 | 61 (89.7%) | 7 (10.3%) |
| $75,000 to $99,999 | 77 (82.8%) | 16 (17.2%) |
| $100,000 and over | 235 (98.7%) | 3 (1.3%) |
Public vs Private Health Insurance Coverage by Age in Mocanaqua
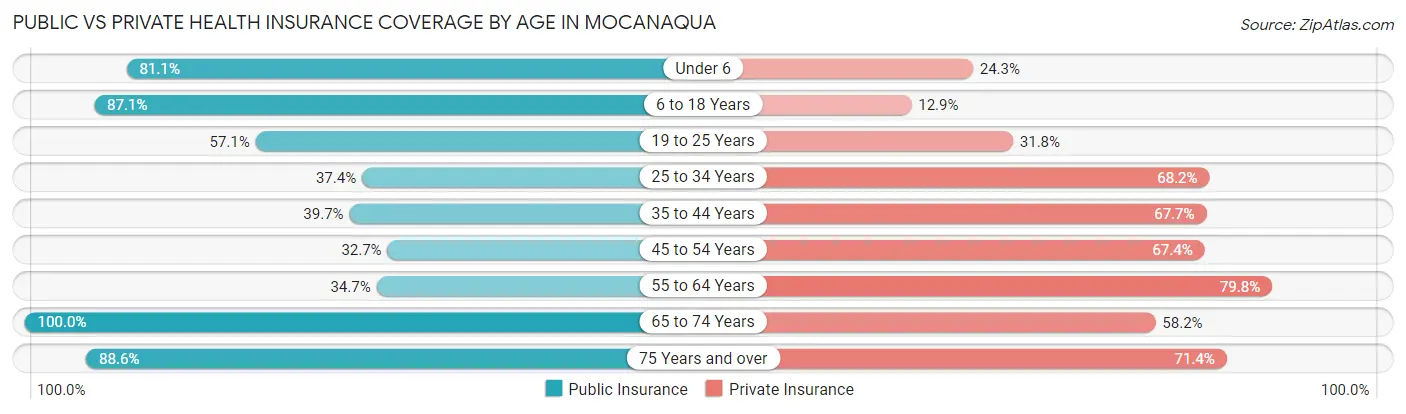
| Age Bracket | Public Insurance | Private Insurance |
| Under 6 | 30 (81.1%) | 9 (24.3%) |
| 6 to 18 Years | 54 (87.1%) | 8 (12.9%) |
| 19 to 25 Years | 36 (57.1%) | 20 (31.8%) |
| 25 to 34 Years | 40 (37.4%) | 73 (68.2%) |
| 35 to 44 Years | 27 (39.7%) | 46 (67.6%) |
| 45 to 54 Years | 16 (32.7%) | 33 (67.3%) |
| 55 to 64 Years | 43 (34.7%) | 99 (79.8%) |
| 65 to 74 Years | 67 (100.0%) | 39 (58.2%) |
| 75 Years and over | 31 (88.6%) | 25 (71.4%) |
| Total | 344 (56.2%) | 352 (57.5%) |
Disability Status by Sex by Age in Mocanaqua
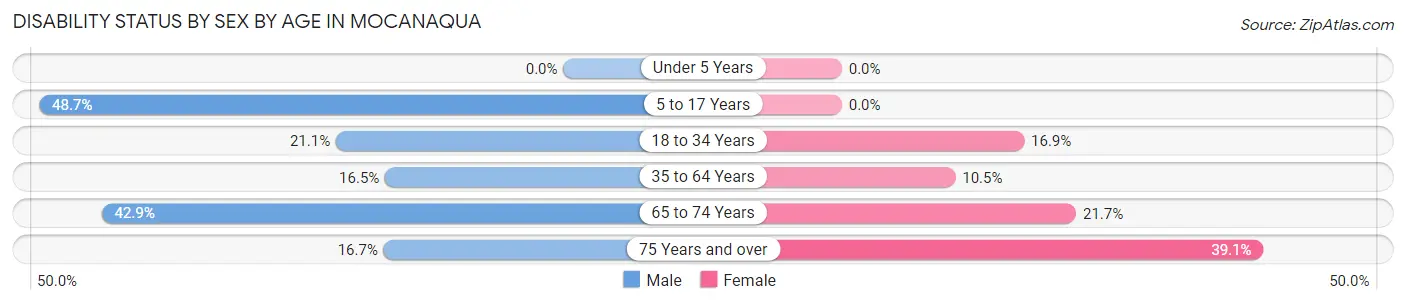
| Age Bracket | Male | Female |
| Under 5 Years | 0 (0.0%) | 0 (0.0%) |
| 5 to 17 Years | 18 (48.6%) | 0 (0.0%) |
| 18 to 34 Years | 23 (21.1%) | 11 (16.9%) |
| 35 to 64 Years | 21 (16.5%) | 12 (10.5%) |
| 65 to 74 Years | 9 (42.9%) | 10 (21.7%) |
| 75 Years and over | 2 (16.7%) | 9 (39.1%) |
Disability Class by Sex by Age in Mocanaqua
Disability Class: Hearing Difficulty
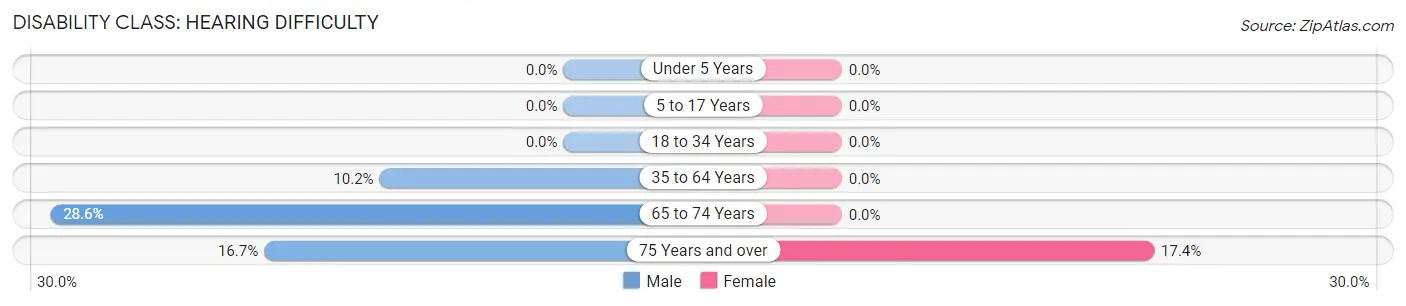
| Age Bracket | Male | Female |
| Under 5 Years | 0 (0.0%) | 0 (0.0%) |
| 5 to 17 Years | 0 (0.0%) | 0 (0.0%) |
| 18 to 34 Years | 0 (0.0%) | 0 (0.0%) |
| 35 to 64 Years | 13 (10.2%) | 0 (0.0%) |
| 65 to 74 Years | 6 (28.6%) | 0 (0.0%) |
| 75 Years and over | 2 (16.7%) | 4 (17.4%) |
Disability Class: Vision Difficulty
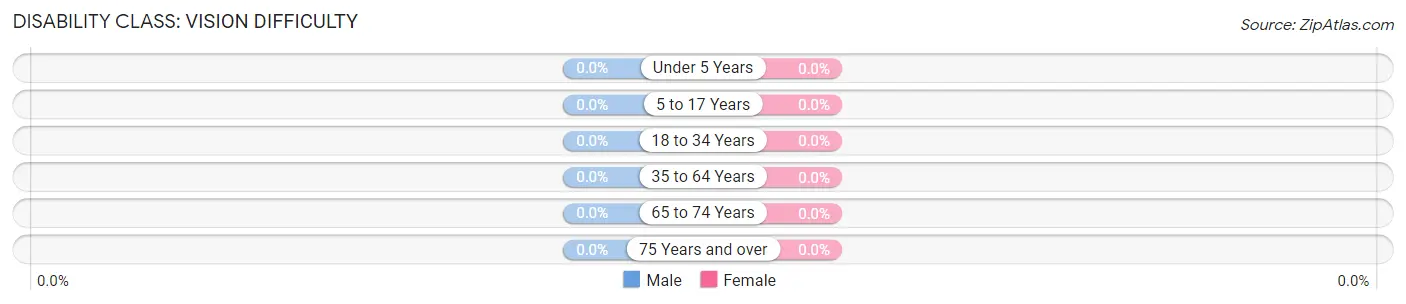
| Age Bracket | Male | Female |
| Under 5 Years | 0 (0.0%) | 0 (0.0%) |
| 5 to 17 Years | 0 (0.0%) | 0 (0.0%) |
| 18 to 34 Years | 0 (0.0%) | 0 (0.0%) |
| 35 to 64 Years | 0 (0.0%) | 0 (0.0%) |
| 65 to 74 Years | 0 (0.0%) | 0 (0.0%) |
| 75 Years and over | 0 (0.0%) | 0 (0.0%) |
Disability Class: Cognitive Difficulty
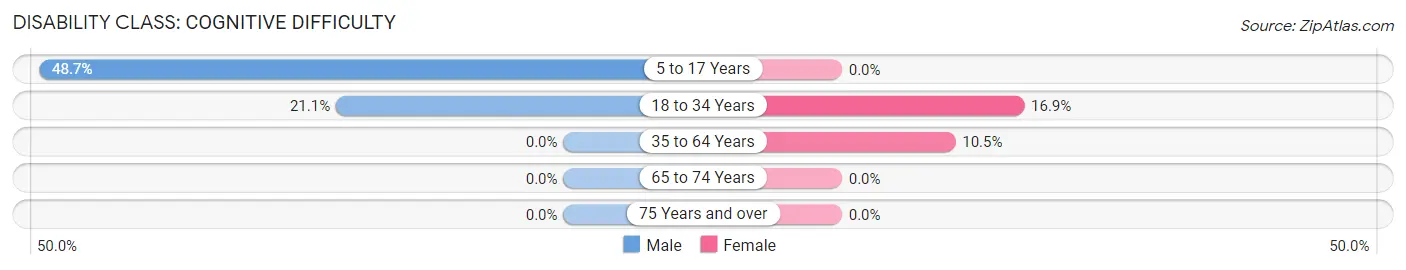
| Age Bracket | Male | Female |
| 5 to 17 Years | 18 (48.6%) | 0 (0.0%) |
| 18 to 34 Years | 23 (21.1%) | 11 (16.9%) |
| 35 to 64 Years | 0 (0.0%) | 12 (10.5%) |
| 65 to 74 Years | 0 (0.0%) | 0 (0.0%) |
| 75 Years and over | 0 (0.0%) | 0 (0.0%) |
Disability Class: Ambulatory Difficulty
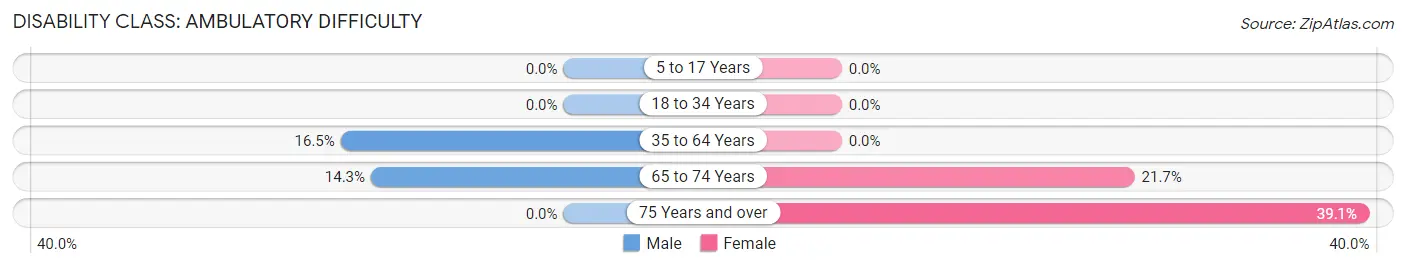
| Age Bracket | Male | Female |
| 5 to 17 Years | 0 (0.0%) | 0 (0.0%) |
| 18 to 34 Years | 0 (0.0%) | 0 (0.0%) |
| 35 to 64 Years | 21 (16.5%) | 0 (0.0%) |
| 65 to 74 Years | 3 (14.3%) | 10 (21.7%) |
| 75 Years and over | 0 (0.0%) | 9 (39.1%) |
Disability Class: Self-Care Difficulty
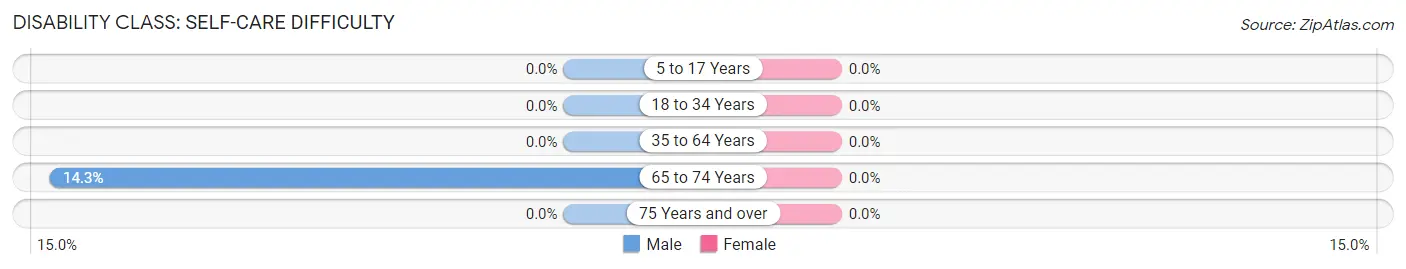
| Age Bracket | Male | Female |
| 5 to 17 Years | 0 (0.0%) | 0 (0.0%) |
| 18 to 34 Years | 0 (0.0%) | 0 (0.0%) |
| 35 to 64 Years | 0 (0.0%) | 0 (0.0%) |
| 65 to 74 Years | 3 (14.3%) | 0 (0.0%) |
| 75 Years and over | 0 (0.0%) | 0 (0.0%) |
Technology Access in Mocanaqua
Computing Device Access in Mocanaqua
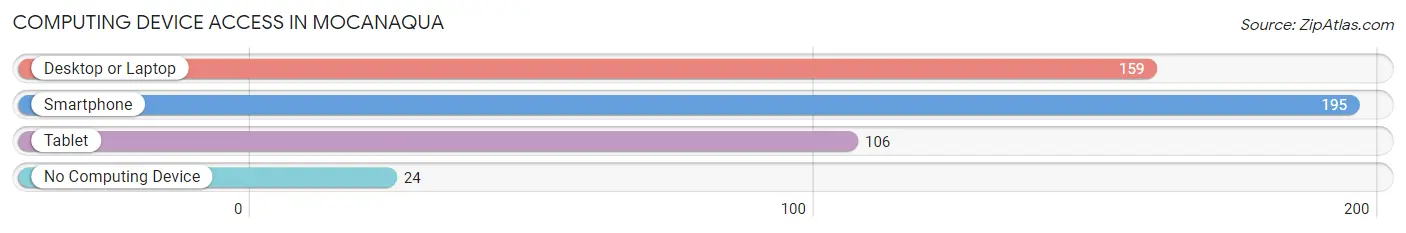
| Device Type | # Households | % Households |
| Desktop or Laptop | 159 | 63.9% |
| Smartphone | 195 | 78.3% |
| Tablet | 106 | 42.6% |
| No Computing Device | 24 | 9.6% |
| Total | 249 | 100.0% |
Internet Access in Mocanaqua
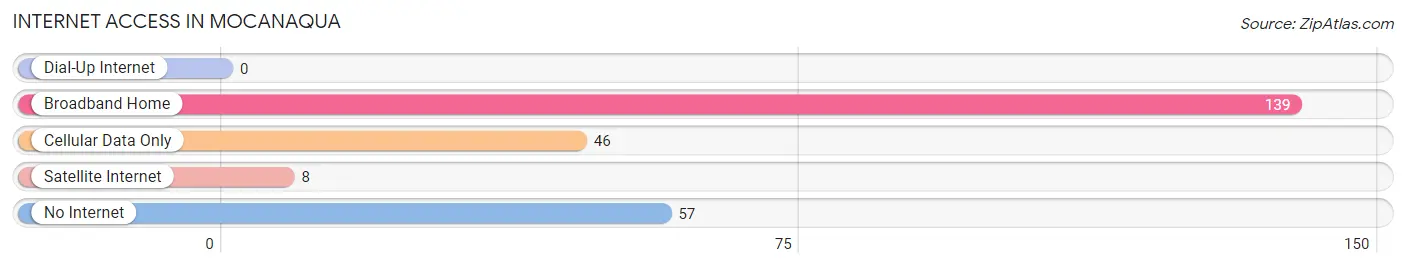
| Internet Type | # Households | % Households |
| Dial-Up Internet | 0 | 0.0% |
| Broadband Home | 139 | 55.8% |
| Cellular Data Only | 46 | 18.5% |
| Satellite Internet | 8 | 3.2% |
| No Internet | 57 | 22.9% |
| Total | 249 | 100.0% |
Mocanaqua Summary
Mocanaqua is a small borough located in Luzerne County, Pennsylvania. It is situated in the Wyoming Valley, a region of the state known for its rich history and culture. The borough is located along the Susquehanna River, and is home to a population of just over 1,000 people.
History
Mocanaqua was first settled in the late 1700s by a group of Welsh immigrants. The name of the borough is derived from the Native American term for “place of many rocks”, which is fitting given the area’s rocky terrain. The borough was officially incorporated in 1876, and has remained relatively unchanged since then.
Geography
Mocanaqua is located in the Wyoming Valley, a region of Pennsylvania known for its rolling hills and lush forests. The borough is situated along the Susquehanna River, and is bordered by the towns of Shickshinny, Nanticoke, and West Nanticoke. The borough is located at an elevation of 845 feet above sea level, and has a total area of 0.7 square miles.
Economy
Mocanaqua’s economy is largely based on agriculture and tourism. The borough is home to several small farms, which produce a variety of crops such as corn, wheat, and hay. The area is also popular with tourists, who come to enjoy the area’s natural beauty and outdoor activities.
Demographics
As of the 2010 census, Mocanaqua had a population of 1,072 people. The racial makeup of the borough was 97.2% White, 0.9% African American, 0.3% Native American, 0.2% Asian, and 1.4% from other races. The median household income was $37,917, and the median family income was $45,000. The per capita income was $18,945.
Conclusion
Mocanaqua is a small borough located in Luzerne County, Pennsylvania. It is situated in the Wyoming Valley, a region of the state known for its rich history and culture. The borough is located along the Susquehanna River, and is home to a population of just over 1,000 people. The economy of Mocanaqua is largely based on agriculture and tourism, and the borough is home to a diverse population.
Common Questions
What is Per Capita Income in Mocanaqua?
Per Capita income in Mocanaqua is $30,277.
What is the Median Family Income in Mocanaqua?
Median Family Income in Mocanaqua is $81,932.
What is the Median Household income in Mocanaqua?
Median Household Income in Mocanaqua is $56,719.
What is Income or Wage Gap in Mocanaqua?
Income or Wage Gap in Mocanaqua is 21.8%.
Women in Mocanaqua earn 78.2 cents for every dollar earned by a man.
What is Inequality or Gini Index in Mocanaqua?
Inequality or Gini Index in Mocanaqua is 0.43.
What is the Total Population of Mocanaqua?
Total Population of Mocanaqua is 612.
What is the Total Male Population of Mocanaqua?
Total Male Population of Mocanaqua is 329.
What is the Total Female Population of Mocanaqua?
Total Female Population of Mocanaqua is 283.
What is the Ratio of Males per 100 Females in Mocanaqua?
There are 116.25 Males per 100 Females in Mocanaqua.
What is the Ratio of Females per 100 Males in Mocanaqua?
There are 86.02 Females per 100 Males in Mocanaqua.
What is the Median Population Age in Mocanaqua?
Median Population Age in Mocanaqua is 41.0 Years.
What is the Average Family Size in Mocanaqua
Average Family Size in Mocanaqua is 3.1 People.
What is the Average Household Size in Mocanaqua
Average Household Size in Mocanaqua is 2.5 People.
How Large is the Labor Force in Mocanaqua?
There are 337 People in the Labor Forcein in Mocanaqua.
What is the Percentage of People in the Labor Force in Mocanaqua?
64.1% of People are in the Labor Force in Mocanaqua.
What is the Unemployment Rate in Mocanaqua?
Unemployment Rate in Mocanaqua is 5.6%.