Tarentum borough, PA Map & Demographics
Tarentum borough Overview
$25,311
PER CAPITA INCOME
$55,994
AVG FAMILY INCOME
$41,466
AVG HOUSEHOLD INCOME
15.5%
WAGE / INCOME GAP [ % ]
84.5¢/ $1
WAGE / INCOME GAP [ $ ]
0.38
INEQUALITY / GINI INDEX
4,328
TOTAL POPULATION
2,122
MALE POPULATION
2,206
FEMALE POPULATION
96.19
MALES / 100 FEMALES
103.96
FEMALES / 100 MALES
48.2
MEDIAN AGE
3.0
AVG FAMILY SIZE
2.0
AVG HOUSEHOLD SIZE
2,051
LABOR FORCE [ PEOPLE ]
55.4%
PERCENT IN LABOR FORCE
6.2%
UNEMPLOYMENT RATE
Income in Tarentum borough
Income Overview in Tarentum borough
Per Capita Income in Tarentum borough is $25,311, while median incomes of families and households are $55,994 and $41,466 respectively.
| Characteristic | Number | Measure |
| Per Capita Income | 4,328 | $25,311 |
| Median Family Income | 939 | $55,994 |
| Mean Family Income | 939 | $63,570 |
| Median Household Income | 2,188 | $41,466 |
| Mean Household Income | 2,188 | $48,817 |
| Income Deficit | 939 | $0 |
| Wage / Income Gap (%) | 4,328 | 15.51% |
| Wage / Income Gap ($) | 4,328 | 84.49¢ per $1 |
| Gini / Inequality Index | 4,328 | 0.38 |
Earnings by Sex in Tarentum borough
Average Earnings in Tarentum borough are $29,908, $32,271 for men and $27,266 for women, a difference of 15.5%.
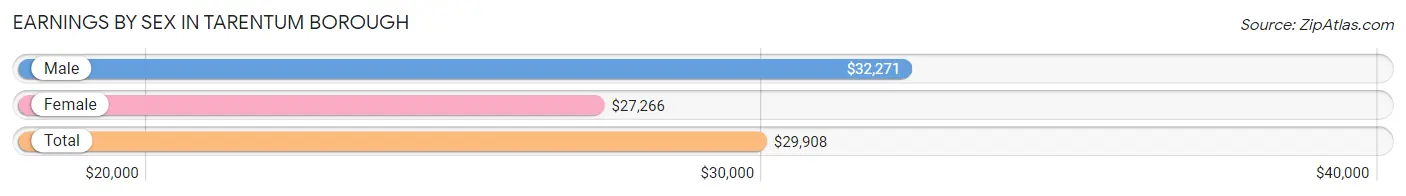
| Sex | Number | Average Earnings |
| Male | 1,064 (49.4%) | $32,271 |
| Female | 1,091 (50.6%) | $27,266 |
| Total | 2,155 (100.0%) | $29,908 |
Earnings by Sex by Income Bracket in Tarentum borough
The most common earnings brackets in Tarentum borough are $30,000 to $34,999 for men (230 | 21.6%) and $25,000 to $29,999 for women (303 | 27.8%).
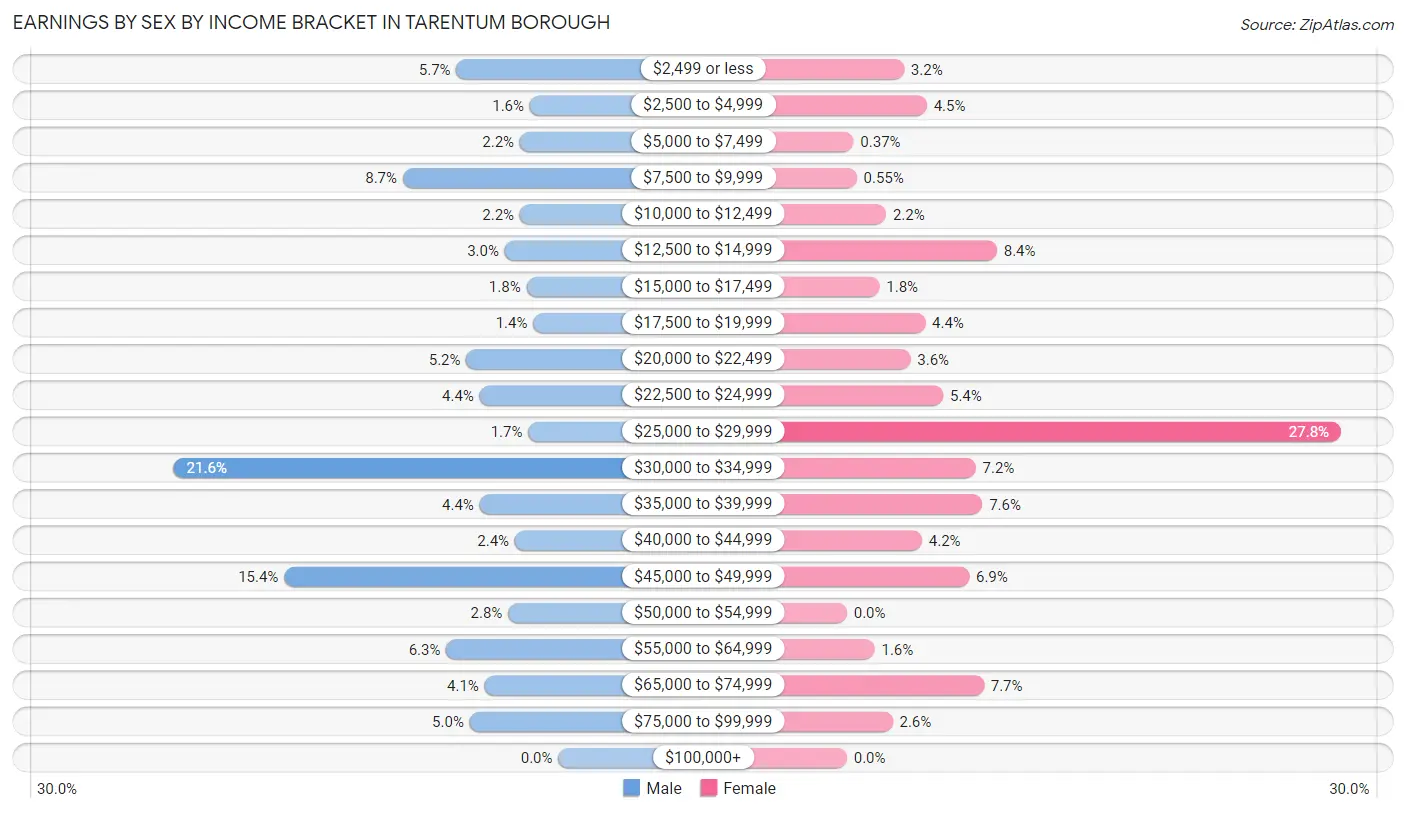
| Income | Male | Female |
| $2,499 or less | 61 (5.7%) | 35 (3.2%) |
| $2,500 to $4,999 | 17 (1.6%) | 49 (4.5%) |
| $5,000 to $7,499 | 23 (2.2%) | 4 (0.4%) |
| $7,500 to $9,999 | 93 (8.7%) | 6 (0.5%) |
| $10,000 to $12,499 | 23 (2.2%) | 24 (2.2%) |
| $12,500 to $14,999 | 32 (3.0%) | 92 (8.4%) |
| $15,000 to $17,499 | 19 (1.8%) | 20 (1.8%) |
| $17,500 to $19,999 | 15 (1.4%) | 48 (4.4%) |
| $20,000 to $22,499 | 55 (5.2%) | 39 (3.6%) |
| $22,500 to $24,999 | 47 (4.4%) | 59 (5.4%) |
| $25,000 to $29,999 | 18 (1.7%) | 303 (27.8%) |
| $30,000 to $34,999 | 230 (21.6%) | 79 (7.2%) |
| $35,000 to $39,999 | 47 (4.4%) | 83 (7.6%) |
| $40,000 to $44,999 | 26 (2.4%) | 46 (4.2%) |
| $45,000 to $49,999 | 164 (15.4%) | 75 (6.9%) |
| $50,000 to $54,999 | 30 (2.8%) | 0 (0.0%) |
| $55,000 to $64,999 | 67 (6.3%) | 17 (1.6%) |
| $65,000 to $74,999 | 44 (4.1%) | 84 (7.7%) |
| $75,000 to $99,999 | 53 (5.0%) | 28 (2.6%) |
| $100,000+ | 0 (0.0%) | 0 (0.0%) |
| Total | 1,064 (100.0%) | 1,091 (100.0%) |
Earnings by Sex by Educational Attainment in Tarentum borough
Average earnings in Tarentum borough are $32,342 for men and $27,935 for women, a difference of 13.6%. Men with an educational attainment of high school diploma enjoy the highest average annual earnings of $32,436, while those with college or associate's degree education earn the least with $32,274. Women with an educational attainment of college or associate's degree earn the most with the average annual earnings of $47,551, while those with high school diploma education have the smallest earnings of $25,911.
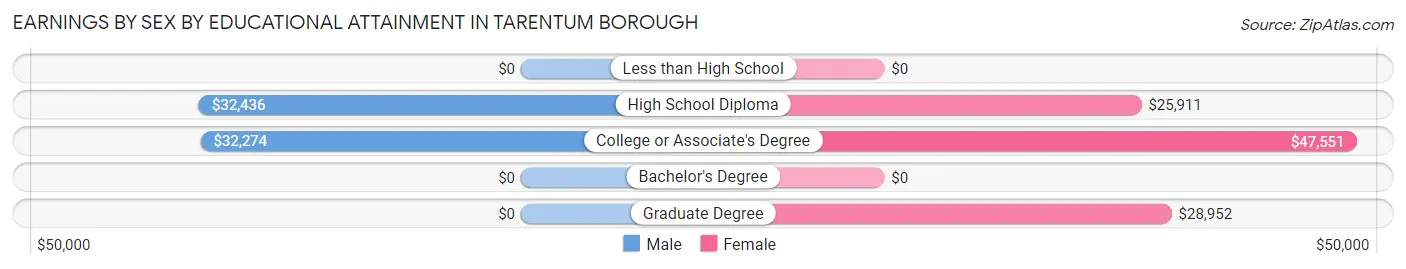
| Educational Attainment | Male Income | Female Income |
| Less than High School | - | - |
| High School Diploma | $32,436 | $25,911 |
| College or Associate's Degree | $32,274 | $47,551 |
| Bachelor's Degree | - | - |
| Graduate Degree | - | - |
| Total | $32,342 | $27,935 |
Family Income in Tarentum borough
Family Income Brackets in Tarentum borough
According to the Tarentum borough family income data, there are 264 families falling into the $35,000 to $49,999 income range, which is the most common income bracket and makes up 28.1% of all families.
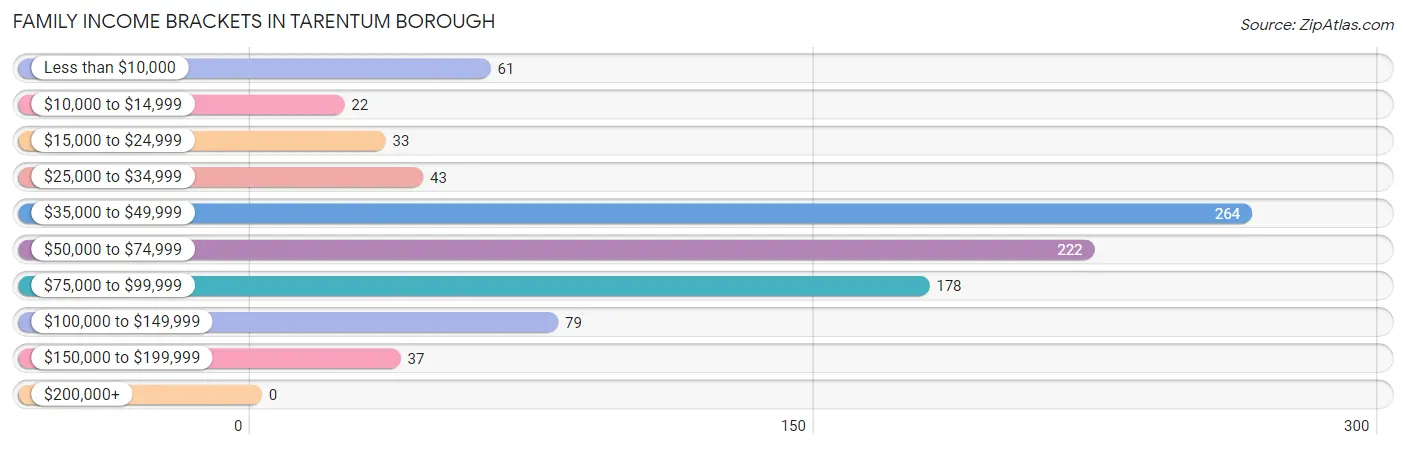
| Income Bracket | # Families | % Families |
| Less than $10,000 | 61 | 6.5% |
| $10,000 to $14,999 | 22 | 2.3% |
| $15,000 to $24,999 | 33 | 3.5% |
| $25,000 to $34,999 | 43 | 4.6% |
| $35,000 to $49,999 | 264 | 28.1% |
| $50,000 to $74,999 | 222 | 23.6% |
| $75,000 to $99,999 | 178 | 19.0% |
| $100,000 to $149,999 | 79 | 8.4% |
| $150,000 to $199,999 | 37 | 3.9% |
| $200,000+ | 0 | 0.0% |
Family Income by Famaliy Size in Tarentum borough
2-person families (558 | 59.4%) account for the highest median family income in Tarentum borough with $59,167 per family, while 2-person families (558 | 59.4%) have the highest median income of $29,584 per family member.
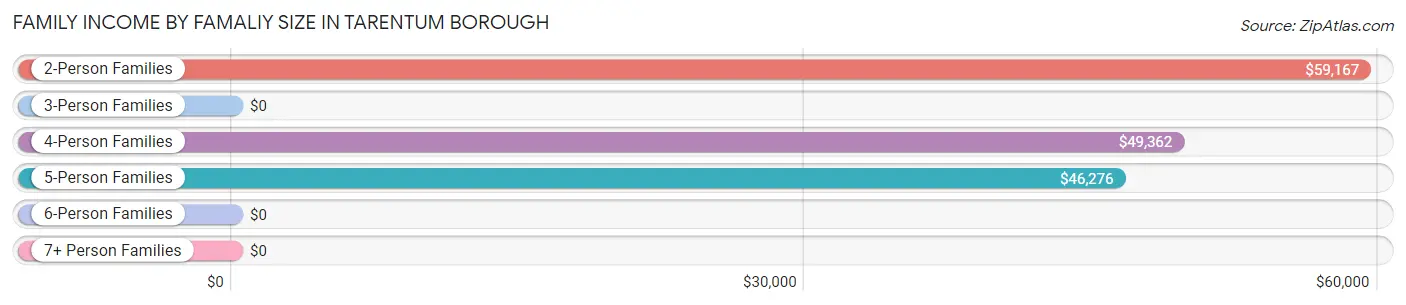
| Income Bracket | # Families | Median Income |
| 2-Person Families | 558 (59.4%) | $59,167 |
| 3-Person Families | 140 (14.9%) | $0 |
| 4-Person Families | 133 (14.2%) | $49,362 |
| 5-Person Families | 88 (9.4%) | $46,276 |
| 6-Person Families | 0 (0.0%) | $0 |
| 7+ Person Families | 20 (2.1%) | $0 |
| Total | 939 (100.0%) | $55,994 |
Family Income by Number of Earners in Tarentum borough
The median family income in Tarentum borough is $55,994, with families comprising 3+ earners (50) having the highest median family income of $137,917, while families with 1 earner (422) have the lowest median family income of $45,238, accounting for 5.3% and 44.9% of families, respectively.
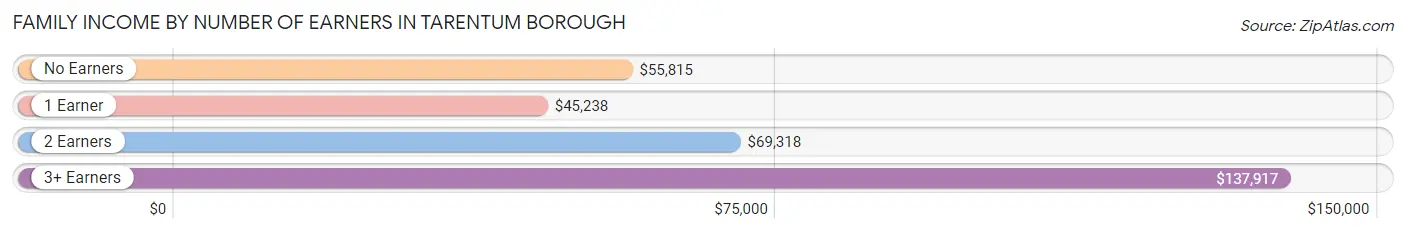
| Number of Earners | # Families | Median Income |
| No Earners | 193 (20.5%) | $55,815 |
| 1 Earner | 422 (44.9%) | $45,238 |
| 2 Earners | 274 (29.2%) | $69,318 |
| 3+ Earners | 50 (5.3%) | $137,917 |
| Total | 939 (100.0%) | $55,994 |
Household Income in Tarentum borough
Household Income Brackets in Tarentum borough
With 556 households falling in the category, the $35,000 to $49,999 income range is the most frequent in Tarentum borough, accounting for 25.4% of all households.
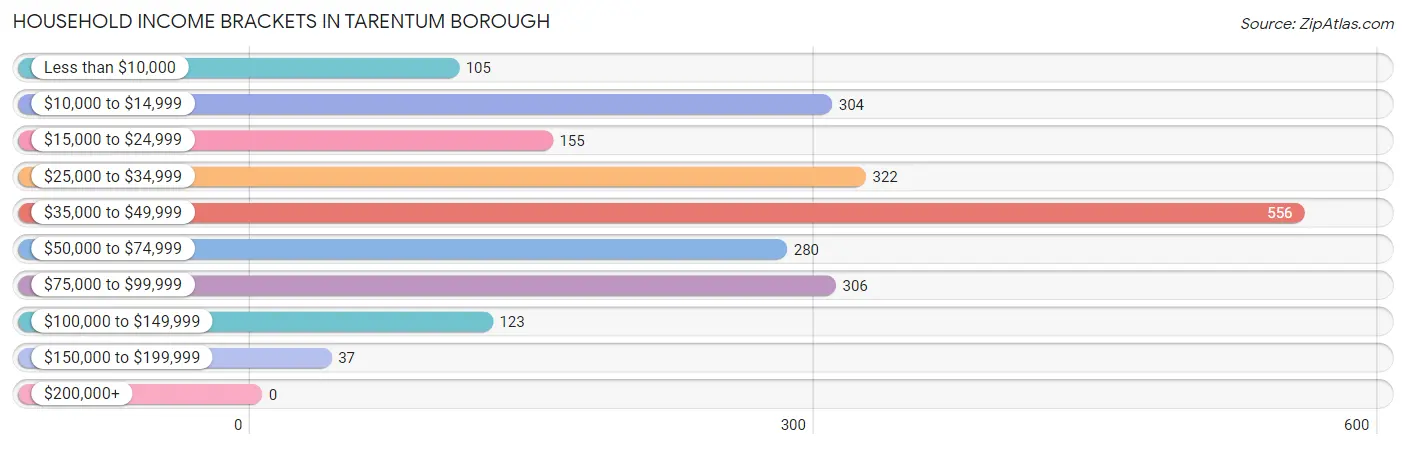
| Income Bracket | # Households | % Households |
| Less than $10,000 | 105 | 4.8% |
| $10,000 to $14,999 | 304 | 13.9% |
| $15,000 to $24,999 | 155 | 7.1% |
| $25,000 to $34,999 | 322 | 14.7% |
| $35,000 to $49,999 | 556 | 25.4% |
| $50,000 to $74,999 | 280 | 12.8% |
| $75,000 to $99,999 | 306 | 14.0% |
| $100,000 to $149,999 | 123 | 5.6% |
| $150,000 to $199,999 | 37 | 1.7% |
| $200,000+ | 0 | 0.0% |
Household Income by Householder Age in Tarentum borough
The median household income in Tarentum borough is $41,466, with the highest median household income of $87,793 found in the 15 to 24 years age bracket for the primary householder. A total of 83 households (3.8%) fall into this category. Meanwhile, the 45 to 64 years age bracket for the primary householder has the lowest median household income of $36,798, with 870 households (39.8%) in this group.
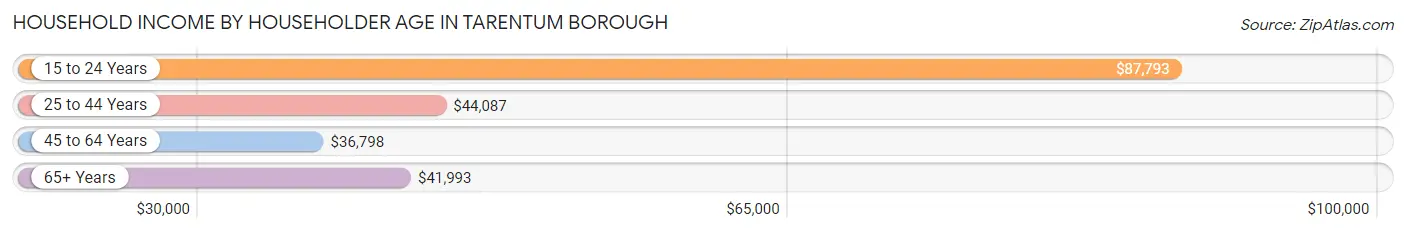
| Income Bracket | # Households | Median Income |
| 15 to 24 Years | 83 (3.8%) | $87,793 |
| 25 to 44 Years | 583 (26.7%) | $44,087 |
| 45 to 64 Years | 870 (39.8%) | $36,798 |
| 65+ Years | 652 (29.8%) | $41,993 |
| Total | 2,188 (100.0%) | $41,466 |
Poverty in Tarentum borough
Income Below Poverty by Sex and Age in Tarentum borough
With 21.1% poverty level for males and 18.0% for females among the residents of Tarentum borough, 6 to 11 year old males and 5 year old females are the most vulnerable to poverty, with 93 males (42.3%) and 19 females (100.0%) in their respective age groups living below the poverty level.
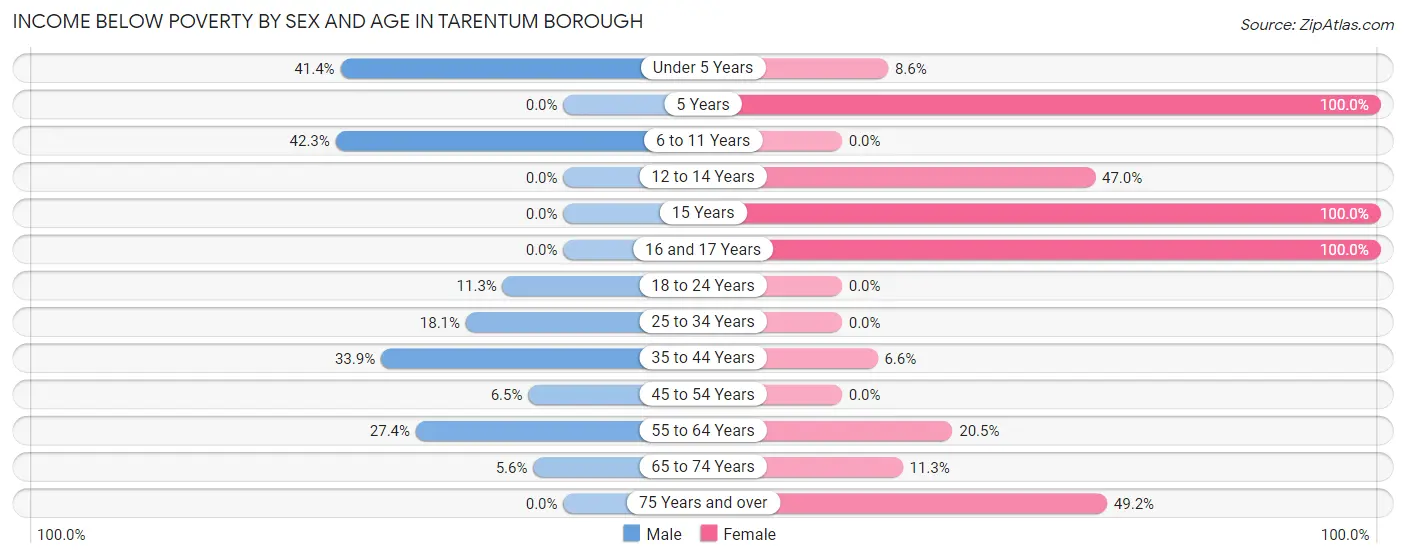
| Age Bracket | Male | Female |
| Under 5 Years | 12 (41.4%) | 12 (8.6%) |
| 5 Years | 0 (0.0%) | 19 (100.0%) |
| 6 to 11 Years | 93 (42.3%) | 0 (0.0%) |
| 12 to 14 Years | 0 (0.0%) | 63 (47.0%) |
| 15 Years | 0 (0.0%) | 20 (100.0%) |
| 16 and 17 Years | 0 (0.0%) | 31 (100.0%) |
| 18 to 24 Years | 23 (11.3%) | 0 (0.0%) |
| 25 to 34 Years | 40 (18.1%) | 0 (0.0%) |
| 35 to 44 Years | 87 (33.9%) | 19 (6.6%) |
| 45 to 54 Years | 11 (6.5%) | 0 (0.0%) |
| 55 to 64 Years | 167 (27.4%) | 64 (20.5%) |
| 65 to 74 Years | 15 (5.6%) | 44 (11.3%) |
| 75 Years and over | 0 (0.0%) | 125 (49.2%) |
| Total | 448 (21.1%) | 397 (18.0%) |
Income Above Poverty by Sex and Age in Tarentum borough
According to the poverty statistics in Tarentum borough, males aged 16 and 17 years and females aged 6 to 11 years are the age groups that are most secure financially, with 100.0% of males and 100.0% of females in these age groups living above the poverty line.
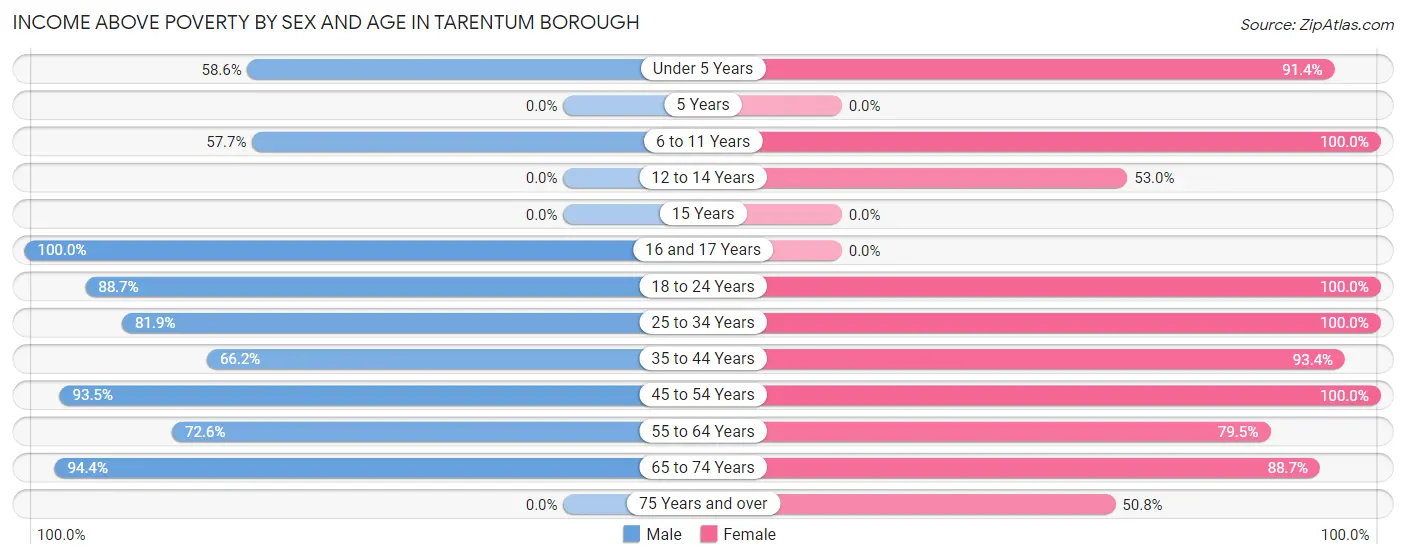
| Age Bracket | Male | Female |
| Under 5 Years | 17 (58.6%) | 128 (91.4%) |
| 5 Years | 0 (0.0%) | 0 (0.0%) |
| 6 to 11 Years | 127 (57.7%) | 64 (100.0%) |
| 12 to 14 Years | 0 (0.0%) | 71 (53.0%) |
| 15 Years | 0 (0.0%) | 0 (0.0%) |
| 16 and 17 Years | 143 (100.0%) | 0 (0.0%) |
| 18 to 24 Years | 181 (88.7%) | 163 (100.0%) |
| 25 to 34 Years | 181 (81.9%) | 115 (100.0%) |
| 35 to 44 Years | 170 (66.1%) | 268 (93.4%) |
| 45 to 54 Years | 158 (93.5%) | 277 (100.0%) |
| 55 to 64 Years | 443 (72.6%) | 248 (79.5%) |
| 65 to 74 Years | 254 (94.4%) | 346 (88.7%) |
| 75 Years and over | 0 (0.0%) | 129 (50.8%) |
| Total | 1,674 (78.9%) | 1,809 (82.0%) |
Income Below Poverty Among Married-Couple Families in Tarentum borough
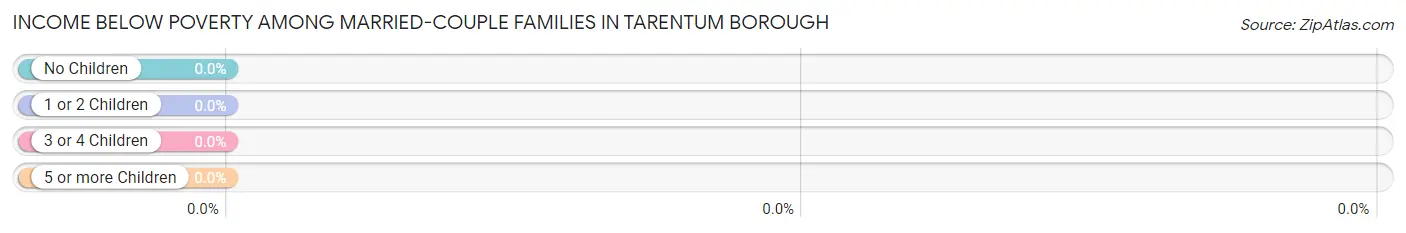
| Children | Above Poverty | Below Poverty |
| No Children | 378 (100.0%) | 0 (0.0%) |
| 1 or 2 Children | 114 (100.0%) | 0 (0.0%) |
| 3 or 4 Children | 49 (100.0%) | 0 (0.0%) |
| 5 or more Children | 0 (0.0%) | 0 (0.0%) |
| Total | 541 (100.0%) | 0 (0.0%) |
Income Below Poverty Among Single-Parent Households in Tarentum borough
According to the poverty data in Tarentum borough, 50.3% or 95 single-father households and 9.1% or 19 single-mother households are living below the poverty line. Among single-father households, those with 3 or 4 children have the highest poverty rate, with 12 households (100.0%) experiencing poverty. Likewise, among single-mother households, those with 3 or 4 children have the highest poverty rate, with 19 households (51.3%) falling below the poverty line.
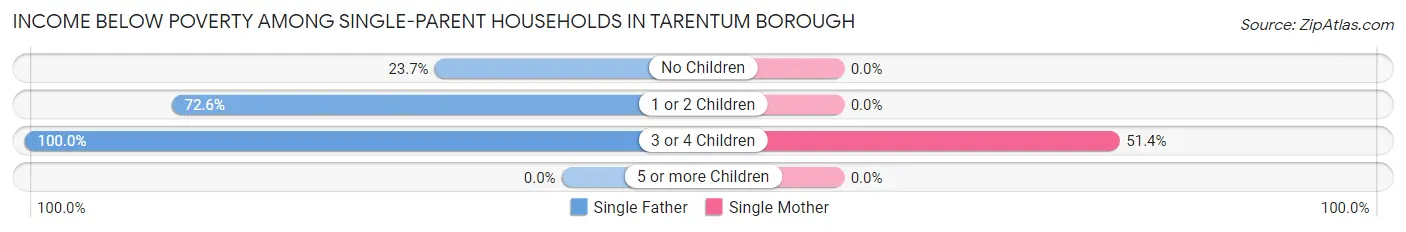
| Children | Single Father | Single Mother |
| No Children | 22 (23.7%) | 0 (0.0%) |
| 1 or 2 Children | 61 (72.6%) | 0 (0.0%) |
| 3 or 4 Children | 12 (100.0%) | 19 (51.3%) |
| 5 or more Children | 0 (0.0%) | 0 (0.0%) |
| Total | 95 (50.3%) | 19 (9.1%) |
Income Below Poverty Among Married-Couple vs Single-Parent Households in Tarentum borough
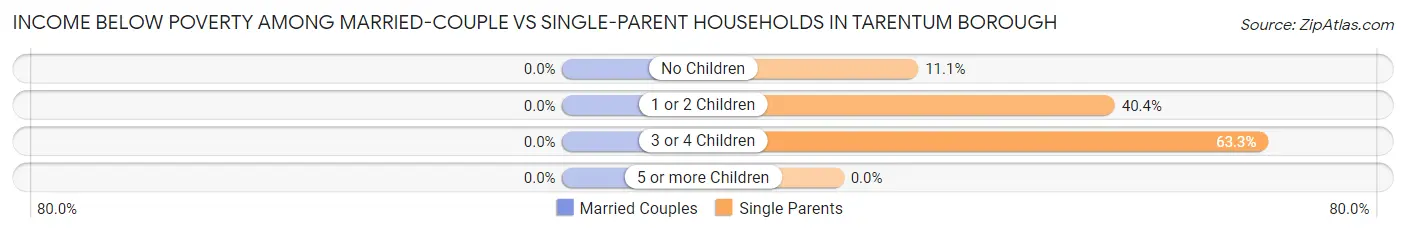
| Children | Married-Couple Families | Single-Parent Households |
| No Children | 0 (0.0%) | 22 (11.1%) |
| 1 or 2 Children | 0 (0.0%) | 61 (40.4%) |
| 3 or 4 Children | 0 (0.0%) | 31 (63.3%) |
| 5 or more Children | 0 (0.0%) | 0 (0.0%) |
| Total | 0 (0.0%) | 114 (28.6%) |
Race in Tarentum borough
The most populous races in Tarentum borough are White / Caucasian (3,925 | 90.7%), Two or more Races (209 | 4.8%), and Black / African American (181 | 4.2%).
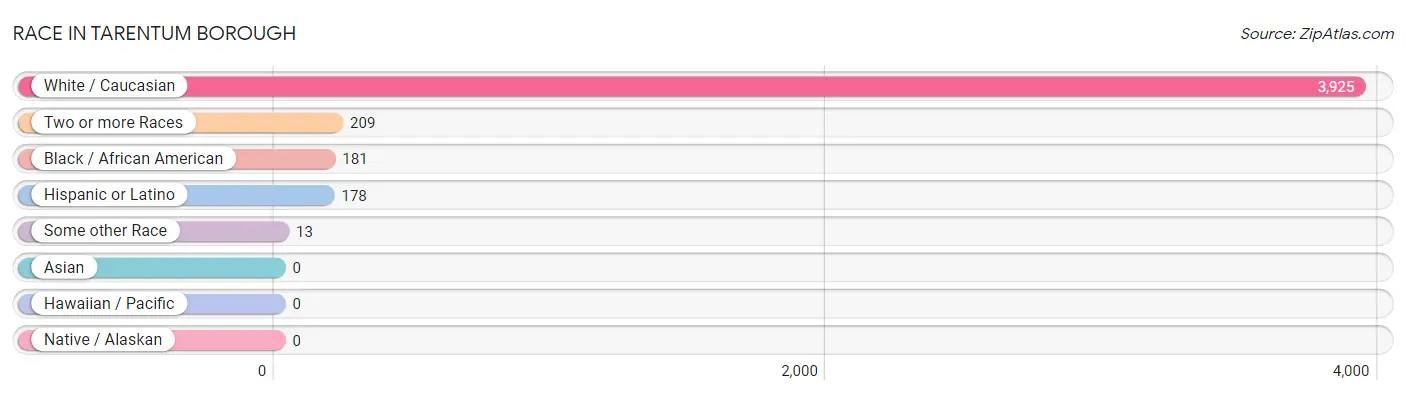
| Race | # Population | % Population |
| Asian | 0 | 0.0% |
| Black / African American | 181 | 4.2% |
| Hawaiian / Pacific | 0 | 0.0% |
| Hispanic or Latino | 178 | 4.1% |
| Native / Alaskan | 0 | 0.0% |
| White / Caucasian | 3,925 | 90.7% |
| Two or more Races | 209 | 4.8% |
| Some other Race | 13 | 0.3% |
| Total | 4,328 | 100.0% |
Ancestry in Tarentum borough
The most populous ancestries reported in Tarentum borough are German (1,055 | 24.4%), Italian (894 | 20.7%), Polish (761 | 17.6%), Irish (585 | 13.5%), and Slovak (560 | 12.9%), together accounting for 89.1% of all Tarentum borough residents.
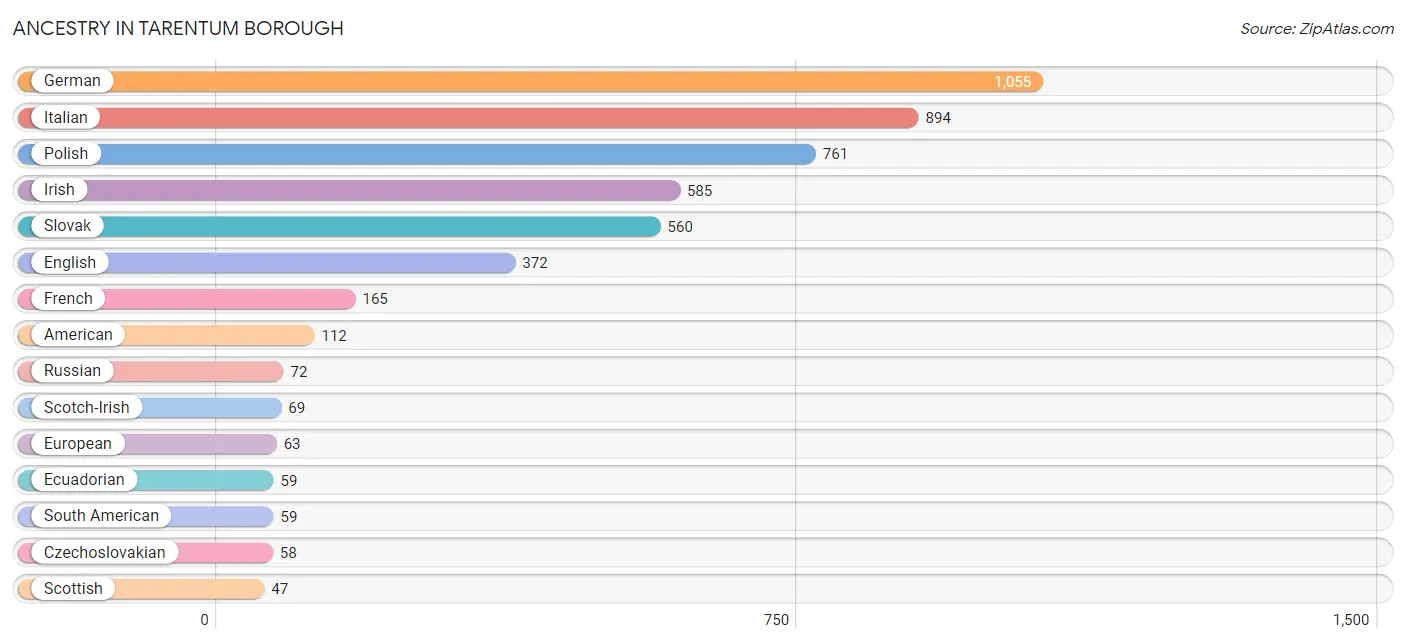
| Ancestry | # Population | % Population |
| Albanian | 18 | 0.4% |
| American | 112 | 2.6% |
| Austrian | 16 | 0.4% |
| Cambodian | 30 | 0.7% |
| Croatian | 10 | 0.2% |
| Czech | 19 | 0.4% |
| Czechoslovakian | 58 | 1.3% |
| Dutch | 10 | 0.2% |
| Eastern European | 15 | 0.4% |
| Ecuadorian | 59 | 1.4% |
| English | 372 | 8.6% |
| European | 63 | 1.5% |
| French | 165 | 3.8% |
| German | 1,055 | 24.4% |
| Irish | 585 | 13.5% |
| Italian | 894 | 20.7% |
| Mexican | 15 | 0.4% |
| Polish | 761 | 17.6% |
| Puerto Rican | 43 | 1.0% |
| Russian | 72 | 1.7% |
| Scotch-Irish | 69 | 1.6% |
| Scottish | 47 | 1.1% |
| Slovak | 560 | 12.9% |
| Slovene | 14 | 0.3% |
| South American | 59 | 1.4% |
| Spaniard | 17 | 0.4% |
| Spanish | 44 | 1.0% |
| Swedish | 16 | 0.4% |
| Welsh | 17 | 0.4% | View All 29 Rows |
Immigrants in Tarentum borough
The most numerous immigrant groups reported in Tarentum borough came from Europe (100 | 2.3%), England (90 | 2.1%), Northern Europe (90 | 2.1%), Ecuador (32 | 0.7%), and Latin America (32 | 0.7%), together accounting for 8.0% of all Tarentum borough residents.
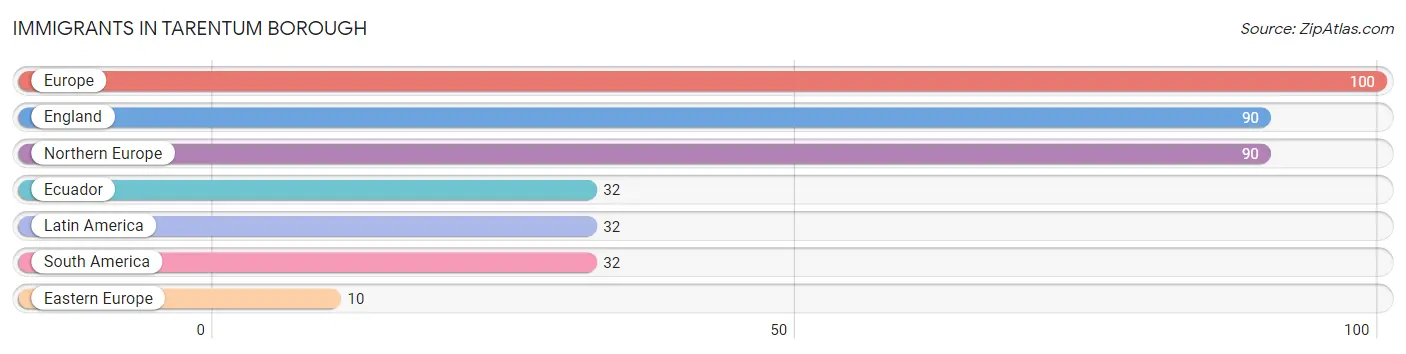
| Immigration Origin | # Population | % Population |
| Eastern Europe | 10 | 0.2% |
| Ecuador | 32 | 0.7% |
| England | 90 | 2.1% |
| Europe | 100 | 2.3% |
| Latin America | 32 | 0.7% |
| Northern Europe | 90 | 2.1% |
| South America | 32 | 0.7% | View All 7 Rows |
Sex and Age in Tarentum borough
Sex and Age in Tarentum borough
The most populous age groups in Tarentum borough are 60 to 64 Years (372 | 17.5%) for men and 85 Years and over (214 | 9.7%) for women.
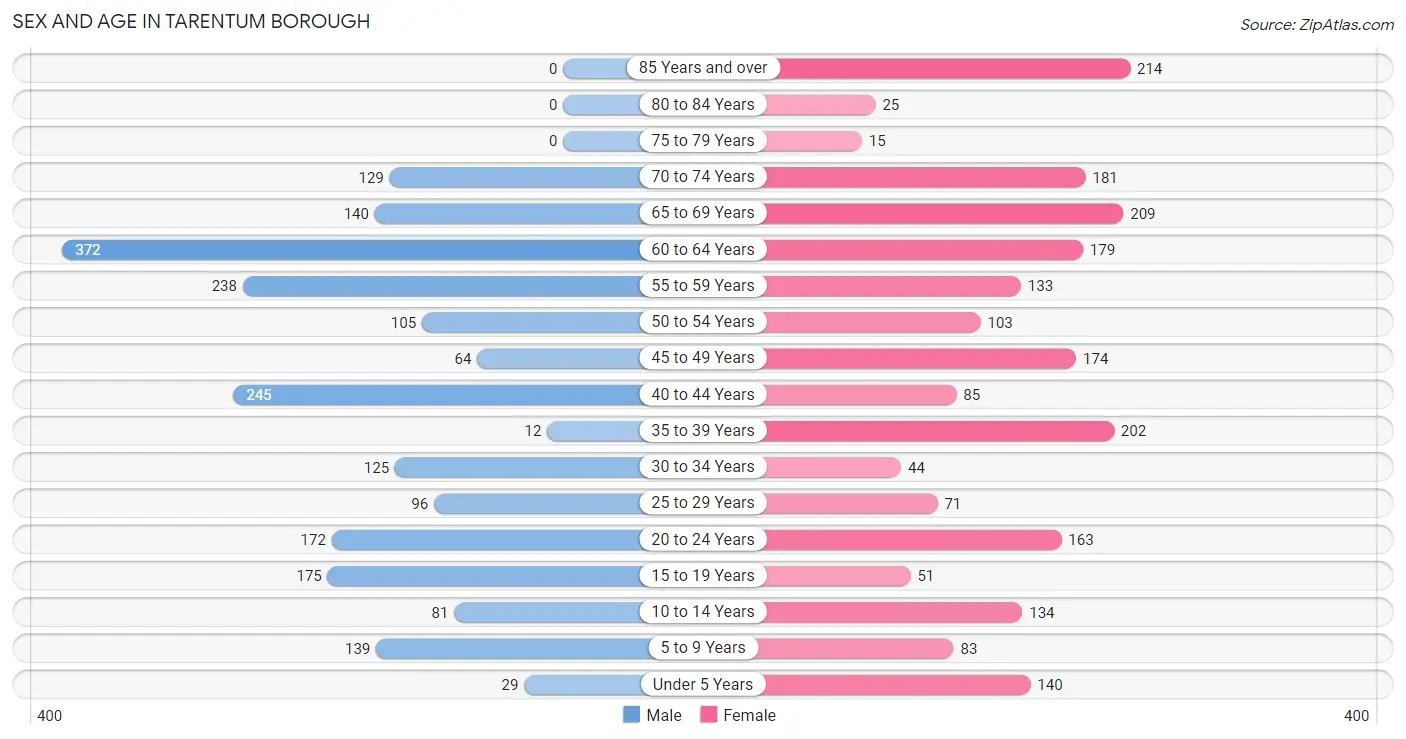
| Age Bracket | Male | Female |
| Under 5 Years | 29 (1.4%) | 140 (6.4%) |
| 5 to 9 Years | 139 (6.6%) | 83 (3.8%) |
| 10 to 14 Years | 81 (3.8%) | 134 (6.1%) |
| 15 to 19 Years | 175 (8.3%) | 51 (2.3%) |
| 20 to 24 Years | 172 (8.1%) | 163 (7.4%) |
| 25 to 29 Years | 96 (4.5%) | 71 (3.2%) |
| 30 to 34 Years | 125 (5.9%) | 44 (2.0%) |
| 35 to 39 Years | 12 (0.6%) | 202 (9.2%) |
| 40 to 44 Years | 245 (11.6%) | 85 (3.8%) |
| 45 to 49 Years | 64 (3.0%) | 174 (7.9%) |
| 50 to 54 Years | 105 (5.0%) | 103 (4.7%) |
| 55 to 59 Years | 238 (11.2%) | 133 (6.0%) |
| 60 to 64 Years | 372 (17.5%) | 179 (8.1%) |
| 65 to 69 Years | 140 (6.6%) | 209 (9.5%) |
| 70 to 74 Years | 129 (6.1%) | 181 (8.2%) |
| 75 to 79 Years | 0 (0.0%) | 15 (0.7%) |
| 80 to 84 Years | 0 (0.0%) | 25 (1.1%) |
| 85 Years and over | 0 (0.0%) | 214 (9.7%) |
| Total | 2,122 (100.0%) | 2,206 (100.0%) |
Families and Households in Tarentum borough
Median Family Size in Tarentum borough
The median family size in Tarentum borough is 3.01 persons per family, with single female/mother families (209 | 22.3%) accounting for the largest median family size of 3.17 persons per family. On the other hand, married-couple families (541 | 57.6%) represent the smallest median family size with 2.90 persons per family.
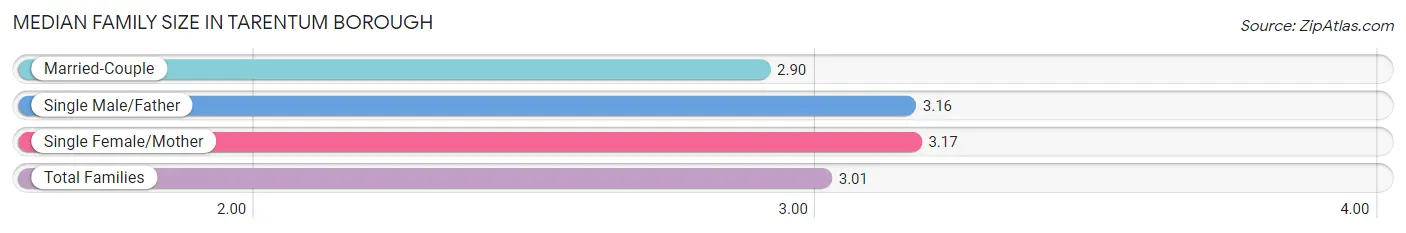
| Family Type | # Families | Family Size |
| Married-Couple | 541 (57.6%) | 2.90 |
| Single Male/Father | 189 (20.1%) | 3.16 |
| Single Female/Mother | 209 (22.3%) | 3.17 |
| Total Families | 939 (100.0%) | 3.01 |
Median Household Size in Tarentum borough
The median household size in Tarentum borough is 1.97 persons per household, with single female/mother households (209 | 9.6%) accounting for the largest median household size of 3.33 persons per household. non-family households (1,249 | 57.1%) represent the smallest median household size with 1.13 persons per household.
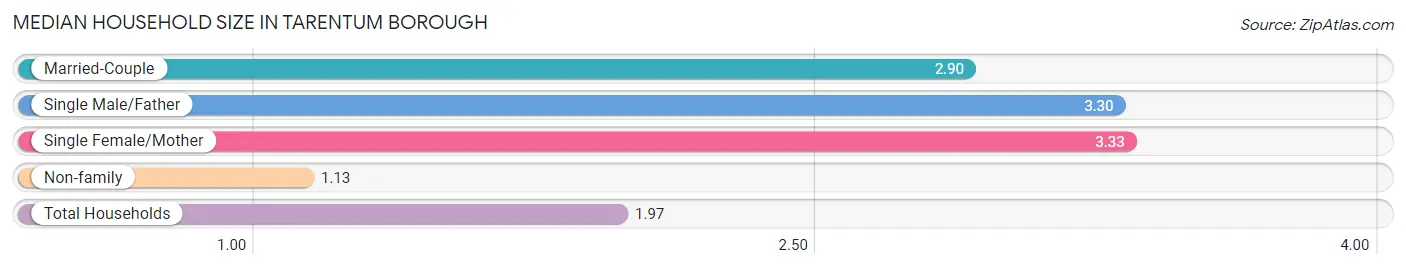
| Household Type | # Households | Household Size |
| Married-Couple | 541 (24.7%) | 2.90 |
| Single Male/Father | 189 (8.6%) | 3.30 |
| Single Female/Mother | 209 (9.6%) | 3.33 |
| Non-family | 1,249 (57.1%) | 1.13 |
| Total Households | 2,188 (100.0%) | 1.97 |
Household Size by Marriage Status in Tarentum borough
Out of a total of 2,188 households in Tarentum borough, 939 (42.9%) are family households, while 1,249 (57.1%) are nonfamily households. The most numerous type of family households are 2-person households, comprising 517, and the most common type of nonfamily households are 1-person households, comprising 1,105.
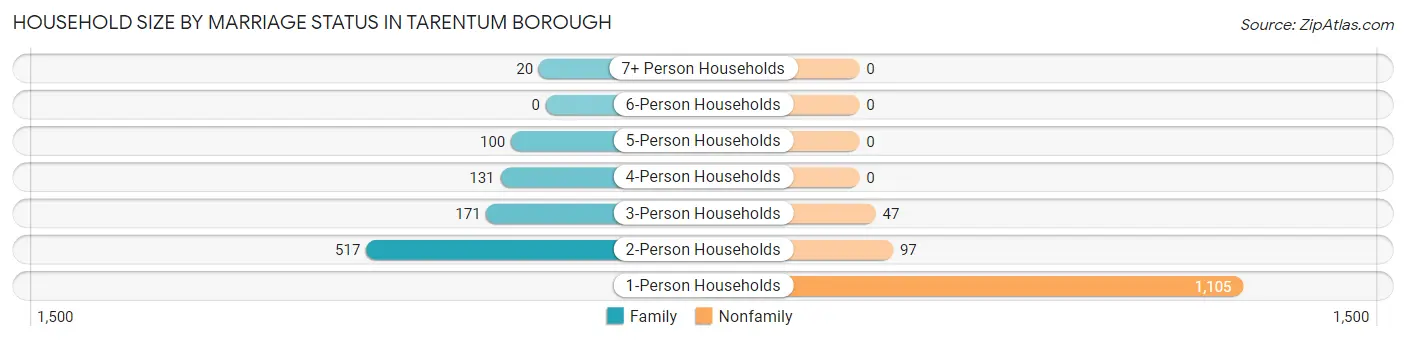
| Household Size | Family Households | Nonfamily Households |
| 1-Person Households | - | 1,105 (50.5%) |
| 2-Person Households | 517 (23.6%) | 97 (4.4%) |
| 3-Person Households | 171 (7.8%) | 47 (2.1%) |
| 4-Person Households | 131 (6.0%) | 0 (0.0%) |
| 5-Person Households | 100 (4.6%) | 0 (0.0%) |
| 6-Person Households | 0 (0.0%) | 0 (0.0%) |
| 7+ Person Households | 20 (0.9%) | 0 (0.0%) |
| Total | 939 (42.9%) | 1,249 (57.1%) |
Female Fertility in Tarentum borough
Fertility by Age in Tarentum borough
Average fertility rate in Tarentum borough is 57.0 births per 1,000 women. Women in the age bracket of 20 to 34 years have the highest fertility rate with 65.0 births per 1,000 women. Women in the age bracket of 35 to 50 years acount for 60.9% of all women with births.
| Age Bracket | Women with Births | Births / 1,000 Women |
| 15 to 19 years | 0 (0.0%) | 0.0 |
| 20 to 34 years | 18 (39.1%) | 65.0 |
| 35 to 50 years | 28 (60.9%) | 59.0 |
| Total | 46 (100.0%) | 57.0 |
Fertility by Age by Marriage Status in Tarentum borough
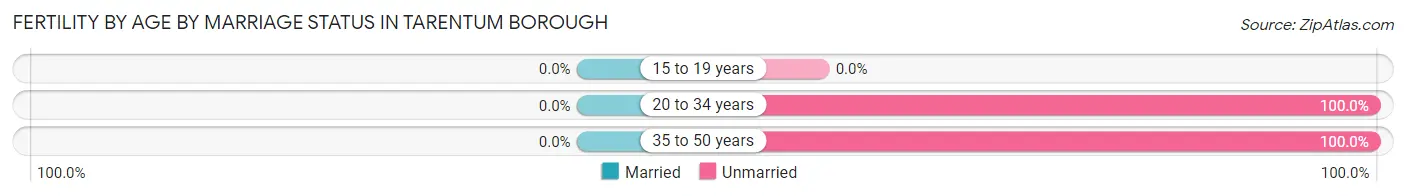
| Age Bracket | Married | Unmarried |
| 15 to 19 years | 0 (0.0%) | 0 (0.0%) |
| 20 to 34 years | 0 (0.0%) | 18 (100.0%) |
| 35 to 50 years | 0 (0.0%) | 28 (100.0%) |
| Total | 0 (0.0%) | 46 (100.0%) |
Fertility by Education in Tarentum borough
| Educational Attainment | Women with Births | Births / 1,000 Women |
| Less than High School | 0 (0.0%) | 0.0 |
| High School Diploma | 46 (100.0%) | 134.0 |
| College or Associate's Degree | 0 (0.0%) | 0.0 |
| Bachelor's Degree | 0 (0.0%) | 0.0 |
| Graduate Degree | 0 (0.0%) | 0.0 |
| Total | 46 (100.0%) | 57.0 |
Fertility by Education by Marriage Status in Tarentum borough
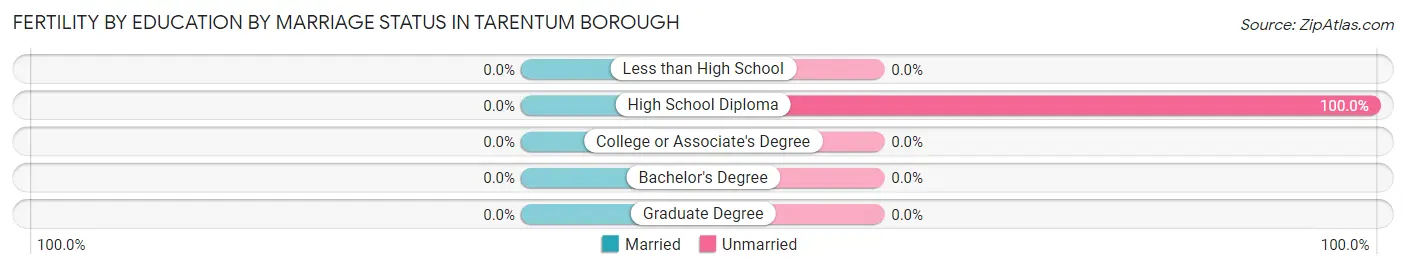
| Educational Attainment | Married | Unmarried |
| Less than High School | 0 (0.0%) | 0 (0.0%) |
| High School Diploma | 0 (0.0%) | 46 (100.0%) |
| College or Associate's Degree | 0 (0.0%) | 0 (0.0%) |
| Bachelor's Degree | 0 (0.0%) | 0 (0.0%) |
| Graduate Degree | 0 (0.0%) | 0 (0.0%) |
| Total | 0 (0.0%) | 46 (100.0%) |
Employment Characteristics in Tarentum borough
Employment by Class of Employer in Tarentum borough
Among the 1,860 employed individuals in Tarentum borough, private company employees (1,415 | 76.1%), not-for-profit organizations (248 | 13.3%), and local government employees (86 | 4.6%) make up the most common classes of employment.
| Employer Class | # Employees | % Employees |
| Private Company Employees | 1,415 | 76.1% |
| Self-Employed (Incorporated) | 45 | 2.4% |
| Self-Employed (Not Incorporated) | 56 | 3.0% |
| Not-for-profit Organizations | 248 | 13.3% |
| Local Government Employees | 86 | 4.6% |
| State Government Employees | 10 | 0.5% |
| Federal Government Employees | 0 | 0.0% |
| Unpaid Family Workers | 0 | 0.0% |
| Total | 1,860 | 100.0% |
Employment Status by Age in Tarentum borough
According to the labor force statistics for Tarentum borough, out of the total population over 16 years of age (3,702), 55.4% or 2,051 individuals are in the labor force, with 6.2% or 127 of them unemployed. The age group with the highest labor force participation rate is 30 to 34 years, with 100.0% or 169 individuals in the labor force. Within the labor force, the 16 to 19 years age range has the highest percentage of unemployed individuals, with 47.6% or 20 of them being unemployed.
| Age Bracket | In Labor Force | Unemployed |
| 16 to 19 Years | 42 (20.4%) | 20 (47.6%) |
| 20 to 24 Years | 279 (83.3%) | 48 (17.2%) |
| 25 to 29 Years | 127 (76.0%) | 0 (0.0%) |
| 30 to 34 Years | 169 (100.0%) | 18 (10.7%) |
| 35 to 44 Years | 378 (69.5%) | 0 (0.0%) |
| 45 to 54 Years | 352 (78.9%) | 25 (7.1%) |
| 55 to 59 Years | 83 (22.4%) | 0 (0.0%) |
| 60 to 64 Years | 416 (75.5%) | 0 (0.0%) |
| 65 to 74 Years | 204 (31.0%) | 16 (7.8%) |
| 75 Years and over | 0 (0.0%) | 0 (0.0%) |
| Total | 2,051 (55.4%) | 127 (6.2%) |
Employment Status by Educational Attainment in Tarentum borough
According to labor force statistics for Tarentum borough, 67.8% of individuals (1,524) out of the total population between 25 and 64 years of age (2,248) are in the labor force, with 2.8% or 43 of them being unemployed. The group with the highest labor force participation rate are those with the educational attainment of bachelor's degree or higher, with 82.5% or 273 individuals in the labor force. Within the labor force, individuals with high school diploma education have the highest percentage of unemployment, with 5.2% or 43 of them being unemployed.
| Educational Attainment | In Labor Force | Unemployed |
| Less than High School | 19 (22.4%) | 0 (0.0%) |
| High School Diploma | 823 (68.7%) | 62 (5.2%) |
| College / Associate Degree | 410 (64.7%) | 0 (0.0%) |
| Bachelor's Degree or higher | 273 (82.5%) | 0 (0.0%) |
| Total | 1,524 (67.8%) | 63 (2.8%) |
Employment Occupations by Sex in Tarentum borough
Management, Business, Science and Arts Occupations
The most common Management, Business, Science and Arts occupations in Tarentum borough are Health Diagnosing & Treating (156 | 8.1%), Health Technologists (90 | 4.7%), Business & Financial (79 | 4.1%), Community & Social Service (64 | 3.3%), and Computers, Engineering & Science (62 | 3.2%).
Management, Business, Science and Arts Occupations by Sex
Within the Management, Business, Science and Arts occupations in Tarentum borough, the most male-oriented occupations are Computers, Engineering & Science (100.0%), Architecture & Engineering (100.0%), and Life, Physical & Social Science (100.0%), while the most female-oriented occupations are Community & Social Service (100.0%), Education, Arts & Media (100.0%), and Education Instruction & Library (100.0%).
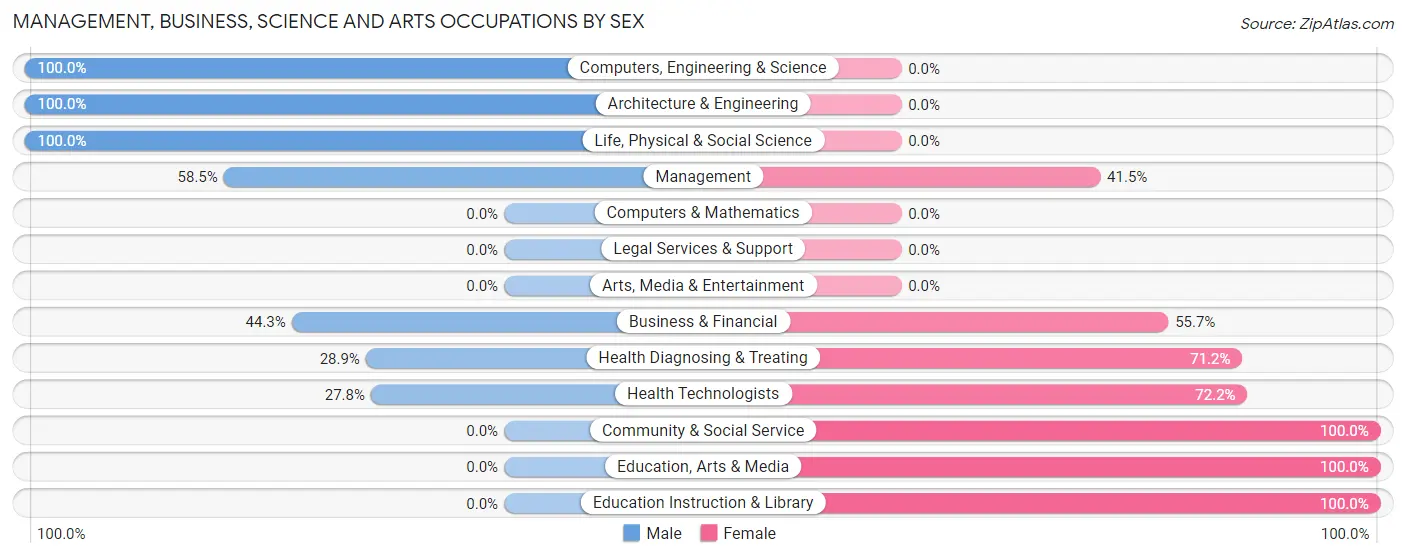
| Occupation | Male | Female |
| Management | 31 (58.5%) | 22 (41.5%) |
| Business & Financial | 35 (44.3%) | 44 (55.7%) |
| Computers, Engineering & Science | 62 (100.0%) | 0 (0.0%) |
| Computers & Mathematics | 0 (0.0%) | 0 (0.0%) |
| Architecture & Engineering | 24 (100.0%) | 0 (0.0%) |
| Life, Physical & Social Science | 38 (100.0%) | 0 (0.0%) |
| Community & Social Service | 0 (0.0%) | 64 (100.0%) |
| Education, Arts & Media | 0 (0.0%) | 10 (100.0%) |
| Legal Services & Support | 0 (0.0%) | 0 (0.0%) |
| Education Instruction & Library | 0 (0.0%) | 54 (100.0%) |
| Arts, Media & Entertainment | 0 (0.0%) | 0 (0.0%) |
| Health Diagnosing & Treating | 45 (28.8%) | 111 (71.2%) |
| Health Technologists | 25 (27.8%) | 65 (72.2%) |
| Total (Category) | 173 (41.8%) | 241 (58.2%) |
| Total (Overall) | 961 (50.0%) | 962 (50.0%) |
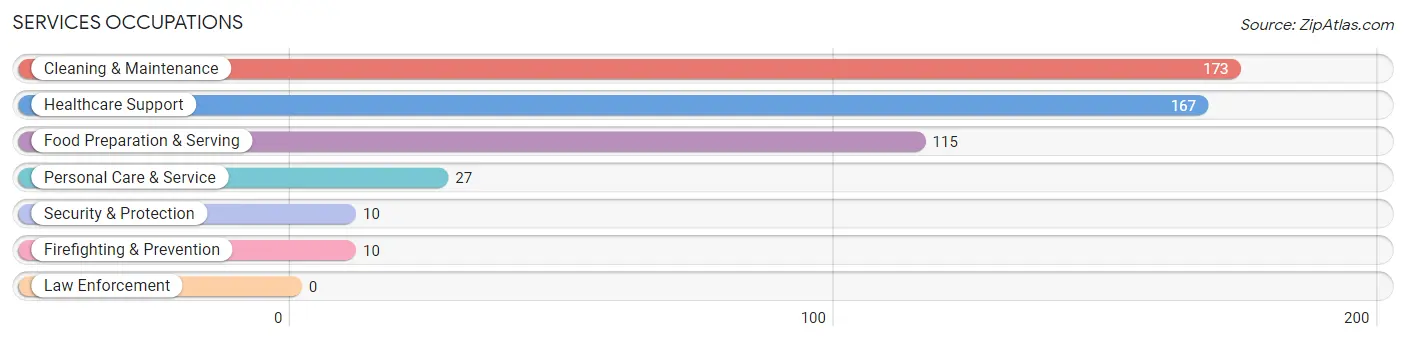
Services Occupations
The most common Services occupations in Tarentum borough are Cleaning & Maintenance (173 | 9.0%), Healthcare Support (167 | 8.7%), Food Preparation & Serving (115 | 6.0%), Personal Care & Service (27 | 1.4%), and Security & Protection (10 | 0.5%).
Services Occupations by Sex
Within the Services occupations in Tarentum borough, the most male-oriented occupations are Security & Protection (100.0%), Firefighting & Prevention (100.0%), and Cleaning & Maintenance (82.7%), while the most female-oriented occupations are Food Preparation & Serving (80.0%), Healthcare Support (65.3%), and Personal Care & Service (51.8%).
| Occupation | Male | Female |
| Healthcare Support | 58 (34.7%) | 109 (65.3%) |
| Security & Protection | 10 (100.0%) | 0 (0.0%) |
| Firefighting & Prevention | 10 (100.0%) | 0 (0.0%) |
| Law Enforcement | 0 (0.0%) | 0 (0.0%) |
| Food Preparation & Serving | 23 (20.0%) | 92 (80.0%) |
| Cleaning & Maintenance | 143 (82.7%) | 30 (17.3%) |
| Personal Care & Service | 13 (48.1%) | 14 (51.8%) |
| Total (Category) | 247 (50.2%) | 245 (49.8%) |
| Total (Overall) | 961 (50.0%) | 962 (50.0%) |
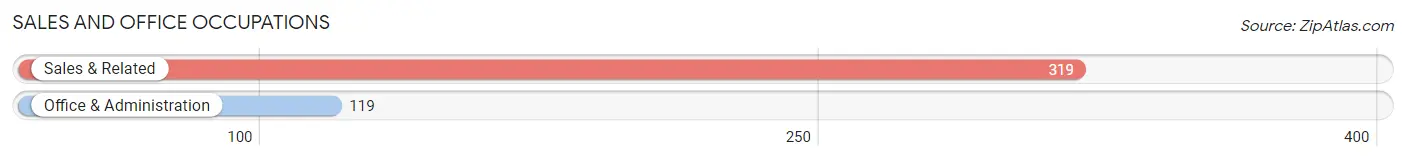
Sales and Office Occupations
The most common Sales and Office occupations in Tarentum borough are Sales & Related (319 | 16.6%), and Office & Administration (119 | 6.2%).
Sales and Office Occupations by Sex
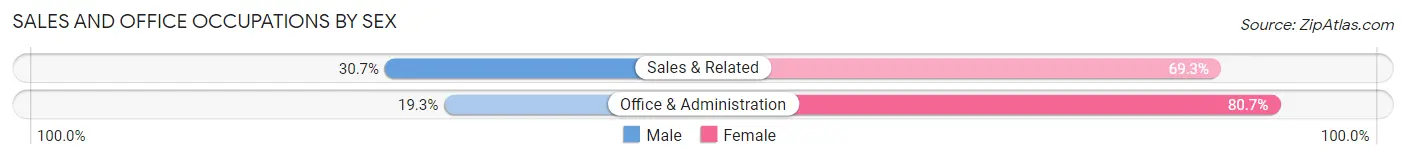
| Occupation | Male | Female |
| Sales & Related | 98 (30.7%) | 221 (69.3%) |
| Office & Administration | 23 (19.3%) | 96 (80.7%) |
| Total (Category) | 121 (27.6%) | 317 (72.4%) |
| Total (Overall) | 961 (50.0%) | 962 (50.0%) |
Natural Resources, Construction and Maintenance Occupations
The most common Natural Resources, Construction and Maintenance occupations in Tarentum borough are , and Construction & Extraction (104 | 5.4%).
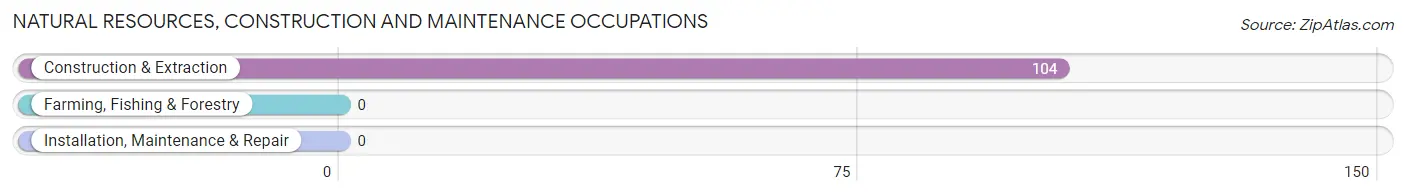
Natural Resources, Construction and Maintenance Occupations by Sex
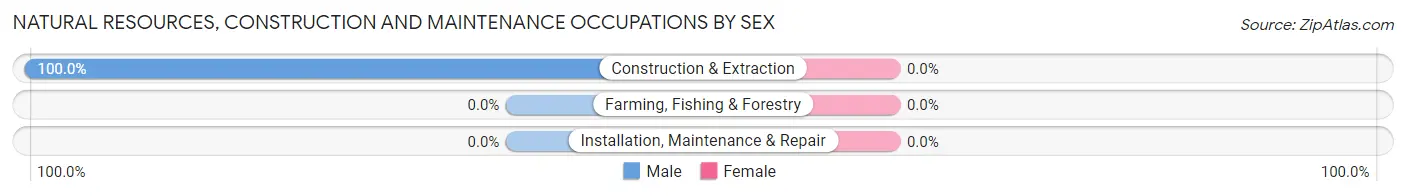
| Occupation | Male | Female |
| Farming, Fishing & Forestry | 0 (0.0%) | 0 (0.0%) |
| Construction & Extraction | 104 (100.0%) | 0 (0.0%) |
| Installation, Maintenance & Repair | 0 (0.0%) | 0 (0.0%) |
| Total (Category) | 104 (100.0%) | 0 (0.0%) |
| Total (Overall) | 961 (50.0%) | 962 (50.0%) |
Production, Transportation and Moving Occupations
The most common Production, Transportation and Moving occupations in Tarentum borough are Material Moving (222 | 11.5%), Production (146 | 7.6%), and Transportation (107 | 5.6%).
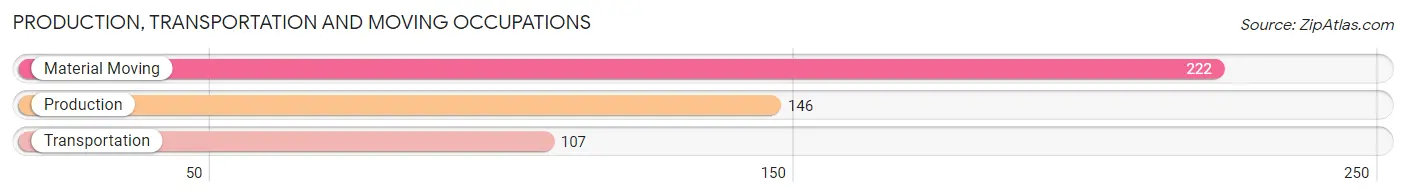
Production, Transportation and Moving Occupations by Sex
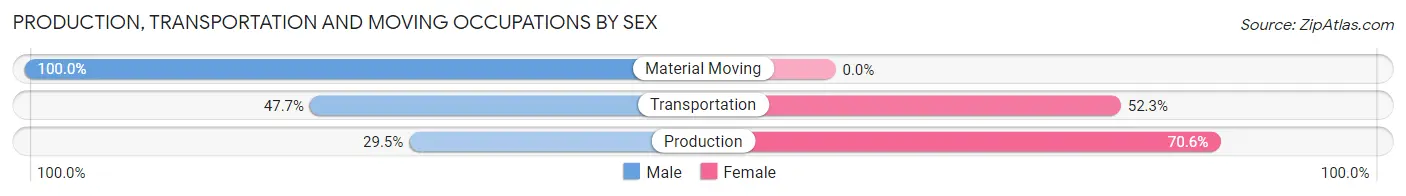
| Occupation | Male | Female |
| Production | 43 (29.4%) | 103 (70.6%) |
| Transportation | 51 (47.7%) | 56 (52.3%) |
| Material Moving | 222 (100.0%) | 0 (0.0%) |
| Total (Category) | 316 (66.5%) | 159 (33.5%) |
| Total (Overall) | 961 (50.0%) | 962 (50.0%) |
Employment Industries by Sex in Tarentum borough
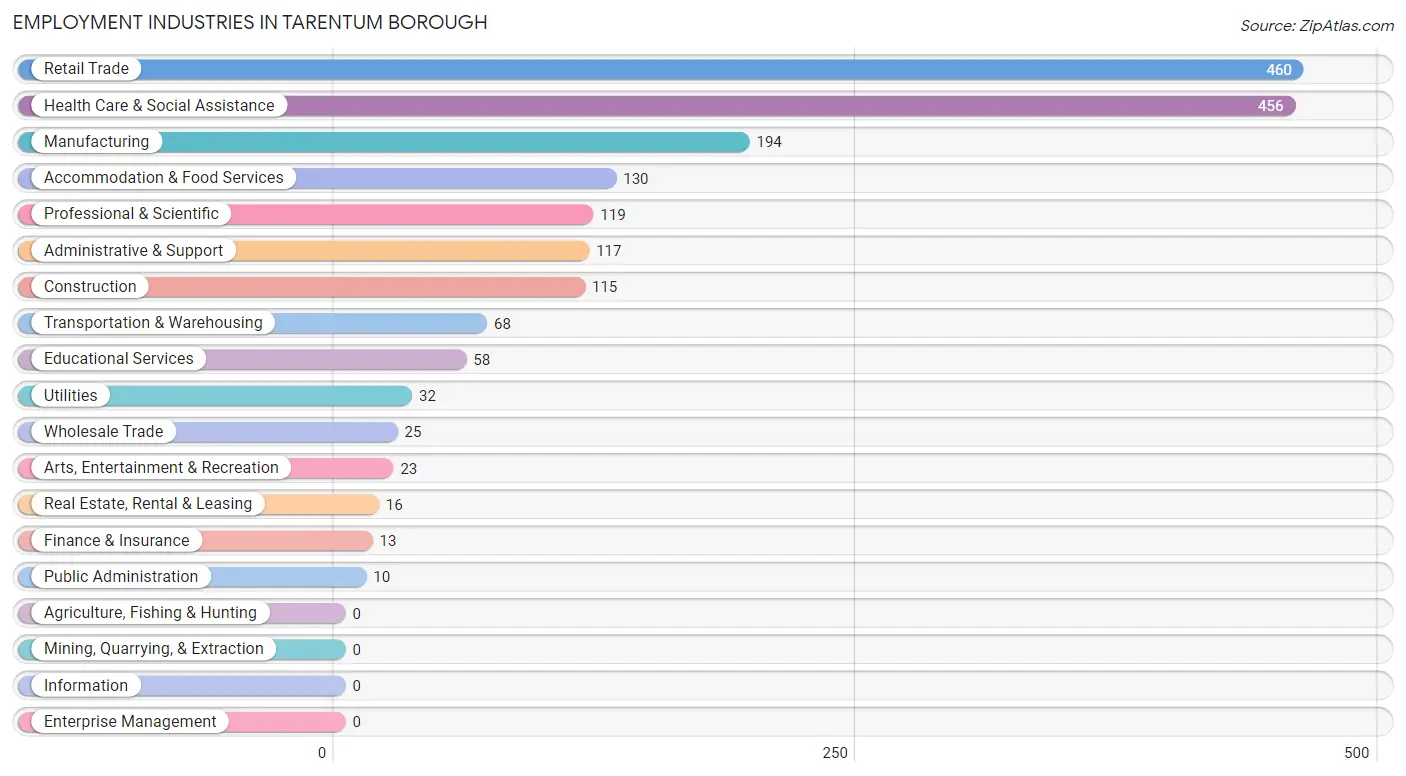
Employment Industries in Tarentum borough
The major employment industries in Tarentum borough include Retail Trade (460 | 23.9%), Health Care & Social Assistance (456 | 23.7%), Manufacturing (194 | 10.1%), Accommodation & Food Services (130 | 6.8%), and Professional & Scientific (119 | 6.2%).
Employment Industries by Sex in Tarentum borough
The Tarentum borough industries that see more men than women are Construction (100.0%), Wholesale Trade (100.0%), and Utilities (100.0%), whereas the industries that tend to have a higher number of women are Finance & Insurance (100.0%), Real Estate, Rental & Leasing (100.0%), and Educational Services (100.0%).
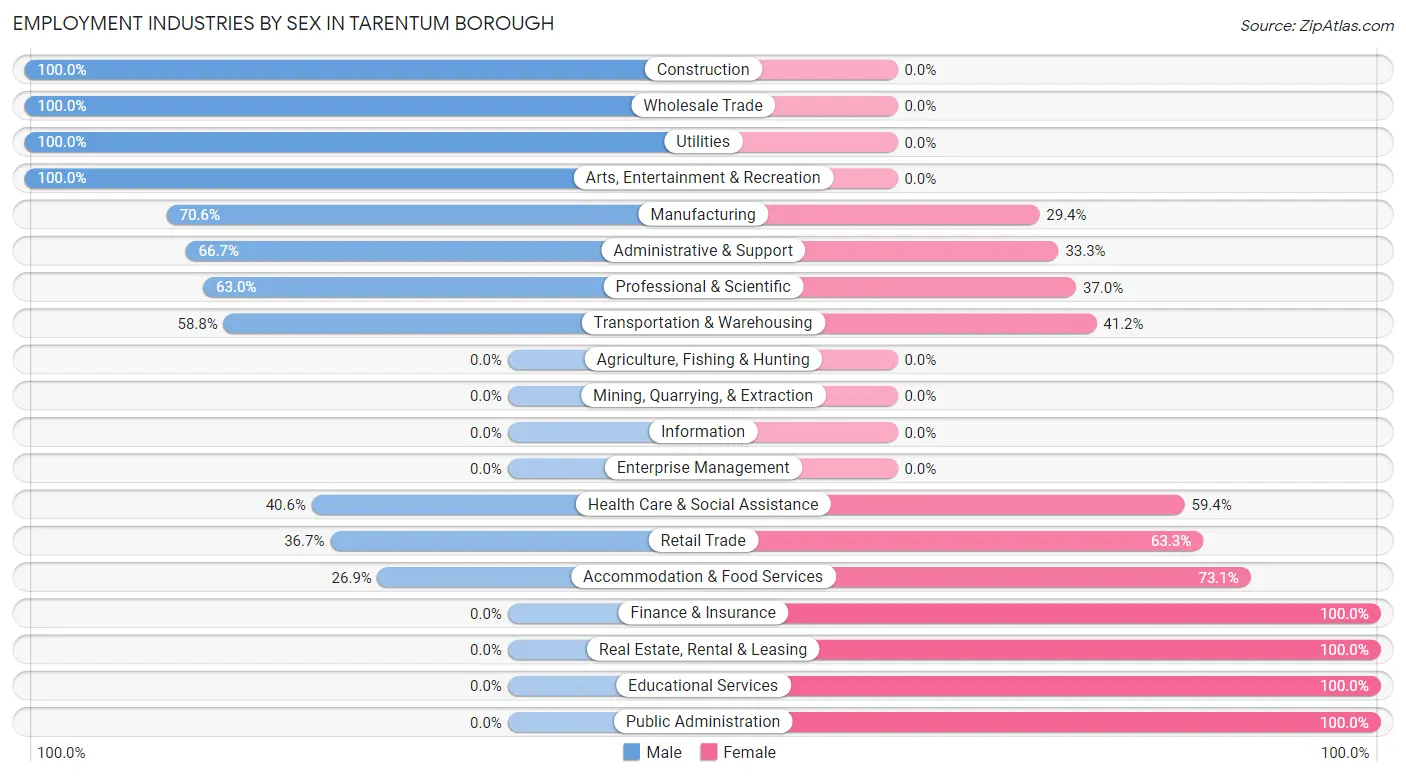
| Industry | Male | Female |
| Agriculture, Fishing & Hunting | 0 (0.0%) | 0 (0.0%) |
| Mining, Quarrying, & Extraction | 0 (0.0%) | 0 (0.0%) |
| Construction | 115 (100.0%) | 0 (0.0%) |
| Manufacturing | 137 (70.6%) | 57 (29.4%) |
| Wholesale Trade | 25 (100.0%) | 0 (0.0%) |
| Retail Trade | 169 (36.7%) | 291 (63.3%) |
| Transportation & Warehousing | 40 (58.8%) | 28 (41.2%) |
| Utilities | 32 (100.0%) | 0 (0.0%) |
| Information | 0 (0.0%) | 0 (0.0%) |
| Finance & Insurance | 0 (0.0%) | 13 (100.0%) |
| Real Estate, Rental & Leasing | 0 (0.0%) | 16 (100.0%) |
| Professional & Scientific | 75 (63.0%) | 44 (37.0%) |
| Enterprise Management | 0 (0.0%) | 0 (0.0%) |
| Administrative & Support | 78 (66.7%) | 39 (33.3%) |
| Educational Services | 0 (0.0%) | 58 (100.0%) |
| Health Care & Social Assistance | 185 (40.6%) | 271 (59.4%) |
| Arts, Entertainment & Recreation | 23 (100.0%) | 0 (0.0%) |
| Accommodation & Food Services | 35 (26.9%) | 95 (73.1%) |
| Public Administration | 0 (0.0%) | 10 (100.0%) |
| Total | 961 (50.0%) | 962 (50.0%) |
Education in Tarentum borough
School Enrollment in Tarentum borough
The most common levels of schooling among the 950 students in Tarentum borough are college / undergraduate (249 | 26.2%), middle school (222 | 23.4%), and elementary school (216 | 22.7%).
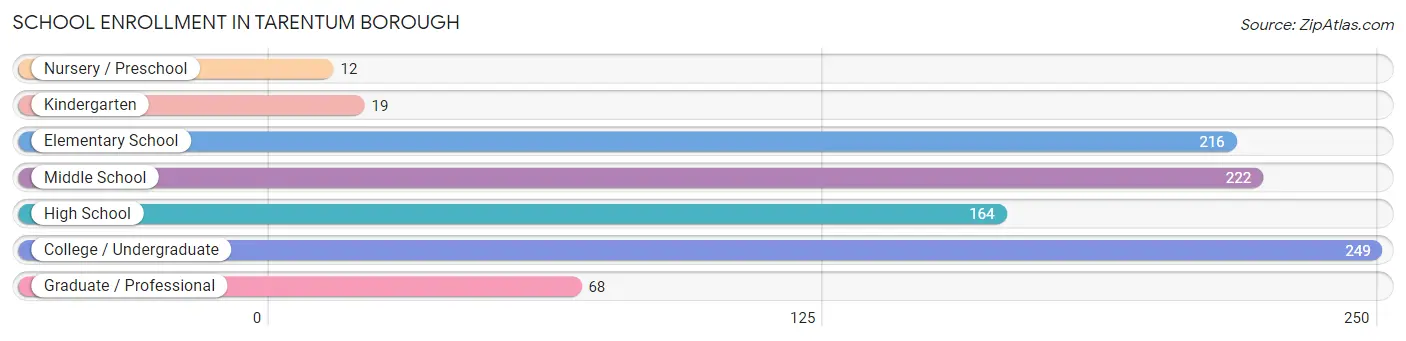
| School Level | # Students | % Students |
| Nursery / Preschool | 12 | 1.3% |
| Kindergarten | 19 | 2.0% |
| Elementary School | 216 | 22.7% |
| Middle School | 222 | 23.4% |
| High School | 164 | 17.3% |
| College / Undergraduate | 249 | 26.2% |
| Graduate / Professional | 68 | 7.2% |
| Total | 950 | 100.0% |
School Enrollment by Age by Funding Source in Tarentum borough
Out of a total of 950 students who are enrolled in schools in Tarentum borough, 147 (15.5%) attend a private institution, while the remaining 803 (84.5%) are enrolled in public schools. The age group of 15 to 17 year olds has the highest likelihood of being enrolled in private schools, with 59 (32.1% in the age bracket) enrolled. Conversely, the age group of 3 to 4 year olds has the lowest likelihood of being enrolled in a private school, with 12 (100.0% in the age bracket) attending a public institution.
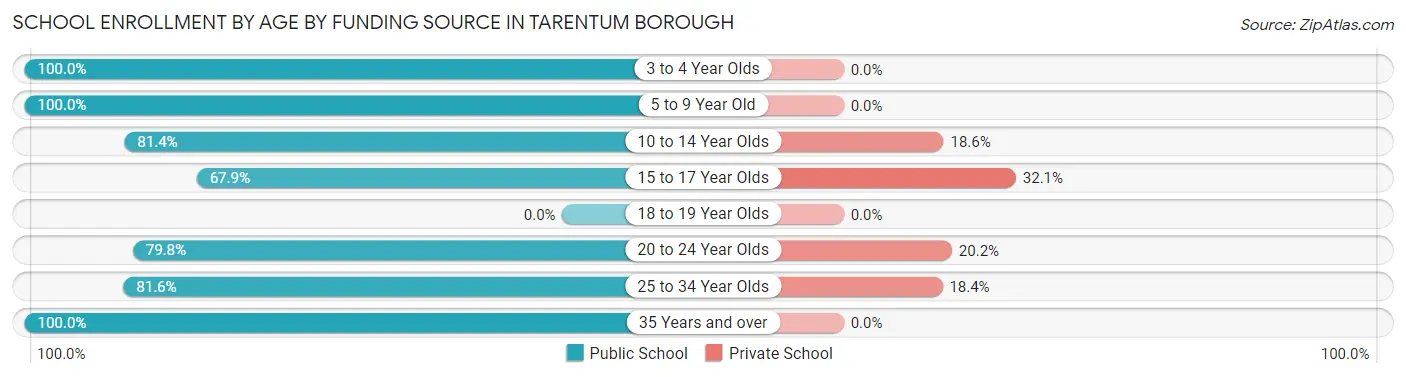
| Age Bracket | Public School | Private School |
| 3 to 4 Year Olds | 12 (100.0%) | 0 (0.0%) |
| 5 to 9 Year Old | 222 (100.0%) | 0 (0.0%) |
| 10 to 14 Year Olds | 175 (81.4%) | 40 (18.6%) |
| 15 to 17 Year Olds | 125 (67.9%) | 59 (32.1%) |
| 18 to 19 Year Olds | 0 (0.0%) | 0 (0.0%) |
| 20 to 24 Year Olds | 99 (79.8%) | 25 (20.2%) |
| 25 to 34 Year Olds | 102 (81.6%) | 23 (18.4%) |
| 35 Years and over | 68 (100.0%) | 0 (0.0%) |
| Total | 803 (84.5%) | 147 (15.5%) |
Educational Attainment by Field of Study in Tarentum borough
Business (114 | 20.6%), social sciences (111 | 20.1%), science & technology (91 | 16.5%), visual & performing arts (51 | 9.2%), and bio, nature & agricultural (41 | 7.4%) are the most common fields of study among 552 individuals in Tarentum borough who have obtained a bachelor's degree or higher.
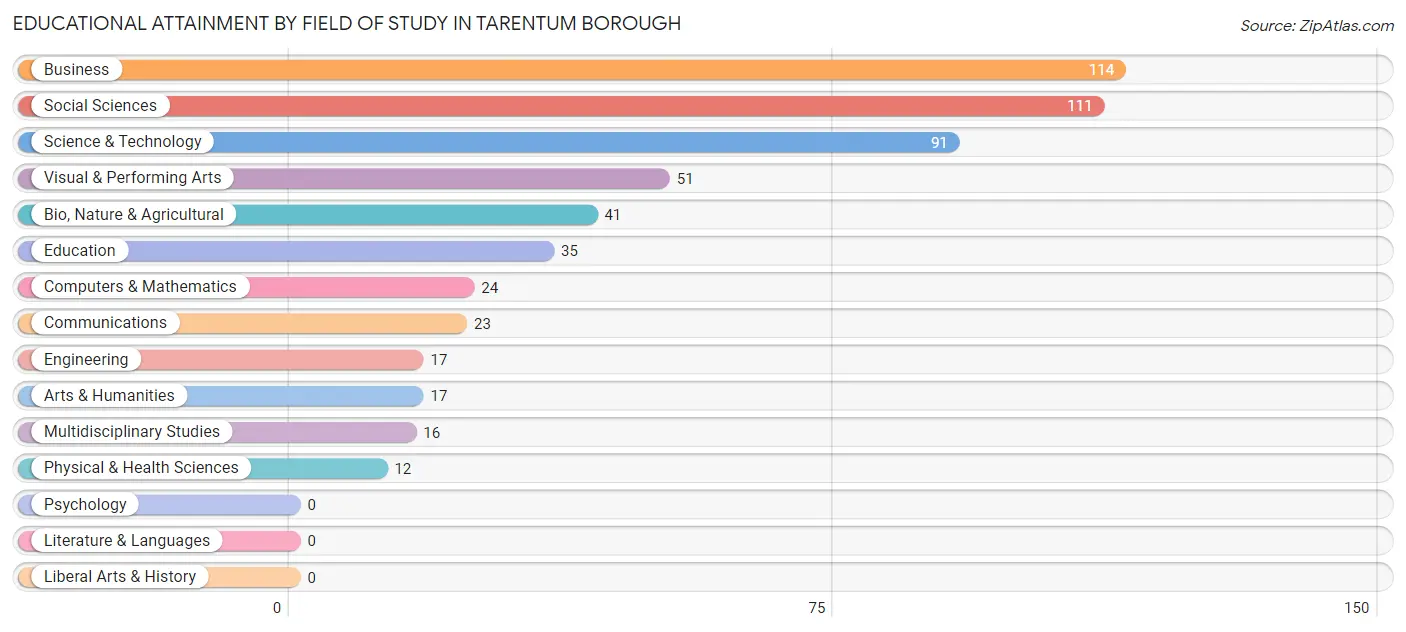
| Field of Study | # Graduates | % Graduates |
| Computers & Mathematics | 24 | 4.3% |
| Bio, Nature & Agricultural | 41 | 7.4% |
| Physical & Health Sciences | 12 | 2.2% |
| Psychology | 0 | 0.0% |
| Social Sciences | 111 | 20.1% |
| Engineering | 17 | 3.1% |
| Multidisciplinary Studies | 16 | 2.9% |
| Science & Technology | 91 | 16.5% |
| Business | 114 | 20.6% |
| Education | 35 | 6.3% |
| Literature & Languages | 0 | 0.0% |
| Liberal Arts & History | 0 | 0.0% |
| Visual & Performing Arts | 51 | 9.2% |
| Communications | 23 | 4.2% |
| Arts & Humanities | 17 | 3.1% |
| Total | 552 | 100.0% |
Transportation & Commute in Tarentum borough
Vehicle Availability by Sex in Tarentum borough
The most prevalent vehicle ownership categories in Tarentum borough are males with 2 vehicles (349, accounting for 37.2%) and females with 2 vehicles (202, making up 37.9%).
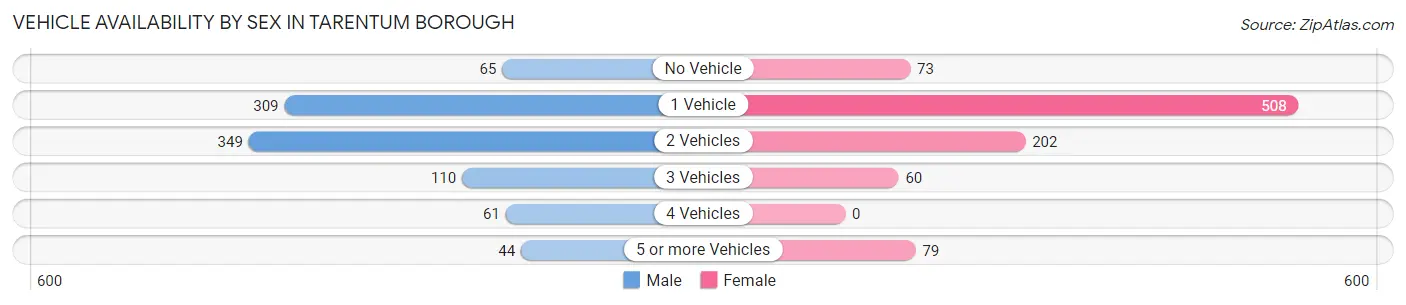
| Vehicles Available | Male | Female |
| No Vehicle | 65 (6.9%) | 73 (7.9%) |
| 1 Vehicle | 309 (32.9%) | 508 (55.1%) |
| 2 Vehicles | 349 (37.2%) | 202 (21.9%) |
| 3 Vehicles | 110 (11.7%) | 60 (6.5%) |
| 4 Vehicles | 61 (6.5%) | 0 (0.0%) |
| 5 or more Vehicles | 44 (4.7%) | 79 (8.6%) |
| Total | 938 (100.0%) | 922 (100.0%) |
Commute Time in Tarentum borough
The most frequently occuring commute durations in Tarentum borough are 10 to 14 minutes (313 commuters, 17.3%), 5 to 9 minutes (263 commuters, 14.5%), and 15 to 19 minutes (236 commuters, 13.0%).
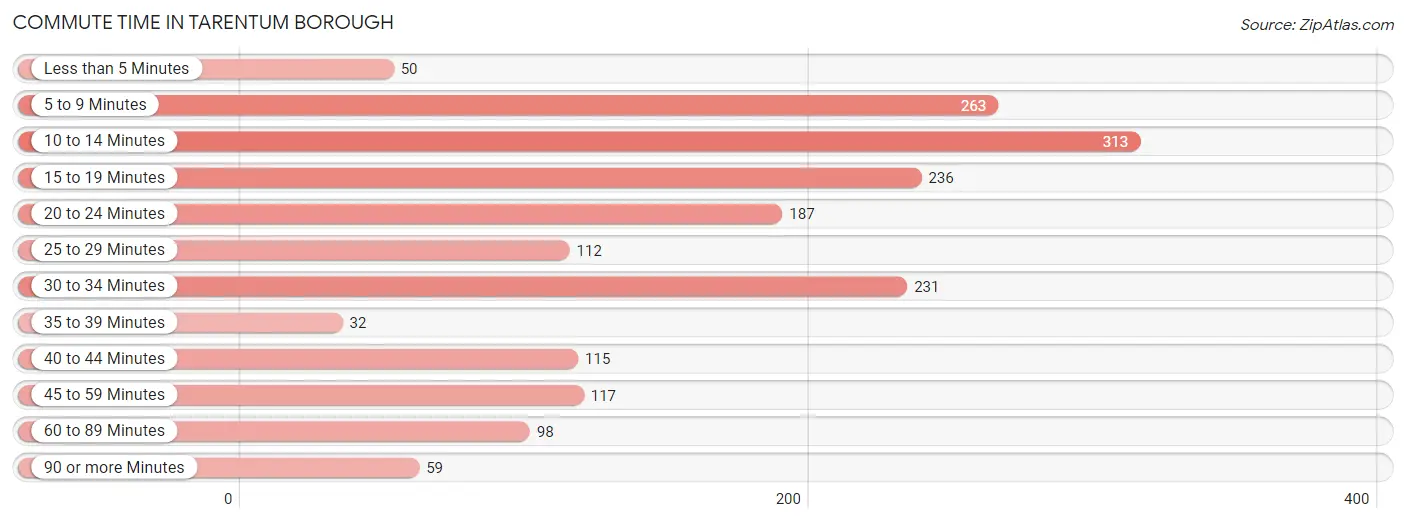
| Commute Time | # Commuters | % Commuters |
| Less than 5 Minutes | 50 | 2.8% |
| 5 to 9 Minutes | 263 | 14.5% |
| 10 to 14 Minutes | 313 | 17.3% |
| 15 to 19 Minutes | 236 | 13.0% |
| 20 to 24 Minutes | 187 | 10.3% |
| 25 to 29 Minutes | 112 | 6.2% |
| 30 to 34 Minutes | 231 | 12.7% |
| 35 to 39 Minutes | 32 | 1.8% |
| 40 to 44 Minutes | 115 | 6.3% |
| 45 to 59 Minutes | 117 | 6.5% |
| 60 to 89 Minutes | 98 | 5.4% |
| 90 or more Minutes | 59 | 3.3% |
Commute Time by Sex in Tarentum borough
The most common commute times in Tarentum borough are 10 to 14 minutes (189 commuters, 21.2%) for males and 20 to 24 minutes (181 commuters, 19.6%) for females.
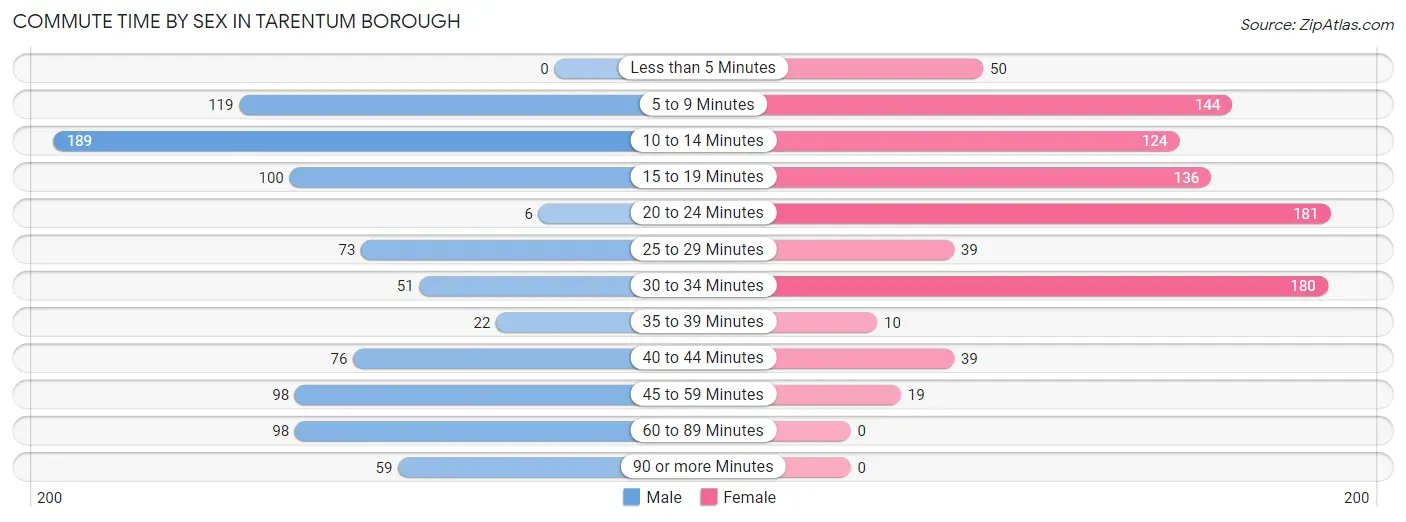
| Commute Time | Male | Female |
| Less than 5 Minutes | 0 (0.0%) | 50 (5.4%) |
| 5 to 9 Minutes | 119 (13.4%) | 144 (15.6%) |
| 10 to 14 Minutes | 189 (21.2%) | 124 (13.5%) |
| 15 to 19 Minutes | 100 (11.2%) | 136 (14.7%) |
| 20 to 24 Minutes | 6 (0.7%) | 181 (19.6%) |
| 25 to 29 Minutes | 73 (8.2%) | 39 (4.2%) |
| 30 to 34 Minutes | 51 (5.7%) | 180 (19.5%) |
| 35 to 39 Minutes | 22 (2.5%) | 10 (1.1%) |
| 40 to 44 Minutes | 76 (8.5%) | 39 (4.2%) |
| 45 to 59 Minutes | 98 (11.0%) | 19 (2.1%) |
| 60 to 89 Minutes | 98 (11.0%) | 0 (0.0%) |
| 90 or more Minutes | 59 (6.6%) | 0 (0.0%) |
Time of Departure to Work by Sex in Tarentum borough
The most frequent times of departure to work in Tarentum borough are 7:00 AM to 7:29 AM (211, 23.7%) for males and 12:00 PM to 3:59 PM (185, 20.1%) for females.
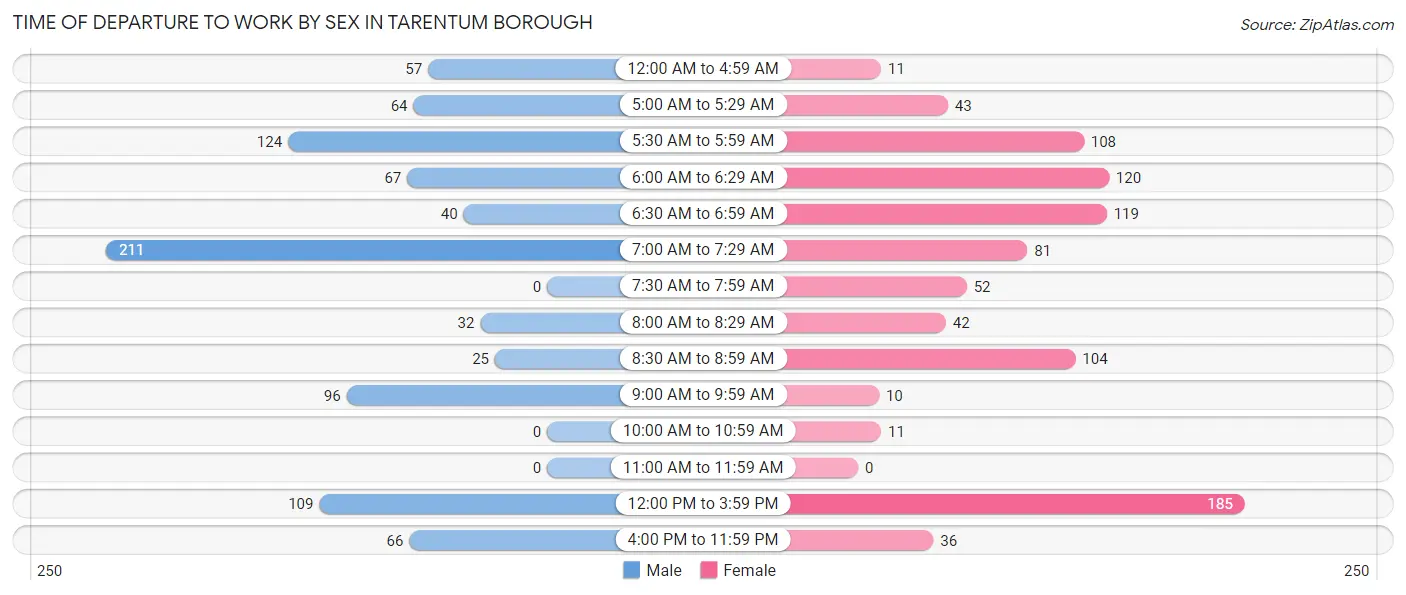
| Time of Departure | Male | Female |
| 12:00 AM to 4:59 AM | 57 (6.4%) | 11 (1.2%) |
| 5:00 AM to 5:29 AM | 64 (7.2%) | 43 (4.7%) |
| 5:30 AM to 5:59 AM | 124 (13.9%) | 108 (11.7%) |
| 6:00 AM to 6:29 AM | 67 (7.5%) | 120 (13.0%) |
| 6:30 AM to 6:59 AM | 40 (4.5%) | 119 (12.9%) |
| 7:00 AM to 7:29 AM | 211 (23.7%) | 81 (8.8%) |
| 7:30 AM to 7:59 AM | 0 (0.0%) | 52 (5.6%) |
| 8:00 AM to 8:29 AM | 32 (3.6%) | 42 (4.6%) |
| 8:30 AM to 8:59 AM | 25 (2.8%) | 104 (11.3%) |
| 9:00 AM to 9:59 AM | 96 (10.8%) | 10 (1.1%) |
| 10:00 AM to 10:59 AM | 0 (0.0%) | 11 (1.2%) |
| 11:00 AM to 11:59 AM | 0 (0.0%) | 0 (0.0%) |
| 12:00 PM to 3:59 PM | 109 (12.2%) | 185 (20.1%) |
| 4:00 PM to 11:59 PM | 66 (7.4%) | 36 (3.9%) |
| Total | 891 (100.0%) | 922 (100.0%) |
Housing Occupancy in Tarentum borough
Occupancy by Ownership in Tarentum borough
Of the total 2,188 dwellings in Tarentum borough, owner-occupied units account for 1,436 (65.6%), while renter-occupied units make up 752 (34.4%).
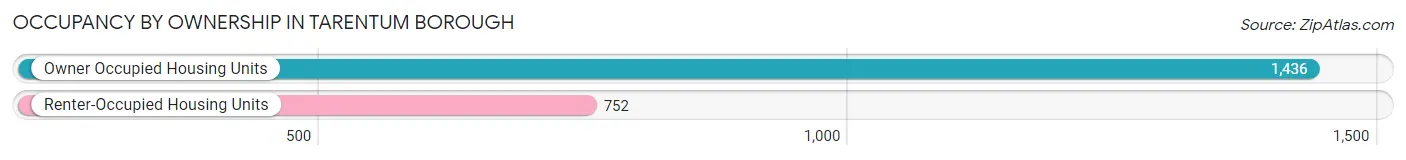
| Occupancy | # Housing Units | % Housing Units |
| Owner Occupied Housing Units | 1,436 | 65.6% |
| Renter-Occupied Housing Units | 752 | 34.4% |
| Total Occupied Housing Units | 2,188 | 100.0% |
Occupancy by Household Size in Tarentum borough
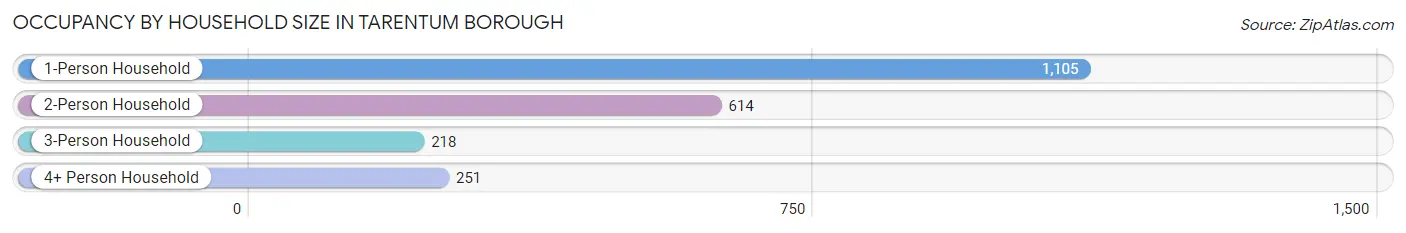
| Household Size | # Housing Units | % Housing Units |
| 1-Person Household | 1,105 | 50.5% |
| 2-Person Household | 614 | 28.1% |
| 3-Person Household | 218 | 10.0% |
| 4+ Person Household | 251 | 11.5% |
| Total Housing Units | 2,188 | 100.0% |
Occupancy by Ownership by Household Size in Tarentum borough
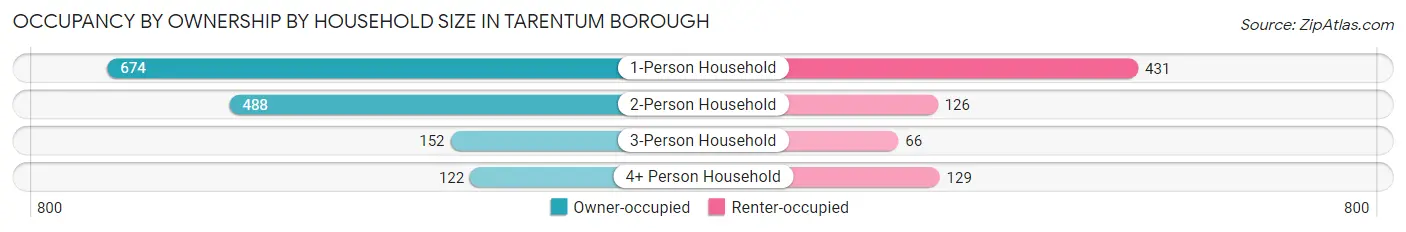
| Household Size | Owner-occupied | Renter-occupied |
| 1-Person Household | 674 (61.0%) | 431 (39.0%) |
| 2-Person Household | 488 (79.5%) | 126 (20.5%) |
| 3-Person Household | 152 (69.7%) | 66 (30.3%) |
| 4+ Person Household | 122 (48.6%) | 129 (51.4%) |
| Total Housing Units | 1,436 (65.6%) | 752 (34.4%) |
Occupancy by Educational Attainment in Tarentum borough
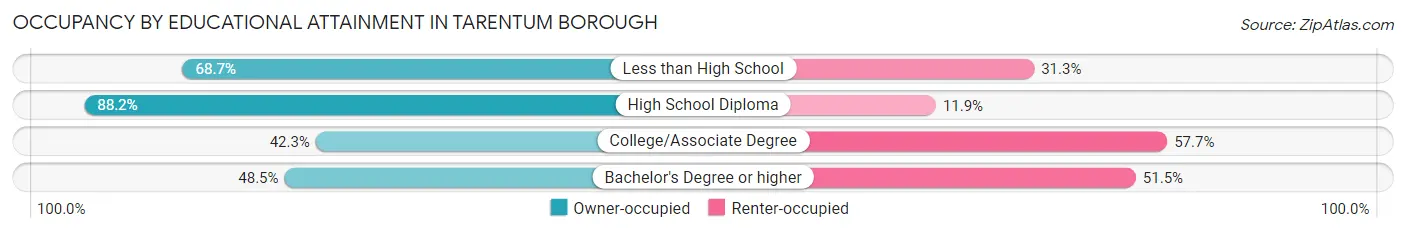
| Household Size | Owner-occupied | Renter-occupied |
| Less than High School | 46 (68.7%) | 21 (31.3%) |
| High School Diploma | 900 (88.1%) | 121 (11.8%) |
| College/Associate Degree | 296 (42.3%) | 404 (57.7%) |
| Bachelor's Degree or higher | 194 (48.5%) | 206 (51.5%) |
Occupancy by Age of Householder in Tarentum borough
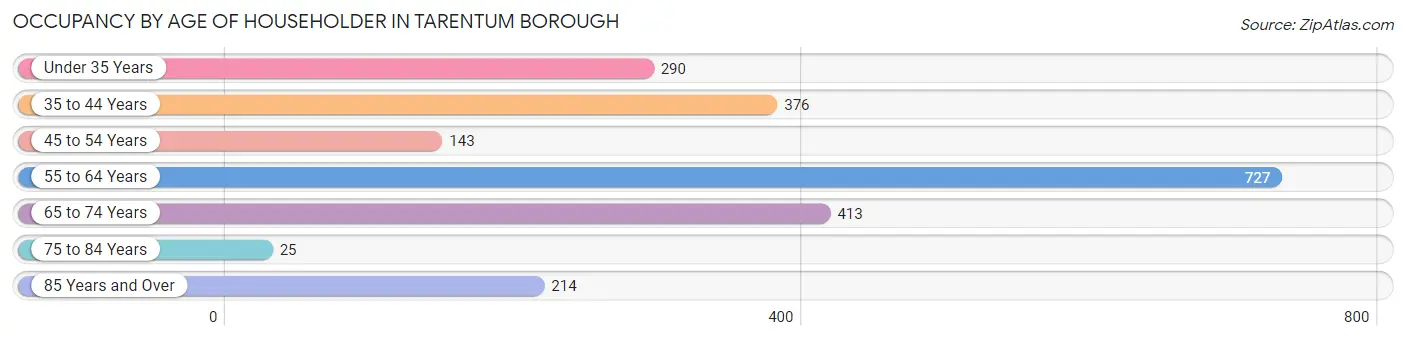
| Age Bracket | # Households | % Households |
| Under 35 Years | 290 | 13.3% |
| 35 to 44 Years | 376 | 17.2% |
| 45 to 54 Years | 143 | 6.5% |
| 55 to 64 Years | 727 | 33.2% |
| 65 to 74 Years | 413 | 18.9% |
| 75 to 84 Years | 25 | 1.1% |
| 85 Years and Over | 214 | 9.8% |
| Total | 2,188 | 100.0% |
Housing Finances in Tarentum borough
Median Income by Occupancy in Tarentum borough
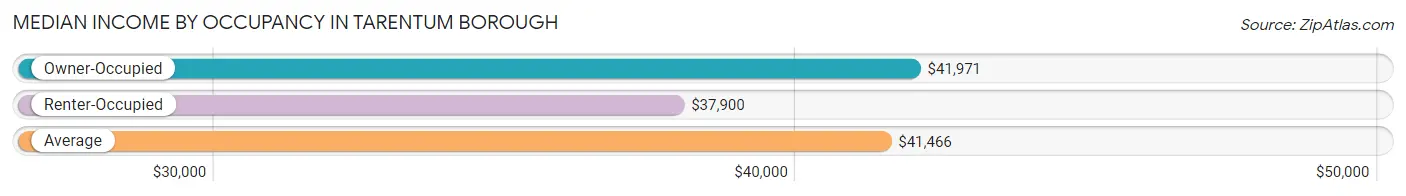
| Occupancy Type | # Households | Median Income |
| Owner-Occupied | 1,436 (65.6%) | $41,971 |
| Renter-Occupied | 752 (34.4%) | $37,900 |
| Average | 2,188 (100.0%) | $41,466 |
Occupancy by Householder Income Bracket in Tarentum borough
| Income Bracket | Owner-occupied | Renter-occupied |
| Less than $5,000 | 23 (1.6%) | 0 (0.0%) |
| $5,000 to $9,999 | 81 (5.6%) | 0 (0.0%) |
| $10,000 to $14,999 | 205 (14.3%) | 99 (13.2%) |
| $15,000 to $19,999 | 32 (2.2%) | 44 (5.9%) |
| $20,000 to $24,999 | 39 (2.7%) | 41 (5.4%) |
| $25,000 to $34,999 | 201 (14.0%) | 121 (16.1%) |
| $35,000 to $49,999 | 287 (20.0%) | 268 (35.6%) |
| $50,000 to $74,999 | 220 (15.3%) | 61 (8.1%) |
| $75,000 to $99,999 | 188 (13.1%) | 118 (15.7%) |
| $100,000 to $149,999 | 123 (8.6%) | 0 (0.0%) |
| $150,000 or more | 37 (2.6%) | 0 (0.0%) |
| Total | 1,436 (100.0%) | 752 (100.0%) |
Monthly Housing Cost Tiers in Tarentum borough
| Monthly Cost | Owner-occupied | Renter-occupied |
| Less than $300 | 232 (16.2%) | 65 (8.6%) |
| $300 to $499 | 326 (22.7%) | 69 (9.2%) |
| $500 to $799 | 372 (25.9%) | 255 (33.9%) |
| $800 to $999 | 253 (17.6%) | 50 (6.7%) |
| $1,000 to $1,499 | 223 (15.5%) | 212 (28.2%) |
| $1,500 to $1,999 | 30 (2.1%) | 0 (0.0%) |
| $2,000 to $2,499 | 0 (0.0%) | 52 (6.9%) |
| $2,500 to $2,999 | 0 (0.0%) | 0 (0.0%) |
| $3,000 or more | 0 (0.0%) | 0 (0.0%) |
| Total | 1,436 (100.0%) | 752 (100.0%) |
Physical Housing Characteristics in Tarentum borough
Housing Structures in Tarentum borough
| Structure Type | # Housing Units | % Housing Units |
| Single Unit, Detached | 1,192 | 54.5% |
| Single Unit, Attached | 144 | 6.6% |
| 2 Unit Apartments | 209 | 9.6% |
| 3 or 4 Unit Apartments | 182 | 8.3% |
| 5 to 9 Unit Apartments | 148 | 6.8% |
| 10 or more Apartments | 291 | 13.3% |
| Mobile Home / Other | 22 | 1.0% |
| Total | 2,188 | 100.0% |
Housing Structures by Occupancy in Tarentum borough
| Structure Type | Owner-occupied | Renter-occupied |
| Single Unit, Detached | 1,059 (88.8%) | 133 (11.2%) |
| Single Unit, Attached | 125 (86.8%) | 19 (13.2%) |
| 2 Unit Apartments | 117 (56.0%) | 92 (44.0%) |
| 3 or 4 Unit Apartments | 33 (18.1%) | 149 (81.9%) |
| 5 to 9 Unit Apartments | 0 (0.0%) | 148 (100.0%) |
| 10 or more Apartments | 80 (27.5%) | 211 (72.5%) |
| Mobile Home / Other | 22 (100.0%) | 0 (0.0%) |
| Total | 1,436 (65.6%) | 752 (34.4%) |
Housing Structures by Number of Rooms in Tarentum borough
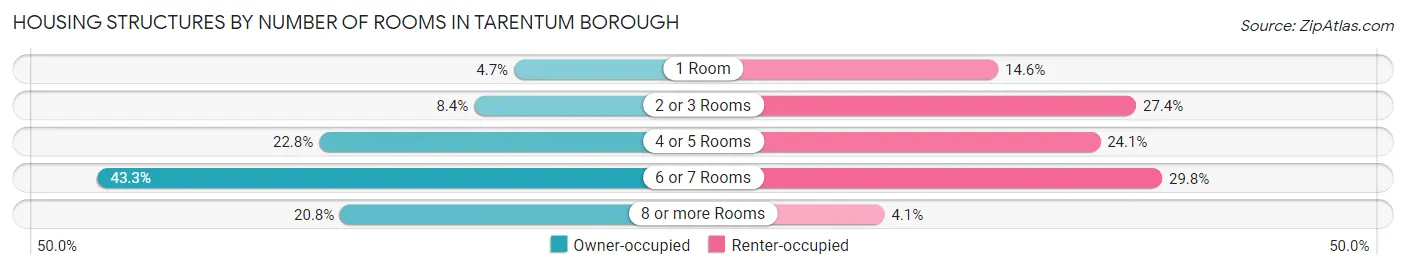
| Number of Rooms | Owner-occupied | Renter-occupied |
| 1 Room | 68 (4.7%) | 110 (14.6%) |
| 2 or 3 Rooms | 121 (8.4%) | 206 (27.4%) |
| 4 or 5 Rooms | 327 (22.8%) | 181 (24.1%) |
| 6 or 7 Rooms | 621 (43.2%) | 224 (29.8%) |
| 8 or more Rooms | 299 (20.8%) | 31 (4.1%) |
| Total | 1,436 (100.0%) | 752 (100.0%) |
Housing Structure by Heating Type in Tarentum borough
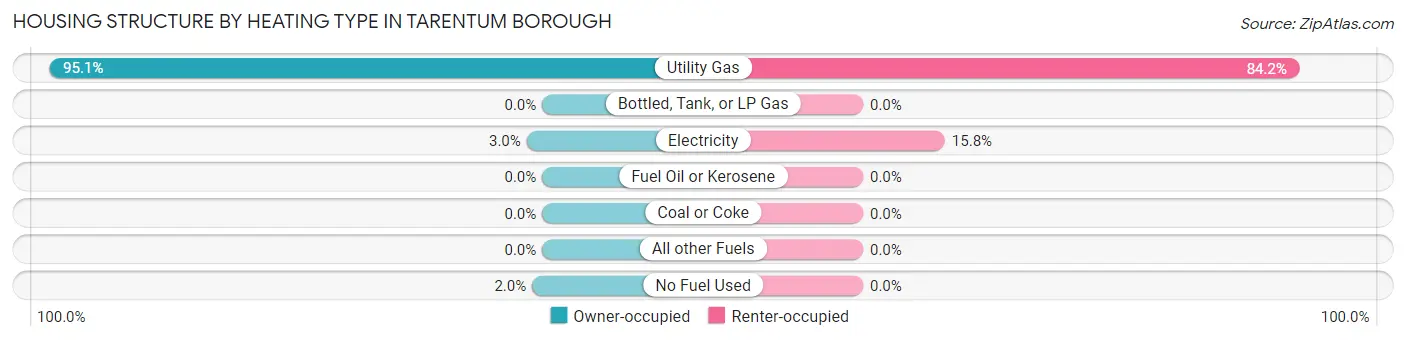
| Heating Type | Owner-occupied | Renter-occupied |
| Utility Gas | 1,365 (95.1%) | 633 (84.2%) |
| Bottled, Tank, or LP Gas | 0 (0.0%) | 0 (0.0%) |
| Electricity | 43 (3.0%) | 119 (15.8%) |
| Fuel Oil or Kerosene | 0 (0.0%) | 0 (0.0%) |
| Coal or Coke | 0 (0.0%) | 0 (0.0%) |
| All other Fuels | 0 (0.0%) | 0 (0.0%) |
| No Fuel Used | 28 (1.9%) | 0 (0.0%) |
| Total | 1,436 (100.0%) | 752 (100.0%) |
Household Vehicle Usage in Tarentum borough
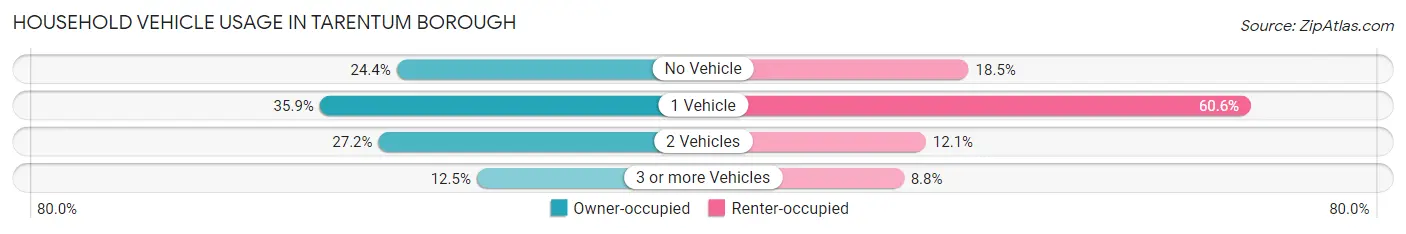
| Vehicles per Household | Owner-occupied | Renter-occupied |
| No Vehicle | 351 (24.4%) | 139 (18.5%) |
| 1 Vehicle | 516 (35.9%) | 456 (60.6%) |
| 2 Vehicles | 390 (27.2%) | 91 (12.1%) |
| 3 or more Vehicles | 179 (12.5%) | 66 (8.8%) |
| Total | 1,436 (100.0%) | 752 (100.0%) |
Real Estate & Mortgages in Tarentum borough
Real Estate and Mortgage Overview in Tarentum borough
| Characteristic | Without Mortgage | With Mortgage |
| Housing Units | 778 | 658 |
| Median Property Value | $58,200 | $74,600 |
| Median Household Income | $29,660 | $20 |
| Monthly Housing Costs | $385 | $0 |
| Real Estate Taxes | $1,155 | $17 |
Property Value by Mortgage Status in Tarentum borough
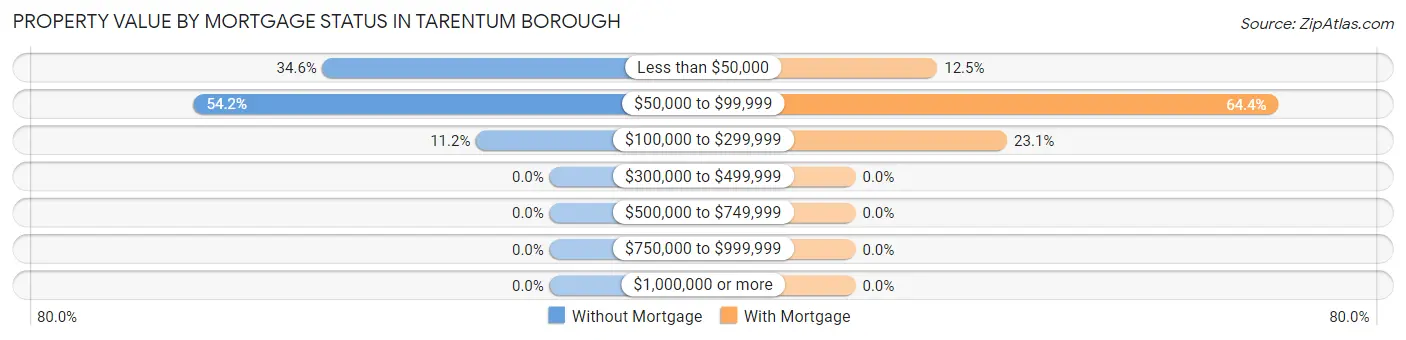
| Property Value | Without Mortgage | With Mortgage |
| Less than $50,000 | 269 (34.6%) | 82 (12.5%) |
| $50,000 to $99,999 | 422 (54.2%) | 424 (64.4%) |
| $100,000 to $299,999 | 87 (11.2%) | 152 (23.1%) |
| $300,000 to $499,999 | 0 (0.0%) | 0 (0.0%) |
| $500,000 to $749,999 | 0 (0.0%) | 0 (0.0%) |
| $750,000 to $999,999 | 0 (0.0%) | 0 (0.0%) |
| $1,000,000 or more | 0 (0.0%) | 0 (0.0%) |
| Total | 778 (100.0%) | 658 (100.0%) |
Household Income by Mortgage Status in Tarentum borough
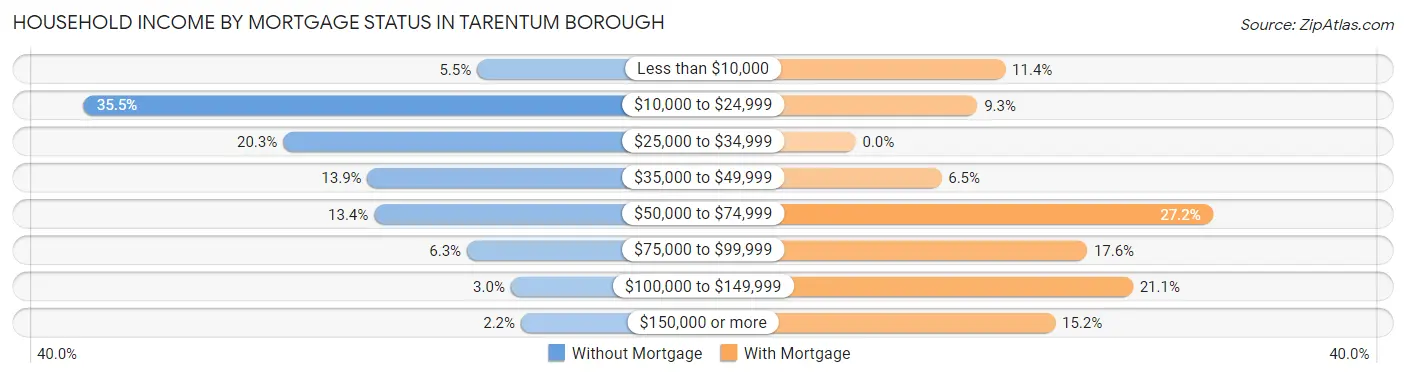
| Household Income | Without Mortgage | With Mortgage |
| Less than $10,000 | 43 (5.5%) | 75 (11.4%) |
| $10,000 to $24,999 | 276 (35.5%) | 61 (9.3%) |
| $25,000 to $34,999 | 158 (20.3%) | 0 (0.0%) |
| $35,000 to $49,999 | 108 (13.9%) | 43 (6.5%) |
| $50,000 to $74,999 | 104 (13.4%) | 179 (27.2%) |
| $75,000 to $99,999 | 49 (6.3%) | 116 (17.6%) |
| $100,000 to $149,999 | 23 (3.0%) | 139 (21.1%) |
| $150,000 or more | 17 (2.2%) | 100 (15.2%) |
| Total | 778 (100.0%) | 658 (100.0%) |
Property Value to Household Income Ratio in Tarentum borough
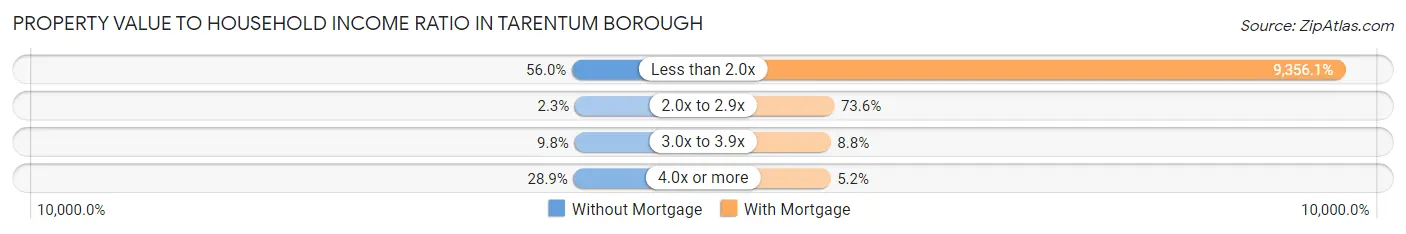
| Value-to-Income Ratio | Without Mortgage | With Mortgage |
| Less than 2.0x | 436 (56.0%) | 61,563 (9,356.1%) |
| 2.0x to 2.9x | 18 (2.3%) | 484 (73.6%) |
| 3.0x to 3.9x | 76 (9.8%) | 58 (8.8%) |
| 4.0x or more | 225 (28.9%) | 34 (5.2%) |
| Total | 778 (100.0%) | 658 (100.0%) |
Real Estate Taxes by Mortgage Status in Tarentum borough
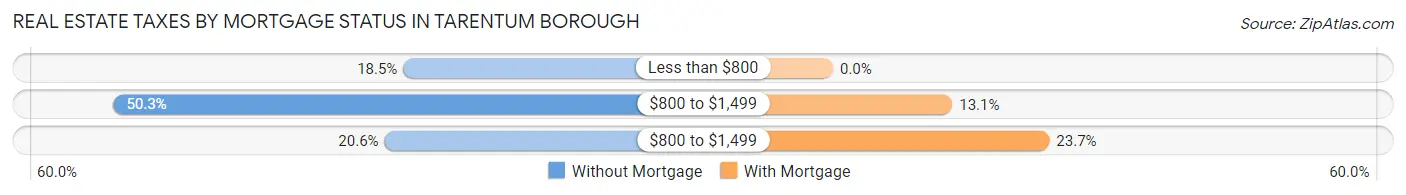
| Property Taxes | Without Mortgage | With Mortgage |
| Less than $800 | 144 (18.5%) | 0 (0.0%) |
| $800 to $1,499 | 391 (50.3%) | 86 (13.1%) |
| $800 to $1,499 | 160 (20.6%) | 156 (23.7%) |
| Total | 778 (100.0%) | 658 (100.0%) |
Health & Disability in Tarentum borough
Health Insurance Coverage by Age in Tarentum borough
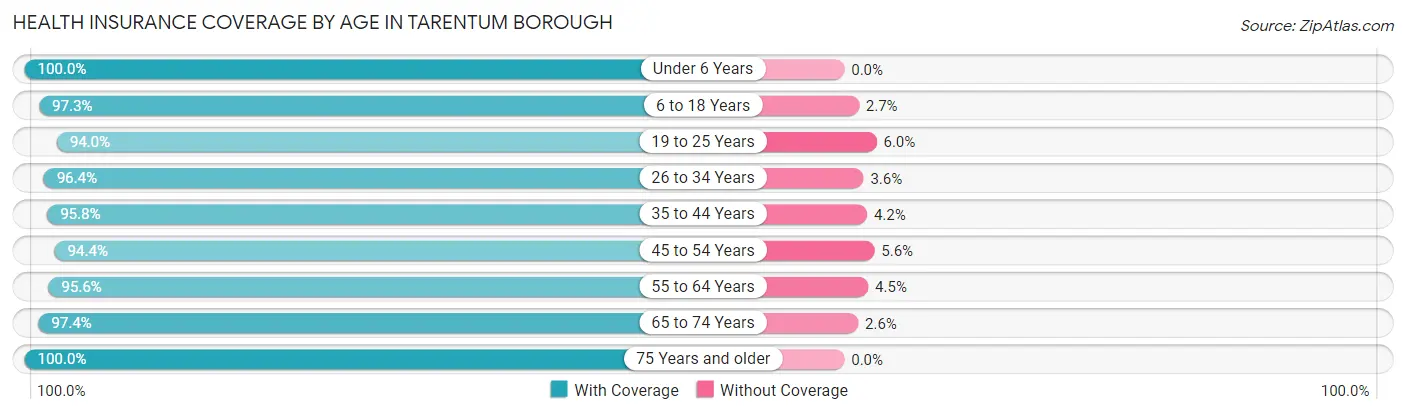
| Age Bracket | With Coverage | Without Coverage |
| Under 6 Years | 188 (100.0%) | 0 (0.0%) |
| 6 to 18 Years | 607 (97.3%) | 17 (2.7%) |
| 19 to 25 Years | 360 (94.0%) | 23 (6.0%) |
| 26 to 34 Years | 297 (96.4%) | 11 (3.6%) |
| 35 to 44 Years | 521 (95.8%) | 23 (4.2%) |
| 45 to 54 Years | 421 (94.4%) | 25 (5.6%) |
| 55 to 64 Years | 881 (95.6%) | 41 (4.4%) |
| 65 to 74 Years | 642 (97.4%) | 17 (2.6%) |
| 75 Years and older | 254 (100.0%) | 0 (0.0%) |
| Total | 4,171 (96.4%) | 157 (3.6%) |
Health Insurance Coverage by Citizenship Status in Tarentum borough
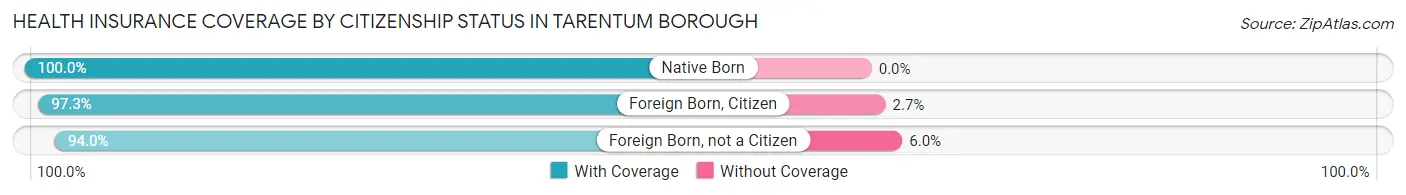
| Citizenship Status | With Coverage | Without Coverage |
| Native Born | 188 (100.0%) | 0 (0.0%) |
| Foreign Born, Citizen | 607 (97.3%) | 17 (2.7%) |
| Foreign Born, not a Citizen | 360 (94.0%) | 23 (6.0%) |
Health Insurance Coverage by Household Income in Tarentum borough
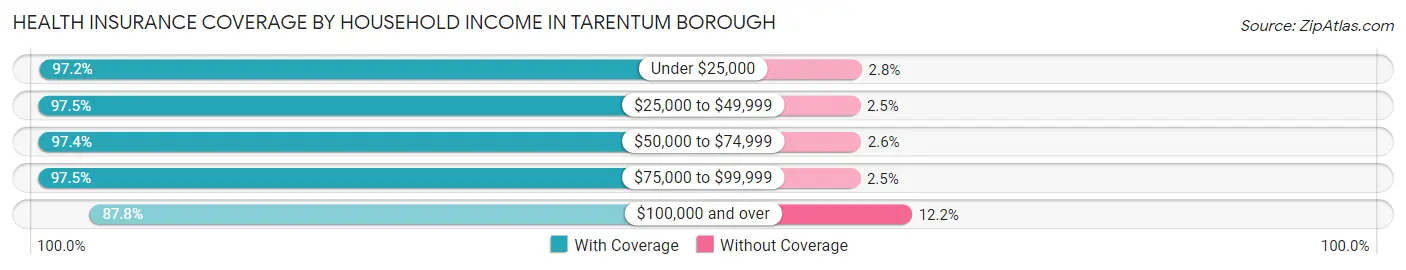
| Household Income | With Coverage | Without Coverage |
| Under $25,000 | 804 (97.2%) | 23 (2.8%) |
| $25,000 to $49,999 | 1,616 (97.5%) | 41 (2.5%) |
| $50,000 to $74,999 | 629 (97.4%) | 17 (2.6%) |
| $75,000 to $99,999 | 672 (97.5%) | 17 (2.5%) |
| $100,000 and over | 426 (87.8%) | 59 (12.2%) |
Public vs Private Health Insurance Coverage by Age in Tarentum borough
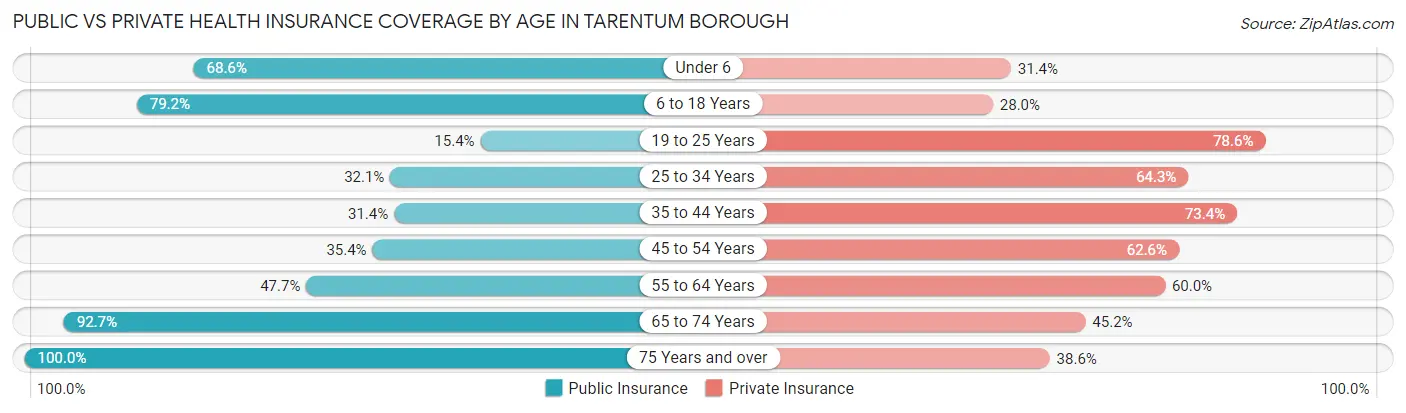
| Age Bracket | Public Insurance | Private Insurance |
| Under 6 | 129 (68.6%) | 59 (31.4%) |
| 6 to 18 Years | 494 (79.2%) | 175 (28.0%) |
| 19 to 25 Years | 59 (15.4%) | 301 (78.6%) |
| 25 to 34 Years | 99 (32.1%) | 198 (64.3%) |
| 35 to 44 Years | 171 (31.4%) | 399 (73.4%) |
| 45 to 54 Years | 158 (35.4%) | 279 (62.6%) |
| 55 to 64 Years | 440 (47.7%) | 553 (60.0%) |
| 65 to 74 Years | 611 (92.7%) | 298 (45.2%) |
| 75 Years and over | 254 (100.0%) | 98 (38.6%) |
| Total | 2,415 (55.8%) | 2,360 (54.5%) |
Disability Status by Sex by Age in Tarentum borough
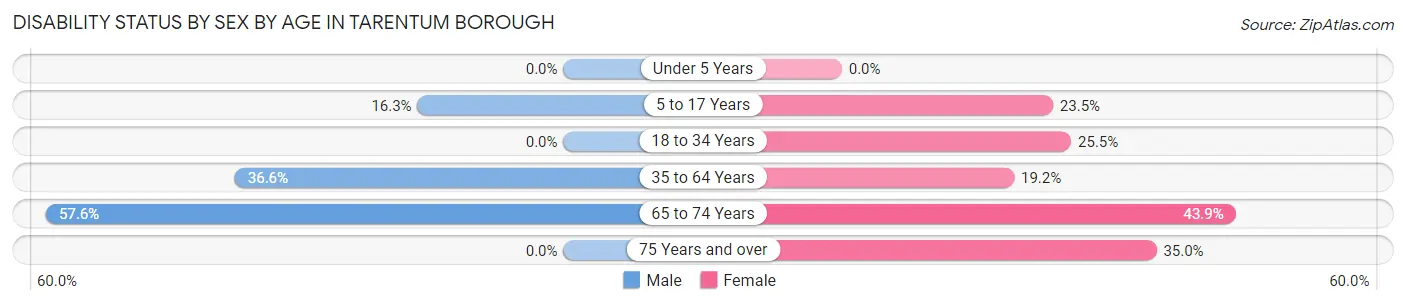
| Age Bracket | Male | Female |
| Under 5 Years | 0 (0.0%) | 0 (0.0%) |
| 5 to 17 Years | 59 (16.3%) | 63 (23.5%) |
| 18 to 34 Years | 0 (0.0%) | 71 (25.5%) |
| 35 to 64 Years | 379 (36.6%) | 168 (19.2%) |
| 65 to 74 Years | 155 (57.6%) | 171 (43.9%) |
| 75 Years and over | 0 (0.0%) | 89 (35.0%) |
Disability Class by Sex by Age in Tarentum borough
Disability Class: Hearing Difficulty
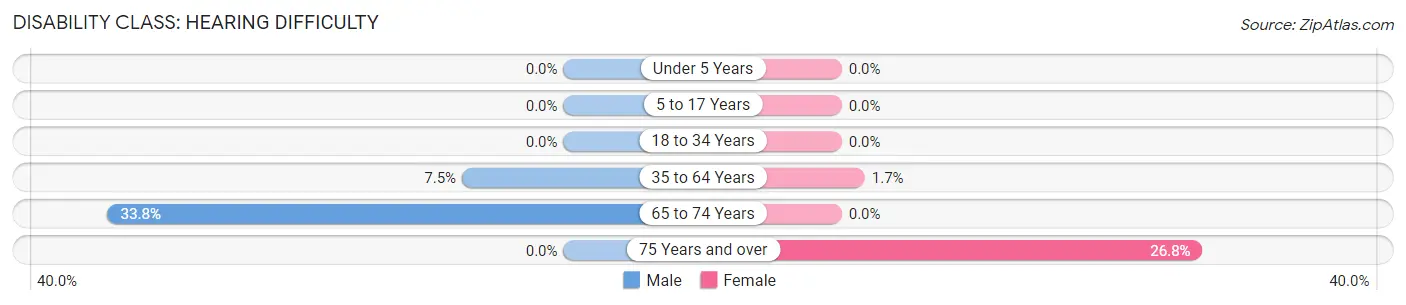
| Age Bracket | Male | Female |
| Under 5 Years | 0 (0.0%) | 0 (0.0%) |
| 5 to 17 Years | 0 (0.0%) | 0 (0.0%) |
| 18 to 34 Years | 0 (0.0%) | 0 (0.0%) |
| 35 to 64 Years | 78 (7.5%) | 15 (1.7%) |
| 65 to 74 Years | 91 (33.8%) | 0 (0.0%) |
| 75 Years and over | 0 (0.0%) | 68 (26.8%) |
Disability Class: Vision Difficulty
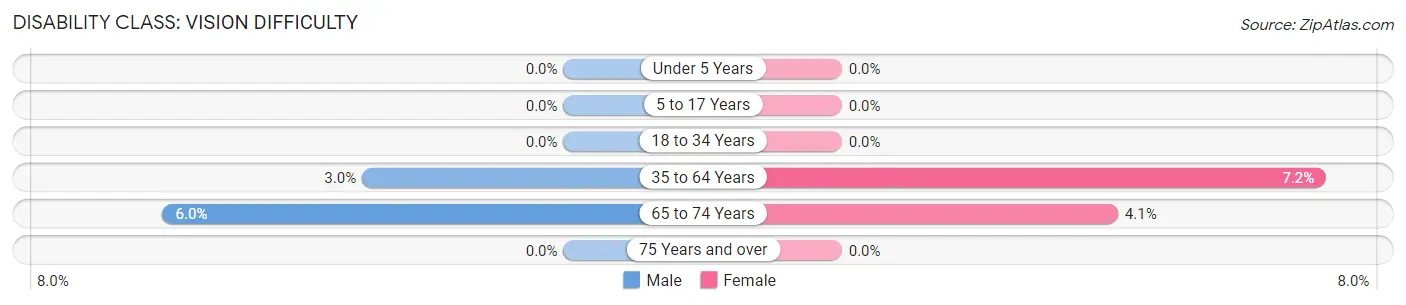
| Age Bracket | Male | Female |
| Under 5 Years | 0 (0.0%) | 0 (0.0%) |
| 5 to 17 Years | 0 (0.0%) | 0 (0.0%) |
| 18 to 34 Years | 0 (0.0%) | 0 (0.0%) |
| 35 to 64 Years | 31 (3.0%) | 63 (7.2%) |
| 65 to 74 Years | 16 (5.9%) | 16 (4.1%) |
| 75 Years and over | 0 (0.0%) | 0 (0.0%) |
Disability Class: Cognitive Difficulty
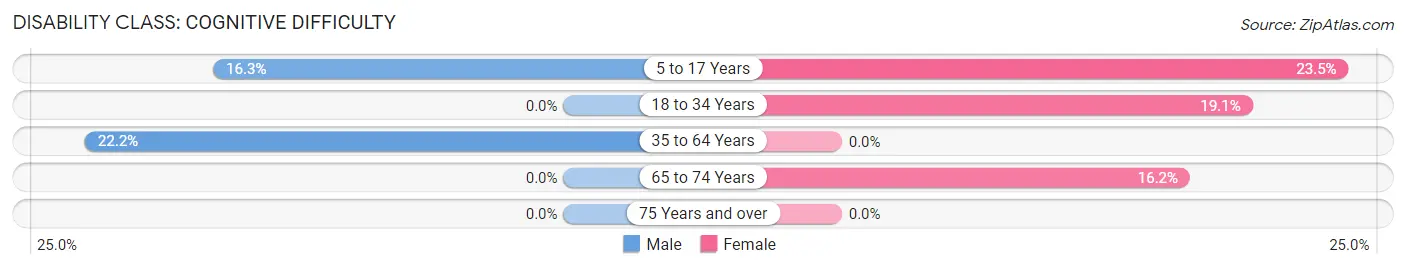
| Age Bracket | Male | Female |
| 5 to 17 Years | 59 (16.3%) | 63 (23.5%) |
| 18 to 34 Years | 0 (0.0%) | 53 (19.1%) |
| 35 to 64 Years | 230 (22.2%) | 0 (0.0%) |
| 65 to 74 Years | 0 (0.0%) | 63 (16.2%) |
| 75 Years and over | 0 (0.0%) | 0 (0.0%) |
Disability Class: Ambulatory Difficulty
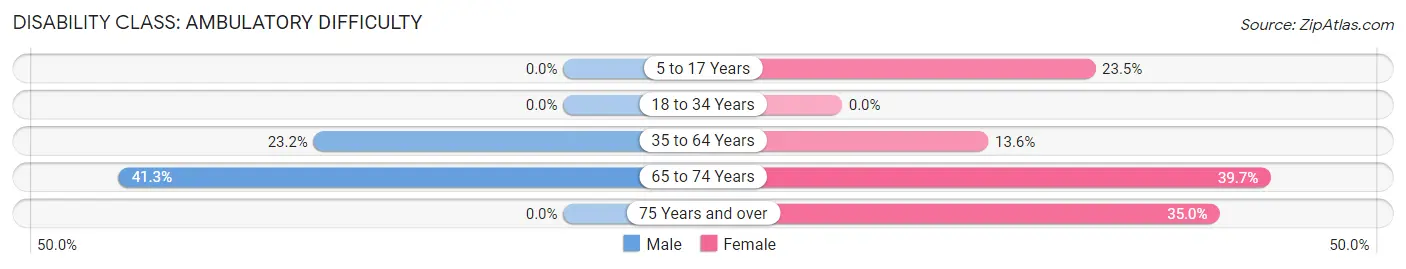
| Age Bracket | Male | Female |
| 5 to 17 Years | 0 (0.0%) | 63 (23.5%) |
| 18 to 34 Years | 0 (0.0%) | 0 (0.0%) |
| 35 to 64 Years | 240 (23.2%) | 119 (13.6%) |
| 65 to 74 Years | 111 (41.3%) | 155 (39.7%) |
| 75 Years and over | 0 (0.0%) | 89 (35.0%) |
Disability Class: Self-Care Difficulty
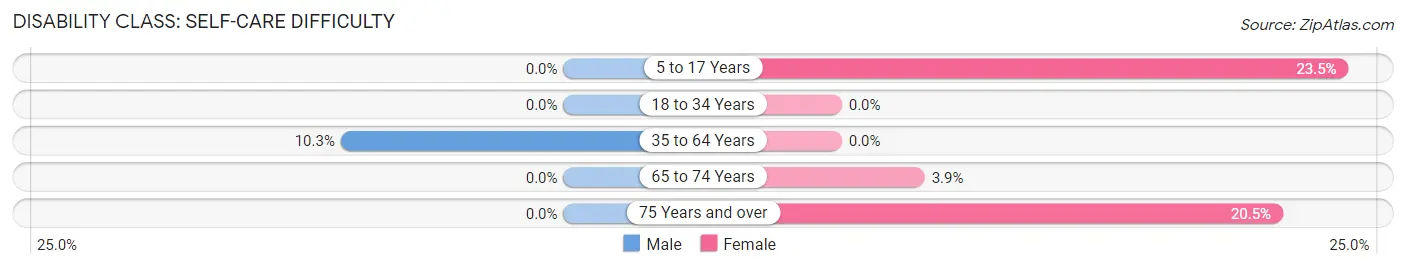
| Age Bracket | Male | Female |
| 5 to 17 Years | 0 (0.0%) | 63 (23.5%) |
| 18 to 34 Years | 0 (0.0%) | 0 (0.0%) |
| 35 to 64 Years | 107 (10.3%) | 0 (0.0%) |
| 65 to 74 Years | 0 (0.0%) | 15 (3.8%) |
| 75 Years and over | 0 (0.0%) | 52 (20.5%) |
Technology Access in Tarentum borough
Computing Device Access in Tarentum borough
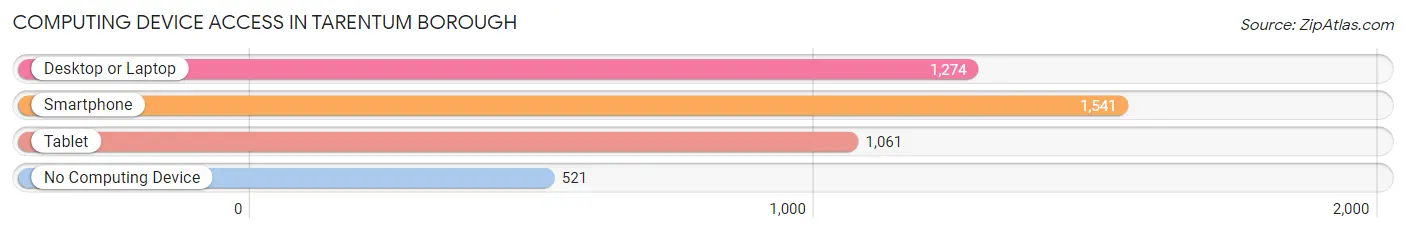
| Device Type | # Households | % Households |
| Desktop or Laptop | 1,274 | 58.2% |
| Smartphone | 1,541 | 70.4% |
| Tablet | 1,061 | 48.5% |
| No Computing Device | 521 | 23.8% |
| Total | 2,188 | 100.0% |
Internet Access in Tarentum borough
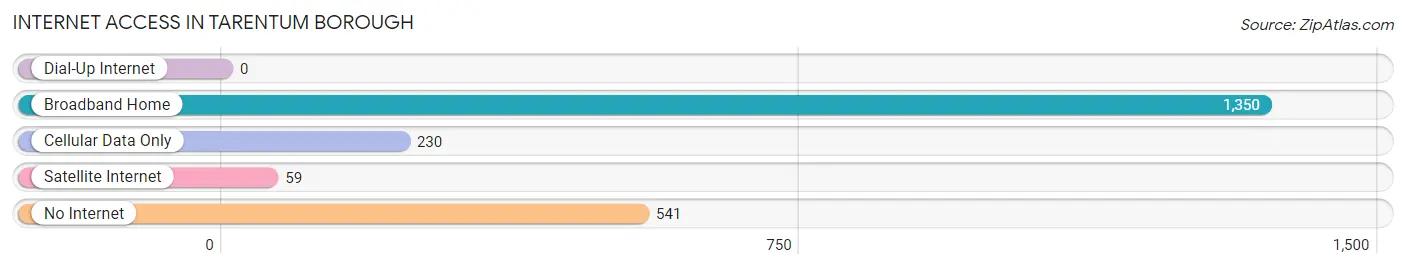
| Internet Type | # Households | % Households |
| Dial-Up Internet | 0 | 0.0% |
| Broadband Home | 1,350 | 61.7% |
| Cellular Data Only | 230 | 10.5% |
| Satellite Internet | 59 | 2.7% |
| No Internet | 541 | 24.7% |
| Total | 2,188 | 100.0% |
Tarentum borough Summary
Tarentum Borough is a small borough located in Allegheny County, Pennsylvania. It is situated along the Allegheny River, just north of the city of Pittsburgh. The borough has a population of approximately 4,000 people and covers an area of 1.2 square miles.
History
Tarentum was first settled in 1796 by a group of settlers from the nearby town of Freeport. The town was named after the ancient Greek city of Tarentum, which was located in the region of Apulia in southern Italy. The settlers were attracted to the area due to its proximity to the Allegheny River, which provided a means of transportation and access to markets.
The town was officially incorporated in 1845 and was initially a farming community. In the late 19th century, the town began to industrialize and the population began to grow. The town was home to several glass factories, a steel mill, and a paper mill. The town also had a thriving business district, which included several stores, banks, and a post office.
In the early 20th century, the town began to decline as the steel and glass industries moved away. The population began to decline as well, and by the 1950s, the town had become a virtual ghost town. In the late 20th century, the town began to experience a resurgence as new businesses moved into the area and the population began to grow again.
Geography
Tarentum is located in Allegheny County, Pennsylvania, along the Allegheny River. The borough covers an area of 1.2 square miles and is bordered by the towns of Brackenridge, East Deer, and Fawn. The borough is located approximately 15 miles north of the city of Pittsburgh.
The terrain of the borough is mostly flat, with some rolling hills in the northern part of the borough. The borough is located in a humid continental climate zone, with hot summers and cold winters. The average annual temperature is around 50 degrees Fahrenheit.
Economy
The economy of Tarentum is largely based on the service industry. The borough is home to several restaurants, bars, and retail stores. The borough also has a few manufacturing companies, including a steel mill and a paper mill.
The borough also has a thriving tourism industry, with several attractions, including the Allegheny River, the Tarentum Bridge, and the Tarentum Historical Society.
Demographics
As of the 2010 census, the population of Tarentum was 4,097. The racial makeup of the borough was 94.3% White, 2.3% African American, 0.3% Native American, 0.7% Asian, and 2.4% from other races. Hispanic or Latino of any race were 1.3% of the population.
The median household income in Tarentum was $37,917, and the median family income was $45,938. The per capita income was $19,945. About 11.3% of families and 14.2% of the population were below the poverty line, including 22.2% of those under age 18 and 8.2% of those age 65 or over.
Common Questions
What is Per Capita Income in Tarentum borough?
Per Capita income in Tarentum borough is $25,311.
What is the Median Family Income in Tarentum borough?
Median Family Income in Tarentum borough is $55,994.
What is the Median Household income in Tarentum borough?
Median Household Income in Tarentum borough is $41,466.
What is Income or Wage Gap in Tarentum borough?
Income or Wage Gap in Tarentum borough is 15.5%.
Women in Tarentum borough earn 84.5 cents for every dollar earned by a man.
What is Inequality or Gini Index in Tarentum borough?
Inequality or Gini Index in Tarentum borough is 0.38.
What is the Total Population of Tarentum borough?
Total Population of Tarentum borough is 4,328.
What is the Total Male Population of Tarentum borough?
Total Male Population of Tarentum borough is 2,122.
What is the Total Female Population of Tarentum borough?
Total Female Population of Tarentum borough is 2,206.
What is the Ratio of Males per 100 Females in Tarentum borough?
There are 96.19 Males per 100 Females in Tarentum borough.
What is the Ratio of Females per 100 Males in Tarentum borough?
There are 103.96 Females per 100 Males in Tarentum borough.
What is the Median Population Age in Tarentum borough?
Median Population Age in Tarentum borough is 48.2 Years.
What is the Average Family Size in Tarentum borough
Average Family Size in Tarentum borough is 3.0 People.
What is the Average Household Size in Tarentum borough
Average Household Size in Tarentum borough is 2.0 People.
How Large is the Labor Force in Tarentum borough?
There are 2,051 People in the Labor Forcein in Tarentum borough.
What is the Percentage of People in the Labor Force in Tarentum borough?
55.4% of People are in the Labor Force in Tarentum borough.
What is the Unemployment Rate in Tarentum borough?
Unemployment Rate in Tarentum borough is 6.2%.