Lakemont, PA Map & Demographics
Lakemont Map
Lakemont Overview
$32,664
PER CAPITA INCOME
$64,758
AVG FAMILY INCOME
$46,840
AVG HOUSEHOLD INCOME
8.0%
WAGE / INCOME GAP [ % ]
92.0¢/ $1
WAGE / INCOME GAP [ $ ]
0.46
INEQUALITY / GINI INDEX
1,511
TOTAL POPULATION
623
MALE POPULATION
888
FEMALE POPULATION
70.16
MALES / 100 FEMALES
142.54
FEMALES / 100 MALES
56.3
MEDIAN AGE
2.6
AVG FAMILY SIZE
1.8
AVG HOUSEHOLD SIZE
746
LABOR FORCE [ PEOPLE ]
55.7%
PERCENT IN LABOR FORCE
5.7%
UNEMPLOYMENT RATE
Income in Lakemont
Income Overview in Lakemont
Per Capita Income in Lakemont is $32,664, while median incomes of families and households are $64,758 and $46,840 respectively.
| Characteristic | Number | Measure |
| Per Capita Income | 1,511 | $32,664 |
| Median Family Income | 370 | $64,758 |
| Mean Family Income | 370 | $89,303 |
| Median Household Income | 780 | $46,840 |
| Mean Household Income | 780 | $61,045 |
| Income Deficit | 370 | $0 |
| Wage / Income Gap (%) | 1,511 | 7.95% |
| Wage / Income Gap ($) | 1,511 | 92.05¢ per $1 |
| Gini / Inequality Index | 1,511 | 0.46 |
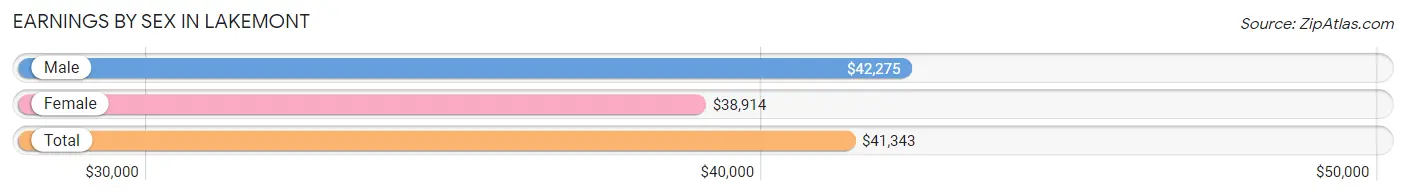
Earnings by Sex in Lakemont
Average Earnings in Lakemont are $41,343, $42,275 for men and $38,914 for women, a difference of 8.0%.
| Sex | Number | Average Earnings |
| Male | 407 (53.4%) | $42,275 |
| Female | 355 (46.6%) | $38,914 |
| Total | 762 (100.0%) | $41,343 |
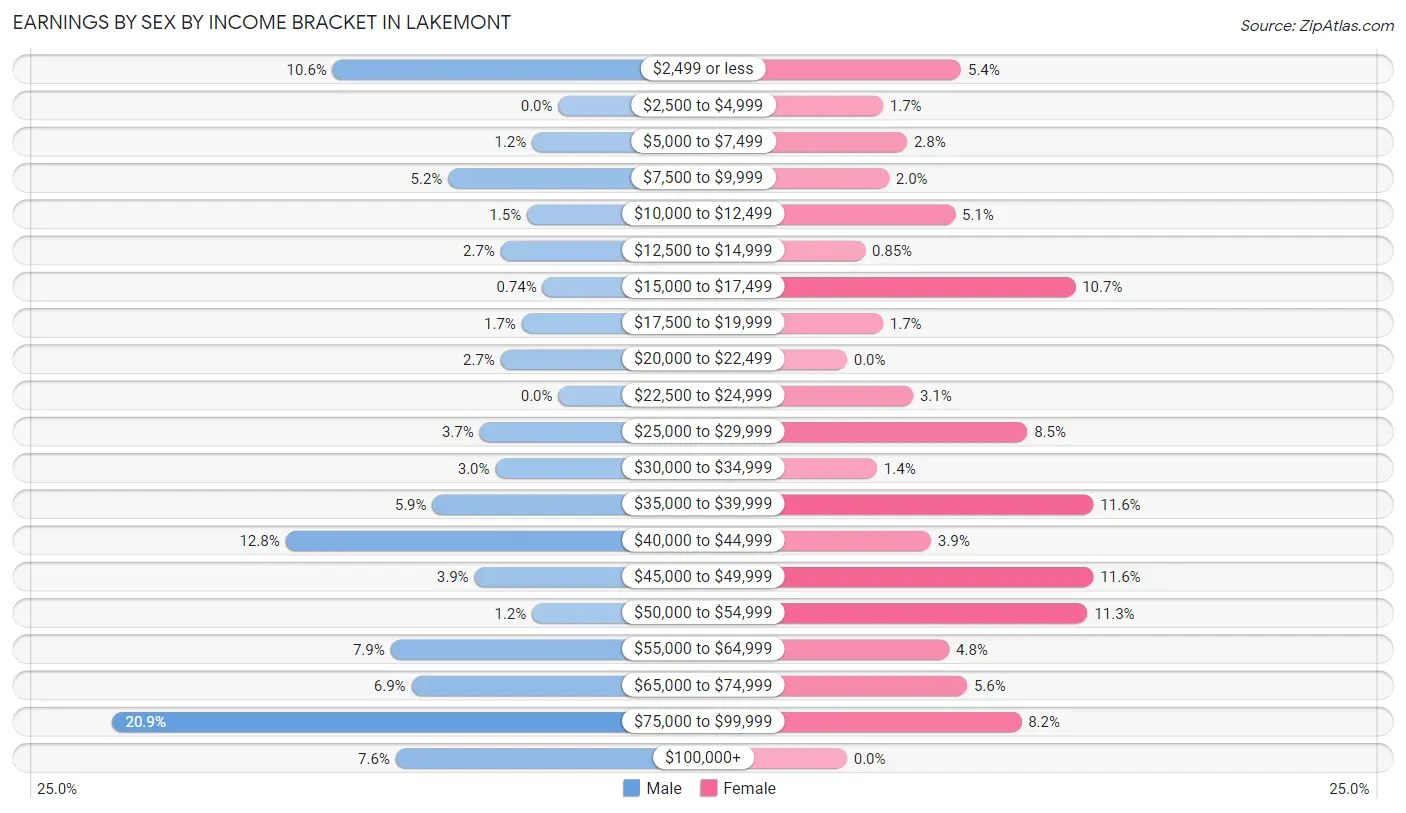
Earnings by Sex by Income Bracket in Lakemont
The most common earnings brackets in Lakemont are $75,000 to $99,999 for men (85 | 20.9%) and $35,000 to $39,999 for women (41 | 11.6%).
| Income | Male | Female |
| $2,499 or less | 43 (10.6%) | 19 (5.3%) |
| $2,500 to $4,999 | 0 (0.0%) | 6 (1.7%) |
| $5,000 to $7,499 | 5 (1.2%) | 10 (2.8%) |
| $7,500 to $9,999 | 21 (5.2%) | 7 (2.0%) |
| $10,000 to $12,499 | 6 (1.5%) | 18 (5.1%) |
| $12,500 to $14,999 | 11 (2.7%) | 3 (0.9%) |
| $15,000 to $17,499 | 3 (0.7%) | 38 (10.7%) |
| $17,500 to $19,999 | 7 (1.7%) | 6 (1.7%) |
| $20,000 to $22,499 | 11 (2.7%) | 0 (0.0%) |
| $22,500 to $24,999 | 0 (0.0%) | 11 (3.1%) |
| $25,000 to $29,999 | 15 (3.7%) | 30 (8.5%) |
| $30,000 to $34,999 | 12 (2.9%) | 5 (1.4%) |
| $35,000 to $39,999 | 24 (5.9%) | 41 (11.6%) |
| $40,000 to $44,999 | 52 (12.8%) | 14 (3.9%) |
| $45,000 to $49,999 | 16 (3.9%) | 41 (11.6%) |
| $50,000 to $54,999 | 5 (1.2%) | 40 (11.3%) |
| $55,000 to $64,999 | 32 (7.9%) | 17 (4.8%) |
| $65,000 to $74,999 | 28 (6.9%) | 20 (5.6%) |
| $75,000 to $99,999 | 85 (20.9%) | 29 (8.2%) |
| $100,000+ | 31 (7.6%) | 0 (0.0%) |
| Total | 407 (100.0%) | 355 (100.0%) |
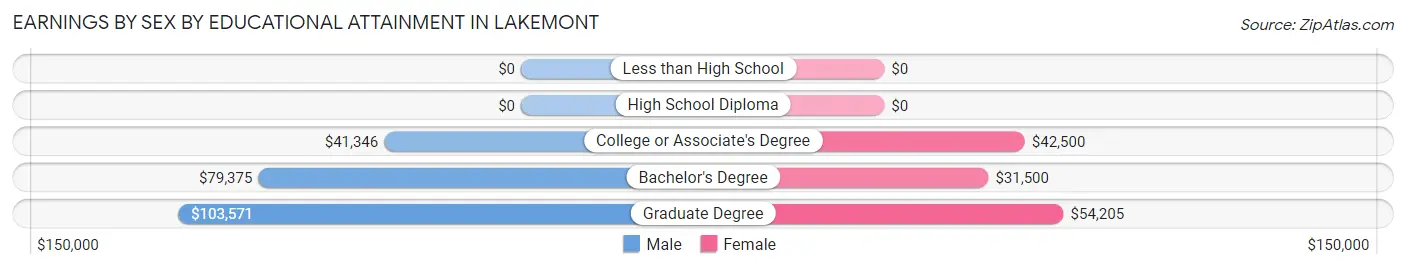
Earnings by Sex by Educational Attainment in Lakemont
Average earnings in Lakemont are $45,234 for men and $39,901 for women, a difference of 11.8%. Men with an educational attainment of graduate degree enjoy the highest average annual earnings of $103,571, while those with college or associate's degree education earn the least with $41,346. Women with an educational attainment of graduate degree earn the most with the average annual earnings of $54,205, while those with bachelor's degree education have the smallest earnings of $31,500.
| Educational Attainment | Male Income | Female Income |
| Less than High School | - | - |
| High School Diploma | - | - |
| College or Associate's Degree | $41,346 | $42,500 |
| Bachelor's Degree | $79,375 | $31,500 |
| Graduate Degree | $103,571 | $54,205 |
| Total | $45,234 | $39,901 |
Family Income in Lakemont
Family Income Brackets in Lakemont
According to the Lakemont family income data, there are 106 families falling into the $50,000 to $74,999 income range, which is the most common income bracket and makes up 28.6% of all families.
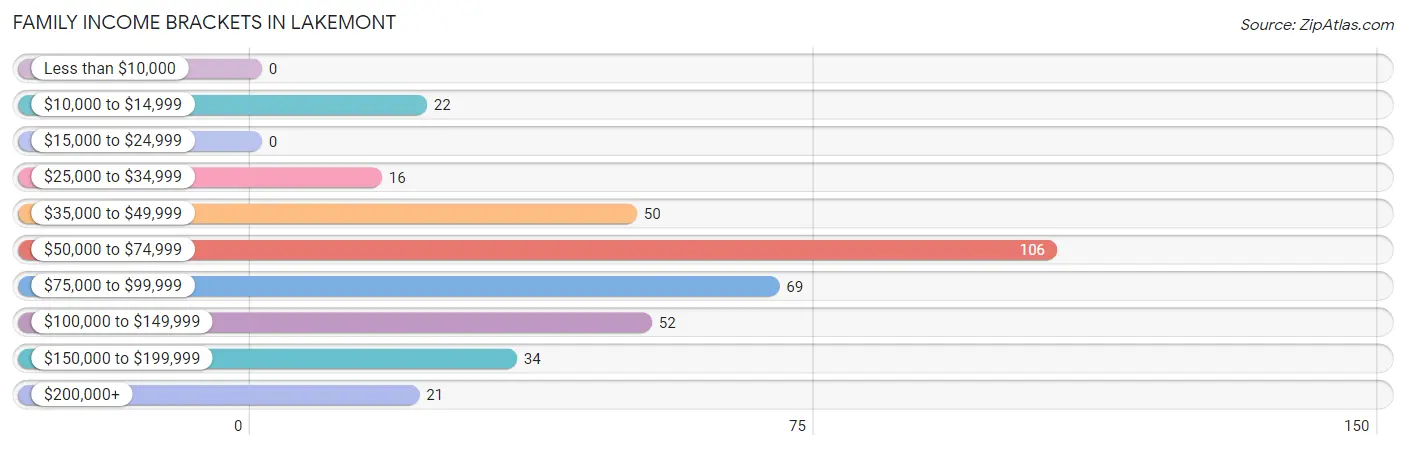
| Income Bracket | # Families | % Families |
| Less than $10,000 | 0 | 0.0% |
| $10,000 to $14,999 | 22 | 5.9% |
| $15,000 to $24,999 | 0 | 0.0% |
| $25,000 to $34,999 | 16 | 4.3% |
| $35,000 to $49,999 | 50 | 13.5% |
| $50,000 to $74,999 | 106 | 28.6% |
| $75,000 to $99,999 | 69 | 18.6% |
| $100,000 to $149,999 | 52 | 14.1% |
| $150,000 to $199,999 | 34 | 9.2% |
| $200,000+ | 21 | 5.7% |
Family Income by Famaliy Size in Lakemont
5-person families (18 | 4.9%) account for the highest median family income in Lakemont with $128,125 per family, while 2-person families (221 | 59.7%) have the highest median income of $31,270 per family member.
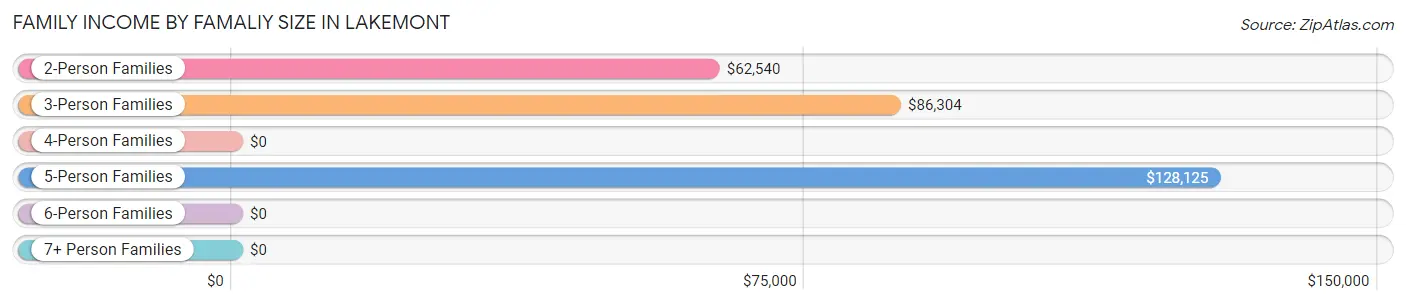
| Income Bracket | # Families | Median Income |
| 2-Person Families | 221 (59.7%) | $62,540 |
| 3-Person Families | 88 (23.8%) | $86,304 |
| 4-Person Families | 40 (10.8%) | $0 |
| 5-Person Families | 18 (4.9%) | $128,125 |
| 6-Person Families | 3 (0.8%) | $0 |
| 7+ Person Families | 0 (0.0%) | $0 |
| Total | 370 (100.0%) | $64,758 |
Family Income by Number of Earners in Lakemont
The median family income in Lakemont is $64,758, with families comprising 3+ earners (50) having the highest median family income of $183,333, while families with no earners (67) have the lowest median family income of $55,750, accounting for 13.5% and 18.1% of families, respectively.
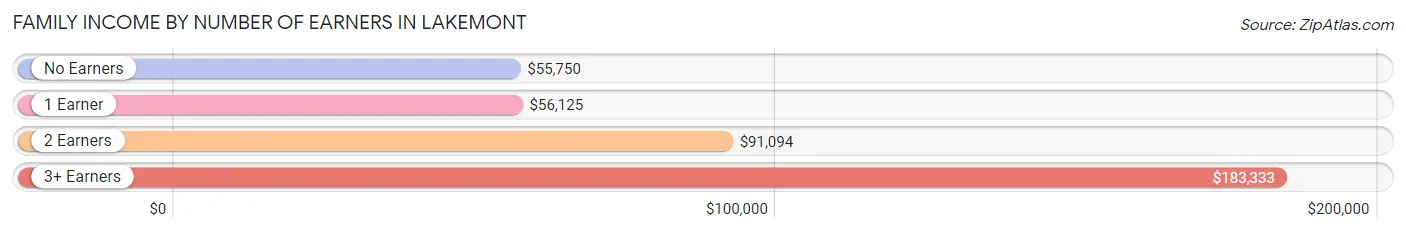
| Number of Earners | # Families | Median Income |
| No Earners | 67 (18.1%) | $55,750 |
| 1 Earner | 118 (31.9%) | $56,125 |
| 2 Earners | 135 (36.5%) | $91,094 |
| 3+ Earners | 50 (13.5%) | $183,333 |
| Total | 370 (100.0%) | $64,758 |
Household Income in Lakemont
Household Income Brackets in Lakemont
With 147 households falling in the category, the $35,000 to $49,999 income range is the most frequent in Lakemont, accounting for 18.9% of all households. In contrast, only 21 households (2.7%) fall into the $200,000+ income bracket, making it the least populous group.
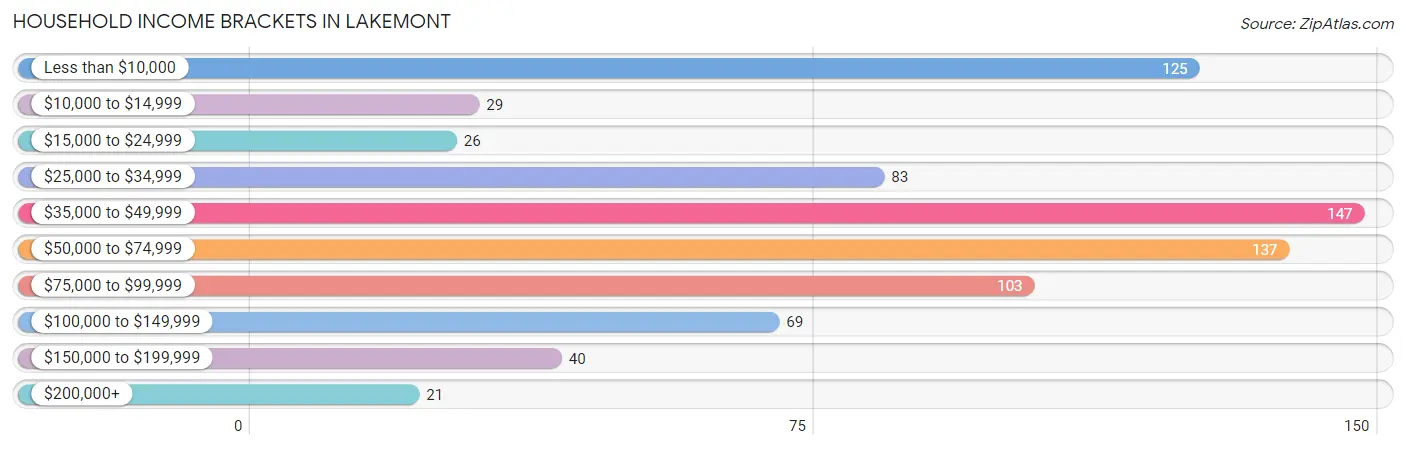
| Income Bracket | # Households | % Households |
| Less than $10,000 | 125 | 16.0% |
| $10,000 to $14,999 | 29 | 3.7% |
| $15,000 to $24,999 | 26 | 3.3% |
| $25,000 to $34,999 | 83 | 10.6% |
| $35,000 to $49,999 | 147 | 18.8% |
| $50,000 to $74,999 | 137 | 17.6% |
| $75,000 to $99,999 | 103 | 13.2% |
| $100,000 to $149,999 | 69 | 8.8% |
| $150,000 to $199,999 | 40 | 5.1% |
| $200,000+ | 21 | 2.7% |
Household Income by Householder Age in Lakemont
The median household income in Lakemont is $46,840, with the highest median household income of $77,083 found in the 25 to 44 years age bracket for the primary householder. A total of 125 households (16.0%) fall into this category.
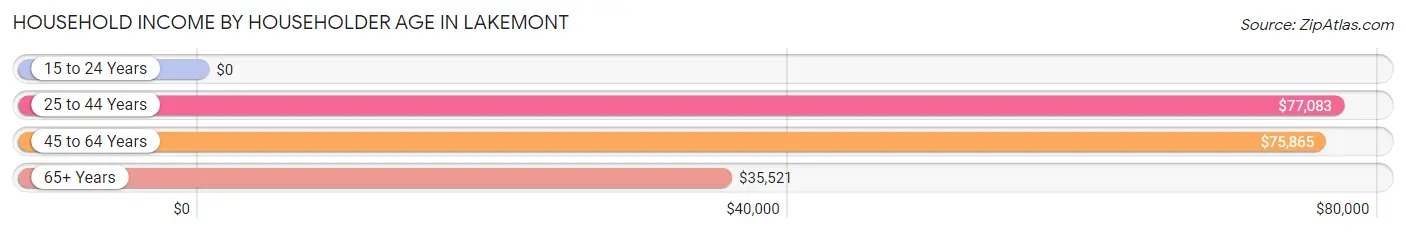
| Income Bracket | # Households | Median Income |
| 15 to 24 Years | 0 (0.0%) | $0 |
| 25 to 44 Years | 125 (16.0%) | $77,083 |
| 45 to 64 Years | 281 (36.0%) | $75,865 |
| 65+ Years | 374 (47.9%) | $35,521 |
| Total | 780 (100.0%) | $46,840 |
Poverty in Lakemont
Income Below Poverty by Sex and Age in Lakemont
With 7.5% poverty level for males and 20.8% for females among the residents of Lakemont, 5 year old males and 75 year old and over females are the most vulnerable to poverty, with 18 males (100.0%) and 97 females (52.4%) in their respective age groups living below the poverty level.
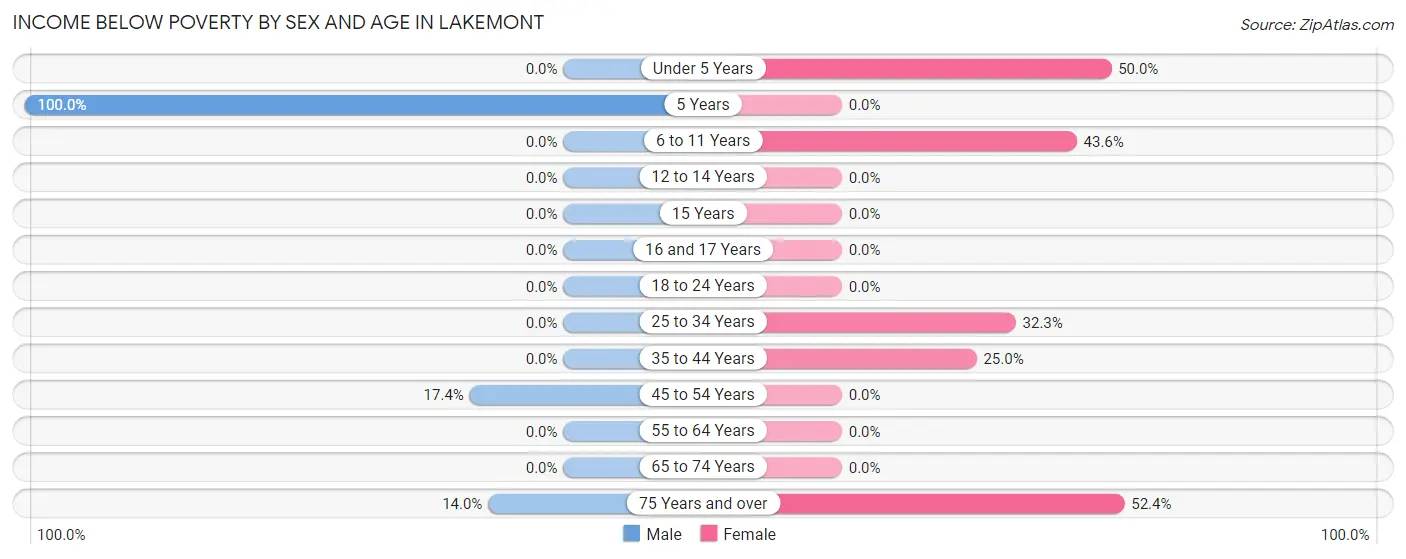
| Age Bracket | Male | Female |
| Under 5 Years | 0 (0.0%) | 8 (50.0%) |
| 5 Years | 18 (100.0%) | 0 (0.0%) |
| 6 to 11 Years | 0 (0.0%) | 34 (43.6%) |
| 12 to 14 Years | 0 (0.0%) | 0 (0.0%) |
| 15 Years | 0 (0.0%) | 0 (0.0%) |
| 16 and 17 Years | 0 (0.0%) | 0 (0.0%) |
| 18 to 24 Years | 0 (0.0%) | 0 (0.0%) |
| 25 to 34 Years | 0 (0.0%) | 10 (32.3%) |
| 35 to 44 Years | 0 (0.0%) | 19 (25.0%) |
| 45 to 54 Years | 16 (17.4%) | 0 (0.0%) |
| 55 to 64 Years | 0 (0.0%) | 0 (0.0%) |
| 65 to 74 Years | 0 (0.0%) | 0 (0.0%) |
| 75 Years and over | 12 (14.0%) | 97 (52.4%) |
| Total | 46 (7.5%) | 168 (20.8%) |
Income Above Poverty by Sex and Age in Lakemont
According to the poverty statistics in Lakemont, males aged under 5 years and females aged 12 to 14 years are the age groups that are most secure financially, with 100.0% of males and 100.0% of females in these age groups living above the poverty line.
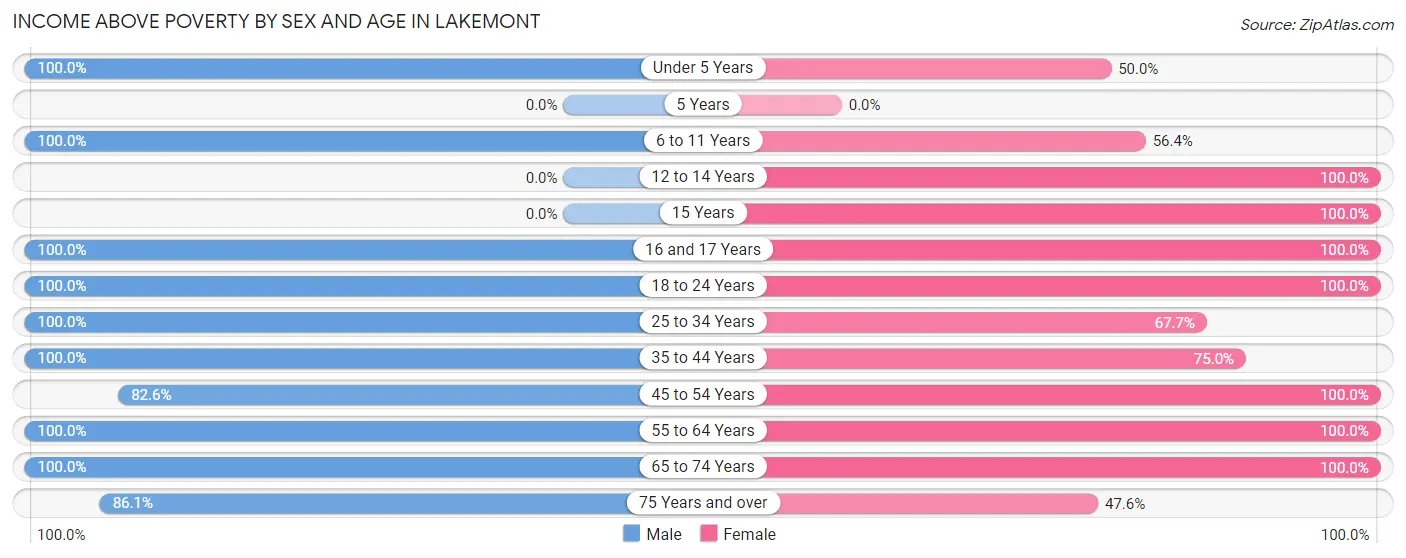
| Age Bracket | Male | Female |
| Under 5 Years | 15 (100.0%) | 8 (50.0%) |
| 5 Years | 0 (0.0%) | 0 (0.0%) |
| 6 to 11 Years | 18 (100.0%) | 44 (56.4%) |
| 12 to 14 Years | 0 (0.0%) | 16 (100.0%) |
| 15 Years | 0 (0.0%) | 11 (100.0%) |
| 16 and 17 Years | 10 (100.0%) | 25 (100.0%) |
| 18 to 24 Years | 16 (100.0%) | 23 (100.0%) |
| 25 to 34 Years | 101 (100.0%) | 21 (67.7%) |
| 35 to 44 Years | 56 (100.0%) | 57 (75.0%) |
| 45 to 54 Years | 76 (82.6%) | 110 (100.0%) |
| 55 to 64 Years | 108 (100.0%) | 110 (100.0%) |
| 65 to 74 Years | 97 (100.0%) | 125 (100.0%) |
| 75 Years and over | 74 (86.1%) | 88 (47.6%) |
| Total | 571 (92.5%) | 638 (79.2%) |
Income Below Poverty Among Married-Couple Families in Lakemont
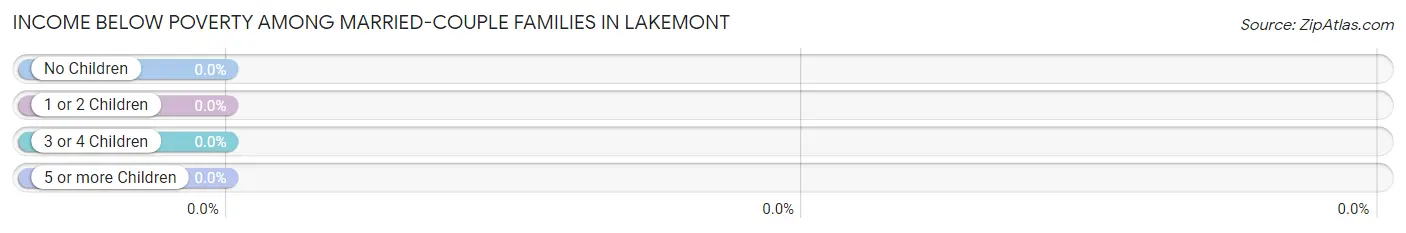
| Children | Above Poverty | Below Poverty |
| No Children | 212 (100.0%) | 0 (0.0%) |
| 1 or 2 Children | 57 (100.0%) | 0 (0.0%) |
| 3 or 4 Children | 8 (100.0%) | 0 (0.0%) |
| 5 or more Children | 0 (0.0%) | 0 (0.0%) |
| Total | 277 (100.0%) | 0 (0.0%) |
Income Below Poverty Among Single-Parent Households in Lakemont
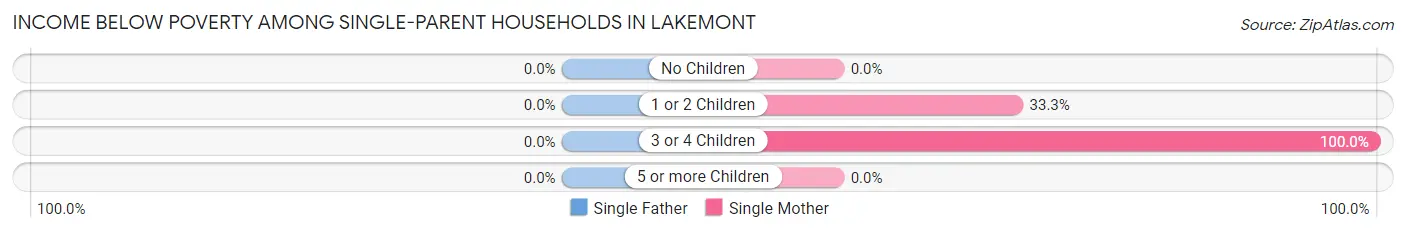
| Children | Single Father | Single Mother |
| No Children | 0 (0.0%) | 0 (0.0%) |
| 1 or 2 Children | 0 (0.0%) | 3 (33.3%) |
| 3 or 4 Children | 0 (0.0%) | 19 (100.0%) |
| 5 or more Children | 0 (0.0%) | 0 (0.0%) |
| Total | 0 (0.0%) | 22 (32.8%) |
Income Below Poverty Among Married-Couple vs Single-Parent Households in Lakemont
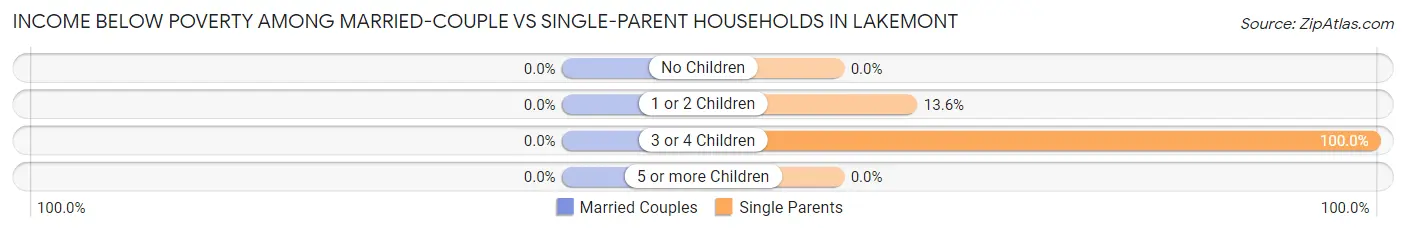
| Children | Married-Couple Families | Single-Parent Households |
| No Children | 0 (0.0%) | 0 (0.0%) |
| 1 or 2 Children | 0 (0.0%) | 3 (13.6%) |
| 3 or 4 Children | 0 (0.0%) | 19 (100.0%) |
| 5 or more Children | 0 (0.0%) | 0 (0.0%) |
| Total | 0 (0.0%) | 22 (23.7%) |
Race in Lakemont
The most populous races in Lakemont are White / Caucasian (1,509 | 99.9%), Hispanic or Latino (20 | 1.3%), and Black / African American (2 | 0.1%).
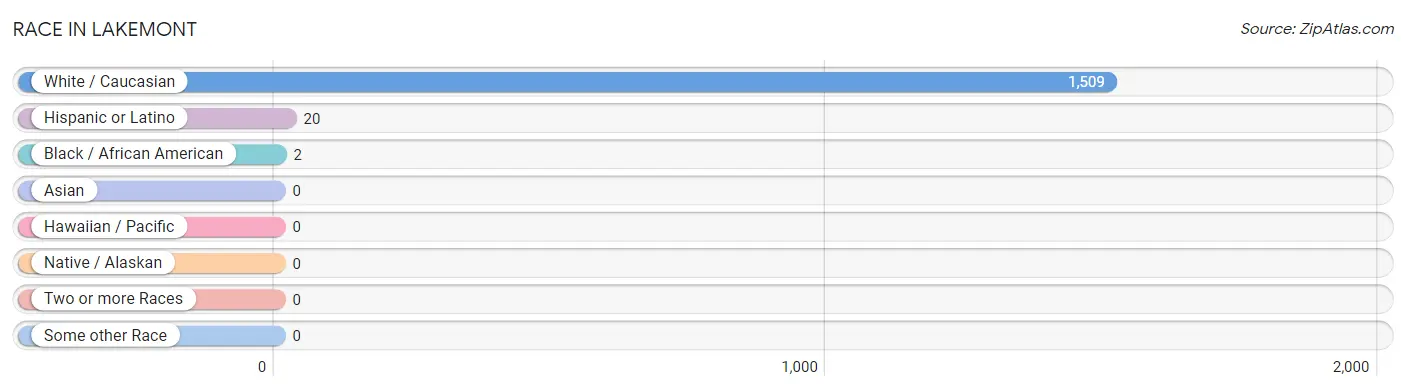
| Race | # Population | % Population |
| Asian | 0 | 0.0% |
| Black / African American | 2 | 0.1% |
| Hawaiian / Pacific | 0 | 0.0% |
| Hispanic or Latino | 20 | 1.3% |
| Native / Alaskan | 0 | 0.0% |
| White / Caucasian | 1,509 | 99.9% |
| Two or more Races | 0 | 0.0% |
| Some other Race | 0 | 0.0% |
| Total | 1,511 | 100.0% |
Ancestry in Lakemont
The most populous ancestries reported in Lakemont are German (620 | 41.0%), Irish (254 | 16.8%), Italian (175 | 11.6%), English (135 | 8.9%), and American (128 | 8.5%), together accounting for 86.8% of all Lakemont residents.
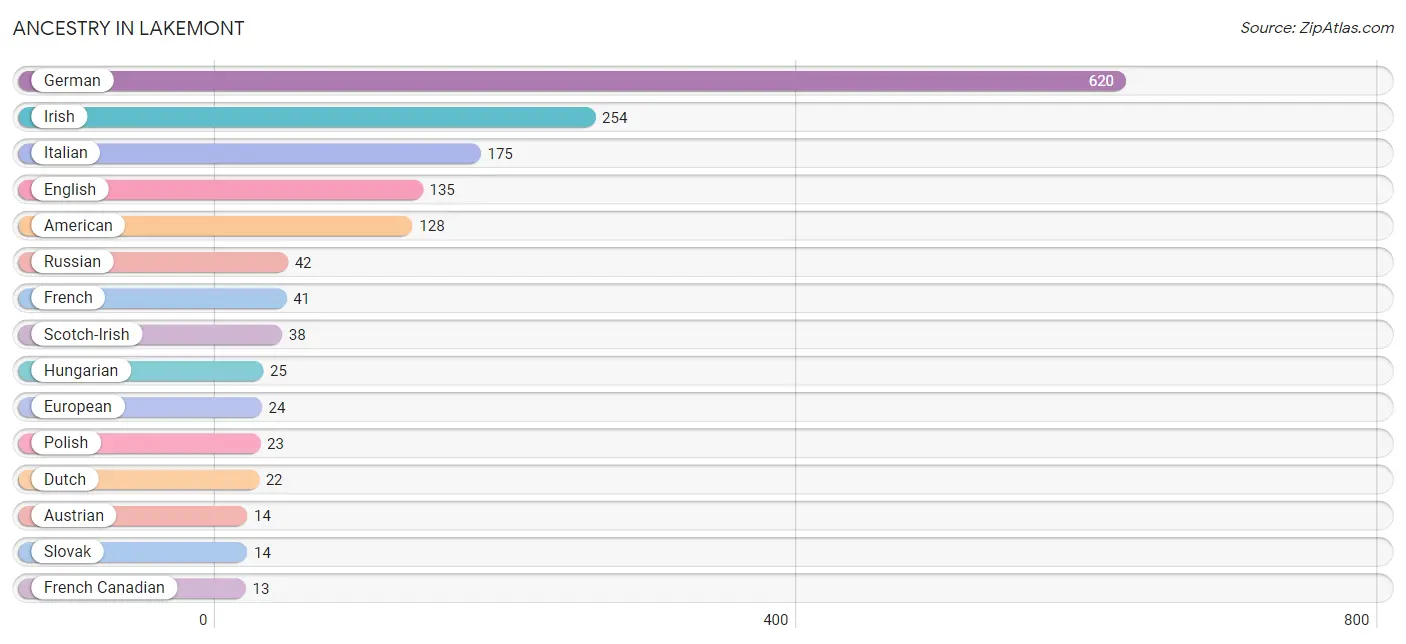
| Ancestry | # Population | % Population |
| American | 128 | 8.5% |
| Austrian | 14 | 0.9% |
| Croatian | 5 | 0.3% |
| Czech | 4 | 0.3% |
| Dutch | 22 | 1.5% |
| English | 135 | 8.9% |
| European | 24 | 1.6% |
| French | 41 | 2.7% |
| French Canadian | 13 | 0.9% |
| German | 620 | 41.0% |
| Hungarian | 25 | 1.7% |
| Irish | 254 | 16.8% |
| Italian | 175 | 11.6% |
| Mexican | 9 | 0.6% |
| Northern European | 11 | 0.7% |
| Pennsylvania German | 12 | 0.8% |
| Polish | 23 | 1.5% |
| Puerto Rican | 11 | 0.7% |
| Russian | 42 | 2.8% |
| Scotch-Irish | 38 | 2.5% |
| Scottish | 11 | 0.7% |
| Slovak | 14 | 0.9% |
| Swedish | 6 | 0.4% |
| Ukrainian | 5 | 0.3% |
| Welsh | 11 | 0.7% | View All 25 Rows |
Immigrants in Lakemont
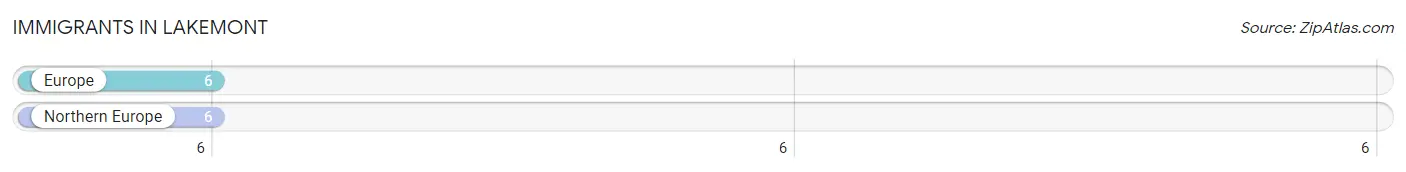
The most numerous immigrant groups reported in Lakemont came from Europe (6 | 0.4%), and Northern Europe (6 | 0.4%), together accounting for 0.8% of all Lakemont residents.
| Immigration Origin | # Population | % Population |
| Europe | 6 | 0.4% |
| Northern Europe | 6 | 0.4% | View All 2 Rows |
Sex and Age in Lakemont
Sex and Age in Lakemont
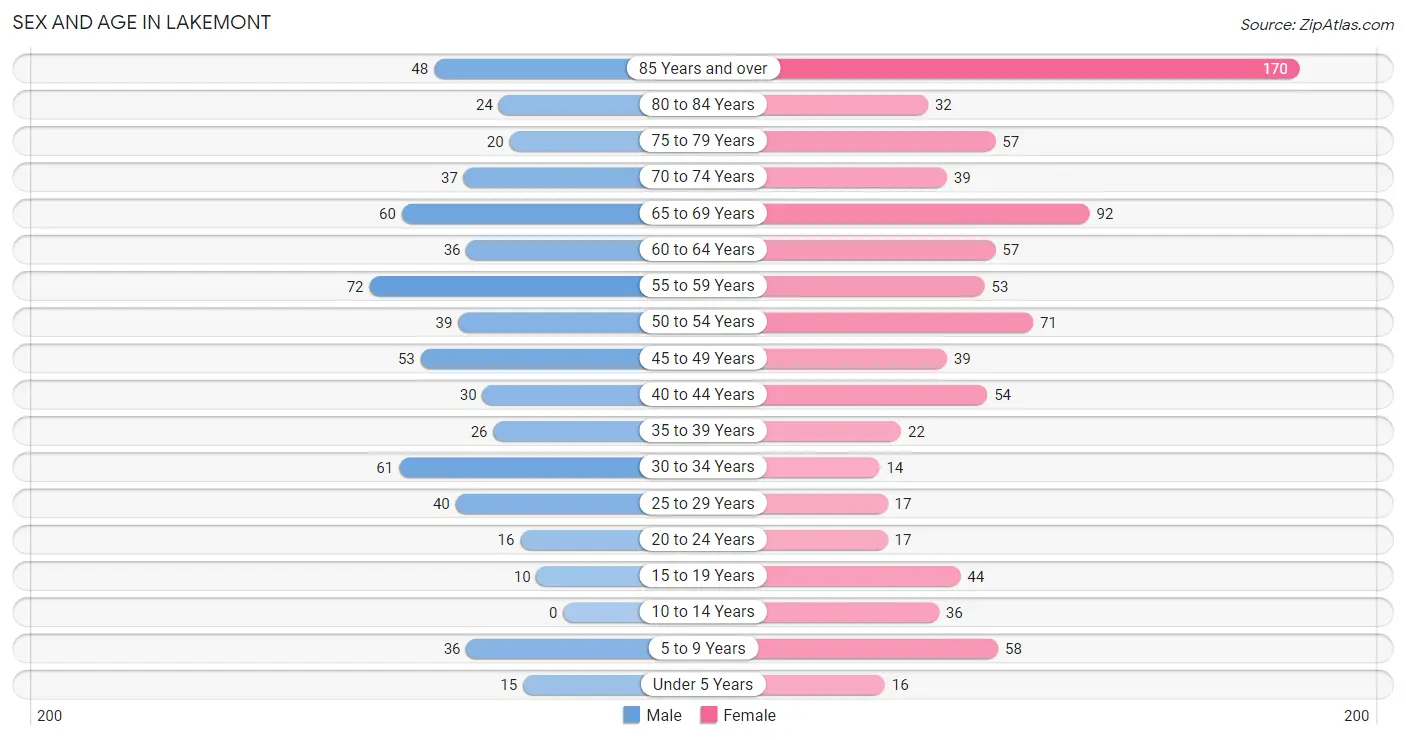
The most populous age groups in Lakemont are 55 to 59 Years (72 | 11.6%) for men and 85 Years and over (170 | 19.1%) for women.
| Age Bracket | Male | Female |
| Under 5 Years | 15 (2.4%) | 16 (1.8%) |
| 5 to 9 Years | 36 (5.8%) | 58 (6.5%) |
| 10 to 14 Years | 0 (0.0%) | 36 (4.1%) |
| 15 to 19 Years | 10 (1.6%) | 44 (5.0%) |
| 20 to 24 Years | 16 (2.6%) | 17 (1.9%) |
| 25 to 29 Years | 40 (6.4%) | 17 (1.9%) |
| 30 to 34 Years | 61 (9.8%) | 14 (1.6%) |
| 35 to 39 Years | 26 (4.2%) | 22 (2.5%) |
| 40 to 44 Years | 30 (4.8%) | 54 (6.1%) |
| 45 to 49 Years | 53 (8.5%) | 39 (4.4%) |
| 50 to 54 Years | 39 (6.3%) | 71 (8.0%) |
| 55 to 59 Years | 72 (11.6%) | 53 (6.0%) |
| 60 to 64 Years | 36 (5.8%) | 57 (6.4%) |
| 65 to 69 Years | 60 (9.6%) | 92 (10.4%) |
| 70 to 74 Years | 37 (5.9%) | 39 (4.4%) |
| 75 to 79 Years | 20 (3.2%) | 57 (6.4%) |
| 80 to 84 Years | 24 (3.8%) | 32 (3.6%) |
| 85 Years and over | 48 (7.7%) | 170 (19.1%) |
| Total | 623 (100.0%) | 888 (100.0%) |
Families and Households in Lakemont
Median Family Size in Lakemont
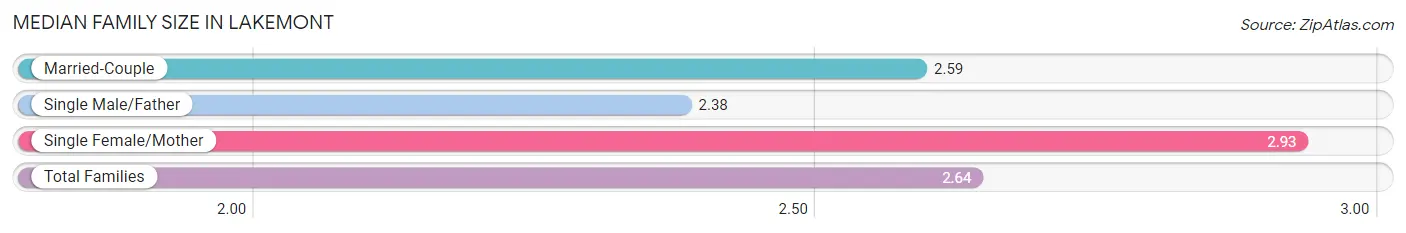
The median family size in Lakemont is 2.64 persons per family, with single female/mother families (67 | 18.1%) accounting for the largest median family size of 2.93 persons per family. On the other hand, single male/father families (26 | 7.0%) represent the smallest median family size with 2.38 persons per family.
| Family Type | # Families | Family Size |
| Married-Couple | 277 (74.9%) | 2.59 |
| Single Male/Father | 26 (7.0%) | 2.38 |
| Single Female/Mother | 67 (18.1%) | 2.93 |
| Total Families | 370 (100.0%) | 2.64 |
Median Household Size in Lakemont
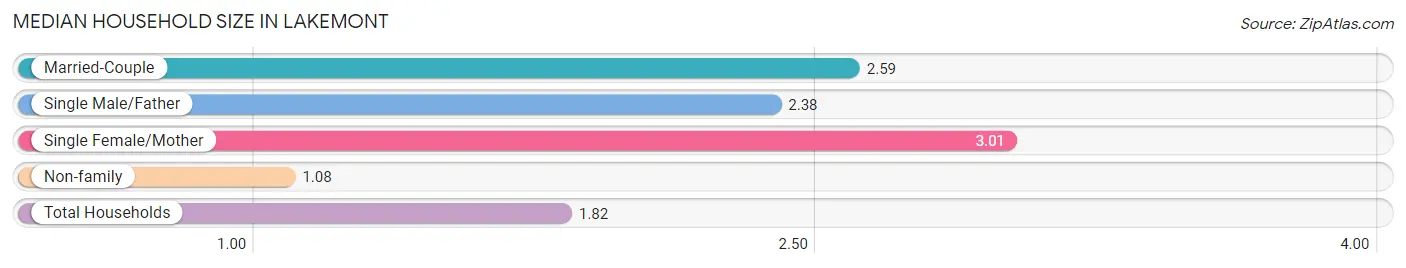
The median household size in Lakemont is 1.82 persons per household, with single female/mother households (67 | 8.6%) accounting for the largest median household size of 3.01 persons per household. non-family households (410 | 52.6%) represent the smallest median household size with 1.08 persons per household.
| Household Type | # Households | Household Size |
| Married-Couple | 277 (35.5%) | 2.59 |
| Single Male/Father | 26 (3.3%) | 2.38 |
| Single Female/Mother | 67 (8.6%) | 3.01 |
| Non-family | 410 (52.6%) | 1.08 |
| Total Households | 780 (100.0%) | 1.82 |
Household Size by Marriage Status in Lakemont
Out of a total of 780 households in Lakemont, 370 (47.4%) are family households, while 410 (52.6%) are nonfamily households. The most numerous type of family households are 2-person households, comprising 221, and the most common type of nonfamily households are 1-person households, comprising 382.
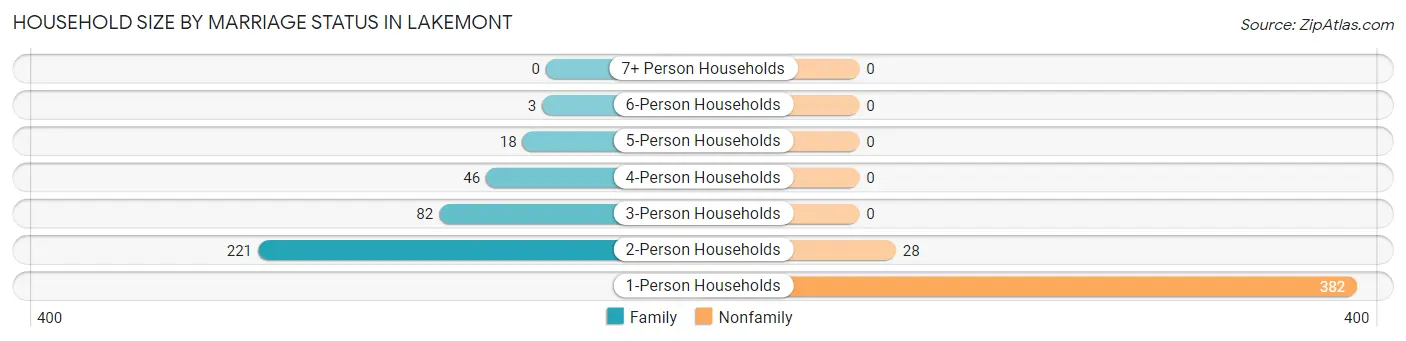
| Household Size | Family Households | Nonfamily Households |
| 1-Person Households | - | 382 (49.0%) |
| 2-Person Households | 221 (28.3%) | 28 (3.6%) |
| 3-Person Households | 82 (10.5%) | 0 (0.0%) |
| 4-Person Households | 46 (5.9%) | 0 (0.0%) |
| 5-Person Households | 18 (2.3%) | 0 (0.0%) |
| 6-Person Households | 3 (0.4%) | 0 (0.0%) |
| 7+ Person Households | 0 (0.0%) | 0 (0.0%) |
| Total | 370 (47.4%) | 410 (52.6%) |
Female Fertility in Lakemont
Fertility by Age in Lakemont
| Age Bracket | Women with Births | Births / 1,000 Women |
| 15 to 19 years | 0 (0.0%) | 0.0 |
| 20 to 34 years | 0 (0.0%) | 0.0 |
| 35 to 50 years | 0 (0.0%) | 0.0 |
| Total | 0 (0.0%) | 0.0 |
Fertility by Age by Marriage Status in Lakemont
| Age Bracket | Married | Unmarried |
| 15 to 19 years | 0 (0.0%) | 0 (0.0%) |
| 20 to 34 years | 0 (0.0%) | 0 (0.0%) |
| 35 to 50 years | 0 (0.0%) | 0 (0.0%) |
| Total | 0 (0.0%) | 0 (0.0%) |
Fertility by Education in Lakemont
| Educational Attainment | Women with Births | Births / 1,000 Women |
| Less than High School | 0 (0.0%) | 0.0 |
| High School Diploma | 0 (0.0%) | 0.0 |
| College or Associate's Degree | 0 (0.0%) | 0.0 |
| Bachelor's Degree | 0 (0.0%) | 0.0 |
| Graduate Degree | 0 (0.0%) | 0.0 |
| Total | 0 (0.0%) | 0.0 |
Fertility by Education by Marriage Status in Lakemont
| Educational Attainment | Married | Unmarried |
| Less than High School | 0 (0.0%) | 0 (0.0%) |
| High School Diploma | 0 (0.0%) | 0 (0.0%) |
| College or Associate's Degree | 0 (0.0%) | 0 (0.0%) |
| Bachelor's Degree | 0 (0.0%) | 0 (0.0%) |
| Graduate Degree | 0 (0.0%) | 0 (0.0%) |
| Total | 0 (0.0%) | 0 (0.0%) |
Employment Characteristics in Lakemont
Employment by Class of Employer in Lakemont
Among the 698 employed individuals in Lakemont, private company employees (408 | 58.5%), not-for-profit organizations (98 | 14.0%), and local government employees (56 | 8.0%) make up the most common classes of employment.
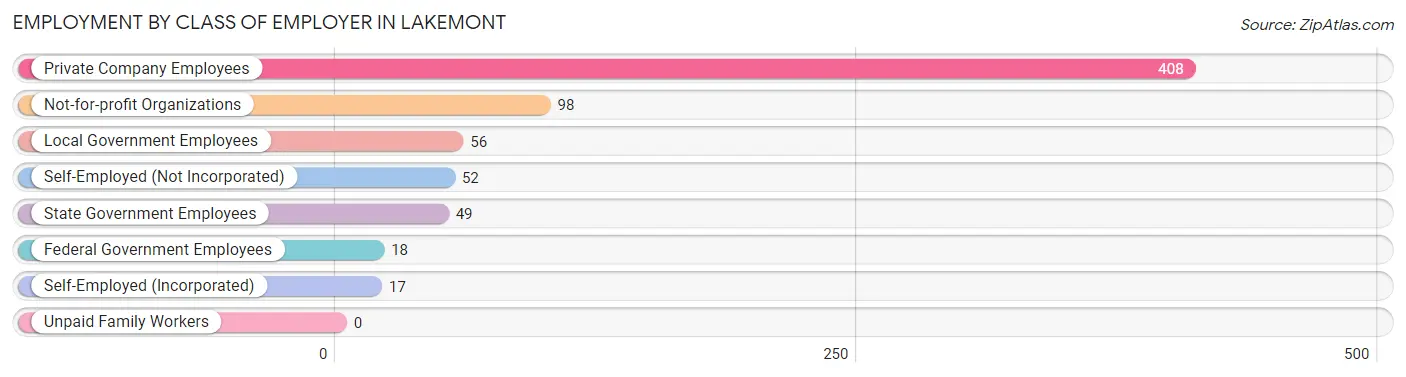
| Employer Class | # Employees | % Employees |
| Private Company Employees | 408 | 58.5% |
| Self-Employed (Incorporated) | 17 | 2.4% |
| Self-Employed (Not Incorporated) | 52 | 7.4% |
| Not-for-profit Organizations | 98 | 14.0% |
| Local Government Employees | 56 | 8.0% |
| State Government Employees | 49 | 7.0% |
| Federal Government Employees | 18 | 2.6% |
| Unpaid Family Workers | 0 | 0.0% |
| Total | 698 | 100.0% |
Employment Status by Age in Lakemont
According to the labor force statistics for Lakemont, out of the total population over 16 years of age (1,339), 55.7% or 746 individuals are in the labor force, with 5.7% or 43 of them unemployed. The age group with the highest labor force participation rate is 25 to 29 years, with 100.0% or 57 individuals in the labor force. Within the labor force, the 30 to 34 years age range has the highest percentage of unemployed individuals, with 41.2% or 28 of them being unemployed.
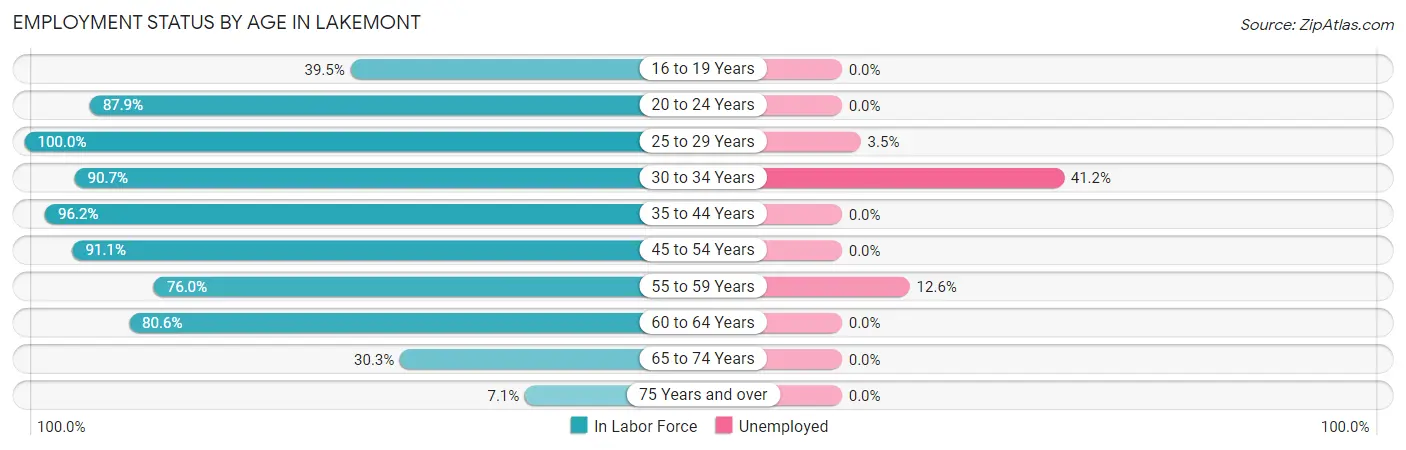
| Age Bracket | In Labor Force | Unemployed |
| 16 to 19 Years | 17 (39.5%) | 0 (0.0%) |
| 20 to 24 Years | 29 (87.9%) | 0 (0.0%) |
| 25 to 29 Years | 57 (100.0%) | 2 (3.5%) |
| 30 to 34 Years | 68 (90.7%) | 28 (41.2%) |
| 35 to 44 Years | 127 (96.2%) | 0 (0.0%) |
| 45 to 54 Years | 184 (91.1%) | 0 (0.0%) |
| 55 to 59 Years | 95 (76.0%) | 12 (12.6%) |
| 60 to 64 Years | 75 (80.6%) | 0 (0.0%) |
| 65 to 74 Years | 69 (30.3%) | 0 (0.0%) |
| 75 Years and over | 25 (7.1%) | 0 (0.0%) |
| Total | 746 (55.7%) | 43 (5.7%) |
Employment Status by Educational Attainment in Lakemont
According to labor force statistics for Lakemont, 88.6% of individuals (606) out of the total population between 25 and 64 years of age (684) are in the labor force, with 7.0% or 42 of them being unemployed. The group with the highest labor force participation rate are those with the educational attainment of high school diploma, with 89.4% or 210 individuals in the labor force. Within the labor force, individuals with high school diploma education have the highest percentage of unemployment, with 14.6% or 31 of them being unemployed.
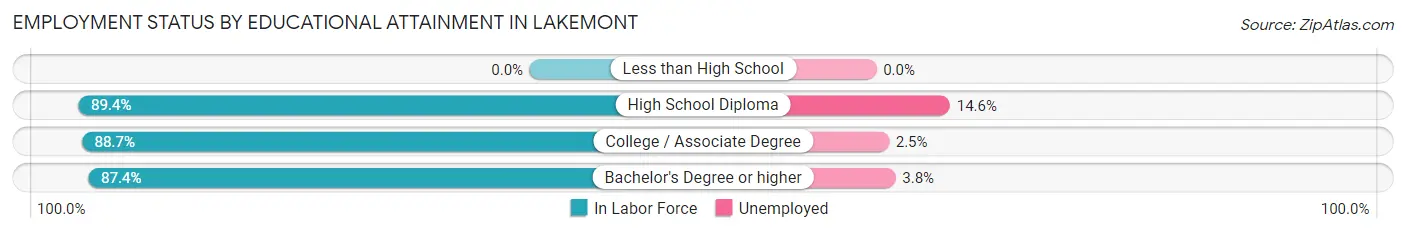
| Educational Attainment | In Labor Force | Unemployed |
| Less than High School | 0 (0.0%) | 0 (0.0%) |
| High School Diploma | 210 (89.4%) | 34 (14.6%) |
| College / Associate Degree | 236 (88.7%) | 7 (2.5%) |
| Bachelor's Degree or higher | 160 (87.4%) | 7 (3.8%) |
| Total | 606 (88.6%) | 48 (7.0%) |
Employment Occupations by Sex in Lakemont
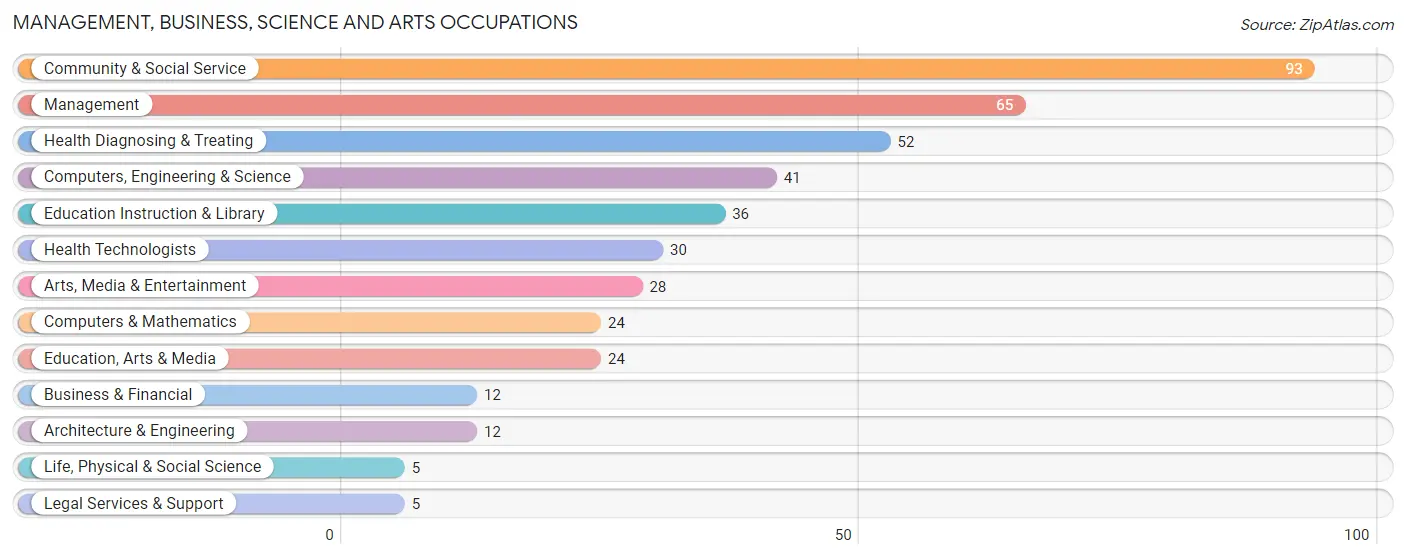
Management, Business, Science and Arts Occupations
The most common Management, Business, Science and Arts occupations in Lakemont are Community & Social Service (93 | 13.3%), Management (65 | 9.3%), Health Diagnosing & Treating (52 | 7.4%), Computers, Engineering & Science (41 | 5.9%), and Education Instruction & Library (36 | 5.1%).
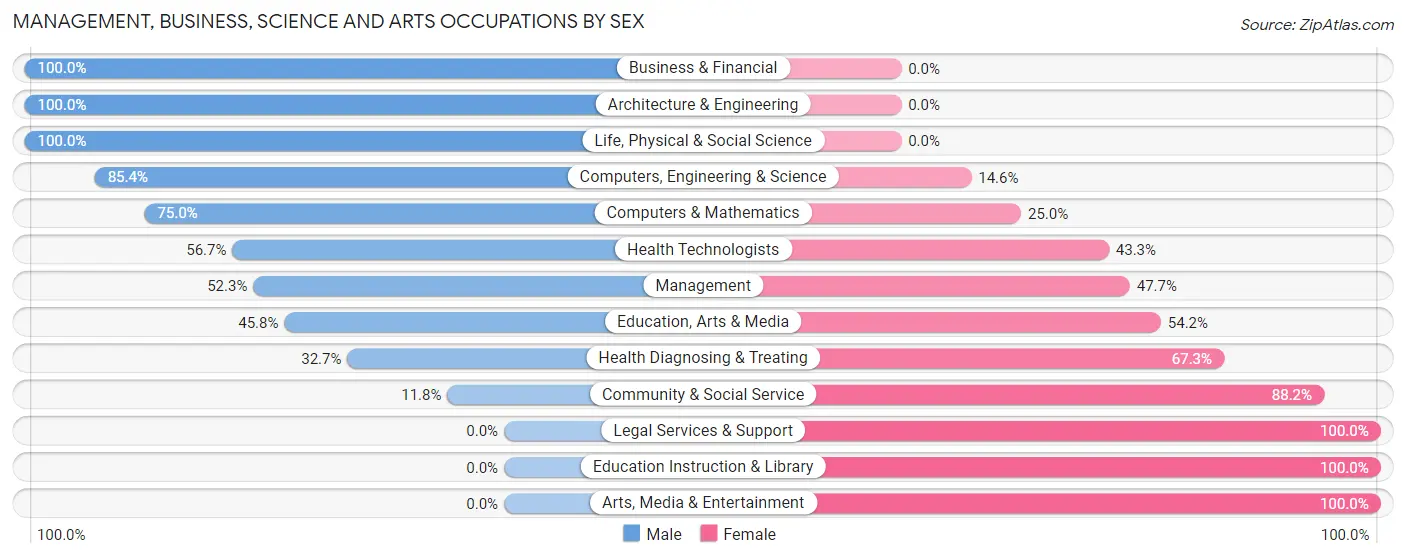
Management, Business, Science and Arts Occupations by Sex
Within the Management, Business, Science and Arts occupations in Lakemont, the most male-oriented occupations are Business & Financial (100.0%), Architecture & Engineering (100.0%), and Life, Physical & Social Science (100.0%), while the most female-oriented occupations are Legal Services & Support (100.0%), Education Instruction & Library (100.0%), and Arts, Media & Entertainment (100.0%).
| Occupation | Male | Female |
| Management | 34 (52.3%) | 31 (47.7%) |
| Business & Financial | 12 (100.0%) | 0 (0.0%) |
| Computers, Engineering & Science | 35 (85.4%) | 6 (14.6%) |
| Computers & Mathematics | 18 (75.0%) | 6 (25.0%) |
| Architecture & Engineering | 12 (100.0%) | 0 (0.0%) |
| Life, Physical & Social Science | 5 (100.0%) | 0 (0.0%) |
| Community & Social Service | 11 (11.8%) | 82 (88.2%) |
| Education, Arts & Media | 11 (45.8%) | 13 (54.2%) |
| Legal Services & Support | 0 (0.0%) | 5 (100.0%) |
| Education Instruction & Library | 0 (0.0%) | 36 (100.0%) |
| Arts, Media & Entertainment | 0 (0.0%) | 28 (100.0%) |
| Health Diagnosing & Treating | 17 (32.7%) | 35 (67.3%) |
| Health Technologists | 17 (56.7%) | 13 (43.3%) |
| Total (Category) | 109 (41.4%) | 154 (58.6%) |
| Total (Overall) | 368 (52.6%) | 331 (47.3%) |
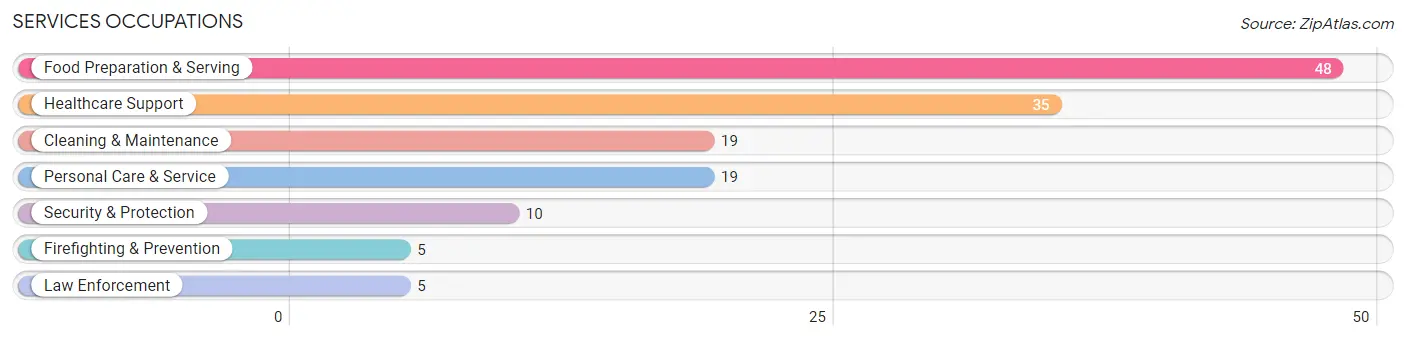
Services Occupations
The most common Services occupations in Lakemont are Food Preparation & Serving (48 | 6.9%), Healthcare Support (35 | 5.0%), Cleaning & Maintenance (19 | 2.7%), Personal Care & Service (19 | 2.7%), and Security & Protection (10 | 1.4%).
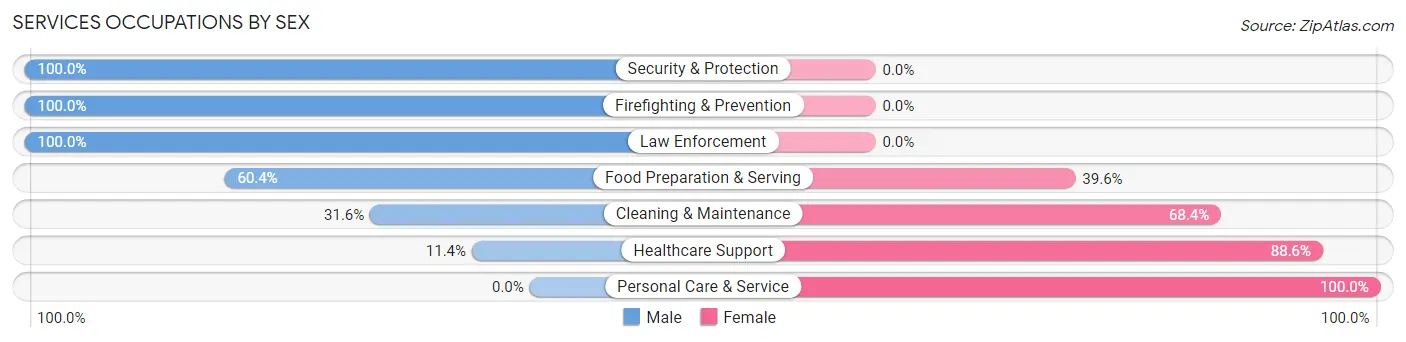
Services Occupations by Sex
Within the Services occupations in Lakemont, the most male-oriented occupations are Security & Protection (100.0%), Firefighting & Prevention (100.0%), and Law Enforcement (100.0%), while the most female-oriented occupations are Personal Care & Service (100.0%), Healthcare Support (88.6%), and Cleaning & Maintenance (68.4%).
| Occupation | Male | Female |
| Healthcare Support | 4 (11.4%) | 31 (88.6%) |
| Security & Protection | 10 (100.0%) | 0 (0.0%) |
| Firefighting & Prevention | 5 (100.0%) | 0 (0.0%) |
| Law Enforcement | 5 (100.0%) | 0 (0.0%) |
| Food Preparation & Serving | 29 (60.4%) | 19 (39.6%) |
| Cleaning & Maintenance | 6 (31.6%) | 13 (68.4%) |
| Personal Care & Service | 0 (0.0%) | 19 (100.0%) |
| Total (Category) | 49 (37.4%) | 82 (62.6%) |
| Total (Overall) | 368 (52.6%) | 331 (47.3%) |
Sales and Office Occupations
The most common Sales and Office occupations in Lakemont are Office & Administration (39 | 5.6%), and Sales & Related (37 | 5.3%).
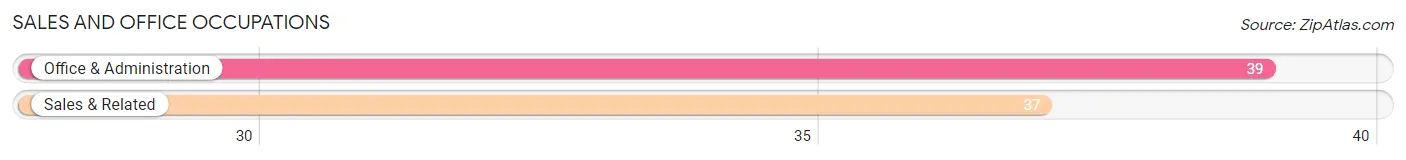
Sales and Office Occupations by Sex

| Occupation | Male | Female |
| Sales & Related | 32 (86.5%) | 5 (13.5%) |
| Office & Administration | 5 (12.8%) | 34 (87.2%) |
| Total (Category) | 37 (48.7%) | 39 (51.3%) |
| Total (Overall) | 368 (52.6%) | 331 (47.3%) |
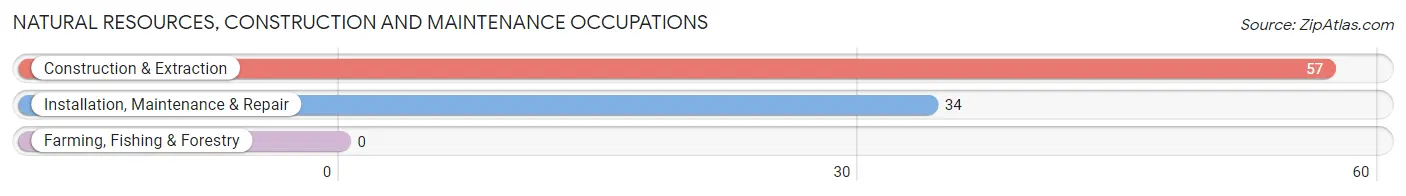
Natural Resources, Construction and Maintenance Occupations
The most common Natural Resources, Construction and Maintenance occupations in Lakemont are Construction & Extraction (57 | 8.2%), and Installation, Maintenance & Repair (34 | 4.9%).
Natural Resources, Construction and Maintenance Occupations by Sex
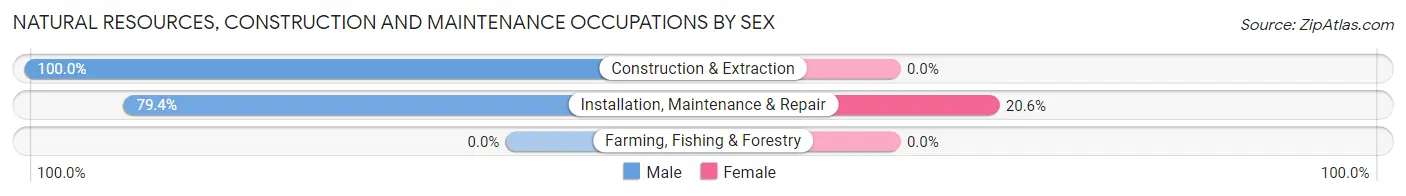
| Occupation | Male | Female |
| Farming, Fishing & Forestry | 0 (0.0%) | 0 (0.0%) |
| Construction & Extraction | 57 (100.0%) | 0 (0.0%) |
| Installation, Maintenance & Repair | 27 (79.4%) | 7 (20.6%) |
| Total (Category) | 84 (92.3%) | 7 (7.7%) |
| Total (Overall) | 368 (52.6%) | 331 (47.3%) |
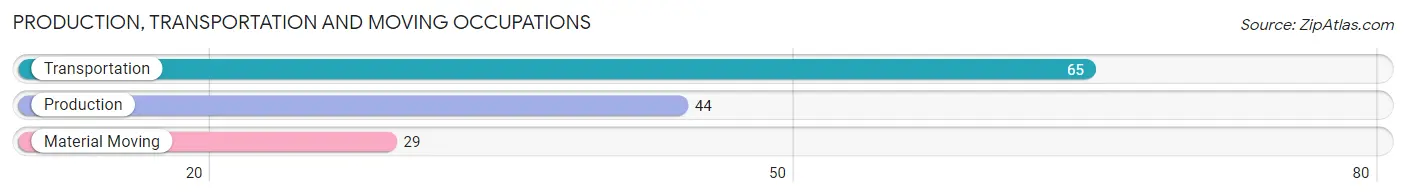
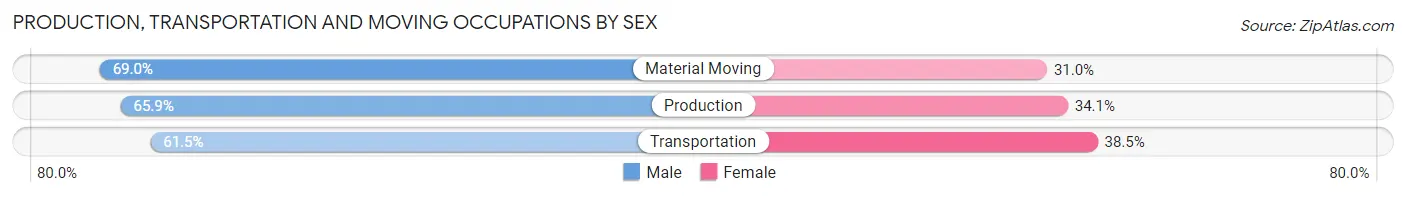
Production, Transportation and Moving Occupations
The most common Production, Transportation and Moving occupations in Lakemont are Transportation (65 | 9.3%), Production (44 | 6.3%), and Material Moving (29 | 4.2%).
Production, Transportation and Moving Occupations by Sex
| Occupation | Male | Female |
| Production | 29 (65.9%) | 15 (34.1%) |
| Transportation | 40 (61.5%) | 25 (38.5%) |
| Material Moving | 20 (69.0%) | 9 (31.0%) |
| Total (Category) | 89 (64.5%) | 49 (35.5%) |
| Total (Overall) | 368 (52.6%) | 331 (47.3%) |
Employment Industries by Sex in Lakemont
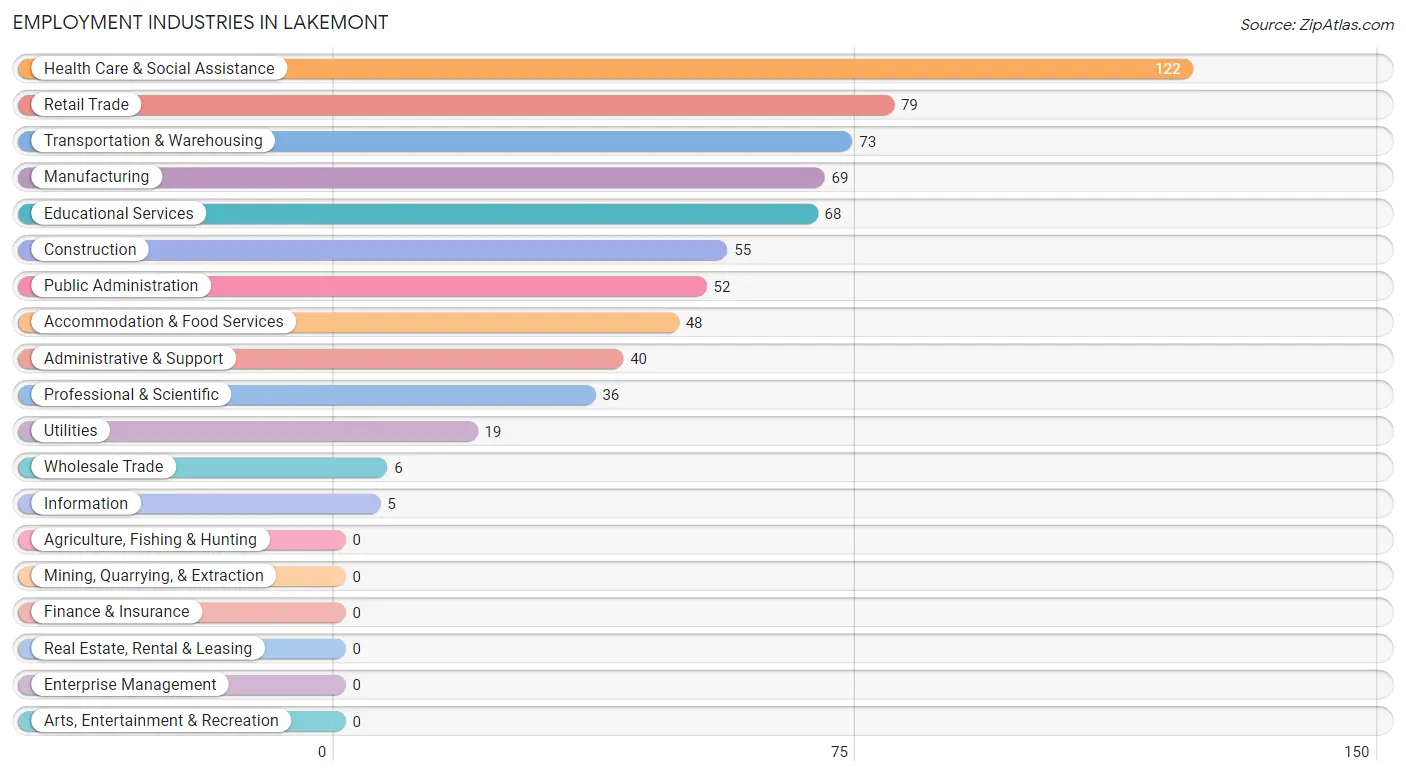
Employment Industries in Lakemont
The major employment industries in Lakemont include Health Care & Social Assistance (122 | 17.4%), Retail Trade (79 | 11.3%), Transportation & Warehousing (73 | 10.4%), Manufacturing (69 | 9.9%), and Educational Services (68 | 9.7%).
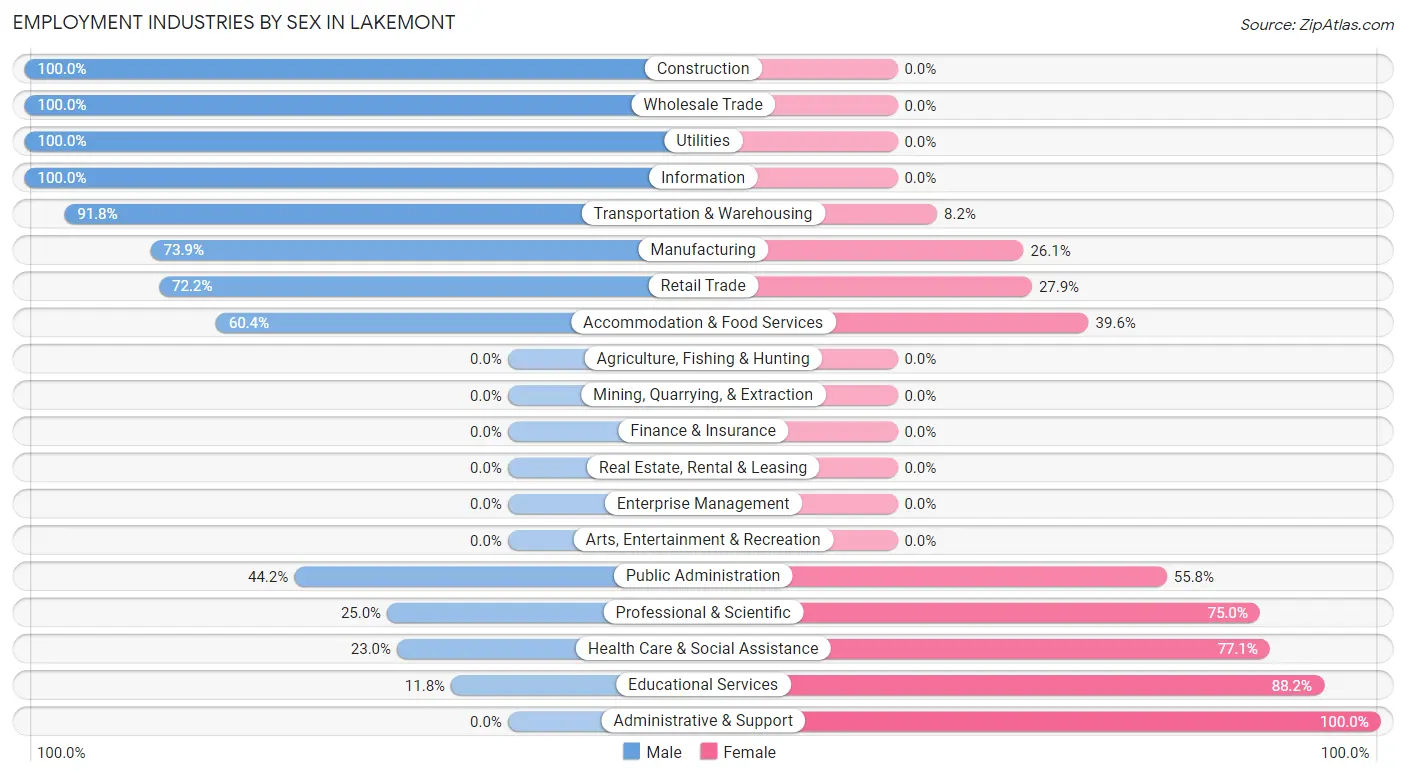
Employment Industries by Sex in Lakemont
The Lakemont industries that see more men than women are Construction (100.0%), Wholesale Trade (100.0%), and Utilities (100.0%), whereas the industries that tend to have a higher number of women are Administrative & Support (100.0%), Educational Services (88.2%), and Health Care & Social Assistance (77.0%).
| Industry | Male | Female |
| Agriculture, Fishing & Hunting | 0 (0.0%) | 0 (0.0%) |
| Mining, Quarrying, & Extraction | 0 (0.0%) | 0 (0.0%) |
| Construction | 55 (100.0%) | 0 (0.0%) |
| Manufacturing | 51 (73.9%) | 18 (26.1%) |
| Wholesale Trade | 6 (100.0%) | 0 (0.0%) |
| Retail Trade | 57 (72.2%) | 22 (27.9%) |
| Transportation & Warehousing | 67 (91.8%) | 6 (8.2%) |
| Utilities | 19 (100.0%) | 0 (0.0%) |
| Information | 5 (100.0%) | 0 (0.0%) |
| Finance & Insurance | 0 (0.0%) | 0 (0.0%) |
| Real Estate, Rental & Leasing | 0 (0.0%) | 0 (0.0%) |
| Professional & Scientific | 9 (25.0%) | 27 (75.0%) |
| Enterprise Management | 0 (0.0%) | 0 (0.0%) |
| Administrative & Support | 0 (0.0%) | 40 (100.0%) |
| Educational Services | 8 (11.8%) | 60 (88.2%) |
| Health Care & Social Assistance | 28 (23.0%) | 94 (77.0%) |
| Arts, Entertainment & Recreation | 0 (0.0%) | 0 (0.0%) |
| Accommodation & Food Services | 29 (60.4%) | 19 (39.6%) |
| Public Administration | 23 (44.2%) | 29 (55.8%) |
| Total | 368 (52.6%) | 331 (47.3%) |
Education in Lakemont
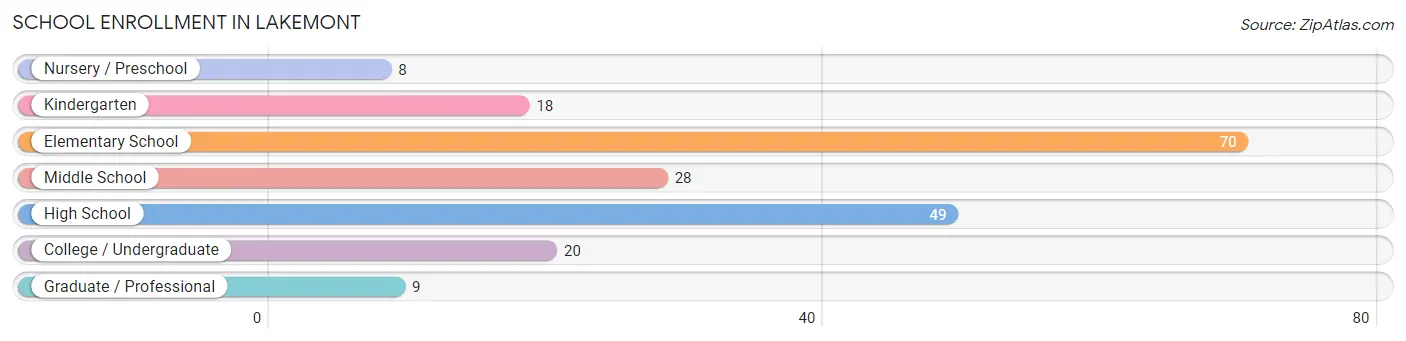
School Enrollment in Lakemont
The most common levels of schooling among the 202 students in Lakemont are elementary school (70 | 34.6%), high school (49 | 24.3%), and middle school (28 | 13.9%).
| School Level | # Students | % Students |
| Nursery / Preschool | 8 | 4.0% |
| Kindergarten | 18 | 8.9% |
| Elementary School | 70 | 34.6% |
| Middle School | 28 | 13.9% |
| High School | 49 | 24.3% |
| College / Undergraduate | 20 | 9.9% |
| Graduate / Professional | 9 | 4.5% |
| Total | 202 | 100.0% |
School Enrollment by Age by Funding Source in Lakemont
Out of a total of 202 students who are enrolled in schools in Lakemont, 43 (21.3%) attend a private institution, while the remaining 159 (78.7%) are enrolled in public schools. The age group of 18 to 19 year olds has the highest likelihood of being enrolled in private schools, with 2 (100.0% in the age bracket) enrolled. Conversely, the age group of 25 to 34 year olds has the lowest likelihood of being enrolled in a private school, with 8 (100.0% in the age bracket) attending a public institution.
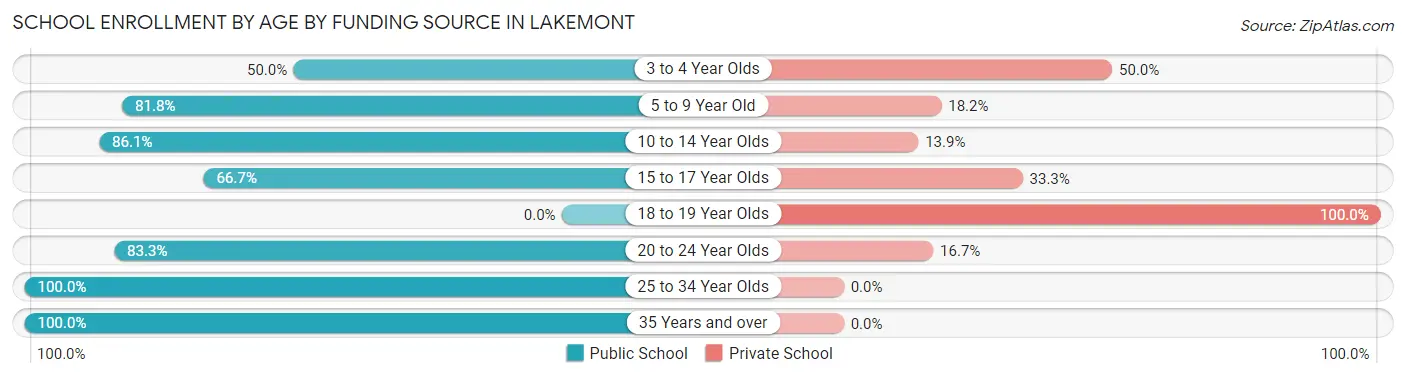
| Age Bracket | Public School | Private School |
| 3 to 4 Year Olds | 4 (50.0%) | 4 (50.0%) |
| 5 to 9 Year Old | 72 (81.8%) | 16 (18.2%) |
| 10 to 14 Year Olds | 31 (86.1%) | 5 (13.9%) |
| 15 to 17 Year Olds | 26 (66.7%) | 13 (33.3%) |
| 18 to 19 Year Olds | 0 (0.0%) | 2 (100.0%) |
| 20 to 24 Year Olds | 15 (83.3%) | 3 (16.7%) |
| 25 to 34 Year Olds | 8 (100.0%) | 0 (0.0%) |
| 35 Years and over | 3 (100.0%) | 0 (0.0%) |
| Total | 159 (78.7%) | 43 (21.3%) |
Educational Attainment by Field of Study in Lakemont
Education (61 | 21.0%), arts & humanities (61 | 21.0%), business (55 | 19.0%), liberal arts & history (39 | 13.5%), and visual & performing arts (18 | 6.2%) are the most common fields of study among 290 individuals in Lakemont who have obtained a bachelor's degree or higher.
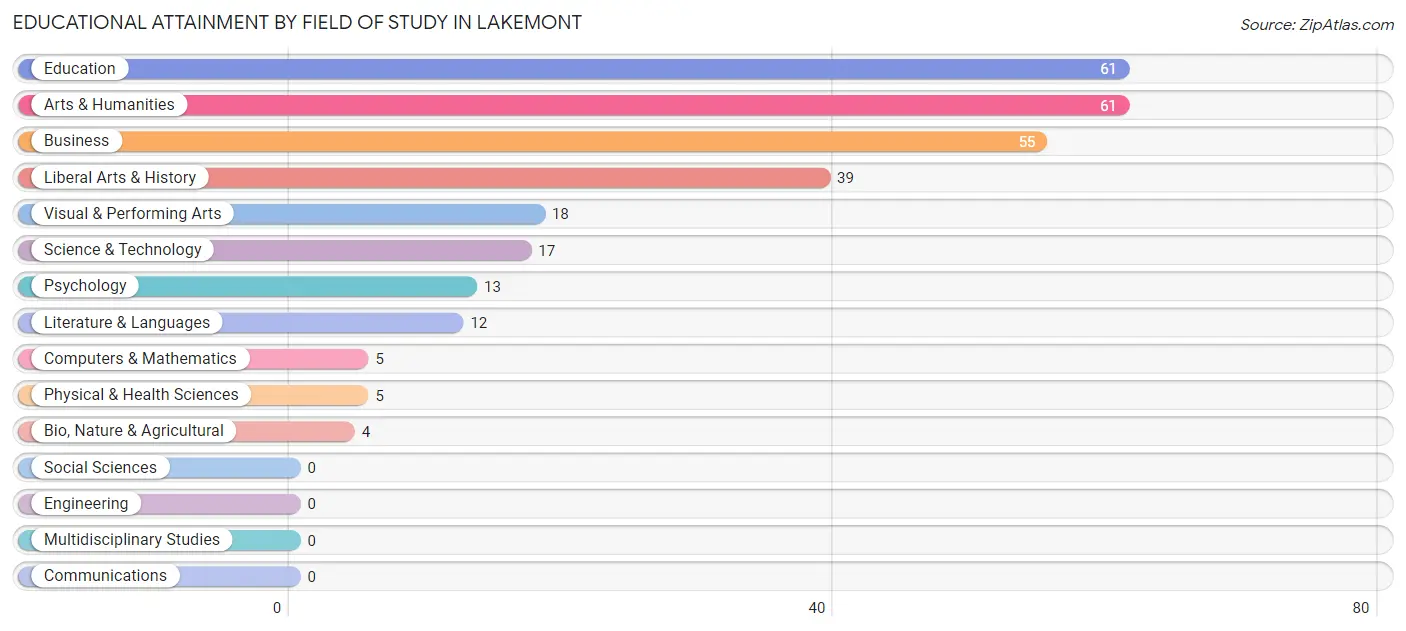
| Field of Study | # Graduates | % Graduates |
| Computers & Mathematics | 5 | 1.7% |
| Bio, Nature & Agricultural | 4 | 1.4% |
| Physical & Health Sciences | 5 | 1.7% |
| Psychology | 13 | 4.5% |
| Social Sciences | 0 | 0.0% |
| Engineering | 0 | 0.0% |
| Multidisciplinary Studies | 0 | 0.0% |
| Science & Technology | 17 | 5.9% |
| Business | 55 | 19.0% |
| Education | 61 | 21.0% |
| Literature & Languages | 12 | 4.1% |
| Liberal Arts & History | 39 | 13.5% |
| Visual & Performing Arts | 18 | 6.2% |
| Communications | 0 | 0.0% |
| Arts & Humanities | 61 | 21.0% |
| Total | 290 | 100.0% |
Transportation & Commute in Lakemont
Vehicle Availability by Sex in Lakemont
The most prevalent vehicle ownership categories in Lakemont are males with 2 vehicles (181, accounting for 49.3%) and females with 2 vehicles (134, making up 54.7%).
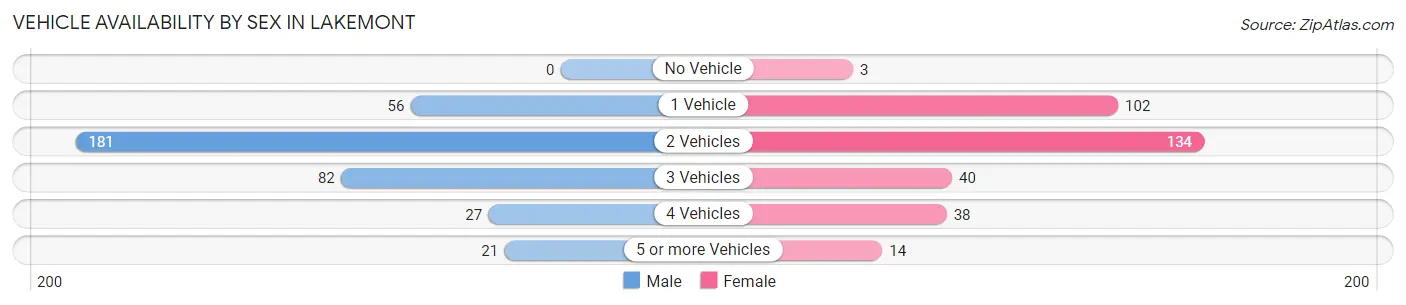
| Vehicles Available | Male | Female |
| No Vehicle | 0 (0.0%) | 3 (0.9%) |
| 1 Vehicle | 56 (15.3%) | 102 (30.8%) |
| 2 Vehicles | 181 (49.3%) | 134 (40.5%) |
| 3 Vehicles | 82 (22.3%) | 40 (12.1%) |
| 4 Vehicles | 27 (7.4%) | 38 (11.5%) |
| 5 or more Vehicles | 21 (5.7%) | 14 (4.2%) |
| Total | 367 (100.0%) | 331 (100.0%) |
Commute Time in Lakemont
The most frequently occuring commute durations in Lakemont are 15 to 19 minutes (183 commuters, 28.1%), 10 to 14 minutes (147 commuters, 22.6%), and 20 to 24 minutes (94 commuters, 14.4%).
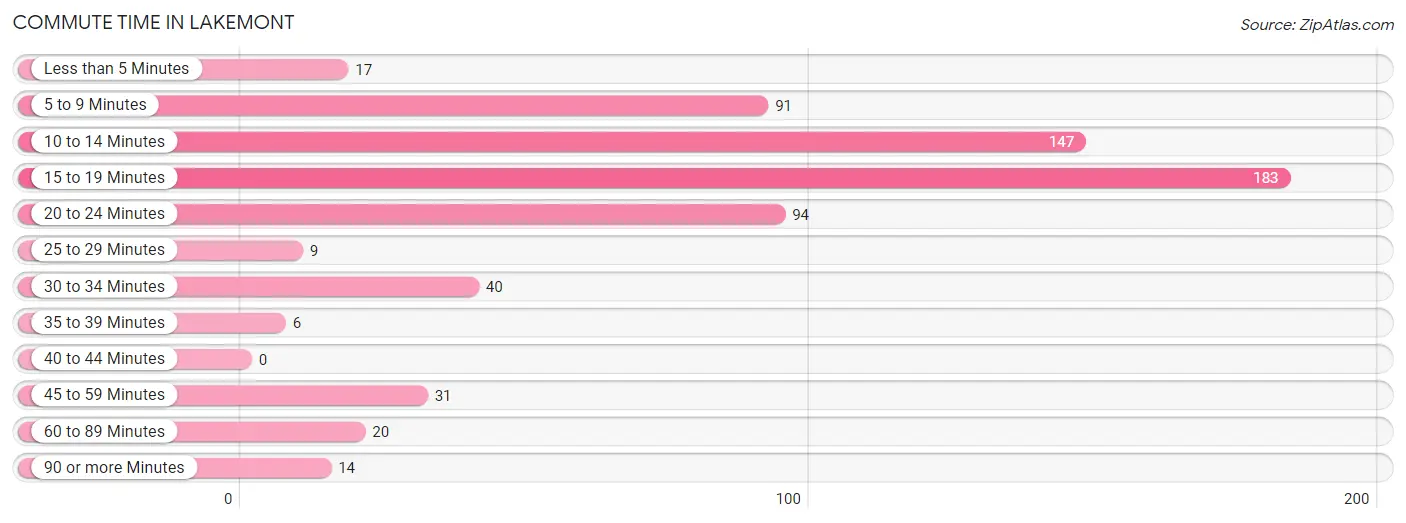
| Commute Time | # Commuters | % Commuters |
| Less than 5 Minutes | 17 | 2.6% |
| 5 to 9 Minutes | 91 | 14.0% |
| 10 to 14 Minutes | 147 | 22.6% |
| 15 to 19 Minutes | 183 | 28.1% |
| 20 to 24 Minutes | 94 | 14.4% |
| 25 to 29 Minutes | 9 | 1.4% |
| 30 to 34 Minutes | 40 | 6.1% |
| 35 to 39 Minutes | 6 | 0.9% |
| 40 to 44 Minutes | 0 | 0.0% |
| 45 to 59 Minutes | 31 | 4.8% |
| 60 to 89 Minutes | 20 | 3.1% |
| 90 or more Minutes | 14 | 2.1% |
Commute Time by Sex in Lakemont
The most common commute times in Lakemont are 15 to 19 minutes (104 commuters, 30.9%) for males and 10 to 14 minutes (92 commuters, 29.2%) for females.
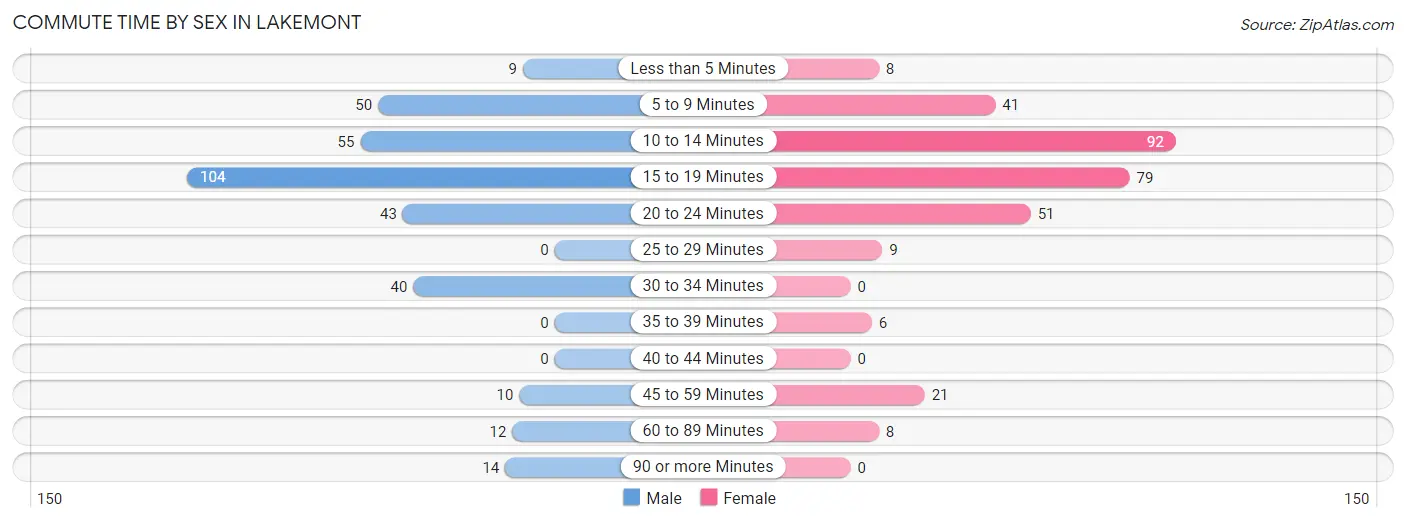
| Commute Time | Male | Female |
| Less than 5 Minutes | 9 (2.7%) | 8 (2.5%) |
| 5 to 9 Minutes | 50 (14.8%) | 41 (13.0%) |
| 10 to 14 Minutes | 55 (16.3%) | 92 (29.2%) |
| 15 to 19 Minutes | 104 (30.9%) | 79 (25.1%) |
| 20 to 24 Minutes | 43 (12.8%) | 51 (16.2%) |
| 25 to 29 Minutes | 0 (0.0%) | 9 (2.9%) |
| 30 to 34 Minutes | 40 (11.9%) | 0 (0.0%) |
| 35 to 39 Minutes | 0 (0.0%) | 6 (1.9%) |
| 40 to 44 Minutes | 0 (0.0%) | 0 (0.0%) |
| 45 to 59 Minutes | 10 (3.0%) | 21 (6.7%) |
| 60 to 89 Minutes | 12 (3.6%) | 8 (2.5%) |
| 90 or more Minutes | 14 (4.2%) | 0 (0.0%) |
Time of Departure to Work by Sex in Lakemont
The most frequent times of departure to work in Lakemont are 6:00 AM to 6:29 AM (43, 12.8%) for males and 7:30 AM to 7:59 AM (81, 25.7%) for females.
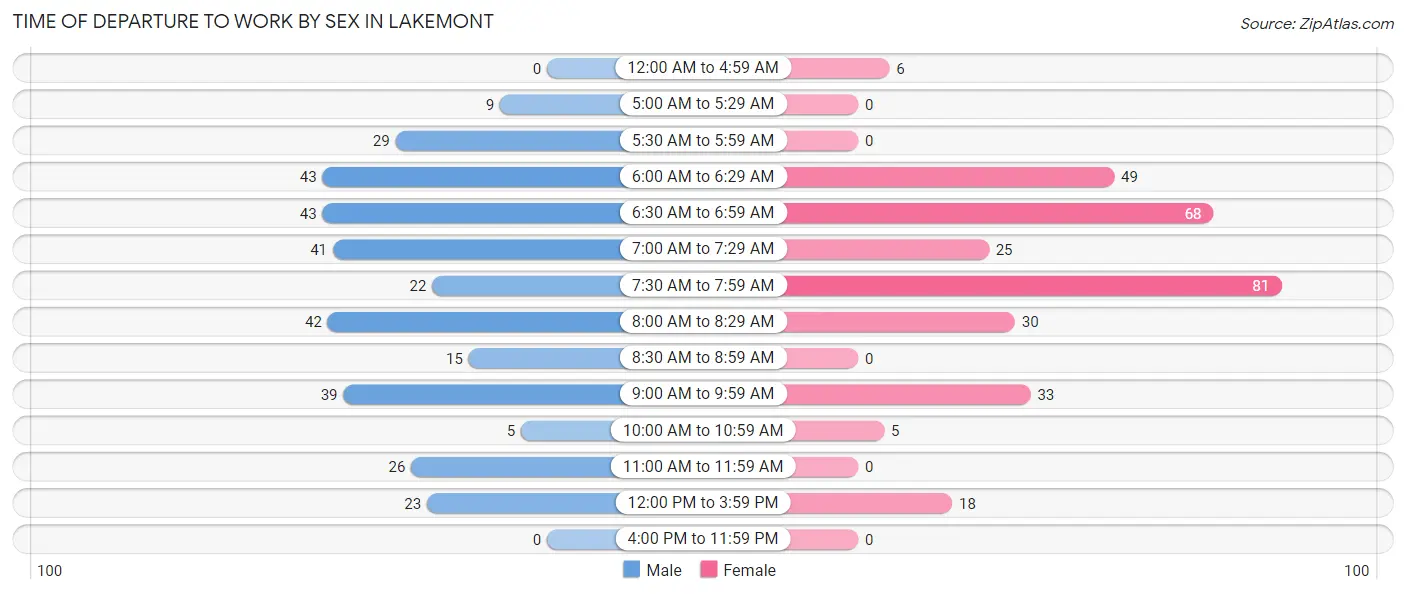
| Time of Departure | Male | Female |
| 12:00 AM to 4:59 AM | 0 (0.0%) | 6 (1.9%) |
| 5:00 AM to 5:29 AM | 9 (2.7%) | 0 (0.0%) |
| 5:30 AM to 5:59 AM | 29 (8.6%) | 0 (0.0%) |
| 6:00 AM to 6:29 AM | 43 (12.8%) | 49 (15.6%) |
| 6:30 AM to 6:59 AM | 43 (12.8%) | 68 (21.6%) |
| 7:00 AM to 7:29 AM | 41 (12.2%) | 25 (7.9%) |
| 7:30 AM to 7:59 AM | 22 (6.5%) | 81 (25.7%) |
| 8:00 AM to 8:29 AM | 42 (12.5%) | 30 (9.5%) |
| 8:30 AM to 8:59 AM | 15 (4.4%) | 0 (0.0%) |
| 9:00 AM to 9:59 AM | 39 (11.6%) | 33 (10.5%) |
| 10:00 AM to 10:59 AM | 5 (1.5%) | 5 (1.6%) |
| 11:00 AM to 11:59 AM | 26 (7.7%) | 0 (0.0%) |
| 12:00 PM to 3:59 PM | 23 (6.8%) | 18 (5.7%) |
| 4:00 PM to 11:59 PM | 0 (0.0%) | 0 (0.0%) |
| Total | 337 (100.0%) | 315 (100.0%) |
Housing Occupancy in Lakemont
Occupancy by Ownership in Lakemont
Of the total 780 dwellings in Lakemont, owner-occupied units account for 533 (68.3%), while renter-occupied units make up 247 (31.7%).
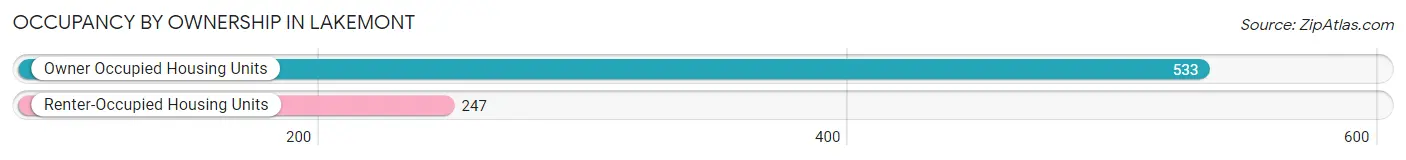
| Occupancy | # Housing Units | % Housing Units |
| Owner Occupied Housing Units | 533 | 68.3% |
| Renter-Occupied Housing Units | 247 | 31.7% |
| Total Occupied Housing Units | 780 | 100.0% |
Occupancy by Household Size in Lakemont
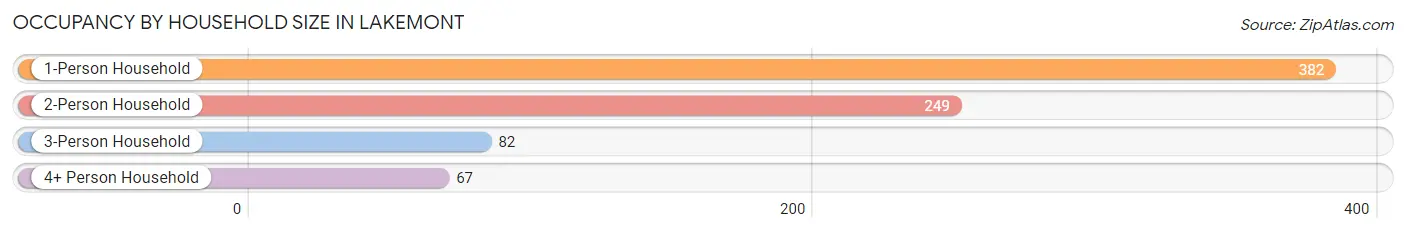
| Household Size | # Housing Units | % Housing Units |
| 1-Person Household | 382 | 49.0% |
| 2-Person Household | 249 | 31.9% |
| 3-Person Household | 82 | 10.5% |
| 4+ Person Household | 67 | 8.6% |
| Total Housing Units | 780 | 100.0% |
Occupancy by Ownership by Household Size in Lakemont
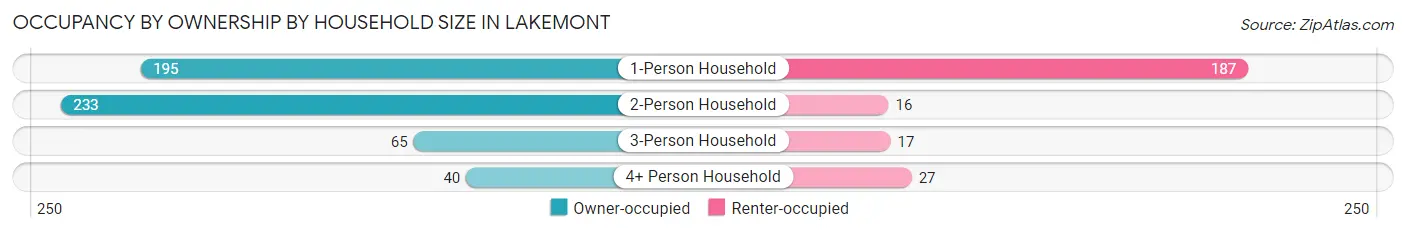
| Household Size | Owner-occupied | Renter-occupied |
| 1-Person Household | 195 (51.0%) | 187 (48.9%) |
| 2-Person Household | 233 (93.6%) | 16 (6.4%) |
| 3-Person Household | 65 (79.3%) | 17 (20.7%) |
| 4+ Person Household | 40 (59.7%) | 27 (40.3%) |
| Total Housing Units | 533 (68.3%) | 247 (31.7%) |
Occupancy by Educational Attainment in Lakemont
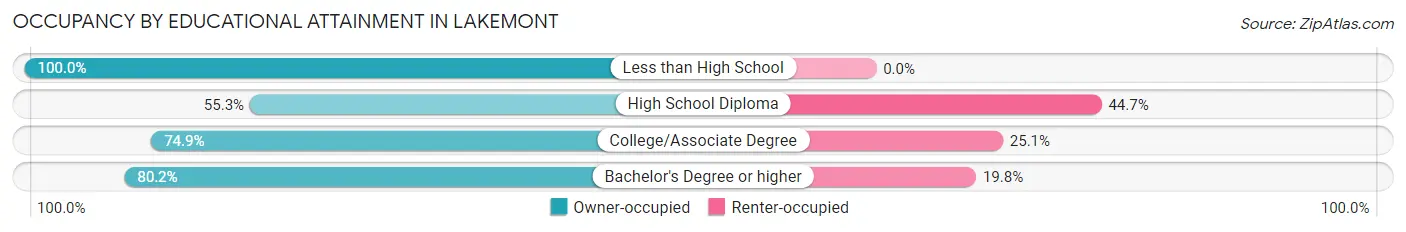
| Household Size | Owner-occupied | Renter-occupied |
| Less than High School | 26 (100.0%) | 0 (0.0%) |
| High School Diploma | 192 (55.3%) | 155 (44.7%) |
| College/Associate Degree | 161 (74.9%) | 54 (25.1%) |
| Bachelor's Degree or higher | 154 (80.2%) | 38 (19.8%) |
Occupancy by Age of Householder in Lakemont
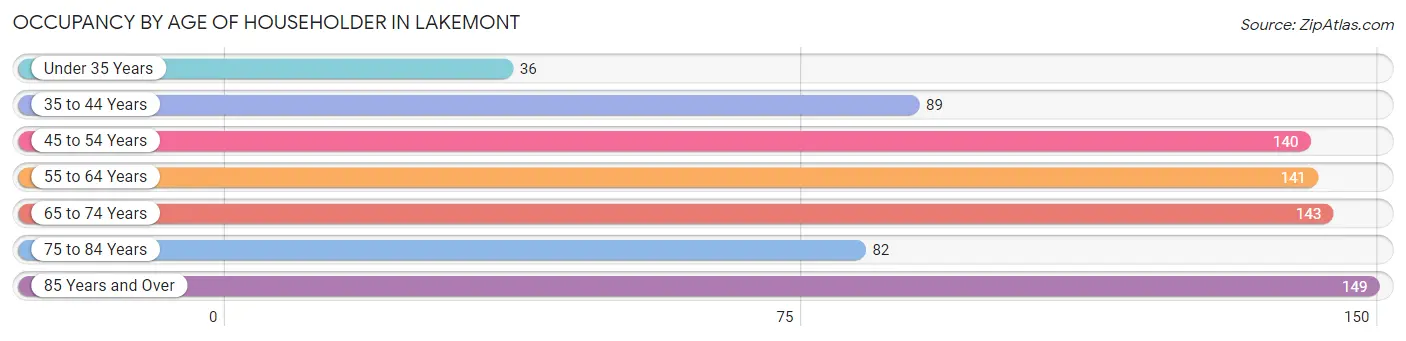
| Age Bracket | # Households | % Households |
| Under 35 Years | 36 | 4.6% |
| 35 to 44 Years | 89 | 11.4% |
| 45 to 54 Years | 140 | 17.9% |
| 55 to 64 Years | 141 | 18.1% |
| 65 to 74 Years | 143 | 18.3% |
| 75 to 84 Years | 82 | 10.5% |
| 85 Years and Over | 149 | 19.1% |
| Total | 780 | 100.0% |
Housing Finances in Lakemont
Median Income by Occupancy in Lakemont
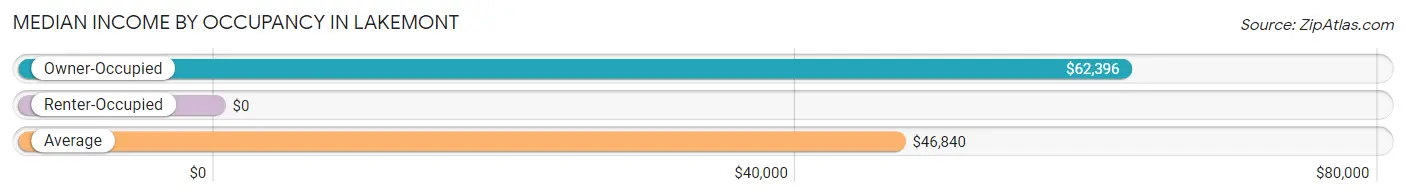
| Occupancy Type | # Households | Median Income |
| Owner-Occupied | 533 (68.3%) | $62,396 |
| Renter-Occupied | 247 (31.7%) | $0 |
| Average | 780 (100.0%) | $46,840 |
Occupancy by Householder Income Bracket in Lakemont
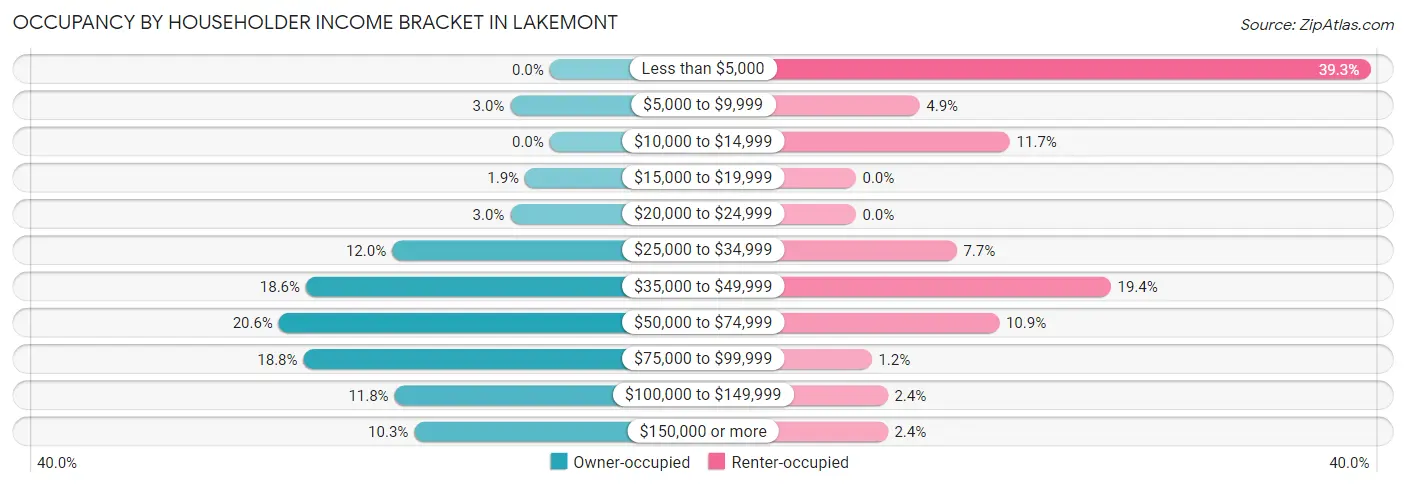
| Income Bracket | Owner-occupied | Renter-occupied |
| Less than $5,000 | 0 (0.0%) | 97 (39.3%) |
| $5,000 to $9,999 | 16 (3.0%) | 12 (4.9%) |
| $10,000 to $14,999 | 0 (0.0%) | 29 (11.7%) |
| $15,000 to $19,999 | 10 (1.9%) | 0 (0.0%) |
| $20,000 to $24,999 | 16 (3.0%) | 0 (0.0%) |
| $25,000 to $34,999 | 64 (12.0%) | 19 (7.7%) |
| $35,000 to $49,999 | 99 (18.6%) | 48 (19.4%) |
| $50,000 to $74,999 | 110 (20.6%) | 27 (10.9%) |
| $75,000 to $99,999 | 100 (18.8%) | 3 (1.2%) |
| $100,000 to $149,999 | 63 (11.8%) | 6 (2.4%) |
| $150,000 or more | 55 (10.3%) | 6 (2.4%) |
| Total | 533 (100.0%) | 247 (100.0%) |
Monthly Housing Cost Tiers in Lakemont
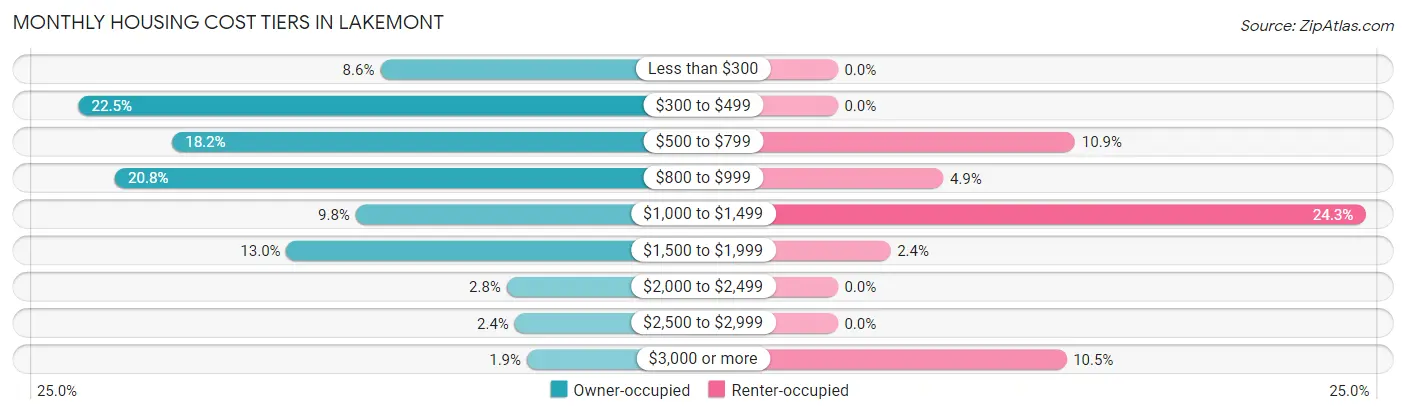
| Monthly Cost | Owner-occupied | Renter-occupied |
| Less than $300 | 46 (8.6%) | 0 (0.0%) |
| $300 to $499 | 120 (22.5%) | 0 (0.0%) |
| $500 to $799 | 97 (18.2%) | 27 (10.9%) |
| $800 to $999 | 111 (20.8%) | 12 (4.9%) |
| $1,000 to $1,499 | 52 (9.8%) | 60 (24.3%) |
| $1,500 to $1,999 | 69 (13.0%) | 6 (2.4%) |
| $2,000 to $2,499 | 15 (2.8%) | 0 (0.0%) |
| $2,500 to $2,999 | 13 (2.4%) | 0 (0.0%) |
| $3,000 or more | 10 (1.9%) | 26 (10.5%) |
| Total | 533 (100.0%) | 247 (100.0%) |
Physical Housing Characteristics in Lakemont
Housing Structures in Lakemont
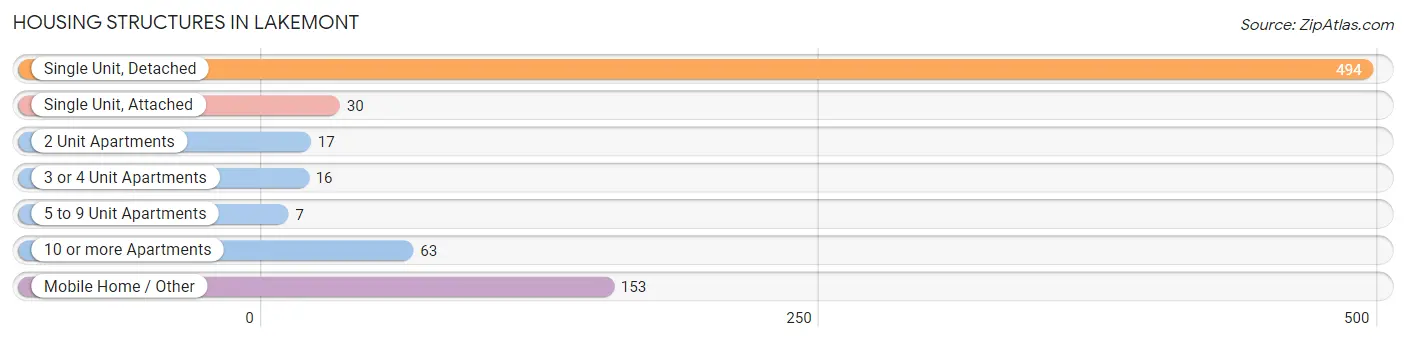
| Structure Type | # Housing Units | % Housing Units |
| Single Unit, Detached | 494 | 63.3% |
| Single Unit, Attached | 30 | 3.8% |
| 2 Unit Apartments | 17 | 2.2% |
| 3 or 4 Unit Apartments | 16 | 2.1% |
| 5 to 9 Unit Apartments | 7 | 0.9% |
| 10 or more Apartments | 63 | 8.1% |
| Mobile Home / Other | 153 | 19.6% |
| Total | 780 | 100.0% |
Housing Structures by Occupancy in Lakemont
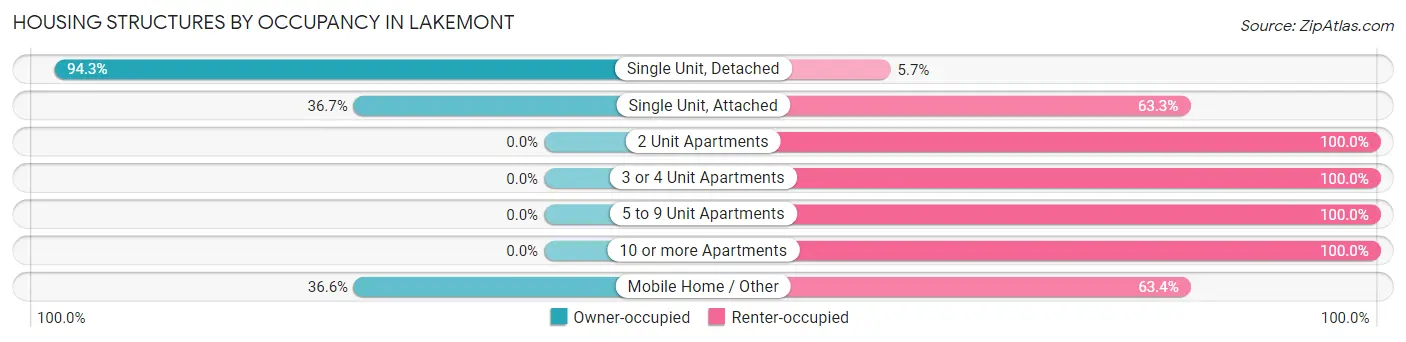
| Structure Type | Owner-occupied | Renter-occupied |
| Single Unit, Detached | 466 (94.3%) | 28 (5.7%) |
| Single Unit, Attached | 11 (36.7%) | 19 (63.3%) |
| 2 Unit Apartments | 0 (0.0%) | 17 (100.0%) |
| 3 or 4 Unit Apartments | 0 (0.0%) | 16 (100.0%) |
| 5 to 9 Unit Apartments | 0 (0.0%) | 7 (100.0%) |
| 10 or more Apartments | 0 (0.0%) | 63 (100.0%) |
| Mobile Home / Other | 56 (36.6%) | 97 (63.4%) |
| Total | 533 (68.3%) | 247 (31.7%) |
Housing Structures by Number of Rooms in Lakemont
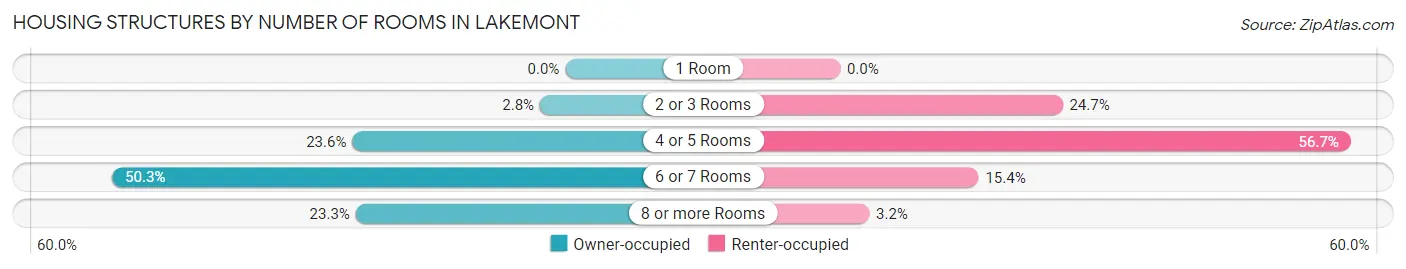
| Number of Rooms | Owner-occupied | Renter-occupied |
| 1 Room | 0 (0.0%) | 0 (0.0%) |
| 2 or 3 Rooms | 15 (2.8%) | 61 (24.7%) |
| 4 or 5 Rooms | 126 (23.6%) | 140 (56.7%) |
| 6 or 7 Rooms | 268 (50.3%) | 38 (15.4%) |
| 8 or more Rooms | 124 (23.3%) | 8 (3.2%) |
| Total | 533 (100.0%) | 247 (100.0%) |
Housing Structure by Heating Type in Lakemont
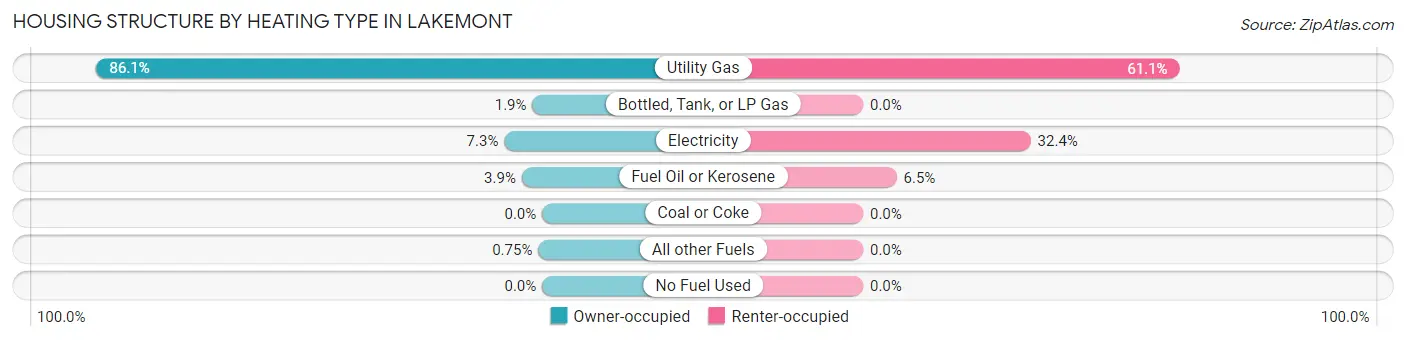
| Heating Type | Owner-occupied | Renter-occupied |
| Utility Gas | 459 (86.1%) | 151 (61.1%) |
| Bottled, Tank, or LP Gas | 10 (1.9%) | 0 (0.0%) |
| Electricity | 39 (7.3%) | 80 (32.4%) |
| Fuel Oil or Kerosene | 21 (3.9%) | 16 (6.5%) |
| Coal or Coke | 0 (0.0%) | 0 (0.0%) |
| All other Fuels | 4 (0.7%) | 0 (0.0%) |
| No Fuel Used | 0 (0.0%) | 0 (0.0%) |
| Total | 533 (100.0%) | 247 (100.0%) |
Household Vehicle Usage in Lakemont
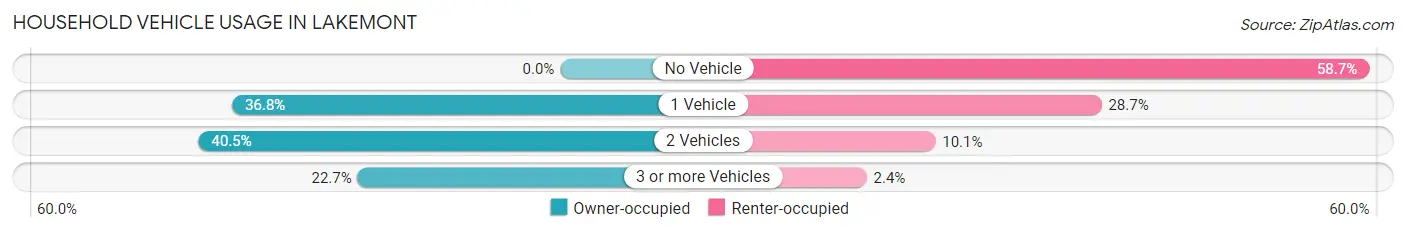
| Vehicles per Household | Owner-occupied | Renter-occupied |
| No Vehicle | 0 (0.0%) | 145 (58.7%) |
| 1 Vehicle | 196 (36.8%) | 71 (28.7%) |
| 2 Vehicles | 216 (40.5%) | 25 (10.1%) |
| 3 or more Vehicles | 121 (22.7%) | 6 (2.4%) |
| Total | 533 (100.0%) | 247 (100.0%) |
Real Estate & Mortgages in Lakemont
Real Estate and Mortgage Overview in Lakemont
| Characteristic | Without Mortgage | With Mortgage |
| Housing Units | 251 | 282 |
| Median Property Value | $103,600 | $160,600 |
| Median Household Income | $42,292 | $51 |
| Monthly Housing Costs | $443 | $10 |
| Real Estate Taxes | $1,288 | $0 |
Property Value by Mortgage Status in Lakemont
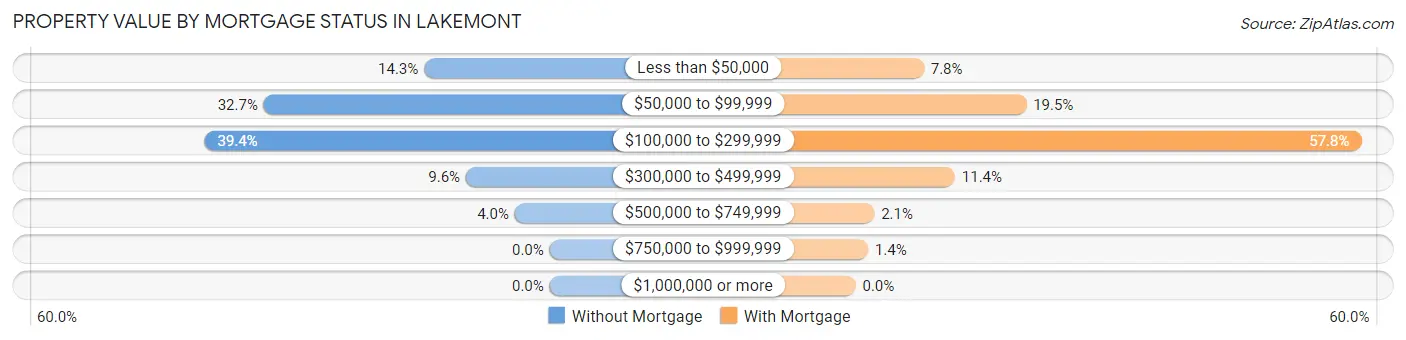
| Property Value | Without Mortgage | With Mortgage |
| Less than $50,000 | 36 (14.3%) | 22 (7.8%) |
| $50,000 to $99,999 | 82 (32.7%) | 55 (19.5%) |
| $100,000 to $299,999 | 99 (39.4%) | 163 (57.8%) |
| $300,000 to $499,999 | 24 (9.6%) | 32 (11.4%) |
| $500,000 to $749,999 | 10 (4.0%) | 6 (2.1%) |
| $750,000 to $999,999 | 0 (0.0%) | 4 (1.4%) |
| $1,000,000 or more | 0 (0.0%) | 0 (0.0%) |
| Total | 251 (100.0%) | 282 (100.0%) |
Household Income by Mortgage Status in Lakemont
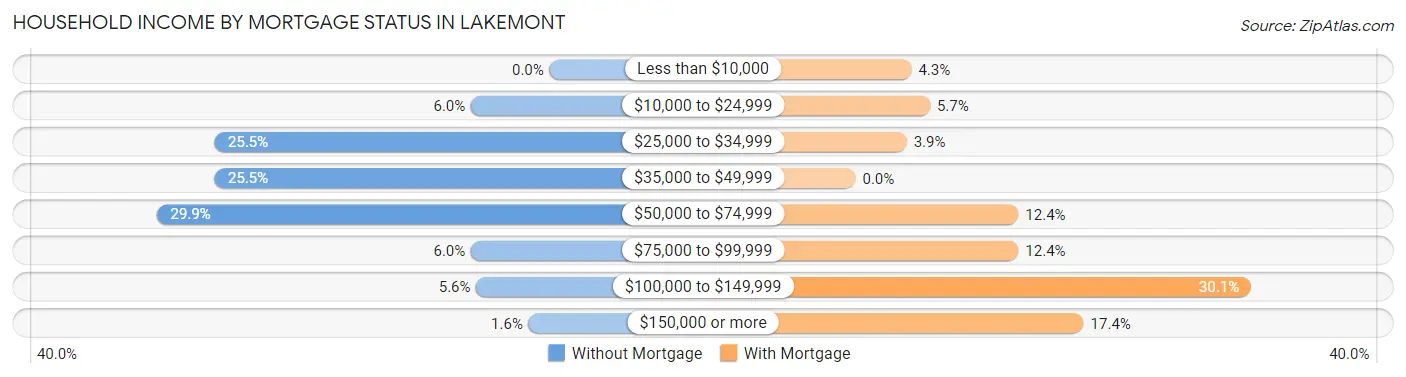
| Household Income | Without Mortgage | With Mortgage |
| Less than $10,000 | 0 (0.0%) | 12 (4.3%) |
| $10,000 to $24,999 | 15 (6.0%) | 16 (5.7%) |
| $25,000 to $34,999 | 64 (25.5%) | 11 (3.9%) |
| $35,000 to $49,999 | 64 (25.5%) | 0 (0.0%) |
| $50,000 to $74,999 | 75 (29.9%) | 35 (12.4%) |
| $75,000 to $99,999 | 15 (6.0%) | 35 (12.4%) |
| $100,000 to $149,999 | 14 (5.6%) | 85 (30.1%) |
| $150,000 or more | 4 (1.6%) | 49 (17.4%) |
| Total | 251 (100.0%) | 282 (100.0%) |
Property Value to Household Income Ratio in Lakemont
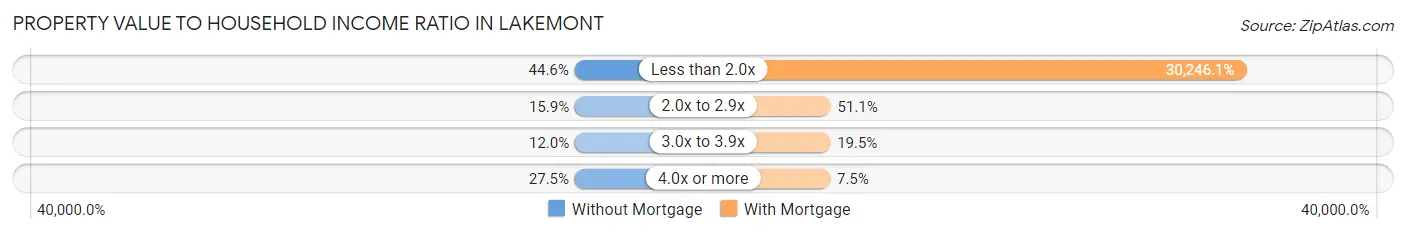
| Value-to-Income Ratio | Without Mortgage | With Mortgage |
| Less than 2.0x | 112 (44.6%) | 85,294 (30,246.1%) |
| 2.0x to 2.9x | 40 (15.9%) | 144 (51.1%) |
| 3.0x to 3.9x | 30 (11.9%) | 55 (19.5%) |
| 4.0x or more | 69 (27.5%) | 21 (7.4%) |
| Total | 251 (100.0%) | 282 (100.0%) |
Real Estate Taxes by Mortgage Status in Lakemont
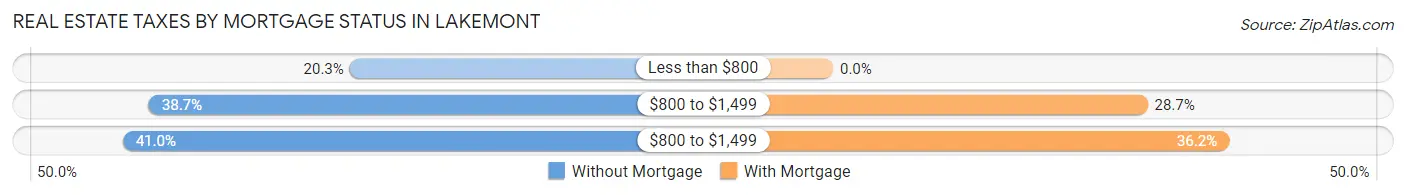
| Property Taxes | Without Mortgage | With Mortgage |
| Less than $800 | 51 (20.3%) | 0 (0.0%) |
| $800 to $1,499 | 97 (38.7%) | 81 (28.7%) |
| $800 to $1,499 | 103 (41.0%) | 102 (36.2%) |
| Total | 251 (100.0%) | 282 (100.0%) |
Health & Disability in Lakemont
Health Insurance Coverage by Age in Lakemont
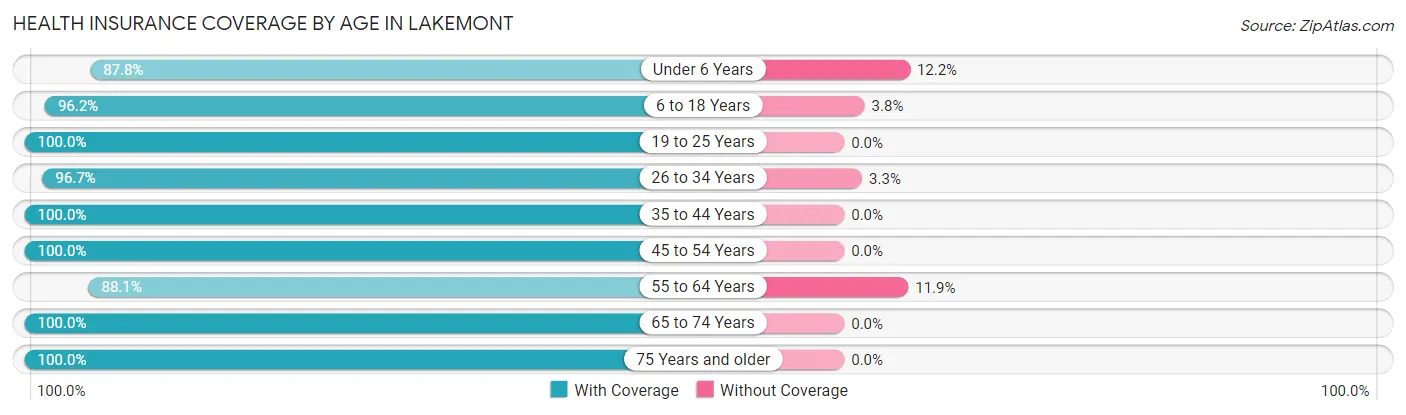
| Age Bracket | With Coverage | Without Coverage |
| Under 6 Years | 43 (87.8%) | 6 (12.2%) |
| 6 to 18 Years | 152 (96.2%) | 6 (3.8%) |
| 19 to 25 Years | 51 (100.0%) | 0 (0.0%) |
| 26 to 34 Years | 116 (96.7%) | 4 (3.3%) |
| 35 to 44 Years | 127 (100.0%) | 0 (0.0%) |
| 45 to 54 Years | 202 (100.0%) | 0 (0.0%) |
| 55 to 64 Years | 192 (88.1%) | 26 (11.9%) |
| 65 to 74 Years | 222 (100.0%) | 0 (0.0%) |
| 75 Years and older | 271 (100.0%) | 0 (0.0%) |
| Total | 1,376 (97.0%) | 42 (3.0%) |
Health Insurance Coverage by Citizenship Status in Lakemont
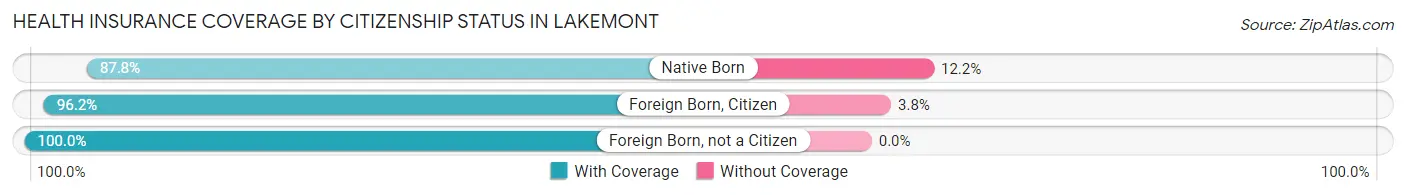
| Citizenship Status | With Coverage | Without Coverage |
| Native Born | 43 (87.8%) | 6 (12.2%) |
| Foreign Born, Citizen | 152 (96.2%) | 6 (3.8%) |
| Foreign Born, not a Citizen | 51 (100.0%) | 0 (0.0%) |
Health Insurance Coverage by Household Income in Lakemont
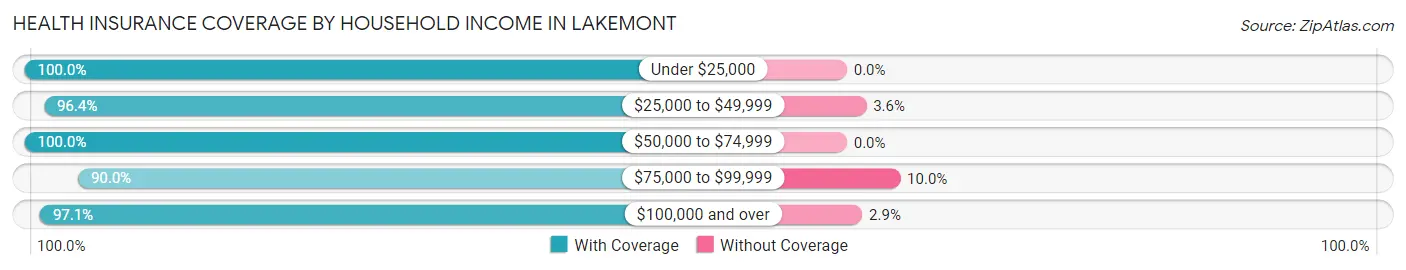
| Household Income | With Coverage | Without Coverage |
| Under $25,000 | 240 (100.0%) | 0 (0.0%) |
| $25,000 to $49,999 | 291 (96.4%) | 11 (3.6%) |
| $50,000 to $74,999 | 269 (100.0%) | 0 (0.0%) |
| $75,000 to $99,999 | 171 (90.0%) | 19 (10.0%) |
| $100,000 and over | 405 (97.1%) | 12 (2.9%) |
Public vs Private Health Insurance Coverage by Age in Lakemont
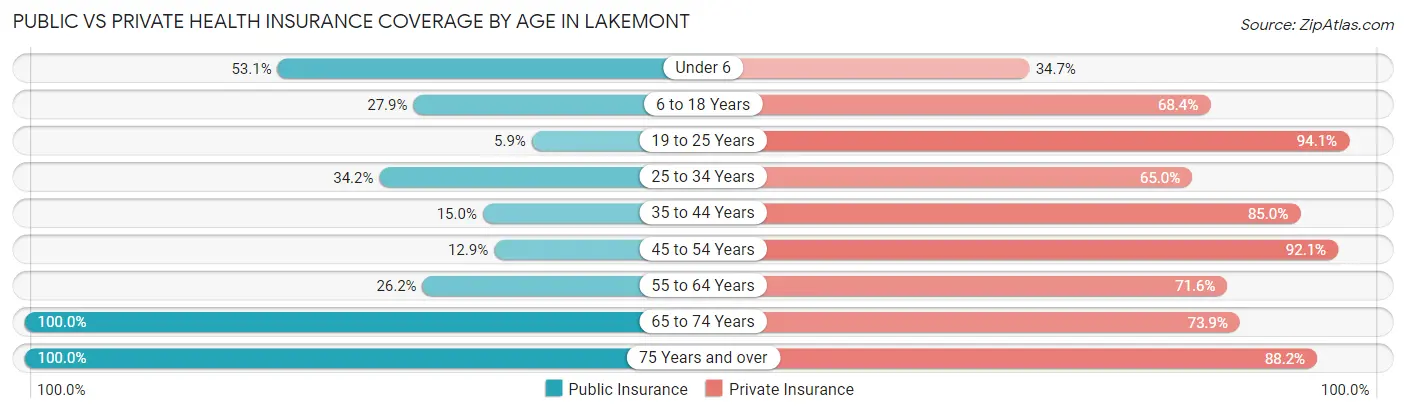
| Age Bracket | Public Insurance | Private Insurance |
| Under 6 | 26 (53.1%) | 17 (34.7%) |
| 6 to 18 Years | 44 (27.9%) | 108 (68.3%) |
| 19 to 25 Years | 3 (5.9%) | 48 (94.1%) |
| 25 to 34 Years | 41 (34.2%) | 78 (65.0%) |
| 35 to 44 Years | 19 (15.0%) | 108 (85.0%) |
| 45 to 54 Years | 26 (12.9%) | 186 (92.1%) |
| 55 to 64 Years | 57 (26.2%) | 156 (71.6%) |
| 65 to 74 Years | 222 (100.0%) | 164 (73.9%) |
| 75 Years and over | 271 (100.0%) | 239 (88.2%) |
| Total | 709 (50.0%) | 1,104 (77.9%) |
Disability Status by Sex by Age in Lakemont
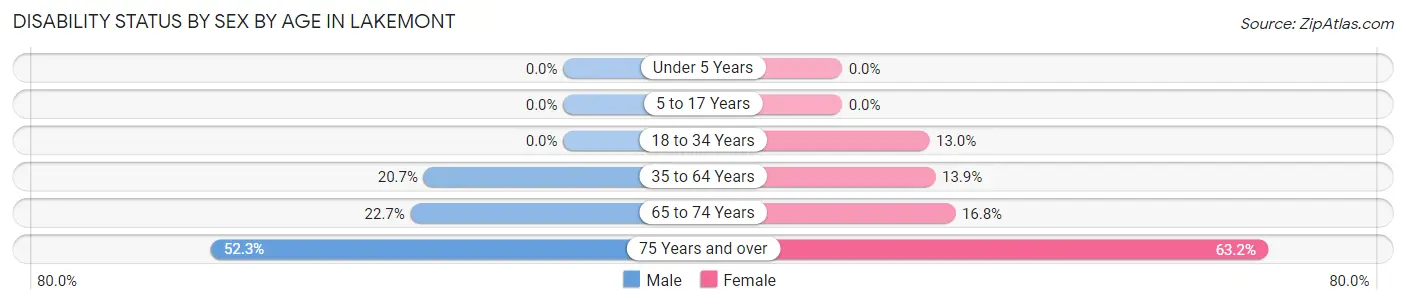
| Age Bracket | Male | Female |
| Under 5 Years | 0 (0.0%) | 0 (0.0%) |
| 5 to 17 Years | 0 (0.0%) | 0 (0.0%) |
| 18 to 34 Years | 0 (0.0%) | 7 (13.0%) |
| 35 to 64 Years | 52 (20.7%) | 41 (13.9%) |
| 65 to 74 Years | 22 (22.7%) | 21 (16.8%) |
| 75 Years and over | 45 (52.3%) | 117 (63.2%) |
Disability Class by Sex by Age in Lakemont
Disability Class: Hearing Difficulty
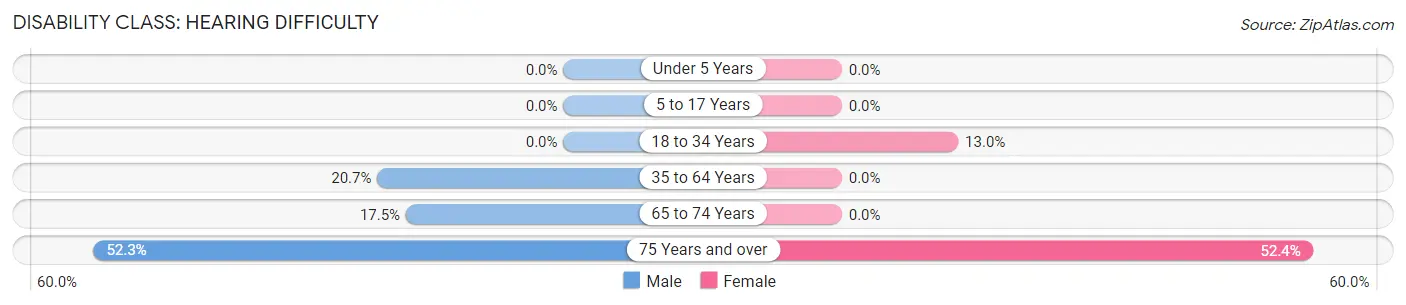
| Age Bracket | Male | Female |
| Under 5 Years | 0 (0.0%) | 0 (0.0%) |
| 5 to 17 Years | 0 (0.0%) | 0 (0.0%) |
| 18 to 34 Years | 0 (0.0%) | 7 (13.0%) |
| 35 to 64 Years | 52 (20.7%) | 0 (0.0%) |
| 65 to 74 Years | 17 (17.5%) | 0 (0.0%) |
| 75 Years and over | 45 (52.3%) | 97 (52.4%) |
Disability Class: Vision Difficulty
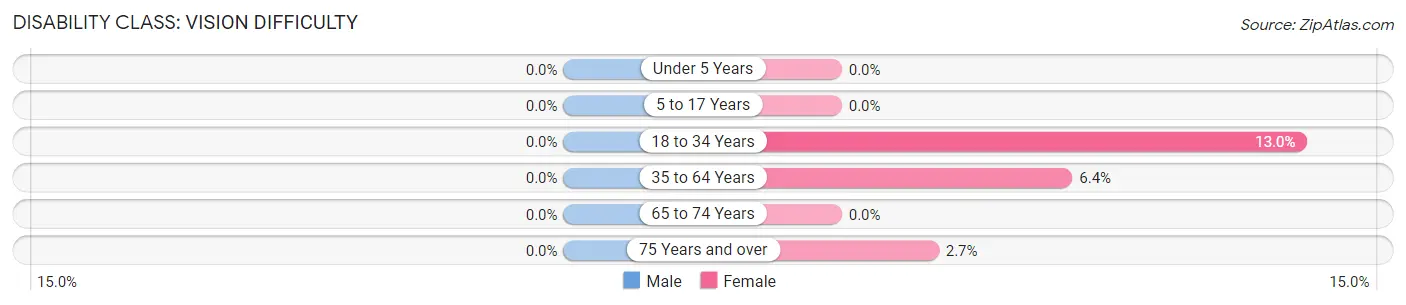
| Age Bracket | Male | Female |
| Under 5 Years | 0 (0.0%) | 0 (0.0%) |
| 5 to 17 Years | 0 (0.0%) | 0 (0.0%) |
| 18 to 34 Years | 0 (0.0%) | 7 (13.0%) |
| 35 to 64 Years | 0 (0.0%) | 19 (6.4%) |
| 65 to 74 Years | 0 (0.0%) | 0 (0.0%) |
| 75 Years and over | 0 (0.0%) | 5 (2.7%) |
Disability Class: Cognitive Difficulty
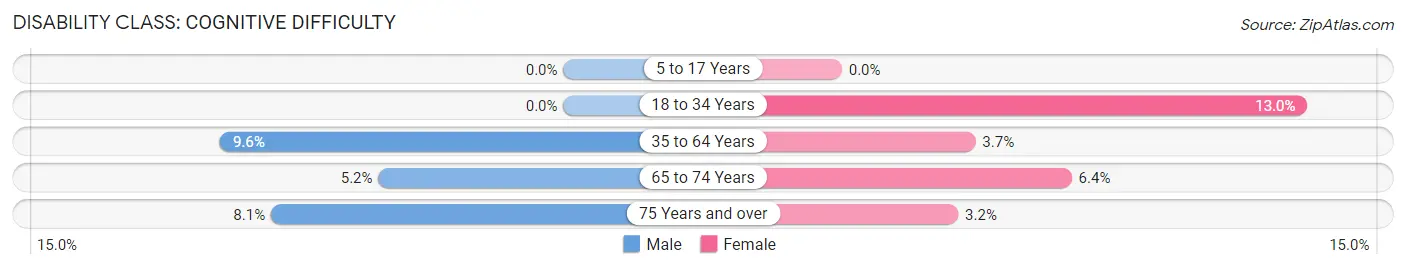
| Age Bracket | Male | Female |
| 5 to 17 Years | 0 (0.0%) | 0 (0.0%) |
| 18 to 34 Years | 0 (0.0%) | 7 (13.0%) |
| 35 to 64 Years | 24 (9.6%) | 11 (3.7%) |
| 65 to 74 Years | 5 (5.1%) | 8 (6.4%) |
| 75 Years and over | 7 (8.1%) | 6 (3.2%) |
Disability Class: Ambulatory Difficulty
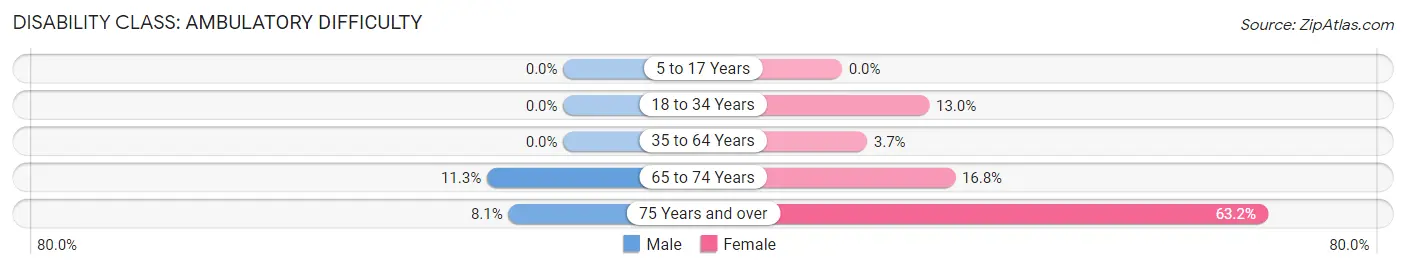
| Age Bracket | Male | Female |
| 5 to 17 Years | 0 (0.0%) | 0 (0.0%) |
| 18 to 34 Years | 0 (0.0%) | 7 (13.0%) |
| 35 to 64 Years | 0 (0.0%) | 11 (3.7%) |
| 65 to 74 Years | 11 (11.3%) | 21 (16.8%) |
| 75 Years and over | 7 (8.1%) | 117 (63.2%) |
Disability Class: Self-Care Difficulty
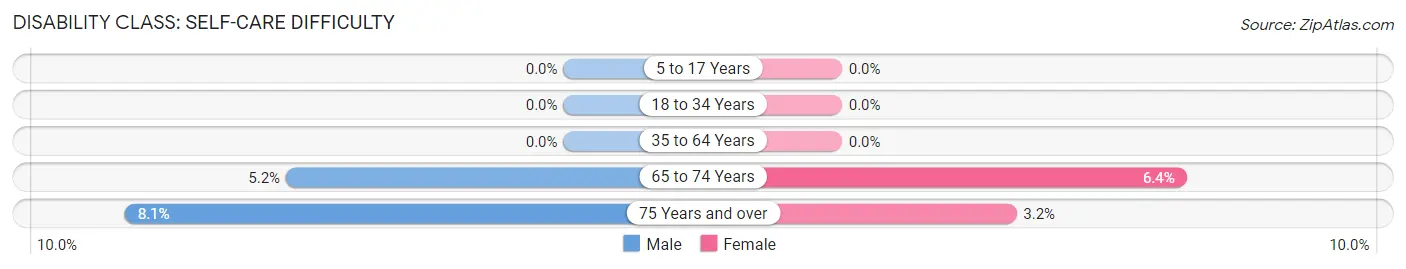
| Age Bracket | Male | Female |
| 5 to 17 Years | 0 (0.0%) | 0 (0.0%) |
| 18 to 34 Years | 0 (0.0%) | 0 (0.0%) |
| 35 to 64 Years | 0 (0.0%) | 0 (0.0%) |
| 65 to 74 Years | 5 (5.1%) | 8 (6.4%) |
| 75 Years and over | 7 (8.1%) | 6 (3.2%) |
Technology Access in Lakemont
Computing Device Access in Lakemont
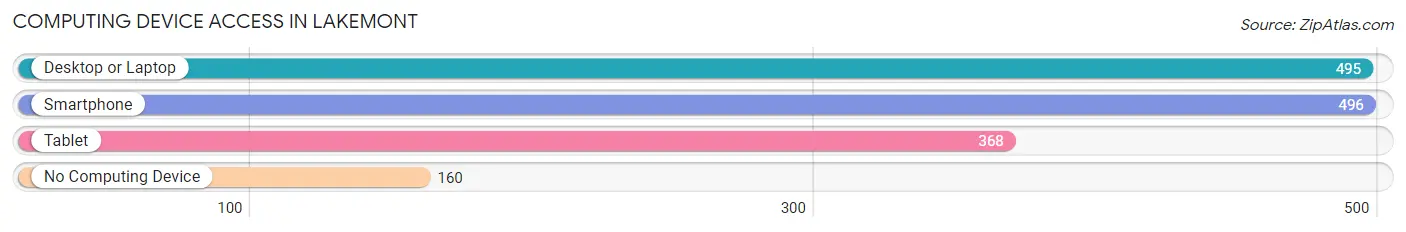
| Device Type | # Households | % Households |
| Desktop or Laptop | 495 | 63.5% |
| Smartphone | 496 | 63.6% |
| Tablet | 368 | 47.2% |
| No Computing Device | 160 | 20.5% |
| Total | 780 | 100.0% |
Internet Access in Lakemont
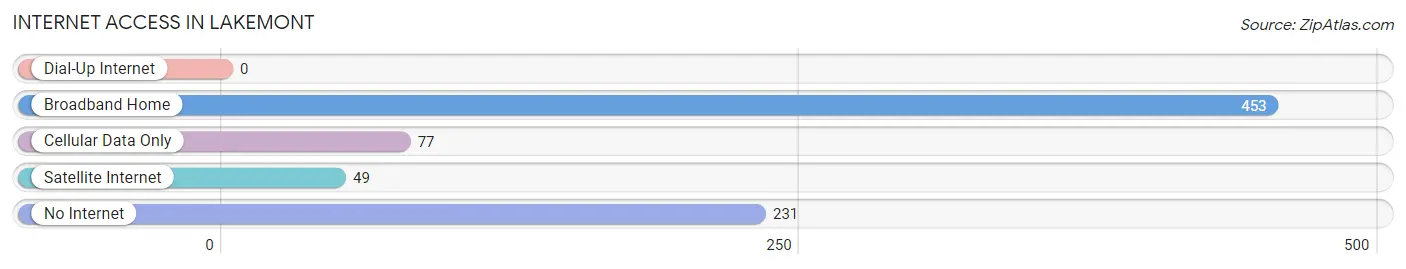
| Internet Type | # Households | % Households |
| Dial-Up Internet | 0 | 0.0% |
| Broadband Home | 453 | 58.1% |
| Cellular Data Only | 77 | 9.9% |
| Satellite Internet | 49 | 6.3% |
| No Internet | 231 | 29.6% |
| Total | 780 | 100.0% |
Lakemont Summary
Lakemont is a small borough located in Blair County, Pennsylvania. It is situated in the foothills of the Allegheny Mountains, approximately five miles east of Altoona. The borough was incorporated in 1891 and has a population of approximately 1,000 people.
History
The area that is now Lakemont was originally inhabited by the Susquehannock Indians. The first European settlers arrived in the area in the late 1700s. The first settler was a man named John Miller, who built a log cabin in the area in 1790. The area was known as Miller’s Settlement until 1891, when it was incorporated as the borough of Lakemont.
The name “Lakemont” was chosen to reflect the presence of a small lake in the area. The lake was created by a dam built in 1845 by the Pennsylvania Canal Company. The lake was used to power a grist mill and a saw mill. The lake was also used for recreational purposes, and it was a popular spot for swimming and fishing.
The borough of Lakemont grew slowly over the years. In the late 1800s, the area was home to several small businesses, including a general store, a blacksmith shop, and a hotel. The first school in the area was built in 1891. In the early 1900s, the borough was home to several churches, a post office, and a trolley line.
Geography
Lakemont is located in the foothills of the Allegheny Mountains in central Pennsylvania. The borough is situated in a valley between two mountain ridges. The area is characterized by rolling hills and lush forests. The borough is located approximately five miles east of Altoona and is bordered by the boroughs of Bellwood and Tyrone.
The climate in Lakemont is humid continental, with cold winters and warm summers. The average annual temperature is around 50 degrees Fahrenheit. The average annual precipitation is around 40 inches.
Economy
The economy of Lakemont is largely based on tourism. The borough is home to several attractions, including the Lakemont Park amusement park, the Horseshoe Curve National Historic Landmark, and the Altoona Railroaders Museum. The borough is also home to several restaurants, shops, and other businesses.
The borough is also home to several manufacturing companies, including a paper mill and a plastics factory. The borough is also home to several small businesses, including a grocery store, a hardware store, and a pharmacy.
Demographics
As of the 2010 census, the population of Lakemont was 1,000 people. The racial makeup of the borough was 97.2% White, 0.7% African American, 0.3% Native American, 0.3% Asian, and 1.5% from other races. The median household income was $37,500, and the median family income was $45,000.
The population of Lakemont is largely Christian, with the majority of residents belonging to the Roman Catholic Church. The borough is also home to several other religious denominations, including the United Methodist Church, the Presbyterian Church, and the Lutheran Church.
Conclusion
Lakemont is a small borough located in Blair County, Pennsylvania. It is situated in the foothills of the Allegheny Mountains, approximately five miles east of Altoona. The borough was incorporated in 1891 and has a population of approximately 1,000 people. The economy of Lakemont is largely based on tourism, and the borough is home to several attractions, including the Lakemont Park amusement park, the Horseshoe Curve National Historic Landmark, and the Altoona Railroaders Museum. The population of Lakemont is largely Christian, with the majority of residents belonging to the Roman Catholic Church.
Common Questions
What is Per Capita Income in Lakemont?
Per Capita income in Lakemont is $32,664.
What is the Median Family Income in Lakemont?
Median Family Income in Lakemont is $64,758.
What is the Median Household income in Lakemont?
Median Household Income in Lakemont is $46,840.
What is Income or Wage Gap in Lakemont?
Income or Wage Gap in Lakemont is 8.0%.
Women in Lakemont earn 92.0 cents for every dollar earned by a man.
What is Inequality or Gini Index in Lakemont?
Inequality or Gini Index in Lakemont is 0.46.
What is the Total Population of Lakemont?
Total Population of Lakemont is 1,511.
What is the Total Male Population of Lakemont?
Total Male Population of Lakemont is 623.
What is the Total Female Population of Lakemont?
Total Female Population of Lakemont is 888.
What is the Ratio of Males per 100 Females in Lakemont?
There are 70.16 Males per 100 Females in Lakemont.
What is the Ratio of Females per 100 Males in Lakemont?
There are 142.54 Females per 100 Males in Lakemont.
What is the Median Population Age in Lakemont?
Median Population Age in Lakemont is 56.3 Years.
What is the Average Family Size in Lakemont
Average Family Size in Lakemont is 2.6 People.
What is the Average Household Size in Lakemont
Average Household Size in Lakemont is 1.8 People.
How Large is the Labor Force in Lakemont?
There are 746 People in the Labor Forcein in Lakemont.
What is the Percentage of People in the Labor Force in Lakemont?
55.7% of People are in the Labor Force in Lakemont.
What is the Unemployment Rate in Lakemont?
Unemployment Rate in Lakemont is 5.7%.