North Lawrence, OH Map & Demographics
North Lawrence Map
North Lawrence Overview
$83,778
PER CAPITA INCOME
$71,563
AVG FAMILY INCOME
$72,188
AVG HOUSEHOLD INCOME
41.7%
WAGE / INCOME GAP [ % ]
58.3¢/ $1
WAGE / INCOME GAP [ $ ]
0.55
INEQUALITY / GINI INDEX
133
TOTAL POPULATION
77
MALE POPULATION
56
FEMALE POPULATION
137.50
MALES / 100 FEMALES
72.73
FEMALES / 100 MALES
45.5
MEDIAN AGE
2.1
AVG FAMILY SIZE
2.0
AVG HOUSEHOLD SIZE
97
LABOR FORCE [ PEOPLE ]
72.9%
PERCENT IN LABOR FORCE
North Lawrence Zip Codes
North Lawrence Area Codes
Income in North Lawrence
Income Overview in North Lawrence
Per Capita Income in North Lawrence is $83,778, while median incomes of families and households are $71,563 and $72,188 respectively.
| Characteristic | Number | Measure |
| Per Capita Income | 133 | $83,778 |
| Median Family Income | 48 | $71,563 |
| Mean Family Income | 48 | $68,777 |
| Median Household Income | 68 | $72,188 |
| Mean Household Income | 68 | $155,319 |
| Income Deficit | 48 | $0 |
| Wage / Income Gap (%) | 133 | 41.67% |
| Wage / Income Gap ($) | 133 | 58.33¢ per $1 |
| Gini / Inequality Index | 133 | 0.55 |
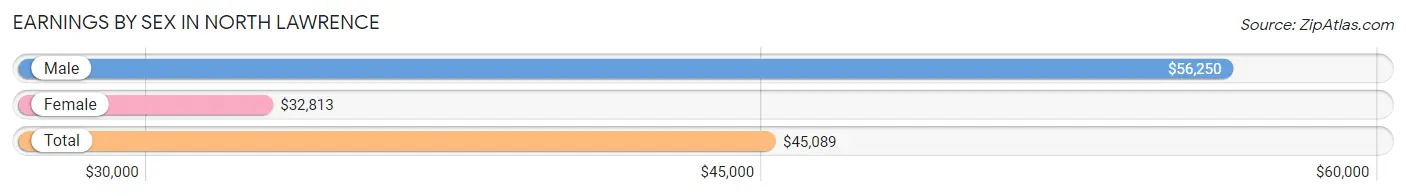
Earnings by Sex in North Lawrence
Average Earnings in North Lawrence are $45,089, $56,250 for men and $32,813 for women, a difference of 41.7%.
| Sex | Number | Average Earnings |
| Male | 62 (63.9%) | $56,250 |
| Female | 35 (36.1%) | $32,813 |
| Total | 97 (100.0%) | $45,089 |
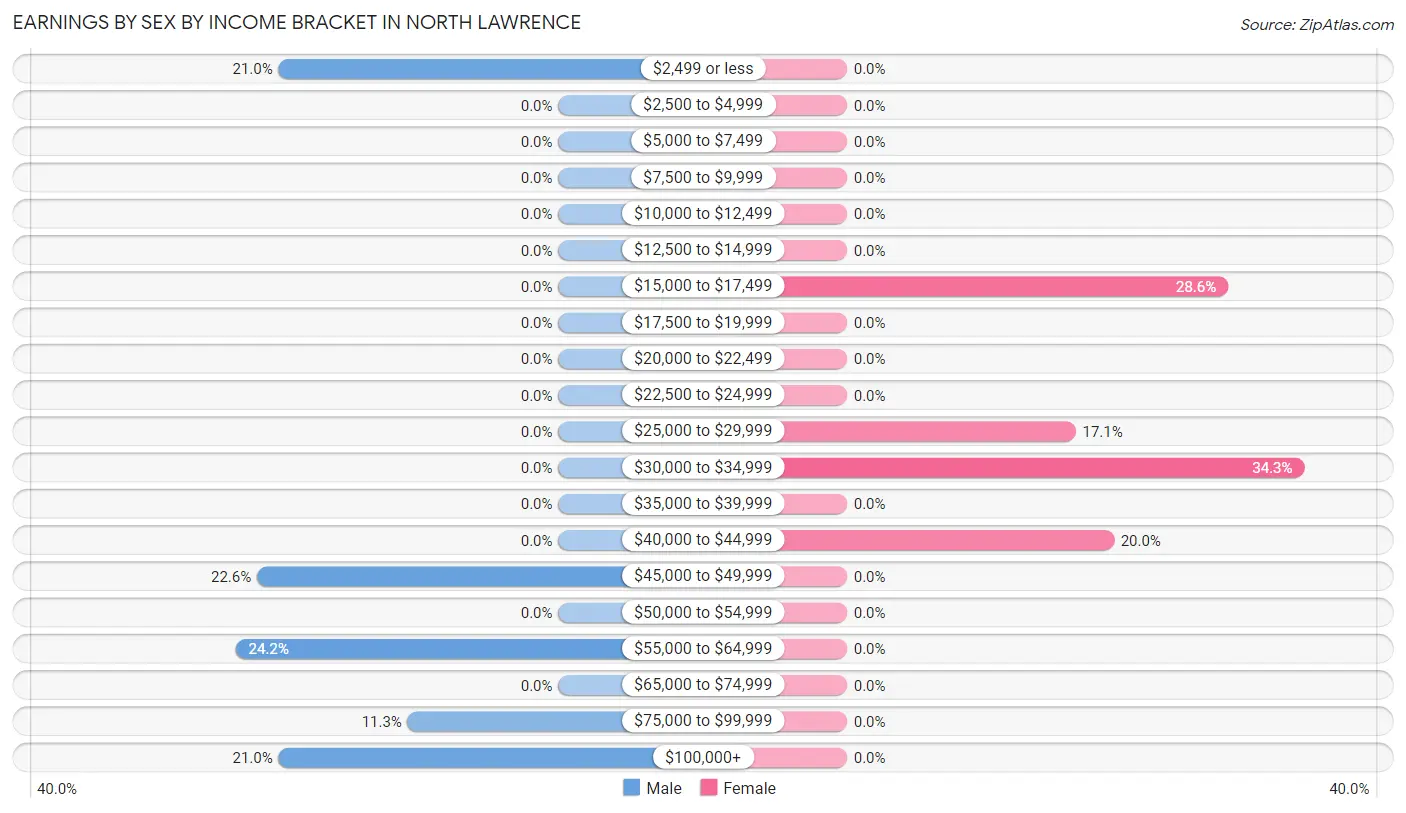
Earnings by Sex by Income Bracket in North Lawrence
The most common earnings brackets in North Lawrence are $55,000 to $64,999 for men (15 | 24.2%) and $30,000 to $34,999 for women (12 | 34.3%).
| Income | Male | Female |
| $2,499 or less | 13 (21.0%) | 0 (0.0%) |
| $2,500 to $4,999 | 0 (0.0%) | 0 (0.0%) |
| $5,000 to $7,499 | 0 (0.0%) | 0 (0.0%) |
| $7,500 to $9,999 | 0 (0.0%) | 0 (0.0%) |
| $10,000 to $12,499 | 0 (0.0%) | 0 (0.0%) |
| $12,500 to $14,999 | 0 (0.0%) | 0 (0.0%) |
| $15,000 to $17,499 | 0 (0.0%) | 10 (28.6%) |
| $17,500 to $19,999 | 0 (0.0%) | 0 (0.0%) |
| $20,000 to $22,499 | 0 (0.0%) | 0 (0.0%) |
| $22,500 to $24,999 | 0 (0.0%) | 0 (0.0%) |
| $25,000 to $29,999 | 0 (0.0%) | 6 (17.1%) |
| $30,000 to $34,999 | 0 (0.0%) | 12 (34.3%) |
| $35,000 to $39,999 | 0 (0.0%) | 0 (0.0%) |
| $40,000 to $44,999 | 0 (0.0%) | 7 (20.0%) |
| $45,000 to $49,999 | 14 (22.6%) | 0 (0.0%) |
| $50,000 to $54,999 | 0 (0.0%) | 0 (0.0%) |
| $55,000 to $64,999 | 15 (24.2%) | 0 (0.0%) |
| $65,000 to $74,999 | 0 (0.0%) | 0 (0.0%) |
| $75,000 to $99,999 | 7 (11.3%) | 0 (0.0%) |
| $100,000+ | 13 (21.0%) | 0 (0.0%) |
| Total | 62 (100.0%) | 35 (100.0%) |
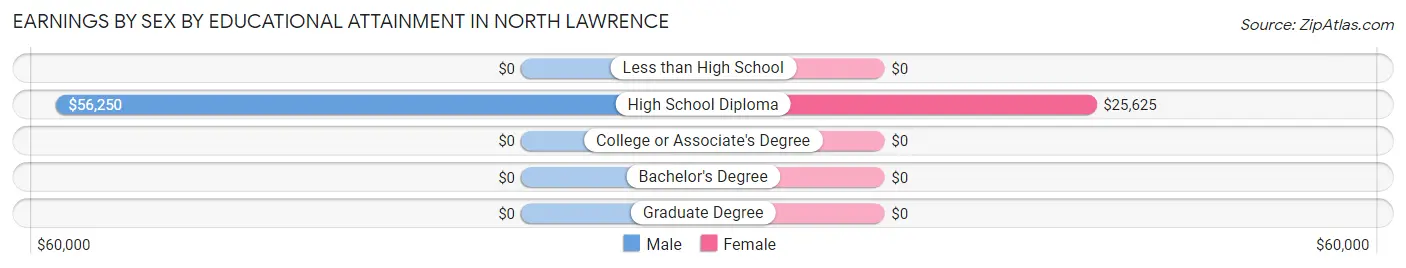
Earnings by Sex by Educational Attainment in North Lawrence
Average earnings in North Lawrence are $56,250 for men and $32,813 for women, a difference of 41.7%. Men with an educational attainment of high school diploma enjoy the highest average annual earnings of $56,250, while those with high school diploma education earn the least with $56,250. Women with an educational attainment of high school diploma earn the most with the average annual earnings of $25,625, while those with high school diploma education have the smallest earnings of $25,625.
| Educational Attainment | Male Income | Female Income |
| Less than High School | - | - |
| High School Diploma | $56,250 | $25,625 |
| College or Associate's Degree | - | - |
| Bachelor's Degree | - | - |
| Graduate Degree | - | - |
| Total | $56,250 | $32,813 |
Family Income in North Lawrence
Family Income Brackets in North Lawrence
According to the North Lawrence family income data, there are 19 families falling into the $35,000 to $49,999 income range, which is the most common income bracket and makes up 39.6% of all families.
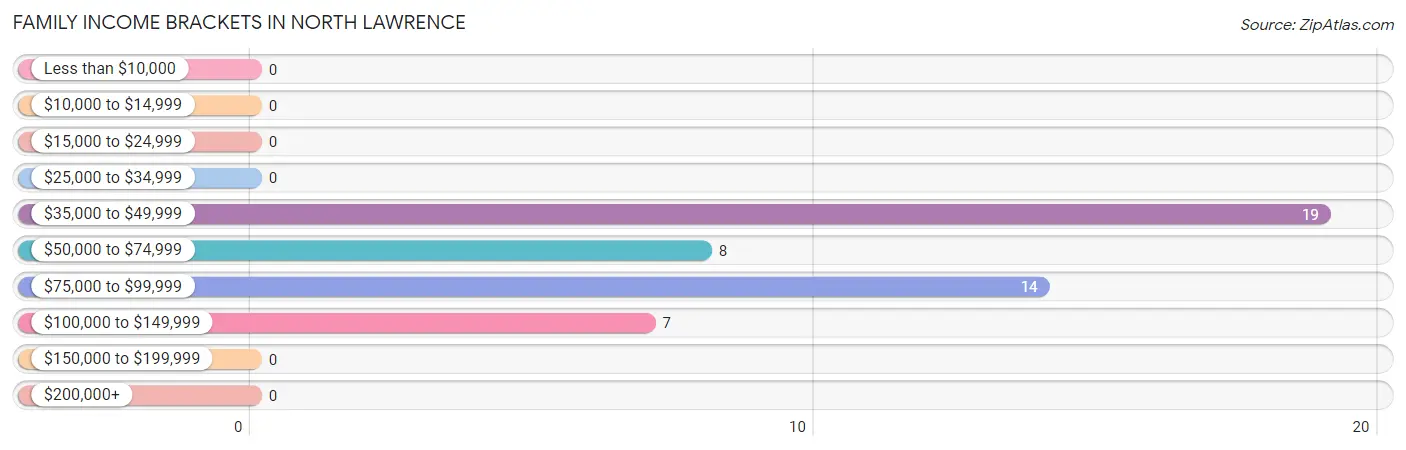
| Income Bracket | # Families | % Families |
| Less than $10,000 | 0 | 0.0% |
| $10,000 to $14,999 | 0 | 0.0% |
| $15,000 to $24,999 | 0 | 0.0% |
| $25,000 to $34,999 | 0 | 0.0% |
| $35,000 to $49,999 | 19 | 39.6% |
| $50,000 to $74,999 | 8 | 16.7% |
| $75,000 to $99,999 | 14 | 29.2% |
| $100,000 to $149,999 | 7 | 14.6% |
| $150,000 to $199,999 | 0 | 0.0% |
| $200,000+ | 0 | 0.0% |
Family Income by Famaliy Size in North Lawrence
2-person families (48 | 100.0%) account for the highest median family income in North Lawrence with $71,563 per family, while 2-person families (48 | 100.0%) have the highest median income of $35,782 per family member.
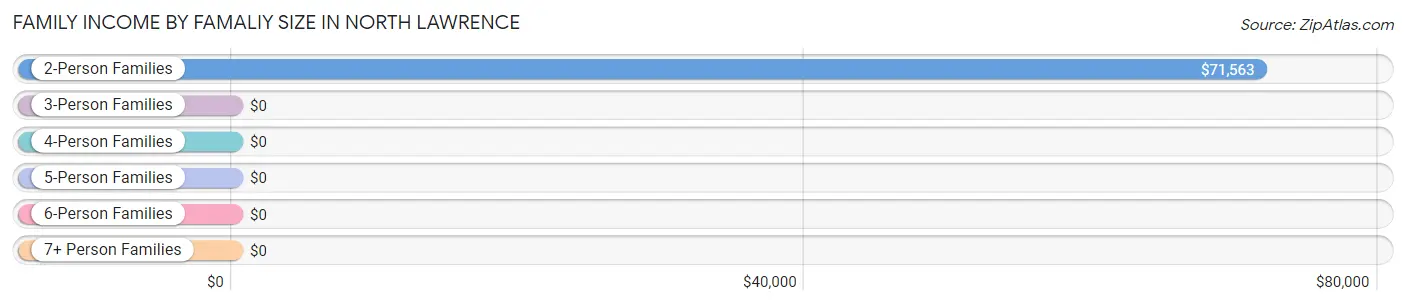
| Income Bracket | # Families | Median Income |
| 2-Person Families | 48 (100.0%) | $71,563 |
| 3-Person Families | 0 (0.0%) | $0 |
| 4-Person Families | 0 (0.0%) | $0 |
| 5-Person Families | 0 (0.0%) | $0 |
| 6-Person Families | 0 (0.0%) | $0 |
| 7+ Person Families | 0 (0.0%) | $0 |
| Total | 48 (100.0%) | $71,563 |
Family Income by Number of Earners in North Lawrence
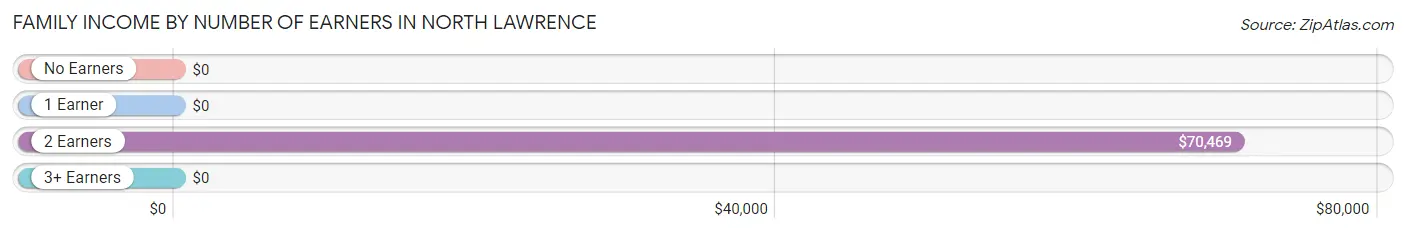
| Number of Earners | # Families | Median Income |
| No Earners | 14 (29.2%) | $0 |
| 1 Earner | 7 (14.6%) | $0 |
| 2 Earners | 27 (56.2%) | $70,469 |
| 3+ Earners | 0 (0.0%) | $0 |
| Total | 48 (100.0%) | $71,563 |
Household Income in North Lawrence
Household Income Brackets in North Lawrence
With 21 households falling in the category, the $35,000 to $49,999 income range is the most frequent in North Lawrence, accounting for 30.9% of all households.
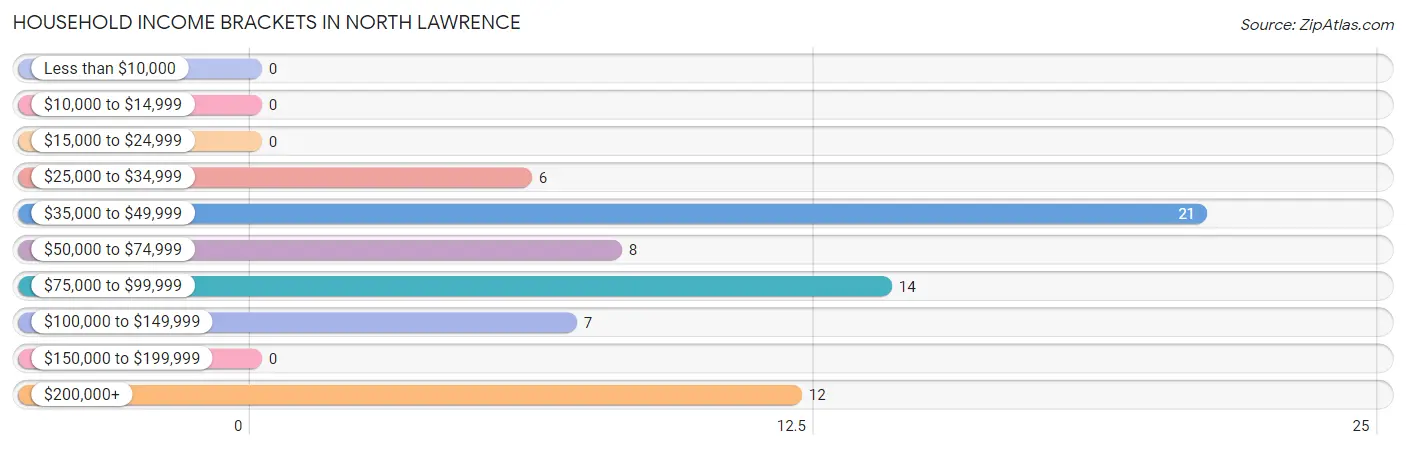
| Income Bracket | # Households | % Households |
| Less than $10,000 | 0 | 0.0% |
| $10,000 to $14,999 | 0 | 0.0% |
| $15,000 to $24,999 | 0 | 0.0% |
| $25,000 to $34,999 | 6 | 8.8% |
| $35,000 to $49,999 | 21 | 30.9% |
| $50,000 to $74,999 | 8 | 11.8% |
| $75,000 to $99,999 | 14 | 20.6% |
| $100,000 to $149,999 | 7 | 10.3% |
| $150,000 to $199,999 | 0 | 0.0% |
| $200,000+ | 12 | 17.6% |
Household Income by Householder Age in North Lawrence
| Income Bracket | # Households | Median Income |
| 15 to 24 Years | 0 (0.0%) | $0 |
| 25 to 44 Years | 22 (32.4%) | $0 |
| 45 to 64 Years | 32 (47.1%) | $0 |
| 65+ Years | 14 (20.6%) | $0 |
| Total | 68 (100.0%) | $72,188 |
Poverty in North Lawrence
Income Below Poverty by Sex and Age in North Lawrence
| Age Bracket | Male | Female |
| Under 5 Years | 0 (0.0%) | 0 (0.0%) |
| 5 Years | 0 (0.0%) | 0 (0.0%) |
| 6 to 11 Years | 0 (0.0%) | 0 (0.0%) |
| 12 to 14 Years | 0 (0.0%) | 0 (0.0%) |
| 15 Years | 0 (0.0%) | 0 (0.0%) |
| 16 and 17 Years | 0 (0.0%) | 0 (0.0%) |
| 18 to 24 Years | 0 (0.0%) | 0 (0.0%) |
| 25 to 34 Years | 0 (0.0%) | 0 (0.0%) |
| 35 to 44 Years | 0 (0.0%) | 0 (0.0%) |
| 45 to 54 Years | 0 (0.0%) | 0 (0.0%) |
| 55 to 64 Years | 0 (0.0%) | 0 (0.0%) |
| 65 to 74 Years | 0 (0.0%) | 0 (0.0%) |
| 75 Years and over | 0 (0.0%) | 0 (0.0%) |
| Total | 0 (0.0%) | 0 (0.0%) |
Income Above Poverty by Sex and Age in North Lawrence
According to the poverty statistics in North Lawrence, males aged 16 and 17 years and females aged 25 to 34 years are the age groups that are most secure financially, with 100.0% of males and 100.0% of females in these age groups living above the poverty line.
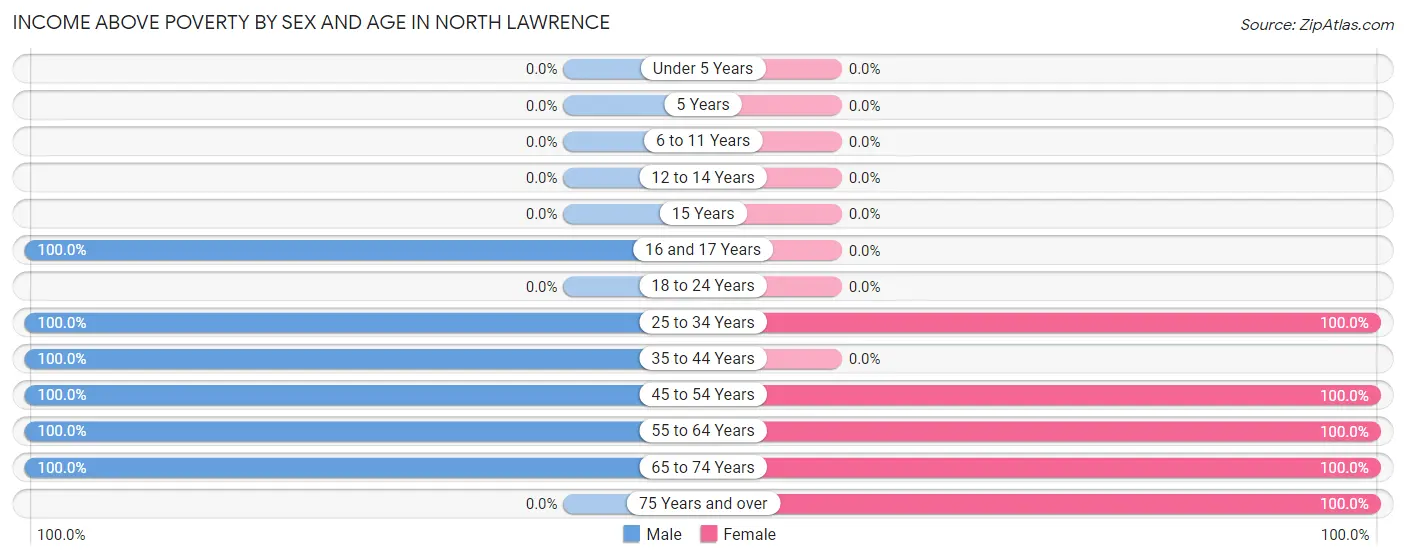
| Age Bracket | Male | Female |
| Under 5 Years | 0 (0.0%) | 0 (0.0%) |
| 5 Years | 0 (0.0%) | 0 (0.0%) |
| 6 to 11 Years | 0 (0.0%) | 0 (0.0%) |
| 12 to 14 Years | 0 (0.0%) | 0 (0.0%) |
| 15 Years | 0 (0.0%) | 0 (0.0%) |
| 16 and 17 Years | 8 (100.0%) | 0 (0.0%) |
| 18 to 24 Years | 0 (0.0%) | 0 (0.0%) |
| 25 to 34 Years | 21 (100.0%) | 10 (100.0%) |
| 35 to 44 Years | 14 (100.0%) | 0 (0.0%) |
| 45 to 54 Years | 20 (100.0%) | 12 (100.0%) |
| 55 to 64 Years | 7 (100.0%) | 13 (100.0%) |
| 65 to 74 Years | 7 (100.0%) | 14 (100.0%) |
| 75 Years and over | 0 (0.0%) | 7 (100.0%) |
| Total | 77 (100.0%) | 56 (100.0%) |
Income Below Poverty Among Married-Couple Families in North Lawrence
| Children | Above Poverty | Below Poverty |
| No Children | 22 (100.0%) | 0 (0.0%) |
| 1 or 2 Children | 0 (0.0%) | 0 (0.0%) |
| 3 or 4 Children | 0 (0.0%) | 0 (0.0%) |
| 5 or more Children | 0 (0.0%) | 0 (0.0%) |
| Total | 22 (100.0%) | 0 (0.0%) |
Income Below Poverty Among Single-Parent Households in North Lawrence
| Children | Single Father | Single Mother |
| No Children | 0 (0.0%) | 0 (0.0%) |
| 1 or 2 Children | 0 (0.0%) | 0 (0.0%) |
| 3 or 4 Children | 0 (0.0%) | 0 (0.0%) |
| 5 or more Children | 0 (0.0%) | 0 (0.0%) |
| Total | 0 (0.0%) | 0 (0.0%) |
Income Below Poverty Among Married-Couple vs Single-Parent Households in North Lawrence
| Children | Married-Couple Families | Single-Parent Households |
| No Children | 0 (0.0%) | 0 (0.0%) |
| 1 or 2 Children | 0 (0.0%) | 0 (0.0%) |
| 3 or 4 Children | 0 (0.0%) | 0 (0.0%) |
| 5 or more Children | 0 (0.0%) | 0 (0.0%) |
| Total | 0 (0.0%) | 0 (0.0%) |
Race in North Lawrence
The most populous races in North Lawrence are White / Caucasian (119 | 89.5%), Hispanic or Latino (29 | 21.8%), and Some other Race (14 | 10.5%).
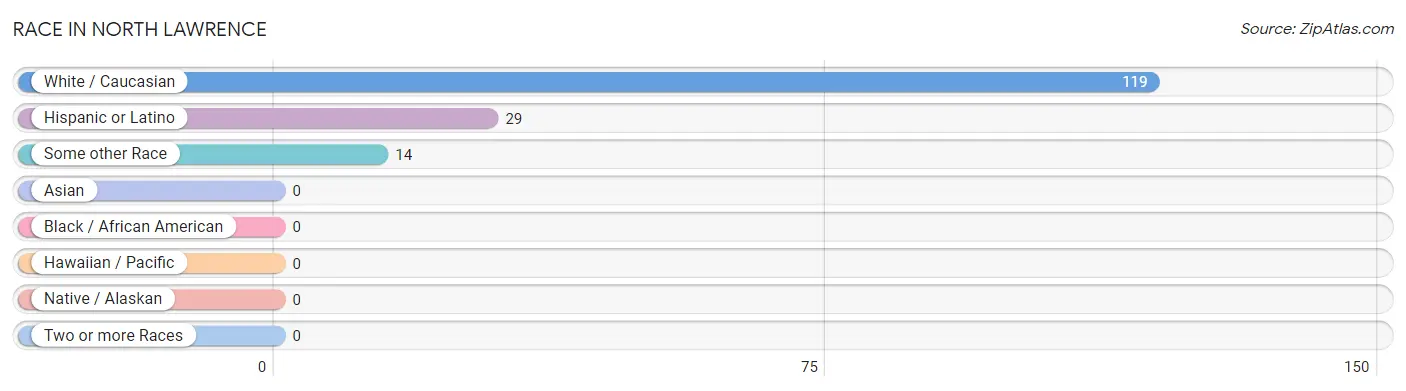
| Race | # Population | % Population |
| Asian | 0 | 0.0% |
| Black / African American | 0 | 0.0% |
| Hawaiian / Pacific | 0 | 0.0% |
| Hispanic or Latino | 29 | 21.8% |
| Native / Alaskan | 0 | 0.0% |
| White / Caucasian | 119 | 89.5% |
| Two or more Races | 0 | 0.0% |
| Some other Race | 14 | 10.5% |
| Total | 133 | 100.0% |
Ancestry in North Lawrence
The most populous ancestries reported in North Lawrence are German (29 | 21.8%), Italian (15 | 11.3%), English (14 | 10.5%), Irish (14 | 10.5%), and Danish (6 | 4.5%), together accounting for 58.7% of all North Lawrence residents.
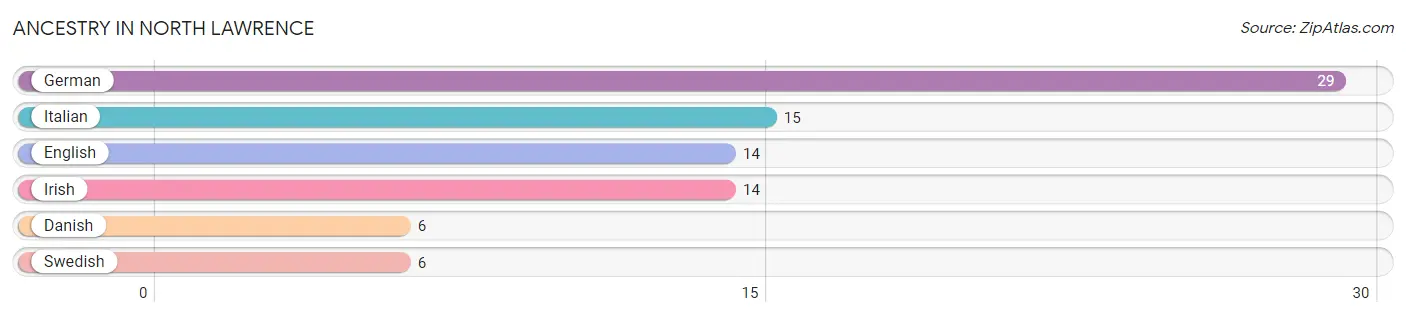
| Ancestry | # Population | % Population |
| Danish | 6 | 4.5% |
| English | 14 | 10.5% |
| German | 29 | 21.8% |
| Irish | 14 | 10.5% |
| Italian | 15 | 11.3% |
| Swedish | 6 | 4.5% | View All 6 Rows |
Immigrants in North Lawrence

| Immigration Origin | # Population | % Population | View All 0 Rows |
Sex and Age in North Lawrence
Sex and Age in North Lawrence
The most populous age groups in North Lawrence are 40 to 44 Years (14 | 18.2%) for men and 55 to 59 Years (13 | 23.2%) for women.
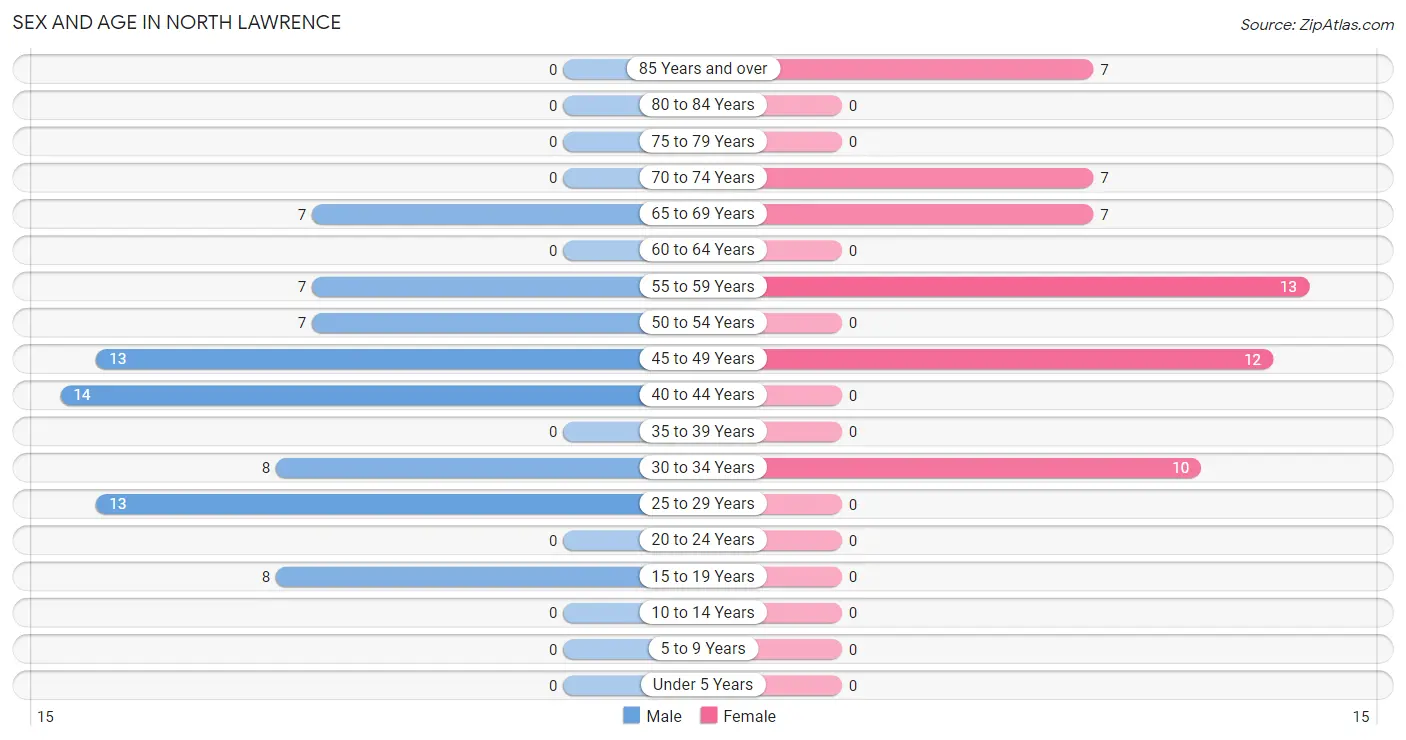
| Age Bracket | Male | Female |
| Under 5 Years | 0 (0.0%) | 0 (0.0%) |
| 5 to 9 Years | 0 (0.0%) | 0 (0.0%) |
| 10 to 14 Years | 0 (0.0%) | 0 (0.0%) |
| 15 to 19 Years | 8 (10.4%) | 0 (0.0%) |
| 20 to 24 Years | 0 (0.0%) | 0 (0.0%) |
| 25 to 29 Years | 13 (16.9%) | 0 (0.0%) |
| 30 to 34 Years | 8 (10.4%) | 10 (17.9%) |
| 35 to 39 Years | 0 (0.0%) | 0 (0.0%) |
| 40 to 44 Years | 14 (18.2%) | 0 (0.0%) |
| 45 to 49 Years | 13 (16.9%) | 12 (21.4%) |
| 50 to 54 Years | 7 (9.1%) | 0 (0.0%) |
| 55 to 59 Years | 7 (9.1%) | 13 (23.2%) |
| 60 to 64 Years | 0 (0.0%) | 0 (0.0%) |
| 65 to 69 Years | 7 (9.1%) | 7 (12.5%) |
| 70 to 74 Years | 0 (0.0%) | 7 (12.5%) |
| 75 to 79 Years | 0 (0.0%) | 0 (0.0%) |
| 80 to 84 Years | 0 (0.0%) | 0 (0.0%) |
| 85 Years and over | 0 (0.0%) | 7 (12.5%) |
| Total | 77 (100.0%) | 56 (100.0%) |
Families and Households in North Lawrence
Median Family Size in North Lawrence
The median family size in North Lawrence is 2.08 persons per family, with single male/father families (7 | 14.6%) accounting for the largest median family size of 2.14 persons per family. On the other hand, single female/mother families (19 | 39.6%) represent the smallest median family size with 2.05 persons per family.
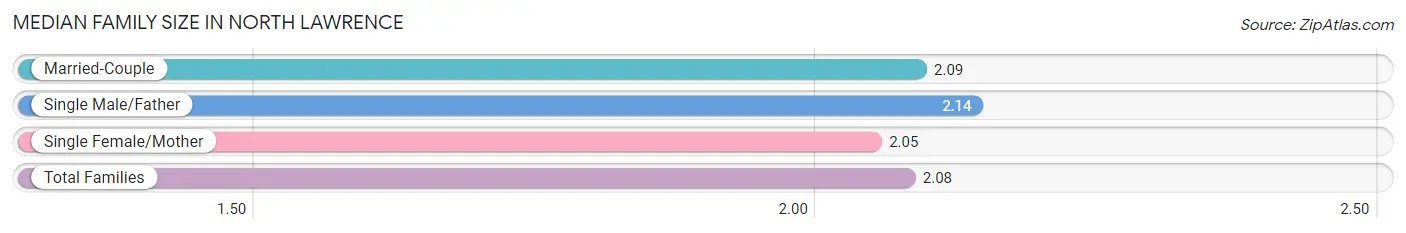
| Family Type | # Families | Family Size |
| Married-Couple | 22 (45.8%) | 2.09 |
| Single Male/Father | 7 (14.6%) | 2.14 |
| Single Female/Mother | 19 (39.6%) | 2.05 |
| Total Families | 48 (100.0%) | 2.08 |
Median Household Size in North Lawrence
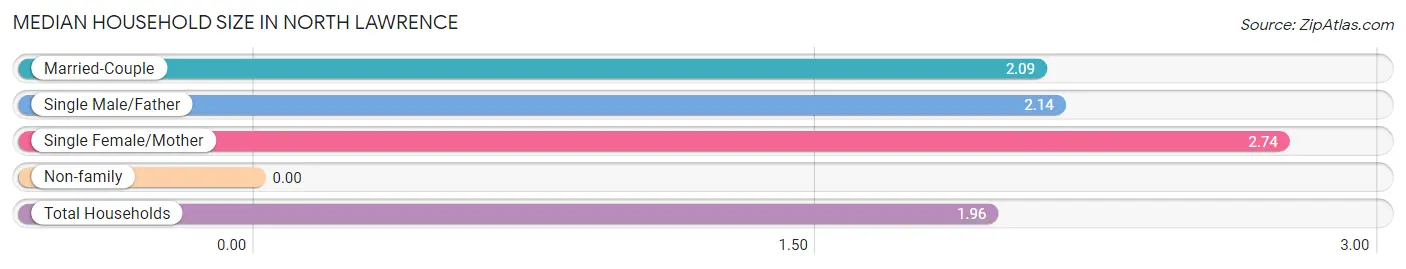
| Household Type | # Households | Household Size |
| Married-Couple | 22 (32.4%) | 2.09 |
| Single Male/Father | 7 (10.3%) | 2.14 |
| Single Female/Mother | 19 (27.9%) | 2.74 |
| Non-family | 20 (29.4%) | - |
| Total Households | 68 (100.0%) | 1.96 |
Household Size by Marriage Status in North Lawrence
Out of a total of 68 households in North Lawrence, 48 (70.6%) are family households, while 20 (29.4%) are nonfamily households. The most numerous type of family households are 2-person households, comprising 36, and the most common type of nonfamily households are 1-person households, comprising 20.
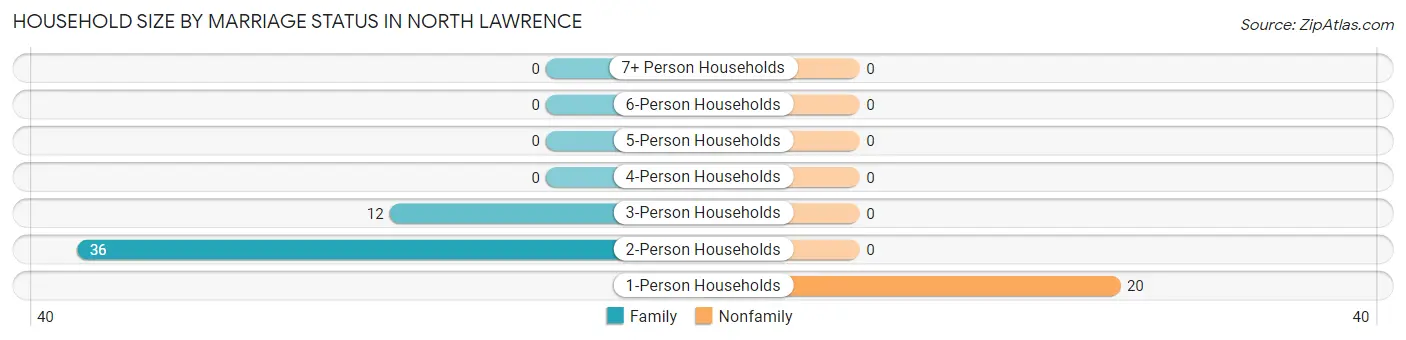
| Household Size | Family Households | Nonfamily Households |
| 1-Person Households | - | 20 (29.4%) |
| 2-Person Households | 36 (52.9%) | 0 (0.0%) |
| 3-Person Households | 12 (17.6%) | 0 (0.0%) |
| 4-Person Households | 0 (0.0%) | 0 (0.0%) |
| 5-Person Households | 0 (0.0%) | 0 (0.0%) |
| 6-Person Households | 0 (0.0%) | 0 (0.0%) |
| 7+ Person Households | 0 (0.0%) | 0 (0.0%) |
| Total | 48 (70.6%) | 20 (29.4%) |
Female Fertility in North Lawrence
Fertility by Age in North Lawrence
| Age Bracket | Women with Births | Births / 1,000 Women |
| 15 to 19 years | 0 (0.0%) | 0.0 |
| 20 to 34 years | 0 (0.0%) | 0.0 |
| 35 to 50 years | 0 (0.0%) | 0.0 |
| Total | 0 (0.0%) | 0.0 |
Fertility by Age by Marriage Status in North Lawrence
| Age Bracket | Married | Unmarried |
| 15 to 19 years | 0 (0.0%) | 0 (0.0%) |
| 20 to 34 years | 0 (0.0%) | 0 (0.0%) |
| 35 to 50 years | 0 (0.0%) | 0 (0.0%) |
| Total | 0 (0.0%) | 0 (0.0%) |
Fertility by Education in North Lawrence
| Educational Attainment | Women with Births | Births / 1,000 Women |
| Less than High School | 0 (0.0%) | 0.0 |
| High School Diploma | 0 (0.0%) | 0.0 |
| College or Associate's Degree | 0 (0.0%) | 0.0 |
| Bachelor's Degree | 0 (0.0%) | 0.0 |
| Graduate Degree | 0 (0.0%) | 0.0 |
| Total | 0 (0.0%) | 0.0 |
Fertility by Education by Marriage Status in North Lawrence
| Educational Attainment | Married | Unmarried |
| Less than High School | 0 (0.0%) | 0 (0.0%) |
| High School Diploma | 0 (0.0%) | 0 (0.0%) |
| College or Associate's Degree | 0 (0.0%) | 0 (0.0%) |
| Bachelor's Degree | 0 (0.0%) | 0 (0.0%) |
| Graduate Degree | 0 (0.0%) | 0 (0.0%) |
| Total | 0 (0.0%) | 0 (0.0%) |
Employment Characteristics in North Lawrence
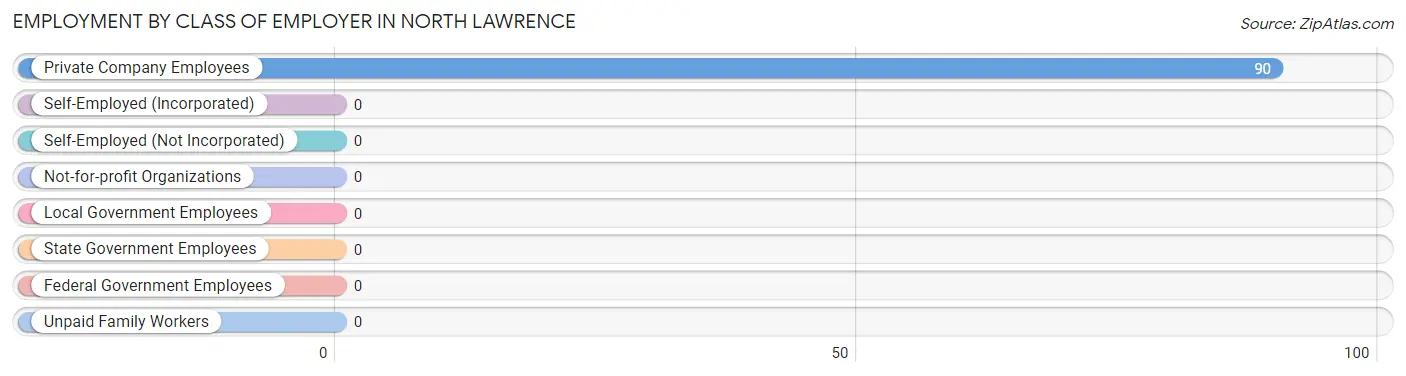
Employment by Class of Employer in North Lawrence
Among the 90 employed individuals in North Lawrence, , and private company employees (90 | 100.0%) make up the most common classes of employment.
| Employer Class | # Employees | % Employees |
| Private Company Employees | 90 | 100.0% |
| Self-Employed (Incorporated) | 0 | 0.0% |
| Self-Employed (Not Incorporated) | 0 | 0.0% |
| Not-for-profit Organizations | 0 | 0.0% |
| Local Government Employees | 0 | 0.0% |
| State Government Employees | 0 | 0.0% |
| Federal Government Employees | 0 | 0.0% |
| Unpaid Family Workers | 0 | 0.0% |
| Total | 90 | 100.0% |
Employment Status by Age in North Lawrence
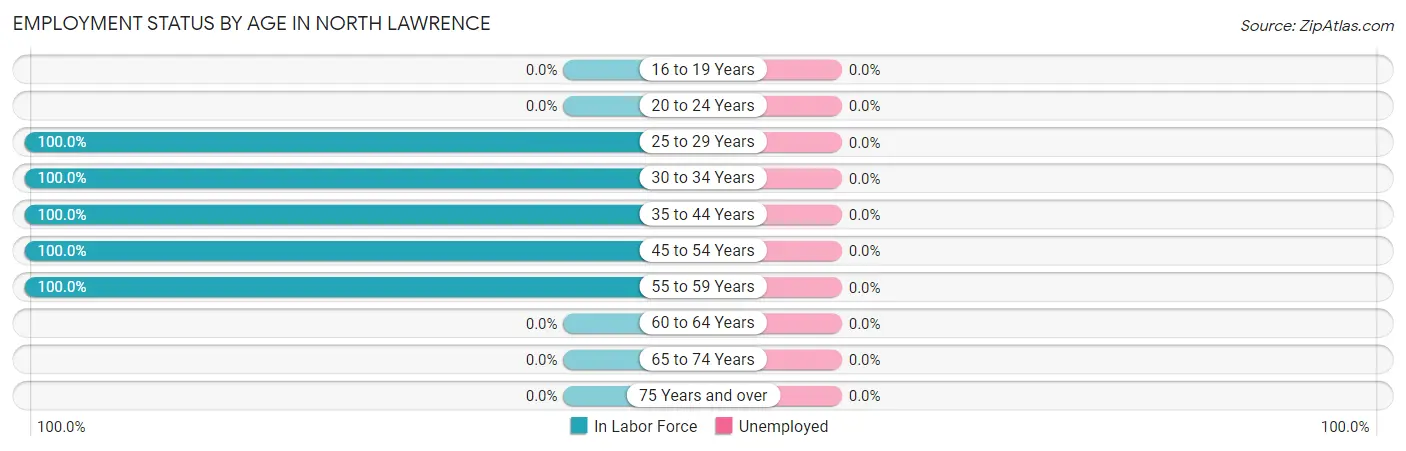
| Age Bracket | In Labor Force | Unemployed |
| 16 to 19 Years | 0 (0.0%) | 0 (0.0%) |
| 20 to 24 Years | 0 (0.0%) | 0 (0.0%) |
| 25 to 29 Years | 13 (100.0%) | 0 (0.0%) |
| 30 to 34 Years | 18 (100.0%) | 0 (0.0%) |
| 35 to 44 Years | 14 (100.0%) | 0 (0.0%) |
| 45 to 54 Years | 32 (100.0%) | 0 (0.0%) |
| 55 to 59 Years | 20 (100.0%) | 0 (0.0%) |
| 60 to 64 Years | 0 (0.0%) | 0 (0.0%) |
| 65 to 74 Years | 0 (0.0%) | 0 (0.0%) |
| 75 Years and over | 0 (0.0%) | 0 (0.0%) |
| Total | 97 (72.9%) | 0 (0.0%) |
Employment Status by Educational Attainment in North Lawrence
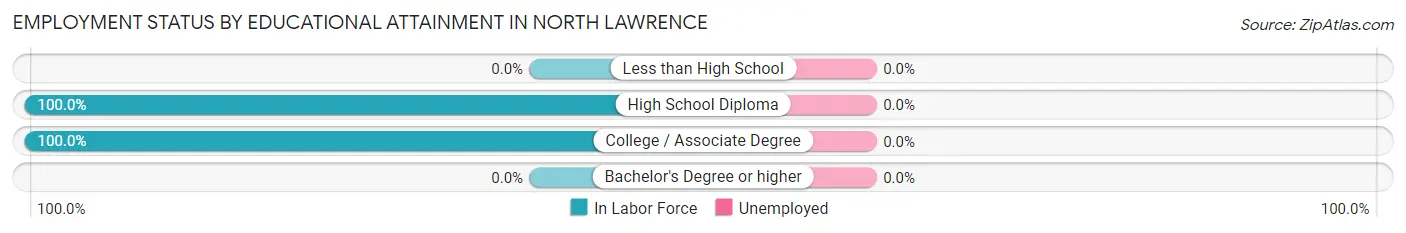
| Educational Attainment | In Labor Force | Unemployed |
| Less than High School | 0 (0.0%) | 0 (0.0%) |
| High School Diploma | 85 (100.0%) | 0 (0.0%) |
| College / Associate Degree | 12 (100.0%) | 0 (0.0%) |
| Bachelor's Degree or higher | 0 (0.0%) | 0 (0.0%) |
| Total | 97 (100.0%) | 0 (0.0%) |
Employment Occupations by Sex in North Lawrence
Management, Business, Science and Arts Occupations
The most common Management, Business, Science and Arts occupations in North Lawrence are Management (13 | 13.4%), Health Diagnosing & Treating (12 | 12.4%), and Business & Financial (6 | 6.2%).
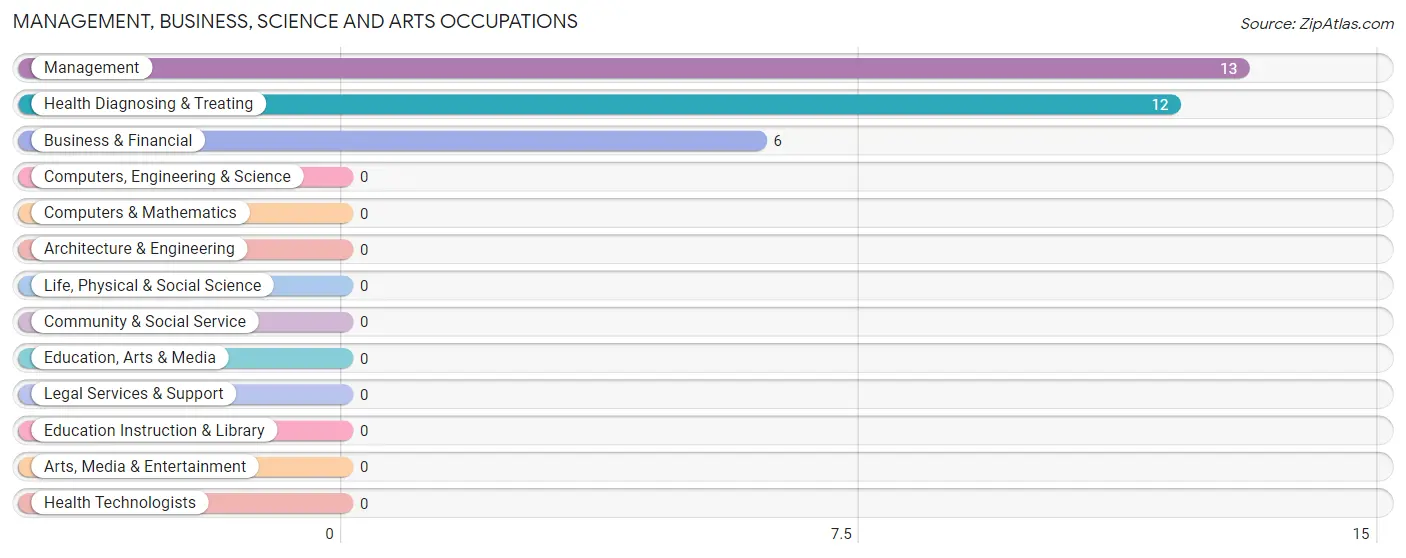
Management, Business, Science and Arts Occupations by Sex
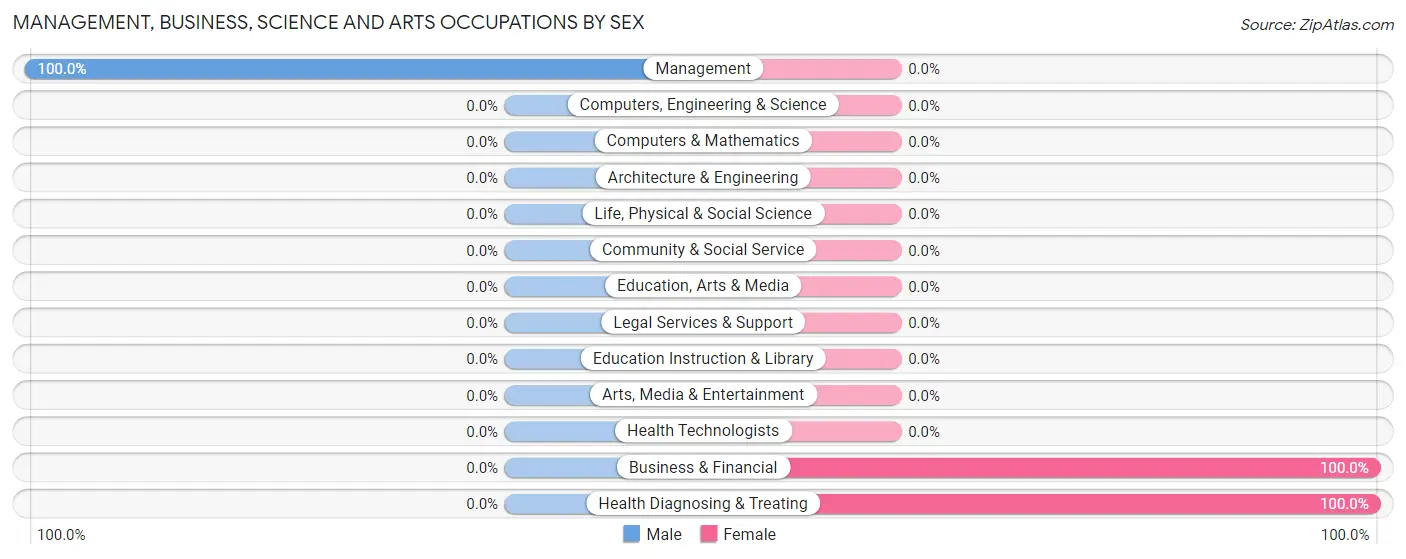
| Occupation | Male | Female |
| Management | 13 (100.0%) | 0 (0.0%) |
| Business & Financial | 0 (0.0%) | 6 (100.0%) |
| Computers, Engineering & Science | 0 (0.0%) | 0 (0.0%) |
| Computers & Mathematics | 0 (0.0%) | 0 (0.0%) |
| Architecture & Engineering | 0 (0.0%) | 0 (0.0%) |
| Life, Physical & Social Science | 0 (0.0%) | 0 (0.0%) |
| Community & Social Service | 0 (0.0%) | 0 (0.0%) |
| Education, Arts & Media | 0 (0.0%) | 0 (0.0%) |
| Legal Services & Support | 0 (0.0%) | 0 (0.0%) |
| Education Instruction & Library | 0 (0.0%) | 0 (0.0%) |
| Arts, Media & Entertainment | 0 (0.0%) | 0 (0.0%) |
| Health Diagnosing & Treating | 0 (0.0%) | 12 (100.0%) |
| Health Technologists | 0 (0.0%) | 0 (0.0%) |
| Total (Category) | 13 (41.9%) | 18 (58.1%) |
| Total (Overall) | 62 (63.9%) | 35 (36.1%) |
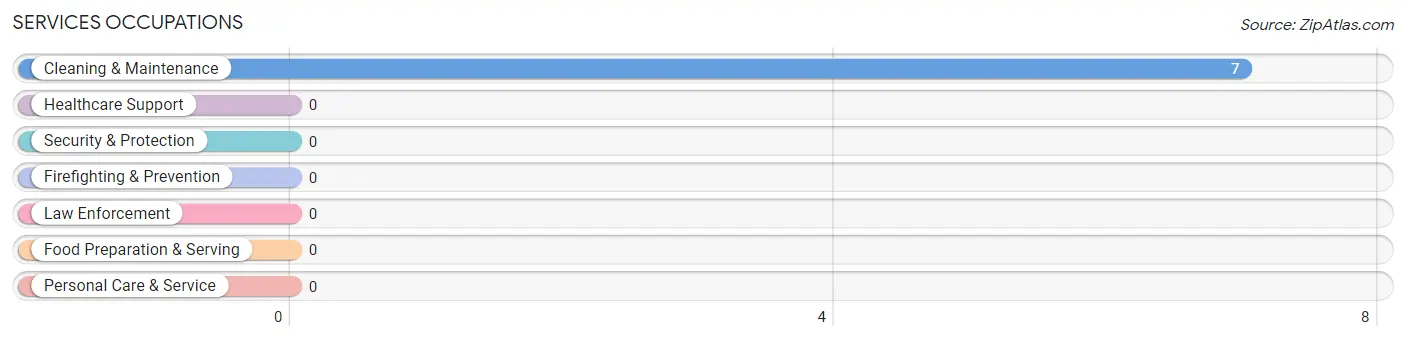
Services Occupations
The most common Services occupations in North Lawrence are , and Cleaning & Maintenance (7 | 7.2%).
Services Occupations by Sex
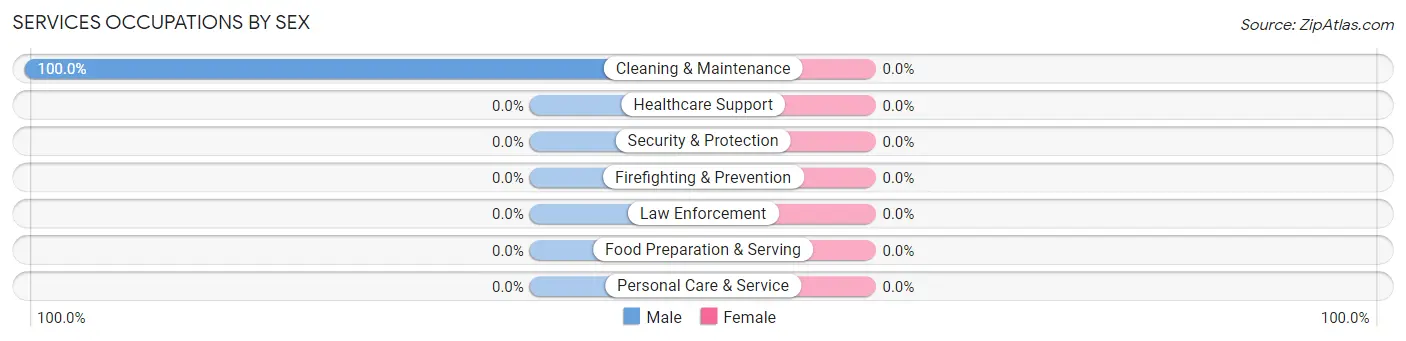
| Occupation | Male | Female |
| Healthcare Support | 0 (0.0%) | 0 (0.0%) |
| Security & Protection | 0 (0.0%) | 0 (0.0%) |
| Firefighting & Prevention | 0 (0.0%) | 0 (0.0%) |
| Law Enforcement | 0 (0.0%) | 0 (0.0%) |
| Food Preparation & Serving | 0 (0.0%) | 0 (0.0%) |
| Cleaning & Maintenance | 7 (100.0%) | 0 (0.0%) |
| Personal Care & Service | 0 (0.0%) | 0 (0.0%) |
| Total (Category) | 7 (100.0%) | 0 (0.0%) |
| Total (Overall) | 62 (63.9%) | 35 (36.1%) |
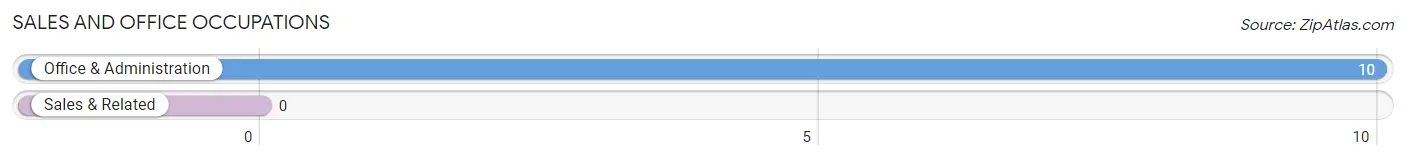
Sales and Office Occupations
The most common Sales and Office occupations in North Lawrence are , and Office & Administration (10 | 10.3%).
Sales and Office Occupations by Sex
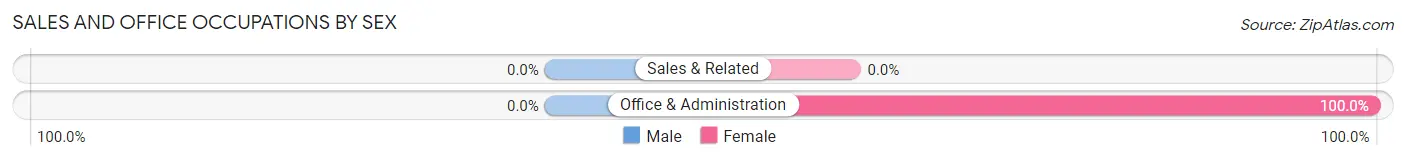
| Occupation | Male | Female |
| Sales & Related | 0 (0.0%) | 0 (0.0%) |
| Office & Administration | 0 (0.0%) | 10 (100.0%) |
| Total (Category) | 0 (0.0%) | 10 (100.0%) |
| Total (Overall) | 62 (63.9%) | 35 (36.1%) |
Natural Resources, Construction and Maintenance Occupations
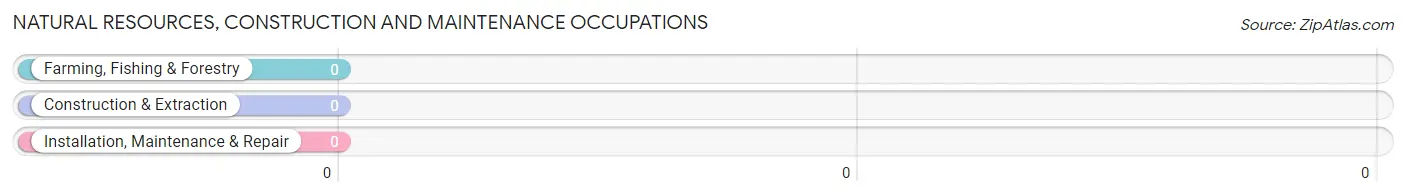
Natural Resources, Construction and Maintenance Occupations by Sex
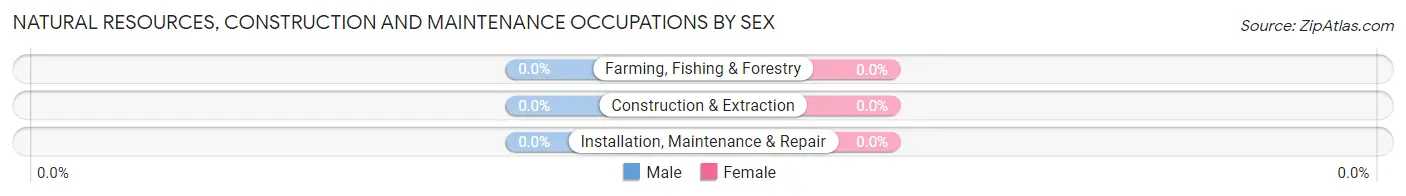
| Occupation | Male | Female |
| Farming, Fishing & Forestry | 0 (0.0%) | 0 (0.0%) |
| Construction & Extraction | 0 (0.0%) | 0 (0.0%) |
| Installation, Maintenance & Repair | 0 (0.0%) | 0 (0.0%) |
| Total (Category) | 0 (0.0%) | 0 (0.0%) |
| Total (Overall) | 62 (63.9%) | 35 (36.1%) |
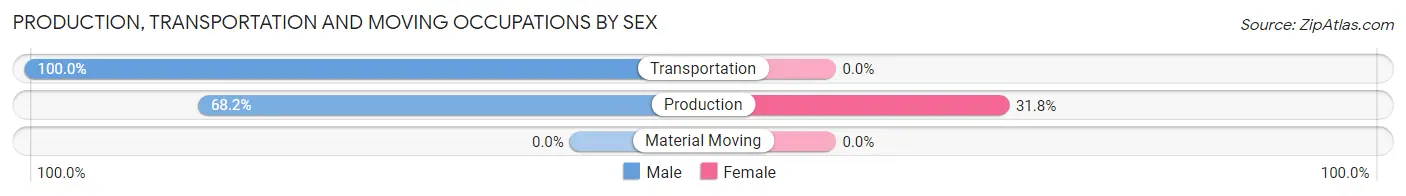
Production, Transportation and Moving Occupations
The most common Production, Transportation and Moving occupations in North Lawrence are Transportation (27 | 27.8%), and Production (22 | 22.7%).
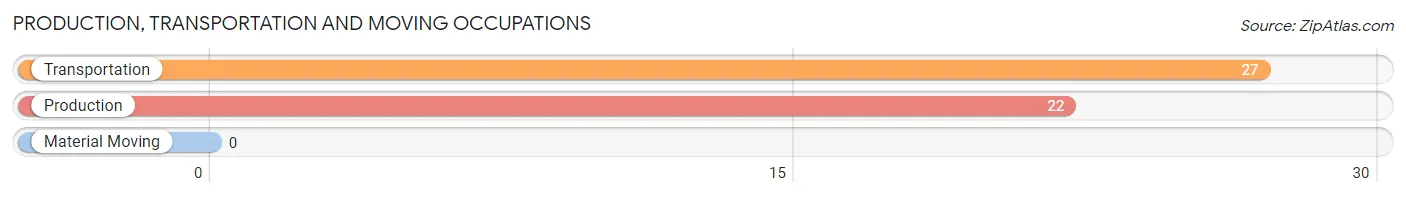
Production, Transportation and Moving Occupations by Sex
| Occupation | Male | Female |
| Production | 15 (68.2%) | 7 (31.8%) |
| Transportation | 27 (100.0%) | 0 (0.0%) |
| Material Moving | 0 (0.0%) | 0 (0.0%) |
| Total (Category) | 42 (85.7%) | 7 (14.3%) |
| Total (Overall) | 62 (63.9%) | 35 (36.1%) |
Employment Industries by Sex in North Lawrence
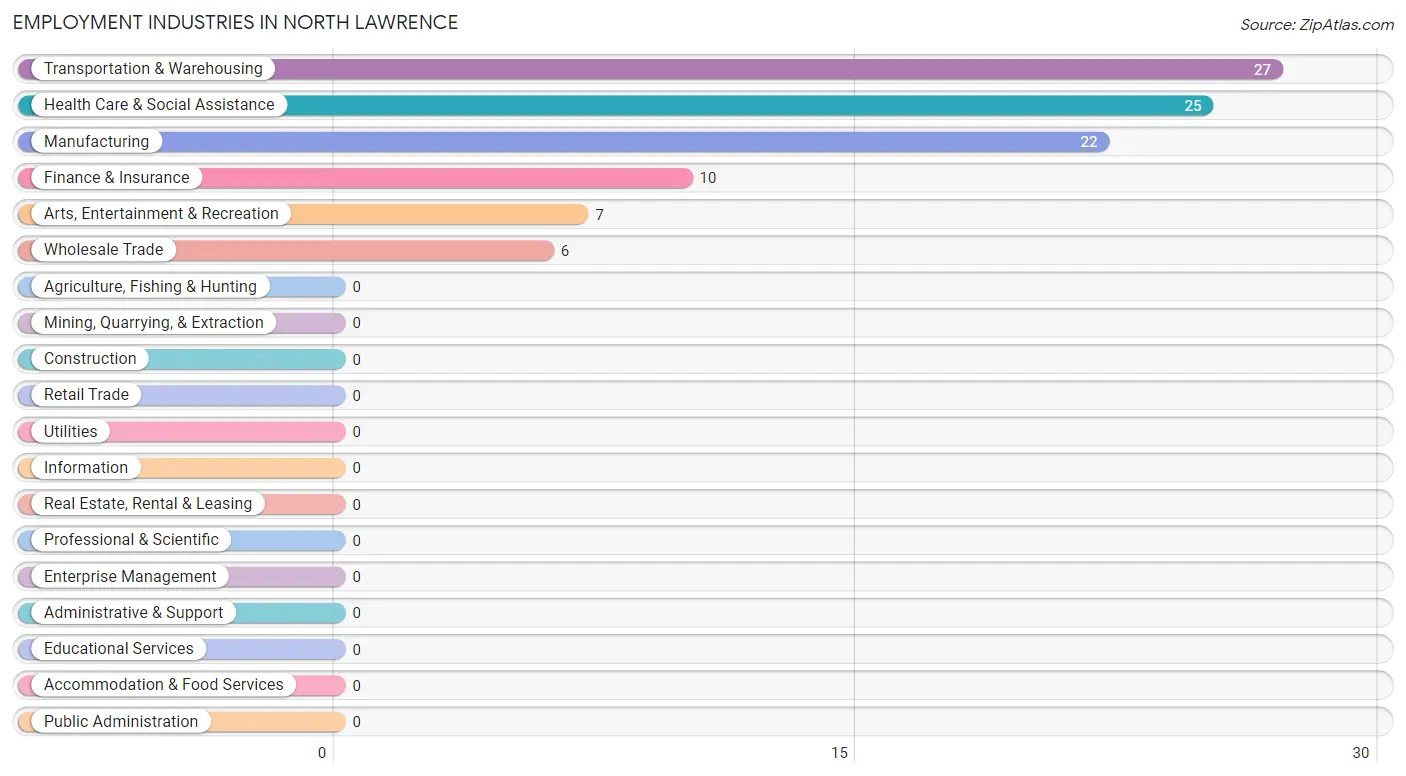
Employment Industries in North Lawrence
The major employment industries in North Lawrence include Transportation & Warehousing (27 | 27.8%), Health Care & Social Assistance (25 | 25.8%), Manufacturing (22 | 22.7%), Finance & Insurance (10 | 10.3%), and Arts, Entertainment & Recreation (7 | 7.2%).
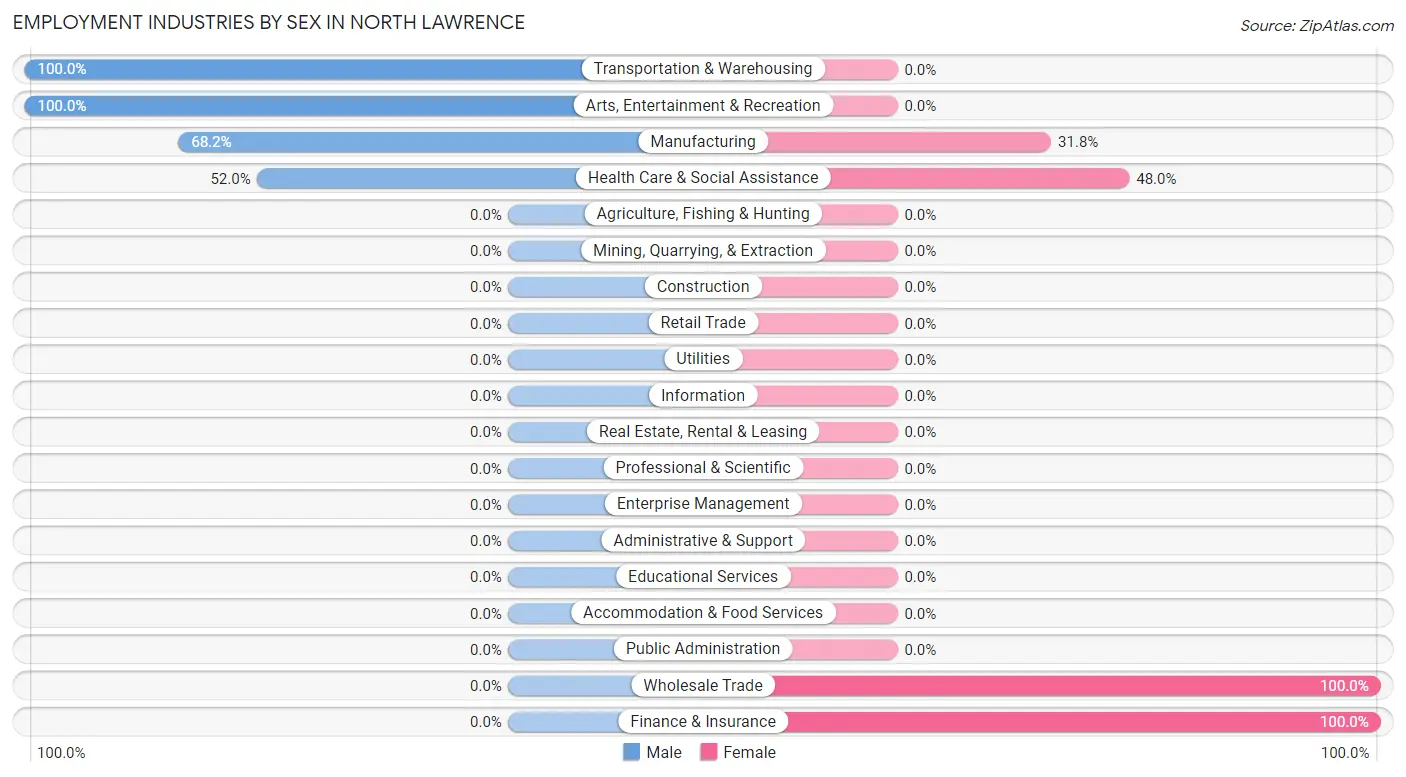
Employment Industries by Sex in North Lawrence
The North Lawrence industries that see more men than women are Transportation & Warehousing (100.0%), Arts, Entertainment & Recreation (100.0%), and Manufacturing (68.2%), whereas the industries that tend to have a higher number of women are Wholesale Trade (100.0%), Finance & Insurance (100.0%), and Health Care & Social Assistance (48.0%).
| Industry | Male | Female |
| Agriculture, Fishing & Hunting | 0 (0.0%) | 0 (0.0%) |
| Mining, Quarrying, & Extraction | 0 (0.0%) | 0 (0.0%) |
| Construction | 0 (0.0%) | 0 (0.0%) |
| Manufacturing | 15 (68.2%) | 7 (31.8%) |
| Wholesale Trade | 0 (0.0%) | 6 (100.0%) |
| Retail Trade | 0 (0.0%) | 0 (0.0%) |
| Transportation & Warehousing | 27 (100.0%) | 0 (0.0%) |
| Utilities | 0 (0.0%) | 0 (0.0%) |
| Information | 0 (0.0%) | 0 (0.0%) |
| Finance & Insurance | 0 (0.0%) | 10 (100.0%) |
| Real Estate, Rental & Leasing | 0 (0.0%) | 0 (0.0%) |
| Professional & Scientific | 0 (0.0%) | 0 (0.0%) |
| Enterprise Management | 0 (0.0%) | 0 (0.0%) |
| Administrative & Support | 0 (0.0%) | 0 (0.0%) |
| Educational Services | 0 (0.0%) | 0 (0.0%) |
| Health Care & Social Assistance | 13 (52.0%) | 12 (48.0%) |
| Arts, Entertainment & Recreation | 7 (100.0%) | 0 (0.0%) |
| Accommodation & Food Services | 0 (0.0%) | 0 (0.0%) |
| Public Administration | 0 (0.0%) | 0 (0.0%) |
| Total | 62 (63.9%) | 35 (36.1%) |
Education in North Lawrence
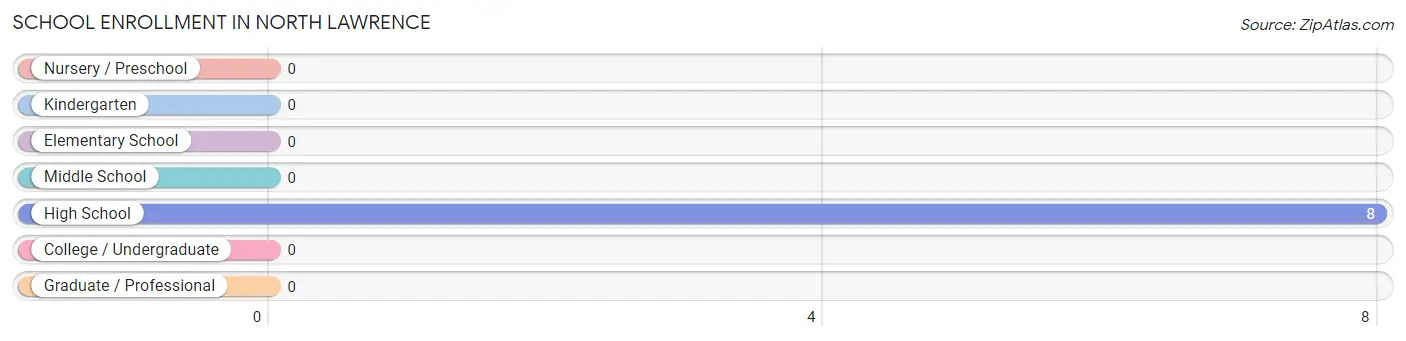
School Enrollment in North Lawrence
| School Level | # Students | % Students |
| Nursery / Preschool | 0 | 0.0% |
| Kindergarten | 0 | 0.0% |
| Elementary School | 0 | 0.0% |
| Middle School | 0 | 0.0% |
| High School | 8 | 100.0% |
| College / Undergraduate | 0 | 0.0% |
| Graduate / Professional | 0 | 0.0% |
| Total | 8 | 100.0% |
School Enrollment by Age by Funding Source in North Lawrence
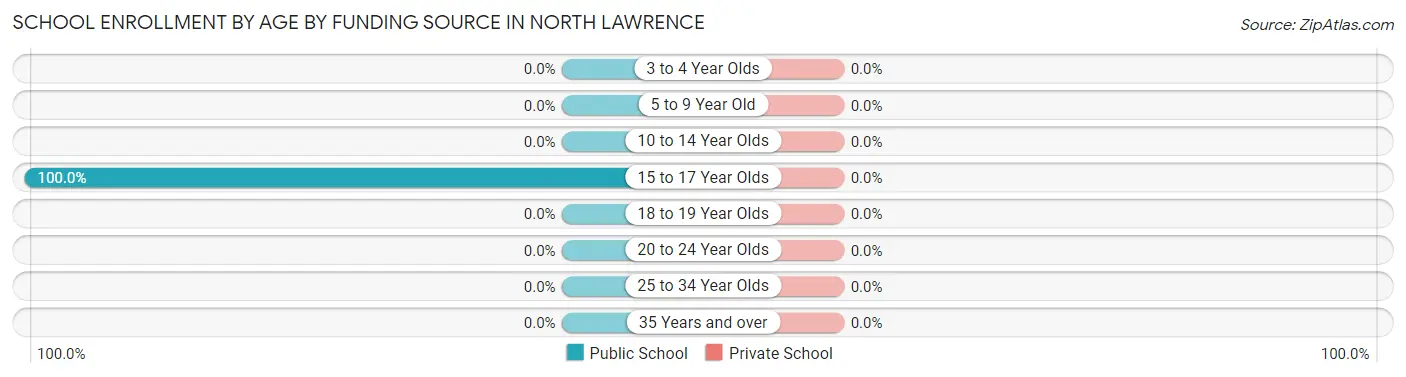
| Age Bracket | Public School | Private School |
| 3 to 4 Year Olds | 0 (0.0%) | 0 (0.0%) |
| 5 to 9 Year Old | 0 (0.0%) | 0 (0.0%) |
| 10 to 14 Year Olds | 0 (0.0%) | 0 (0.0%) |
| 15 to 17 Year Olds | 8 (100.0%) | 0 (0.0%) |
| 18 to 19 Year Olds | 0 (0.0%) | 0 (0.0%) |
| 20 to 24 Year Olds | 0 (0.0%) | 0 (0.0%) |
| 25 to 34 Year Olds | 0 (0.0%) | 0 (0.0%) |
| 35 Years and over | 0 (0.0%) | 0 (0.0%) |
| Total | 8 (100.0%) | 0 (0.0%) |
Educational Attainment by Field of Study in North Lawrence
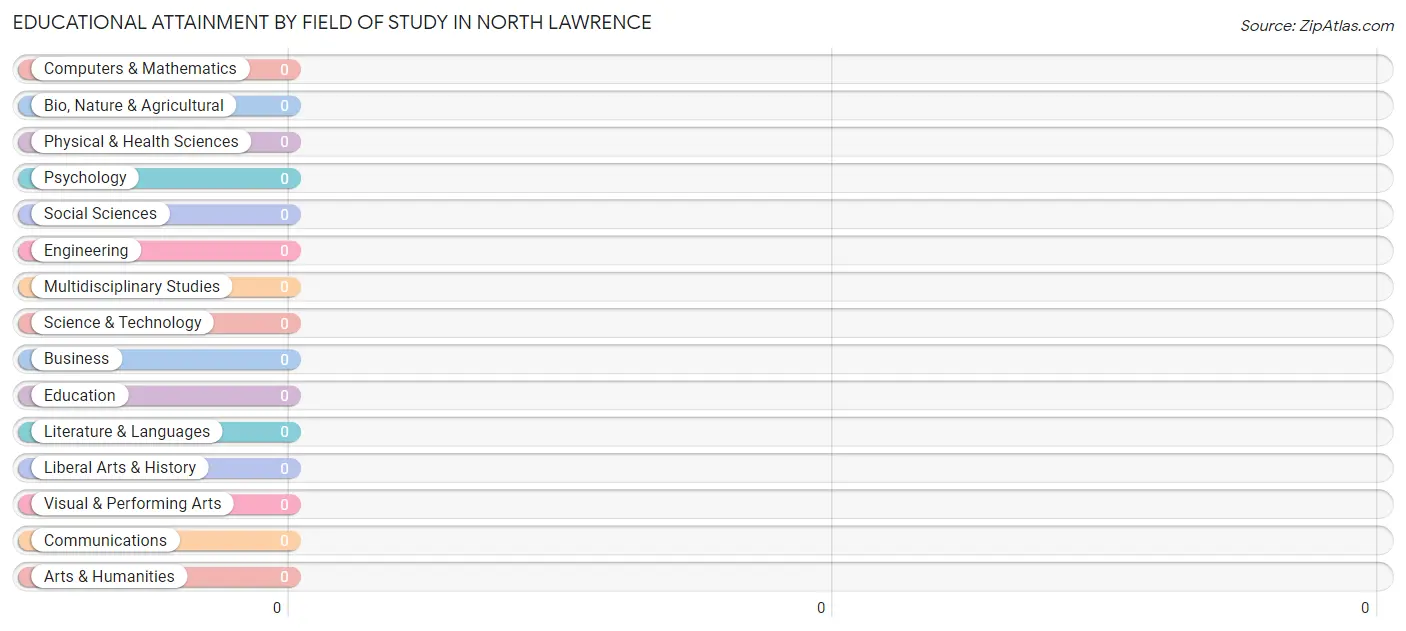
| Field of Study | # Graduates | % Graduates |
| Computers & Mathematics | 0 | 0.0% |
| Bio, Nature & Agricultural | 0 | 0.0% |
| Physical & Health Sciences | 0 | 0.0% |
| Psychology | 0 | 0.0% |
| Social Sciences | 0 | 0.0% |
| Engineering | 0 | 0.0% |
| Multidisciplinary Studies | 0 | 0.0% |
| Science & Technology | 0 | 0.0% |
| Business | 0 | 0.0% |
| Education | 0 | 0.0% |
| Literature & Languages | 0 | 0.0% |
| Liberal Arts & History | 0 | 0.0% |
| Visual & Performing Arts | 0 | 0.0% |
| Communications | 0 | 0.0% |
| Arts & Humanities | 0 | 0.0% |
| Total | 0 | 0.0% |
Transportation & Commute in North Lawrence
Vehicle Availability by Sex in North Lawrence
The most prevalent vehicle ownership categories in North Lawrence are males with 2 vehicles (34, accounting for 61.8%) and females with 2 vehicles (22, making up 97.1%).
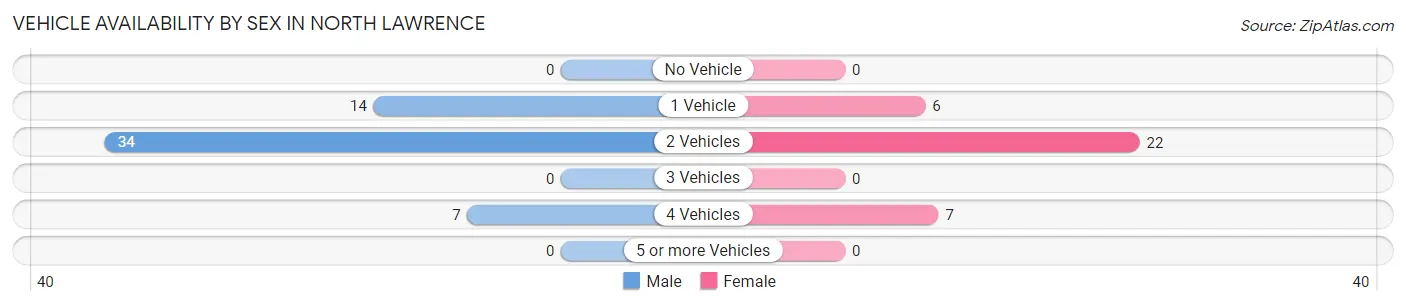
| Vehicles Available | Male | Female |
| No Vehicle | 0 (0.0%) | 0 (0.0%) |
| 1 Vehicle | 14 (25.5%) | 6 (17.1%) |
| 2 Vehicles | 34 (61.8%) | 22 (62.9%) |
| 3 Vehicles | 0 (0.0%) | 0 (0.0%) |
| 4 Vehicles | 7 (12.7%) | 7 (20.0%) |
| 5 or more Vehicles | 0 (0.0%) | 0 (0.0%) |
| Total | 55 (100.0%) | 35 (100.0%) |
Commute Time in North Lawrence
The most frequently occuring commute durations in North Lawrence are 30 to 34 minutes (31 commuters, 34.4%), 15 to 19 minutes (23 commuters, 25.6%), and 60 to 89 minutes (22 commuters, 24.4%).
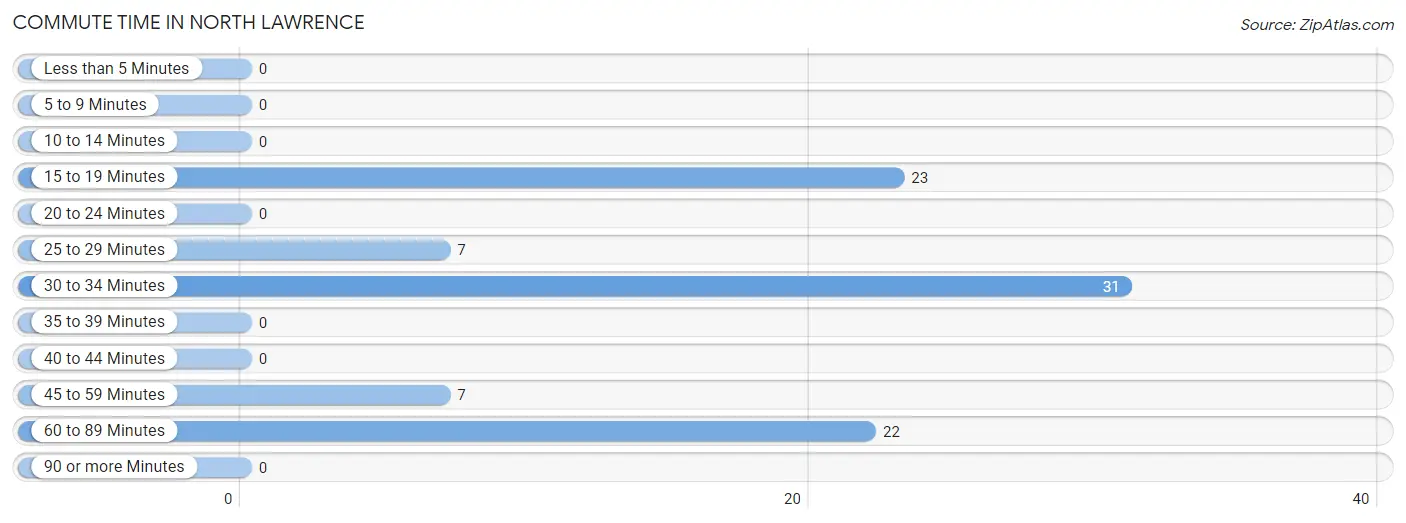
| Commute Time | # Commuters | % Commuters |
| Less than 5 Minutes | 0 | 0.0% |
| 5 to 9 Minutes | 0 | 0.0% |
| 10 to 14 Minutes | 0 | 0.0% |
| 15 to 19 Minutes | 23 | 25.6% |
| 20 to 24 Minutes | 0 | 0.0% |
| 25 to 29 Minutes | 7 | 7.8% |
| 30 to 34 Minutes | 31 | 34.4% |
| 35 to 39 Minutes | 0 | 0.0% |
| 40 to 44 Minutes | 0 | 0.0% |
| 45 to 59 Minutes | 7 | 7.8% |
| 60 to 89 Minutes | 22 | 24.4% |
| 90 or more Minutes | 0 | 0.0% |
Commute Time by Sex in North Lawrence
The most common commute times in North Lawrence are 60 to 89 minutes (22 commuters, 40.0%) for males and 30 to 34 minutes (18 commuters, 51.4%) for females.
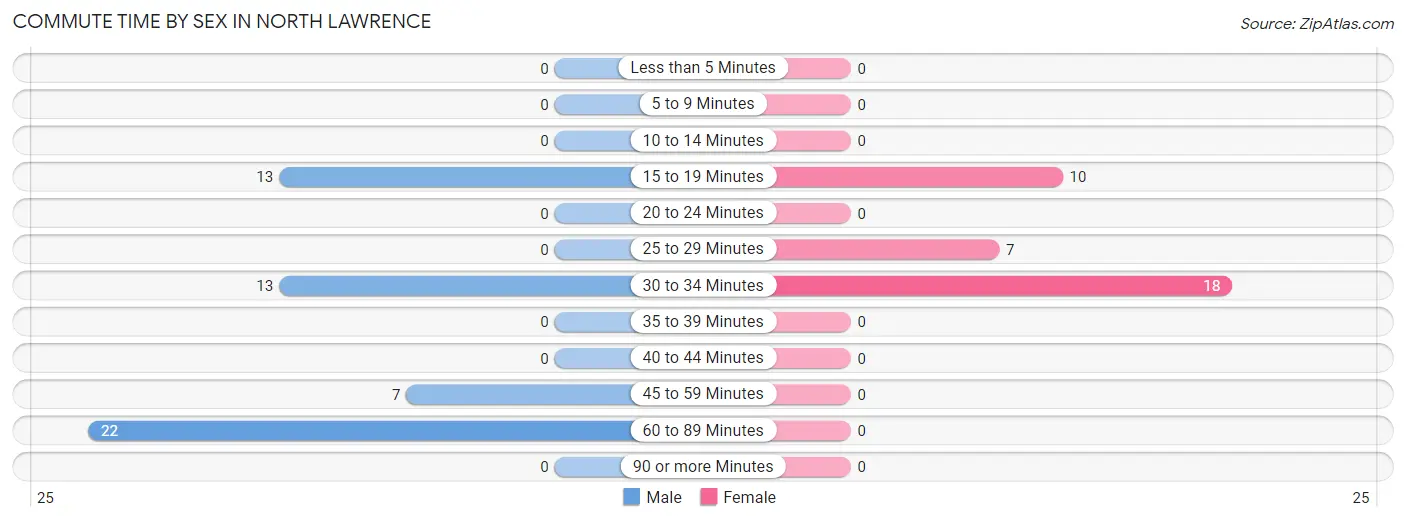
| Commute Time | Male | Female |
| Less than 5 Minutes | 0 (0.0%) | 0 (0.0%) |
| 5 to 9 Minutes | 0 (0.0%) | 0 (0.0%) |
| 10 to 14 Minutes | 0 (0.0%) | 0 (0.0%) |
| 15 to 19 Minutes | 13 (23.6%) | 10 (28.6%) |
| 20 to 24 Minutes | 0 (0.0%) | 0 (0.0%) |
| 25 to 29 Minutes | 0 (0.0%) | 7 (20.0%) |
| 30 to 34 Minutes | 13 (23.6%) | 18 (51.4%) |
| 35 to 39 Minutes | 0 (0.0%) | 0 (0.0%) |
| 40 to 44 Minutes | 0 (0.0%) | 0 (0.0%) |
| 45 to 59 Minutes | 7 (12.7%) | 0 (0.0%) |
| 60 to 89 Minutes | 22 (40.0%) | 0 (0.0%) |
| 90 or more Minutes | 0 (0.0%) | 0 (0.0%) |
Time of Departure to Work by Sex in North Lawrence
The most frequent times of departure to work in North Lawrence are 5:00 AM to 5:29 AM (22, 40.0%) for males and 6:00 AM to 6:29 AM (19, 54.3%) for females.
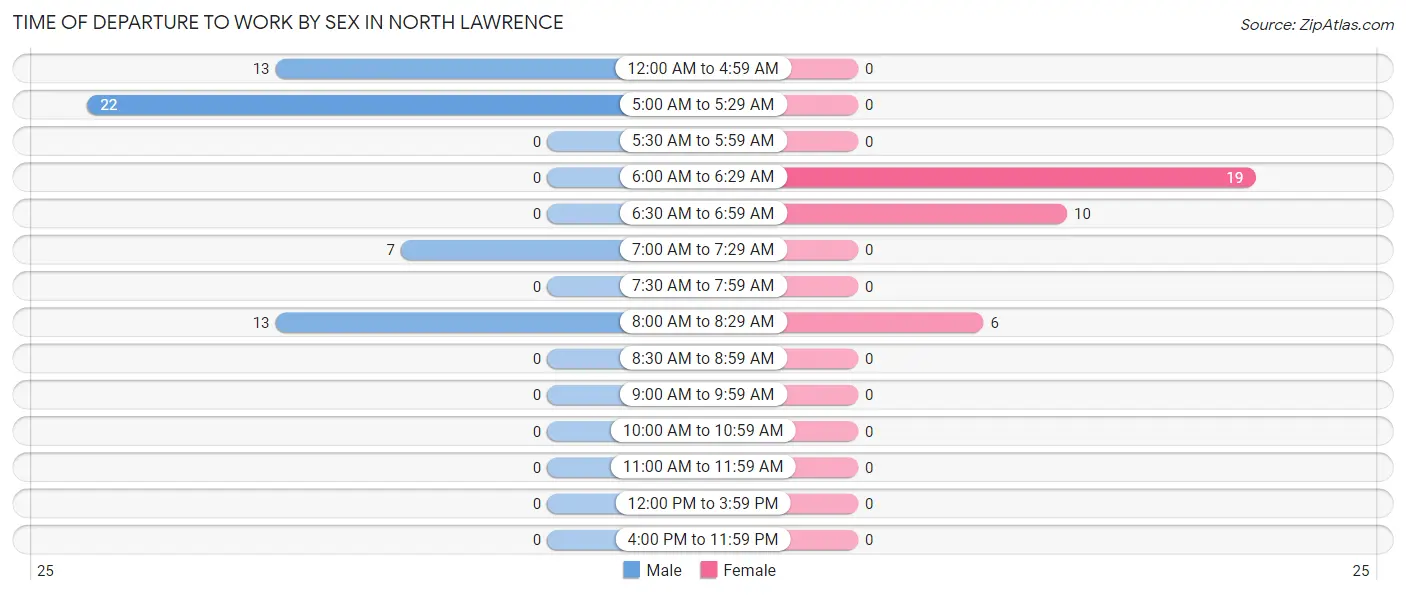
| Time of Departure | Male | Female |
| 12:00 AM to 4:59 AM | 13 (23.6%) | 0 (0.0%) |
| 5:00 AM to 5:29 AM | 22 (40.0%) | 0 (0.0%) |
| 5:30 AM to 5:59 AM | 0 (0.0%) | 0 (0.0%) |
| 6:00 AM to 6:29 AM | 0 (0.0%) | 19 (54.3%) |
| 6:30 AM to 6:59 AM | 0 (0.0%) | 10 (28.6%) |
| 7:00 AM to 7:29 AM | 7 (12.7%) | 0 (0.0%) |
| 7:30 AM to 7:59 AM | 0 (0.0%) | 0 (0.0%) |
| 8:00 AM to 8:29 AM | 13 (23.6%) | 6 (17.1%) |
| 8:30 AM to 8:59 AM | 0 (0.0%) | 0 (0.0%) |
| 9:00 AM to 9:59 AM | 0 (0.0%) | 0 (0.0%) |
| 10:00 AM to 10:59 AM | 0 (0.0%) | 0 (0.0%) |
| 11:00 AM to 11:59 AM | 0 (0.0%) | 0 (0.0%) |
| 12:00 PM to 3:59 PM | 0 (0.0%) | 0 (0.0%) |
| 4:00 PM to 11:59 PM | 0 (0.0%) | 0 (0.0%) |
| Total | 55 (100.0%) | 35 (100.0%) |
Housing Occupancy in North Lawrence
Occupancy by Ownership in North Lawrence
Of the total 68 dwellings in North Lawrence, owner-occupied units account for 68 (100.0%), while renter-occupied units make up 0 (0.0%).
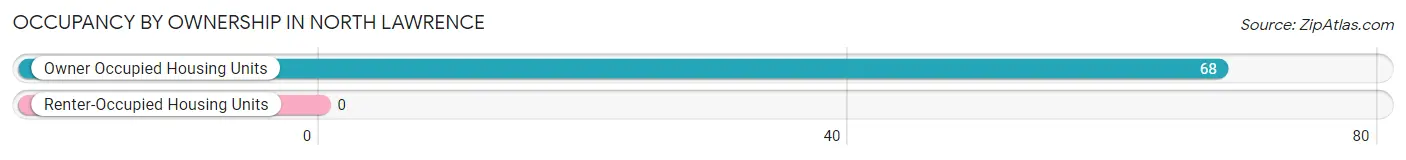
| Occupancy | # Housing Units | % Housing Units |
| Owner Occupied Housing Units | 68 | 100.0% |
| Renter-Occupied Housing Units | 0 | 0.0% |
| Total Occupied Housing Units | 68 | 100.0% |
Occupancy by Household Size in North Lawrence
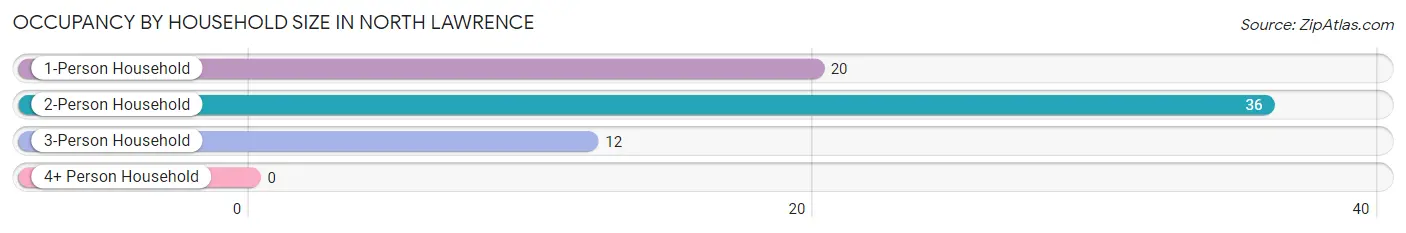
| Household Size | # Housing Units | % Housing Units |
| 1-Person Household | 20 | 29.4% |
| 2-Person Household | 36 | 52.9% |
| 3-Person Household | 12 | 17.6% |
| 4+ Person Household | 0 | 0.0% |
| Total Housing Units | 68 | 100.0% |
Occupancy by Ownership by Household Size in North Lawrence
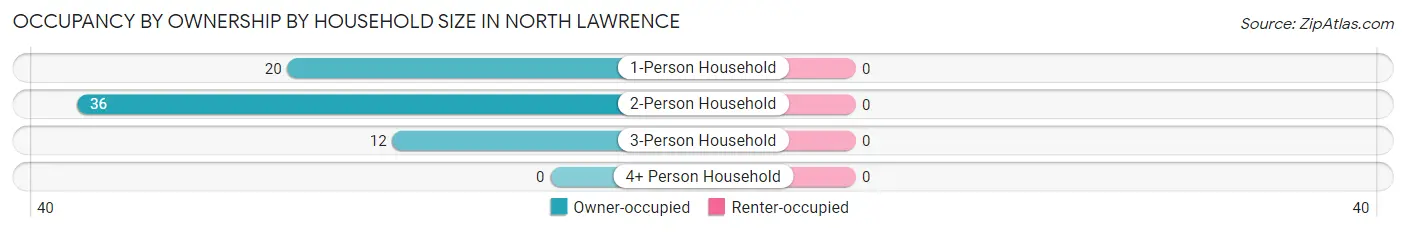
| Household Size | Owner-occupied | Renter-occupied |
| 1-Person Household | 20 (100.0%) | 0 (0.0%) |
| 2-Person Household | 36 (100.0%) | 0 (0.0%) |
| 3-Person Household | 12 (100.0%) | 0 (0.0%) |
| 4+ Person Household | 0 (0.0%) | 0 (0.0%) |
| Total Housing Units | 68 (100.0%) | 0 (0.0%) |
Occupancy by Educational Attainment in North Lawrence
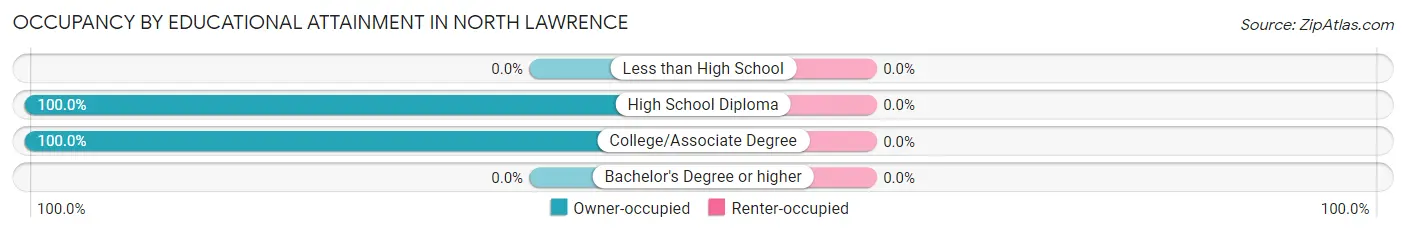
| Household Size | Owner-occupied | Renter-occupied |
| Less than High School | 0 (0.0%) | 0 (0.0%) |
| High School Diploma | 56 (100.0%) | 0 (0.0%) |
| College/Associate Degree | 12 (100.0%) | 0 (0.0%) |
| Bachelor's Degree or higher | 0 (0.0%) | 0 (0.0%) |
Occupancy by Age of Householder in North Lawrence
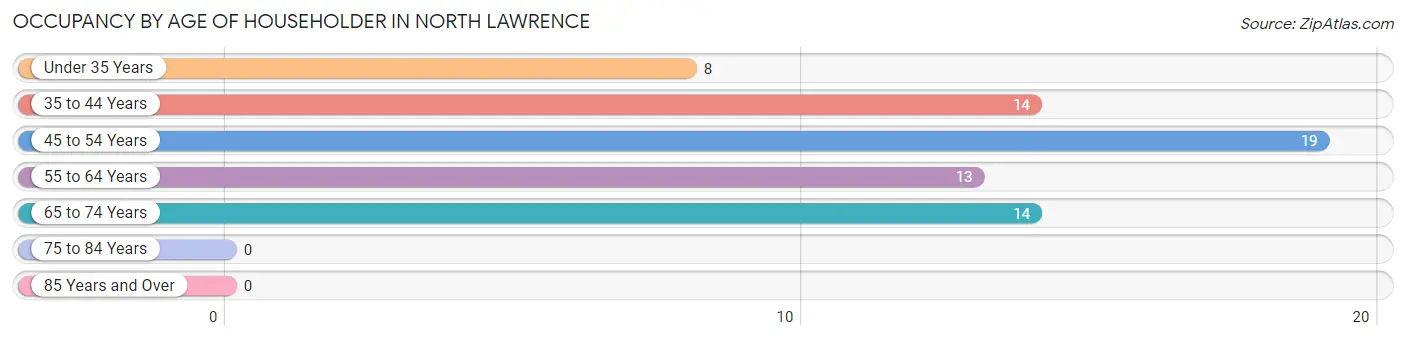
| Age Bracket | # Households | % Households |
| Under 35 Years | 8 | 11.8% |
| 35 to 44 Years | 14 | 20.6% |
| 45 to 54 Years | 19 | 27.9% |
| 55 to 64 Years | 13 | 19.1% |
| 65 to 74 Years | 14 | 20.6% |
| 75 to 84 Years | 0 | 0.0% |
| 85 Years and Over | 0 | 0.0% |
| Total | 68 | 100.0% |
Housing Finances in North Lawrence
Median Income by Occupancy in North Lawrence
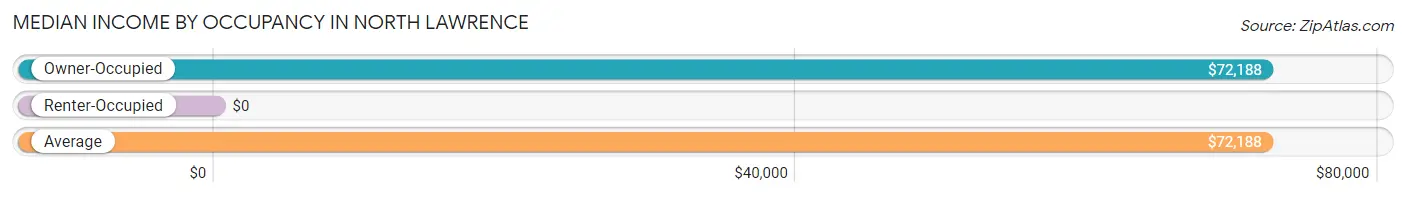
| Occupancy Type | # Households | Median Income |
| Owner-Occupied | 68 (100.0%) | $72,188 |
| Renter-Occupied | 0 (0.0%) | $0 |
| Average | 68 (100.0%) | $72,188 |
Occupancy by Householder Income Bracket in North Lawrence
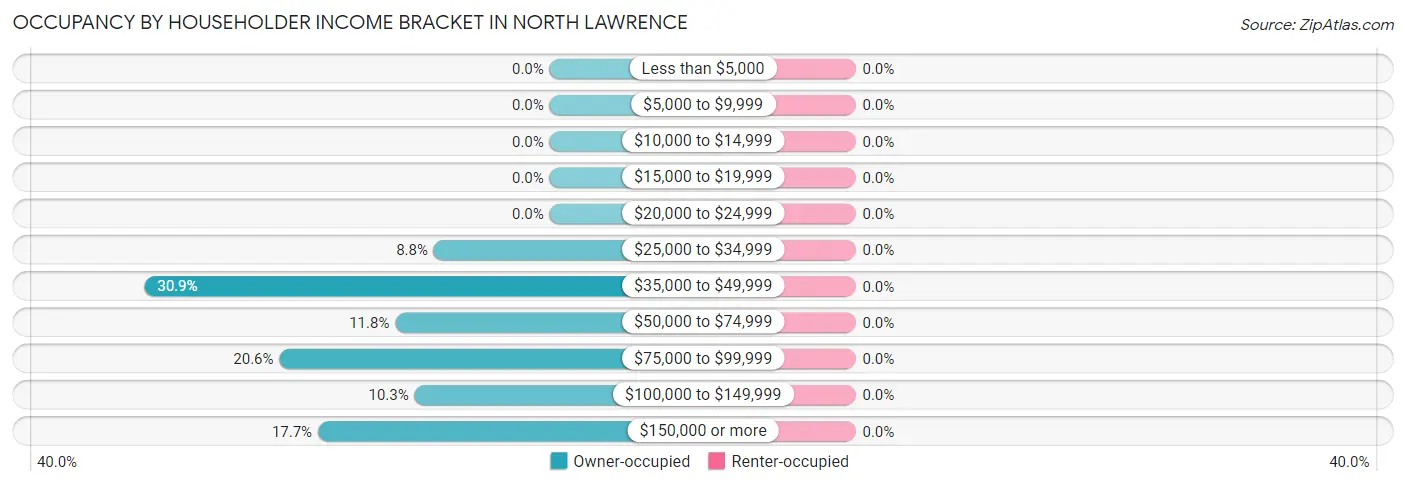
| Income Bracket | Owner-occupied | Renter-occupied |
| Less than $5,000 | 0 (0.0%) | 0 (0.0%) |
| $5,000 to $9,999 | 0 (0.0%) | 0 (0.0%) |
| $10,000 to $14,999 | 0 (0.0%) | 0 (0.0%) |
| $15,000 to $19,999 | 0 (0.0%) | 0 (0.0%) |
| $20,000 to $24,999 | 0 (0.0%) | 0 (0.0%) |
| $25,000 to $34,999 | 6 (8.8%) | 0 (0.0%) |
| $35,000 to $49,999 | 21 (30.9%) | 0 (0.0%) |
| $50,000 to $74,999 | 8 (11.8%) | 0 (0.0%) |
| $75,000 to $99,999 | 14 (20.6%) | 0 (0.0%) |
| $100,000 to $149,999 | 7 (10.3%) | 0 (0.0%) |
| $150,000 or more | 12 (17.6%) | 0 (0.0%) |
| Total | 68 (100.0%) | 0 (0.0%) |
Monthly Housing Cost Tiers in North Lawrence
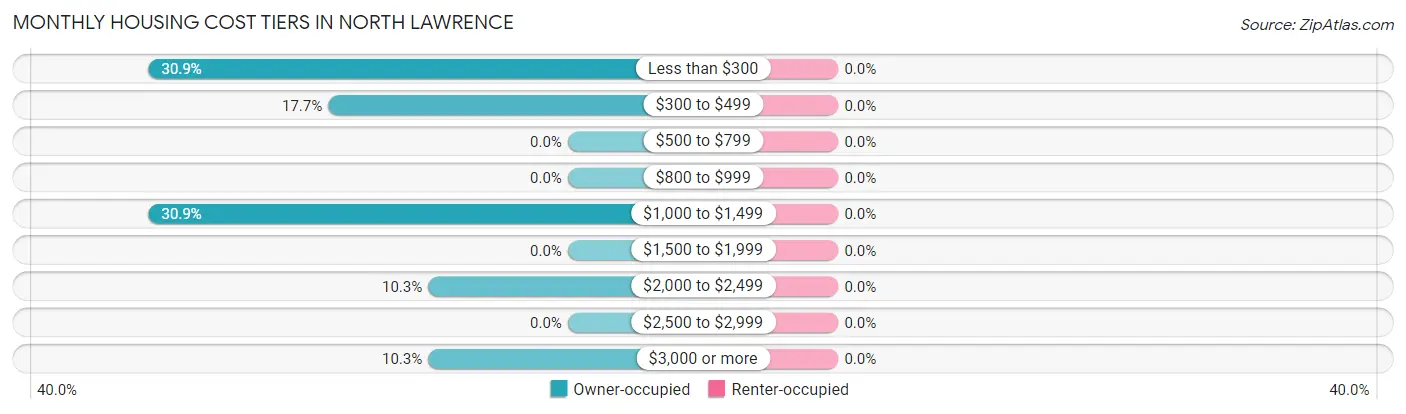
| Monthly Cost | Owner-occupied | Renter-occupied |
| Less than $300 | 21 (30.9%) | 0 (0.0%) |
| $300 to $499 | 12 (17.6%) | 0 (0.0%) |
| $500 to $799 | 0 (0.0%) | 0 (0.0%) |
| $800 to $999 | 0 (0.0%) | 0 (0.0%) |
| $1,000 to $1,499 | 21 (30.9%) | 0 (0.0%) |
| $1,500 to $1,999 | 0 (0.0%) | 0 (0.0%) |
| $2,000 to $2,499 | 7 (10.3%) | 0 (0.0%) |
| $2,500 to $2,999 | 0 (0.0%) | 0 (0.0%) |
| $3,000 or more | 7 (10.3%) | 0 (0.0%) |
| Total | 68 (100.0%) | 0 (0.0%) |
Physical Housing Characteristics in North Lawrence
Housing Structures in North Lawrence
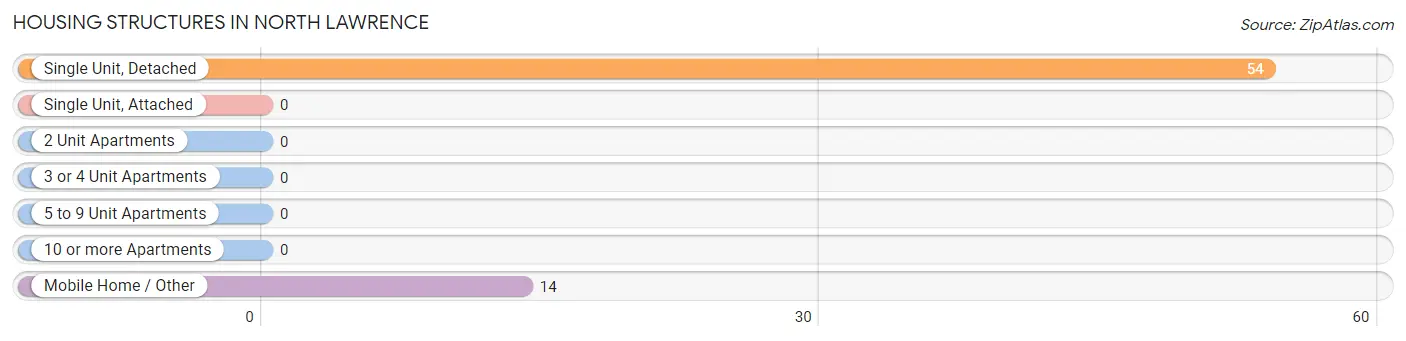
| Structure Type | # Housing Units | % Housing Units |
| Single Unit, Detached | 54 | 79.4% |
| Single Unit, Attached | 0 | 0.0% |
| 2 Unit Apartments | 0 | 0.0% |
| 3 or 4 Unit Apartments | 0 | 0.0% |
| 5 to 9 Unit Apartments | 0 | 0.0% |
| 10 or more Apartments | 0 | 0.0% |
| Mobile Home / Other | 14 | 20.6% |
| Total | 68 | 100.0% |
Housing Structures by Occupancy in North Lawrence
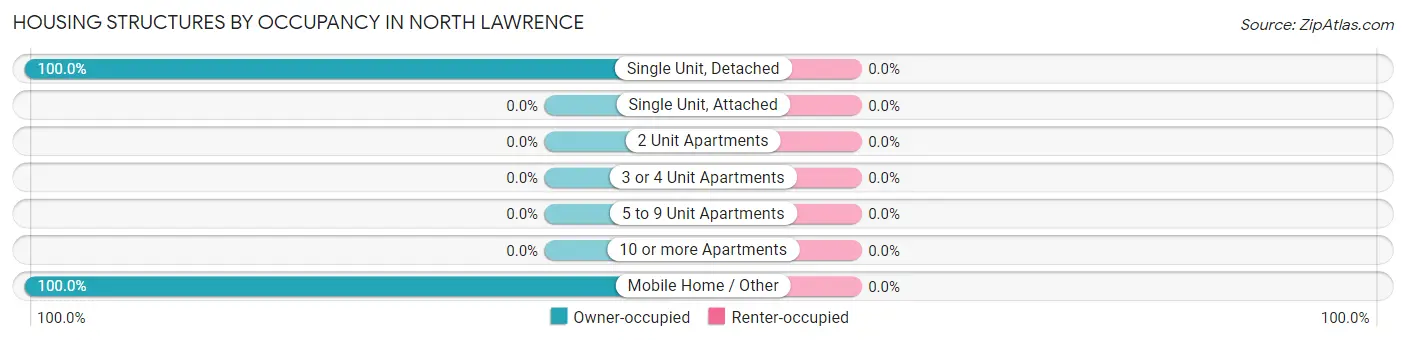
| Structure Type | Owner-occupied | Renter-occupied |
| Single Unit, Detached | 54 (100.0%) | 0 (0.0%) |
| Single Unit, Attached | 0 (0.0%) | 0 (0.0%) |
| 2 Unit Apartments | 0 (0.0%) | 0 (0.0%) |
| 3 or 4 Unit Apartments | 0 (0.0%) | 0 (0.0%) |
| 5 to 9 Unit Apartments | 0 (0.0%) | 0 (0.0%) |
| 10 or more Apartments | 0 (0.0%) | 0 (0.0%) |
| Mobile Home / Other | 14 (100.0%) | 0 (0.0%) |
| Total | 68 (100.0%) | 0 (0.0%) |
Housing Structures by Number of Rooms in North Lawrence
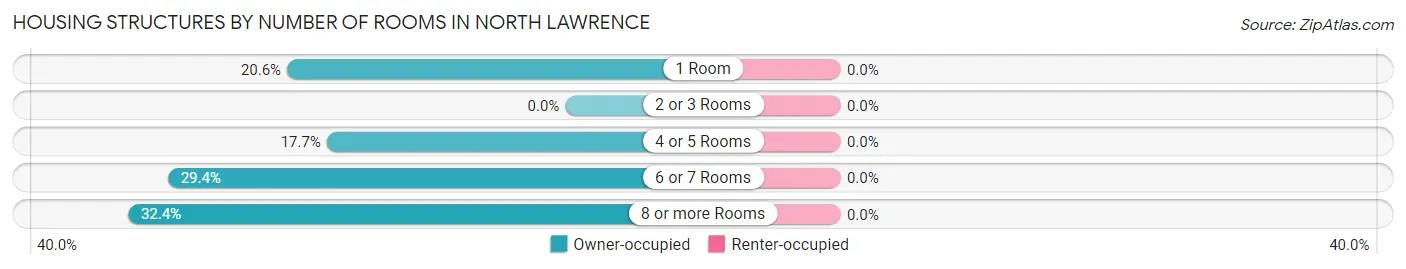
| Number of Rooms | Owner-occupied | Renter-occupied |
| 1 Room | 14 (20.6%) | 0 (0.0%) |
| 2 or 3 Rooms | 0 (0.0%) | 0 (0.0%) |
| 4 or 5 Rooms | 12 (17.6%) | 0 (0.0%) |
| 6 or 7 Rooms | 20 (29.4%) | 0 (0.0%) |
| 8 or more Rooms | 22 (32.4%) | 0 (0.0%) |
| Total | 68 (100.0%) | 0 (0.0%) |
Housing Structure by Heating Type in North Lawrence
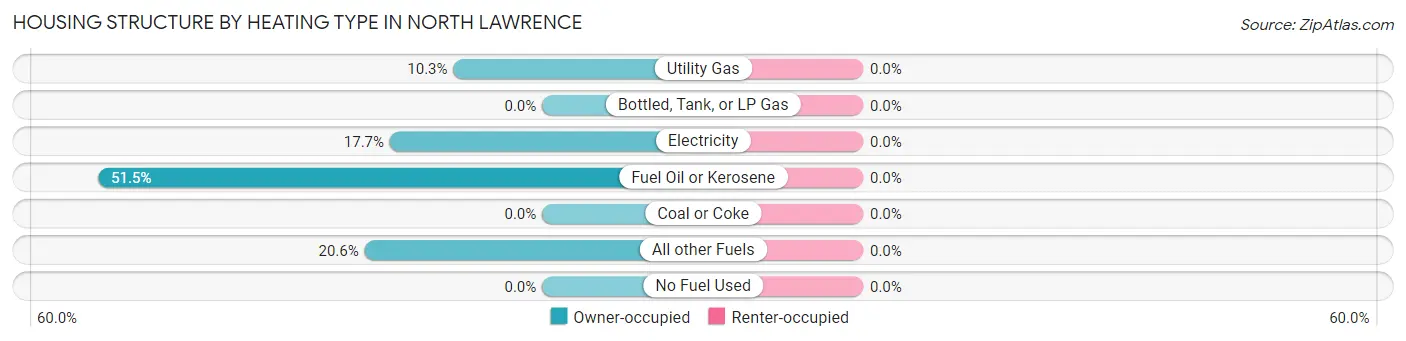
| Heating Type | Owner-occupied | Renter-occupied |
| Utility Gas | 7 (10.3%) | 0 (0.0%) |
| Bottled, Tank, or LP Gas | 0 (0.0%) | 0 (0.0%) |
| Electricity | 12 (17.6%) | 0 (0.0%) |
| Fuel Oil or Kerosene | 35 (51.5%) | 0 (0.0%) |
| Coal or Coke | 0 (0.0%) | 0 (0.0%) |
| All other Fuels | 14 (20.6%) | 0 (0.0%) |
| No Fuel Used | 0 (0.0%) | 0 (0.0%) |
| Total | 68 (100.0%) | 0 (0.0%) |
Household Vehicle Usage in North Lawrence
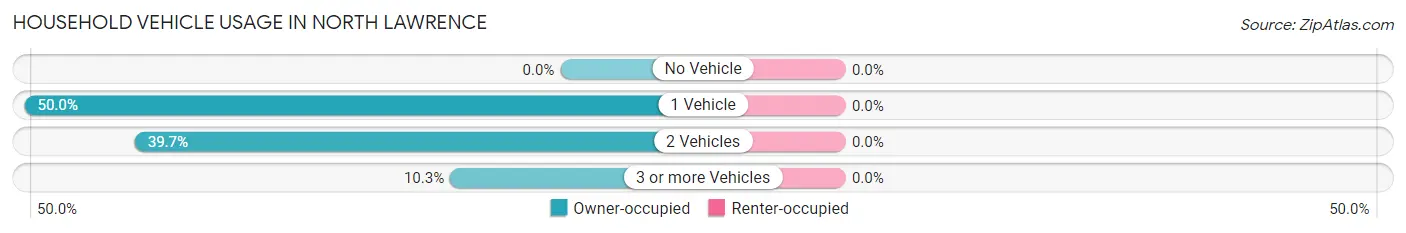
| Vehicles per Household | Owner-occupied | Renter-occupied |
| No Vehicle | 0 (0.0%) | 0 (0.0%) |
| 1 Vehicle | 34 (50.0%) | 0 (0.0%) |
| 2 Vehicles | 27 (39.7%) | 0 (0.0%) |
| 3 or more Vehicles | 7 (10.3%) | 0 (0.0%) |
| Total | 68 (100.0%) | 0 (0.0%) |
Real Estate & Mortgages in North Lawrence
Real Estate and Mortgage Overview in North Lawrence
| Characteristic | Without Mortgage | With Mortgage |
| Housing Units | 33 | 35 |
| Median Property Value | $96,800 | $189,100 |
| Median Household Income | - | - |
| Monthly Housing Costs | - | - |
| Real Estate Taxes | - | - |
Property Value by Mortgage Status in North Lawrence
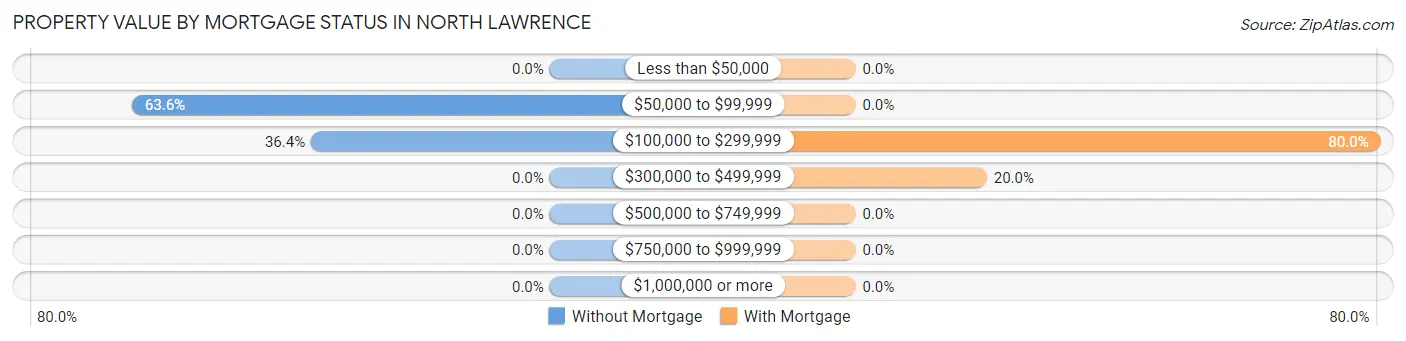
| Property Value | Without Mortgage | With Mortgage |
| Less than $50,000 | 0 (0.0%) | 0 (0.0%) |
| $50,000 to $99,999 | 21 (63.6%) | 0 (0.0%) |
| $100,000 to $299,999 | 12 (36.4%) | 28 (80.0%) |
| $300,000 to $499,999 | 0 (0.0%) | 7 (20.0%) |
| $500,000 to $749,999 | 0 (0.0%) | 0 (0.0%) |
| $750,000 to $999,999 | 0 (0.0%) | 0 (0.0%) |
| $1,000,000 or more | 0 (0.0%) | 0 (0.0%) |
| Total | 33 (100.0%) | 35 (100.0%) |
Household Income by Mortgage Status in North Lawrence
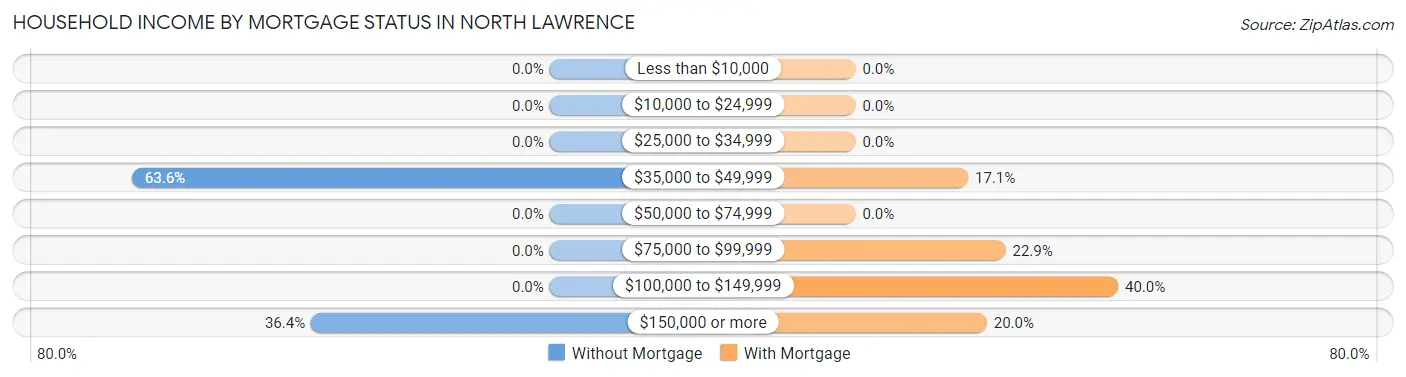
| Household Income | Without Mortgage | With Mortgage |
| Less than $10,000 | 0 (0.0%) | 0 (0.0%) |
| $10,000 to $24,999 | 0 (0.0%) | 0 (0.0%) |
| $25,000 to $34,999 | 0 (0.0%) | 0 (0.0%) |
| $35,000 to $49,999 | 21 (63.6%) | 6 (17.1%) |
| $50,000 to $74,999 | 0 (0.0%) | 0 (0.0%) |
| $75,000 to $99,999 | 0 (0.0%) | 8 (22.9%) |
| $100,000 to $149,999 | 0 (0.0%) | 14 (40.0%) |
| $150,000 or more | 12 (36.4%) | 7 (20.0%) |
| Total | 33 (100.0%) | 35 (100.0%) |
Property Value to Household Income Ratio in North Lawrence
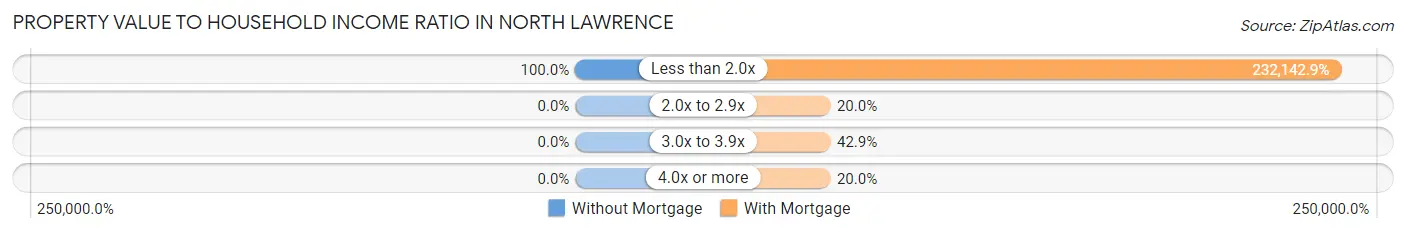
| Value-to-Income Ratio | Without Mortgage | With Mortgage |
| Less than 2.0x | 33 (100.0%) | 81,250 (232,142.9%) |
| 2.0x to 2.9x | 0 (0.0%) | 7 (20.0%) |
| 3.0x to 3.9x | 0 (0.0%) | 15 (42.9%) |
| 4.0x or more | 0 (0.0%) | 7 (20.0%) |
| Total | 33 (100.0%) | 35 (100.0%) |
Real Estate Taxes by Mortgage Status in North Lawrence
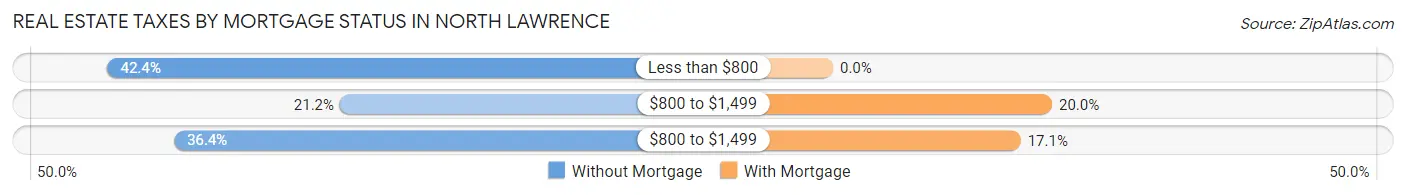
| Property Taxes | Without Mortgage | With Mortgage |
| Less than $800 | 14 (42.4%) | 0 (0.0%) |
| $800 to $1,499 | 7 (21.2%) | 7 (20.0%) |
| $800 to $1,499 | 12 (36.4%) | 6 (17.1%) |
| Total | 33 (100.0%) | 35 (100.0%) |
Health & Disability in North Lawrence
Health Insurance Coverage by Age in North Lawrence
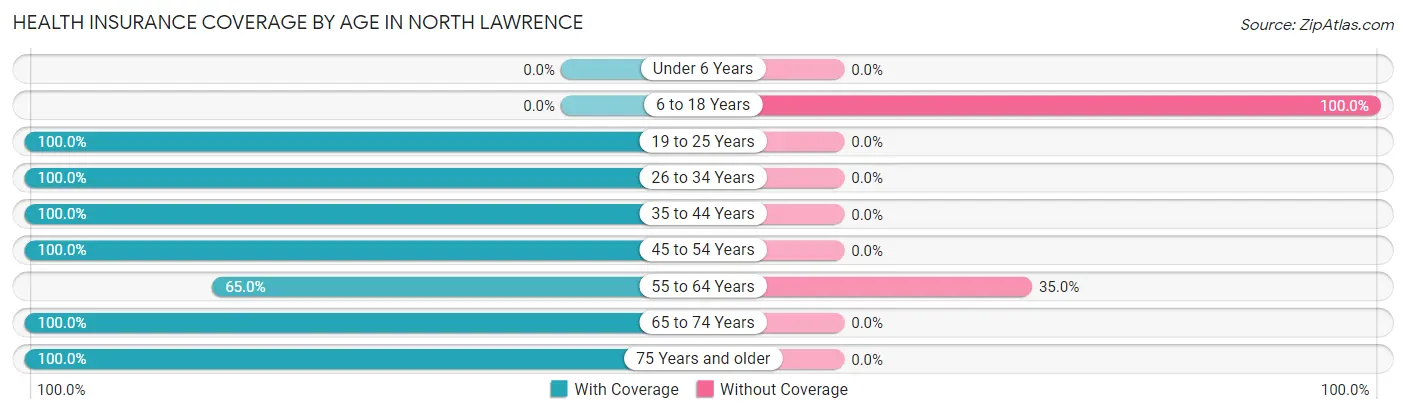
| Age Bracket | With Coverage | Without Coverage |
| Under 6 Years | 0 (0.0%) | 0 (0.0%) |
| 6 to 18 Years | 0 (0.0%) | 8 (100.0%) |
| 19 to 25 Years | 13 (100.0%) | 0 (0.0%) |
| 26 to 34 Years | 18 (100.0%) | 0 (0.0%) |
| 35 to 44 Years | 14 (100.0%) | 0 (0.0%) |
| 45 to 54 Years | 32 (100.0%) | 0 (0.0%) |
| 55 to 64 Years | 13 (65.0%) | 7 (35.0%) |
| 65 to 74 Years | 21 (100.0%) | 0 (0.0%) |
| 75 Years and older | 7 (100.0%) | 0 (0.0%) |
| Total | 118 (88.7%) | 15 (11.3%) |
Health Insurance Coverage by Citizenship Status in North Lawrence
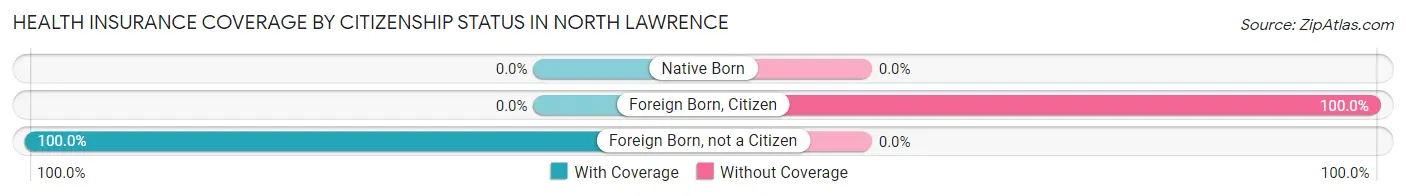
| Citizenship Status | With Coverage | Without Coverage |
| Native Born | 0 (0.0%) | 0 (0.0%) |
| Foreign Born, Citizen | 0 (0.0%) | 8 (100.0%) |
| Foreign Born, not a Citizen | 13 (100.0%) | 0 (0.0%) |
Health Insurance Coverage by Household Income in North Lawrence
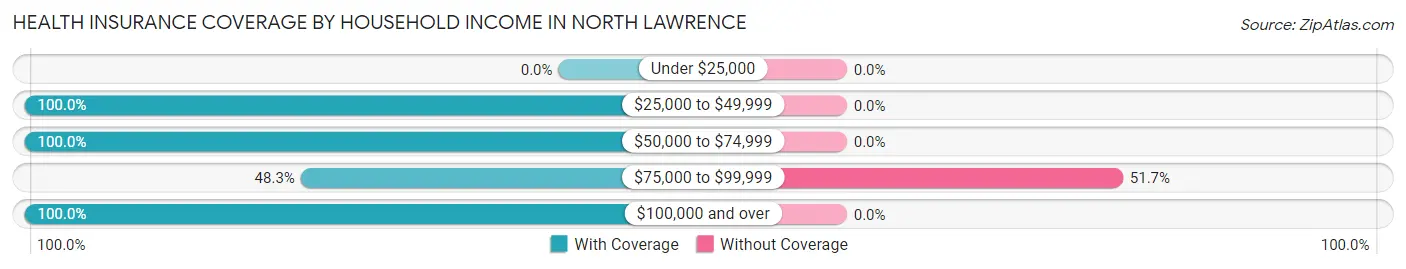
| Household Income | With Coverage | Without Coverage |
| Under $25,000 | 0 (0.0%) | 0 (0.0%) |
| $25,000 to $49,999 | 34 (100.0%) | 0 (0.0%) |
| $50,000 to $74,999 | 18 (100.0%) | 0 (0.0%) |
| $75,000 to $99,999 | 14 (48.3%) | 15 (51.7%) |
| $100,000 and over | 52 (100.0%) | 0 (0.0%) |
Public vs Private Health Insurance Coverage by Age in North Lawrence
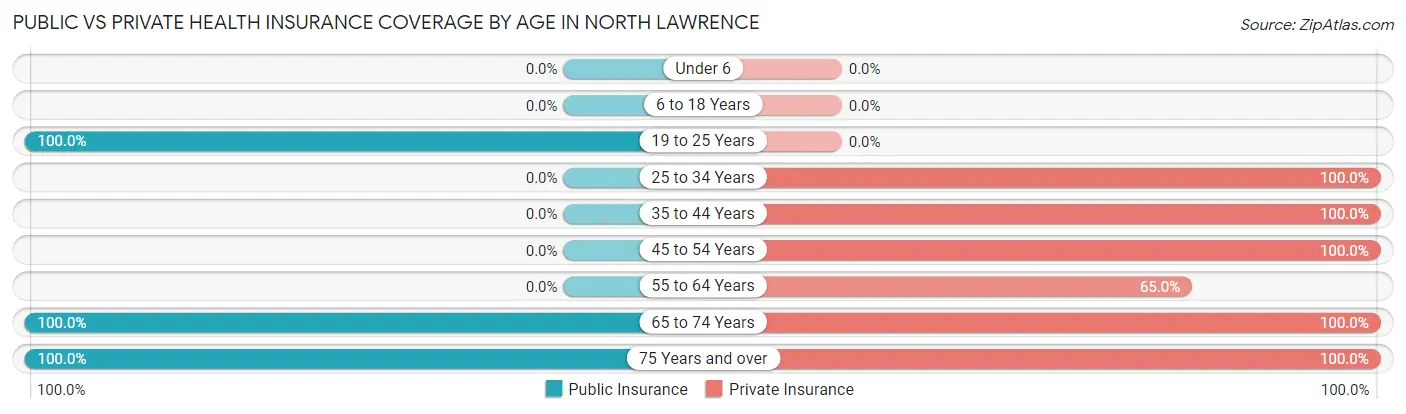
| Age Bracket | Public Insurance | Private Insurance |
| Under 6 | 0 (0.0%) | 0 (0.0%) |
| 6 to 18 Years | 0 (0.0%) | 0 (0.0%) |
| 19 to 25 Years | 13 (100.0%) | 0 (0.0%) |
| 25 to 34 Years | 0 (0.0%) | 18 (100.0%) |
| 35 to 44 Years | 0 (0.0%) | 14 (100.0%) |
| 45 to 54 Years | 0 (0.0%) | 32 (100.0%) |
| 55 to 64 Years | 0 (0.0%) | 13 (65.0%) |
| 65 to 74 Years | 21 (100.0%) | 21 (100.0%) |
| 75 Years and over | 7 (100.0%) | 7 (100.0%) |
| Total | 41 (30.8%) | 105 (78.9%) |
Disability Status by Sex by Age in North Lawrence
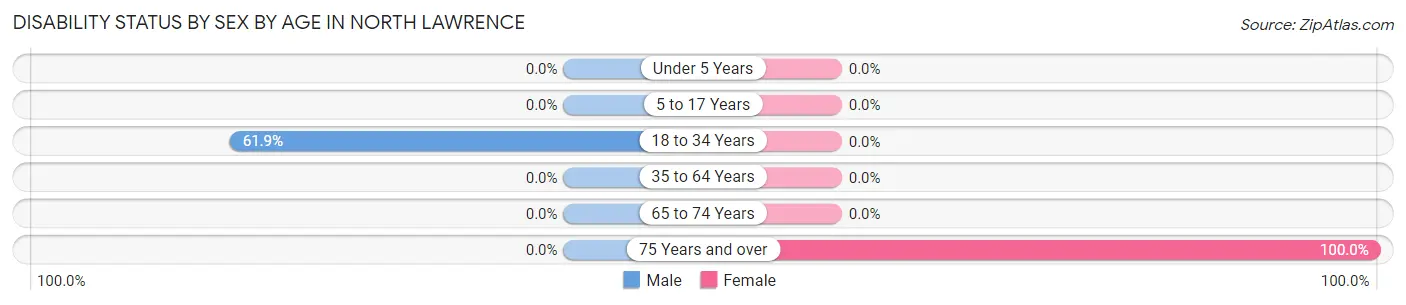
| Age Bracket | Male | Female |
| Under 5 Years | 0 (0.0%) | 0 (0.0%) |
| 5 to 17 Years | 0 (0.0%) | 0 (0.0%) |
| 18 to 34 Years | 13 (61.9%) | 0 (0.0%) |
| 35 to 64 Years | 0 (0.0%) | 0 (0.0%) |
| 65 to 74 Years | 0 (0.0%) | 0 (0.0%) |
| 75 Years and over | 0 (0.0%) | 7 (100.0%) |
Disability Class by Sex by Age in North Lawrence
Disability Class: Hearing Difficulty
| Age Bracket | Male | Female |
| Under 5 Years | 0 (0.0%) | 0 (0.0%) |
| 5 to 17 Years | 0 (0.0%) | 0 (0.0%) |
| 18 to 34 Years | 0 (0.0%) | 0 (0.0%) |
| 35 to 64 Years | 0 (0.0%) | 0 (0.0%) |
| 65 to 74 Years | 0 (0.0%) | 0 (0.0%) |
| 75 Years and over | 0 (0.0%) | 0 (0.0%) |
Disability Class: Vision Difficulty
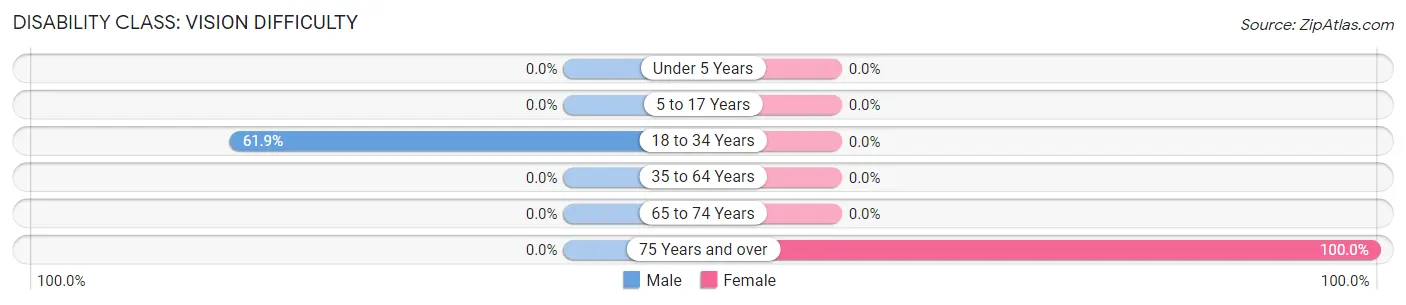
| Age Bracket | Male | Female |
| Under 5 Years | 0 (0.0%) | 0 (0.0%) |
| 5 to 17 Years | 0 (0.0%) | 0 (0.0%) |
| 18 to 34 Years | 13 (61.9%) | 0 (0.0%) |
| 35 to 64 Years | 0 (0.0%) | 0 (0.0%) |
| 65 to 74 Years | 0 (0.0%) | 0 (0.0%) |
| 75 Years and over | 0 (0.0%) | 7 (100.0%) |
Disability Class: Cognitive Difficulty
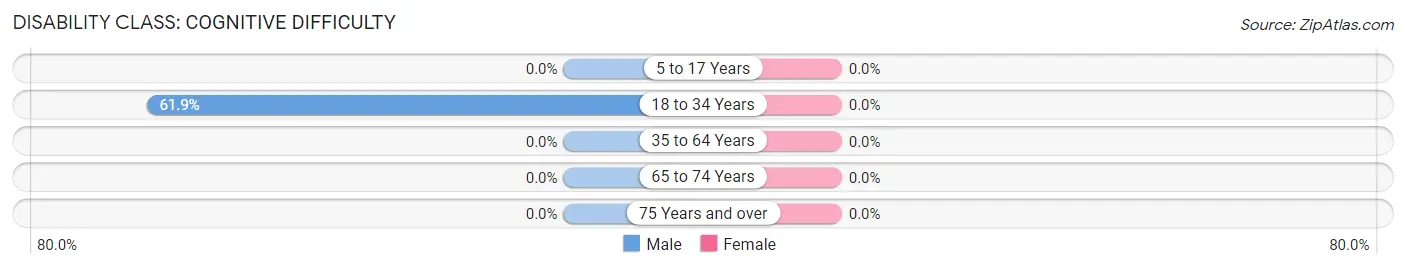
| Age Bracket | Male | Female |
| 5 to 17 Years | 0 (0.0%) | 0 (0.0%) |
| 18 to 34 Years | 13 (61.9%) | 0 (0.0%) |
| 35 to 64 Years | 0 (0.0%) | 0 (0.0%) |
| 65 to 74 Years | 0 (0.0%) | 0 (0.0%) |
| 75 Years and over | 0 (0.0%) | 0 (0.0%) |
Disability Class: Ambulatory Difficulty
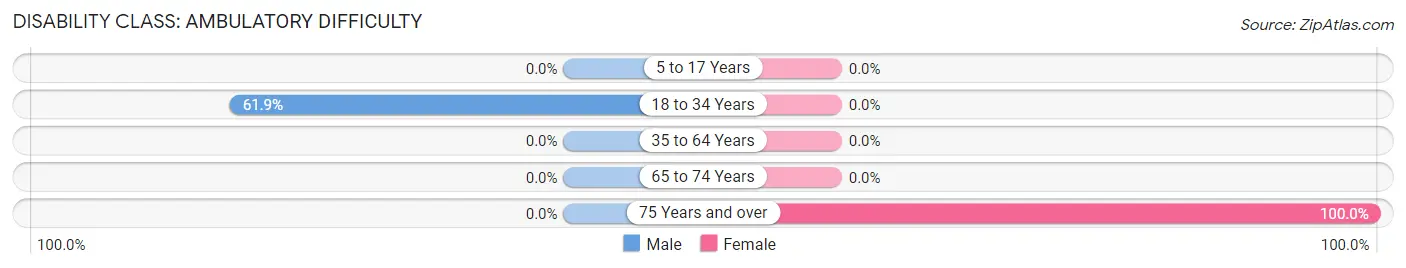
| Age Bracket | Male | Female |
| 5 to 17 Years | 0 (0.0%) | 0 (0.0%) |
| 18 to 34 Years | 13 (61.9%) | 0 (0.0%) |
| 35 to 64 Years | 0 (0.0%) | 0 (0.0%) |
| 65 to 74 Years | 0 (0.0%) | 0 (0.0%) |
| 75 Years and over | 0 (0.0%) | 7 (100.0%) |
Disability Class: Self-Care Difficulty
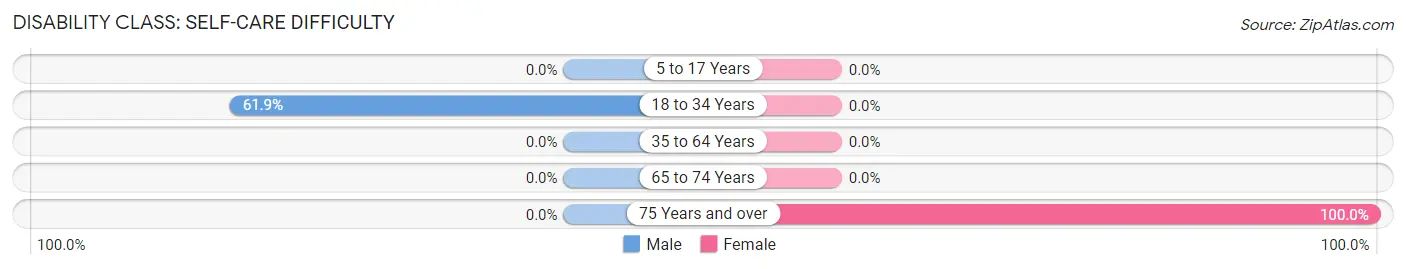
| Age Bracket | Male | Female |
| 5 to 17 Years | 0 (0.0%) | 0 (0.0%) |
| 18 to 34 Years | 13 (61.9%) | 0 (0.0%) |
| 35 to 64 Years | 0 (0.0%) | 0 (0.0%) |
| 65 to 74 Years | 0 (0.0%) | 0 (0.0%) |
| 75 Years and over | 0 (0.0%) | 7 (100.0%) |
Technology Access in North Lawrence
Computing Device Access in North Lawrence
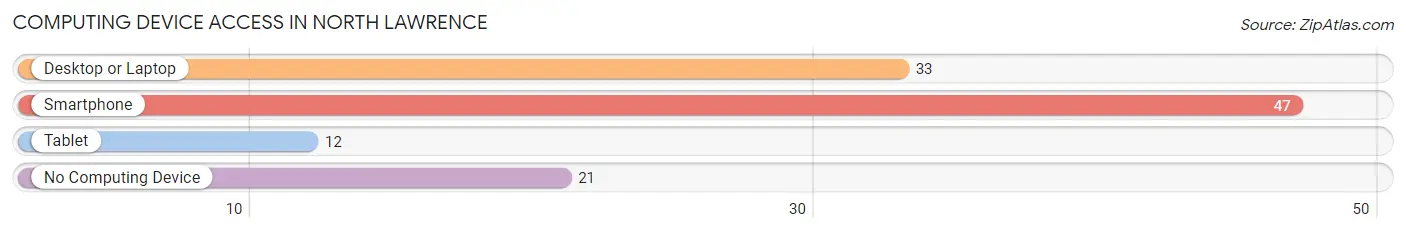
| Device Type | # Households | % Households |
| Desktop or Laptop | 33 | 48.5% |
| Smartphone | 47 | 69.1% |
| Tablet | 12 | 17.6% |
| No Computing Device | 21 | 30.9% |
| Total | 68 | 100.0% |
Internet Access in North Lawrence
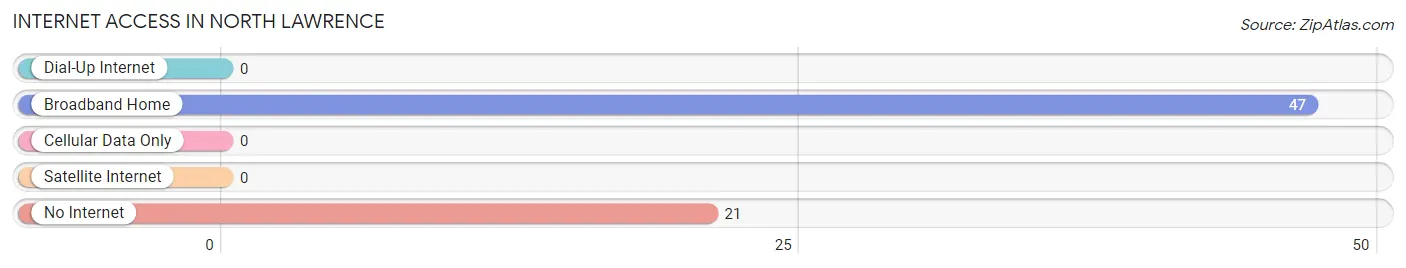
| Internet Type | # Households | % Households |
| Dial-Up Internet | 0 | 0.0% |
| Broadband Home | 47 | 69.1% |
| Cellular Data Only | 0 | 0.0% |
| Satellite Internet | 0 | 0.0% |
| No Internet | 21 | 30.9% |
| Total | 68 | 100.0% |
North Lawrence Summary
North Lawrence is a small village located in Stark County, Ohio, United States. The village is situated in the northeast corner of the county, just south of the city of Canton. The population of North Lawrence was 1,845 at the 2010 census.
History
North Lawrence was founded in 1815 by a group of settlers from Lawrence Township, Pennsylvania. The village was originally known as Lawrenceville, but the name was changed to North Lawrence in 1820. The village was incorporated in 1867.
The village was a major stop on the Ohio and Erie Canal, which was built in the early 19th century. The canal was used to transport goods and people between Cleveland and Portsmouth. The canal was abandoned in the late 19th century, but the village still retains its historic charm.
Geography
North Lawrence is located at 40°48'25"N 81°25'45"W (40.806944, -81.429167). The village is situated in the northeast corner of Stark County, just south of the city of Canton. The village is bordered by the townships of Lawrence, Osnaburg, and Bethlehem.
The village is situated on the banks of the Nimishillen Creek, which flows through the village and into the Tuscarawas River. The village is located in the Appalachian Plateau region of Ohio, and is surrounded by rolling hills and forests.
Economy
The economy of North Lawrence is largely based on agriculture and manufacturing. The village is home to several small businesses, including a grocery store, a hardware store, and a few restaurants. The village is also home to a number of small farms, which produce a variety of crops, including corn, soybeans, and wheat.
The village is also home to several manufacturing companies, including a plastics manufacturer, a metal fabricator, and a machine shop. The village is also home to a number of small service businesses, including a gas station, a car wash, and a few auto repair shops.
Demographics
As of the 2010 census, the population of North Lawrence was 1,845. The racial makeup of the village was 97.3% White, 0.7% African American, 0.2% Native American, 0.2% Asian, 0.1% Pacific Islander, 0.3% from other races, and 1.3% from two or more races. Hispanic or Latino of any race were 1.2% of the population.
The median income for a household in the village was $41,250, and the median income for a family was $48,750. The per capita income for the village was $19,945. About 8.3% of families and 10.2% of the population were below the poverty line, including 14.2% of those under age 18 and 5.2% of those age 65 or over.
Common Questions
What is Per Capita Income in North Lawrence?
Per Capita income in North Lawrence is $83,778.
What is the Median Family Income in North Lawrence?
Median Family Income in North Lawrence is $71,563.
What is the Median Household income in North Lawrence?
Median Household Income in North Lawrence is $72,188.
What is Income or Wage Gap in North Lawrence?
Income or Wage Gap in North Lawrence is 41.7%.
Women in North Lawrence earn 58.3 cents for every dollar earned by a man.
What is Inequality or Gini Index in North Lawrence?
Inequality or Gini Index in North Lawrence is 0.55.
What is the Total Population of North Lawrence?
Total Population of North Lawrence is 133.
What is the Total Male Population of North Lawrence?
Total Male Population of North Lawrence is 77.
What is the Total Female Population of North Lawrence?
Total Female Population of North Lawrence is 56.
What is the Ratio of Males per 100 Females in North Lawrence?
There are 137.50 Males per 100 Females in North Lawrence.
What is the Ratio of Females per 100 Males in North Lawrence?
There are 72.73 Females per 100 Males in North Lawrence.
What is the Median Population Age in North Lawrence?
Median Population Age in North Lawrence is 45.5 Years.
What is the Average Family Size in North Lawrence
Average Family Size in North Lawrence is 2.1 People.
What is the Average Household Size in North Lawrence
Average Household Size in North Lawrence is 2.0 People.
How Large is the Labor Force in North Lawrence?
There are 97 People in the Labor Forcein in North Lawrence.
What is the Percentage of People in the Labor Force in North Lawrence?
72.9% of People are in the Labor Force in North Lawrence.