Zip Codes with the Highest Percentage of Households with Income Above $200,000 in Ohio
RELATED REPORTS & OPTIONS
Household Income | $200k+
Ohio
Compare Zip Codes
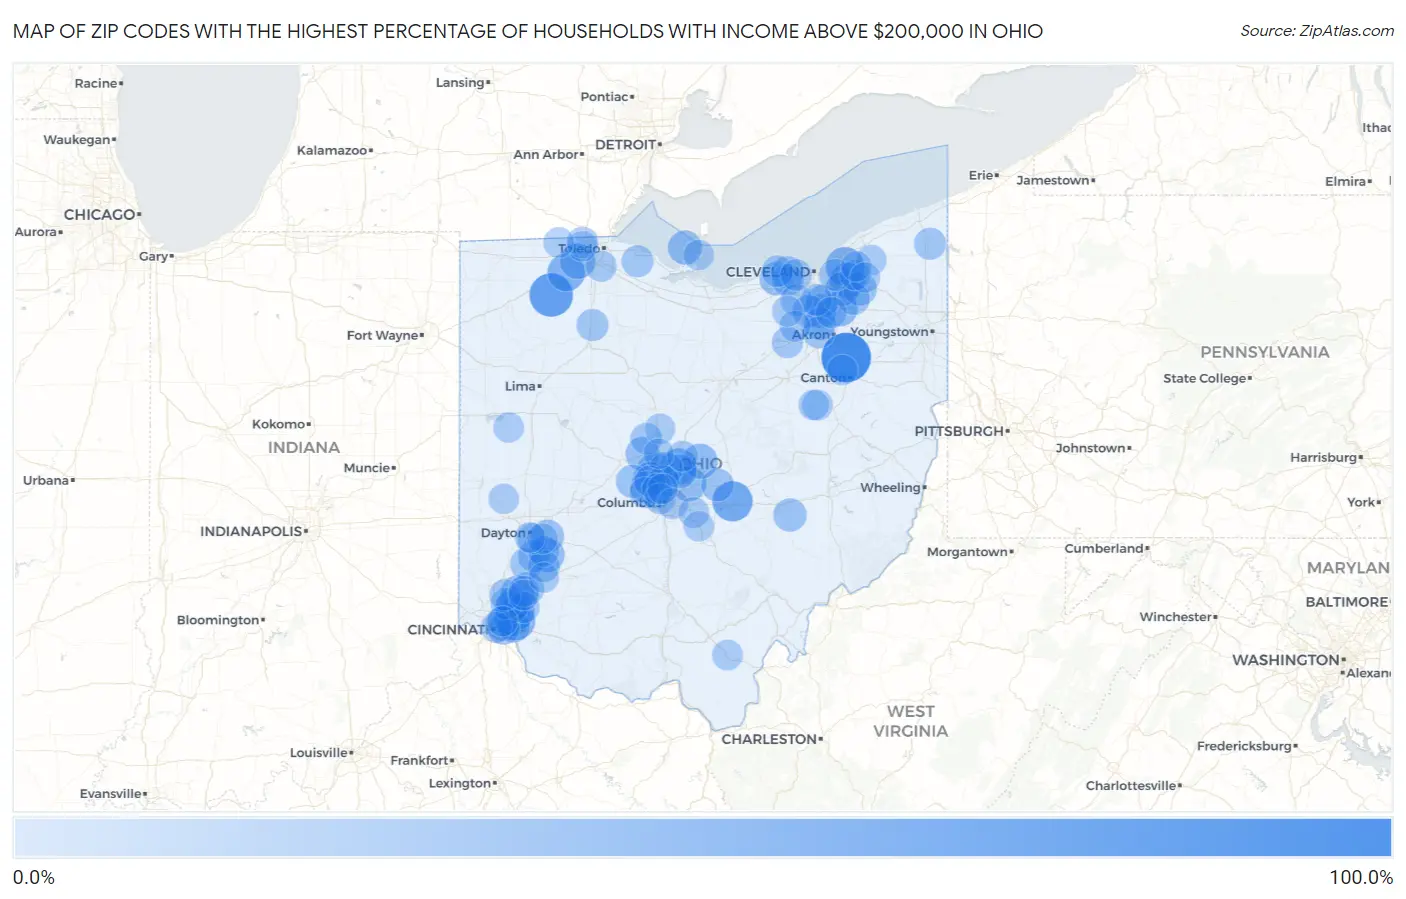
Map of Zip Codes with the Highest Percentage of Households with Income Above $200,000 in Ohio
0.0%
100.0%
Zip Codes with the Highest Percentage of Households with Income Above $200,000 in Ohio
| Zip Code | Households with Income > $200k | vs State | vs National | |
| 1. | 44630 | 100.0% | 7.6%(+92.4)#1 | 11.4%(+88.6)#3 |
| 2. | 43523 | 72.4% | 7.6%(+64.8)#2 | 11.4%(+61.0)#50 |
| 3. | 43030 | 57.9% | 7.6%(+50.3)#3 | 11.4%(+46.5)#135 |
| 4. | 44040 | 49.7% | 7.6%(+42.1)#4 | 11.4%(+38.3)#290 |
| 5. | 45174 | 47.1% | 7.6%(+39.5)#5 | 11.4%(+35.7)#355 |
| 6. | 43547 | 46.5% | 7.6%(+38.9)#6 | 11.4%(+35.1)#374 |
| 7. | 45243 | 41.2% | 7.6%(+33.6)#7 | 11.4%(+29.8)#587 |
| 8. | 43021 | 38.5% | 7.6%(+30.9)#8 | 11.4%(+27.1)#743 |
| 9. | 43542 | 36.7% | 7.6%(+29.1)#9 | 11.4%(+25.3)#863 |
| 10. | 44236 | 35.9% | 7.6%(+28.3)#10 | 11.4%(+24.5)#908 |
| 11. | 44022 | 35.7% | 7.6%(+28.1)#11 | 11.4%(+24.3)#924 |
| 12. | 43054 | 35.0% | 7.6%(+27.4)#12 | 11.4%(+23.6)#977 |
| 13. | 43013 | 34.9% | 7.6%(+27.3)#13 | 11.4%(+23.5)#990 |
| 14. | 43065 | 34.0% | 7.6%(+26.4)#14 | 11.4%(+22.6)#1,058 |
| 15. | 45147 | 31.6% | 7.6%(+24.0)#15 | 11.4%(+20.2)#1,291 |
| 16. | 45370 | 30.9% | 7.6%(+23.3)#16 | 11.4%(+19.5)#1,363 |
| 17. | 45208 | 30.8% | 7.6%(+23.2)#17 | 11.4%(+19.4)#1,368 |
| 18. | 43456 | 30.7% | 7.6%(+23.1)#18 | 11.4%(+19.3)#1,382 |
| 19. | 44139 | 30.2% | 7.6%(+22.6)#19 | 11.4%(+18.8)#1,434 |
| 20. | 43061 | 29.4% | 7.6%(+21.8)#20 | 11.4%(+18.0)#1,539 |
| 21. | 45040 | 29.2% | 7.6%(+21.6)#21 | 11.4%(+17.8)#1,549 |
| 22. | 43017 | 28.9% | 7.6%(+21.3)#22 | 11.4%(+17.5)#1,586 |
| 23. | 44286 | 28.6% | 7.6%(+21.0)#23 | 11.4%(+17.2)#1,635 |
| 24. | 44023 | 28.4% | 7.6%(+20.8)#24 | 11.4%(+17.0)#1,668 |
| 25. | 43082 | 28.1% | 7.6%(+20.5)#25 | 11.4%(+16.7)#1,701 |
| 26. | 45249 | 27.9% | 7.6%(+20.3)#26 | 11.4%(+16.5)#1,747 |
| 27. | 44011 | 27.4% | 7.6%(+19.8)#27 | 11.4%(+16.0)#1,810 |
| 28. | 43035 | 27.3% | 7.6%(+19.7)#28 | 11.4%(+15.9)#1,825 |
| 29. | 43734 | 26.7% | 7.6%(+19.1)#29 | 11.4%(+15.3)#1,921 |
| 30. | 43064 | 26.3% | 7.6%(+18.7)#30 | 11.4%(+14.9)#1,981 |
| 31. | 45434 | 26.3% | 7.6%(+18.7)#31 | 11.4%(+14.9)#1,982 |
| 32. | 45065 | 26.3% | 7.6%(+18.7)#32 | 11.4%(+14.9)#1,985 |
| 33. | 43023 | 24.6% | 7.6%(+17.0)#33 | 11.4%(+13.2)#2,268 |
| 34. | 45244 | 24.2% | 7.6%(+16.6)#34 | 11.4%(+12.8)#2,332 |
| 35. | 45242 | 24.0% | 7.6%(+16.4)#35 | 11.4%(+12.6)#2,369 |
| 36. | 44140 | 24.0% | 7.6%(+16.4)#36 | 11.4%(+12.6)#2,371 |
| 37. | 44141 | 23.5% | 7.6%(+15.9)#37 | 11.4%(+12.1)#2,465 |
| 38. | 44233 | 23.5% | 7.6%(+15.9)#38 | 11.4%(+12.1)#2,466 |
| 39. | 43002 | 23.3% | 7.6%(+15.7)#39 | 11.4%(+11.9)#2,507 |
| 40. | 43221 | 22.9% | 7.6%(+15.3)#40 | 11.4%(+11.5)#2,570 |
| 41. | 44333 | 22.9% | 7.6%(+15.3)#41 | 11.4%(+11.5)#2,575 |
| 42. | 44202 | 22.7% | 7.6%(+15.1)#42 | 11.4%(+11.3)#2,623 |
| 43. | 45066 | 22.2% | 7.6%(+14.6)#43 | 11.4%(+10.8)#2,731 |
| 44. | 44122 | 21.9% | 7.6%(+14.3)#44 | 11.4%(+10.5)#2,794 |
| 45. | 45458 | 21.8% | 7.6%(+14.2)#45 | 11.4%(+10.4)#2,816 |
| 46. | 44145 | 21.3% | 7.6%(+13.7)#46 | 11.4%(+9.90)#2,929 |
| 47. | 44032 | 21.2% | 7.6%(+13.6)#47 | 11.4%(+9.80)#2,979 |
| 48. | 45068 | 21.0% | 7.6%(+13.4)#48 | 11.4%(+9.60)#3,029 |
| 49. | 45889 | 21.0% | 7.6%(+13.4)#49 | 11.4%(+9.60)#3,036 |
| 50. | 45226 | 20.9% | 7.6%(+13.3)#50 | 11.4%(+9.50)#3,062 |
| 51. | 43432 | 20.9% | 7.6%(+13.3)#51 | 11.4%(+9.50)#3,068 |
| 52. | 44321 | 20.8% | 7.6%(+13.2)#52 | 11.4%(+9.40)#3,081 |
| 53. | 44149 | 19.8% | 7.6%(+12.2)#53 | 11.4%(+8.40)#3,344 |
| 54. | 44147 | 19.8% | 7.6%(+12.2)#54 | 11.4%(+8.40)#3,345 |
| 55. | 43066 | 19.8% | 7.6%(+12.2)#55 | 11.4%(+8.40)#3,358 |
| 56. | 43085 | 19.7% | 7.6%(+12.1)#56 | 11.4%(+8.30)#3,367 |
| 57. | 44012 | 19.4% | 7.6%(+11.8)#57 | 11.4%(+8.00)#3,466 |
| 58. | 44116 | 19.4% | 7.6%(+11.8)#58 | 11.4%(+8.00)#3,468 |
| 59. | 43016 | 19.1% | 7.6%(+11.5)#59 | 11.4%(+7.70)#3,529 |
| 60. | 45241 | 18.8% | 7.6%(+11.2)#60 | 11.4%(+7.40)#3,617 |
| 61. | 44251 | 18.8% | 7.6%(+11.2)#61 | 11.4%(+7.40)#3,632 |
| 62. | 45140 | 18.6% | 7.6%(+11.0)#62 | 11.4%(+7.20)#3,666 |
| 63. | 45069 | 18.5% | 7.6%(+10.9)#63 | 11.4%(+7.10)#3,693 |
| 64. | 43560 | 18.5% | 7.6%(+10.9)#64 | 11.4%(+7.10)#3,700 |
| 65. | 44264 | 17.8% | 7.6%(+10.2)#65 | 11.4%(+6.40)#3,918 |
| 66. | 45305 | 17.6% | 7.6%(+10.0)#66 | 11.4%(+6.20)#3,975 |
| 67. | 44256 | 17.1% | 7.6%(+9.50)#67 | 11.4%(+5.70)#4,136 |
| 68. | 45034 | 17.0% | 7.6%(+9.40)#68 | 11.4%(+5.60)#4,202 |
| 69. | 43026 | 16.8% | 7.6%(+9.20)#69 | 11.4%(+5.40)#4,244 |
| 70. | 43551 | 16.8% | 7.6%(+9.20)#70 | 11.4%(+5.40)#4,247 |
| 71. | 43220 | 16.5% | 7.6%(+8.90)#71 | 11.4%(+5.10)#4,371 |
| 72. | 43212 | 16.5% | 7.6%(+8.90)#72 | 11.4%(+5.10)#4,377 |
| 73. | 45039 | 16.4% | 7.6%(+8.80)#73 | 11.4%(+5.00)#4,409 |
| 74. | 43074 | 16.4% | 7.6%(+8.80)#74 | 11.4%(+5.00)#4,417 |
| 75. | 43209 | 16.3% | 7.6%(+8.70)#75 | 11.4%(+4.90)#4,447 |
| 76. | 44280 | 16.2% | 7.6%(+8.60)#76 | 11.4%(+4.80)#4,497 |
| 77. | 45202 | 16.1% | 7.6%(+8.50)#77 | 11.4%(+4.70)#4,524 |
| 78. | 43147 | 15.8% | 7.6%(+8.20)#78 | 11.4%(+4.40)#4,637 |
| 79. | 45419 | 15.8% | 7.6%(+8.20)#79 | 11.4%(+4.40)#4,652 |
| 80. | 45685 | 15.5% | 7.6%(+7.90)#80 | 11.4%(+4.10)#4,786 |
| 81. | 44624 | 15.3% | 7.6%(+7.70)#81 | 11.4%(+3.90)#4,865 |
| 82. | 44072 | 15.3% | 7.6%(+7.70)#82 | 11.4%(+3.90)#4,866 |
| 83. | 45430 | 15.1% | 7.6%(+7.50)#83 | 11.4%(+3.70)#4,949 |
| 84. | 44718 | 15.0% | 7.6%(+7.40)#84 | 11.4%(+3.60)#4,988 |
| 85. | 44024 | 14.9% | 7.6%(+7.30)#85 | 11.4%(+3.50)#5,031 |
| 86. | 44690 | 14.9% | 7.6%(+7.30)#86 | 11.4%(+3.50)#5,069 |
| 87. | 43356 | 14.8% | 7.6%(+7.20)#87 | 11.4%(+3.40)#5,103 |
| 88. | 43617 | 14.7% | 7.6%(+7.10)#88 | 11.4%(+3.30)#5,139 |
| 89. | 43112 | 14.7% | 7.6%(+7.10)#89 | 11.4%(+3.30)#5,144 |
| 90. | 43214 | 14.6% | 7.6%(+7.00)#90 | 11.4%(+3.20)#5,179 |
| 91. | 45054 | 14.5% | 7.6%(+6.90)#91 | 11.4%(+3.10)#5,235 |
| 92. | 43438 | 14.5% | 7.6%(+6.90)#92 | 11.4%(+3.10)#5,244 |
| 93. | 45337 | 14.4% | 7.6%(+6.80)#93 | 11.4%(+3.00)#5,283 |
| 94. | 43540 | 14.4% | 7.6%(+6.80)#94 | 11.4%(+3.00)#5,285 |
| 95. | 45869 | 14.3% | 7.6%(+6.70)#95 | 11.4%(+2.90)#5,320 |
| 96. | 44026 | 14.2% | 7.6%(+6.60)#96 | 11.4%(+2.80)#5,364 |
| 97. | 44065 | 14.2% | 7.6%(+6.60)#97 | 11.4%(+2.80)#5,376 |
| 98. | 43015 | 14.1% | 7.6%(+6.50)#98 | 11.4%(+2.70)#5,400 |
| 99. | 45409 | 14.1% | 7.6%(+6.50)#99 | 11.4%(+2.70)#5,419 |
| 100. | 45209 | 14.0% | 7.6%(+6.40)#100 | 11.4%(+2.60)#5,474 |
Common Questions
What are the Top 10 Zip Codes with the Highest Percentage of Households with Income Above $200,000 in Ohio?
Top 10 Zip Codes with the Highest Percentage of Households with Income Above $200,000 in Ohio are:
What zip code has the Highest Percentage of Households with Income Above $200,000 in Ohio?
44630 has the Highest Percentage of Households with Income Above $200,000 in Ohio with 100.0%.
What is the Percentage of Households with Income Above $200,000 in the State of Ohio?
Percentage of Households with Income Above $200,000 in Ohio is 7.6%.
What is the Percentage of Households with Income Above $200,000 in the United States?
Percentage of Households with Income Above $200,000 in the United States is 11.4%.