Zoar, OH Map & Demographics
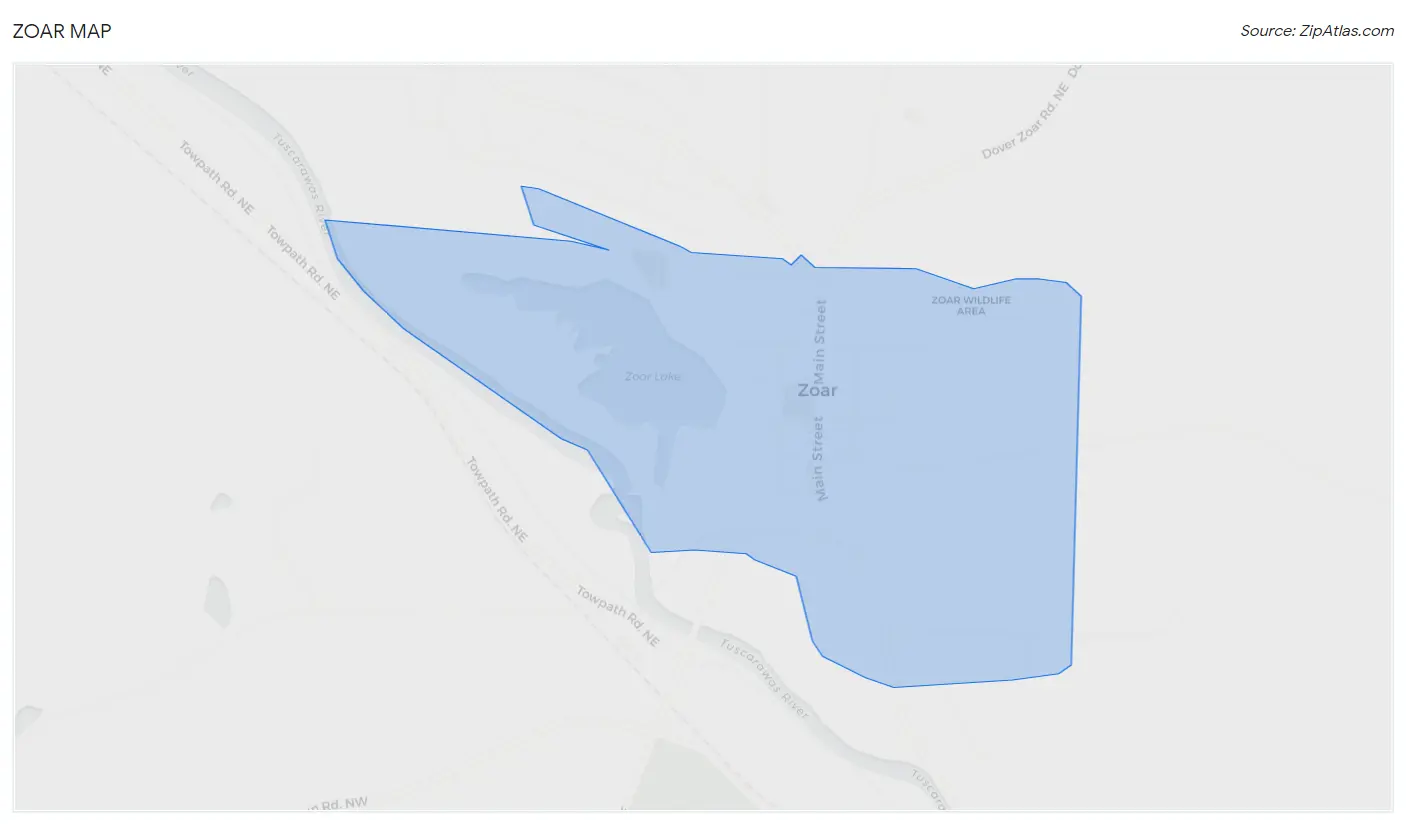
Zoar Map
Zoar Overview
$33,557
PER CAPITA INCOME
$103,750
AVG FAMILY INCOME
$90,000
AVG HOUSEHOLD INCOME
0.28
INEQUALITY / GINI INDEX
206
TOTAL POPULATION
107
MALE POPULATION
99
FEMALE POPULATION
108.08
MALES / 100 FEMALES
92.52
FEMALES / 100 MALES
42.5
MEDIAN AGE
3.2
AVG FAMILY SIZE
2.6
AVG HOUSEHOLD SIZE
101
LABOR FORCE [ PEOPLE ]
61.6%
PERCENT IN LABOR FORCE
Zoar Zip Codes
Income in Zoar
Income Overview in Zoar
Per Capita Income in Zoar is $33,557, while median incomes of families and households are $103,750 and $90,000 respectively.
| Characteristic | Number | Measure |
| Per Capita Income | 206 | $33,557 |
| Median Family Income | 58 | $103,750 |
| Mean Family Income | 58 | $92,643 |
| Median Household Income | 78 | $90,000 |
| Mean Household Income | 78 | $84,795 |
| Income Deficit | 58 | $0 |
| Wage / Income Gap (%) | 206 | 0.00% |
| Wage / Income Gap ($) | 206 | 100.00¢ per $1 |
| Gini / Inequality Index | 206 | 0.28 |
Earnings by Sex in Zoar
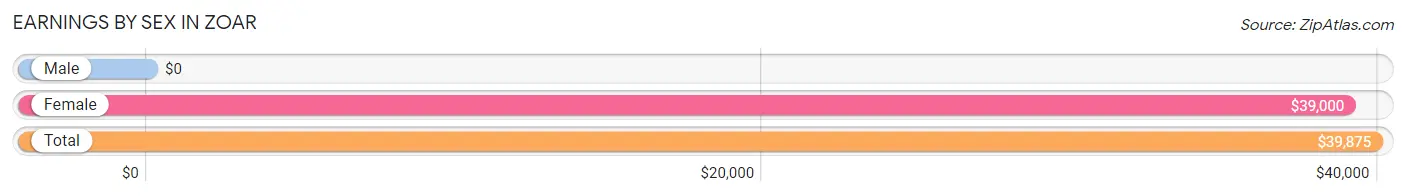
| Sex | Number | Average Earnings |
| Male | 67 (62.6%) | $0 |
| Female | 40 (37.4%) | $39,000 |
| Total | 107 (100.0%) | $39,875 |
Earnings by Sex by Income Bracket in Zoar
The most common earnings brackets in Zoar are $65,000 to $74,999 for men (15 | 22.4%) and $35,000 to $39,999 for women (10 | 25.0%).
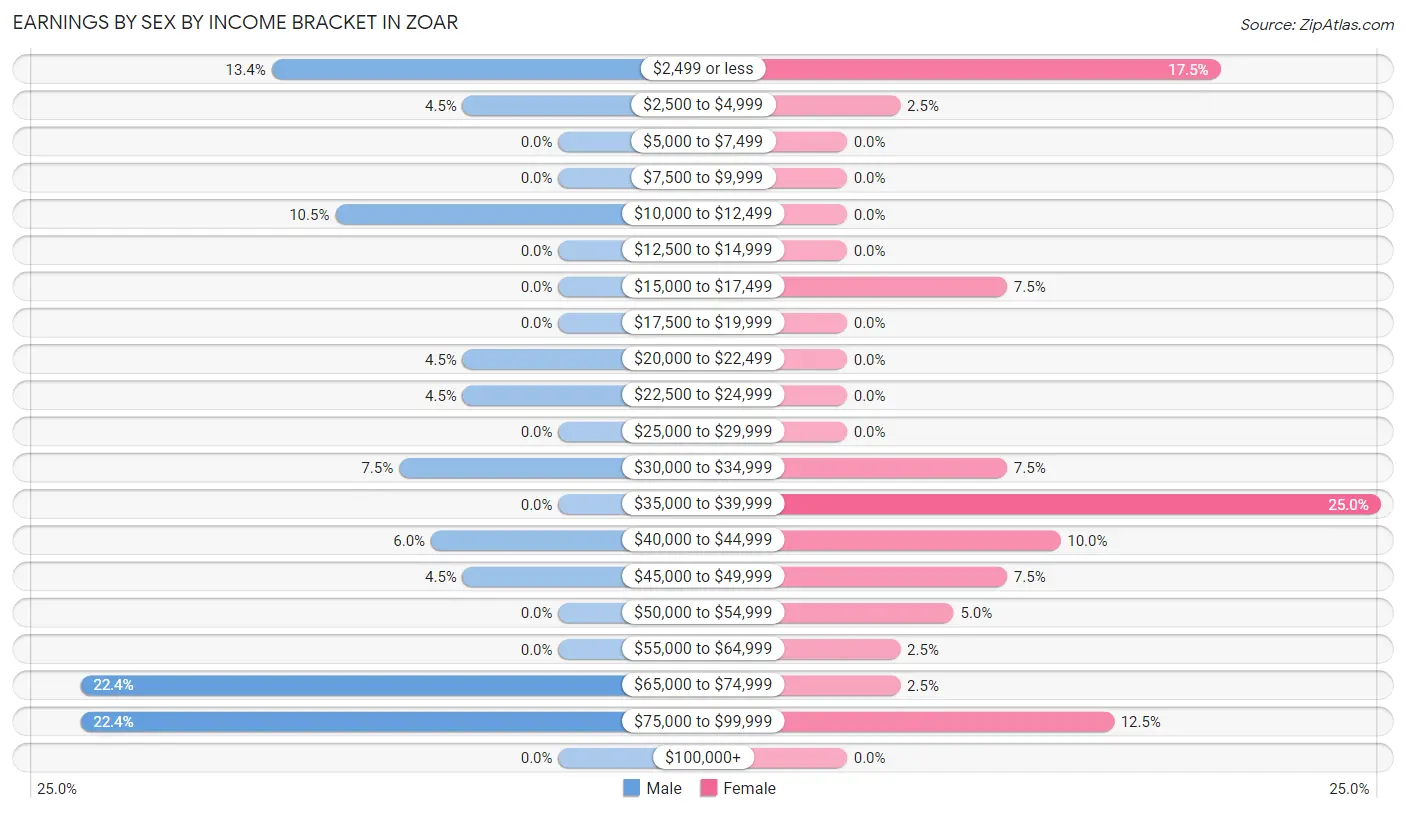
| Income | Male | Female |
| $2,499 or less | 9 (13.4%) | 7 (17.5%) |
| $2,500 to $4,999 | 3 (4.5%) | 1 (2.5%) |
| $5,000 to $7,499 | 0 (0.0%) | 0 (0.0%) |
| $7,500 to $9,999 | 0 (0.0%) | 0 (0.0%) |
| $10,000 to $12,499 | 7 (10.4%) | 0 (0.0%) |
| $12,500 to $14,999 | 0 (0.0%) | 0 (0.0%) |
| $15,000 to $17,499 | 0 (0.0%) | 3 (7.5%) |
| $17,500 to $19,999 | 0 (0.0%) | 0 (0.0%) |
| $20,000 to $22,499 | 3 (4.5%) | 0 (0.0%) |
| $22,500 to $24,999 | 3 (4.5%) | 0 (0.0%) |
| $25,000 to $29,999 | 0 (0.0%) | 0 (0.0%) |
| $30,000 to $34,999 | 5 (7.5%) | 3 (7.5%) |
| $35,000 to $39,999 | 0 (0.0%) | 10 (25.0%) |
| $40,000 to $44,999 | 4 (6.0%) | 4 (10.0%) |
| $45,000 to $49,999 | 3 (4.5%) | 3 (7.5%) |
| $50,000 to $54,999 | 0 (0.0%) | 2 (5.0%) |
| $55,000 to $64,999 | 0 (0.0%) | 1 (2.5%) |
| $65,000 to $74,999 | 15 (22.4%) | 1 (2.5%) |
| $75,000 to $99,999 | 15 (22.4%) | 5 (12.5%) |
| $100,000+ | 0 (0.0%) | 0 (0.0%) |
| Total | 67 (100.0%) | 40 (100.0%) |
Earnings by Sex by Educational Attainment in Zoar
Average earnings in Zoar are $68,214 for men and $39,000 for women, a difference of 42.8%. Men with an educational attainment of bachelor's degree enjoy the highest average annual earnings of $77,292, while those with graduate degree education earn the least with $2,499. Women with an educational attainment of college or associate's degree earn the most with the average annual earnings of $38,875, while those with high school diploma education have the smallest earnings of $37,500.
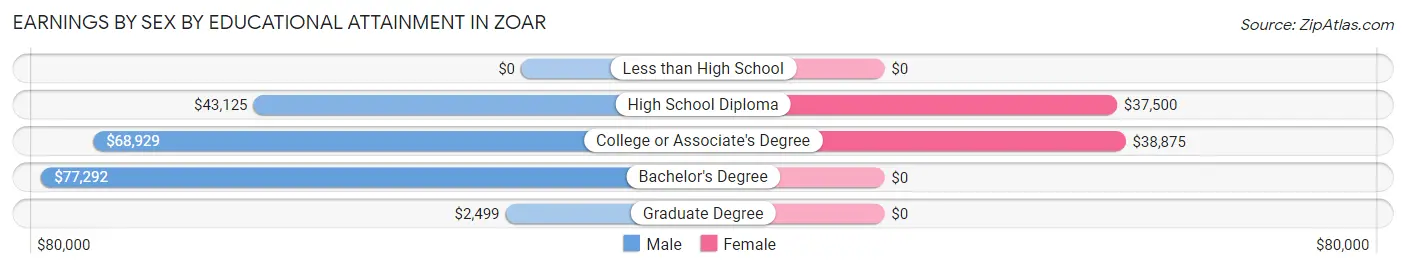
| Educational Attainment | Male Income | Female Income |
| Less than High School | - | - |
| High School Diploma | $43,125 | $37,500 |
| College or Associate's Degree | $68,929 | $38,875 |
| Bachelor's Degree | $77,292 | $0 |
| Graduate Degree | $2,499 | $0 |
| Total | $68,214 | $39,000 |
Family Income in Zoar
Family Income Brackets in Zoar
According to the Zoar family income data, there are 22 families falling into the $100,000 to $149,999 income range, which is the most common income bracket and makes up 37.9% of all families.
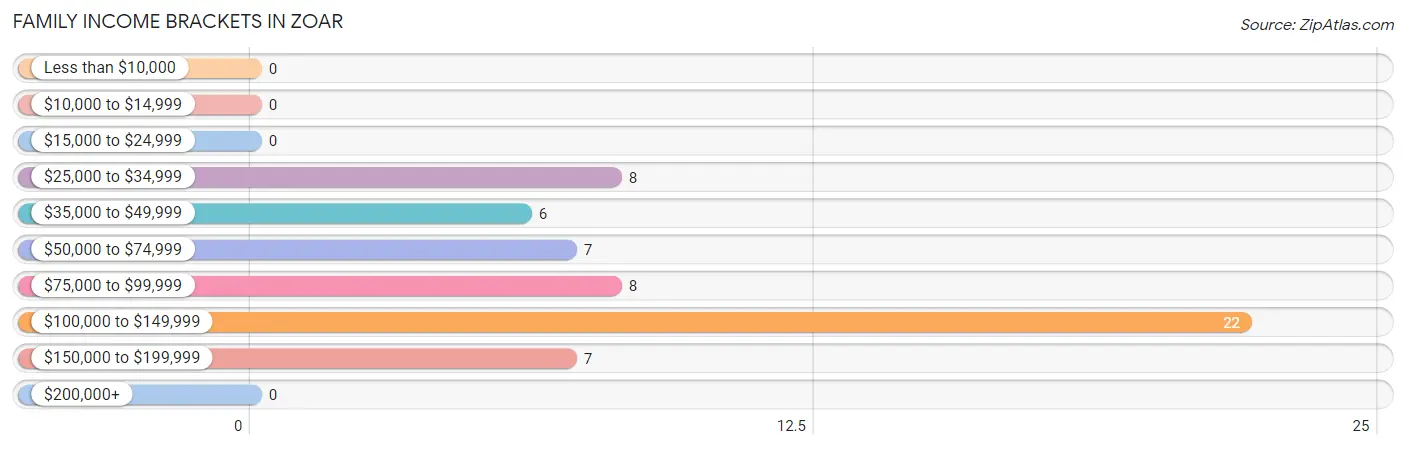
| Income Bracket | # Families | % Families |
| Less than $10,000 | 0 | 0.0% |
| $10,000 to $14,999 | 0 | 0.0% |
| $15,000 to $24,999 | 0 | 0.0% |
| $25,000 to $34,999 | 8 | 13.8% |
| $35,000 to $49,999 | 6 | 10.3% |
| $50,000 to $74,999 | 7 | 12.1% |
| $75,000 to $99,999 | 8 | 13.8% |
| $100,000 to $149,999 | 22 | 37.9% |
| $150,000 to $199,999 | 7 | 12.1% |
| $200,000+ | 0 | 0.0% |
Family Income by Famaliy Size in Zoar
3-person families (19 | 32.8%) account for the highest median family income in Zoar with $109,625 per family, while 3-person families (19 | 32.8%) have the highest median income of $36,542 per family member.
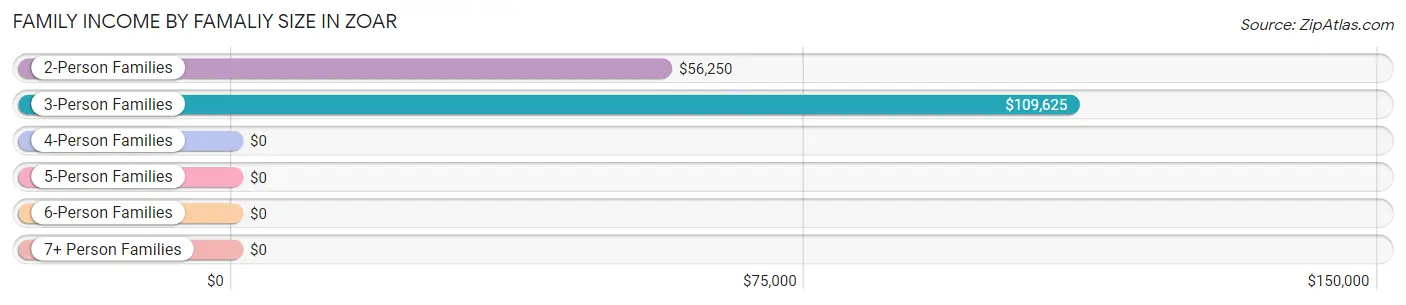
| Income Bracket | # Families | Median Income |
| 2-Person Families | 27 (46.6%) | $56,250 |
| 3-Person Families | 19 (32.8%) | $109,625 |
| 4-Person Families | 5 (8.6%) | $0 |
| 5-Person Families | 3 (5.2%) | $0 |
| 6-Person Families | 4 (6.9%) | $0 |
| 7+ Person Families | 0 (0.0%) | $0 |
| Total | 58 (100.0%) | $103,750 |
Family Income by Number of Earners in Zoar
The median family income in Zoar is $103,750, with families comprising 3+ earners (11) having the highest median family income of $136,250, while families with no earners (19) have the lowest median family income of $45,625, accounting for 19.0% and 32.8% of families, respectively.
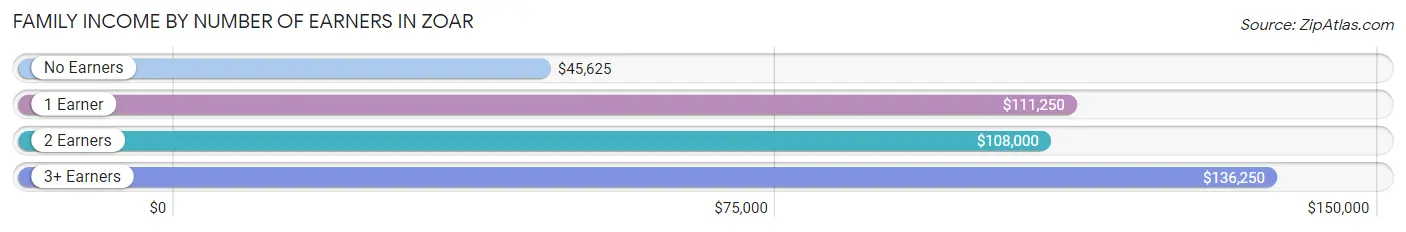
| Number of Earners | # Families | Median Income |
| No Earners | 19 (32.8%) | $45,625 |
| 1 Earner | 10 (17.2%) | $111,250 |
| 2 Earners | 18 (31.0%) | $108,000 |
| 3+ Earners | 11 (19.0%) | $136,250 |
| Total | 58 (100.0%) | $103,750 |
Household Income in Zoar
Household Income Brackets in Zoar
With 22 households falling in the category, the $100,000 to $149,999 income range is the most frequent in Zoar, accounting for 28.2% of all households.
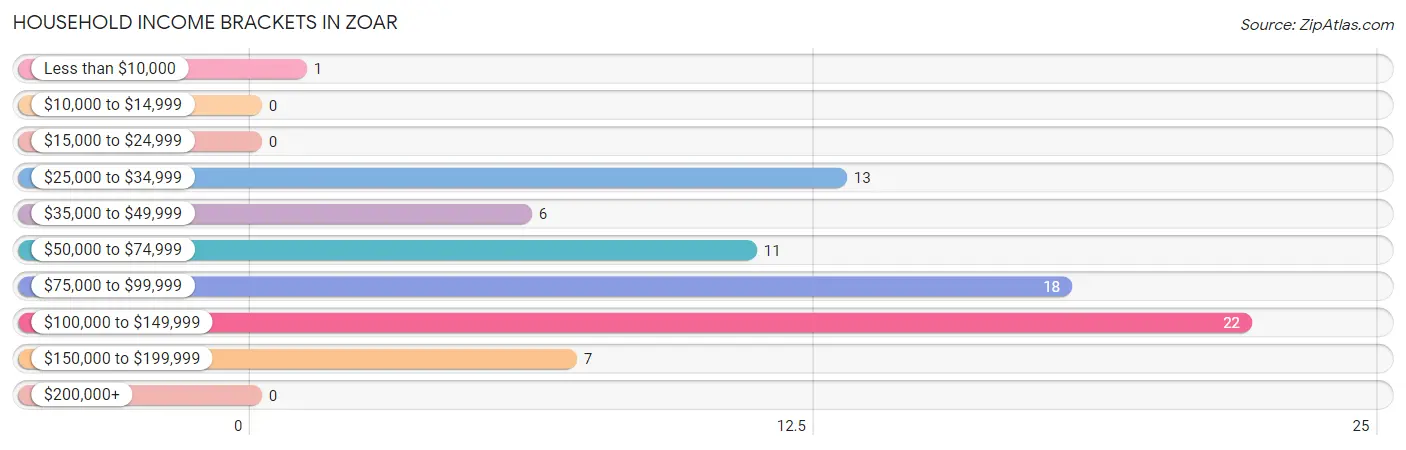
| Income Bracket | # Households | % Households |
| Less than $10,000 | 1 | 1.3% |
| $10,000 to $14,999 | 0 | 0.0% |
| $15,000 to $24,999 | 0 | 0.0% |
| $25,000 to $34,999 | 13 | 16.7% |
| $35,000 to $49,999 | 6 | 7.7% |
| $50,000 to $74,999 | 11 | 14.1% |
| $75,000 to $99,999 | 18 | 23.1% |
| $100,000 to $149,999 | 22 | 28.2% |
| $150,000 to $199,999 | 7 | 9.0% |
| $200,000+ | 0 | 0.0% |
Household Income by Householder Age in Zoar
The median household income in Zoar is $90,000, with the highest median household income of $108,250 found in the 25 to 44 years age bracket for the primary householder. A total of 24 households (30.8%) fall into this category.
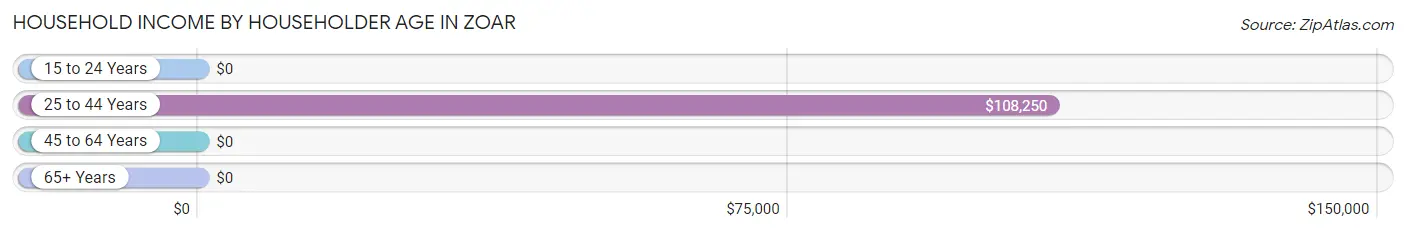
| Income Bracket | # Households | Median Income |
| 15 to 24 Years | 0 (0.0%) | $0 |
| 25 to 44 Years | 24 (30.8%) | $108,250 |
| 45 to 64 Years | 16 (20.5%) | $0 |
| 65+ Years | 38 (48.7%) | $0 |
| Total | 78 (100.0%) | $90,000 |
Poverty in Zoar
Income Below Poverty by Sex and Age in Zoar
With 3.7% poverty level for males and 13.1% for females among the residents of Zoar, 55 to 64 year old males and under 5 year old females are the most vulnerable to poverty, with 4 males (26.7%) and 4 females (100.0%) in their respective age groups living below the poverty level.
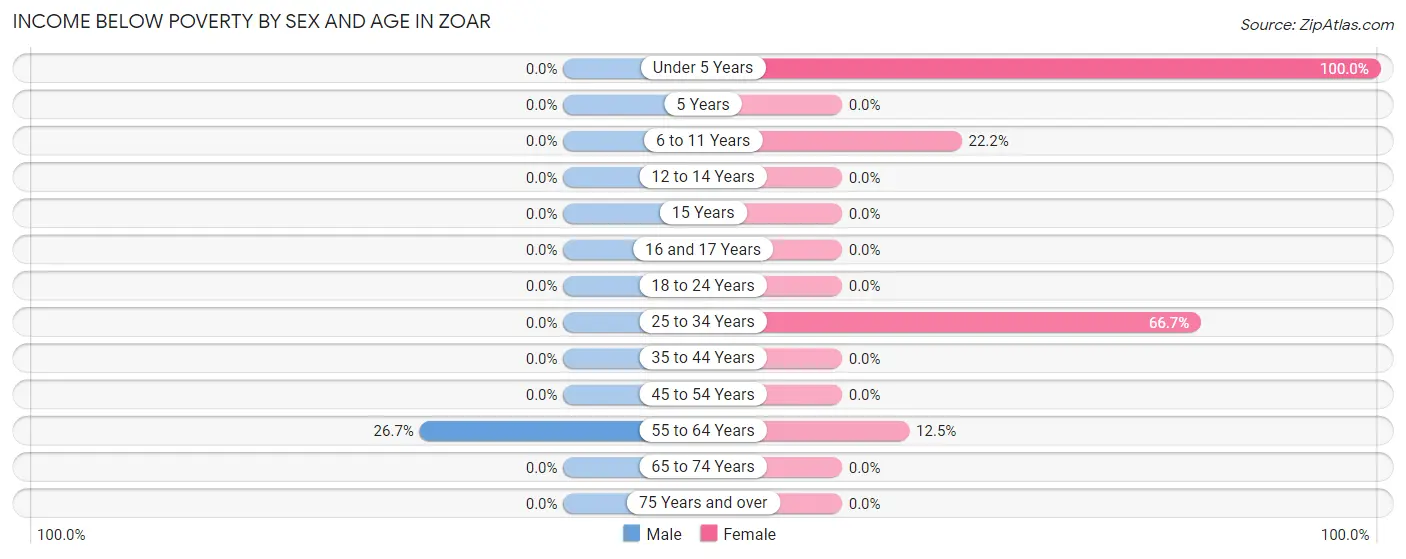
| Age Bracket | Male | Female |
| Under 5 Years | 0 (0.0%) | 4 (100.0%) |
| 5 Years | 0 (0.0%) | 0 (0.0%) |
| 6 to 11 Years | 0 (0.0%) | 4 (22.2%) |
| 12 to 14 Years | 0 (0.0%) | 0 (0.0%) |
| 15 Years | 0 (0.0%) | 0 (0.0%) |
| 16 and 17 Years | 0 (0.0%) | 0 (0.0%) |
| 18 to 24 Years | 0 (0.0%) | 0 (0.0%) |
| 25 to 34 Years | 0 (0.0%) | 4 (66.7%) |
| 35 to 44 Years | 0 (0.0%) | 0 (0.0%) |
| 45 to 54 Years | 0 (0.0%) | 0 (0.0%) |
| 55 to 64 Years | 4 (26.7%) | 1 (12.5%) |
| 65 to 74 Years | 0 (0.0%) | 0 (0.0%) |
| 75 Years and over | 0 (0.0%) | 0 (0.0%) |
| Total | 4 (3.7%) | 13 (13.1%) |
Income Above Poverty by Sex and Age in Zoar
According to the poverty statistics in Zoar, males aged under 5 years and females aged 12 to 14 years are the age groups that are most secure financially, with 100.0% of males and 100.0% of females in these age groups living above the poverty line.
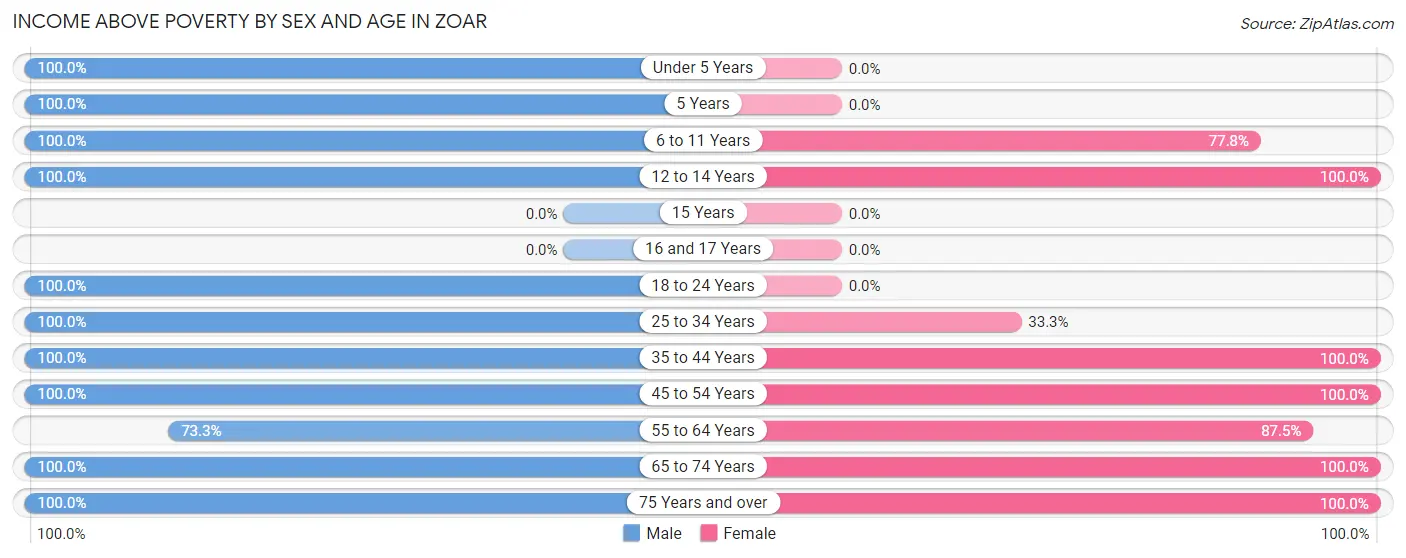
| Age Bracket | Male | Female |
| Under 5 Years | 1 (100.0%) | 0 (0.0%) |
| 5 Years | 2 (100.0%) | 0 (0.0%) |
| 6 to 11 Years | 8 (100.0%) | 14 (77.8%) |
| 12 to 14 Years | 5 (100.0%) | 4 (100.0%) |
| 15 Years | 0 (0.0%) | 0 (0.0%) |
| 16 and 17 Years | 0 (0.0%) | 0 (0.0%) |
| 18 to 24 Years | 15 (100.0%) | 0 (0.0%) |
| 25 to 34 Years | 6 (100.0%) | 2 (33.3%) |
| 35 to 44 Years | 21 (100.0%) | 15 (100.0%) |
| 45 to 54 Years | 3 (100.0%) | 6 (100.0%) |
| 55 to 64 Years | 11 (73.3%) | 7 (87.5%) |
| 65 to 74 Years | 13 (100.0%) | 17 (100.0%) |
| 75 Years and over | 18 (100.0%) | 21 (100.0%) |
| Total | 103 (96.3%) | 86 (86.9%) |
Income Below Poverty Among Married-Couple Families in Zoar
The poverty statistics for married-couple families in Zoar show that 8.2% or 4 of the total 49 families live below the poverty line. Families with 1 or 2 children have the highest poverty rate of 25.0%, comprising of 4 families. On the other hand, families with no children have the lowest poverty rate of 0.0%, which includes 0 families.
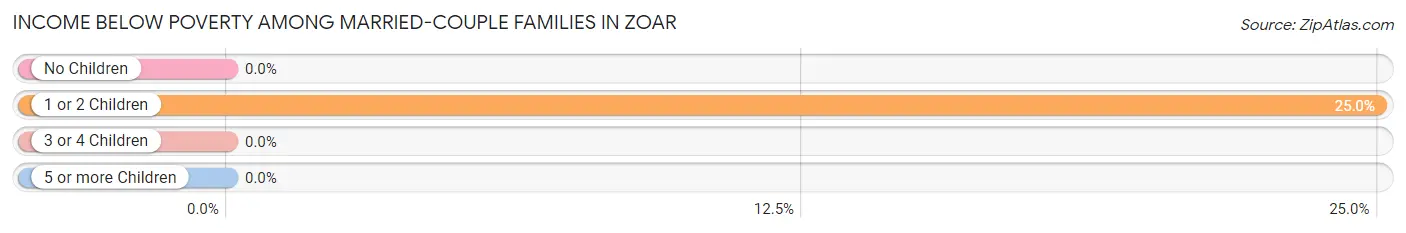
| Children | Above Poverty | Below Poverty |
| No Children | 29 (100.0%) | 0 (0.0%) |
| 1 or 2 Children | 12 (75.0%) | 4 (25.0%) |
| 3 or 4 Children | 4 (100.0%) | 0 (0.0%) |
| 5 or more Children | 0 (0.0%) | 0 (0.0%) |
| Total | 45 (91.8%) | 4 (8.2%) |
Income Below Poverty Among Single-Parent Households in Zoar
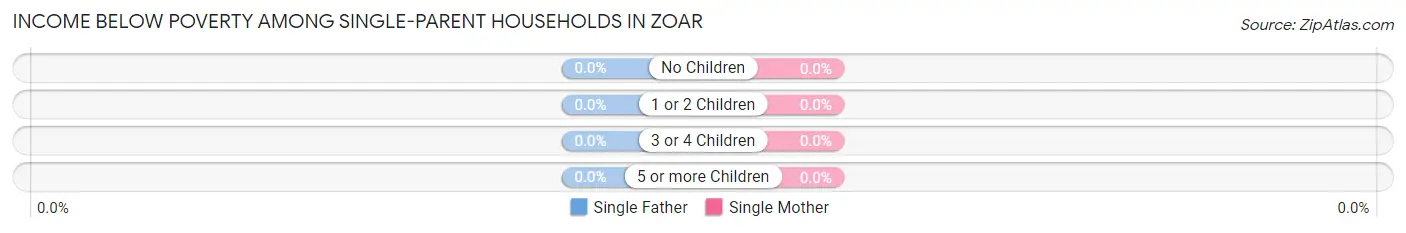
| Children | Single Father | Single Mother |
| No Children | 0 (0.0%) | 0 (0.0%) |
| 1 or 2 Children | 0 (0.0%) | 0 (0.0%) |
| 3 or 4 Children | 0 (0.0%) | 0 (0.0%) |
| 5 or more Children | 0 (0.0%) | 0 (0.0%) |
| Total | 0 (0.0%) | 0 (0.0%) |
Income Below Poverty Among Married-Couple vs Single-Parent Households in Zoar
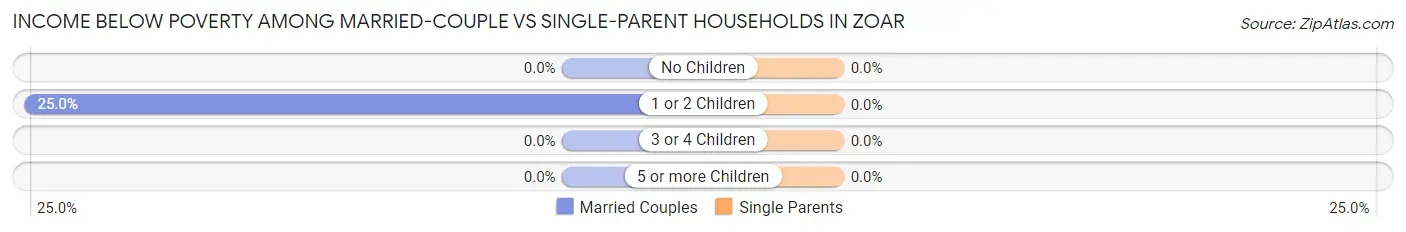
| Children | Married-Couple Families | Single-Parent Households |
| No Children | 0 (0.0%) | 0 (0.0%) |
| 1 or 2 Children | 4 (25.0%) | 0 (0.0%) |
| 3 or 4 Children | 0 (0.0%) | 0 (0.0%) |
| 5 or more Children | 0 (0.0%) | 0 (0.0%) |
| Total | 4 (8.2%) | 0 (0.0%) |
Race in Zoar
The most populous races in Zoar are White / Caucasian (206 | 100.0%), and Hispanic or Latino (7 | 3.4%).
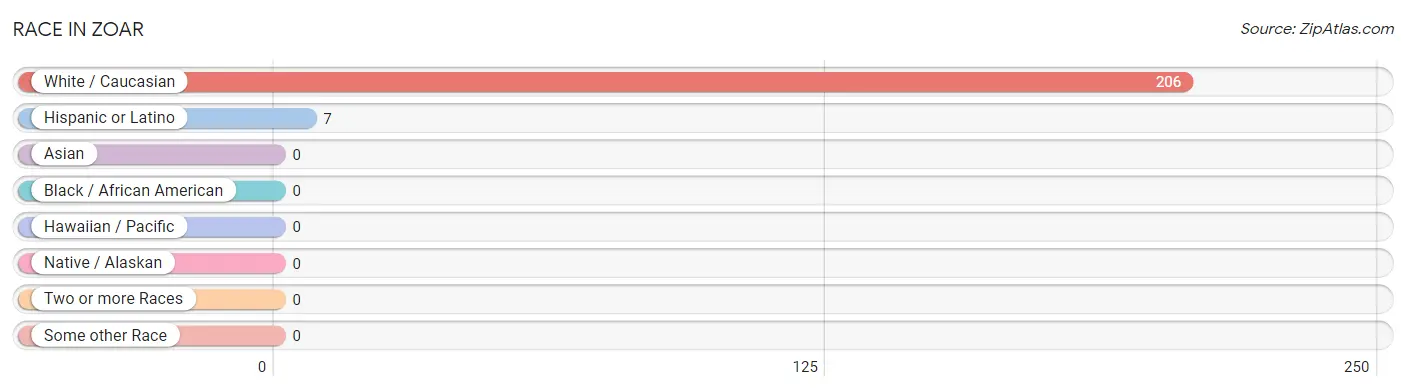
| Race | # Population | % Population |
| Asian | 0 | 0.0% |
| Black / African American | 0 | 0.0% |
| Hawaiian / Pacific | 0 | 0.0% |
| Hispanic or Latino | 7 | 3.4% |
| Native / Alaskan | 0 | 0.0% |
| White / Caucasian | 206 | 100.0% |
| Two or more Races | 0 | 0.0% |
| Some other Race | 0 | 0.0% |
| Total | 206 | 100.0% |
Ancestry in Zoar
The most populous ancestries reported in Zoar are German (103 | 50.0%), Irish (49 | 23.8%), French (40 | 19.4%), English (39 | 18.9%), and Scottish (27 | 13.1%), together accounting for 125.2% of all Zoar residents.
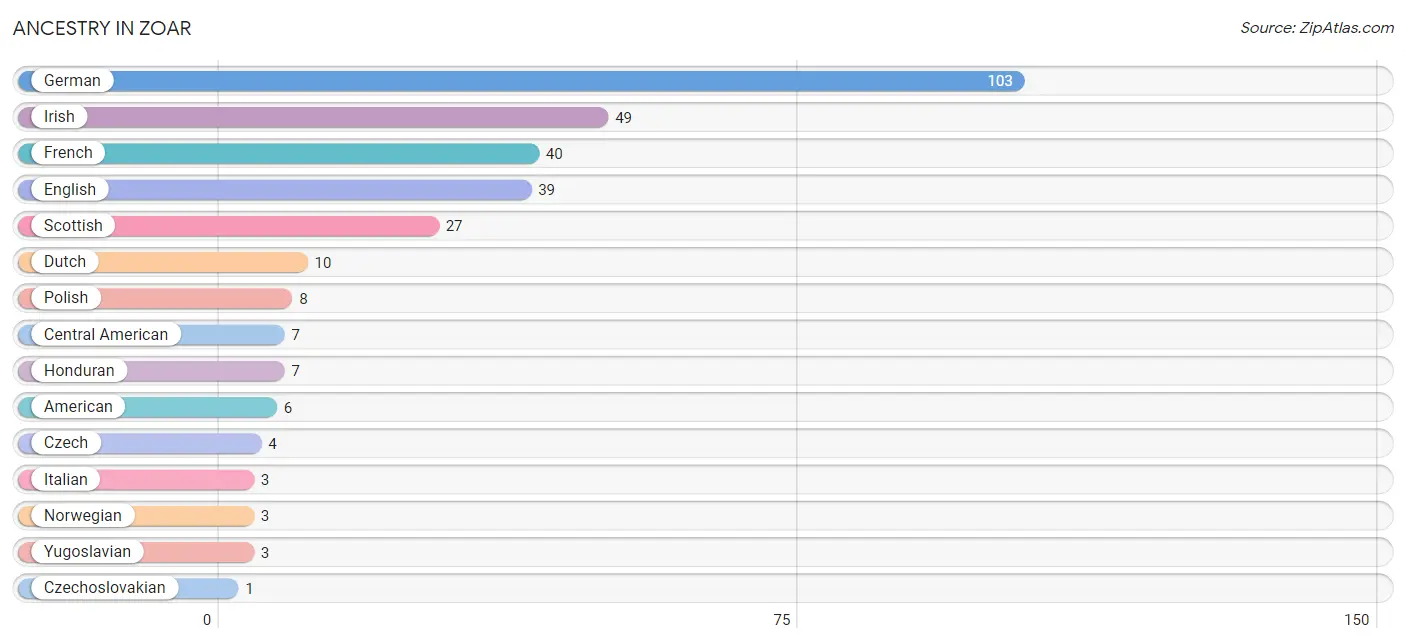
| Ancestry | # Population | % Population |
| American | 6 | 2.9% |
| Central American | 7 | 3.4% |
| Czech | 4 | 1.9% |
| Czechoslovakian | 1 | 0.5% |
| Dutch | 10 | 4.9% |
| English | 39 | 18.9% |
| French | 40 | 19.4% |
| German | 103 | 50.0% |
| Honduran | 7 | 3.4% |
| Irish | 49 | 23.8% |
| Italian | 3 | 1.5% |
| Norwegian | 3 | 1.5% |
| Polish | 8 | 3.9% |
| Scottish | 27 | 13.1% |
| Yugoslavian | 3 | 1.5% | View All 15 Rows |
Immigrants in Zoar

| Immigration Origin | # Population | % Population | View All 0 Rows |
Sex and Age in Zoar
Sex and Age in Zoar
The most populous age groups in Zoar are 35 to 39 Years (16 | 14.9%) for men and 75 to 79 Years (21 | 21.2%) for women.
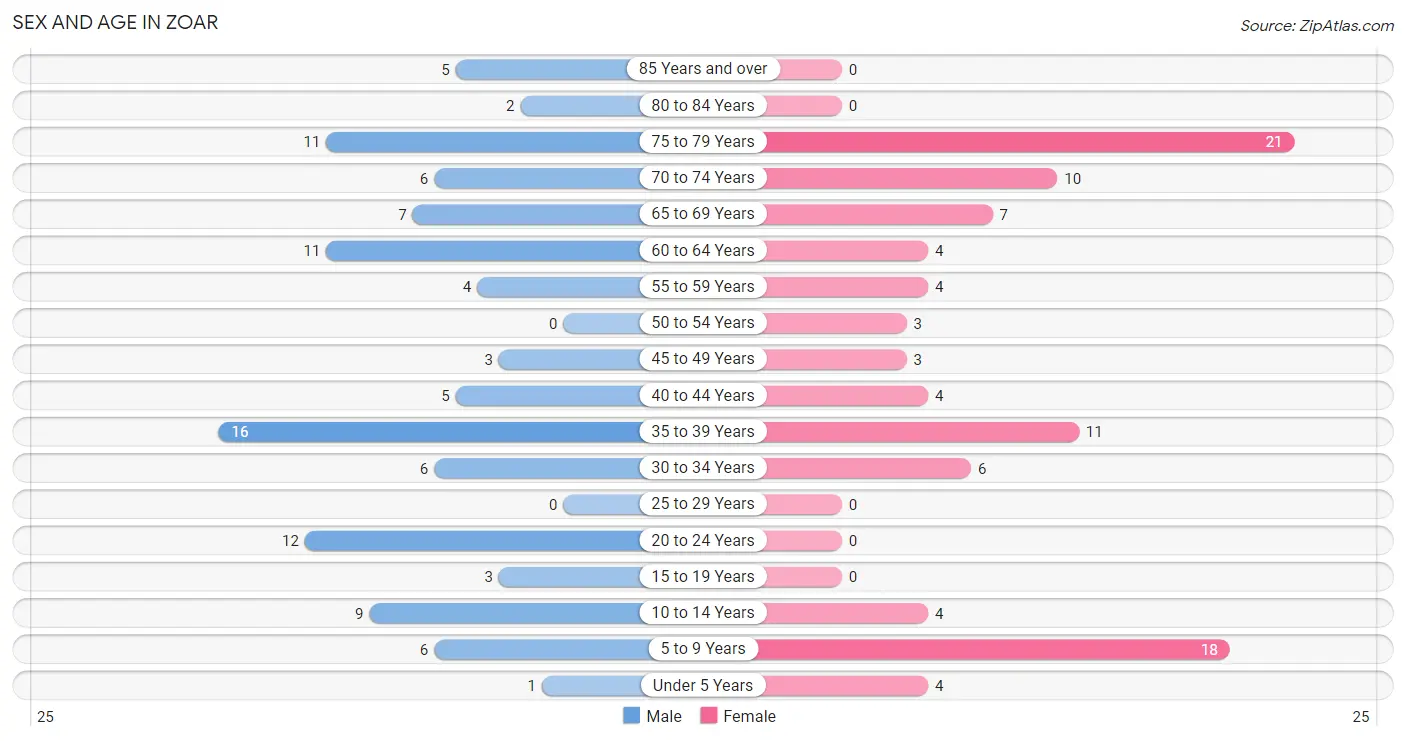
| Age Bracket | Male | Female |
| Under 5 Years | 1 (0.9%) | 4 (4.0%) |
| 5 to 9 Years | 6 (5.6%) | 18 (18.2%) |
| 10 to 14 Years | 9 (8.4%) | 4 (4.0%) |
| 15 to 19 Years | 3 (2.8%) | 0 (0.0%) |
| 20 to 24 Years | 12 (11.2%) | 0 (0.0%) |
| 25 to 29 Years | 0 (0.0%) | 0 (0.0%) |
| 30 to 34 Years | 6 (5.6%) | 6 (6.1%) |
| 35 to 39 Years | 16 (14.9%) | 11 (11.1%) |
| 40 to 44 Years | 5 (4.7%) | 4 (4.0%) |
| 45 to 49 Years | 3 (2.8%) | 3 (3.0%) |
| 50 to 54 Years | 0 (0.0%) | 3 (3.0%) |
| 55 to 59 Years | 4 (3.7%) | 4 (4.0%) |
| 60 to 64 Years | 11 (10.3%) | 4 (4.0%) |
| 65 to 69 Years | 7 (6.5%) | 7 (7.1%) |
| 70 to 74 Years | 6 (5.6%) | 10 (10.1%) |
| 75 to 79 Years | 11 (10.3%) | 21 (21.2%) |
| 80 to 84 Years | 2 (1.9%) | 0 (0.0%) |
| 85 Years and over | 5 (4.7%) | 0 (0.0%) |
| Total | 107 (100.0%) | 99 (100.0%) |
Families and Households in Zoar
Median Family Size in Zoar
The median family size in Zoar is 3.21 persons per family, with single male/father families (3 | 5.2%) accounting for the largest median family size of 3.33 persons per family. On the other hand, single female/mother families (6 | 10.3%) represent the smallest median family size with 3.17 persons per family.
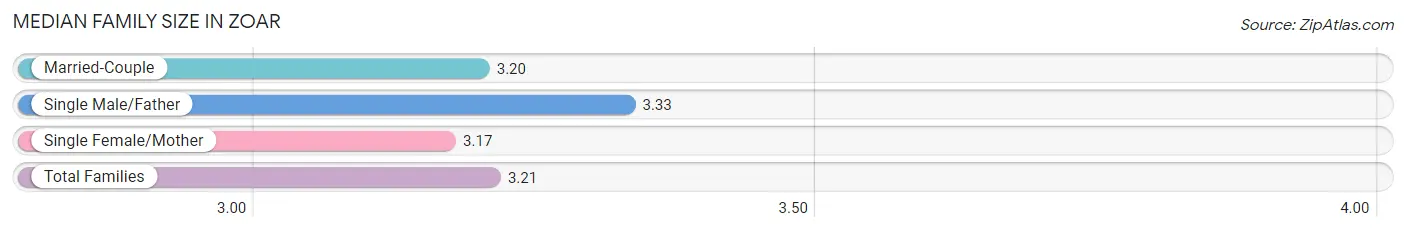
| Family Type | # Families | Family Size |
| Married-Couple | 49 (84.5%) | 3.20 |
| Single Male/Father | 3 (5.2%) | 3.33 |
| Single Female/Mother | 6 (10.3%) | 3.17 |
| Total Families | 58 (100.0%) | 3.21 |
Median Household Size in Zoar
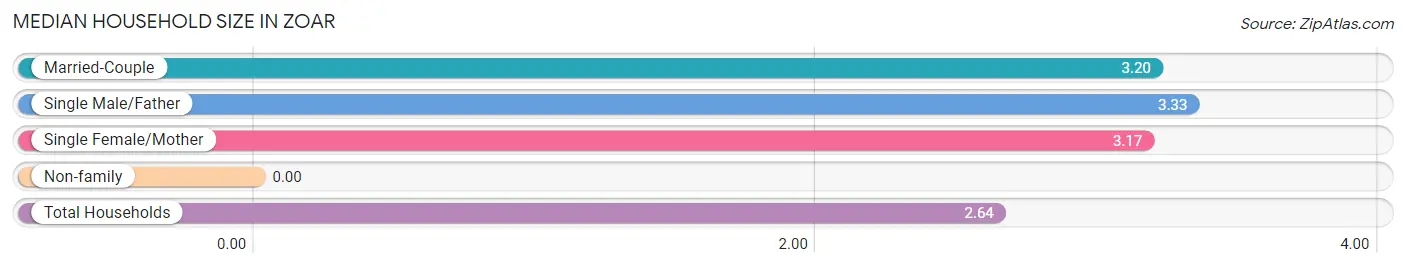
| Household Type | # Households | Household Size |
| Married-Couple | 49 (62.8%) | 3.20 |
| Single Male/Father | 3 (3.8%) | 3.33 |
| Single Female/Mother | 6 (7.7%) | 3.17 |
| Non-family | 20 (25.6%) | - |
| Total Households | 78 (100.0%) | 2.64 |
Household Size by Marriage Status in Zoar
Out of a total of 78 households in Zoar, 58 (74.4%) are family households, while 20 (25.6%) are nonfamily households. The most numerous type of family households are 2-person households, comprising 27, and the most common type of nonfamily households are 1-person households, comprising 20.
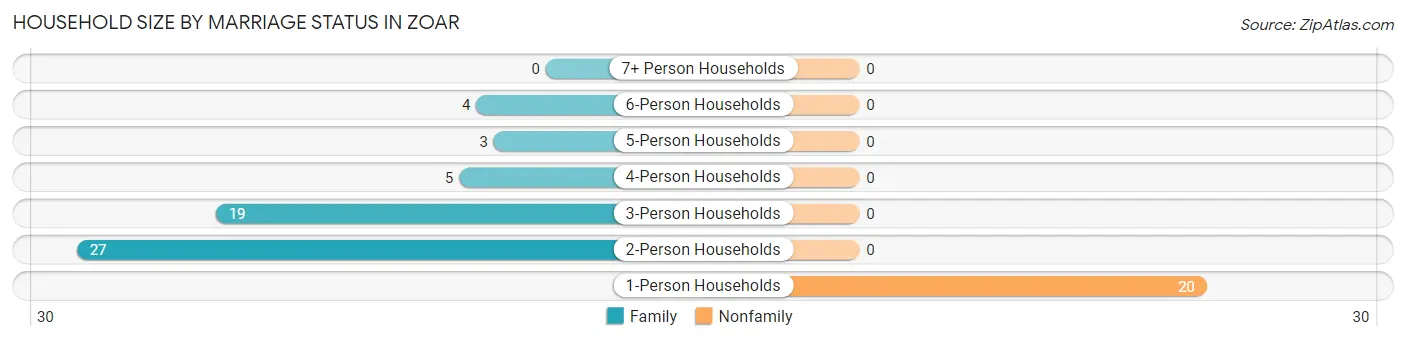
| Household Size | Family Households | Nonfamily Households |
| 1-Person Households | - | 20 (25.6%) |
| 2-Person Households | 27 (34.6%) | 0 (0.0%) |
| 3-Person Households | 19 (24.4%) | 0 (0.0%) |
| 4-Person Households | 5 (6.4%) | 0 (0.0%) |
| 5-Person Households | 3 (3.8%) | 0 (0.0%) |
| 6-Person Households | 4 (5.1%) | 0 (0.0%) |
| 7+ Person Households | 0 (0.0%) | 0 (0.0%) |
| Total | 58 (74.4%) | 20 (25.6%) |
Female Fertility in Zoar
Fertility by Age in Zoar
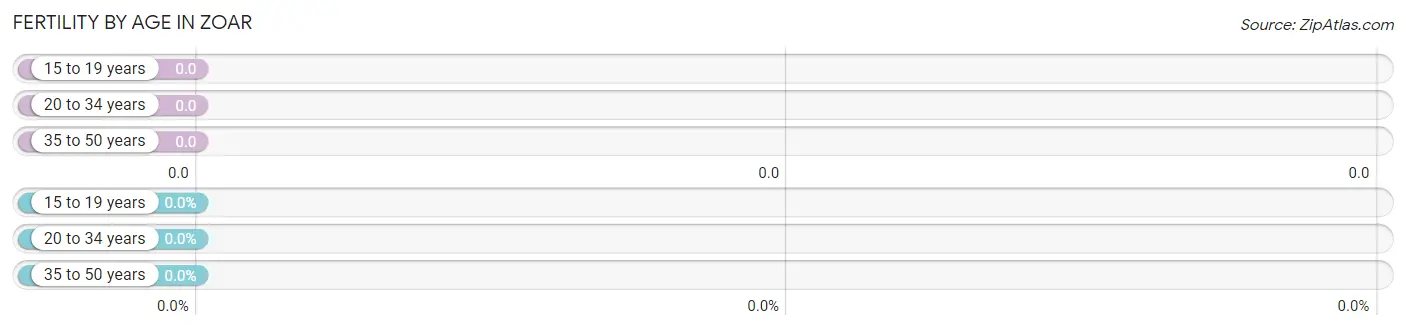
| Age Bracket | Women with Births | Births / 1,000 Women |
| 15 to 19 years | 0 (0.0%) | 0.0 |
| 20 to 34 years | 0 (0.0%) | 0.0 |
| 35 to 50 years | 0 (0.0%) | 0.0 |
| Total | 0 (0.0%) | 0.0 |
Fertility by Age by Marriage Status in Zoar
| Age Bracket | Married | Unmarried |
| 15 to 19 years | 0 (0.0%) | 0 (0.0%) |
| 20 to 34 years | 0 (0.0%) | 0 (0.0%) |
| 35 to 50 years | 0 (0.0%) | 0 (0.0%) |
| Total | 0 (0.0%) | 0 (0.0%) |
Fertility by Education in Zoar
| Educational Attainment | Women with Births | Births / 1,000 Women |
| Less than High School | 0 (0.0%) | 0.0 |
| High School Diploma | 0 (0.0%) | 0.0 |
| College or Associate's Degree | 0 (0.0%) | 0.0 |
| Bachelor's Degree | 0 (0.0%) | 0.0 |
| Graduate Degree | 0 (0.0%) | 0.0 |
| Total | 0 (0.0%) | 0.0 |
Fertility by Education by Marriage Status in Zoar
| Educational Attainment | Married | Unmarried |
| Less than High School | 0 (0.0%) | 0 (0.0%) |
| High School Diploma | 0 (0.0%) | 0 (0.0%) |
| College or Associate's Degree | 0 (0.0%) | 0 (0.0%) |
| Bachelor's Degree | 0 (0.0%) | 0 (0.0%) |
| Graduate Degree | 0 (0.0%) | 0 (0.0%) |
| Total | 0 (0.0%) | 0 (0.0%) |
Employment Characteristics in Zoar
Employment by Class of Employer in Zoar
Among the 101 employed individuals in Zoar, private company employees (56 | 55.4%), not-for-profit organizations (23 | 22.8%), and local government employees (15 | 14.8%) make up the most common classes of employment.
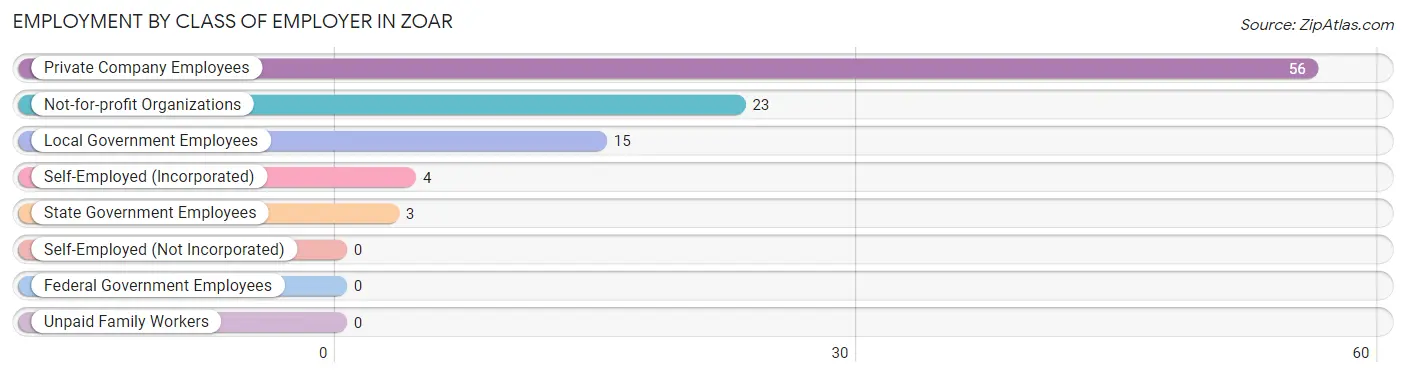
| Employer Class | # Employees | % Employees |
| Private Company Employees | 56 | 55.4% |
| Self-Employed (Incorporated) | 4 | 4.0% |
| Self-Employed (Not Incorporated) | 0 | 0.0% |
| Not-for-profit Organizations | 23 | 22.8% |
| Local Government Employees | 15 | 14.8% |
| State Government Employees | 3 | 3.0% |
| Federal Government Employees | 0 | 0.0% |
| Unpaid Family Workers | 0 | 0.0% |
| Total | 101 | 100.0% |
Employment Status by Age in Zoar
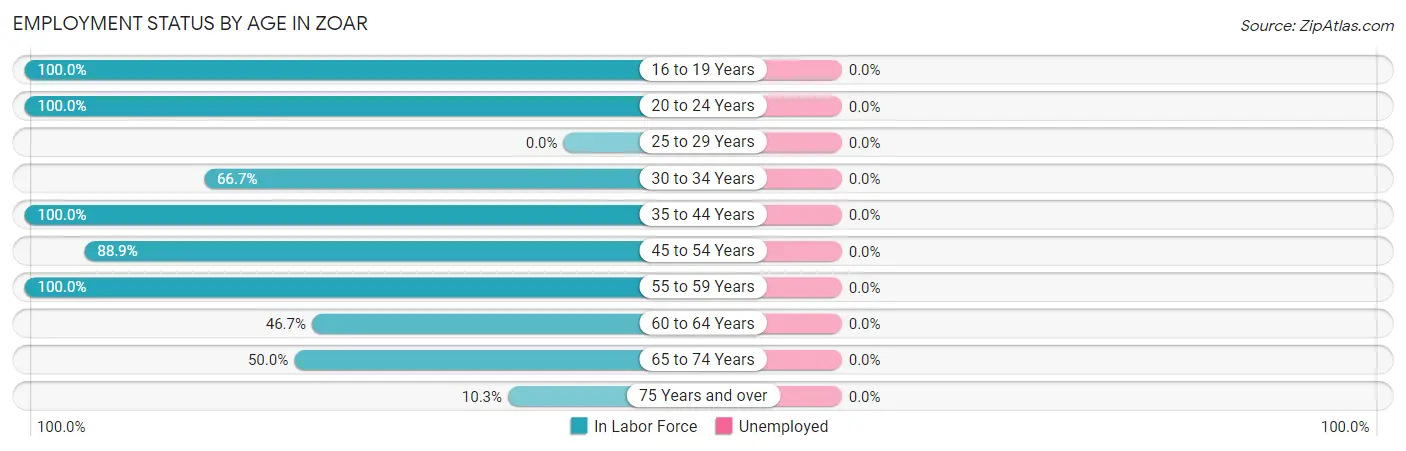
| Age Bracket | In Labor Force | Unemployed |
| 16 to 19 Years | 3 (100.0%) | 0 (0.0%) |
| 20 to 24 Years | 12 (100.0%) | 0 (0.0%) |
| 25 to 29 Years | 0 (0.0%) | 0 (0.0%) |
| 30 to 34 Years | 8 (66.7%) | 0 (0.0%) |
| 35 to 44 Years | 36 (100.0%) | 0 (0.0%) |
| 45 to 54 Years | 8 (88.9%) | 0 (0.0%) |
| 55 to 59 Years | 8 (100.0%) | 0 (0.0%) |
| 60 to 64 Years | 7 (46.7%) | 0 (0.0%) |
| 65 to 74 Years | 15 (50.0%) | 0 (0.0%) |
| 75 Years and over | 4 (10.3%) | 0 (0.0%) |
| Total | 101 (61.6%) | 0 (0.0%) |
Employment Status by Educational Attainment in Zoar
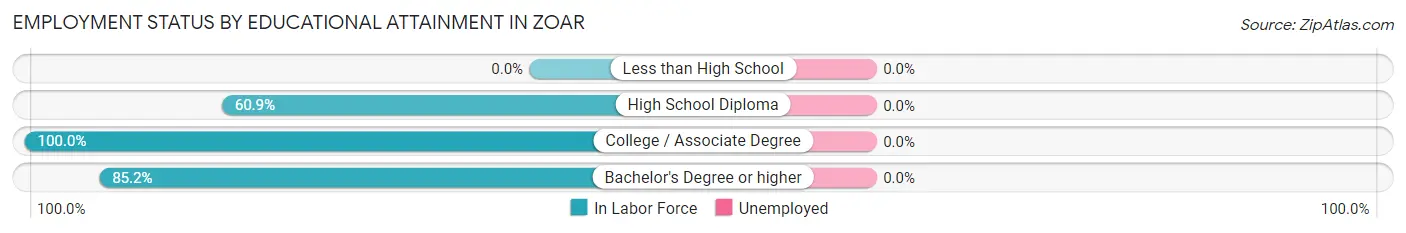
| Educational Attainment | In Labor Force | Unemployed |
| Less than High School | 0 (0.0%) | 0 (0.0%) |
| High School Diploma | 14 (60.9%) | 0 (0.0%) |
| College / Associate Degree | 30 (100.0%) | 0 (0.0%) |
| Bachelor's Degree or higher | 23 (85.2%) | 0 (0.0%) |
| Total | 67 (83.8%) | 0 (0.0%) |
Employment Occupations by Sex in Zoar
Management, Business, Science and Arts Occupations
The most common Management, Business, Science and Arts occupations in Zoar are Community & Social Service (19 | 18.8%), Education Instruction & Library (15 | 14.8%), Management (11 | 10.9%), Computers, Engineering & Science (5 | 5.0%), and Life, Physical & Social Science (5 | 5.0%).
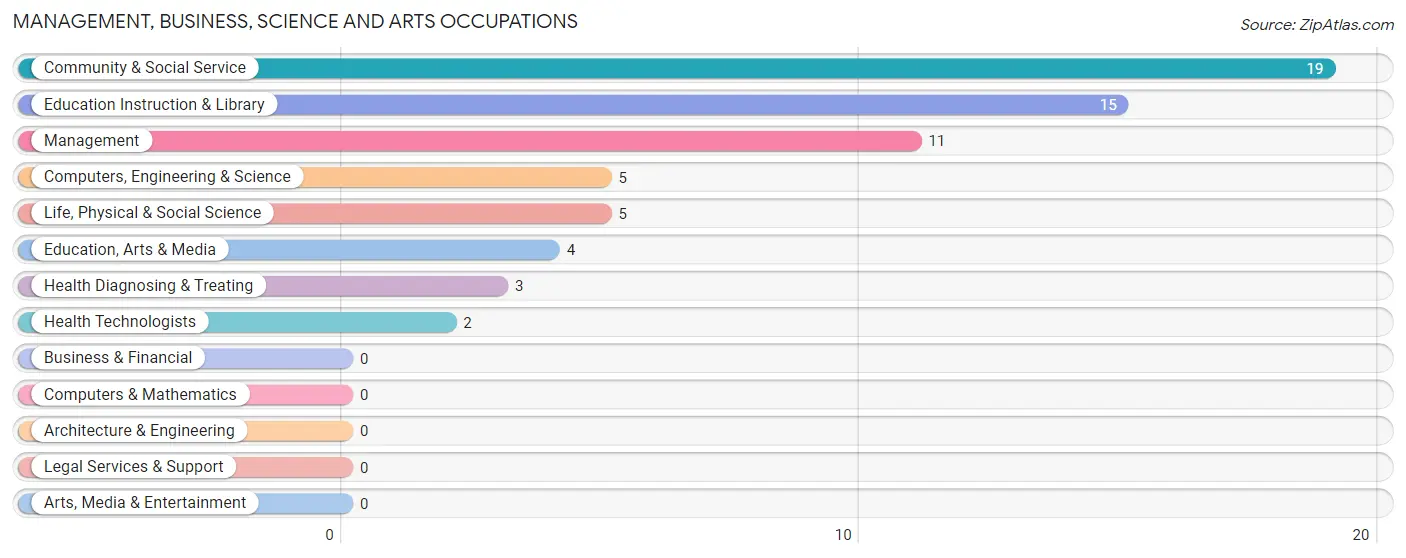
Management, Business, Science and Arts Occupations by Sex
Within the Management, Business, Science and Arts occupations in Zoar, the most male-oriented occupations are Management (100.0%), Education, Arts & Media (75.0%), and Computers, Engineering & Science (60.0%), while the most female-oriented occupations are Education Instruction & Library (100.0%), Health Diagnosing & Treating (100.0%), and Health Technologists (100.0%).
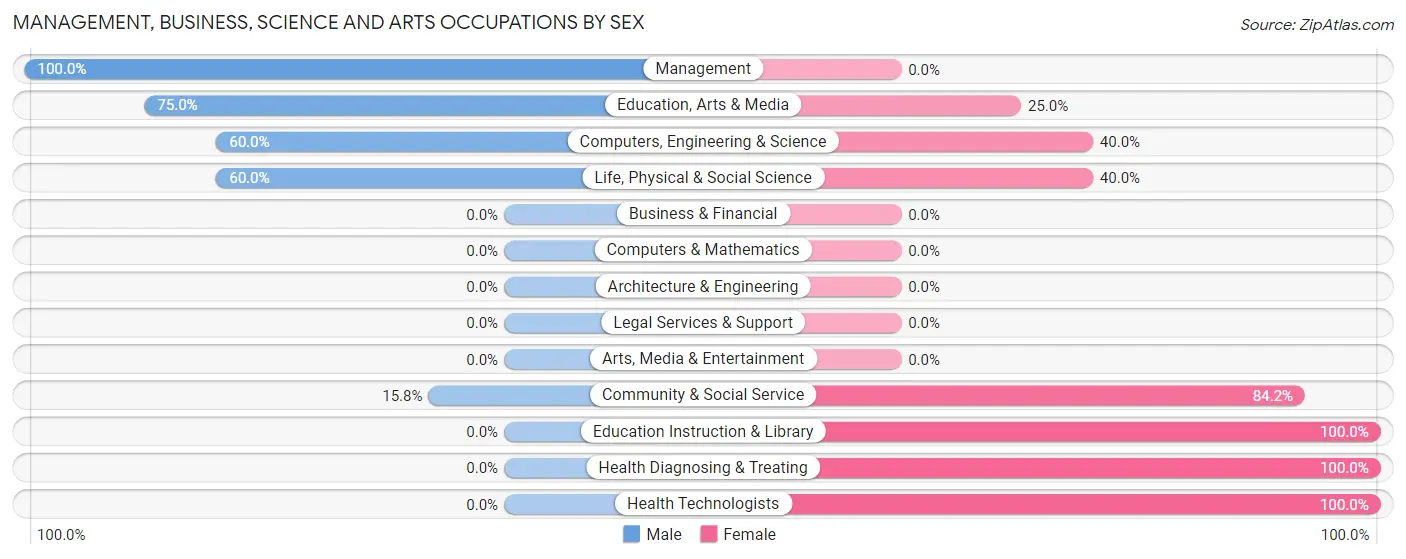
| Occupation | Male | Female |
| Management | 11 (100.0%) | 0 (0.0%) |
| Business & Financial | 0 (0.0%) | 0 (0.0%) |
| Computers, Engineering & Science | 3 (60.0%) | 2 (40.0%) |
| Computers & Mathematics | 0 (0.0%) | 0 (0.0%) |
| Architecture & Engineering | 0 (0.0%) | 0 (0.0%) |
| Life, Physical & Social Science | 3 (60.0%) | 2 (40.0%) |
| Community & Social Service | 3 (15.8%) | 16 (84.2%) |
| Education, Arts & Media | 3 (75.0%) | 1 (25.0%) |
| Legal Services & Support | 0 (0.0%) | 0 (0.0%) |
| Education Instruction & Library | 0 (0.0%) | 15 (100.0%) |
| Arts, Media & Entertainment | 0 (0.0%) | 0 (0.0%) |
| Health Diagnosing & Treating | 0 (0.0%) | 3 (100.0%) |
| Health Technologists | 0 (0.0%) | 2 (100.0%) |
| Total (Category) | 17 (44.7%) | 21 (55.3%) |
| Total (Overall) | 64 (63.4%) | 37 (36.6%) |
Services Occupations
The most common Services occupations in Zoar are Security & Protection (14 | 13.9%), Firefighting & Prevention (14 | 13.9%), Food Preparation & Serving (8 | 7.9%), and Cleaning & Maintenance (1 | 1.0%).
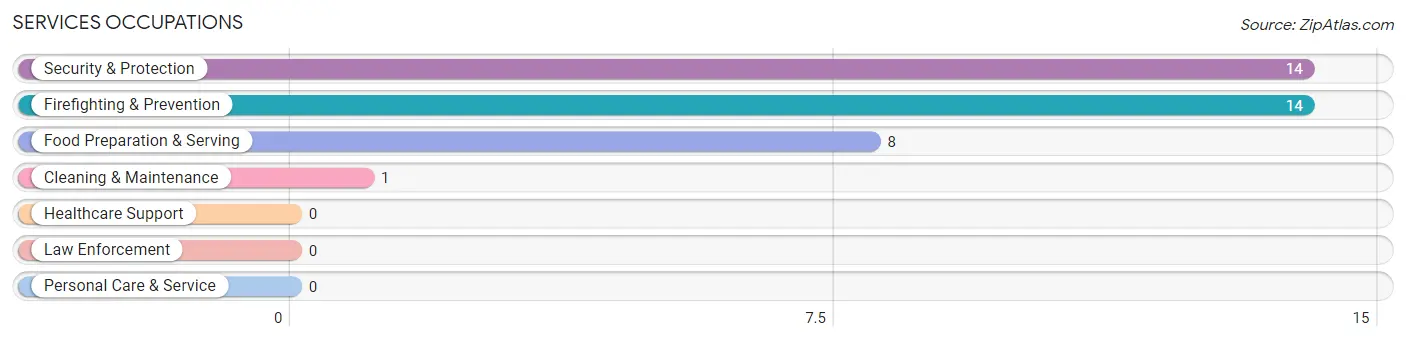
Services Occupations by Sex
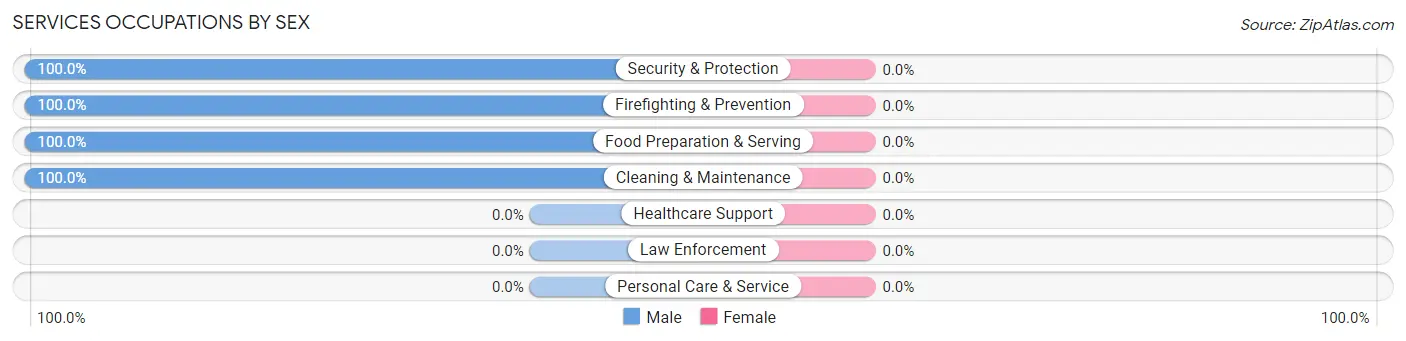
| Occupation | Male | Female |
| Healthcare Support | 0 (0.0%) | 0 (0.0%) |
| Security & Protection | 14 (100.0%) | 0 (0.0%) |
| Firefighting & Prevention | 14 (100.0%) | 0 (0.0%) |
| Law Enforcement | 0 (0.0%) | 0 (0.0%) |
| Food Preparation & Serving | 8 (100.0%) | 0 (0.0%) |
| Cleaning & Maintenance | 1 (100.0%) | 0 (0.0%) |
| Personal Care & Service | 0 (0.0%) | 0 (0.0%) |
| Total (Category) | 23 (100.0%) | 0 (0.0%) |
| Total (Overall) | 64 (63.4%) | 37 (36.6%) |
Sales and Office Occupations
The most common Sales and Office occupations in Zoar are Sales & Related (14 | 13.9%), and Office & Administration (6 | 5.9%).
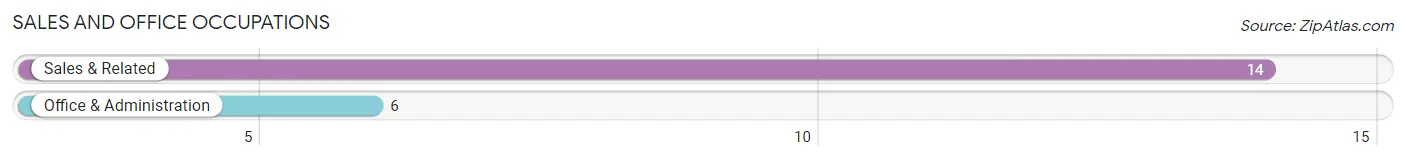
Sales and Office Occupations by Sex
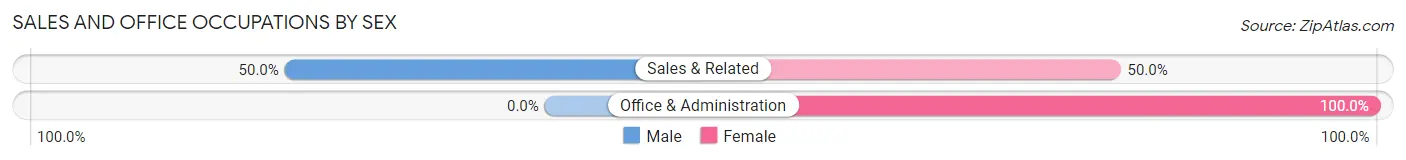
| Occupation | Male | Female |
| Sales & Related | 7 (50.0%) | 7 (50.0%) |
| Office & Administration | 0 (0.0%) | 6 (100.0%) |
| Total (Category) | 7 (35.0%) | 13 (65.0%) |
| Total (Overall) | 64 (63.4%) | 37 (36.6%) |
Natural Resources, Construction and Maintenance Occupations
The most common Natural Resources, Construction and Maintenance occupations in Zoar are , and Installation, Maintenance & Repair (6 | 5.9%).
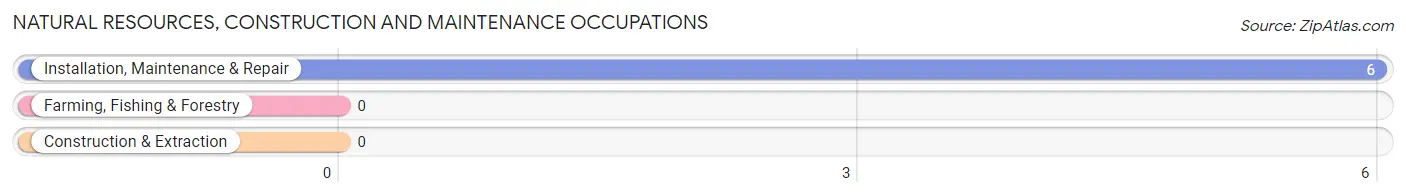
Natural Resources, Construction and Maintenance Occupations by Sex
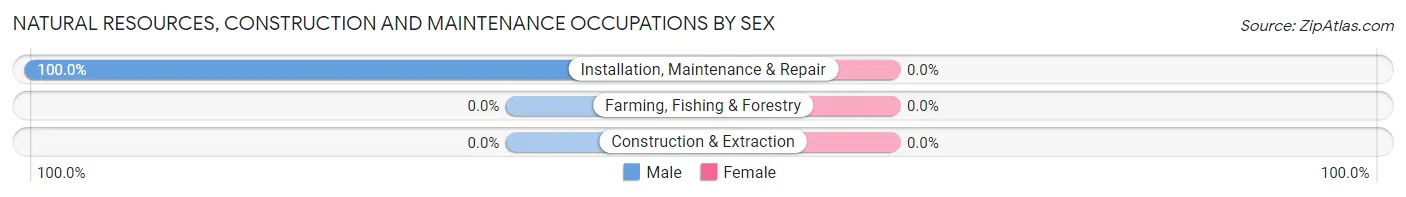
| Occupation | Male | Female |
| Farming, Fishing & Forestry | 0 (0.0%) | 0 (0.0%) |
| Construction & Extraction | 0 (0.0%) | 0 (0.0%) |
| Installation, Maintenance & Repair | 6 (100.0%) | 0 (0.0%) |
| Total (Category) | 6 (100.0%) | 0 (0.0%) |
| Total (Overall) | 64 (63.4%) | 37 (36.6%) |
Production, Transportation and Moving Occupations
The most common Production, Transportation and Moving occupations in Zoar are Material Moving (8 | 7.9%), and Production (6 | 5.9%).
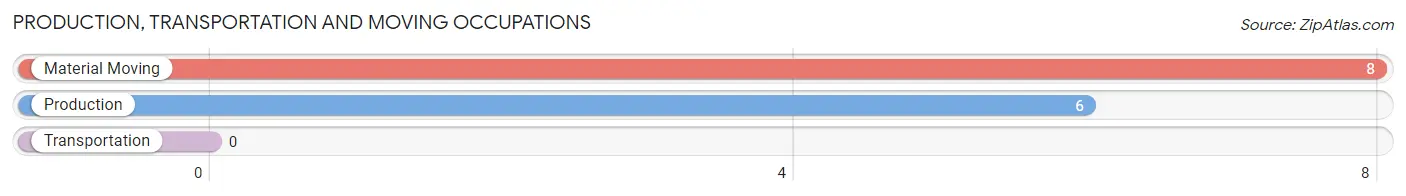
Production, Transportation and Moving Occupations by Sex
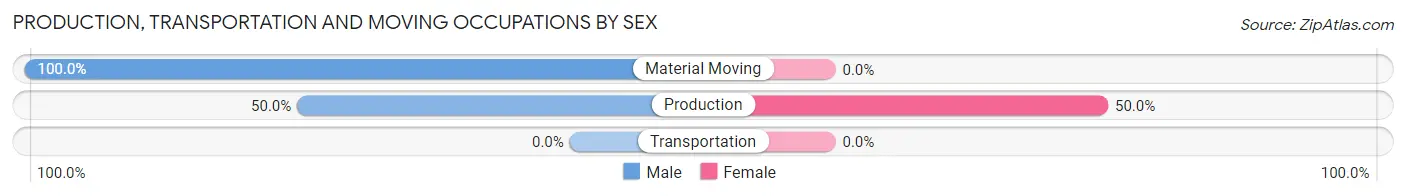
| Occupation | Male | Female |
| Production | 3 (50.0%) | 3 (50.0%) |
| Transportation | 0 (0.0%) | 0 (0.0%) |
| Material Moving | 8 (100.0%) | 0 (0.0%) |
| Total (Category) | 11 (78.6%) | 3 (21.4%) |
| Total (Overall) | 64 (63.4%) | 37 (36.6%) |
Employment Industries by Sex in Zoar
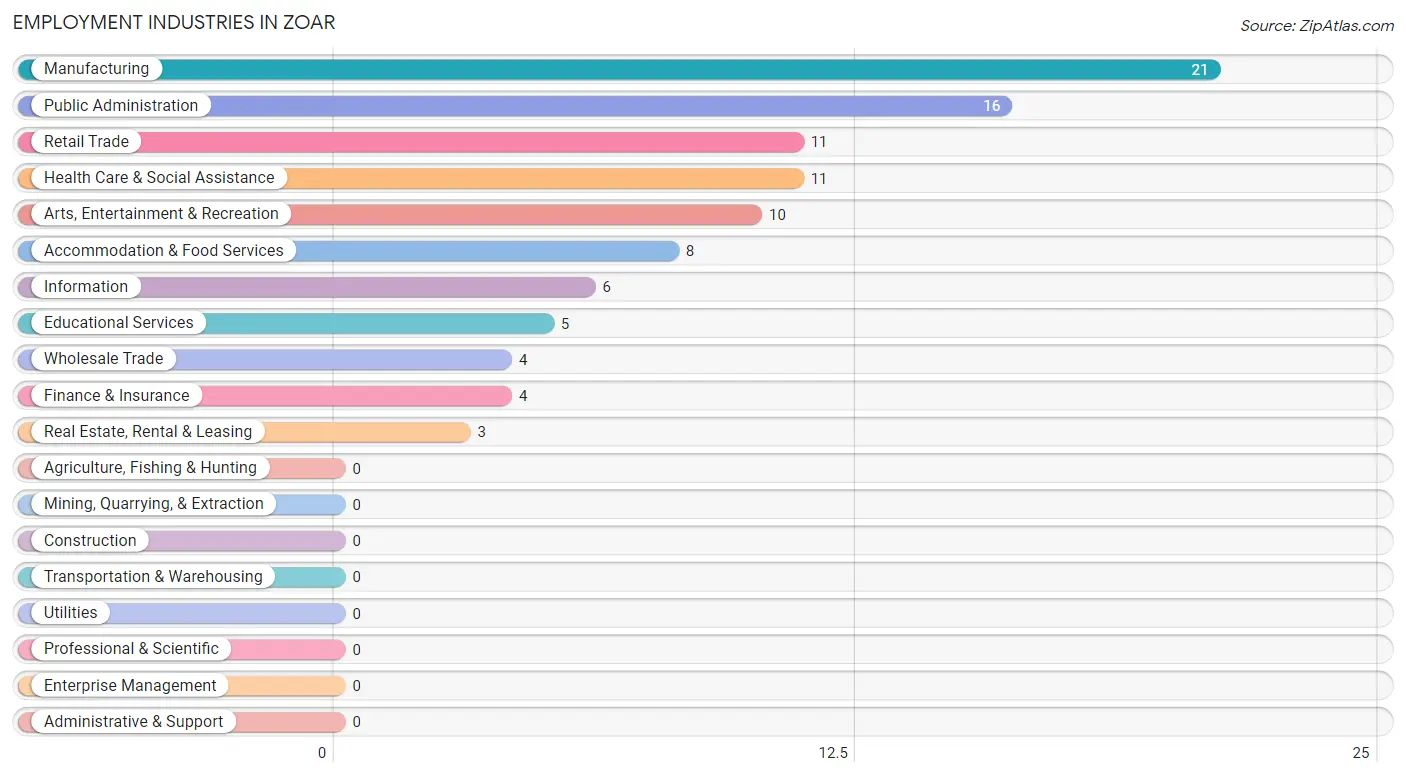
Employment Industries in Zoar
The major employment industries in Zoar include Manufacturing (21 | 20.8%), Public Administration (16 | 15.8%), Retail Trade (11 | 10.9%), Health Care & Social Assistance (11 | 10.9%), and Arts, Entertainment & Recreation (10 | 9.9%).
Employment Industries by Sex in Zoar
The Zoar industries that see more men than women are Wholesale Trade (100.0%), Finance & Insurance (100.0%), and Accommodation & Food Services (100.0%), whereas the industries that tend to have a higher number of women are Information (100.0%), Real Estate, Rental & Leasing (100.0%), and Educational Services (100.0%).
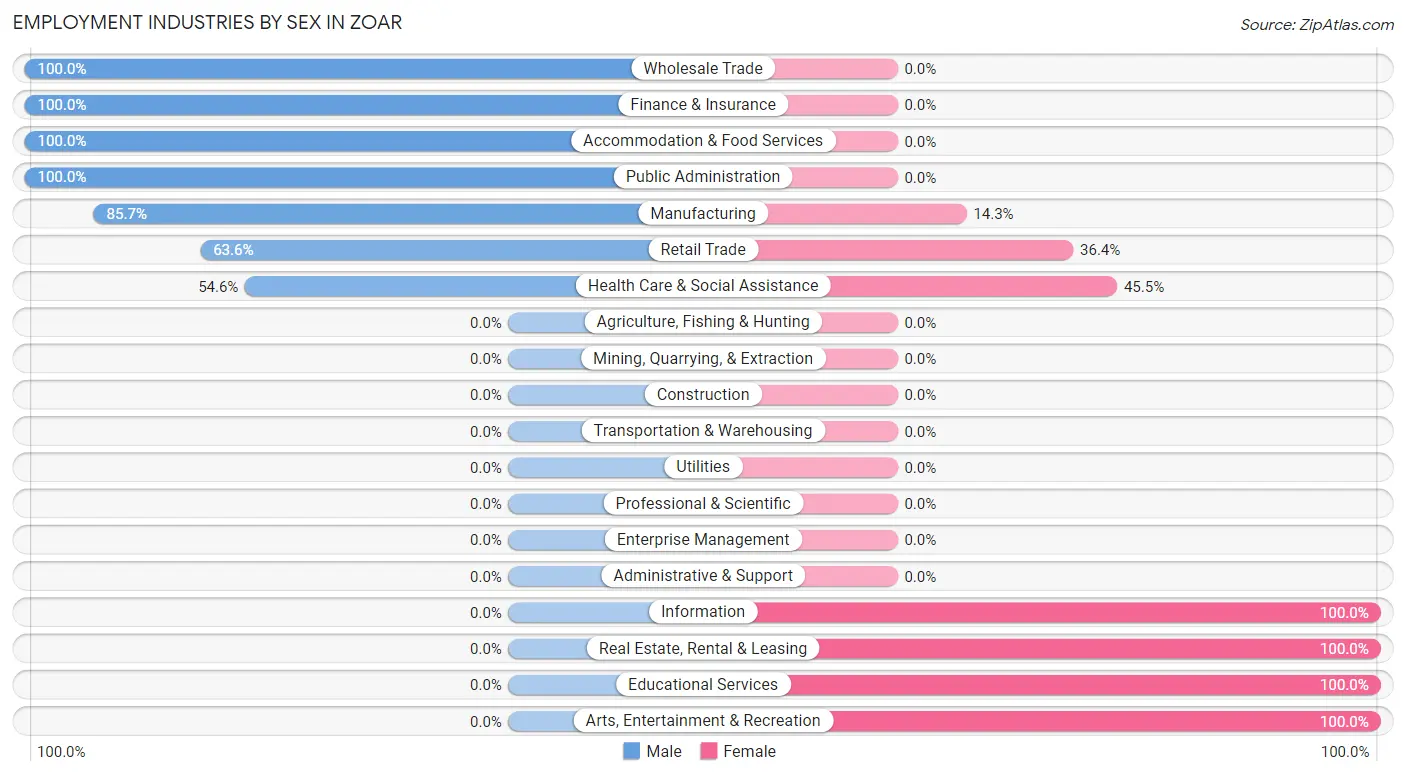
| Industry | Male | Female |
| Agriculture, Fishing & Hunting | 0 (0.0%) | 0 (0.0%) |
| Mining, Quarrying, & Extraction | 0 (0.0%) | 0 (0.0%) |
| Construction | 0 (0.0%) | 0 (0.0%) |
| Manufacturing | 18 (85.7%) | 3 (14.3%) |
| Wholesale Trade | 4 (100.0%) | 0 (0.0%) |
| Retail Trade | 7 (63.6%) | 4 (36.4%) |
| Transportation & Warehousing | 0 (0.0%) | 0 (0.0%) |
| Utilities | 0 (0.0%) | 0 (0.0%) |
| Information | 0 (0.0%) | 6 (100.0%) |
| Finance & Insurance | 4 (100.0%) | 0 (0.0%) |
| Real Estate, Rental & Leasing | 0 (0.0%) | 3 (100.0%) |
| Professional & Scientific | 0 (0.0%) | 0 (0.0%) |
| Enterprise Management | 0 (0.0%) | 0 (0.0%) |
| Administrative & Support | 0 (0.0%) | 0 (0.0%) |
| Educational Services | 0 (0.0%) | 5 (100.0%) |
| Health Care & Social Assistance | 6 (54.5%) | 5 (45.5%) |
| Arts, Entertainment & Recreation | 0 (0.0%) | 10 (100.0%) |
| Accommodation & Food Services | 8 (100.0%) | 0 (0.0%) |
| Public Administration | 16 (100.0%) | 0 (0.0%) |
| Total | 64 (63.4%) | 37 (36.6%) |
Education in Zoar
School Enrollment in Zoar
The most common levels of schooling among the 53 students in Zoar are elementary school (22 | 41.5%), middle school (9 | 17.0%), and nursery / preschool (6 | 11.3%).
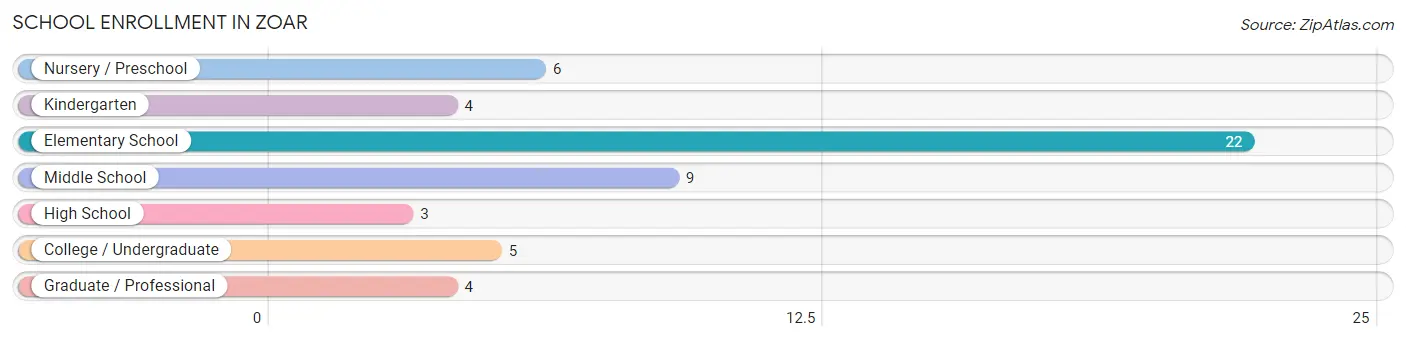
| School Level | # Students | % Students |
| Nursery / Preschool | 6 | 11.3% |
| Kindergarten | 4 | 7.5% |
| Elementary School | 22 | 41.5% |
| Middle School | 9 | 17.0% |
| High School | 3 | 5.7% |
| College / Undergraduate | 5 | 9.4% |
| Graduate / Professional | 4 | 7.5% |
| Total | 53 | 100.0% |
School Enrollment by Age by Funding Source in Zoar
Out of a total of 53 students who are enrolled in schools in Zoar, 6 (11.3%) attend a private institution, while the remaining 47 (88.7%) are enrolled in public schools. The age group of 10 to 14 year olds has the highest likelihood of being enrolled in private schools, with 4 (30.8% in the age bracket) enrolled. Conversely, the age group of 3 to 4 year olds has the lowest likelihood of being enrolled in a private school, with 4 (100.0% in the age bracket) attending a public institution.
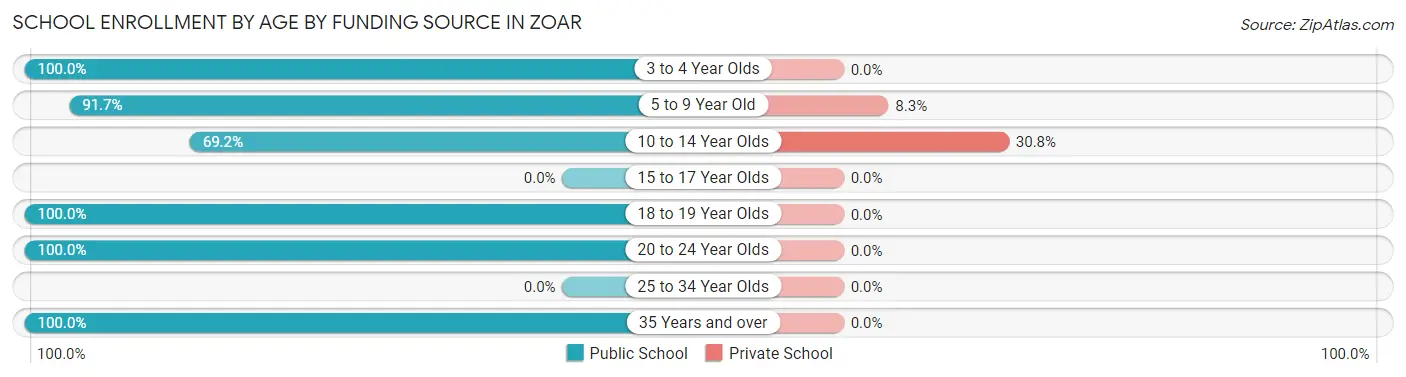
| Age Bracket | Public School | Private School |
| 3 to 4 Year Olds | 4 (100.0%) | 0 (0.0%) |
| 5 to 9 Year Old | 22 (91.7%) | 2 (8.3%) |
| 10 to 14 Year Olds | 9 (69.2%) | 4 (30.8%) |
| 15 to 17 Year Olds | 0 (0.0%) | 0 (0.0%) |
| 18 to 19 Year Olds | 3 (100.0%) | 0 (0.0%) |
| 20 to 24 Year Olds | 5 (100.0%) | 0 (0.0%) |
| 25 to 34 Year Olds | 0 (0.0%) | 0 (0.0%) |
| 35 Years and over | 4 (100.0%) | 0 (0.0%) |
| Total | 47 (88.7%) | 6 (11.3%) |
Educational Attainment by Field of Study in Zoar
Engineering (10 | 20.8%), arts & humanities (8 | 16.7%), social sciences (7 | 14.6%), education (7 | 14.6%), and business (6 | 12.5%) are the most common fields of study among 48 individuals in Zoar who have obtained a bachelor's degree or higher.
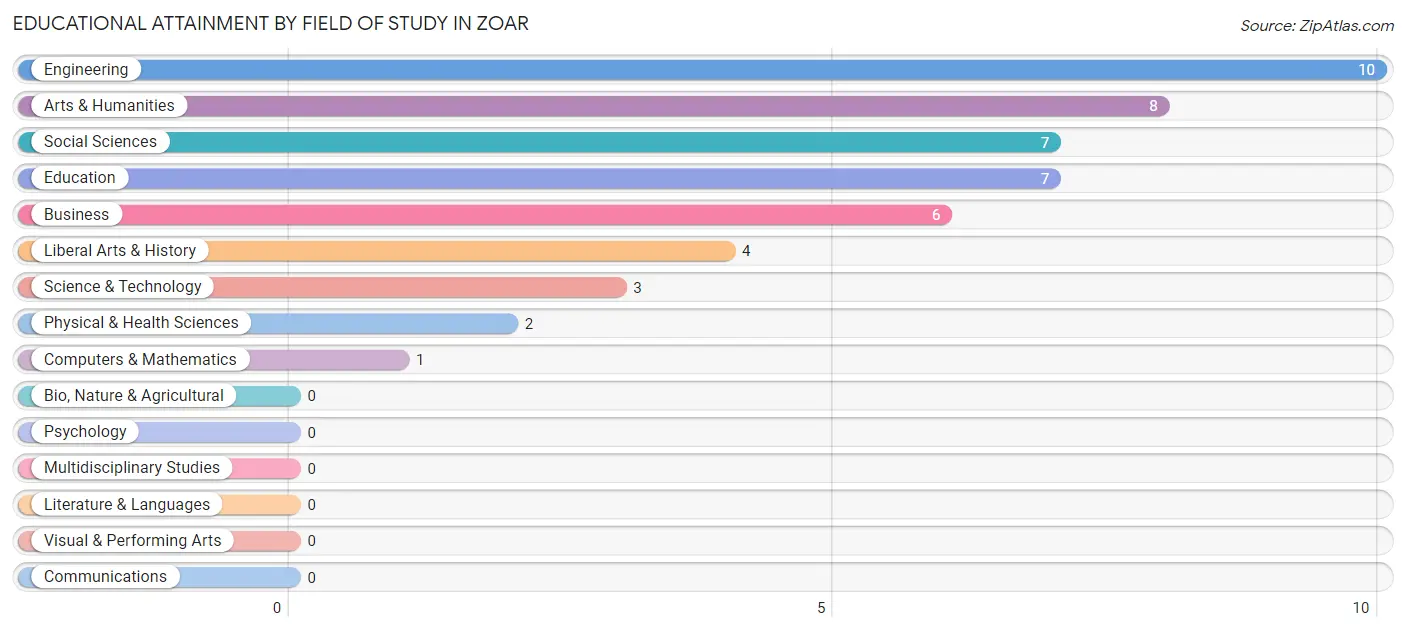
| Field of Study | # Graduates | % Graduates |
| Computers & Mathematics | 1 | 2.1% |
| Bio, Nature & Agricultural | 0 | 0.0% |
| Physical & Health Sciences | 2 | 4.2% |
| Psychology | 0 | 0.0% |
| Social Sciences | 7 | 14.6% |
| Engineering | 10 | 20.8% |
| Multidisciplinary Studies | 0 | 0.0% |
| Science & Technology | 3 | 6.2% |
| Business | 6 | 12.5% |
| Education | 7 | 14.6% |
| Literature & Languages | 0 | 0.0% |
| Liberal Arts & History | 4 | 8.3% |
| Visual & Performing Arts | 0 | 0.0% |
| Communications | 0 | 0.0% |
| Arts & Humanities | 8 | 16.7% |
| Total | 48 | 100.0% |
Transportation & Commute in Zoar
Vehicle Availability by Sex in Zoar
The most prevalent vehicle ownership categories in Zoar are males with 2 vehicles (27, accounting for 42.2%) and females with 2 vehicles (17, making up 73.0%).
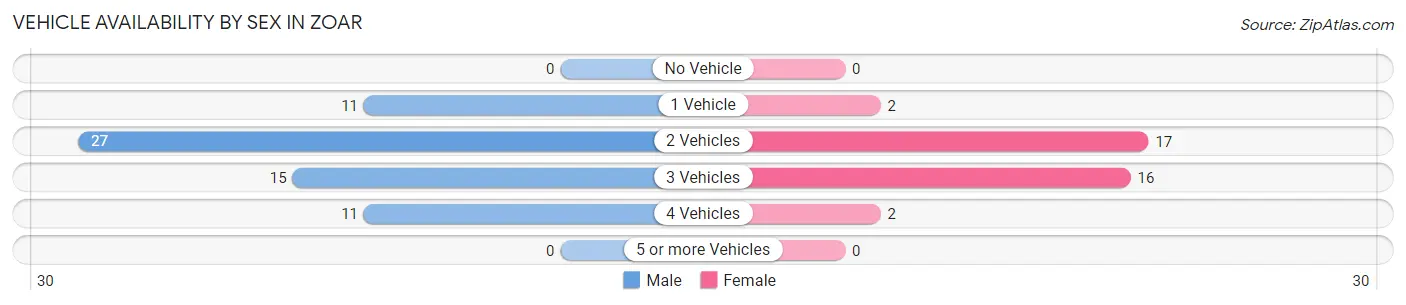
| Vehicles Available | Male | Female |
| No Vehicle | 0 (0.0%) | 0 (0.0%) |
| 1 Vehicle | 11 (17.2%) | 2 (5.4%) |
| 2 Vehicles | 27 (42.2%) | 17 (46.0%) |
| 3 Vehicles | 15 (23.4%) | 16 (43.2%) |
| 4 Vehicles | 11 (17.2%) | 2 (5.4%) |
| 5 or more Vehicles | 0 (0.0%) | 0 (0.0%) |
| Total | 64 (100.0%) | 37 (100.0%) |
Commute Time in Zoar
The most frequently occuring commute durations in Zoar are 20 to 24 minutes (19 commuters, 19.8%), 15 to 19 minutes (17 commuters, 17.7%), and less than 5 minutes (14 commuters, 14.6%).
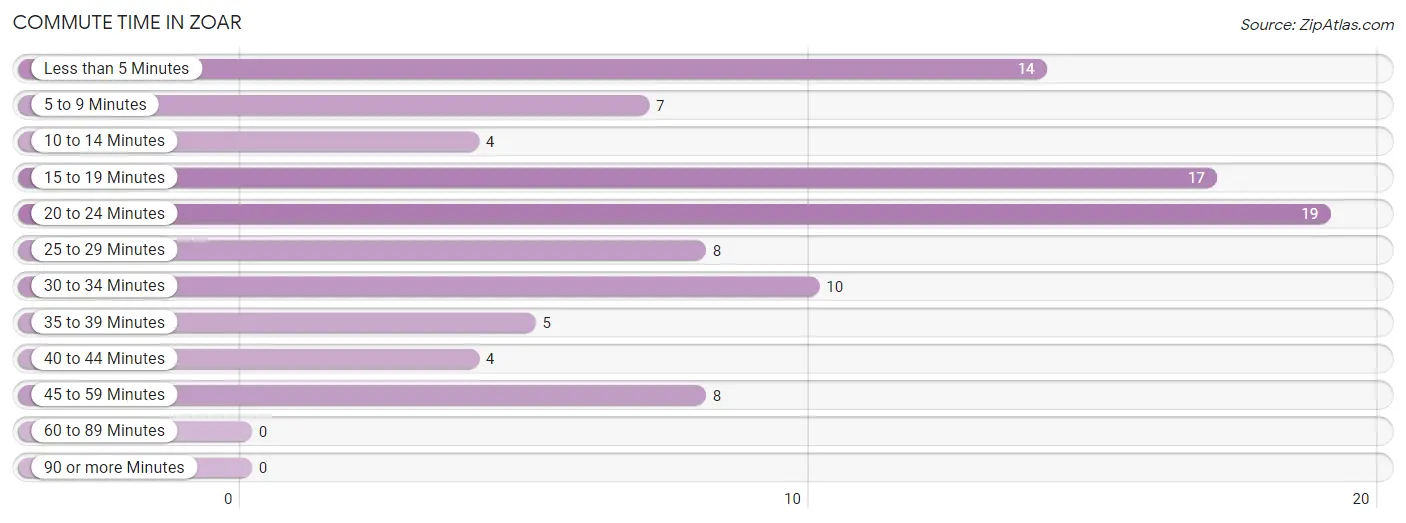
| Commute Time | # Commuters | % Commuters |
| Less than 5 Minutes | 14 | 14.6% |
| 5 to 9 Minutes | 7 | 7.3% |
| 10 to 14 Minutes | 4 | 4.2% |
| 15 to 19 Minutes | 17 | 17.7% |
| 20 to 24 Minutes | 19 | 19.8% |
| 25 to 29 Minutes | 8 | 8.3% |
| 30 to 34 Minutes | 10 | 10.4% |
| 35 to 39 Minutes | 5 | 5.2% |
| 40 to 44 Minutes | 4 | 4.2% |
| 45 to 59 Minutes | 8 | 8.3% |
| 60 to 89 Minutes | 0 | 0.0% |
| 90 or more Minutes | 0 | 0.0% |
Commute Time by Sex in Zoar
The most common commute times in Zoar are 20 to 24 minutes (14 commuters, 23.7%) for males and less than 5 minutes (14 commuters, 37.8%) for females.
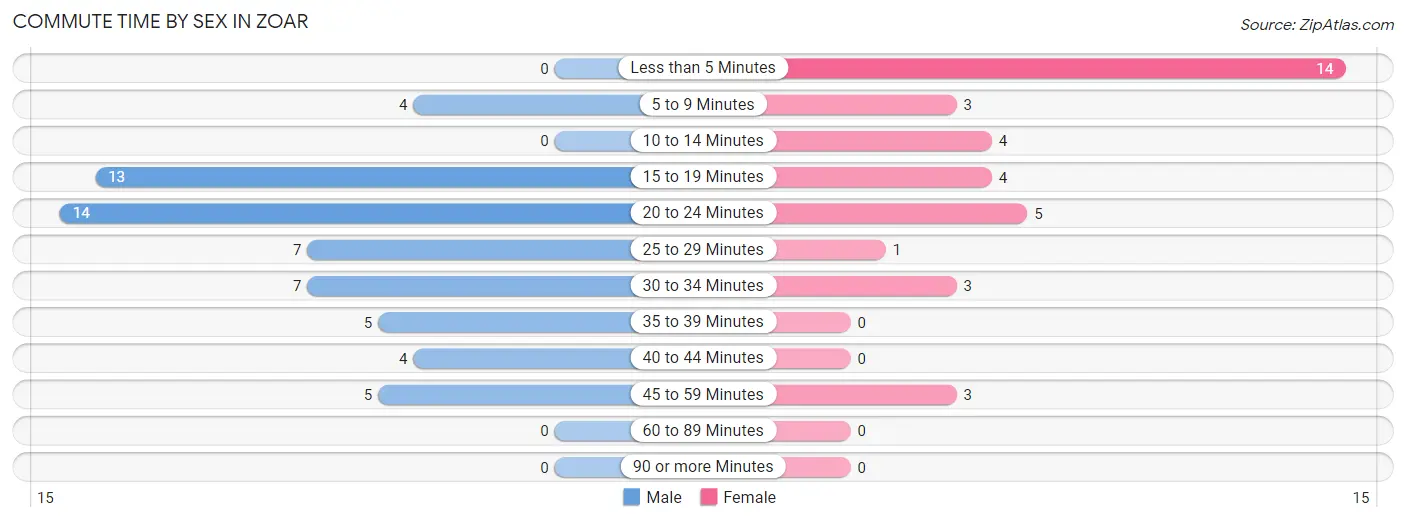
| Commute Time | Male | Female |
| Less than 5 Minutes | 0 (0.0%) | 14 (37.8%) |
| 5 to 9 Minutes | 4 (6.8%) | 3 (8.1%) |
| 10 to 14 Minutes | 0 (0.0%) | 4 (10.8%) |
| 15 to 19 Minutes | 13 (22.0%) | 4 (10.8%) |
| 20 to 24 Minutes | 14 (23.7%) | 5 (13.5%) |
| 25 to 29 Minutes | 7 (11.9%) | 1 (2.7%) |
| 30 to 34 Minutes | 7 (11.9%) | 3 (8.1%) |
| 35 to 39 Minutes | 5 (8.5%) | 0 (0.0%) |
| 40 to 44 Minutes | 4 (6.8%) | 0 (0.0%) |
| 45 to 59 Minutes | 5 (8.5%) | 3 (8.1%) |
| 60 to 89 Minutes | 0 (0.0%) | 0 (0.0%) |
| 90 or more Minutes | 0 (0.0%) | 0 (0.0%) |
Time of Departure to Work by Sex in Zoar
The most frequent times of departure to work in Zoar are 6:30 AM to 6:59 AM (14, 23.7%) for males and 9:00 AM to 9:59 AM (13, 35.1%) for females.
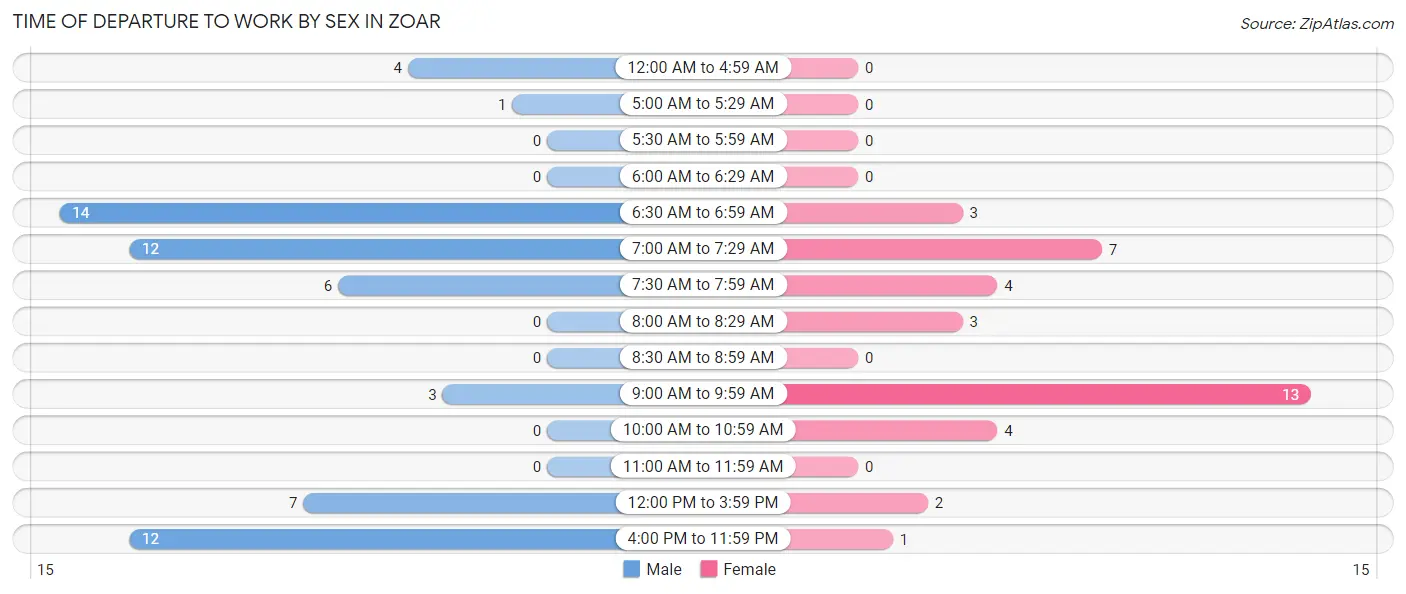
| Time of Departure | Male | Female |
| 12:00 AM to 4:59 AM | 4 (6.8%) | 0 (0.0%) |
| 5:00 AM to 5:29 AM | 1 (1.7%) | 0 (0.0%) |
| 5:30 AM to 5:59 AM | 0 (0.0%) | 0 (0.0%) |
| 6:00 AM to 6:29 AM | 0 (0.0%) | 0 (0.0%) |
| 6:30 AM to 6:59 AM | 14 (23.7%) | 3 (8.1%) |
| 7:00 AM to 7:29 AM | 12 (20.3%) | 7 (18.9%) |
| 7:30 AM to 7:59 AM | 6 (10.2%) | 4 (10.8%) |
| 8:00 AM to 8:29 AM | 0 (0.0%) | 3 (8.1%) |
| 8:30 AM to 8:59 AM | 0 (0.0%) | 0 (0.0%) |
| 9:00 AM to 9:59 AM | 3 (5.1%) | 13 (35.1%) |
| 10:00 AM to 10:59 AM | 0 (0.0%) | 4 (10.8%) |
| 11:00 AM to 11:59 AM | 0 (0.0%) | 0 (0.0%) |
| 12:00 PM to 3:59 PM | 7 (11.9%) | 2 (5.4%) |
| 4:00 PM to 11:59 PM | 12 (20.3%) | 1 (2.7%) |
| Total | 59 (100.0%) | 37 (100.0%) |
Housing Occupancy in Zoar
Occupancy by Ownership in Zoar
Of the total 78 dwellings in Zoar, owner-occupied units account for 74 (94.9%), while renter-occupied units make up 4 (5.1%).
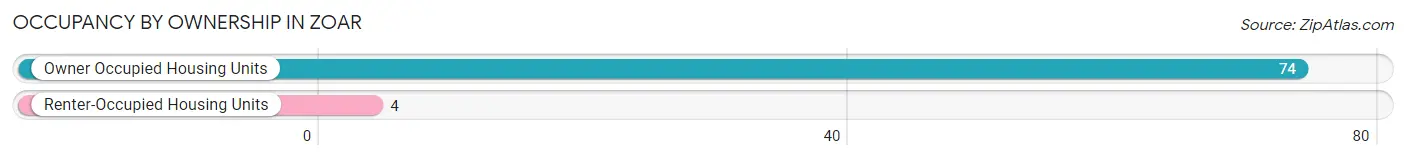
| Occupancy | # Housing Units | % Housing Units |
| Owner Occupied Housing Units | 74 | 94.9% |
| Renter-Occupied Housing Units | 4 | 5.1% |
| Total Occupied Housing Units | 78 | 100.0% |
Occupancy by Household Size in Zoar
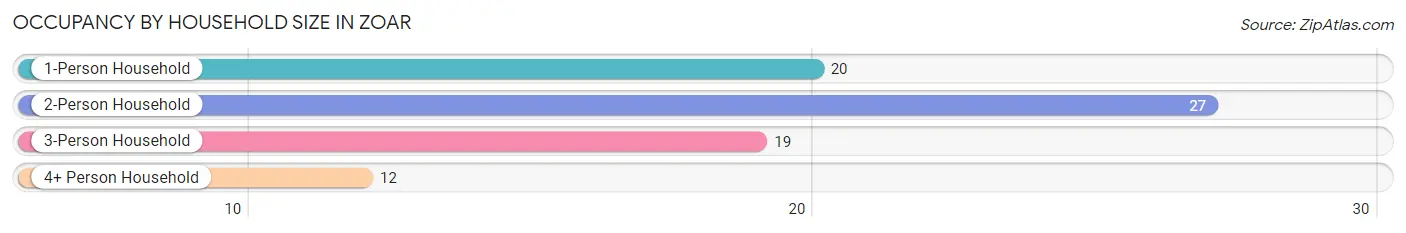
| Household Size | # Housing Units | % Housing Units |
| 1-Person Household | 20 | 25.6% |
| 2-Person Household | 27 | 34.6% |
| 3-Person Household | 19 | 24.4% |
| 4+ Person Household | 12 | 15.4% |
| Total Housing Units | 78 | 100.0% |
Occupancy by Ownership by Household Size in Zoar
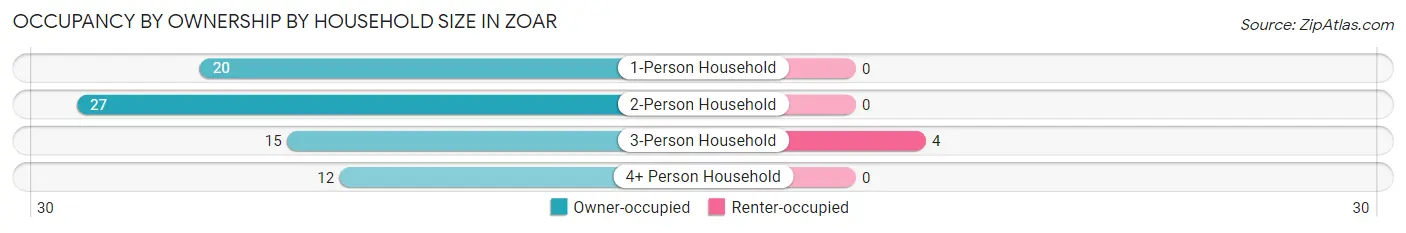
| Household Size | Owner-occupied | Renter-occupied |
| 1-Person Household | 20 (100.0%) | 0 (0.0%) |
| 2-Person Household | 27 (100.0%) | 0 (0.0%) |
| 3-Person Household | 15 (78.9%) | 4 (21.0%) |
| 4+ Person Household | 12 (100.0%) | 0 (0.0%) |
| Total Housing Units | 74 (94.9%) | 4 (5.1%) |
Occupancy by Educational Attainment in Zoar
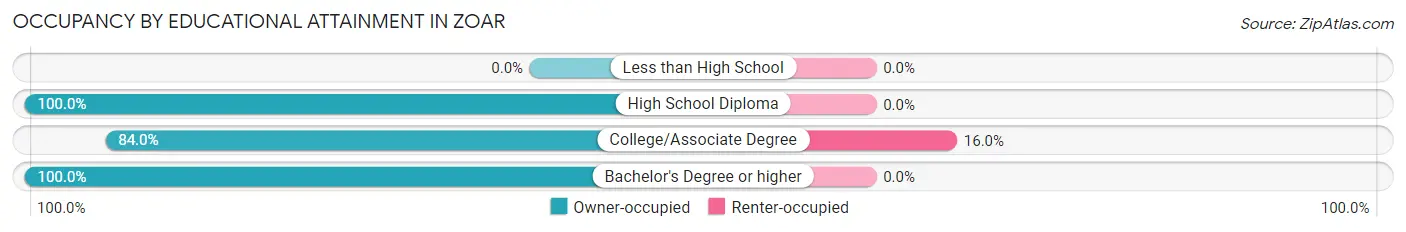
| Household Size | Owner-occupied | Renter-occupied |
| Less than High School | 0 (0.0%) | 0 (0.0%) |
| High School Diploma | 23 (100.0%) | 0 (0.0%) |
| College/Associate Degree | 21 (84.0%) | 4 (16.0%) |
| Bachelor's Degree or higher | 30 (100.0%) | 0 (0.0%) |
Occupancy by Age of Householder in Zoar
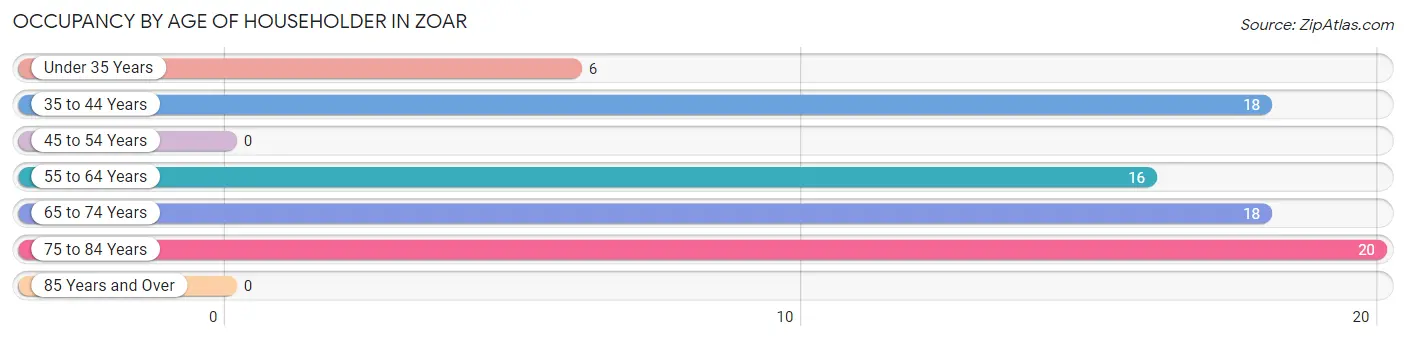
| Age Bracket | # Households | % Households |
| Under 35 Years | 6 | 7.7% |
| 35 to 44 Years | 18 | 23.1% |
| 45 to 54 Years | 0 | 0.0% |
| 55 to 64 Years | 16 | 20.5% |
| 65 to 74 Years | 18 | 23.1% |
| 75 to 84 Years | 20 | 25.6% |
| 85 Years and Over | 0 | 0.0% |
| Total | 78 | 100.0% |
Housing Finances in Zoar
Median Income by Occupancy in Zoar
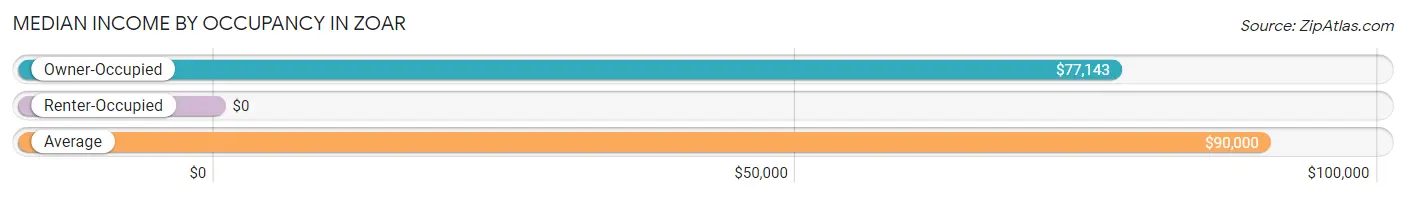
| Occupancy Type | # Households | Median Income |
| Owner-Occupied | 74 (94.9%) | $77,143 |
| Renter-Occupied | 4 (5.1%) | $0 |
| Average | 78 (100.0%) | $90,000 |
Occupancy by Householder Income Bracket in Zoar
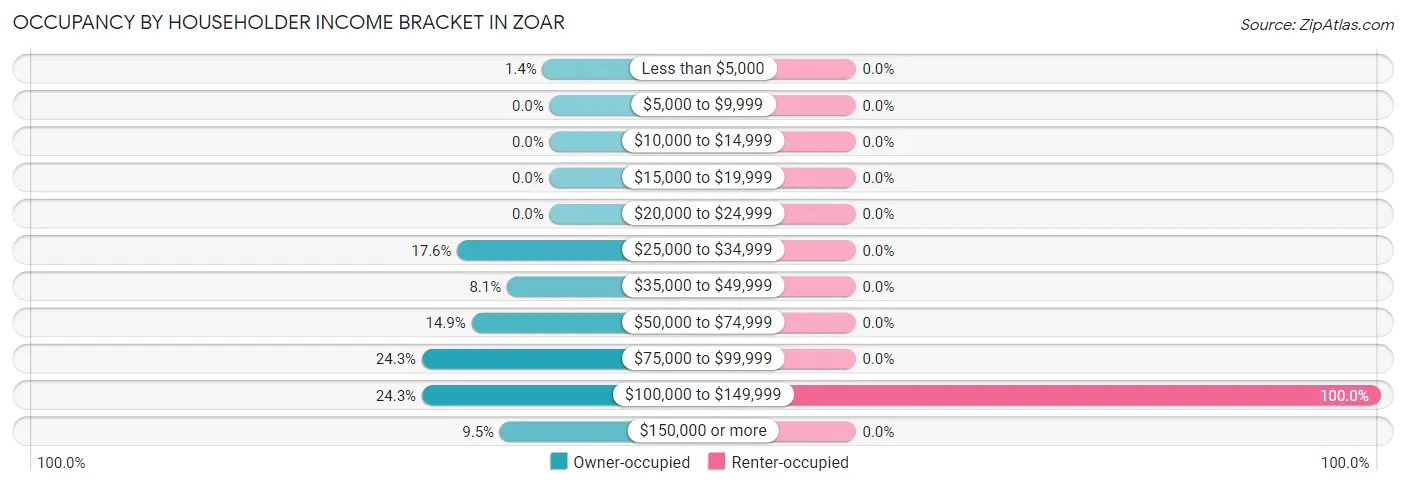
| Income Bracket | Owner-occupied | Renter-occupied |
| Less than $5,000 | 1 (1.3%) | 0 (0.0%) |
| $5,000 to $9,999 | 0 (0.0%) | 0 (0.0%) |
| $10,000 to $14,999 | 0 (0.0%) | 0 (0.0%) |
| $15,000 to $19,999 | 0 (0.0%) | 0 (0.0%) |
| $20,000 to $24,999 | 0 (0.0%) | 0 (0.0%) |
| $25,000 to $34,999 | 13 (17.6%) | 0 (0.0%) |
| $35,000 to $49,999 | 6 (8.1%) | 0 (0.0%) |
| $50,000 to $74,999 | 11 (14.9%) | 0 (0.0%) |
| $75,000 to $99,999 | 18 (24.3%) | 0 (0.0%) |
| $100,000 to $149,999 | 18 (24.3%) | 4 (100.0%) |
| $150,000 or more | 7 (9.5%) | 0 (0.0%) |
| Total | 74 (100.0%) | 4 (100.0%) |
Monthly Housing Cost Tiers in Zoar
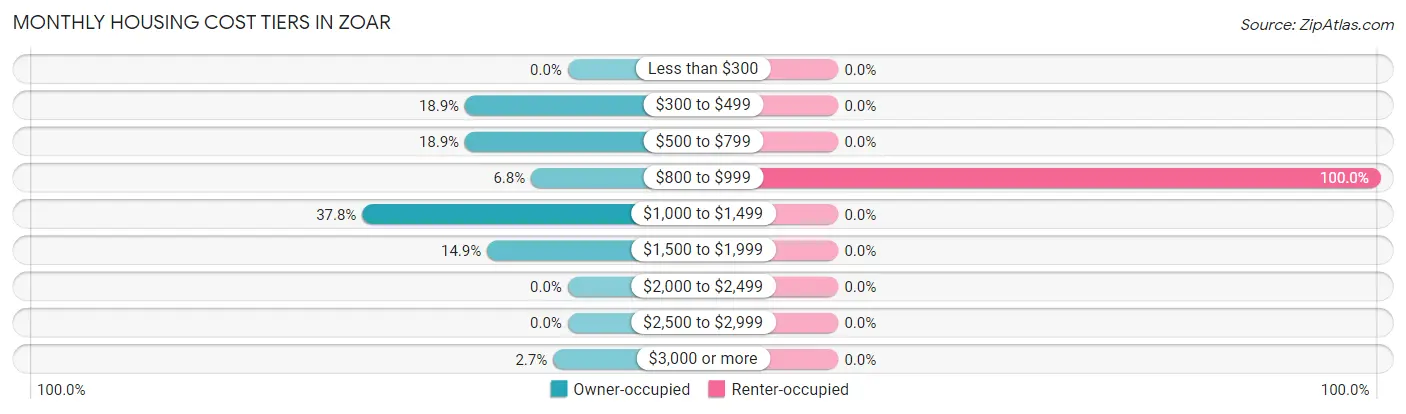
| Monthly Cost | Owner-occupied | Renter-occupied |
| Less than $300 | 0 (0.0%) | 0 (0.0%) |
| $300 to $499 | 14 (18.9%) | 0 (0.0%) |
| $500 to $799 | 14 (18.9%) | 0 (0.0%) |
| $800 to $999 | 5 (6.8%) | 4 (100.0%) |
| $1,000 to $1,499 | 28 (37.8%) | 0 (0.0%) |
| $1,500 to $1,999 | 11 (14.9%) | 0 (0.0%) |
| $2,000 to $2,499 | 0 (0.0%) | 0 (0.0%) |
| $2,500 to $2,999 | 0 (0.0%) | 0 (0.0%) |
| $3,000 or more | 2 (2.7%) | 0 (0.0%) |
| Total | 74 (100.0%) | 4 (100.0%) |
Physical Housing Characteristics in Zoar
Housing Structures in Zoar
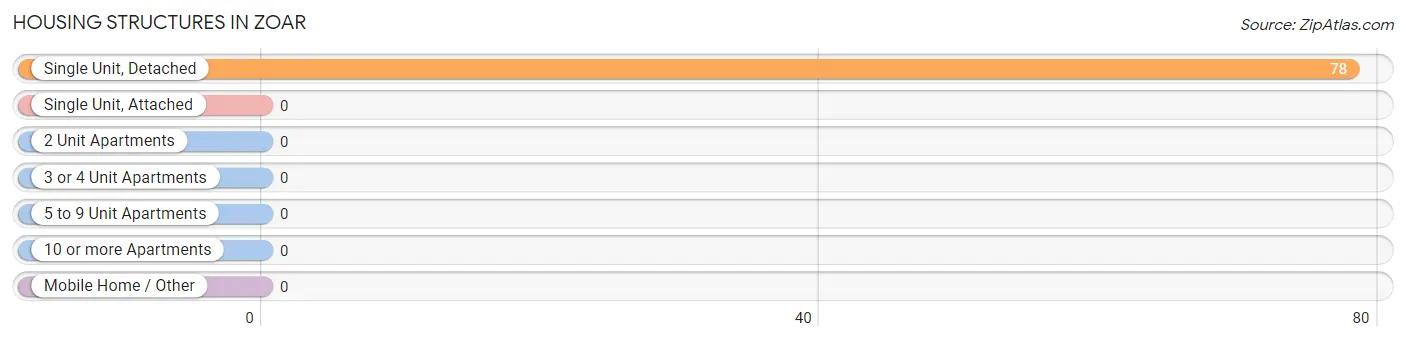
| Structure Type | # Housing Units | % Housing Units |
| Single Unit, Detached | 78 | 100.0% |
| Single Unit, Attached | 0 | 0.0% |
| 2 Unit Apartments | 0 | 0.0% |
| 3 or 4 Unit Apartments | 0 | 0.0% |
| 5 to 9 Unit Apartments | 0 | 0.0% |
| 10 or more Apartments | 0 | 0.0% |
| Mobile Home / Other | 0 | 0.0% |
| Total | 78 | 100.0% |
Housing Structures by Occupancy in Zoar
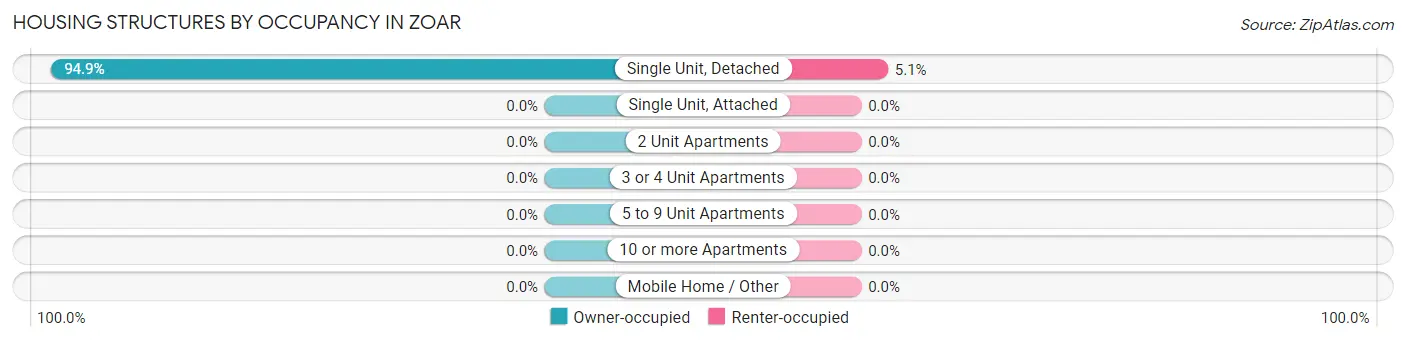
| Structure Type | Owner-occupied | Renter-occupied |
| Single Unit, Detached | 74 (94.9%) | 4 (5.1%) |
| Single Unit, Attached | 0 (0.0%) | 0 (0.0%) |
| 2 Unit Apartments | 0 (0.0%) | 0 (0.0%) |
| 3 or 4 Unit Apartments | 0 (0.0%) | 0 (0.0%) |
| 5 to 9 Unit Apartments | 0 (0.0%) | 0 (0.0%) |
| 10 or more Apartments | 0 (0.0%) | 0 (0.0%) |
| Mobile Home / Other | 0 (0.0%) | 0 (0.0%) |
| Total | 74 (94.9%) | 4 (5.1%) |
Housing Structures by Number of Rooms in Zoar
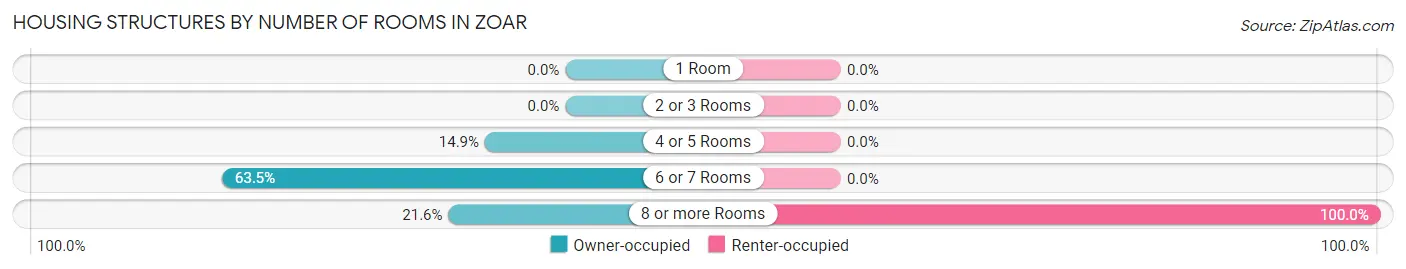
| Number of Rooms | Owner-occupied | Renter-occupied |
| 1 Room | 0 (0.0%) | 0 (0.0%) |
| 2 or 3 Rooms | 0 (0.0%) | 0 (0.0%) |
| 4 or 5 Rooms | 11 (14.9%) | 0 (0.0%) |
| 6 or 7 Rooms | 47 (63.5%) | 0 (0.0%) |
| 8 or more Rooms | 16 (21.6%) | 4 (100.0%) |
| Total | 74 (100.0%) | 4 (100.0%) |
Housing Structure by Heating Type in Zoar
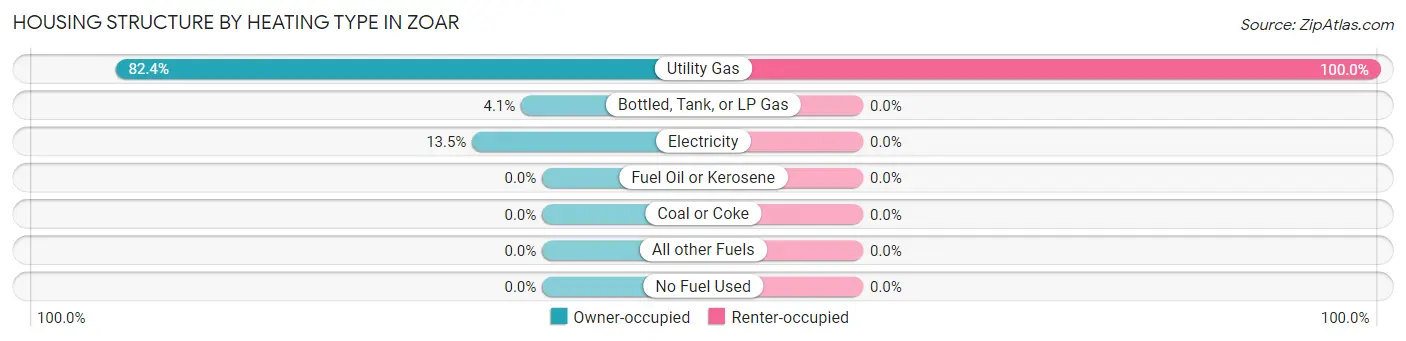
| Heating Type | Owner-occupied | Renter-occupied |
| Utility Gas | 61 (82.4%) | 4 (100.0%) |
| Bottled, Tank, or LP Gas | 3 (4.1%) | 0 (0.0%) |
| Electricity | 10 (13.5%) | 0 (0.0%) |
| Fuel Oil or Kerosene | 0 (0.0%) | 0 (0.0%) |
| Coal or Coke | 0 (0.0%) | 0 (0.0%) |
| All other Fuels | 0 (0.0%) | 0 (0.0%) |
| No Fuel Used | 0 (0.0%) | 0 (0.0%) |
| Total | 74 (100.0%) | 4 (100.0%) |
Household Vehicle Usage in Zoar
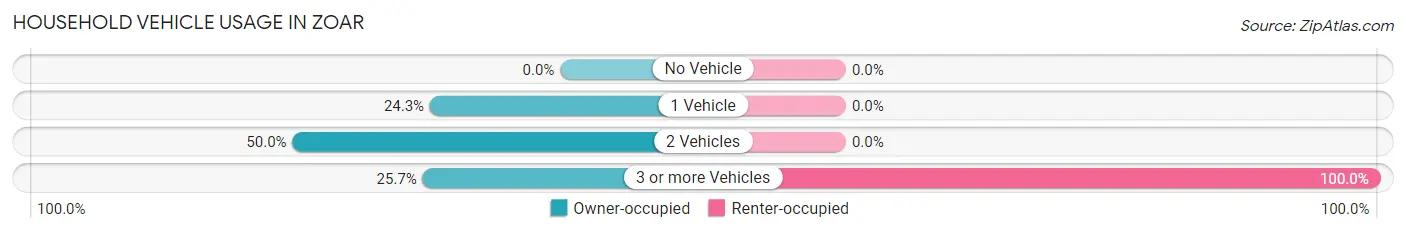
| Vehicles per Household | Owner-occupied | Renter-occupied |
| No Vehicle | 0 (0.0%) | 0 (0.0%) |
| 1 Vehicle | 18 (24.3%) | 0 (0.0%) |
| 2 Vehicles | 37 (50.0%) | 0 (0.0%) |
| 3 or more Vehicles | 19 (25.7%) | 4 (100.0%) |
| Total | 74 (100.0%) | 4 (100.0%) |
Real Estate & Mortgages in Zoar
Real Estate and Mortgage Overview in Zoar
| Characteristic | Without Mortgage | With Mortgage |
| Housing Units | 32 | 42 |
| Median Property Value | $216,700 | $187,500 |
| Median Household Income | $53,333 | $4 |
| Monthly Housing Costs | $520 | $1 |
| Real Estate Taxes | $2,100 | $0 |
Property Value by Mortgage Status in Zoar
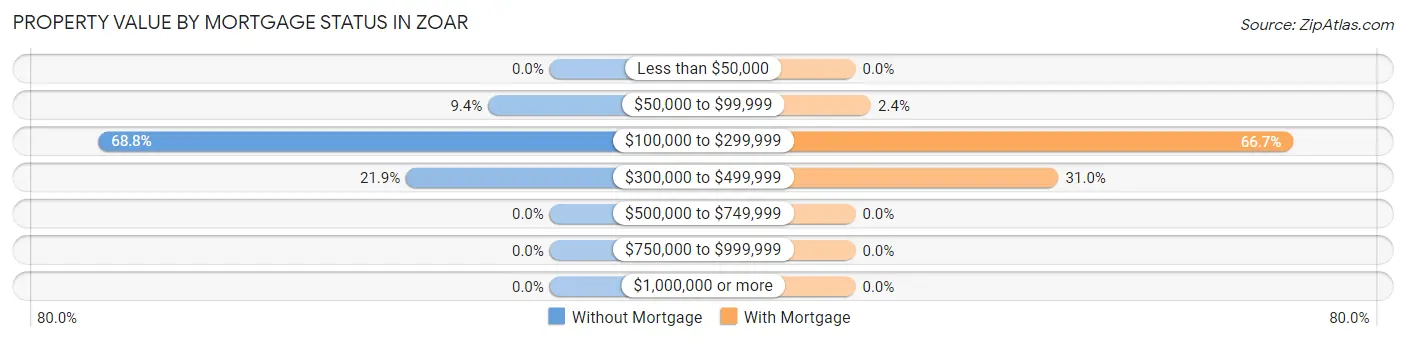
| Property Value | Without Mortgage | With Mortgage |
| Less than $50,000 | 0 (0.0%) | 0 (0.0%) |
| $50,000 to $99,999 | 3 (9.4%) | 1 (2.4%) |
| $100,000 to $299,999 | 22 (68.8%) | 28 (66.7%) |
| $300,000 to $499,999 | 7 (21.9%) | 13 (30.9%) |
| $500,000 to $749,999 | 0 (0.0%) | 0 (0.0%) |
| $750,000 to $999,999 | 0 (0.0%) | 0 (0.0%) |
| $1,000,000 or more | 0 (0.0%) | 0 (0.0%) |
| Total | 32 (100.0%) | 42 (100.0%) |
Household Income by Mortgage Status in Zoar
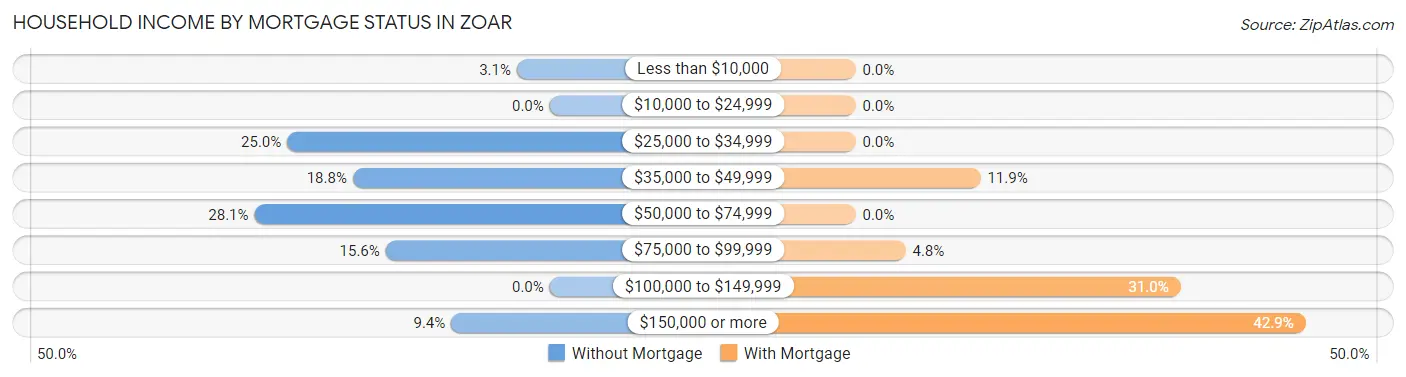
| Household Income | Without Mortgage | With Mortgage |
| Less than $10,000 | 1 (3.1%) | 0 (0.0%) |
| $10,000 to $24,999 | 0 (0.0%) | 0 (0.0%) |
| $25,000 to $34,999 | 8 (25.0%) | 0 (0.0%) |
| $35,000 to $49,999 | 6 (18.8%) | 5 (11.9%) |
| $50,000 to $74,999 | 9 (28.1%) | 0 (0.0%) |
| $75,000 to $99,999 | 5 (15.6%) | 2 (4.8%) |
| $100,000 to $149,999 | 0 (0.0%) | 13 (30.9%) |
| $150,000 or more | 3 (9.4%) | 18 (42.9%) |
| Total | 32 (100.0%) | 42 (100.0%) |
Property Value to Household Income Ratio in Zoar
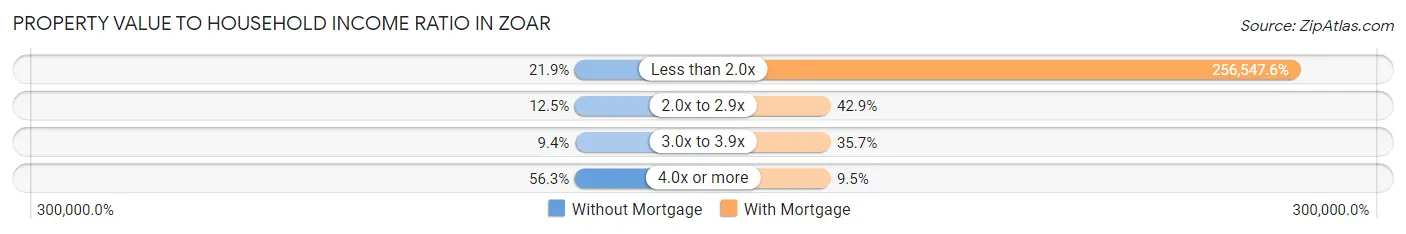
| Value-to-Income Ratio | Without Mortgage | With Mortgage |
| Less than 2.0x | 7 (21.9%) | 107,750 (256,547.6%) |
| 2.0x to 2.9x | 4 (12.5%) | 18 (42.9%) |
| 3.0x to 3.9x | 3 (9.4%) | 15 (35.7%) |
| 4.0x or more | 18 (56.2%) | 4 (9.5%) |
| Total | 32 (100.0%) | 42 (100.0%) |
Real Estate Taxes by Mortgage Status in Zoar
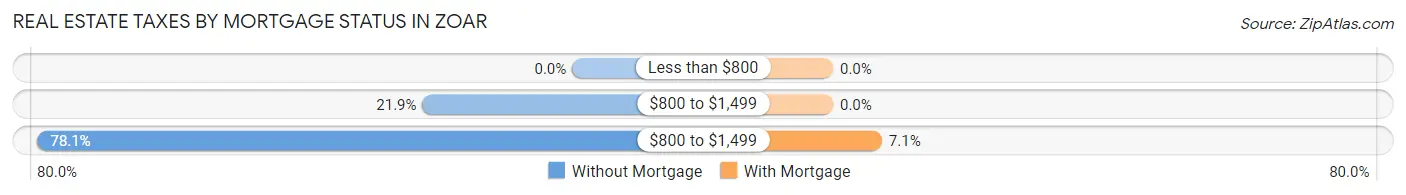
| Property Taxes | Without Mortgage | With Mortgage |
| Less than $800 | 0 (0.0%) | 0 (0.0%) |
| $800 to $1,499 | 7 (21.9%) | 0 (0.0%) |
| $800 to $1,499 | 25 (78.1%) | 3 (7.1%) |
| Total | 32 (100.0%) | 42 (100.0%) |
Health & Disability in Zoar
Health Insurance Coverage by Age in Zoar
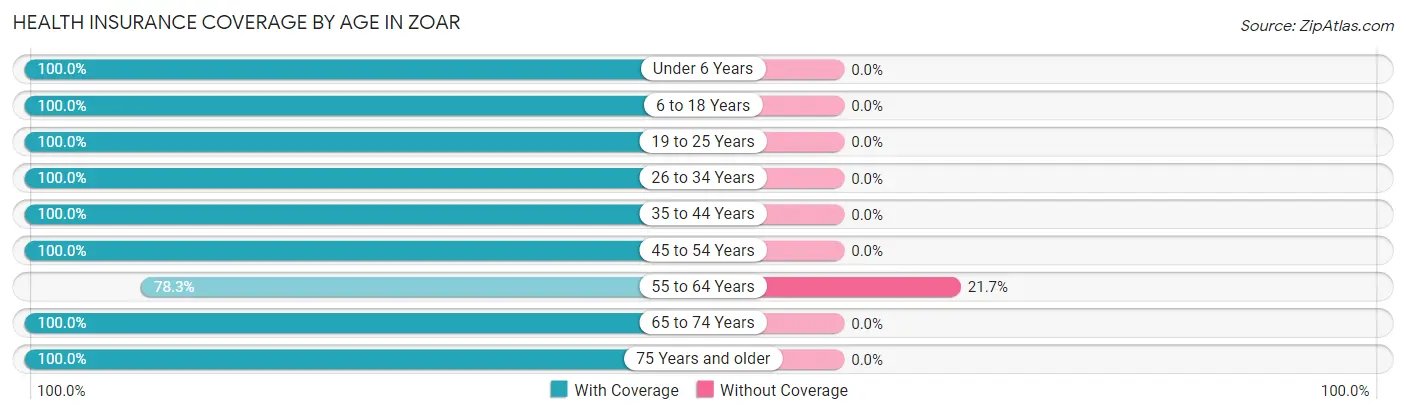
| Age Bracket | With Coverage | Without Coverage |
| Under 6 Years | 7 (100.0%) | 0 (0.0%) |
| 6 to 18 Years | 38 (100.0%) | 0 (0.0%) |
| 19 to 25 Years | 12 (100.0%) | 0 (0.0%) |
| 26 to 34 Years | 12 (100.0%) | 0 (0.0%) |
| 35 to 44 Years | 36 (100.0%) | 0 (0.0%) |
| 45 to 54 Years | 9 (100.0%) | 0 (0.0%) |
| 55 to 64 Years | 18 (78.3%) | 5 (21.7%) |
| 65 to 74 Years | 30 (100.0%) | 0 (0.0%) |
| 75 Years and older | 39 (100.0%) | 0 (0.0%) |
| Total | 201 (97.6%) | 5 (2.4%) |
Health Insurance Coverage by Citizenship Status in Zoar
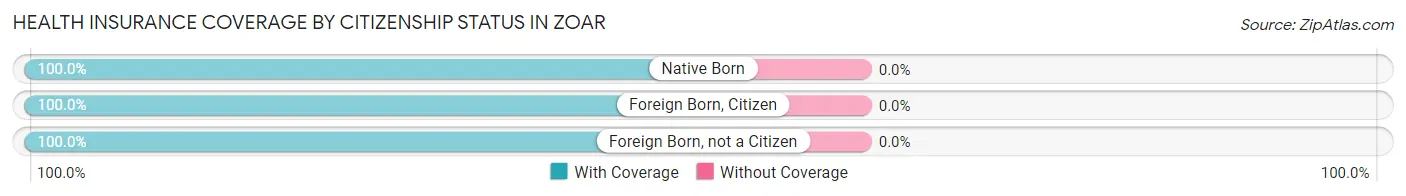
| Citizenship Status | With Coverage | Without Coverage |
| Native Born | 7 (100.0%) | 0 (0.0%) |
| Foreign Born, Citizen | 38 (100.0%) | 0 (0.0%) |
| Foreign Born, not a Citizen | 12 (100.0%) | 0 (0.0%) |
Health Insurance Coverage by Household Income in Zoar
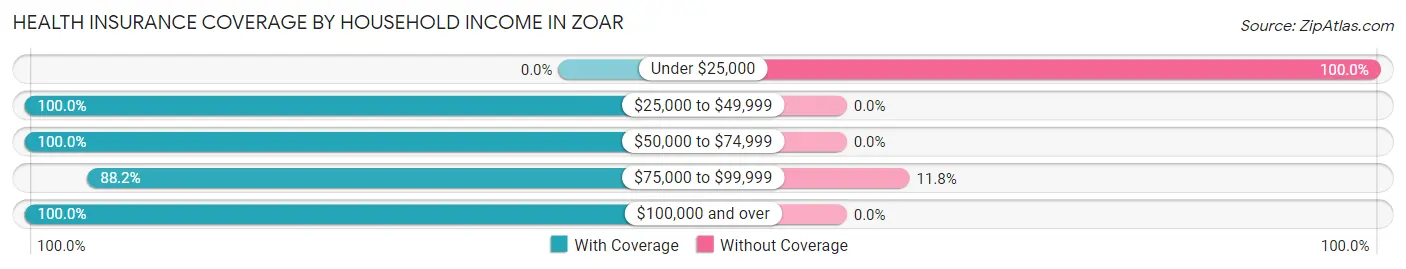
| Household Income | With Coverage | Without Coverage |
| Under $25,000 | 0 (0.0%) | 1 (100.0%) |
| $25,000 to $49,999 | 41 (100.0%) | 0 (0.0%) |
| $50,000 to $74,999 | 21 (100.0%) | 0 (0.0%) |
| $75,000 to $99,999 | 30 (88.2%) | 4 (11.8%) |
| $100,000 and over | 109 (100.0%) | 0 (0.0%) |
Public vs Private Health Insurance Coverage by Age in Zoar
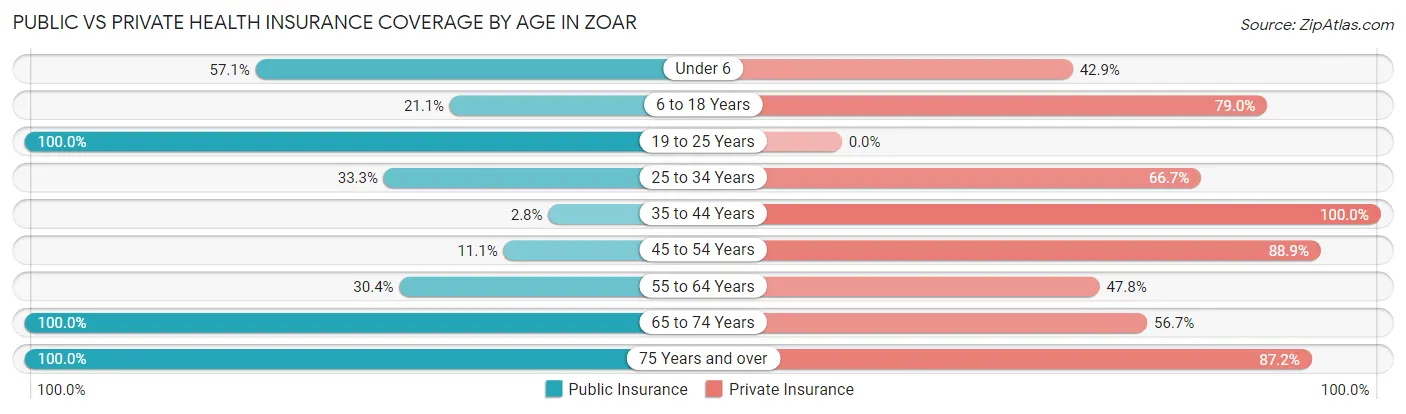
| Age Bracket | Public Insurance | Private Insurance |
| Under 6 | 4 (57.1%) | 3 (42.9%) |
| 6 to 18 Years | 8 (21.0%) | 30 (78.9%) |
| 19 to 25 Years | 12 (100.0%) | 0 (0.0%) |
| 25 to 34 Years | 4 (33.3%) | 8 (66.7%) |
| 35 to 44 Years | 1 (2.8%) | 36 (100.0%) |
| 45 to 54 Years | 1 (11.1%) | 8 (88.9%) |
| 55 to 64 Years | 7 (30.4%) | 11 (47.8%) |
| 65 to 74 Years | 30 (100.0%) | 17 (56.7%) |
| 75 Years and over | 39 (100.0%) | 34 (87.2%) |
| Total | 106 (51.5%) | 147 (71.4%) |
Disability Status by Sex by Age in Zoar
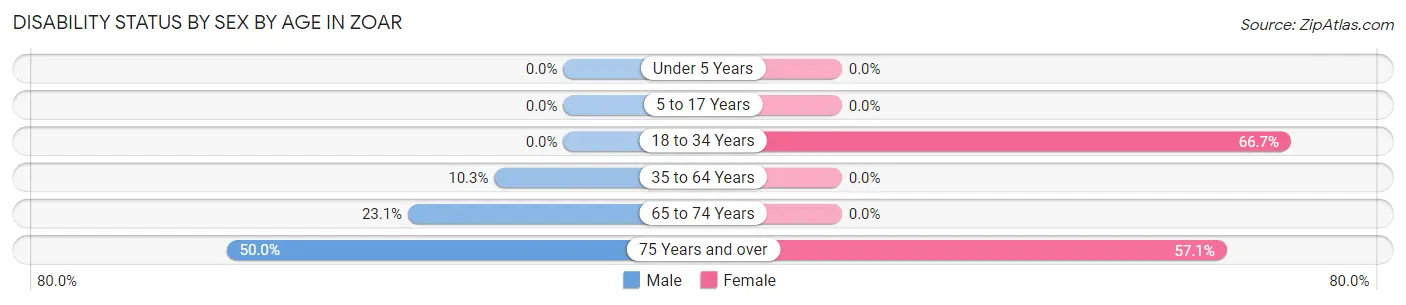
| Age Bracket | Male | Female |
| Under 5 Years | 0 (0.0%) | 0 (0.0%) |
| 5 to 17 Years | 0 (0.0%) | 0 (0.0%) |
| 18 to 34 Years | 0 (0.0%) | 4 (66.7%) |
| 35 to 64 Years | 4 (10.3%) | 0 (0.0%) |
| 65 to 74 Years | 3 (23.1%) | 0 (0.0%) |
| 75 Years and over | 9 (50.0%) | 12 (57.1%) |
Disability Class by Sex by Age in Zoar
Disability Class: Hearing Difficulty
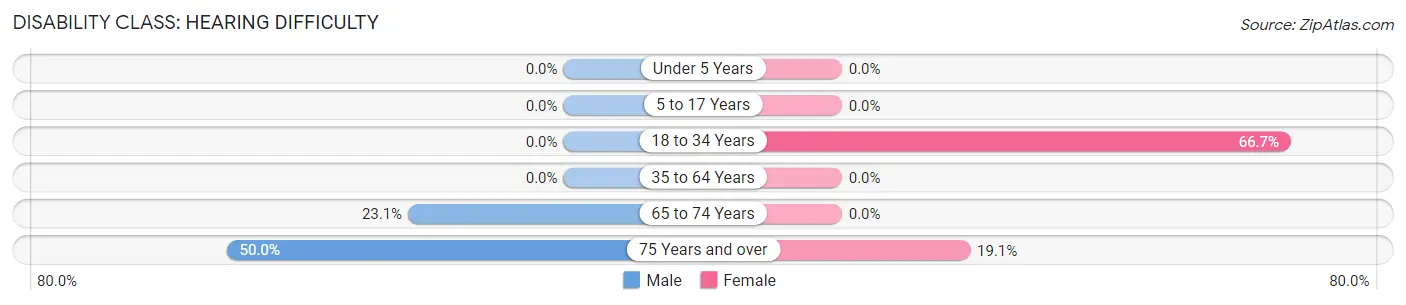
| Age Bracket | Male | Female |
| Under 5 Years | 0 (0.0%) | 0 (0.0%) |
| 5 to 17 Years | 0 (0.0%) | 0 (0.0%) |
| 18 to 34 Years | 0 (0.0%) | 4 (66.7%) |
| 35 to 64 Years | 0 (0.0%) | 0 (0.0%) |
| 65 to 74 Years | 3 (23.1%) | 0 (0.0%) |
| 75 Years and over | 9 (50.0%) | 4 (19.1%) |
Disability Class: Vision Difficulty
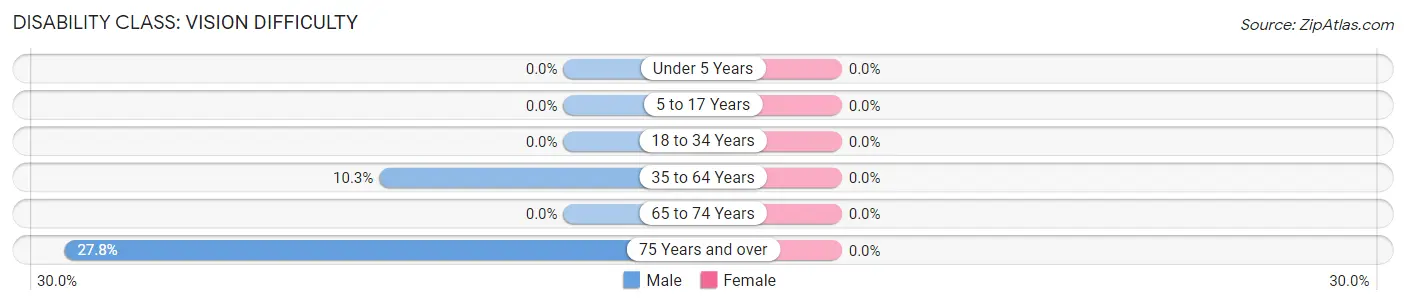
| Age Bracket | Male | Female |
| Under 5 Years | 0 (0.0%) | 0 (0.0%) |
| 5 to 17 Years | 0 (0.0%) | 0 (0.0%) |
| 18 to 34 Years | 0 (0.0%) | 0 (0.0%) |
| 35 to 64 Years | 4 (10.3%) | 0 (0.0%) |
| 65 to 74 Years | 0 (0.0%) | 0 (0.0%) |
| 75 Years and over | 5 (27.8%) | 0 (0.0%) |
Disability Class: Cognitive Difficulty
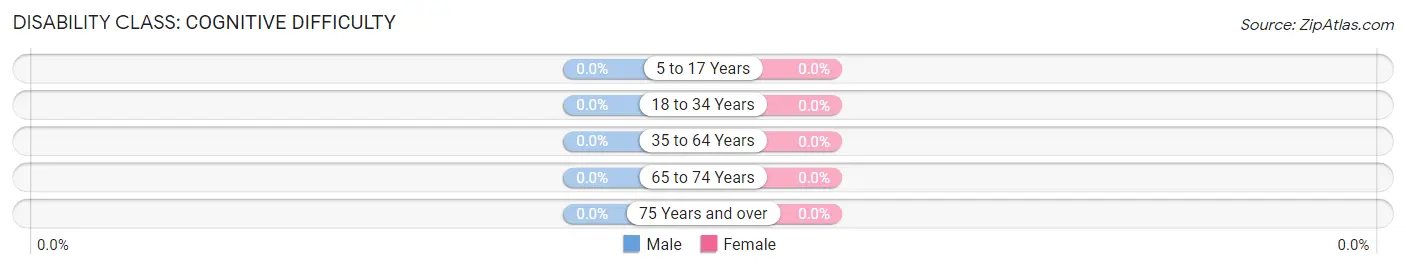
| Age Bracket | Male | Female |
| 5 to 17 Years | 0 (0.0%) | 0 (0.0%) |
| 18 to 34 Years | 0 (0.0%) | 0 (0.0%) |
| 35 to 64 Years | 0 (0.0%) | 0 (0.0%) |
| 65 to 74 Years | 0 (0.0%) | 0 (0.0%) |
| 75 Years and over | 0 (0.0%) | 0 (0.0%) |
Disability Class: Ambulatory Difficulty
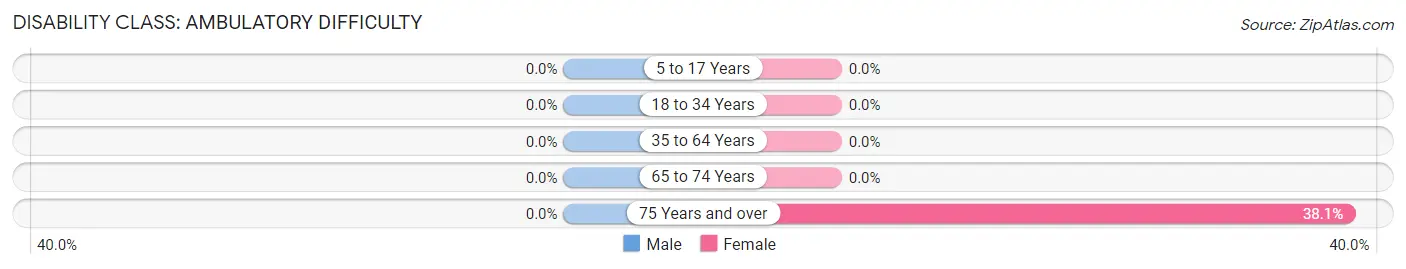
| Age Bracket | Male | Female |
| 5 to 17 Years | 0 (0.0%) | 0 (0.0%) |
| 18 to 34 Years | 0 (0.0%) | 0 (0.0%) |
| 35 to 64 Years | 0 (0.0%) | 0 (0.0%) |
| 65 to 74 Years | 0 (0.0%) | 0 (0.0%) |
| 75 Years and over | 0 (0.0%) | 8 (38.1%) |
Disability Class: Self-Care Difficulty

| Age Bracket | Male | Female |
| 5 to 17 Years | 0 (0.0%) | 0 (0.0%) |
| 18 to 34 Years | 0 (0.0%) | 0 (0.0%) |
| 35 to 64 Years | 0 (0.0%) | 0 (0.0%) |
| 65 to 74 Years | 0 (0.0%) | 0 (0.0%) |
| 75 Years and over | 0 (0.0%) | 4 (19.1%) |
Technology Access in Zoar
Computing Device Access in Zoar
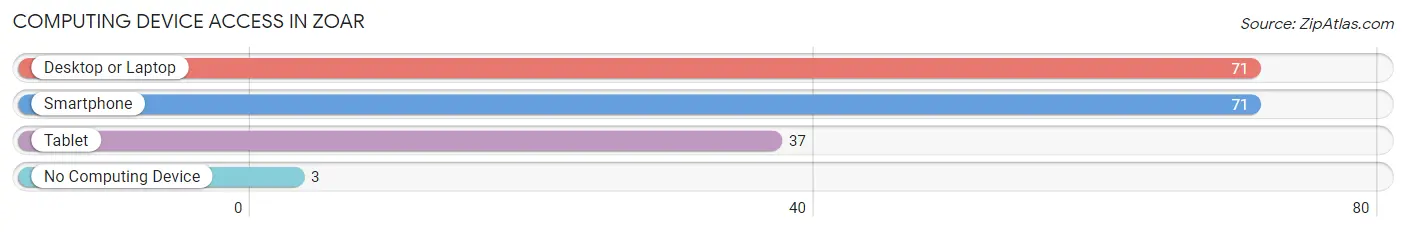
| Device Type | # Households | % Households |
| Desktop or Laptop | 71 | 91.0% |
| Smartphone | 71 | 91.0% |
| Tablet | 37 | 47.4% |
| No Computing Device | 3 | 3.8% |
| Total | 78 | 100.0% |
Internet Access in Zoar
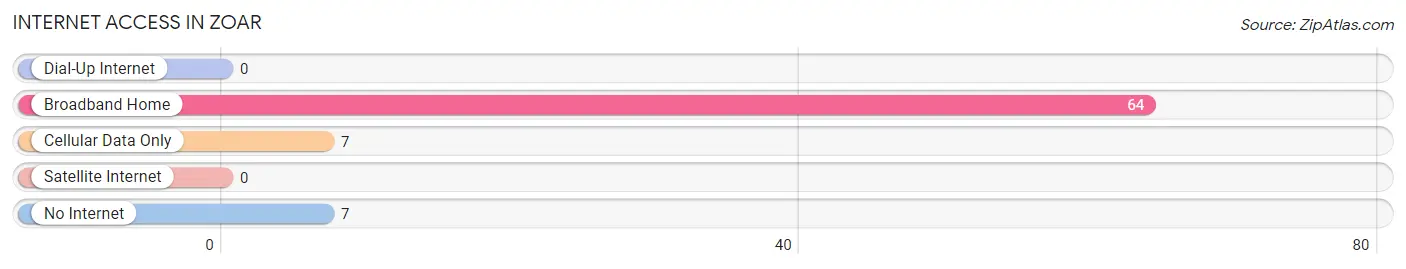
| Internet Type | # Households | % Households |
| Dial-Up Internet | 0 | 0.0% |
| Broadband Home | 64 | 82.1% |
| Cellular Data Only | 7 | 9.0% |
| Satellite Internet | 0 | 0.0% |
| No Internet | 7 | 9.0% |
| Total | 78 | 100.0% |
Zoar Summary
Zoar, Ohio is a small village located in Tuscarawas County, Ohio. It was founded in 1817 by a group of German Separatists, who were seeking religious freedom. The village is located on the Tuscarawas River, and is known for its historic buildings and quaint atmosphere.
History
The village of Zoar was founded in 1817 by a group of German Separatists, who were seeking religious freedom. The group was led by Joseph Bimeler, and they purchased 5,500 acres of land in the Tuscarawas Valley. The group established a communal society, and the village was named after the Biblical city of Zoar. The village was designed to be self-sufficient, and the members of the society worked together to build homes, businesses, and other structures.
The village flourished for many years, and the members of the society were able to build a successful economy. They built a grist mill, a saw mill, a brewery, and a woolen mill. They also established a school, a church, and a cemetery. The village was known for its high quality of life, and it was a popular destination for travelers.
In 1853, the members of the society decided to dissolve the communal society and divide the land among themselves. The village continued to thrive, and it became a popular tourist destination. In the late 19th century, the village was home to several hotels, restaurants, and stores.
Geography
Zoar is located in Tuscarawas County, Ohio. It is situated on the Tuscarawas River, and is surrounded by rolling hills and farmland. The village is located approximately 30 miles south of Canton, Ohio, and is about an hour’s drive from Cleveland.
The village is home to several historic buildings, including the Zoar Hotel, the Zoar Store, and the Zoar Church. The village is also home to several parks, including the Zoar Wetlands State Nature Preserve and the Zoar Historic District.
Economy
The economy of Zoar is largely based on tourism. The village is home to several historic buildings and attractions, and it is a popular destination for visitors. The village is also home to several small businesses, including restaurants, shops, and galleries.
The village is also home to several manufacturing companies, including the Zoar Manufacturing Company and the Zoar Tool and Die Company. These companies produce a variety of products, including tools, machine parts, and industrial equipment.
Demographics
As of the 2010 census, the population of Zoar was 1,054. The village is predominantly white, with 95.3% of the population identifying as white. The median household income is $41,250, and the median age is 44.7 years.
Conclusion
Zoar, Ohio is a small village located in Tuscarawas County, Ohio. It was founded in 1817 by a group of German Separatists, who were seeking religious freedom. The village is known for its historic buildings and quaint atmosphere, and it is a popular destination for visitors. The economy of Zoar is largely based on tourism, and the village is home to several small businesses and manufacturing companies. The population of Zoar is predominantly white, with a median household income of $41,250 and a median age of 44.7 years.
Common Questions
What is Per Capita Income in Zoar?
Per Capita income in Zoar is $33,557.
What is the Median Family Income in Zoar?
Median Family Income in Zoar is $103,750.
What is the Median Household income in Zoar?
Median Household Income in Zoar is $90,000.
What is Inequality or Gini Index in Zoar?
Inequality or Gini Index in Zoar is 0.28.
What is the Total Population of Zoar?
Total Population of Zoar is 206.
What is the Total Male Population of Zoar?
Total Male Population of Zoar is 107.
What is the Total Female Population of Zoar?
Total Female Population of Zoar is 99.
What is the Ratio of Males per 100 Females in Zoar?
There are 108.08 Males per 100 Females in Zoar.
What is the Ratio of Females per 100 Males in Zoar?
There are 92.52 Females per 100 Males in Zoar.
What is the Median Population Age in Zoar?
Median Population Age in Zoar is 42.5 Years.
What is the Average Family Size in Zoar
Average Family Size in Zoar is 3.2 People.
What is the Average Household Size in Zoar
Average Household Size in Zoar is 2.6 People.
How Large is the Labor Force in Zoar?
There are 101 People in the Labor Forcein in Zoar.
What is the Percentage of People in the Labor Force in Zoar?
61.6% of People are in the Labor Force in Zoar.