Highpoint, OH Map & Demographics
Highpoint Map
Highpoint Overview
$45,498
PER CAPITA INCOME
$80,685
AVG FAMILY INCOME
$60,887
AVG HOUSEHOLD INCOME
9.7%
WAGE / INCOME GAP [ % ]
90.3¢/ $1
WAGE / INCOME GAP [ $ ]
0.35
INEQUALITY / GINI INDEX
876
TOTAL POPULATION
542
MALE POPULATION
334
FEMALE POPULATION
162.28
MALES / 100 FEMALES
61.62
FEMALES / 100 MALES
58.7
MEDIAN AGE
2.4
AVG FAMILY SIZE
1.8
AVG HOUSEHOLD SIZE
504
LABOR FORCE [ PEOPLE ]
60.9%
PERCENT IN LABOR FORCE
7.3%
UNEMPLOYMENT RATE
Income in Highpoint
Income Overview in Highpoint
Per Capita Income in Highpoint is $45,498, while median incomes of families and households are $80,685 and $60,887 respectively.
| Characteristic | Number | Measure |
| Per Capita Income | 876 | $45,498 |
| Median Family Income | 245 | $80,685 |
| Mean Family Income | 245 | $90,282 |
| Median Household Income | 492 | $60,887 |
| Mean Household Income | 492 | $80,339 |
| Income Deficit | 245 | $0 |
| Wage / Income Gap (%) | 876 | 9.73% |
| Wage / Income Gap ($) | 876 | 90.27¢ per $1 |
| Gini / Inequality Index | 876 | 0.35 |
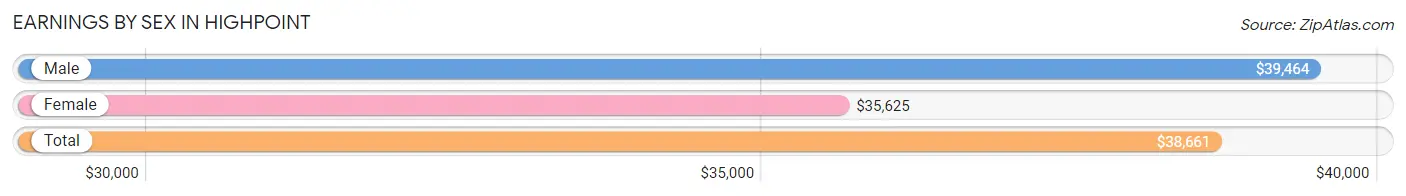
Earnings by Sex in Highpoint
Average Earnings in Highpoint are $38,661, $39,464 for men and $35,625 for women, a difference of 9.7%.
| Sex | Number | Average Earnings |
| Male | 308 (58.0%) | $39,464 |
| Female | 223 (42.0%) | $35,625 |
| Total | 531 (100.0%) | $38,661 |
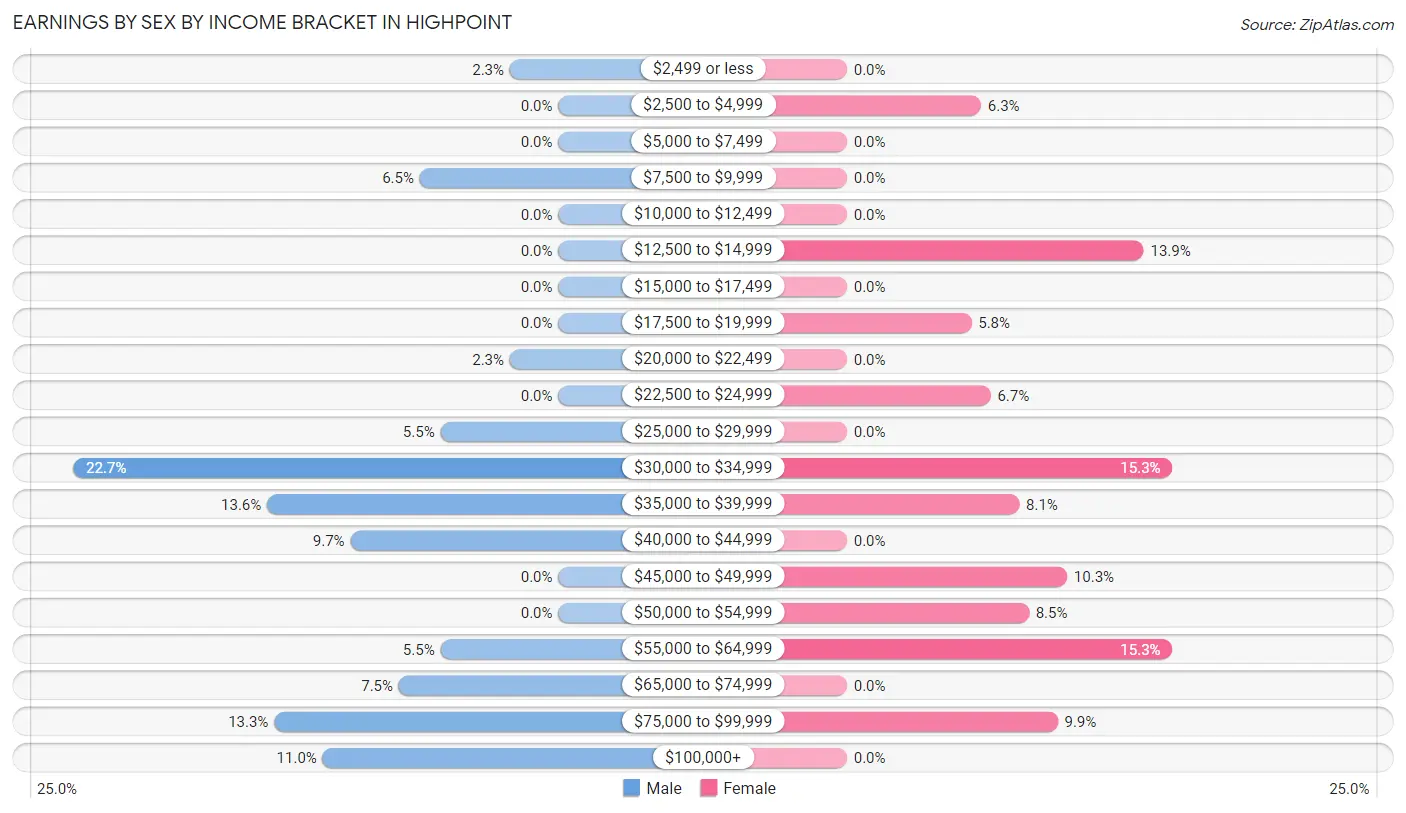
Earnings by Sex by Income Bracket in Highpoint
The most common earnings brackets in Highpoint are $30,000 to $34,999 for men (70 | 22.7%) and $30,000 to $34,999 for women (34 | 15.2%).
| Income | Male | Female |
| $2,499 or less | 7 (2.3%) | 0 (0.0%) |
| $2,500 to $4,999 | 0 (0.0%) | 14 (6.3%) |
| $5,000 to $7,499 | 0 (0.0%) | 0 (0.0%) |
| $7,500 to $9,999 | 20 (6.5%) | 0 (0.0%) |
| $10,000 to $12,499 | 0 (0.0%) | 0 (0.0%) |
| $12,500 to $14,999 | 0 (0.0%) | 31 (13.9%) |
| $15,000 to $17,499 | 0 (0.0%) | 0 (0.0%) |
| $17,500 to $19,999 | 0 (0.0%) | 13 (5.8%) |
| $20,000 to $22,499 | 7 (2.3%) | 0 (0.0%) |
| $22,500 to $24,999 | 0 (0.0%) | 15 (6.7%) |
| $25,000 to $29,999 | 17 (5.5%) | 0 (0.0%) |
| $30,000 to $34,999 | 70 (22.7%) | 34 (15.2%) |
| $35,000 to $39,999 | 42 (13.6%) | 18 (8.1%) |
| $40,000 to $44,999 | 30 (9.7%) | 0 (0.0%) |
| $45,000 to $49,999 | 0 (0.0%) | 23 (10.3%) |
| $50,000 to $54,999 | 0 (0.0%) | 19 (8.5%) |
| $55,000 to $64,999 | 17 (5.5%) | 34 (15.2%) |
| $65,000 to $74,999 | 23 (7.5%) | 0 (0.0%) |
| $75,000 to $99,999 | 41 (13.3%) | 22 (9.9%) |
| $100,000+ | 34 (11.0%) | 0 (0.0%) |
| Total | 308 (100.0%) | 223 (100.0%) |
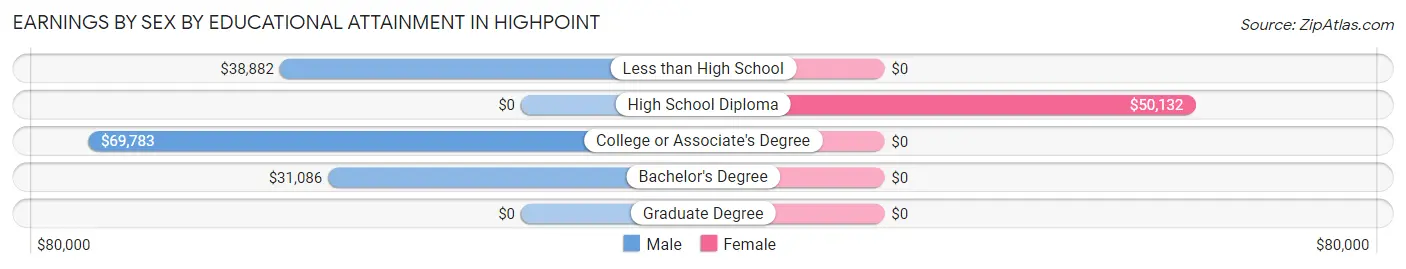
Earnings by Sex by Educational Attainment in Highpoint
Average earnings in Highpoint are $39,881 for men and $35,625 for women, a difference of 10.7%. Men with an educational attainment of college or associate's degree enjoy the highest average annual earnings of $69,783, while those with bachelor's degree education earn the least with $31,086. Women with an educational attainment of high school diploma earn the most with the average annual earnings of $50,132, while those with high school diploma education have the smallest earnings of $50,132.
| Educational Attainment | Male Income | Female Income |
| Less than High School | $38,882 | $0 |
| High School Diploma | - | - |
| College or Associate's Degree | $69,783 | $0 |
| Bachelor's Degree | $31,086 | $0 |
| Graduate Degree | - | - |
| Total | $39,881 | $35,625 |
Family Income in Highpoint
Family Income Brackets in Highpoint
According to the Highpoint family income data, there are 77 families falling into the $75,000 to $99,999 income range, which is the most common income bracket and makes up 31.4% of all families.
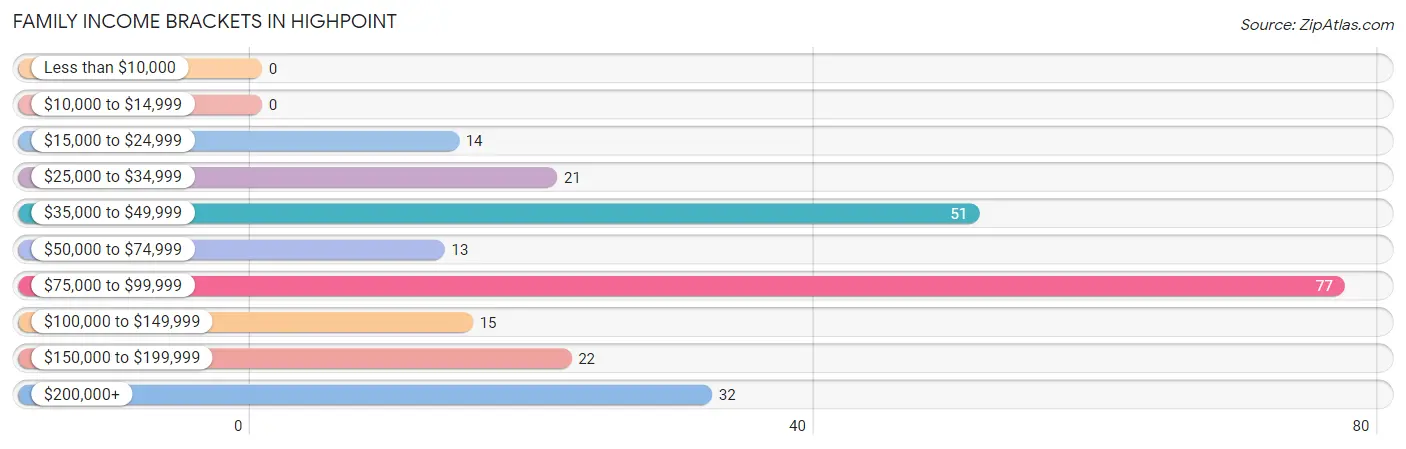
| Income Bracket | # Families | % Families |
| Less than $10,000 | 0 | 0.0% |
| $10,000 to $14,999 | 0 | 0.0% |
| $15,000 to $24,999 | 14 | 5.7% |
| $25,000 to $34,999 | 21 | 8.6% |
| $35,000 to $49,999 | 51 | 20.8% |
| $50,000 to $74,999 | 13 | 5.3% |
| $75,000 to $99,999 | 77 | 31.4% |
| $100,000 to $149,999 | 15 | 6.1% |
| $150,000 to $199,999 | 22 | 9.0% |
| $200,000+ | 32 | 13.1% |
Family Income by Famaliy Size in Highpoint
2-person families (157 | 64.1%) account for the highest median family income in Highpoint with $83,854 per family, while 2-person families (157 | 64.1%) have the highest median income of $41,927 per family member.
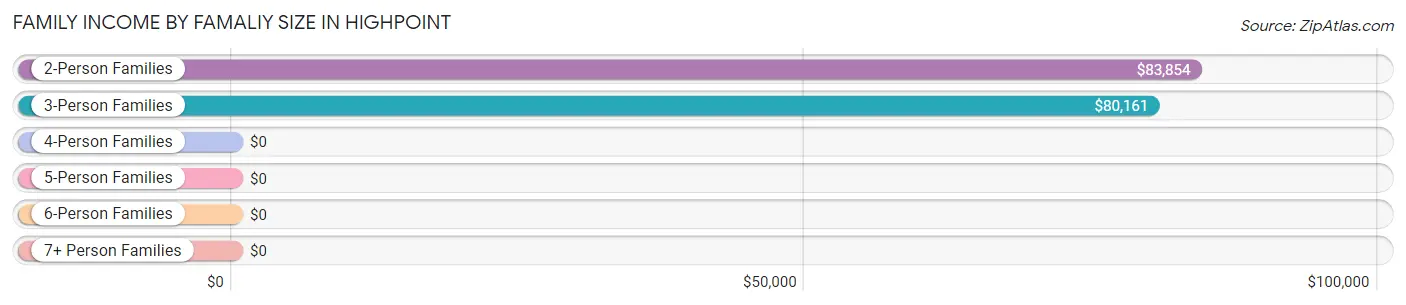
| Income Bracket | # Families | Median Income |
| 2-Person Families | 157 (64.1%) | $83,854 |
| 3-Person Families | 88 (35.9%) | $80,161 |
| 4-Person Families | 0 (0.0%) | $0 |
| 5-Person Families | 0 (0.0%) | $0 |
| 6-Person Families | 0 (0.0%) | $0 |
| 7+ Person Families | 0 (0.0%) | $0 |
| Total | 245 (100.0%) | $80,685 |
Family Income by Number of Earners in Highpoint
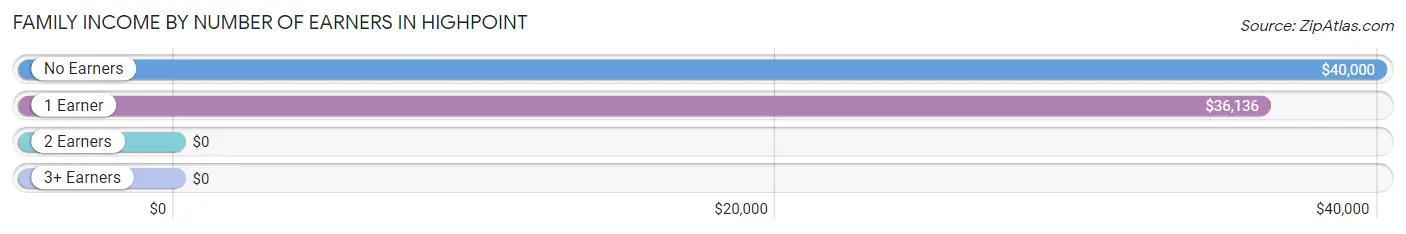
| Number of Earners | # Families | Median Income |
| No Earners | 56 (22.9%) | $40,000 |
| 1 Earner | 48 (19.6%) | $36,136 |
| 2 Earners | 141 (57.6%) | $0 |
| 3+ Earners | 0 (0.0%) | $0 |
| Total | 245 (100.0%) | $80,685 |
Household Income in Highpoint
Household Income Brackets in Highpoint
With 115 households falling in the category, the $35,000 to $49,999 income range is the most frequent in Highpoint, accounting for 23.4% of all households.
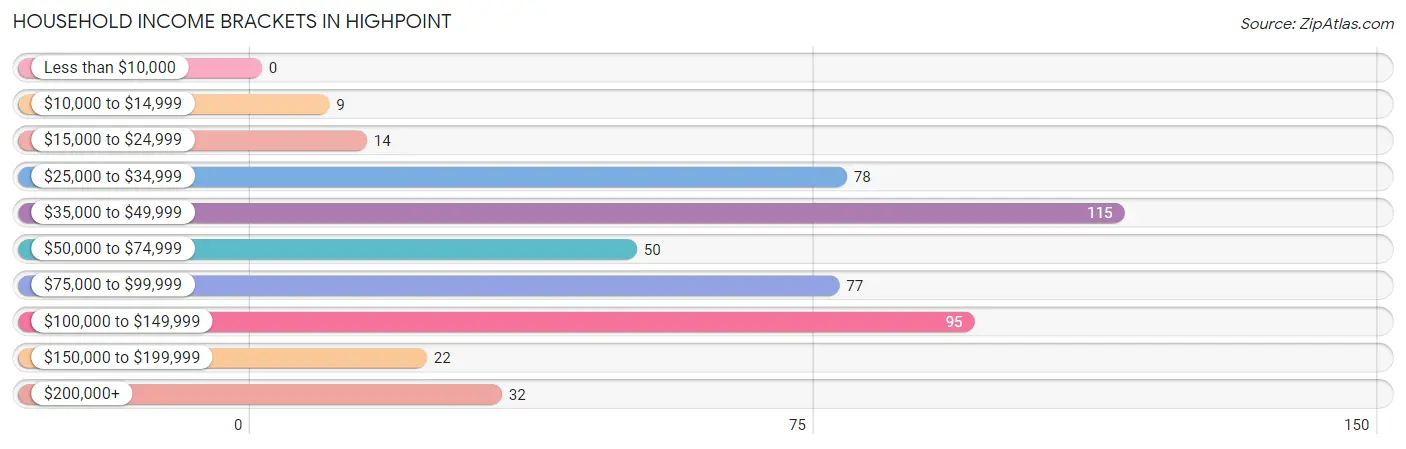
| Income Bracket | # Households | % Households |
| Less than $10,000 | 0 | 0.0% |
| $10,000 to $14,999 | 9 | 1.8% |
| $15,000 to $24,999 | 14 | 2.8% |
| $25,000 to $34,999 | 78 | 15.9% |
| $35,000 to $49,999 | 115 | 23.4% |
| $50,000 to $74,999 | 50 | 10.2% |
| $75,000 to $99,999 | 77 | 15.7% |
| $100,000 to $149,999 | 95 | 19.3% |
| $150,000 to $199,999 | 22 | 4.5% |
| $200,000+ | 32 | 6.5% |
Household Income by Householder Age in Highpoint
The median household income in Highpoint is $60,887, with the highest median household income of $81,694 found in the 45 to 64 years age bracket for the primary householder. A total of 176 households (35.8%) fall into this category. Meanwhile, the 15 to 24 years age bracket for the primary householder has the lowest median household income of $0, with 7 households (1.4%) in this group.
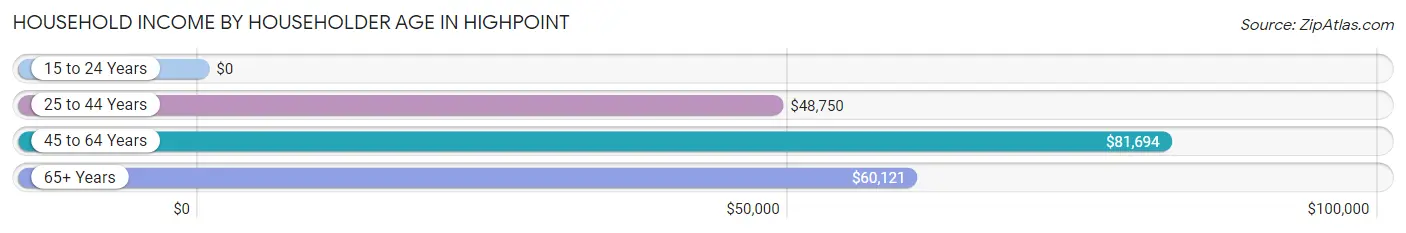
| Income Bracket | # Households | Median Income |
| 15 to 24 Years | 7 (1.4%) | $0 |
| 25 to 44 Years | 128 (26.0%) | $48,750 |
| 45 to 64 Years | 176 (35.8%) | $81,694 |
| 65+ Years | 181 (36.8%) | $60,121 |
| Total | 492 (100.0%) | $60,887 |
Poverty in Highpoint
Income Below Poverty by Sex and Age in Highpoint
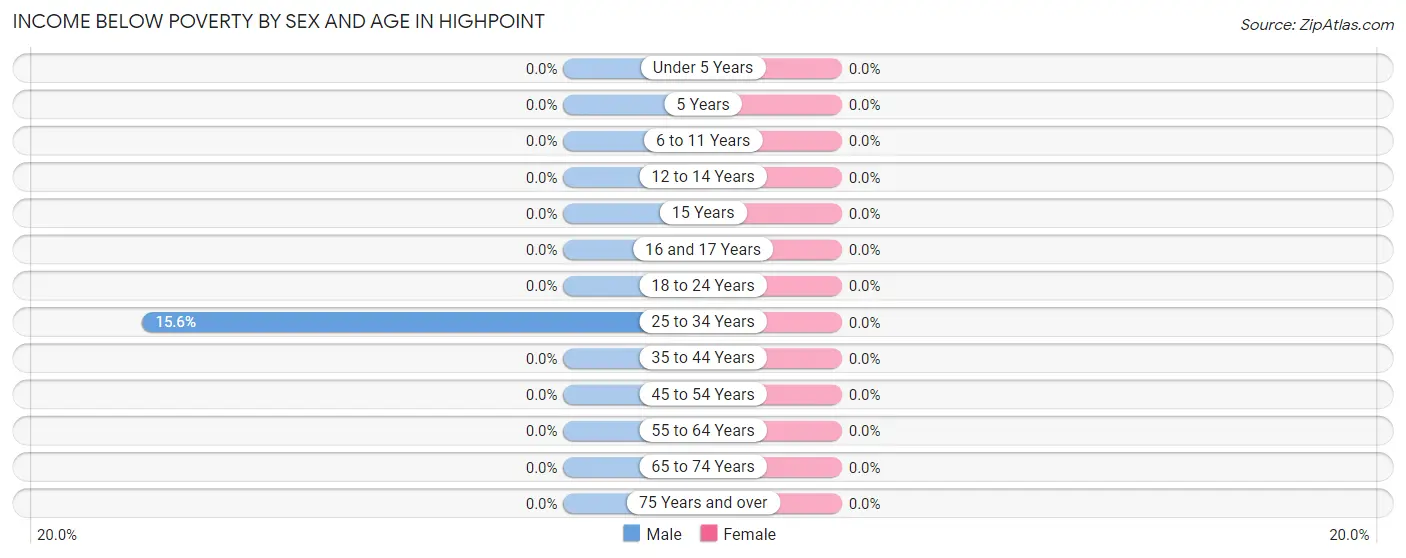
| Age Bracket | Male | Female |
| Under 5 Years | 0 (0.0%) | 0 (0.0%) |
| 5 Years | 0 (0.0%) | 0 (0.0%) |
| 6 to 11 Years | 0 (0.0%) | 0 (0.0%) |
| 12 to 14 Years | 0 (0.0%) | 0 (0.0%) |
| 15 Years | 0 (0.0%) | 0 (0.0%) |
| 16 and 17 Years | 0 (0.0%) | 0 (0.0%) |
| 18 to 24 Years | 0 (0.0%) | 0 (0.0%) |
| 25 to 34 Years | 20 (15.6%) | 0 (0.0%) |
| 35 to 44 Years | 0 (0.0%) | 0 (0.0%) |
| 45 to 54 Years | 0 (0.0%) | 0 (0.0%) |
| 55 to 64 Years | 0 (0.0%) | 0 (0.0%) |
| 65 to 74 Years | 0 (0.0%) | 0 (0.0%) |
| 75 Years and over | 0 (0.0%) | 0 (0.0%) |
| Total | 20 (3.7%) | 0 (0.0%) |
Income Above Poverty by Sex and Age in Highpoint
According to the poverty statistics in Highpoint, males aged 6 to 11 years and females aged 25 to 34 years are the age groups that are most secure financially, with 100.0% of males and 100.0% of females in these age groups living above the poverty line.
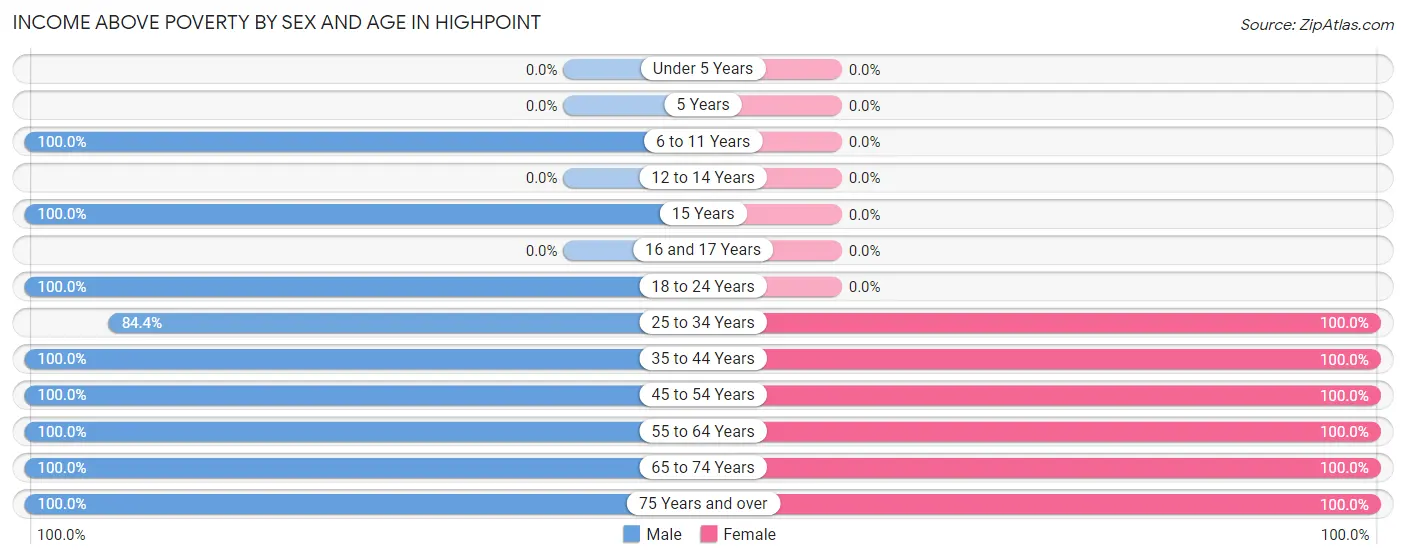
| Age Bracket | Male | Female |
| Under 5 Years | 0 (0.0%) | 0 (0.0%) |
| 5 Years | 0 (0.0%) | 0 (0.0%) |
| 6 to 11 Years | 22 (100.0%) | 0 (0.0%) |
| 12 to 14 Years | 0 (0.0%) | 0 (0.0%) |
| 15 Years | 26 (100.0%) | 0 (0.0%) |
| 16 and 17 Years | 0 (0.0%) | 0 (0.0%) |
| 18 to 24 Years | 14 (100.0%) | 0 (0.0%) |
| 25 to 34 Years | 108 (84.4%) | 22 (100.0%) |
| 35 to 44 Years | 34 (100.0%) | 64 (100.0%) |
| 45 to 54 Years | 42 (100.0%) | 31 (100.0%) |
| 55 to 64 Years | 143 (100.0%) | 72 (100.0%) |
| 65 to 74 Years | 84 (100.0%) | 131 (100.0%) |
| 75 Years and over | 49 (100.0%) | 14 (100.0%) |
| Total | 522 (96.3%) | 334 (100.0%) |
Income Below Poverty Among Married-Couple Families in Highpoint
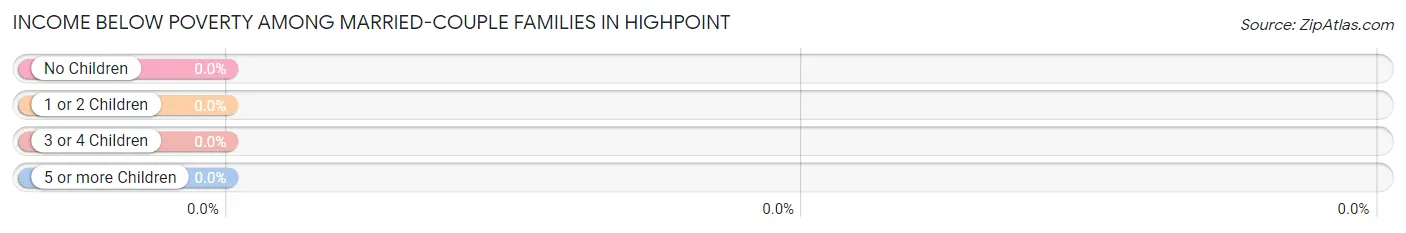
| Children | Above Poverty | Below Poverty |
| No Children | 154 (100.0%) | 0 (0.0%) |
| 1 or 2 Children | 53 (100.0%) | 0 (0.0%) |
| 3 or 4 Children | 0 (0.0%) | 0 (0.0%) |
| 5 or more Children | 0 (0.0%) | 0 (0.0%) |
| Total | 207 (100.0%) | 0 (0.0%) |
Income Below Poverty Among Single-Parent Households in Highpoint
| Children | Single Father | Single Mother |
| No Children | 0 (0.0%) | 0 (0.0%) |
| 1 or 2 Children | 0 (0.0%) | 0 (0.0%) |
| 3 or 4 Children | 0 (0.0%) | 0 (0.0%) |
| 5 or more Children | 0 (0.0%) | 0 (0.0%) |
| Total | 0 (0.0%) | 0 (0.0%) |
Income Below Poverty Among Married-Couple vs Single-Parent Households in Highpoint
| Children | Married-Couple Families | Single-Parent Households |
| No Children | 0 (0.0%) | 0 (0.0%) |
| 1 or 2 Children | 0 (0.0%) | 0 (0.0%) |
| 3 or 4 Children | 0 (0.0%) | 0 (0.0%) |
| 5 or more Children | 0 (0.0%) | 0 (0.0%) |
| Total | 0 (0.0%) | 0 (0.0%) |
Race in Highpoint
The most populous races in Highpoint are White / Caucasian (834 | 95.2%), Black / African American (28 | 3.2%), and Two or more Races (14 | 1.6%).
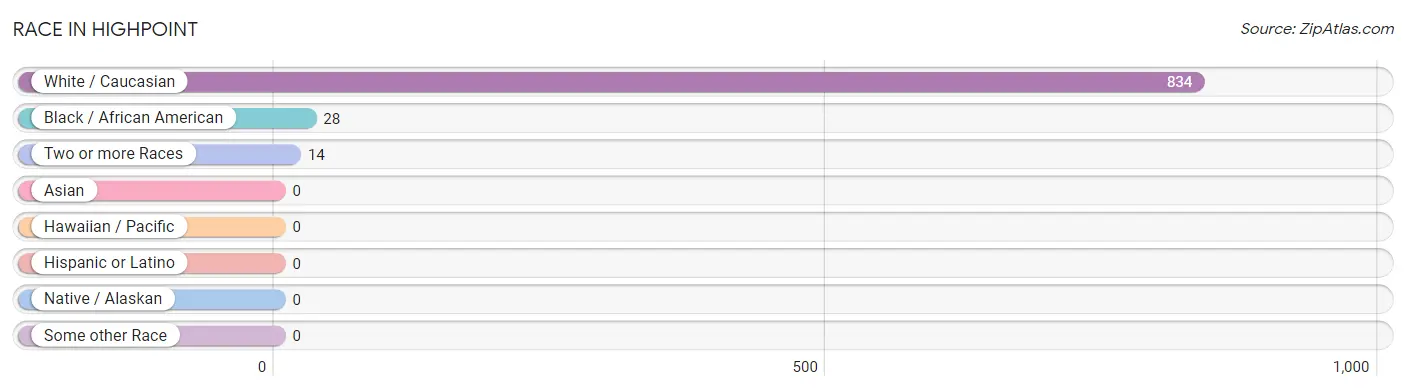
| Race | # Population | % Population |
| Asian | 0 | 0.0% |
| Black / African American | 28 | 3.2% |
| Hawaiian / Pacific | 0 | 0.0% |
| Hispanic or Latino | 0 | 0.0% |
| Native / Alaskan | 0 | 0.0% |
| White / Caucasian | 834 | 95.2% |
| Two or more Races | 14 | 1.6% |
| Some other Race | 0 | 0.0% |
| Total | 876 | 100.0% |
Ancestry in Highpoint
The most populous ancestries reported in Highpoint are German (135 | 15.4%), Irish (129 | 14.7%), American (94 | 10.7%), English (90 | 10.3%), and Swiss (49 | 5.6%), together accounting for 56.7% of all Highpoint residents.
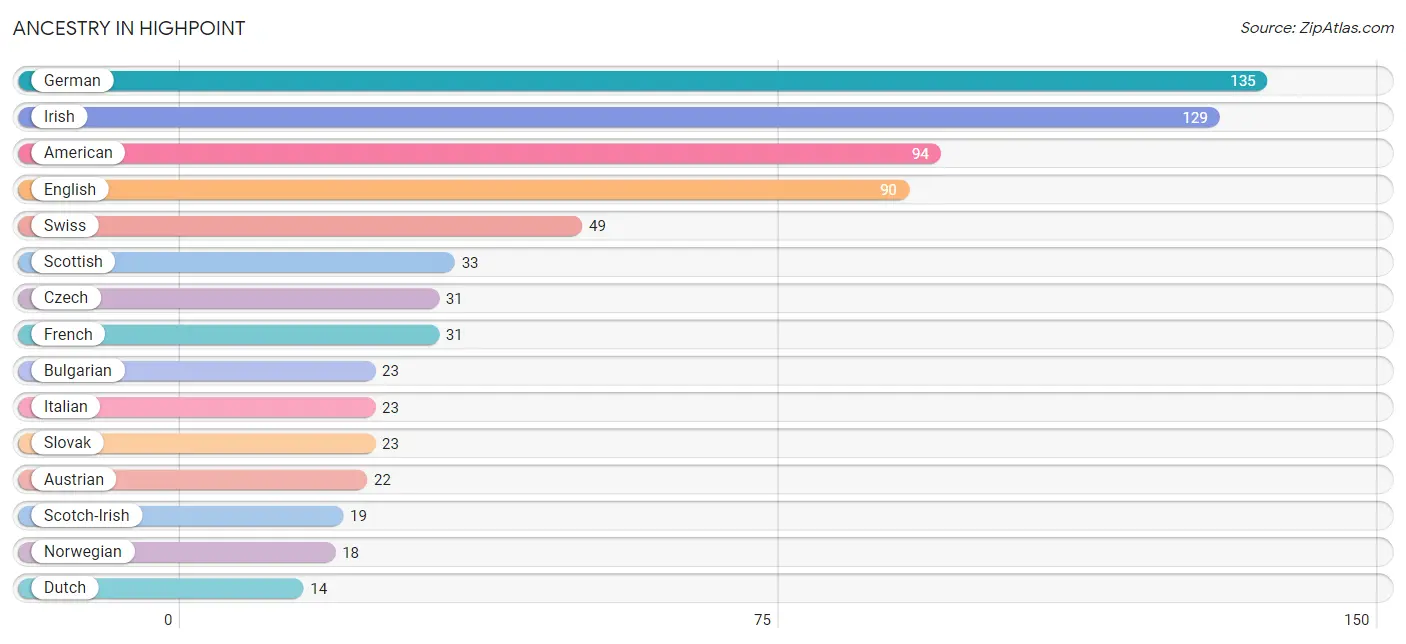
| Ancestry | # Population | % Population |
| American | 94 | 10.7% |
| Austrian | 22 | 2.5% |
| Bulgarian | 23 | 2.6% |
| Czech | 31 | 3.5% |
| Dutch | 14 | 1.6% |
| English | 90 | 10.3% |
| French | 31 | 3.5% |
| German | 135 | 15.4% |
| Irish | 129 | 14.7% |
| Italian | 23 | 2.6% |
| Norwegian | 18 | 2.1% |
| Scotch-Irish | 19 | 2.2% |
| Scottish | 33 | 3.8% |
| Slovak | 23 | 2.6% |
| Swiss | 49 | 5.6% | View All 15 Rows |
Immigrants in Highpoint
The most numerous immigrant groups reported in Highpoint came from Europe (41 | 4.7%), Bulgaria (23 | 2.6%), Eastern Europe (23 | 2.6%), Northern Europe (18 | 2.1%), and Norway (18 | 2.1%), together accounting for 14.0% of all Highpoint residents.
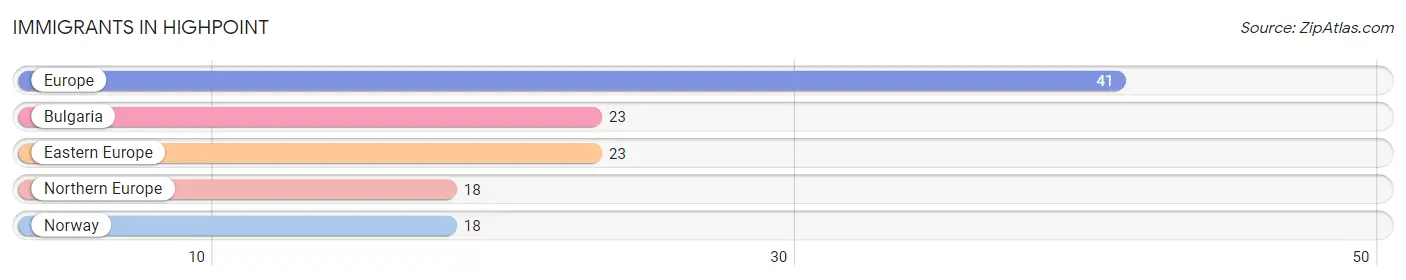
| Immigration Origin | # Population | % Population |
| Bulgaria | 23 | 2.6% |
| Eastern Europe | 23 | 2.6% |
| Europe | 41 | 4.7% |
| Northern Europe | 18 | 2.1% |
| Norway | 18 | 2.1% | View All 5 Rows |
Sex and Age in Highpoint
Sex and Age in Highpoint
The most populous age groups in Highpoint are 60 to 64 Years (109 | 20.1%) for men and 65 to 69 Years (76 | 22.8%) for women.
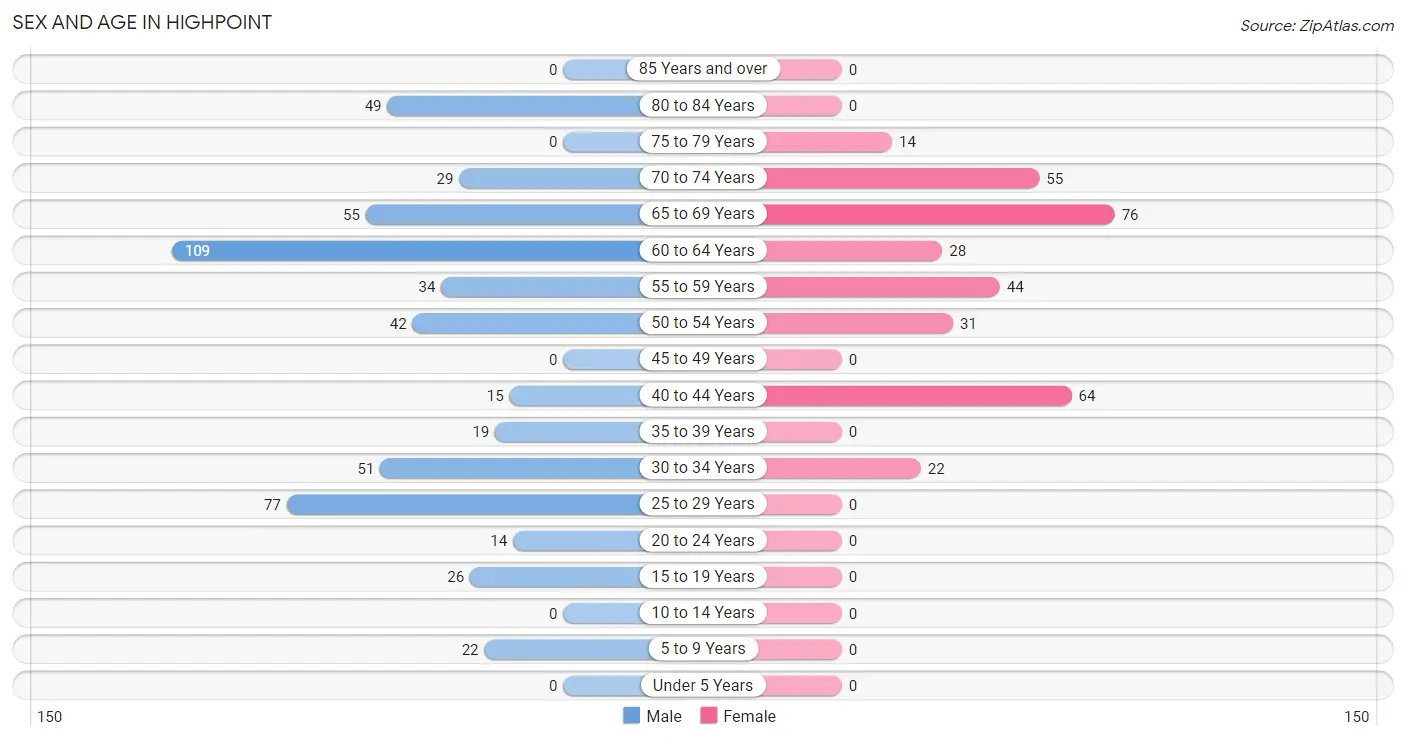
| Age Bracket | Male | Female |
| Under 5 Years | 0 (0.0%) | 0 (0.0%) |
| 5 to 9 Years | 22 (4.1%) | 0 (0.0%) |
| 10 to 14 Years | 0 (0.0%) | 0 (0.0%) |
| 15 to 19 Years | 26 (4.8%) | 0 (0.0%) |
| 20 to 24 Years | 14 (2.6%) | 0 (0.0%) |
| 25 to 29 Years | 77 (14.2%) | 0 (0.0%) |
| 30 to 34 Years | 51 (9.4%) | 22 (6.6%) |
| 35 to 39 Years | 19 (3.5%) | 0 (0.0%) |
| 40 to 44 Years | 15 (2.8%) | 64 (19.2%) |
| 45 to 49 Years | 0 (0.0%) | 0 (0.0%) |
| 50 to 54 Years | 42 (7.7%) | 31 (9.3%) |
| 55 to 59 Years | 34 (6.3%) | 44 (13.2%) |
| 60 to 64 Years | 109 (20.1%) | 28 (8.4%) |
| 65 to 69 Years | 55 (10.2%) | 76 (22.8%) |
| 70 to 74 Years | 29 (5.3%) | 55 (16.5%) |
| 75 to 79 Years | 0 (0.0%) | 14 (4.2%) |
| 80 to 84 Years | 49 (9.0%) | 0 (0.0%) |
| 85 Years and over | 0 (0.0%) | 0 (0.0%) |
| Total | 542 (100.0%) | 334 (100.0%) |
Families and Households in Highpoint
Median Family Size in Highpoint
The median family size in Highpoint is 2.44 persons per family, with single male/father families (24 | 9.8%) accounting for the largest median family size of 3.17 persons per family. On the other hand, single female/mother families (14 | 5.7%) represent the smallest median family size with 2.14 persons per family.
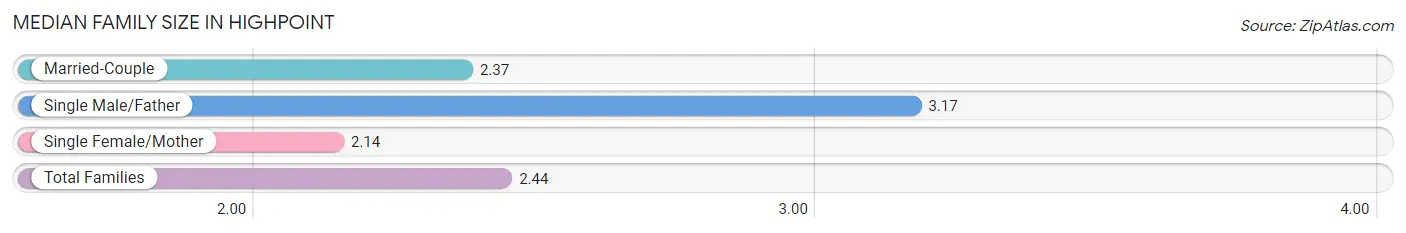
| Family Type | # Families | Family Size |
| Married-Couple | 207 (84.5%) | 2.37 |
| Single Male/Father | 24 (9.8%) | 3.17 |
| Single Female/Mother | 14 (5.7%) | 2.14 |
| Total Families | 245 (100.0%) | 2.44 |
Median Household Size in Highpoint
The median household size in Highpoint is 1.78 persons per household, with single male/father households (24 | 4.9%) accounting for the largest median household size of 3.17 persons per household. non-family households (247 | 50.2%) represent the smallest median household size with 1.13 persons per household.
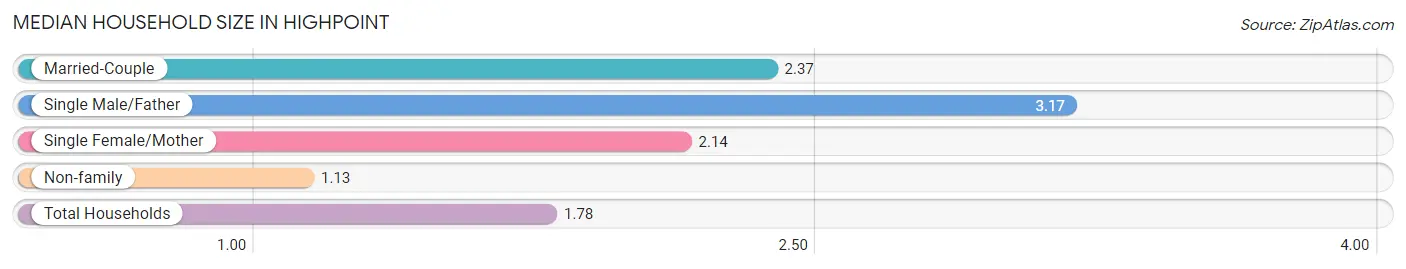
| Household Type | # Households | Household Size |
| Married-Couple | 207 (42.1%) | 2.37 |
| Single Male/Father | 24 (4.9%) | 3.17 |
| Single Female/Mother | 14 (2.9%) | 2.14 |
| Non-family | 247 (50.2%) | 1.13 |
| Total Households | 492 (100.0%) | 1.78 |
Household Size by Marriage Status in Highpoint
Out of a total of 492 households in Highpoint, 245 (49.8%) are family households, while 247 (50.2%) are nonfamily households. The most numerous type of family households are 2-person households, comprising 157, and the most common type of nonfamily households are 1-person households, comprising 211.
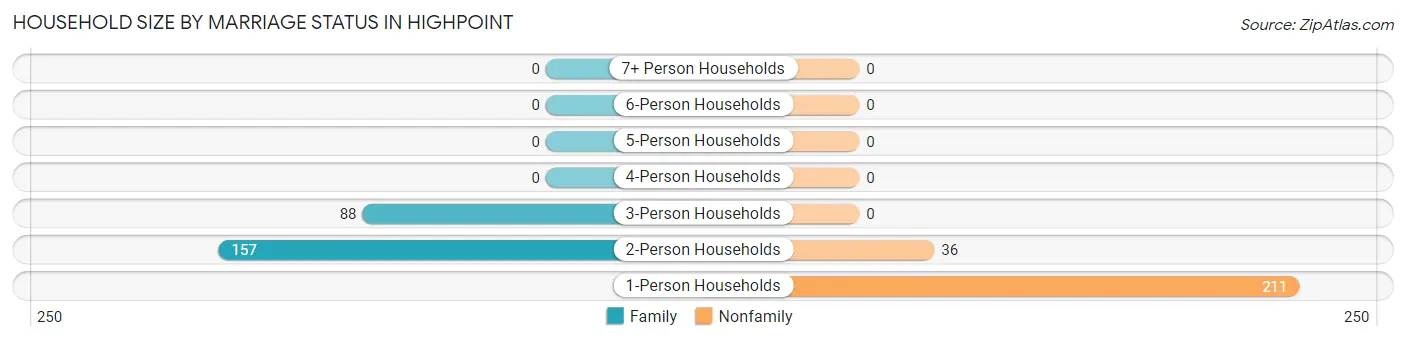
| Household Size | Family Households | Nonfamily Households |
| 1-Person Households | - | 211 (42.9%) |
| 2-Person Households | 157 (31.9%) | 36 (7.3%) |
| 3-Person Households | 88 (17.9%) | 0 (0.0%) |
| 4-Person Households | 0 (0.0%) | 0 (0.0%) |
| 5-Person Households | 0 (0.0%) | 0 (0.0%) |
| 6-Person Households | 0 (0.0%) | 0 (0.0%) |
| 7+ Person Households | 0 (0.0%) | 0 (0.0%) |
| Total | 245 (49.8%) | 247 (50.2%) |
Female Fertility in Highpoint
Fertility by Age in Highpoint
| Age Bracket | Women with Births | Births / 1,000 Women |
| 15 to 19 years | 0 (0.0%) | 0.0 |
| 20 to 34 years | 0 (0.0%) | 0.0 |
| 35 to 50 years | 0 (0.0%) | 0.0 |
| Total | 0 (0.0%) | 0.0 |
Fertility by Age by Marriage Status in Highpoint
| Age Bracket | Married | Unmarried |
| 15 to 19 years | 0 (0.0%) | 0 (0.0%) |
| 20 to 34 years | 0 (0.0%) | 0 (0.0%) |
| 35 to 50 years | 0 (0.0%) | 0 (0.0%) |
| Total | 0 (0.0%) | 0 (0.0%) |
Fertility by Education in Highpoint
| Educational Attainment | Women with Births | Births / 1,000 Women |
| Less than High School | 0 (0.0%) | 0.0 |
| High School Diploma | 0 (0.0%) | 0.0 |
| College or Associate's Degree | 0 (0.0%) | 0.0 |
| Bachelor's Degree | 0 (0.0%) | 0.0 |
| Graduate Degree | 0 (0.0%) | 0.0 |
| Total | 0 (0.0%) | 0.0 |
Fertility by Education by Marriage Status in Highpoint
| Educational Attainment | Married | Unmarried |
| Less than High School | 0 (0.0%) | 0 (0.0%) |
| High School Diploma | 0 (0.0%) | 0 (0.0%) |
| College or Associate's Degree | 0 (0.0%) | 0 (0.0%) |
| Bachelor's Degree | 0 (0.0%) | 0 (0.0%) |
| Graduate Degree | 0 (0.0%) | 0 (0.0%) |
| Total | 0 (0.0%) | 0 (0.0%) |
Employment Characteristics in Highpoint
Employment by Class of Employer in Highpoint
Among the 454 employed individuals in Highpoint, private company employees (297 | 65.4%), local government employees (79 | 17.4%), and state government employees (40 | 8.8%) make up the most common classes of employment.
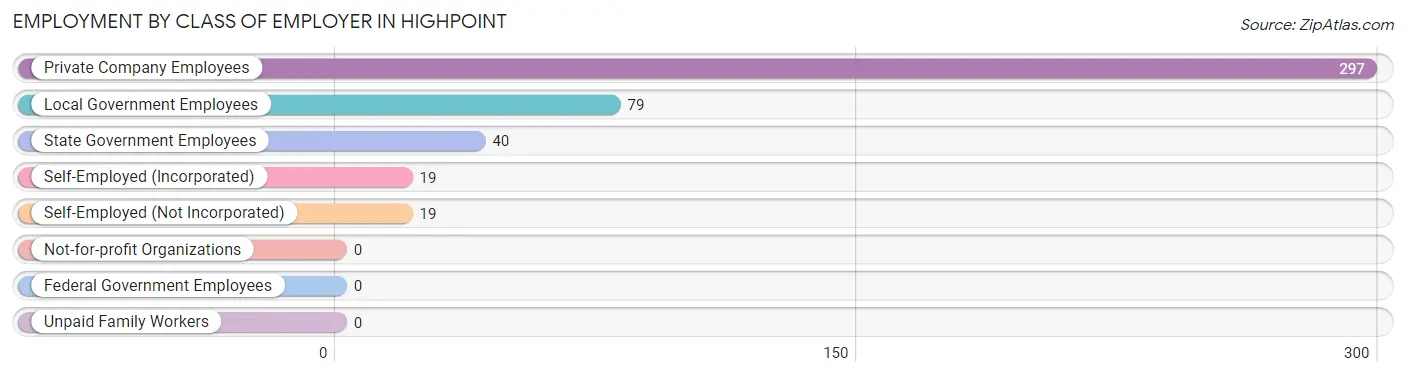
| Employer Class | # Employees | % Employees |
| Private Company Employees | 297 | 65.4% |
| Self-Employed (Incorporated) | 19 | 4.2% |
| Self-Employed (Not Incorporated) | 19 | 4.2% |
| Not-for-profit Organizations | 0 | 0.0% |
| Local Government Employees | 79 | 17.4% |
| State Government Employees | 40 | 8.8% |
| Federal Government Employees | 0 | 0.0% |
| Unpaid Family Workers | 0 | 0.0% |
| Total | 454 | 100.0% |
Employment Status by Age in Highpoint
According to the labor force statistics for Highpoint, out of the total population over 16 years of age (828), 60.9% or 504 individuals are in the labor force, with 7.3% or 37 of them unemployed. The age group with the highest labor force participation rate is 30 to 34 years, with 100.0% or 73 individuals in the labor force. Within the labor force, the 20 to 24 years age range has the highest percentage of unemployed individuals, with 100.0% or 7 of them being unemployed.
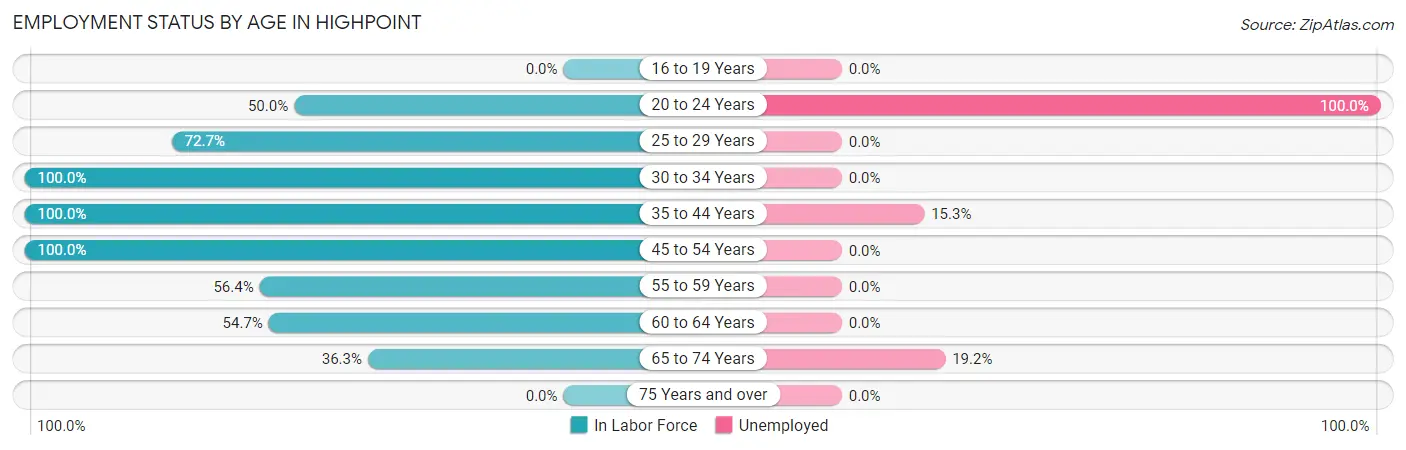
| Age Bracket | In Labor Force | Unemployed |
| 16 to 19 Years | 0 (0.0%) | 0 (0.0%) |
| 20 to 24 Years | 7 (50.0%) | 7 (100.0%) |
| 25 to 29 Years | 56 (72.7%) | 0 (0.0%) |
| 30 to 34 Years | 73 (100.0%) | 0 (0.0%) |
| 35 to 44 Years | 98 (100.0%) | 15 (15.3%) |
| 45 to 54 Years | 73 (100.0%) | 0 (0.0%) |
| 55 to 59 Years | 44 (56.4%) | 0 (0.0%) |
| 60 to 64 Years | 75 (54.7%) | 0 (0.0%) |
| 65 to 74 Years | 78 (36.3%) | 15 (19.2%) |
| 75 Years and over | 0 (0.0%) | 0 (0.0%) |
| Total | 504 (60.9%) | 37 (7.3%) |
Employment Status by Educational Attainment in Highpoint
According to labor force statistics for Highpoint, 78.2% of individuals (419) out of the total population between 25 and 64 years of age (536) are in the labor force, with 3.6% or 15 of them being unemployed. The group with the highest labor force participation rate are those with the educational attainment of college / associate degree, with 100.0% or 178 individuals in the labor force. Within the labor force, individuals with bachelor's degree or higher education have the highest percentage of unemployment, with 12.2% or 15 of them being unemployed.
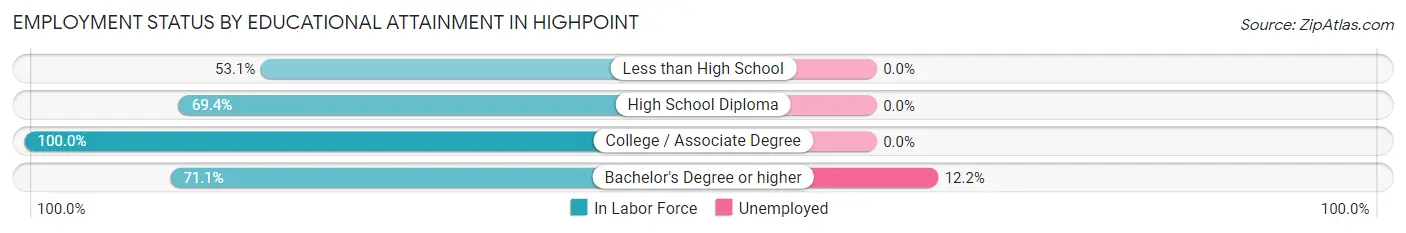
| Educational Attainment | In Labor Force | Unemployed |
| Less than High School | 34 (53.1%) | 0 (0.0%) |
| High School Diploma | 84 (69.4%) | 0 (0.0%) |
| College / Associate Degree | 178 (100.0%) | 0 (0.0%) |
| Bachelor's Degree or higher | 123 (71.1%) | 21 (12.2%) |
| Total | 419 (78.2%) | 19 (3.6%) |
Employment Occupations by Sex in Highpoint
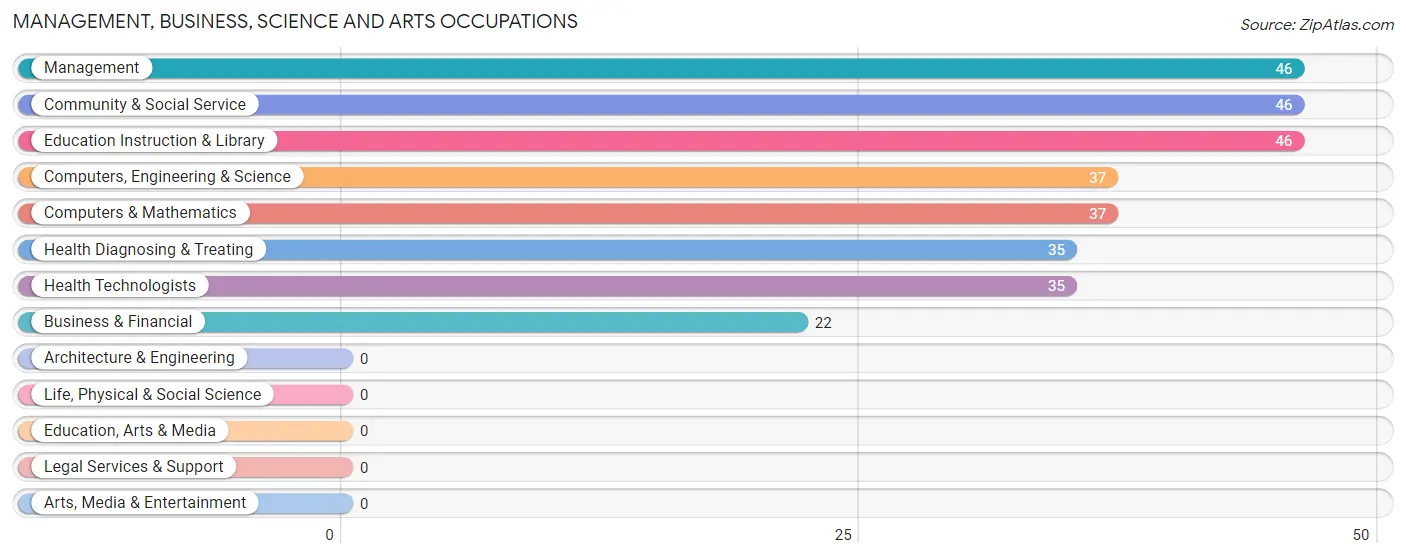
Management, Business, Science and Arts Occupations
The most common Management, Business, Science and Arts occupations in Highpoint are Management (46 | 9.9%), Community & Social Service (46 | 9.9%), Education Instruction & Library (46 | 9.9%), Computers, Engineering & Science (37 | 7.9%), and Computers & Mathematics (37 | 7.9%).
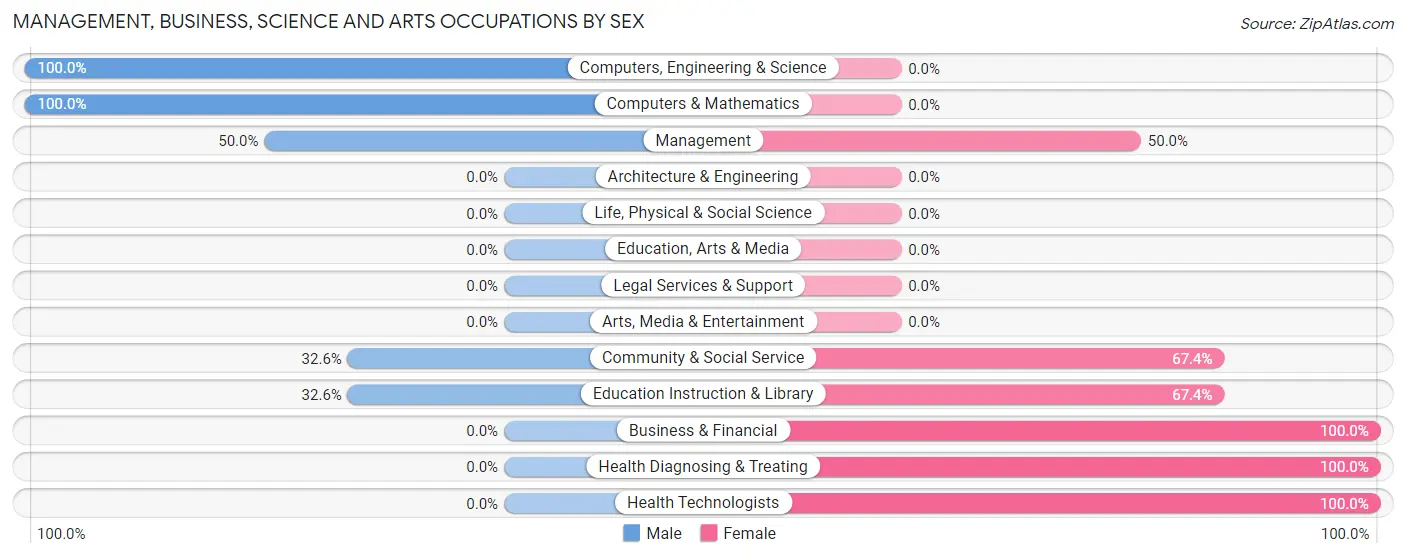
Management, Business, Science and Arts Occupations by Sex
Within the Management, Business, Science and Arts occupations in Highpoint, the most male-oriented occupations are Computers, Engineering & Science (100.0%), Computers & Mathematics (100.0%), and Management (50.0%), while the most female-oriented occupations are Business & Financial (100.0%), Health Diagnosing & Treating (100.0%), and Health Technologists (100.0%).
| Occupation | Male | Female |
| Management | 23 (50.0%) | 23 (50.0%) |
| Business & Financial | 0 (0.0%) | 22 (100.0%) |
| Computers, Engineering & Science | 37 (100.0%) | 0 (0.0%) |
| Computers & Mathematics | 37 (100.0%) | 0 (0.0%) |
| Architecture & Engineering | 0 (0.0%) | 0 (0.0%) |
| Life, Physical & Social Science | 0 (0.0%) | 0 (0.0%) |
| Community & Social Service | 15 (32.6%) | 31 (67.4%) |
| Education, Arts & Media | 0 (0.0%) | 0 (0.0%) |
| Legal Services & Support | 0 (0.0%) | 0 (0.0%) |
| Education Instruction & Library | 15 (32.6%) | 31 (67.4%) |
| Arts, Media & Entertainment | 0 (0.0%) | 0 (0.0%) |
| Health Diagnosing & Treating | 0 (0.0%) | 35 (100.0%) |
| Health Technologists | 0 (0.0%) | 35 (100.0%) |
| Total (Category) | 75 (40.3%) | 111 (59.7%) |
| Total (Overall) | 259 (55.5%) | 208 (44.5%) |
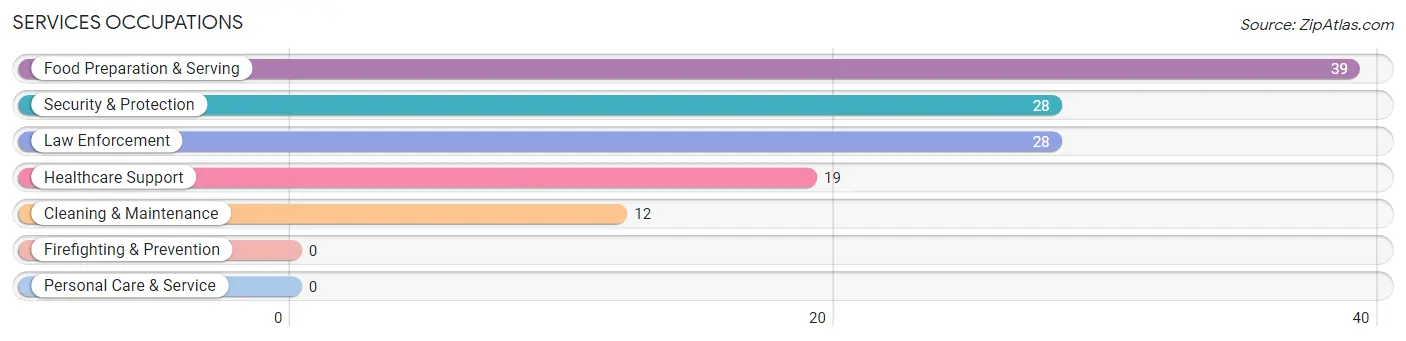
Services Occupations
The most common Services occupations in Highpoint are Food Preparation & Serving (39 | 8.4%), Security & Protection (28 | 6.0%), Law Enforcement (28 | 6.0%), Healthcare Support (19 | 4.1%), and Cleaning & Maintenance (12 | 2.6%).
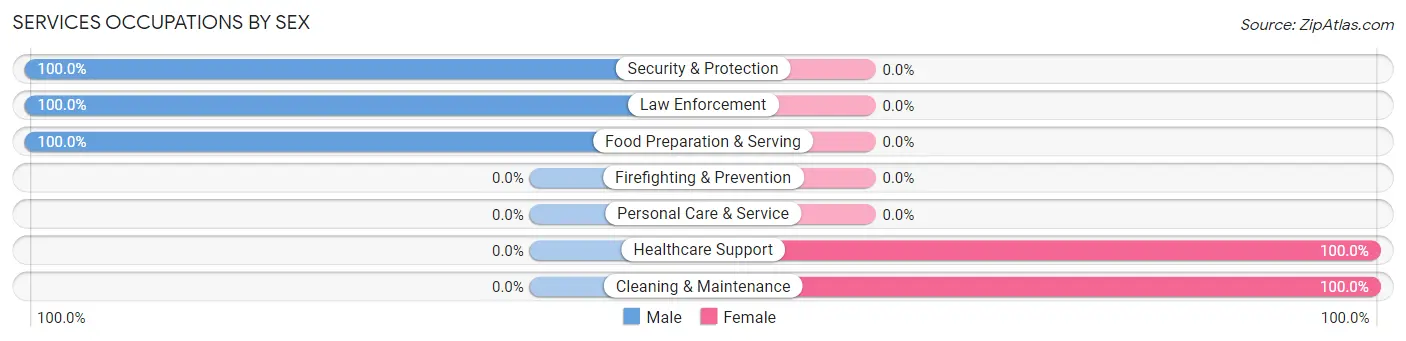
Services Occupations by Sex
Within the Services occupations in Highpoint, the most male-oriented occupations are Security & Protection (100.0%), Law Enforcement (100.0%), and Food Preparation & Serving (100.0%), while the most female-oriented occupations are Healthcare Support (100.0%), and Cleaning & Maintenance (100.0%).
| Occupation | Male | Female |
| Healthcare Support | 0 (0.0%) | 19 (100.0%) |
| Security & Protection | 28 (100.0%) | 0 (0.0%) |
| Firefighting & Prevention | 0 (0.0%) | 0 (0.0%) |
| Law Enforcement | 28 (100.0%) | 0 (0.0%) |
| Food Preparation & Serving | 39 (100.0%) | 0 (0.0%) |
| Cleaning & Maintenance | 0 (0.0%) | 12 (100.0%) |
| Personal Care & Service | 0 (0.0%) | 0 (0.0%) |
| Total (Category) | 67 (68.4%) | 31 (31.6%) |
| Total (Overall) | 259 (55.5%) | 208 (44.5%) |
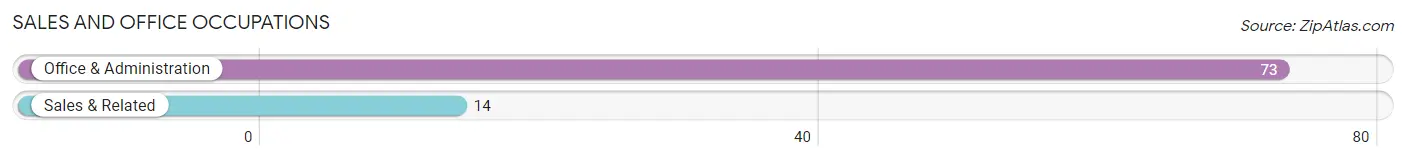
Sales and Office Occupations
The most common Sales and Office occupations in Highpoint are Office & Administration (73 | 15.6%), and Sales & Related (14 | 3.0%).
Sales and Office Occupations by Sex
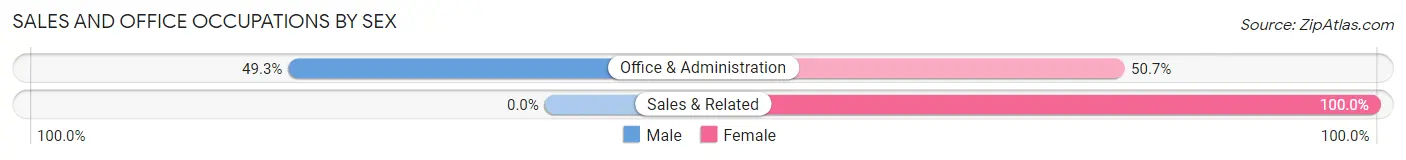
| Occupation | Male | Female |
| Sales & Related | 0 (0.0%) | 14 (100.0%) |
| Office & Administration | 36 (49.3%) | 37 (50.7%) |
| Total (Category) | 36 (41.4%) | 51 (58.6%) |
| Total (Overall) | 259 (55.5%) | 208 (44.5%) |
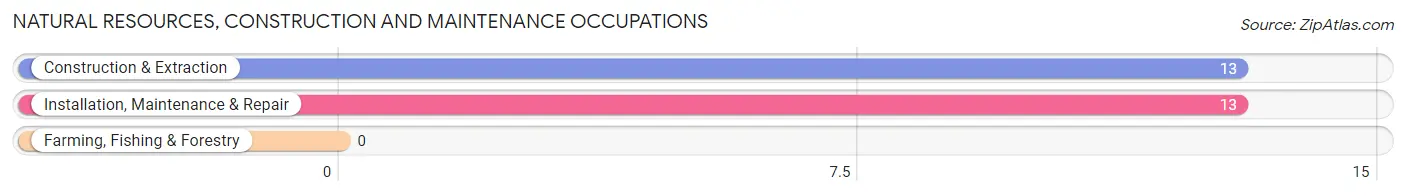
Natural Resources, Construction and Maintenance Occupations
The most common Natural Resources, Construction and Maintenance occupations in Highpoint are Construction & Extraction (13 | 2.8%), and Installation, Maintenance & Repair (13 | 2.8%).
Natural Resources, Construction and Maintenance Occupations by Sex
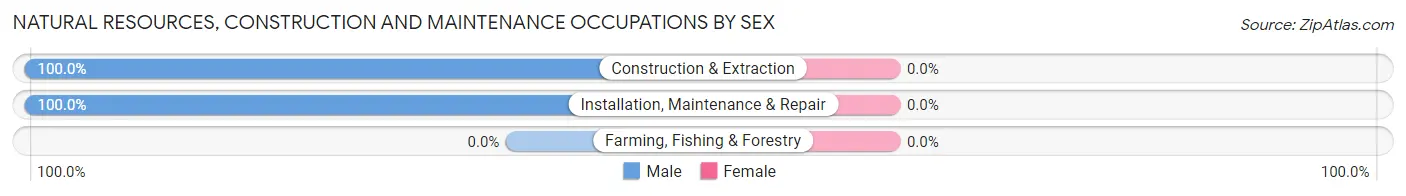
| Occupation | Male | Female |
| Farming, Fishing & Forestry | 0 (0.0%) | 0 (0.0%) |
| Construction & Extraction | 13 (100.0%) | 0 (0.0%) |
| Installation, Maintenance & Repair | 13 (100.0%) | 0 (0.0%) |
| Total (Category) | 26 (100.0%) | 0 (0.0%) |
| Total (Overall) | 259 (55.5%) | 208 (44.5%) |
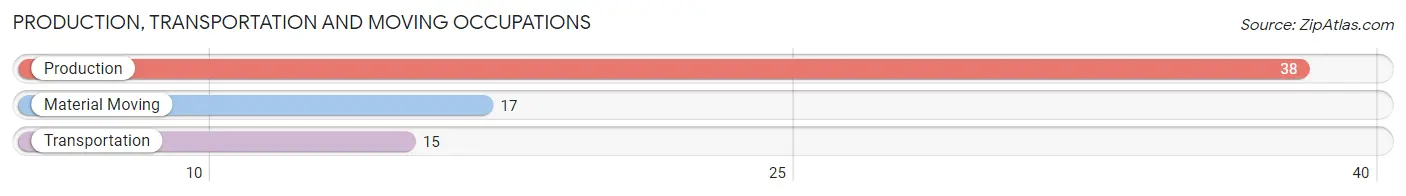
Production, Transportation and Moving Occupations
The most common Production, Transportation and Moving occupations in Highpoint are Production (38 | 8.1%), Material Moving (17 | 3.6%), and Transportation (15 | 3.2%).
Production, Transportation and Moving Occupations by Sex
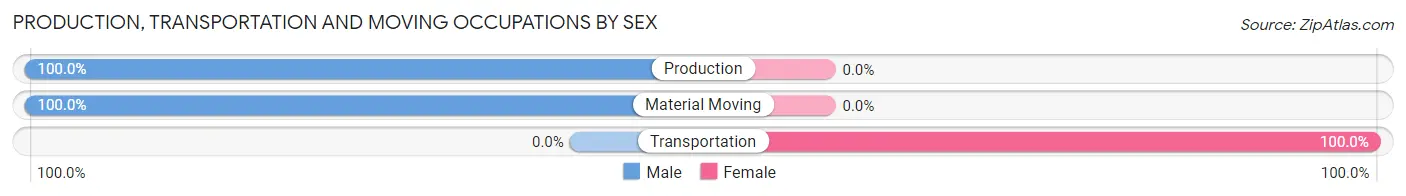
| Occupation | Male | Female |
| Production | 38 (100.0%) | 0 (0.0%) |
| Transportation | 0 (0.0%) | 15 (100.0%) |
| Material Moving | 17 (100.0%) | 0 (0.0%) |
| Total (Category) | 55 (78.6%) | 15 (21.4%) |
| Total (Overall) | 259 (55.5%) | 208 (44.5%) |
Employment Industries by Sex in Highpoint
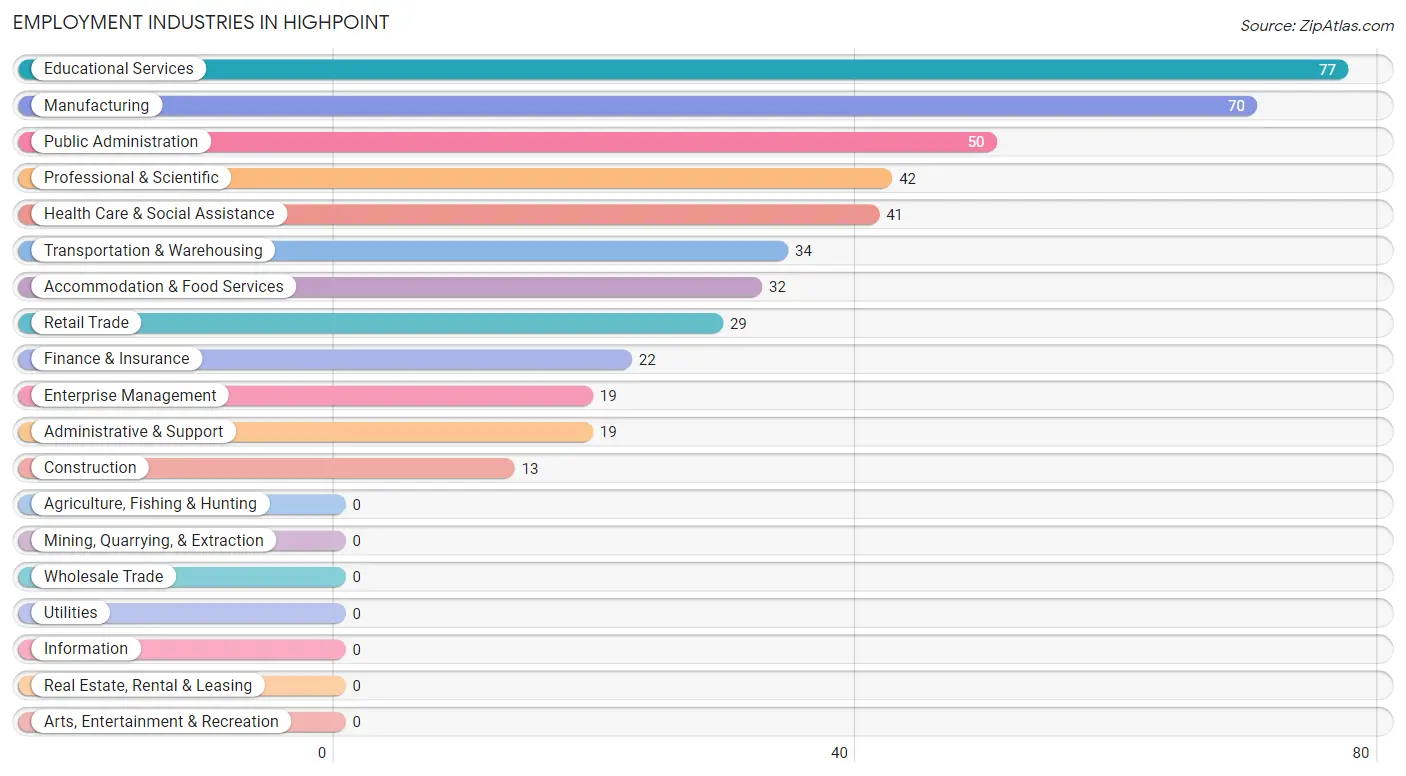
Employment Industries in Highpoint
The major employment industries in Highpoint include Educational Services (77 | 16.5%), Manufacturing (70 | 15.0%), Public Administration (50 | 10.7%), Professional & Scientific (42 | 9.0%), and Health Care & Social Assistance (41 | 8.8%).
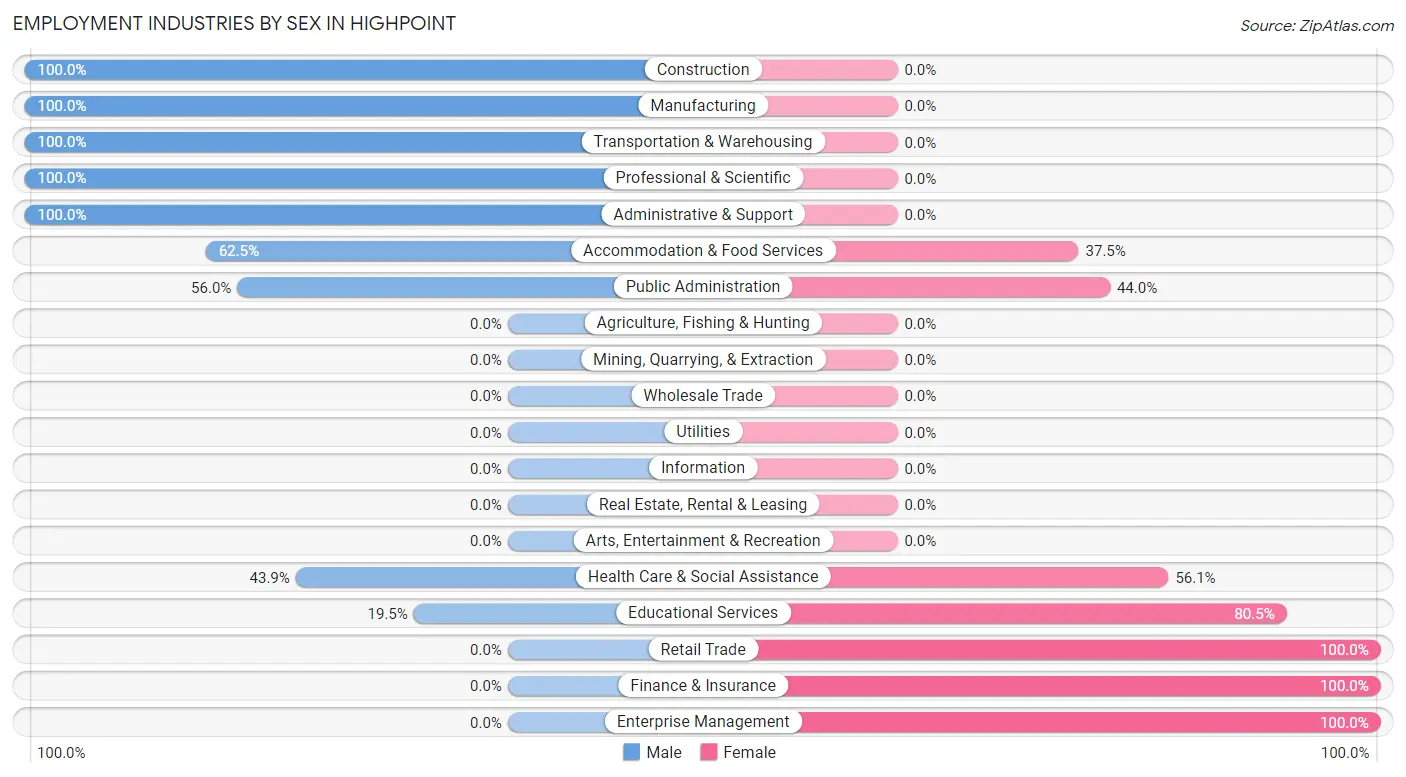
Employment Industries by Sex in Highpoint
The Highpoint industries that see more men than women are Construction (100.0%), Manufacturing (100.0%), and Transportation & Warehousing (100.0%), whereas the industries that tend to have a higher number of women are Retail Trade (100.0%), Finance & Insurance (100.0%), and Enterprise Management (100.0%).
| Industry | Male | Female |
| Agriculture, Fishing & Hunting | 0 (0.0%) | 0 (0.0%) |
| Mining, Quarrying, & Extraction | 0 (0.0%) | 0 (0.0%) |
| Construction | 13 (100.0%) | 0 (0.0%) |
| Manufacturing | 70 (100.0%) | 0 (0.0%) |
| Wholesale Trade | 0 (0.0%) | 0 (0.0%) |
| Retail Trade | 0 (0.0%) | 29 (100.0%) |
| Transportation & Warehousing | 34 (100.0%) | 0 (0.0%) |
| Utilities | 0 (0.0%) | 0 (0.0%) |
| Information | 0 (0.0%) | 0 (0.0%) |
| Finance & Insurance | 0 (0.0%) | 22 (100.0%) |
| Real Estate, Rental & Leasing | 0 (0.0%) | 0 (0.0%) |
| Professional & Scientific | 42 (100.0%) | 0 (0.0%) |
| Enterprise Management | 0 (0.0%) | 19 (100.0%) |
| Administrative & Support | 19 (100.0%) | 0 (0.0%) |
| Educational Services | 15 (19.5%) | 62 (80.5%) |
| Health Care & Social Assistance | 18 (43.9%) | 23 (56.1%) |
| Arts, Entertainment & Recreation | 0 (0.0%) | 0 (0.0%) |
| Accommodation & Food Services | 20 (62.5%) | 12 (37.5%) |
| Public Administration | 28 (56.0%) | 22 (44.0%) |
| Total | 259 (55.5%) | 208 (44.5%) |
Education in Highpoint
School Enrollment in Highpoint
The most common levels of schooling among the 78 students in Highpoint are graduate / professional (30 | 38.5%), high school (26 | 33.3%), and elementary school (22 | 28.2%).
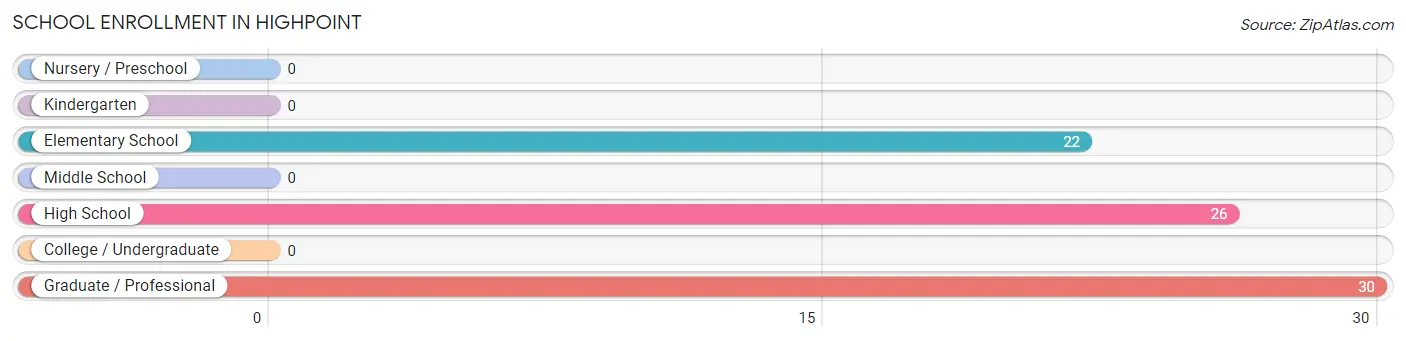
| School Level | # Students | % Students |
| Nursery / Preschool | 0 | 0.0% |
| Kindergarten | 0 | 0.0% |
| Elementary School | 22 | 28.2% |
| Middle School | 0 | 0.0% |
| High School | 26 | 33.3% |
| College / Undergraduate | 0 | 0.0% |
| Graduate / Professional | 30 | 38.5% |
| Total | 78 | 100.0% |
School Enrollment by Age by Funding Source in Highpoint
Out of a total of 78 students who are enrolled in schools in Highpoint, 7 (9.0%) attend a private institution, while the remaining 71 (91.0%) are enrolled in public schools. The age group of 20 to 24 year olds has the highest likelihood of being enrolled in private schools, with 7 (100.0% in the age bracket) enrolled. Conversely, the age group of 5 to 9 year old has the lowest likelihood of being enrolled in a private school, with 22 (100.0% in the age bracket) attending a public institution.
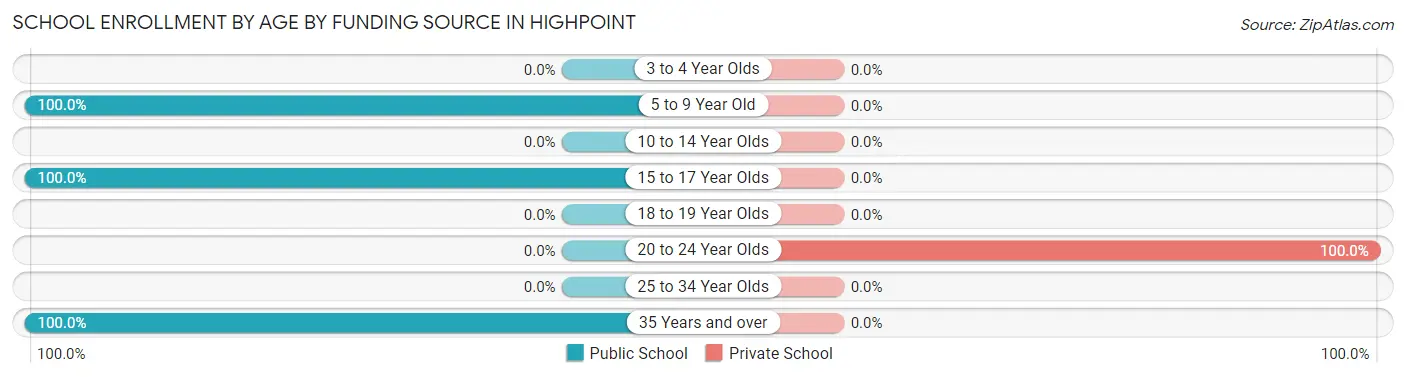
| Age Bracket | Public School | Private School |
| 3 to 4 Year Olds | 0 (0.0%) | 0 (0.0%) |
| 5 to 9 Year Old | 22 (100.0%) | 0 (0.0%) |
| 10 to 14 Year Olds | 0 (0.0%) | 0 (0.0%) |
| 15 to 17 Year Olds | 26 (100.0%) | 0 (0.0%) |
| 18 to 19 Year Olds | 0 (0.0%) | 0 (0.0%) |
| 20 to 24 Year Olds | 0 (0.0%) | 7 (100.0%) |
| 25 to 34 Year Olds | 0 (0.0%) | 0 (0.0%) |
| 35 Years and over | 23 (100.0%) | 0 (0.0%) |
| Total | 71 (91.0%) | 7 (9.0%) |
Educational Attainment by Field of Study in Highpoint
Education (45 | 18.2%), liberal arts & history (42 | 17.0%), social sciences (38 | 15.4%), business (38 | 15.4%), and arts & humanities (38 | 15.4%) are the most common fields of study among 247 individuals in Highpoint who have obtained a bachelor's degree or higher.
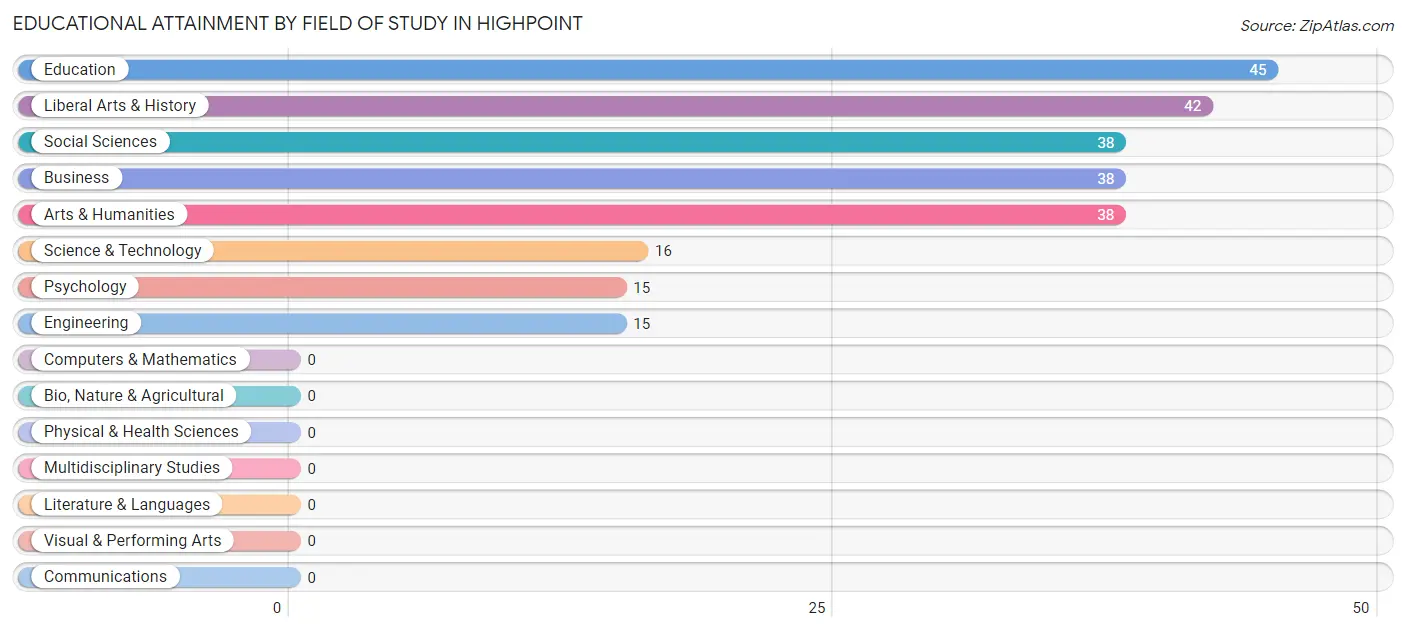
| Field of Study | # Graduates | % Graduates |
| Computers & Mathematics | 0 | 0.0% |
| Bio, Nature & Agricultural | 0 | 0.0% |
| Physical & Health Sciences | 0 | 0.0% |
| Psychology | 15 | 6.1% |
| Social Sciences | 38 | 15.4% |
| Engineering | 15 | 6.1% |
| Multidisciplinary Studies | 0 | 0.0% |
| Science & Technology | 16 | 6.5% |
| Business | 38 | 15.4% |
| Education | 45 | 18.2% |
| Literature & Languages | 0 | 0.0% |
| Liberal Arts & History | 42 | 17.0% |
| Visual & Performing Arts | 0 | 0.0% |
| Communications | 0 | 0.0% |
| Arts & Humanities | 38 | 15.4% |
| Total | 247 | 100.0% |
Transportation & Commute in Highpoint
Vehicle Availability by Sex in Highpoint
The most prevalent vehicle ownership categories in Highpoint are males with 2 vehicles (155, accounting for 63.0%) and females with 2 vehicles (107, making up 74.5%).
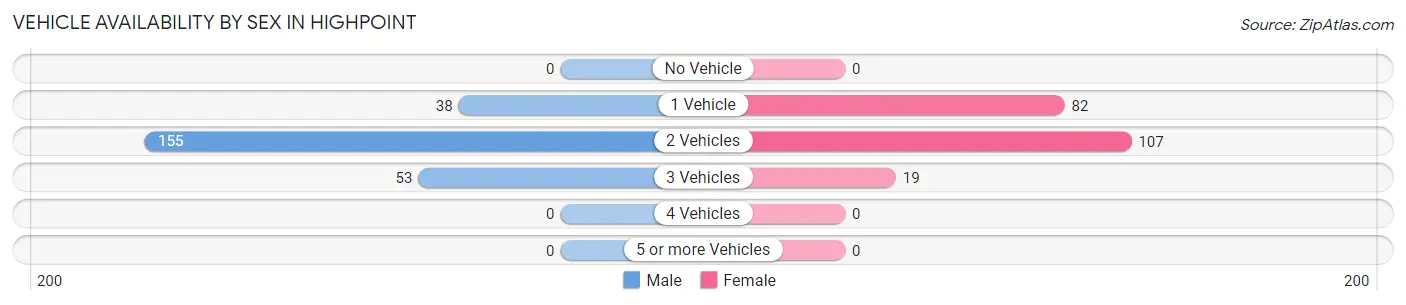
| Vehicles Available | Male | Female |
| No Vehicle | 0 (0.0%) | 0 (0.0%) |
| 1 Vehicle | 38 (15.4%) | 82 (39.4%) |
| 2 Vehicles | 155 (63.0%) | 107 (51.4%) |
| 3 Vehicles | 53 (21.5%) | 19 (9.1%) |
| 4 Vehicles | 0 (0.0%) | 0 (0.0%) |
| 5 or more Vehicles | 0 (0.0%) | 0 (0.0%) |
| Total | 246 (100.0%) | 208 (100.0%) |
Commute Time in Highpoint
The most frequently occuring commute durations in Highpoint are 10 to 14 minutes (135 commuters, 32.5%), 15 to 19 minutes (87 commuters, 20.9%), and 20 to 24 minutes (73 commuters, 17.5%).
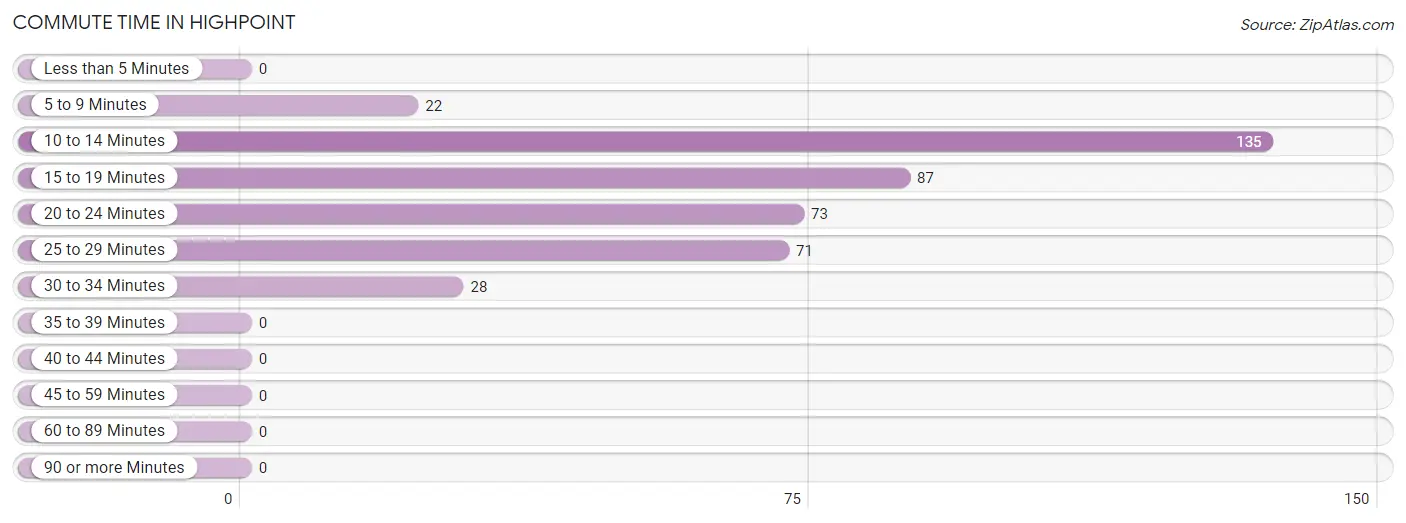
| Commute Time | # Commuters | % Commuters |
| Less than 5 Minutes | 0 | 0.0% |
| 5 to 9 Minutes | 22 | 5.3% |
| 10 to 14 Minutes | 135 | 32.5% |
| 15 to 19 Minutes | 87 | 20.9% |
| 20 to 24 Minutes | 73 | 17.5% |
| 25 to 29 Minutes | 71 | 17.1% |
| 30 to 34 Minutes | 28 | 6.7% |
| 35 to 39 Minutes | 0 | 0.0% |
| 40 to 44 Minutes | 0 | 0.0% |
| 45 to 59 Minutes | 0 | 0.0% |
| 60 to 89 Minutes | 0 | 0.0% |
| 90 or more Minutes | 0 | 0.0% |
Commute Time by Sex in Highpoint
The most common commute times in Highpoint are 10 to 14 minutes (89 commuters, 42.8%) for males and 20 to 24 minutes (56 commuters, 26.9%) for females.
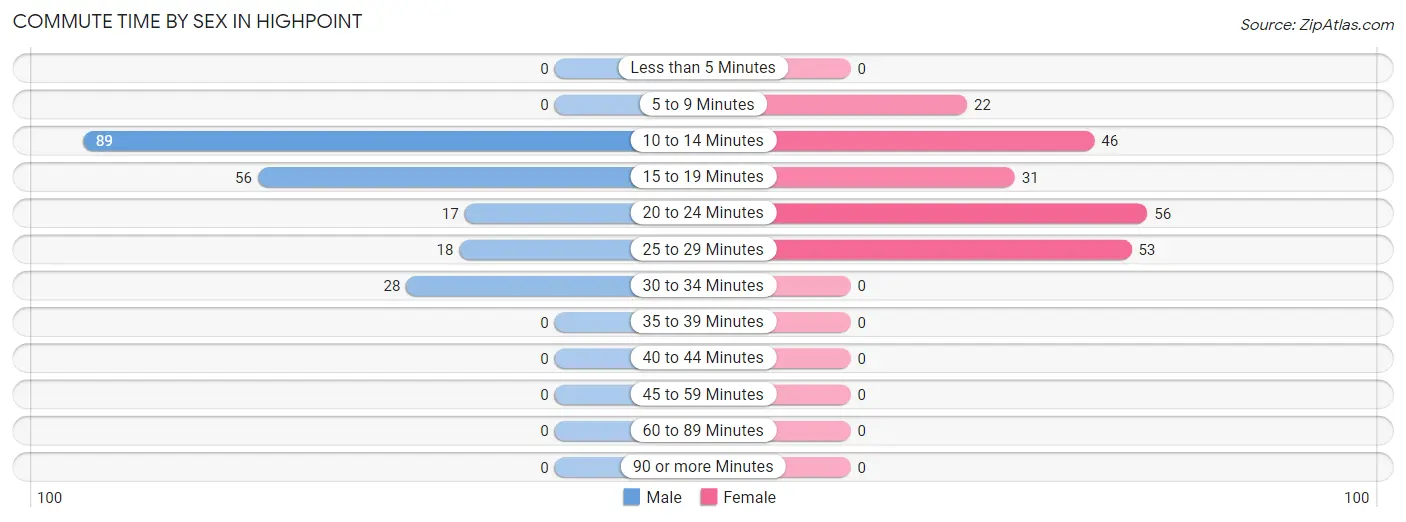
| Commute Time | Male | Female |
| Less than 5 Minutes | 0 (0.0%) | 0 (0.0%) |
| 5 to 9 Minutes | 0 (0.0%) | 22 (10.6%) |
| 10 to 14 Minutes | 89 (42.8%) | 46 (22.1%) |
| 15 to 19 Minutes | 56 (26.9%) | 31 (14.9%) |
| 20 to 24 Minutes | 17 (8.2%) | 56 (26.9%) |
| 25 to 29 Minutes | 18 (8.6%) | 53 (25.5%) |
| 30 to 34 Minutes | 28 (13.5%) | 0 (0.0%) |
| 35 to 39 Minutes | 0 (0.0%) | 0 (0.0%) |
| 40 to 44 Minutes | 0 (0.0%) | 0 (0.0%) |
| 45 to 59 Minutes | 0 (0.0%) | 0 (0.0%) |
| 60 to 89 Minutes | 0 (0.0%) | 0 (0.0%) |
| 90 or more Minutes | 0 (0.0%) | 0 (0.0%) |
Time of Departure to Work by Sex in Highpoint
The most frequent times of departure to work in Highpoint are 6:00 AM to 6:29 AM (47, 22.6%) for males and 7:00 AM to 7:29 AM (60, 28.8%) for females.
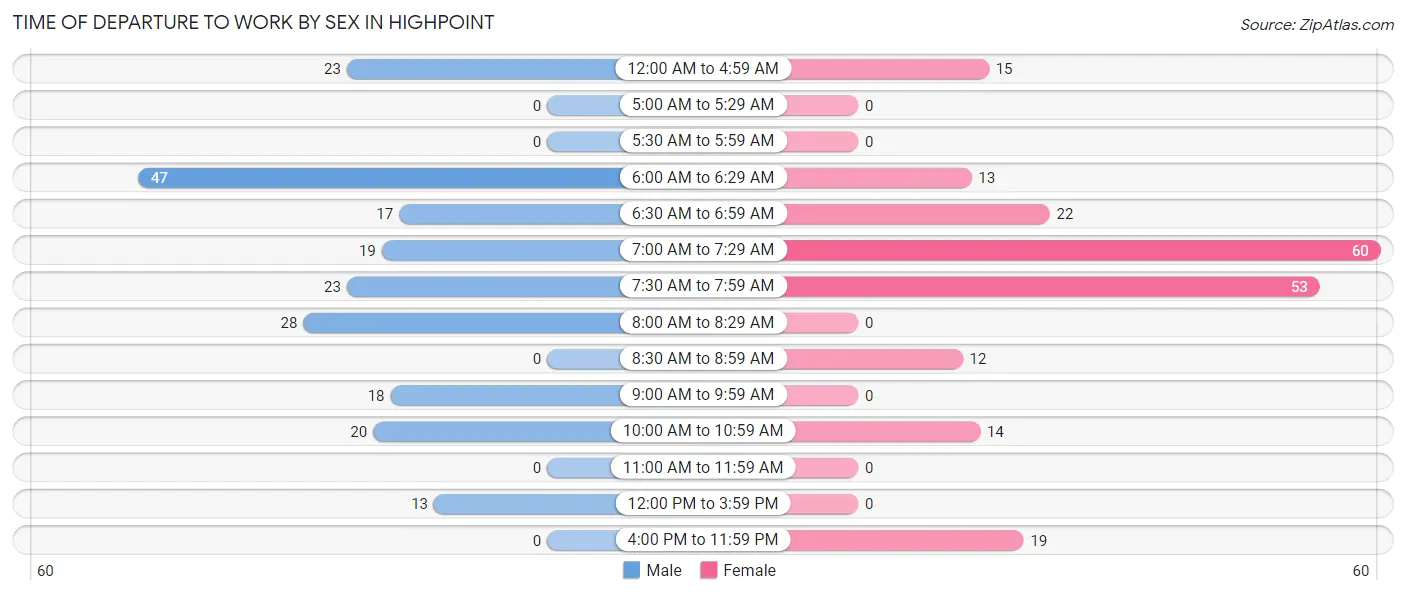
| Time of Departure | Male | Female |
| 12:00 AM to 4:59 AM | 23 (11.1%) | 15 (7.2%) |
| 5:00 AM to 5:29 AM | 0 (0.0%) | 0 (0.0%) |
| 5:30 AM to 5:59 AM | 0 (0.0%) | 0 (0.0%) |
| 6:00 AM to 6:29 AM | 47 (22.6%) | 13 (6.2%) |
| 6:30 AM to 6:59 AM | 17 (8.2%) | 22 (10.6%) |
| 7:00 AM to 7:29 AM | 19 (9.1%) | 60 (28.8%) |
| 7:30 AM to 7:59 AM | 23 (11.1%) | 53 (25.5%) |
| 8:00 AM to 8:29 AM | 28 (13.5%) | 0 (0.0%) |
| 8:30 AM to 8:59 AM | 0 (0.0%) | 12 (5.8%) |
| 9:00 AM to 9:59 AM | 18 (8.6%) | 0 (0.0%) |
| 10:00 AM to 10:59 AM | 20 (9.6%) | 14 (6.7%) |
| 11:00 AM to 11:59 AM | 0 (0.0%) | 0 (0.0%) |
| 12:00 PM to 3:59 PM | 13 (6.2%) | 0 (0.0%) |
| 4:00 PM to 11:59 PM | 0 (0.0%) | 19 (9.1%) |
| Total | 208 (100.0%) | 208 (100.0%) |
Housing Occupancy in Highpoint
Occupancy by Ownership in Highpoint
Of the total 492 dwellings in Highpoint, owner-occupied units account for 442 (89.8%), while renter-occupied units make up 50 (10.2%).
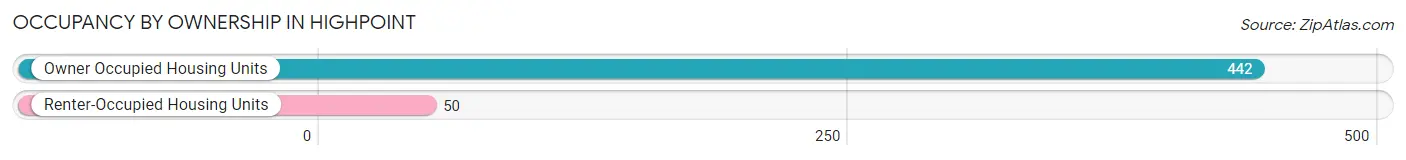
| Occupancy | # Housing Units | % Housing Units |
| Owner Occupied Housing Units | 442 | 89.8% |
| Renter-Occupied Housing Units | 50 | 10.2% |
| Total Occupied Housing Units | 492 | 100.0% |
Occupancy by Household Size in Highpoint
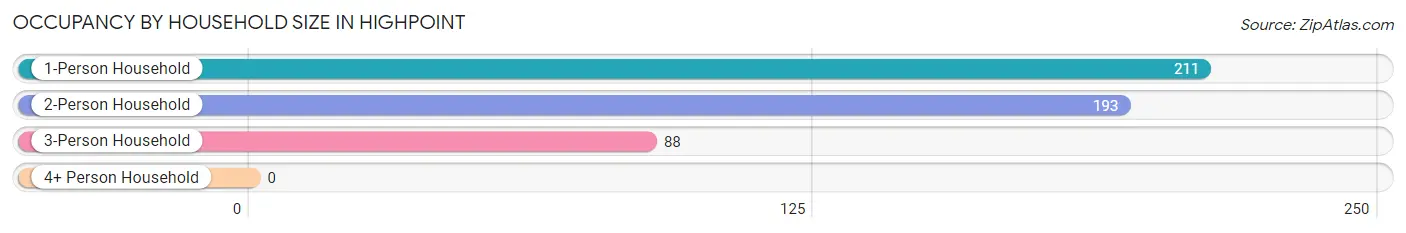
| Household Size | # Housing Units | % Housing Units |
| 1-Person Household | 211 | 42.9% |
| 2-Person Household | 193 | 39.2% |
| 3-Person Household | 88 | 17.9% |
| 4+ Person Household | 0 | 0.0% |
| Total Housing Units | 492 | 100.0% |
Occupancy by Ownership by Household Size in Highpoint
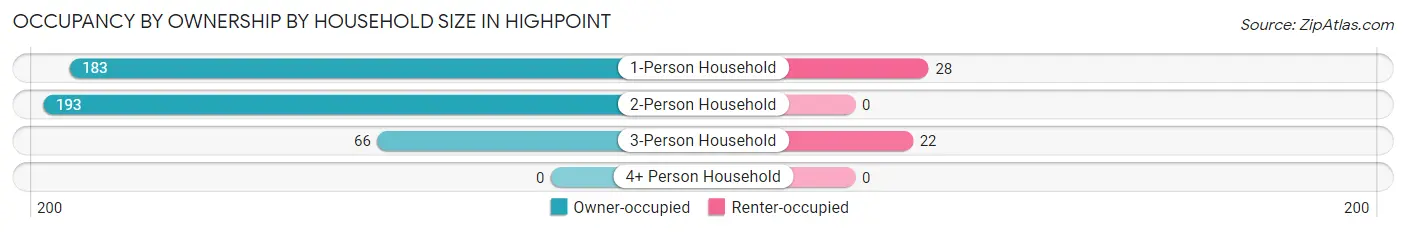
| Household Size | Owner-occupied | Renter-occupied |
| 1-Person Household | 183 (86.7%) | 28 (13.3%) |
| 2-Person Household | 193 (100.0%) | 0 (0.0%) |
| 3-Person Household | 66 (75.0%) | 22 (25.0%) |
| 4+ Person Household | 0 (0.0%) | 0 (0.0%) |
| Total Housing Units | 442 (89.8%) | 50 (10.2%) |
Occupancy by Educational Attainment in Highpoint
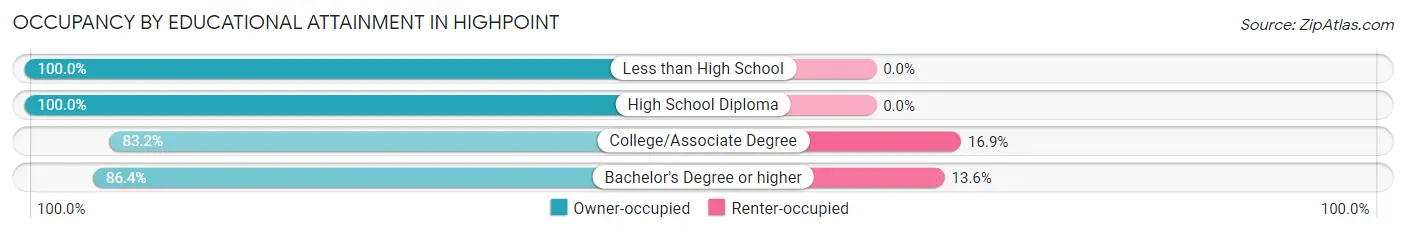
| Household Size | Owner-occupied | Renter-occupied |
| Less than High School | 77 (100.0%) | 0 (0.0%) |
| High School Diploma | 91 (100.0%) | 0 (0.0%) |
| College/Associate Degree | 153 (83.2%) | 31 (16.9%) |
| Bachelor's Degree or higher | 121 (86.4%) | 19 (13.6%) |
Occupancy by Age of Householder in Highpoint
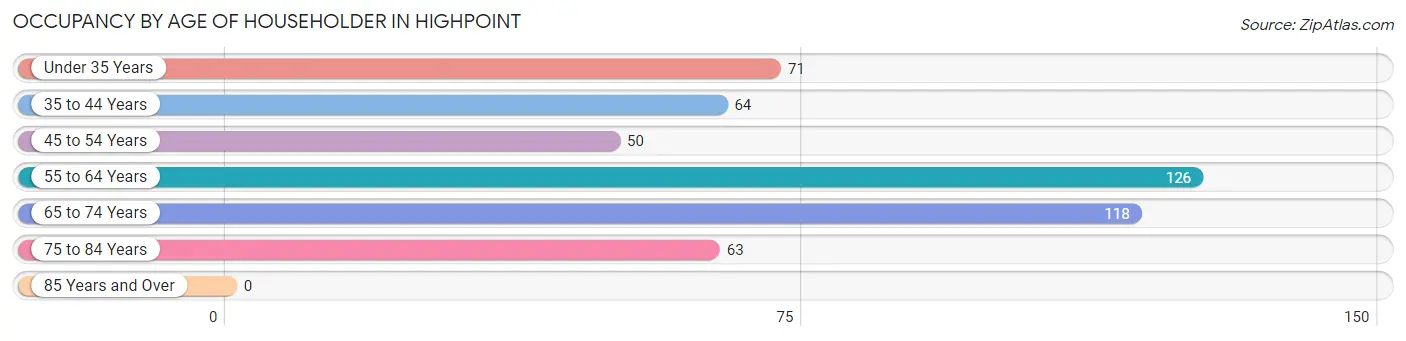
| Age Bracket | # Households | % Households |
| Under 35 Years | 71 | 14.4% |
| 35 to 44 Years | 64 | 13.0% |
| 45 to 54 Years | 50 | 10.2% |
| 55 to 64 Years | 126 | 25.6% |
| 65 to 74 Years | 118 | 24.0% |
| 75 to 84 Years | 63 | 12.8% |
| 85 Years and Over | 0 | 0.0% |
| Total | 492 | 100.0% |
Housing Finances in Highpoint
Median Income by Occupancy in Highpoint
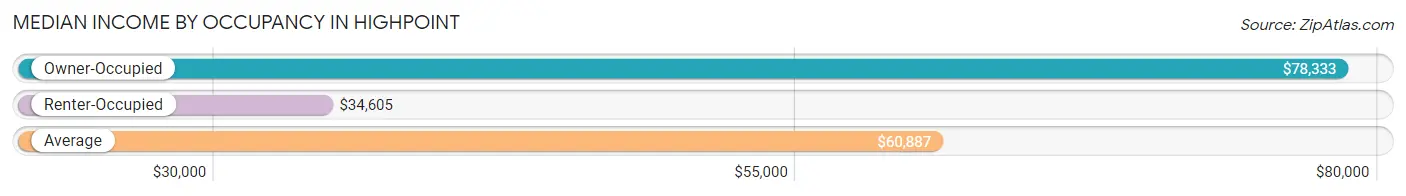
| Occupancy Type | # Households | Median Income |
| Owner-Occupied | 442 (89.8%) | $78,333 |
| Renter-Occupied | 50 (10.2%) | $34,605 |
| Average | 492 (100.0%) | $60,887 |
Occupancy by Householder Income Bracket in Highpoint
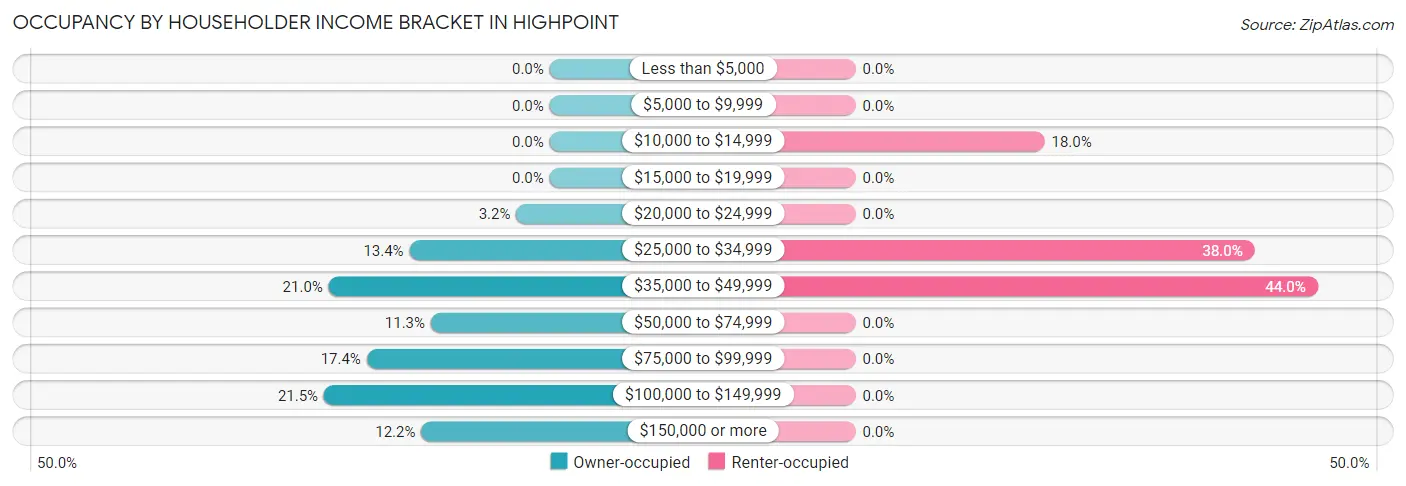
| Income Bracket | Owner-occupied | Renter-occupied |
| Less than $5,000 | 0 (0.0%) | 0 (0.0%) |
| $5,000 to $9,999 | 0 (0.0%) | 0 (0.0%) |
| $10,000 to $14,999 | 0 (0.0%) | 9 (18.0%) |
| $15,000 to $19,999 | 0 (0.0%) | 0 (0.0%) |
| $20,000 to $24,999 | 14 (3.2%) | 0 (0.0%) |
| $25,000 to $34,999 | 59 (13.4%) | 19 (38.0%) |
| $35,000 to $49,999 | 93 (21.0%) | 22 (44.0%) |
| $50,000 to $74,999 | 50 (11.3%) | 0 (0.0%) |
| $75,000 to $99,999 | 77 (17.4%) | 0 (0.0%) |
| $100,000 to $149,999 | 95 (21.5%) | 0 (0.0%) |
| $150,000 or more | 54 (12.2%) | 0 (0.0%) |
| Total | 442 (100.0%) | 50 (100.0%) |
Monthly Housing Cost Tiers in Highpoint
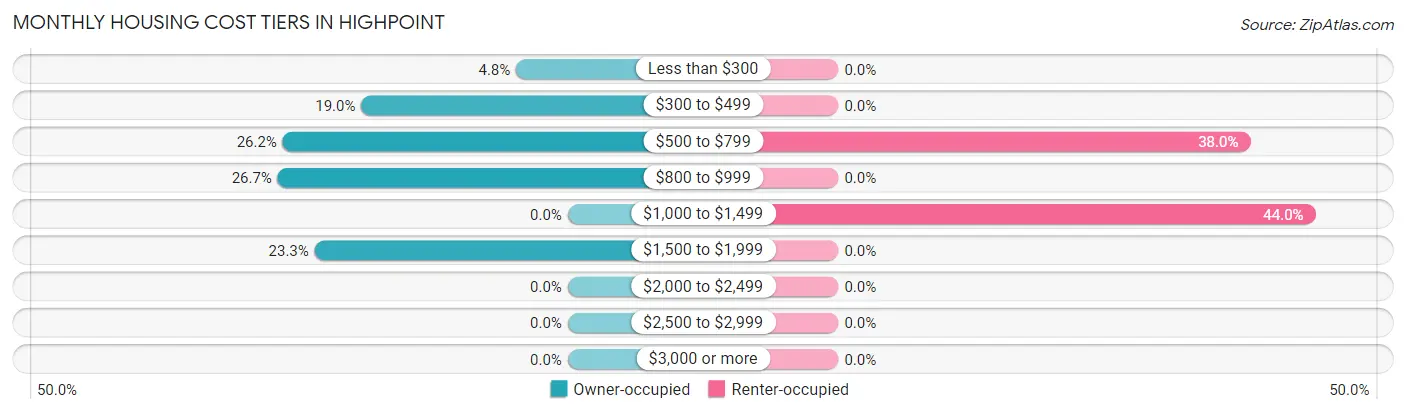
| Monthly Cost | Owner-occupied | Renter-occupied |
| Less than $300 | 21 (4.8%) | 0 (0.0%) |
| $300 to $499 | 84 (19.0%) | 0 (0.0%) |
| $500 to $799 | 116 (26.2%) | 19 (38.0%) |
| $800 to $999 | 118 (26.7%) | 0 (0.0%) |
| $1,000 to $1,499 | 0 (0.0%) | 22 (44.0%) |
| $1,500 to $1,999 | 103 (23.3%) | 0 (0.0%) |
| $2,000 to $2,499 | 0 (0.0%) | 0 (0.0%) |
| $2,500 to $2,999 | 0 (0.0%) | 0 (0.0%) |
| $3,000 or more | 0 (0.0%) | 0 (0.0%) |
| Total | 442 (100.0%) | 50 (100.0%) |
Physical Housing Characteristics in Highpoint
Housing Structures in Highpoint
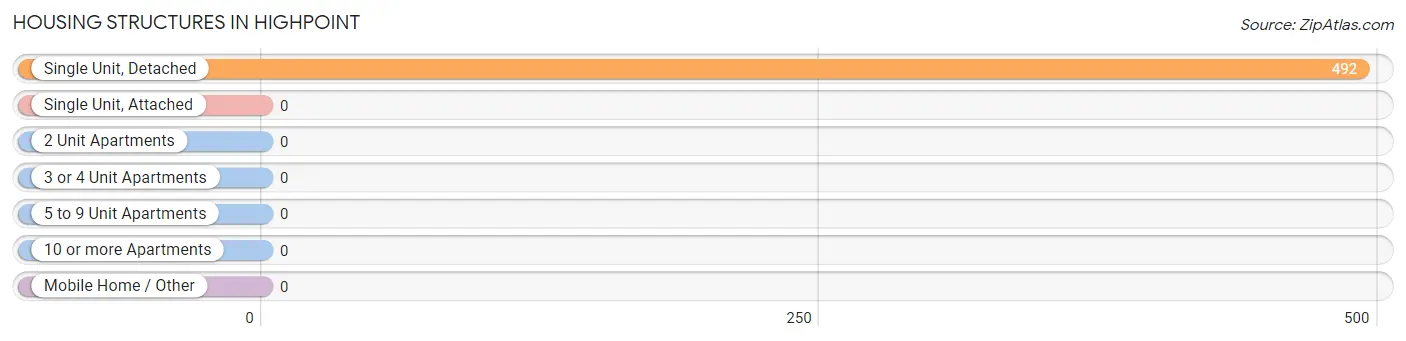
| Structure Type | # Housing Units | % Housing Units |
| Single Unit, Detached | 492 | 100.0% |
| Single Unit, Attached | 0 | 0.0% |
| 2 Unit Apartments | 0 | 0.0% |
| 3 or 4 Unit Apartments | 0 | 0.0% |
| 5 to 9 Unit Apartments | 0 | 0.0% |
| 10 or more Apartments | 0 | 0.0% |
| Mobile Home / Other | 0 | 0.0% |
| Total | 492 | 100.0% |
Housing Structures by Occupancy in Highpoint
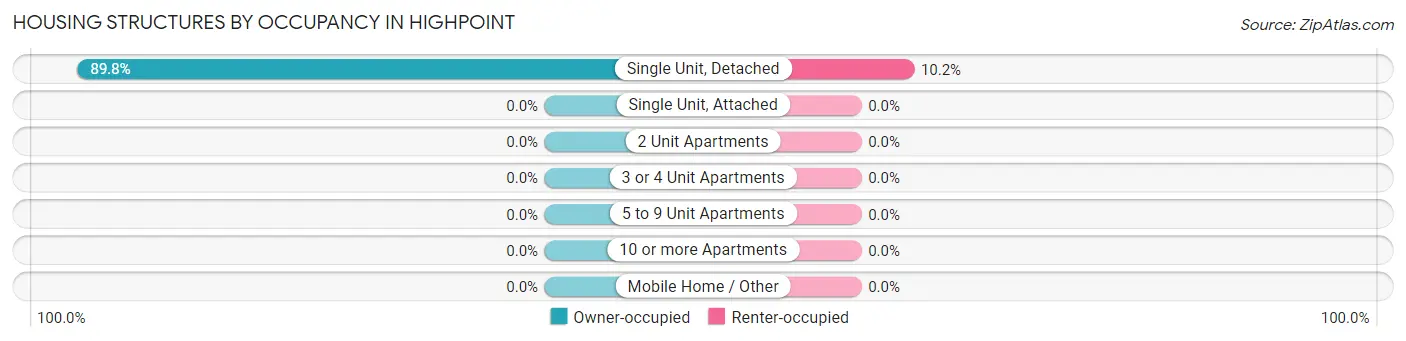
| Structure Type | Owner-occupied | Renter-occupied |
| Single Unit, Detached | 442 (89.8%) | 50 (10.2%) |
| Single Unit, Attached | 0 (0.0%) | 0 (0.0%) |
| 2 Unit Apartments | 0 (0.0%) | 0 (0.0%) |
| 3 or 4 Unit Apartments | 0 (0.0%) | 0 (0.0%) |
| 5 to 9 Unit Apartments | 0 (0.0%) | 0 (0.0%) |
| 10 or more Apartments | 0 (0.0%) | 0 (0.0%) |
| Mobile Home / Other | 0 (0.0%) | 0 (0.0%) |
| Total | 442 (89.8%) | 50 (10.2%) |
Housing Structures by Number of Rooms in Highpoint
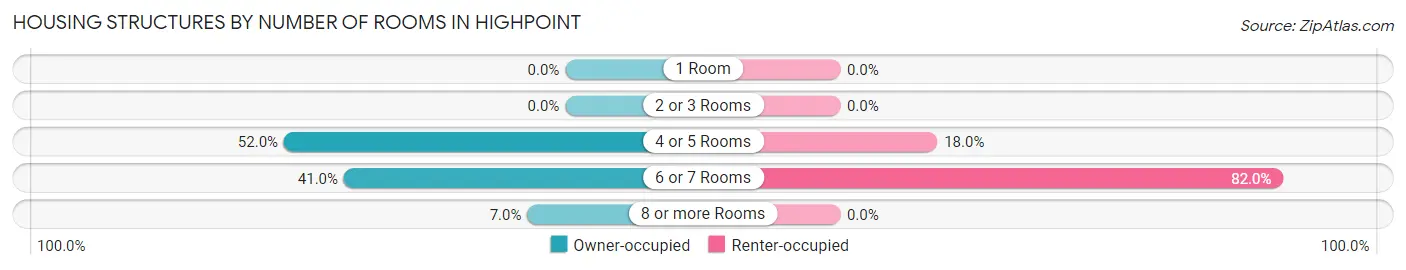
| Number of Rooms | Owner-occupied | Renter-occupied |
| 1 Room | 0 (0.0%) | 0 (0.0%) |
| 2 or 3 Rooms | 0 (0.0%) | 0 (0.0%) |
| 4 or 5 Rooms | 230 (52.0%) | 9 (18.0%) |
| 6 or 7 Rooms | 181 (40.9%) | 41 (82.0%) |
| 8 or more Rooms | 31 (7.0%) | 0 (0.0%) |
| Total | 442 (100.0%) | 50 (100.0%) |
Housing Structure by Heating Type in Highpoint
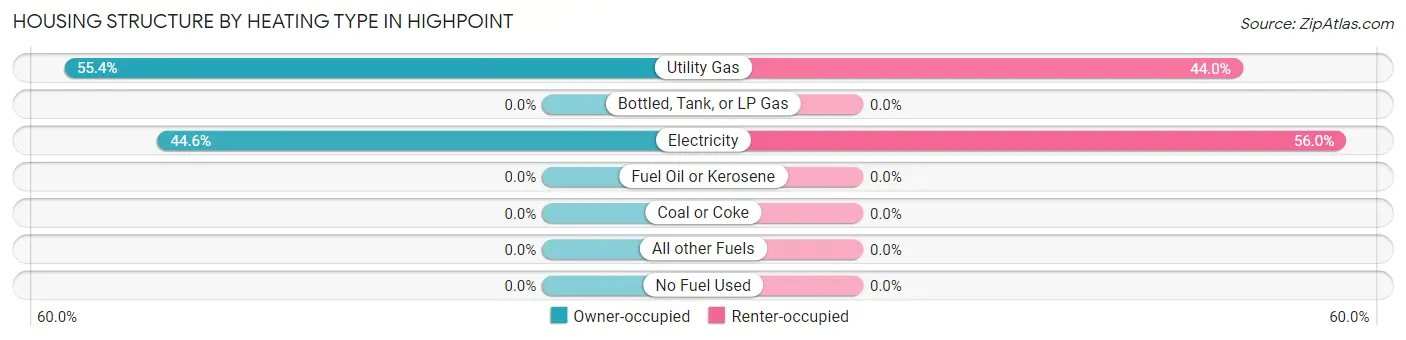
| Heating Type | Owner-occupied | Renter-occupied |
| Utility Gas | 245 (55.4%) | 22 (44.0%) |
| Bottled, Tank, or LP Gas | 0 (0.0%) | 0 (0.0%) |
| Electricity | 197 (44.6%) | 28 (56.0%) |
| Fuel Oil or Kerosene | 0 (0.0%) | 0 (0.0%) |
| Coal or Coke | 0 (0.0%) | 0 (0.0%) |
| All other Fuels | 0 (0.0%) | 0 (0.0%) |
| No Fuel Used | 0 (0.0%) | 0 (0.0%) |
| Total | 442 (100.0%) | 50 (100.0%) |
Household Vehicle Usage in Highpoint
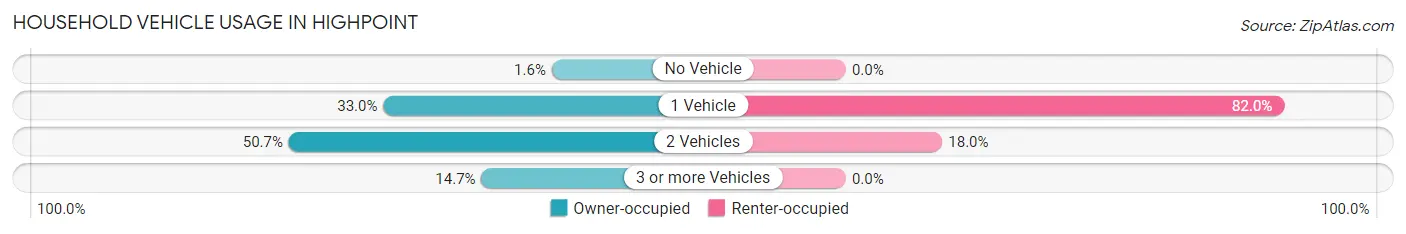
| Vehicles per Household | Owner-occupied | Renter-occupied |
| No Vehicle | 7 (1.6%) | 0 (0.0%) |
| 1 Vehicle | 146 (33.0%) | 41 (82.0%) |
| 2 Vehicles | 224 (50.7%) | 9 (18.0%) |
| 3 or more Vehicles | 65 (14.7%) | 0 (0.0%) |
| Total | 442 (100.0%) | 50 (100.0%) |
Real Estate & Mortgages in Highpoint
Real Estate and Mortgage Overview in Highpoint
| Characteristic | Without Mortgage | With Mortgage |
| Housing Units | 187 | 255 |
| Median Property Value | $78,400 | $191,400 |
| Median Household Income | $60,524 | $37 |
| Monthly Housing Costs | $486 | $0 |
| Real Estate Taxes | $1,804 | $0 |
Property Value by Mortgage Status in Highpoint
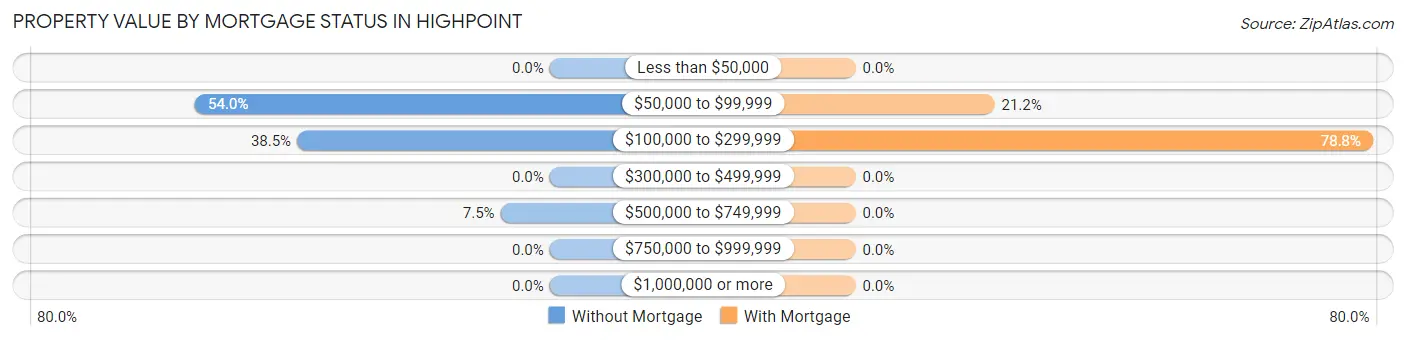
| Property Value | Without Mortgage | With Mortgage |
| Less than $50,000 | 0 (0.0%) | 0 (0.0%) |
| $50,000 to $99,999 | 101 (54.0%) | 54 (21.2%) |
| $100,000 to $299,999 | 72 (38.5%) | 201 (78.8%) |
| $300,000 to $499,999 | 0 (0.0%) | 0 (0.0%) |
| $500,000 to $749,999 | 14 (7.5%) | 0 (0.0%) |
| $750,000 to $999,999 | 0 (0.0%) | 0 (0.0%) |
| $1,000,000 or more | 0 (0.0%) | 0 (0.0%) |
| Total | 187 (100.0%) | 255 (100.0%) |
Household Income by Mortgage Status in Highpoint
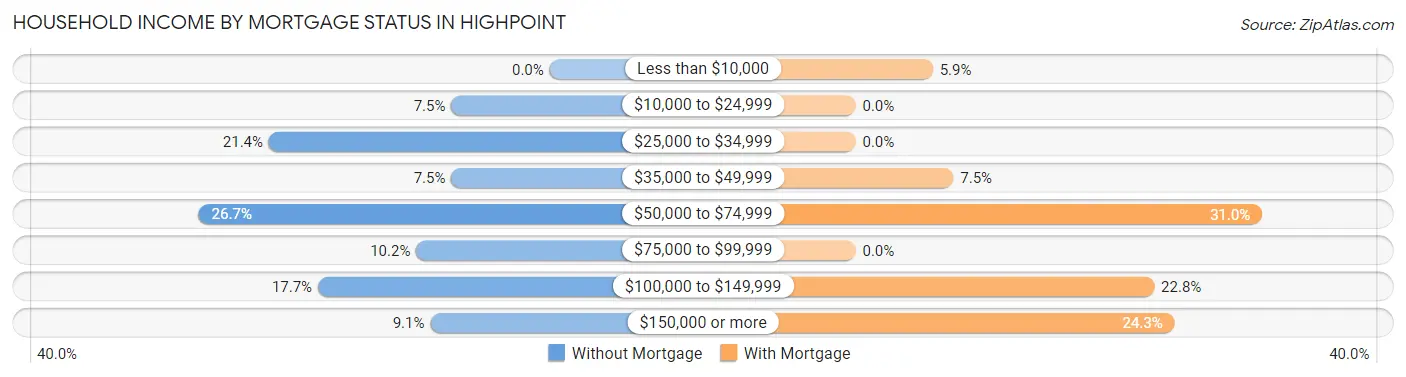
| Household Income | Without Mortgage | With Mortgage |
| Less than $10,000 | 0 (0.0%) | 15 (5.9%) |
| $10,000 to $24,999 | 14 (7.5%) | 0 (0.0%) |
| $25,000 to $34,999 | 40 (21.4%) | 0 (0.0%) |
| $35,000 to $49,999 | 14 (7.5%) | 19 (7.4%) |
| $50,000 to $74,999 | 50 (26.7%) | 79 (31.0%) |
| $75,000 to $99,999 | 19 (10.2%) | 0 (0.0%) |
| $100,000 to $149,999 | 33 (17.6%) | 58 (22.8%) |
| $150,000 or more | 17 (9.1%) | 62 (24.3%) |
| Total | 187 (100.0%) | 255 (100.0%) |
Property Value to Household Income Ratio in Highpoint
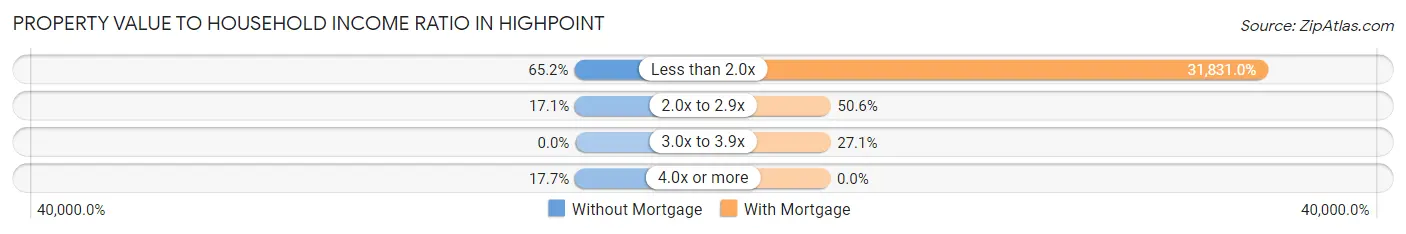
| Value-to-Income Ratio | Without Mortgage | With Mortgage |
| Less than 2.0x | 122 (65.2%) | 81,169 (31,831.0%) |
| 2.0x to 2.9x | 32 (17.1%) | 129 (50.6%) |
| 3.0x to 3.9x | 0 (0.0%) | 69 (27.1%) |
| 4.0x or more | 33 (17.6%) | 0 (0.0%) |
| Total | 187 (100.0%) | 255 (100.0%) |
Real Estate Taxes by Mortgage Status in Highpoint
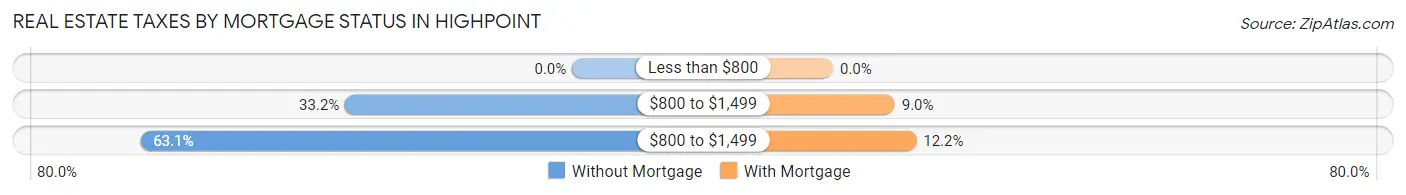
| Property Taxes | Without Mortgage | With Mortgage |
| Less than $800 | 0 (0.0%) | 0 (0.0%) |
| $800 to $1,499 | 62 (33.2%) | 23 (9.0%) |
| $800 to $1,499 | 118 (63.1%) | 31 (12.2%) |
| Total | 187 (100.0%) | 255 (100.0%) |
Health & Disability in Highpoint
Health Insurance Coverage by Age in Highpoint
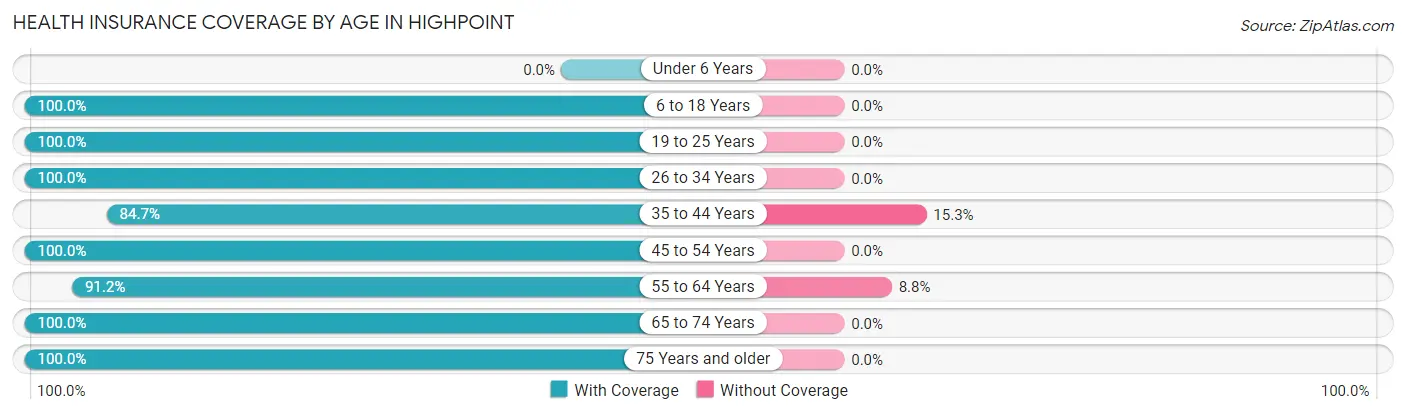
| Age Bracket | With Coverage | Without Coverage |
| Under 6 Years | 0 (0.0%) | 0 (0.0%) |
| 6 to 18 Years | 48 (100.0%) | 0 (0.0%) |
| 19 to 25 Years | 31 (100.0%) | 0 (0.0%) |
| 26 to 34 Years | 133 (100.0%) | 0 (0.0%) |
| 35 to 44 Years | 83 (84.7%) | 15 (15.3%) |
| 45 to 54 Years | 73 (100.0%) | 0 (0.0%) |
| 55 to 64 Years | 196 (91.2%) | 19 (8.8%) |
| 65 to 74 Years | 215 (100.0%) | 0 (0.0%) |
| 75 Years and older | 63 (100.0%) | 0 (0.0%) |
| Total | 842 (96.1%) | 34 (3.9%) |
Health Insurance Coverage by Citizenship Status in Highpoint
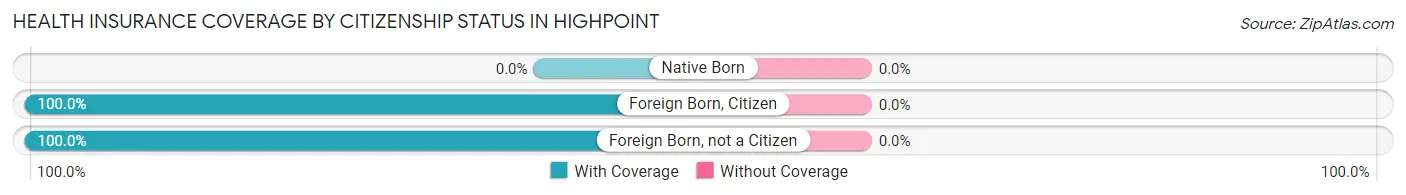
| Citizenship Status | With Coverage | Without Coverage |
| Native Born | 0 (0.0%) | 0 (0.0%) |
| Foreign Born, Citizen | 48 (100.0%) | 0 (0.0%) |
| Foreign Born, not a Citizen | 31 (100.0%) | 0 (0.0%) |
Health Insurance Coverage by Household Income in Highpoint
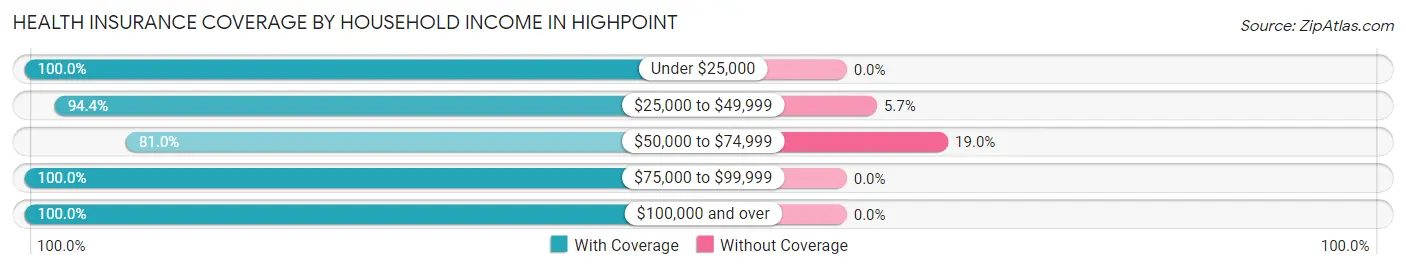
| Household Income | With Coverage | Without Coverage |
| Under $25,000 | 37 (100.0%) | 0 (0.0%) |
| $25,000 to $49,999 | 317 (94.4%) | 19 (5.7%) |
| $50,000 to $74,999 | 64 (81.0%) | 15 (19.0%) |
| $75,000 to $99,999 | 171 (100.0%) | 0 (0.0%) |
| $100,000 and over | 253 (100.0%) | 0 (0.0%) |
Public vs Private Health Insurance Coverage by Age in Highpoint
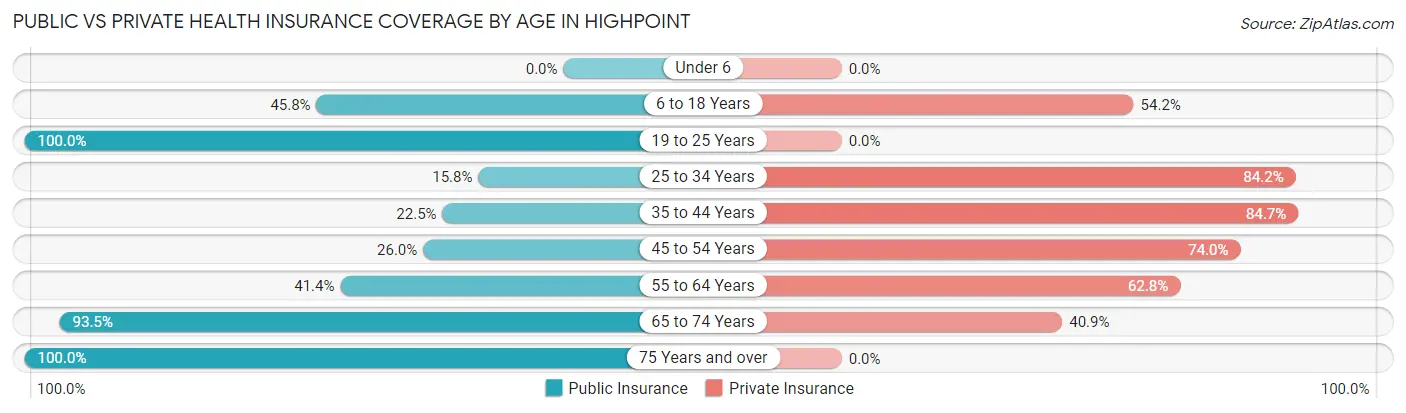
| Age Bracket | Public Insurance | Private Insurance |
| Under 6 | 0 (0.0%) | 0 (0.0%) |
| 6 to 18 Years | 22 (45.8%) | 26 (54.2%) |
| 19 to 25 Years | 31 (100.0%) | 0 (0.0%) |
| 25 to 34 Years | 21 (15.8%) | 112 (84.2%) |
| 35 to 44 Years | 22 (22.5%) | 83 (84.7%) |
| 45 to 54 Years | 19 (26.0%) | 54 (74.0%) |
| 55 to 64 Years | 89 (41.4%) | 135 (62.8%) |
| 65 to 74 Years | 201 (93.5%) | 88 (40.9%) |
| 75 Years and over | 63 (100.0%) | 0 (0.0%) |
| Total | 468 (53.4%) | 498 (56.9%) |
Disability Status by Sex by Age in Highpoint
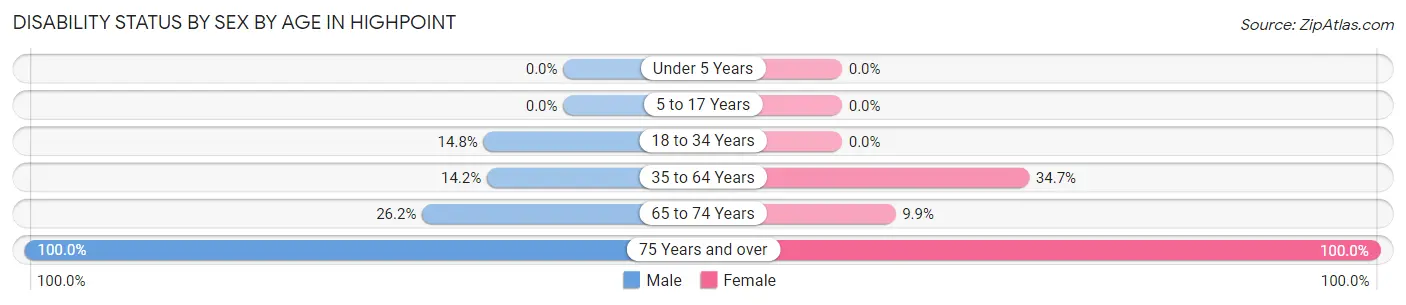
| Age Bracket | Male | Female |
| Under 5 Years | 0 (0.0%) | 0 (0.0%) |
| 5 to 17 Years | 0 (0.0%) | 0 (0.0%) |
| 18 to 34 Years | 21 (14.8%) | 0 (0.0%) |
| 35 to 64 Years | 31 (14.2%) | 58 (34.7%) |
| 65 to 74 Years | 22 (26.2%) | 13 (9.9%) |
| 75 Years and over | 49 (100.0%) | 14 (100.0%) |
Disability Class by Sex by Age in Highpoint
Disability Class: Hearing Difficulty
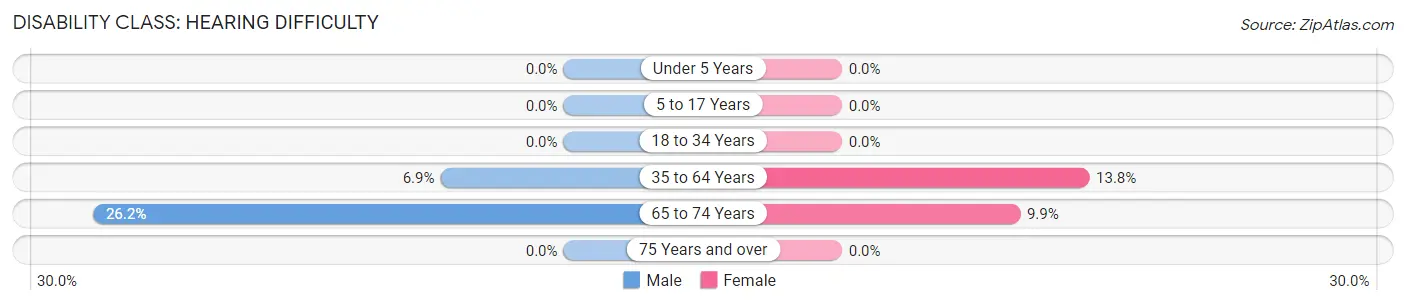
| Age Bracket | Male | Female |
| Under 5 Years | 0 (0.0%) | 0 (0.0%) |
| 5 to 17 Years | 0 (0.0%) | 0 (0.0%) |
| 18 to 34 Years | 0 (0.0%) | 0 (0.0%) |
| 35 to 64 Years | 15 (6.9%) | 23 (13.8%) |
| 65 to 74 Years | 22 (26.2%) | 13 (9.9%) |
| 75 Years and over | 0 (0.0%) | 0 (0.0%) |
Disability Class: Vision Difficulty
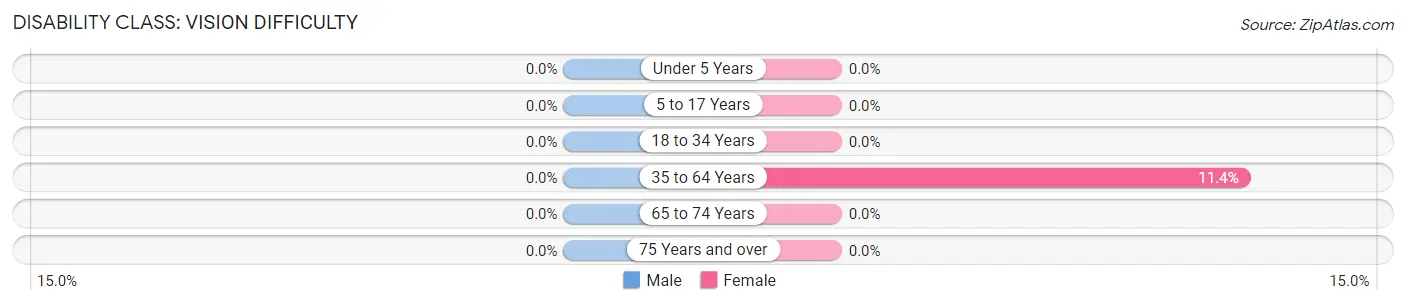
| Age Bracket | Male | Female |
| Under 5 Years | 0 (0.0%) | 0 (0.0%) |
| 5 to 17 Years | 0 (0.0%) | 0 (0.0%) |
| 18 to 34 Years | 0 (0.0%) | 0 (0.0%) |
| 35 to 64 Years | 0 (0.0%) | 19 (11.4%) |
| 65 to 74 Years | 0 (0.0%) | 0 (0.0%) |
| 75 Years and over | 0 (0.0%) | 0 (0.0%) |
Disability Class: Cognitive Difficulty
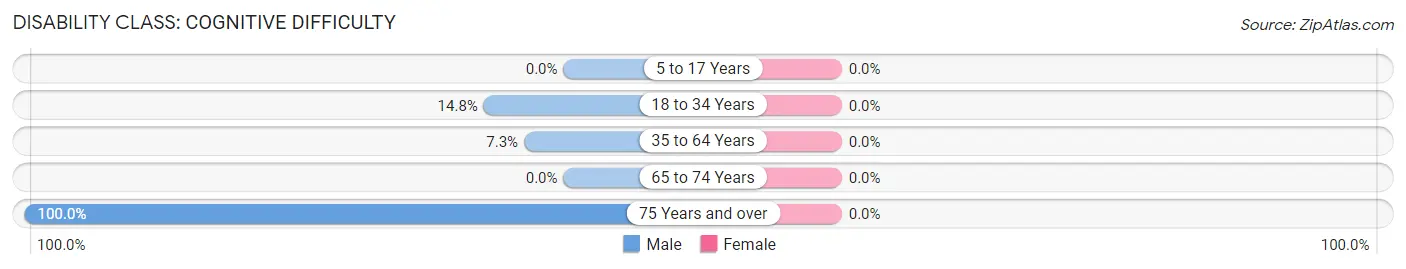
| Age Bracket | Male | Female |
| 5 to 17 Years | 0 (0.0%) | 0 (0.0%) |
| 18 to 34 Years | 21 (14.8%) | 0 (0.0%) |
| 35 to 64 Years | 16 (7.3%) | 0 (0.0%) |
| 65 to 74 Years | 0 (0.0%) | 0 (0.0%) |
| 75 Years and over | 49 (100.0%) | 0 (0.0%) |
Disability Class: Ambulatory Difficulty
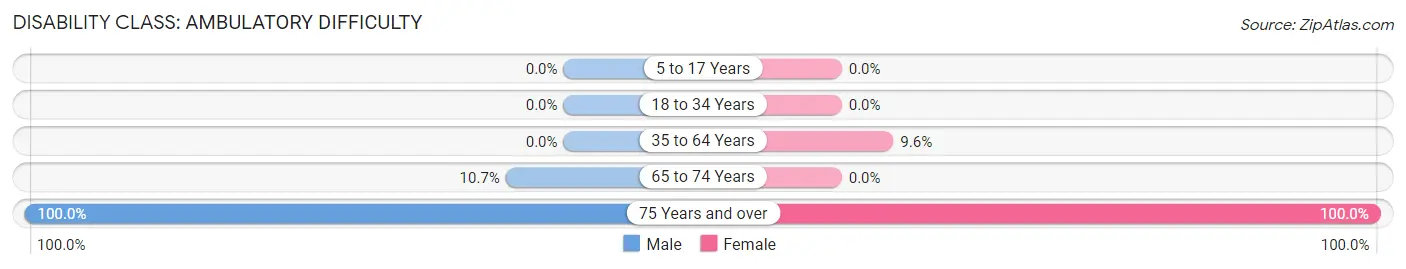
| Age Bracket | Male | Female |
| 5 to 17 Years | 0 (0.0%) | 0 (0.0%) |
| 18 to 34 Years | 0 (0.0%) | 0 (0.0%) |
| 35 to 64 Years | 0 (0.0%) | 16 (9.6%) |
| 65 to 74 Years | 9 (10.7%) | 0 (0.0%) |
| 75 Years and over | 49 (100.0%) | 14 (100.0%) |
Disability Class: Self-Care Difficulty
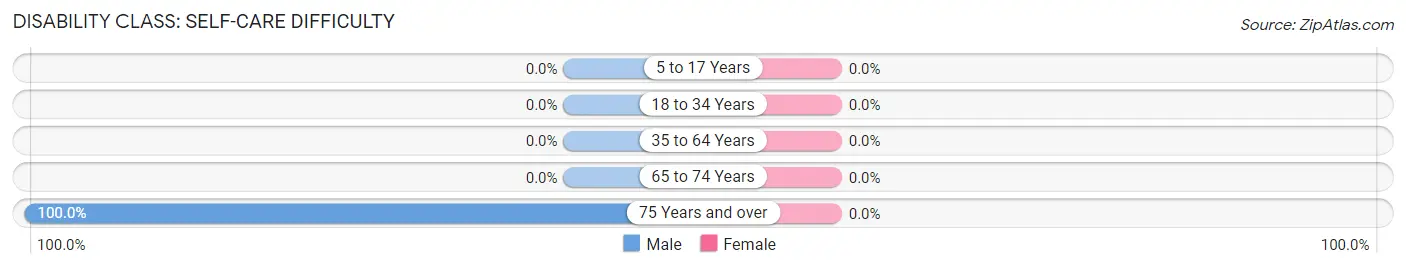
| Age Bracket | Male | Female |
| 5 to 17 Years | 0 (0.0%) | 0 (0.0%) |
| 18 to 34 Years | 0 (0.0%) | 0 (0.0%) |
| 35 to 64 Years | 0 (0.0%) | 0 (0.0%) |
| 65 to 74 Years | 0 (0.0%) | 0 (0.0%) |
| 75 Years and over | 49 (100.0%) | 0 (0.0%) |
Technology Access in Highpoint
Computing Device Access in Highpoint
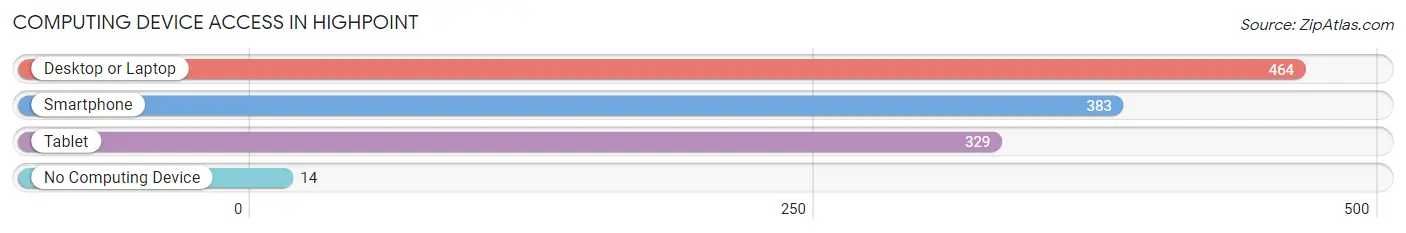
| Device Type | # Households | % Households |
| Desktop or Laptop | 464 | 94.3% |
| Smartphone | 383 | 77.8% |
| Tablet | 329 | 66.9% |
| No Computing Device | 14 | 2.9% |
| Total | 492 | 100.0% |
Internet Access in Highpoint
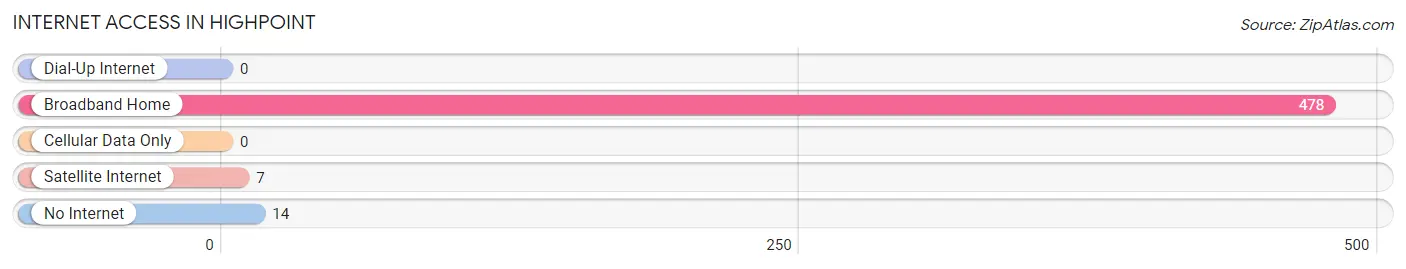
| Internet Type | # Households | % Households |
| Dial-Up Internet | 0 | 0.0% |
| Broadband Home | 478 | 97.2% |
| Cellular Data Only | 0 | 0.0% |
| Satellite Internet | 7 | 1.4% |
| No Internet | 14 | 2.9% |
| Total | 492 | 100.0% |
Highpoint Summary
Highpoint, Ohio is a small village located in the southeastern corner of the state, in the county of Highland. It is situated on the banks of the Little Miami River, and is surrounded by rolling hills and lush forests. The village has a population of just over 1,000 people, and is a quiet, rural community.
Highpoint was first settled in the early 1800s by a group of German immigrants. The village was originally known as “High Point”, and was named for its location on a high point of land overlooking the Little Miami River. The village was incorporated in 1845, and has remained a small, rural community ever since.
Geographically, Highpoint is located in the Appalachian Plateau region of Ohio. The village is situated on the banks of the Little Miami River, and is surrounded by rolling hills and lush forests. The village is located approximately 30 miles east of Cincinnati, and is within easy driving distance of several major cities, including Dayton, Columbus, and Cleveland.
Highpoint’s economy is largely based on agriculture and tourism. The village is home to several small farms, which produce a variety of crops, including corn, soybeans, and wheat. The village also has several small businesses, including a grocery store, a hardware store, and a few restaurants. In addition, Highpoint is home to several tourist attractions, including a historic covered bridge, a nature preserve, and a museum.
Highpoint’s demographics are largely reflective of the rural nature of the village. The population is predominantly white, with a small minority population. The median household income is slightly below the national average, and the poverty rate is slightly higher than the national average. The village is also home to a large elderly population, with nearly one-third of the population over the age of 65.
Highpoint is a small, rural village with a rich history and a unique culture. The village is home to a variety of attractions, including a historic covered bridge, a nature preserve, and a museum. The village is also home to several small businesses, and is a popular destination for tourists. Highpoint is a quiet, peaceful community, and is a great place to live and raise a family.
Common Questions
What is Per Capita Income in Highpoint?
Per Capita income in Highpoint is $45,498.
What is the Median Family Income in Highpoint?
Median Family Income in Highpoint is $80,685.
What is the Median Household income in Highpoint?
Median Household Income in Highpoint is $60,887.
What is Income or Wage Gap in Highpoint?
Income or Wage Gap in Highpoint is 9.7%.
Women in Highpoint earn 90.3 cents for every dollar earned by a man.
What is Inequality or Gini Index in Highpoint?
Inequality or Gini Index in Highpoint is 0.35.
What is the Total Population of Highpoint?
Total Population of Highpoint is 876.
What is the Total Male Population of Highpoint?
Total Male Population of Highpoint is 542.
What is the Total Female Population of Highpoint?
Total Female Population of Highpoint is 334.
What is the Ratio of Males per 100 Females in Highpoint?
There are 162.28 Males per 100 Females in Highpoint.
What is the Ratio of Females per 100 Males in Highpoint?
There are 61.62 Females per 100 Males in Highpoint.
What is the Median Population Age in Highpoint?
Median Population Age in Highpoint is 58.7 Years.
What is the Average Family Size in Highpoint
Average Family Size in Highpoint is 2.4 People.
What is the Average Household Size in Highpoint
Average Household Size in Highpoint is 1.8 People.
How Large is the Labor Force in Highpoint?
There are 504 People in the Labor Forcein in Highpoint.
What is the Percentage of People in the Labor Force in Highpoint?
60.9% of People are in the Labor Force in Highpoint.
What is the Unemployment Rate in Highpoint?
Unemployment Rate in Highpoint is 7.3%.