East Liverpool, OH Map & Demographics
East Liverpool Map
East Liverpool Overview
$20,649
PER CAPITA INCOME
$45,327
AVG FAMILY INCOME
$34,560
AVG HOUSEHOLD INCOME
34.9%
WAGE / INCOME GAP [ % ]
65.1¢/ $1
WAGE / INCOME GAP [ $ ]
$11,485
FAMILY INCOME DEFICIT
0.48
INEQUALITY / GINI INDEX
9,969
TOTAL POPULATION
4,934
MALE POPULATION
5,035
FEMALE POPULATION
97.99
MALES / 100 FEMALES
102.05
FEMALES / 100 MALES
37.4
MEDIAN AGE
3.2
AVG FAMILY SIZE
2.5
AVG HOUSEHOLD SIZE
4,003
LABOR FORCE [ PEOPLE ]
53.4%
PERCENT IN LABOR FORCE
6.1%
UNEMPLOYMENT RATE
East Liverpool Zip Codes
Income in East Liverpool
Income Overview in East Liverpool
Per Capita Income in East Liverpool is $20,649, while median incomes of families and households are $45,327 and $34,560 respectively.
| Characteristic | Number | Measure |
| Per Capita Income | 9,969 | $20,649 |
| Median Family Income | 2,357 | $45,327 |
| Mean Family Income | 2,357 | $61,159 |
| Median Household Income | 3,896 | $34,560 |
| Mean Household Income | 3,896 | $50,841 |
| Income Deficit | 2,357 | $11,485 |
| Wage / Income Gap (%) | 9,969 | 34.87% |
| Wage / Income Gap ($) | 9,969 | 65.13¢ per $1 |
| Gini / Inequality Index | 9,969 | 0.48 |
Earnings by Sex in East Liverpool
Average Earnings in East Liverpool are $32,582, $37,097 for men and $24,160 for women, a difference of 34.9%.
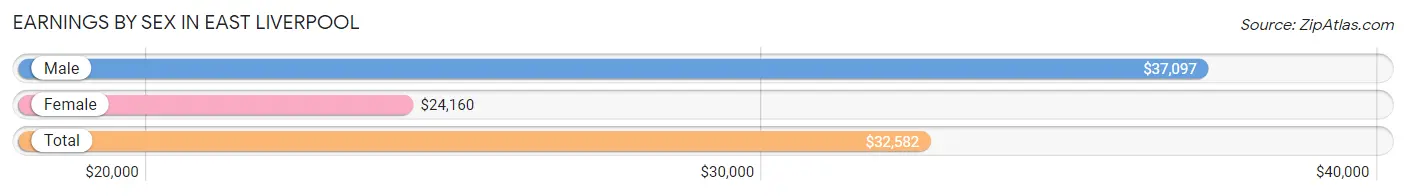
| Sex | Number | Average Earnings |
| Male | 2,015 (49.1%) | $37,097 |
| Female | 2,088 (50.9%) | $24,160 |
| Total | 4,103 (100.0%) | $32,582 |
Earnings by Sex by Income Bracket in East Liverpool
The most common earnings brackets in East Liverpool are $35,000 to $39,999 for men (247 | 12.3%) and $30,000 to $34,999 for women (409 | 19.6%).
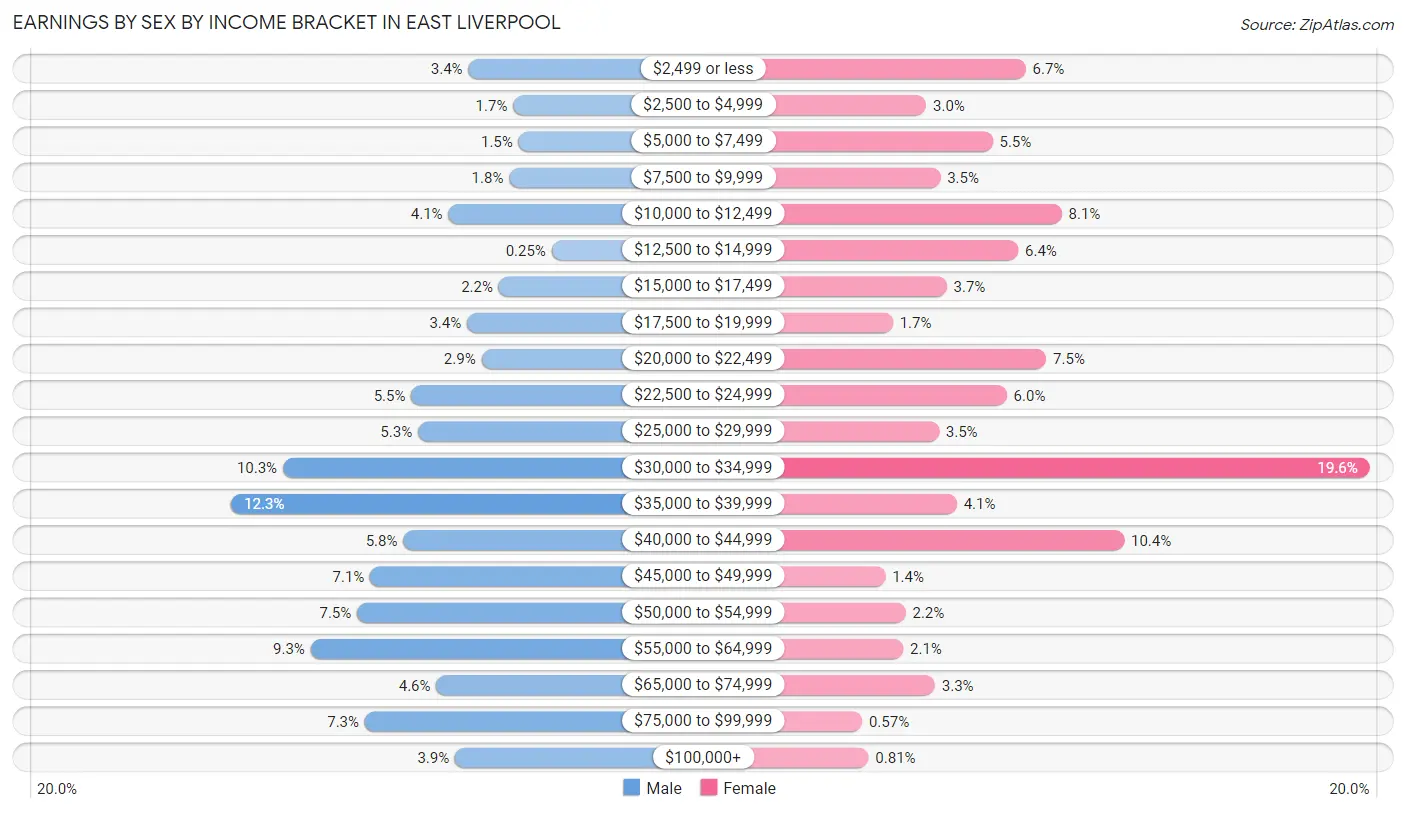
| Income | Male | Female |
| $2,499 or less | 68 (3.4%) | 140 (6.7%) |
| $2,500 to $4,999 | 34 (1.7%) | 62 (3.0%) |
| $5,000 to $7,499 | 30 (1.5%) | 114 (5.5%) |
| $7,500 to $9,999 | 37 (1.8%) | 73 (3.5%) |
| $10,000 to $12,499 | 83 (4.1%) | 168 (8.1%) |
| $12,500 to $14,999 | 5 (0.3%) | 134 (6.4%) |
| $15,000 to $17,499 | 45 (2.2%) | 78 (3.7%) |
| $17,500 to $19,999 | 69 (3.4%) | 36 (1.7%) |
| $20,000 to $22,499 | 58 (2.9%) | 156 (7.5%) |
| $22,500 to $24,999 | 111 (5.5%) | 125 (6.0%) |
| $25,000 to $29,999 | 106 (5.3%) | 72 (3.5%) |
| $30,000 to $34,999 | 208 (10.3%) | 409 (19.6%) |
| $35,000 to $39,999 | 247 (12.3%) | 86 (4.1%) |
| $40,000 to $44,999 | 117 (5.8%) | 217 (10.4%) |
| $45,000 to $49,999 | 142 (7.0%) | 30 (1.4%) |
| $50,000 to $54,999 | 152 (7.5%) | 46 (2.2%) |
| $55,000 to $64,999 | 187 (9.3%) | 44 (2.1%) |
| $65,000 to $74,999 | 92 (4.6%) | 69 (3.3%) |
| $75,000 to $99,999 | 146 (7.2%) | 12 (0.6%) |
| $100,000+ | 78 (3.9%) | 17 (0.8%) |
| Total | 2,015 (100.0%) | 2,088 (100.0%) |
Earnings by Sex by Educational Attainment in East Liverpool
Average earnings in East Liverpool are $38,926 for men and $29,306 for women, a difference of 24.7%. Men with an educational attainment of bachelor's degree enjoy the highest average annual earnings of $62,813, while those with high school diploma education earn the least with $35,096. Women with an educational attainment of graduate degree earn the most with the average annual earnings of $58,938, while those with high school diploma education have the smallest earnings of $24,788.
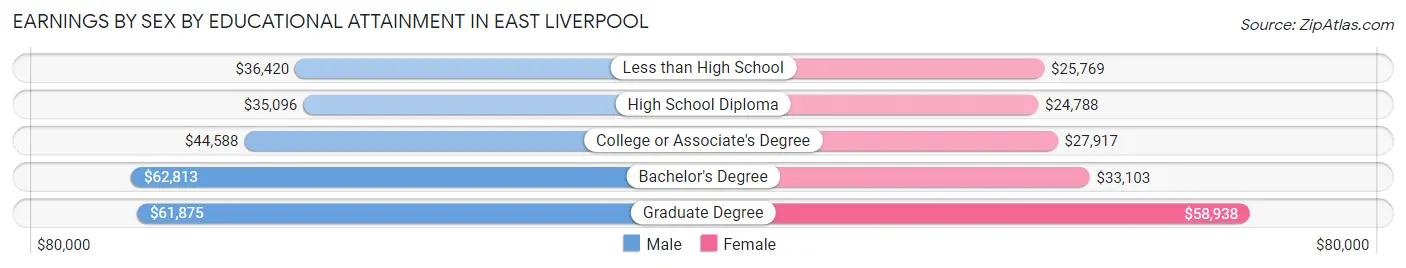
| Educational Attainment | Male Income | Female Income |
| Less than High School | $36,420 | $25,769 |
| High School Diploma | $35,096 | $24,788 |
| College or Associate's Degree | $44,588 | $27,917 |
| Bachelor's Degree | $62,813 | $33,103 |
| Graduate Degree | $61,875 | $58,938 |
| Total | $38,926 | $29,306 |
Family Income in East Liverpool
Family Income Brackets in East Liverpool
According to the East Liverpool family income data, there are 375 families falling into the $100,000 to $149,999 income range, which is the most common income bracket and makes up 15.9% of all families. Conversely, the $200,000+ income bracket is the least frequent group with only 26 families (1.1%) belonging to this category.
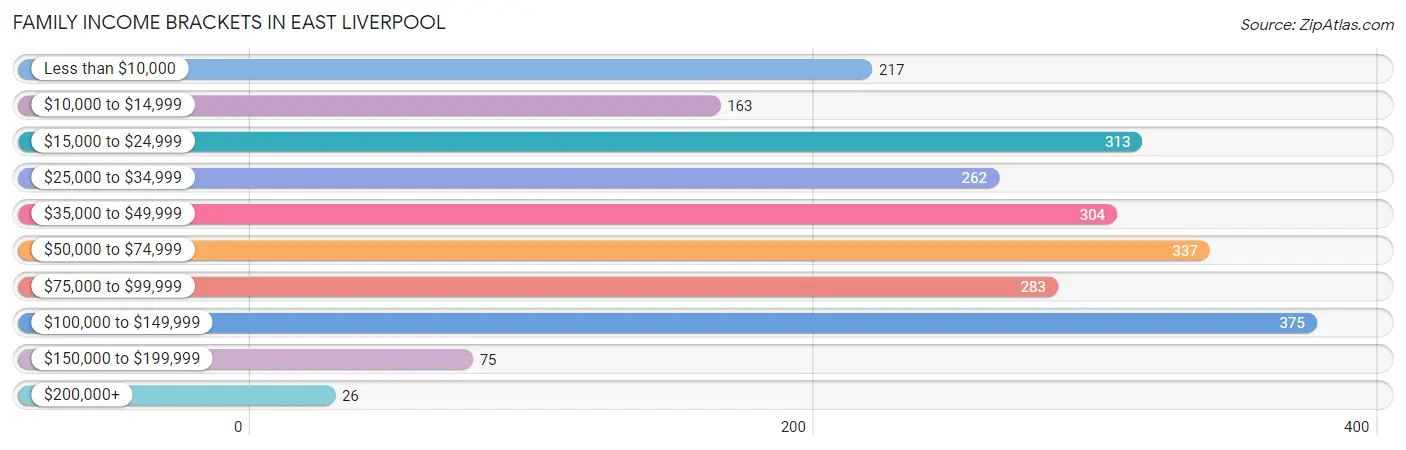
| Income Bracket | # Families | % Families |
| Less than $10,000 | 217 | 9.2% |
| $10,000 to $14,999 | 163 | 6.9% |
| $15,000 to $24,999 | 313 | 13.3% |
| $25,000 to $34,999 | 262 | 11.1% |
| $35,000 to $49,999 | 304 | 12.9% |
| $50,000 to $74,999 | 337 | 14.3% |
| $75,000 to $99,999 | 283 | 12.0% |
| $100,000 to $149,999 | 375 | 15.9% |
| $150,000 to $199,999 | 75 | 3.2% |
| $200,000+ | 26 | 1.1% |
Family Income by Famaliy Size in East Liverpool
4-person families (468 | 19.9%) account for the highest median family income in East Liverpool with $62,661 per family, while 2-person families (1,111 | 47.1%) have the highest median income of $20,625 per family member.
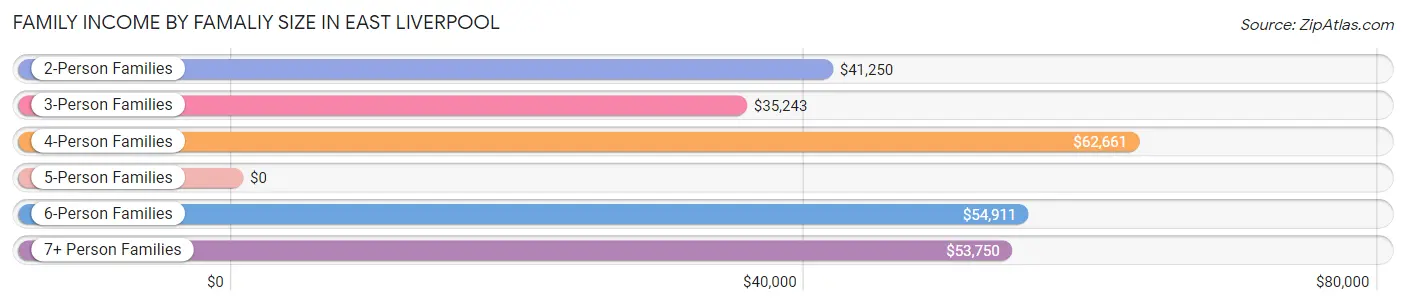
| Income Bracket | # Families | Median Income |
| 2-Person Families | 1,111 (47.1%) | $41,250 |
| 3-Person Families | 577 (24.5%) | $35,243 |
| 4-Person Families | 468 (19.9%) | $62,661 |
| 5-Person Families | 96 (4.1%) | $0 |
| 6-Person Families | 71 (3.0%) | $54,911 |
| 7+ Person Families | 34 (1.4%) | $53,750 |
| Total | 2,357 (100.0%) | $45,327 |
Family Income by Number of Earners in East Liverpool
The median family income in East Liverpool is $45,327, with families comprising 3+ earners (108) having the highest median family income of $122,813, while families with no earners (534) have the lowest median family income of $17,458, accounting for 4.6% and 22.7% of families, respectively.
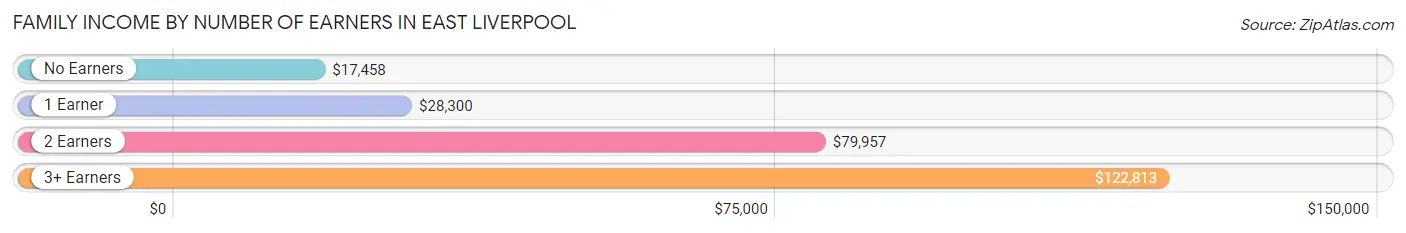
| Number of Earners | # Families | Median Income |
| No Earners | 534 (22.7%) | $17,458 |
| 1 Earner | 776 (32.9%) | $28,300 |
| 2 Earners | 939 (39.8%) | $79,957 |
| 3+ Earners | 108 (4.6%) | $122,813 |
| Total | 2,357 (100.0%) | $45,327 |
Household Income in East Liverpool
Household Income Brackets in East Liverpool
With 608 households falling in the category, the $15,000 to $24,999 income range is the most frequent in East Liverpool, accounting for 15.6% of all households. In contrast, only 39 households (1.0%) fall into the $200,000+ income bracket, making it the least populous group.
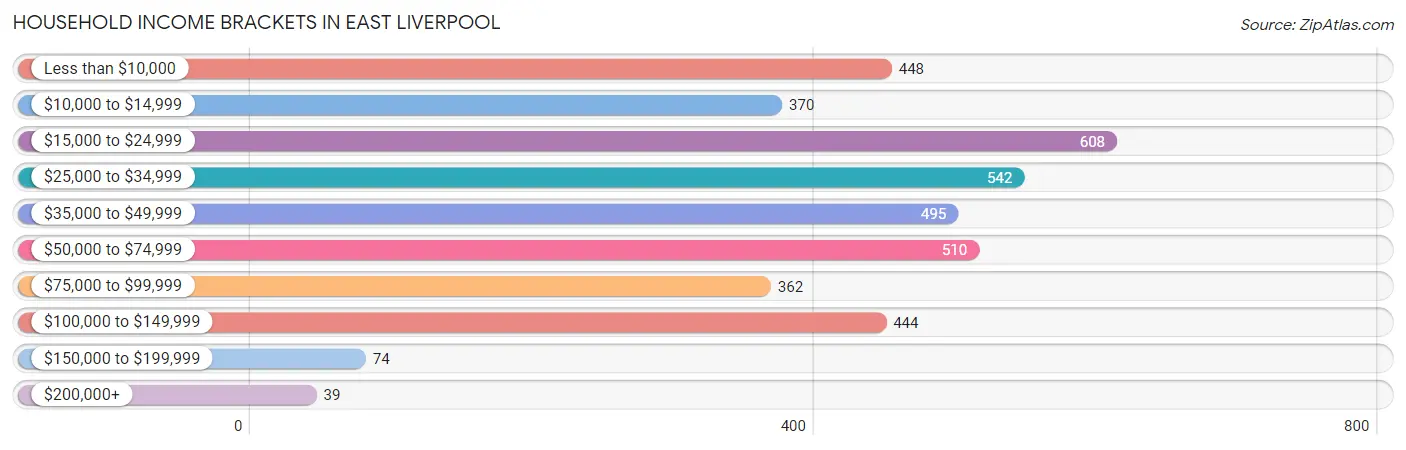
| Income Bracket | # Households | % Households |
| Less than $10,000 | 448 | 11.5% |
| $10,000 to $14,999 | 370 | 9.5% |
| $15,000 to $24,999 | 608 | 15.6% |
| $25,000 to $34,999 | 542 | 13.9% |
| $35,000 to $49,999 | 495 | 12.7% |
| $50,000 to $74,999 | 510 | 13.1% |
| $75,000 to $99,999 | 362 | 9.3% |
| $100,000 to $149,999 | 444 | 11.4% |
| $150,000 to $199,999 | 74 | 1.9% |
| $200,000+ | 39 | 1.0% |
Household Income by Householder Age in East Liverpool
The median household income in East Liverpool is $34,560, with the highest median household income of $38,857 found in the 25 to 44 years age bracket for the primary householder. A total of 1,153 households (29.6%) fall into this category. Meanwhile, the 15 to 24 years age bracket for the primary householder has the lowest median household income of $17,222, with 174 households (4.5%) in this group.
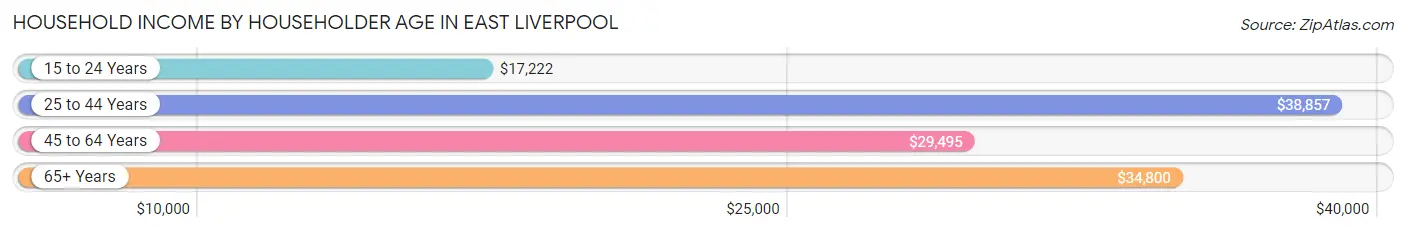
| Income Bracket | # Households | Median Income |
| 15 to 24 Years | 174 (4.5%) | $17,222 |
| 25 to 44 Years | 1,153 (29.6%) | $38,857 |
| 45 to 64 Years | 1,533 (39.4%) | $29,495 |
| 65+ Years | 1,036 (26.6%) | $34,800 |
| Total | 3,896 (100.0%) | $34,560 |
Poverty in East Liverpool
Income Below Poverty by Sex and Age in East Liverpool
With 25.0% poverty level for males and 38.2% for females among the residents of East Liverpool, 12 to 14 year old males and 5 year old females are the most vulnerable to poverty, with 130 males (49.4%) and 73 females (79.3%) in their respective age groups living below the poverty level.
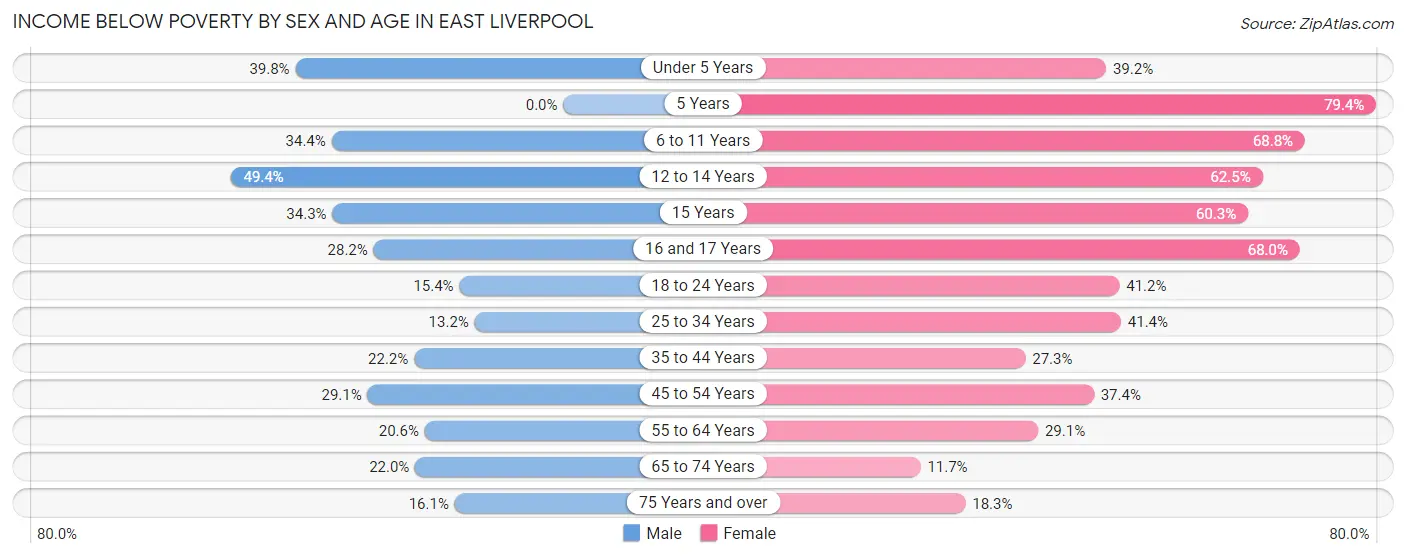
| Age Bracket | Male | Female |
| Under 5 Years | 142 (39.8%) | 164 (39.2%) |
| 5 Years | 0 (0.0%) | 73 (79.3%) |
| 6 to 11 Years | 181 (34.4%) | 229 (68.8%) |
| 12 to 14 Years | 130 (49.4%) | 208 (62.5%) |
| 15 Years | 12 (34.3%) | 38 (60.3%) |
| 16 and 17 Years | 20 (28.2%) | 68 (68.0%) |
| 18 to 24 Years | 56 (15.4%) | 143 (41.2%) |
| 25 to 34 Years | 81 (13.2%) | 334 (41.4%) |
| 35 to 44 Years | 121 (22.2%) | 112 (27.3%) |
| 45 to 54 Years | 171 (29.1%) | 214 (37.4%) |
| 55 to 64 Years | 162 (20.6%) | 178 (29.1%) |
| 65 to 74 Years | 132 (22.0%) | 68 (11.7%) |
| 75 Years and over | 20 (16.1%) | 42 (18.3%) |
| Total | 1,228 (25.0%) | 1,871 (38.2%) |
Income Above Poverty by Sex and Age in East Liverpool
According to the poverty statistics in East Liverpool, males aged 5 years and females aged 65 to 74 years are the age groups that are most secure financially, with 100.0% of males and 88.3% of females in these age groups living above the poverty line.
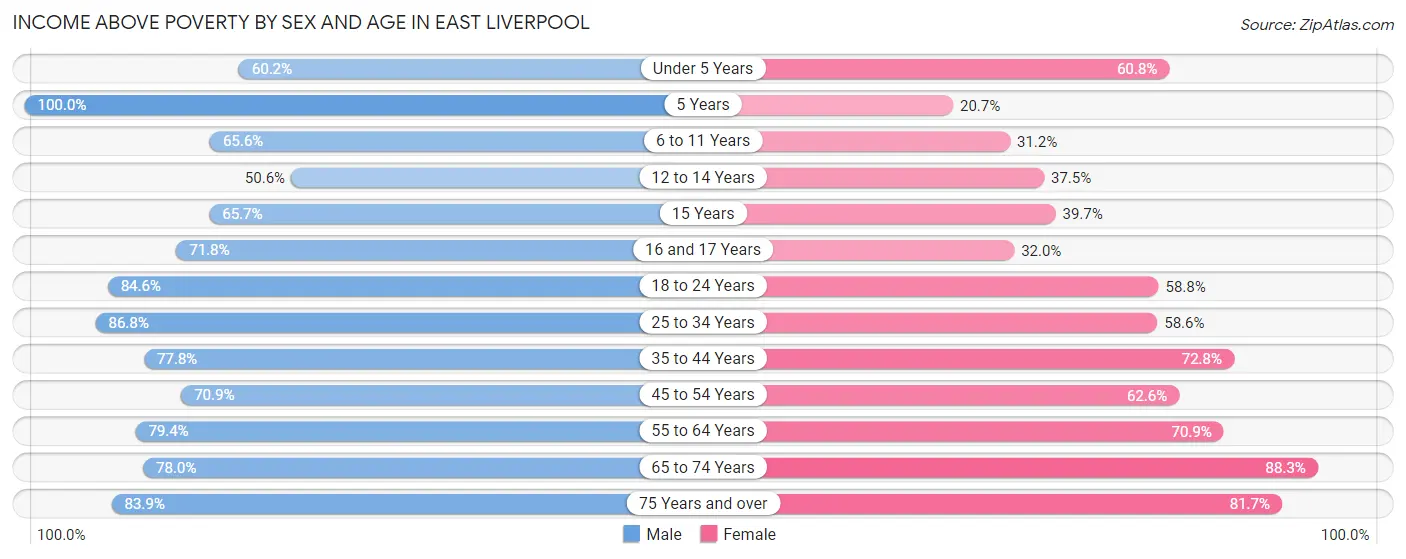
| Age Bracket | Male | Female |
| Under 5 Years | 215 (60.2%) | 254 (60.8%) |
| 5 Years | 30 (100.0%) | 19 (20.6%) |
| 6 to 11 Years | 345 (65.6%) | 104 (31.2%) |
| 12 to 14 Years | 133 (50.6%) | 125 (37.5%) |
| 15 Years | 23 (65.7%) | 25 (39.7%) |
| 16 and 17 Years | 51 (71.8%) | 32 (32.0%) |
| 18 to 24 Years | 307 (84.6%) | 204 (58.8%) |
| 25 to 34 Years | 534 (86.8%) | 472 (58.6%) |
| 35 to 44 Years | 425 (77.8%) | 299 (72.8%) |
| 45 to 54 Years | 417 (70.9%) | 358 (62.6%) |
| 55 to 64 Years | 625 (79.4%) | 433 (70.9%) |
| 65 to 74 Years | 468 (78.0%) | 514 (88.3%) |
| 75 Years and over | 104 (83.9%) | 187 (81.7%) |
| Total | 3,677 (75.0%) | 3,026 (61.8%) |
Income Below Poverty Among Married-Couple Families in East Liverpool
The poverty statistics for married-couple families in East Liverpool show that 8.3% or 116 of the total 1,401 families live below the poverty line. Families with 1 or 2 children have the highest poverty rate of 13.7%, comprising of 66 families. On the other hand, families with 3 or 4 children have the lowest poverty rate of 0.0%, which includes 0 families.
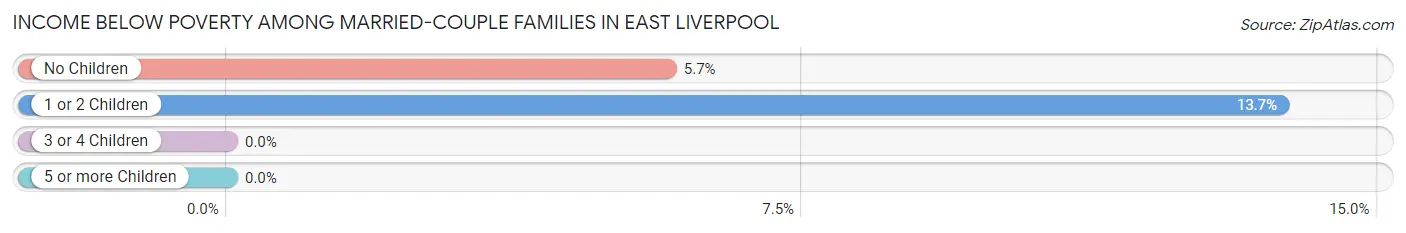
| Children | Above Poverty | Below Poverty |
| No Children | 823 (94.3%) | 50 (5.7%) |
| 1 or 2 Children | 415 (86.3%) | 66 (13.7%) |
| 3 or 4 Children | 45 (100.0%) | 0 (0.0%) |
| 5 or more Children | 2 (100.0%) | 0 (0.0%) |
| Total | 1,285 (91.7%) | 116 (8.3%) |
Income Below Poverty Among Single-Parent Households in East Liverpool
According to the poverty data in East Liverpool, 39.7% or 104 single-father households and 59.7% or 414 single-mother households are living below the poverty line. Among single-father households, those with 3 or 4 children have the highest poverty rate, with 7 households (100.0%) experiencing poverty. Likewise, among single-mother households, those with 5 or more children have the highest poverty rate, with 12 households (100.0%) falling below the poverty line.
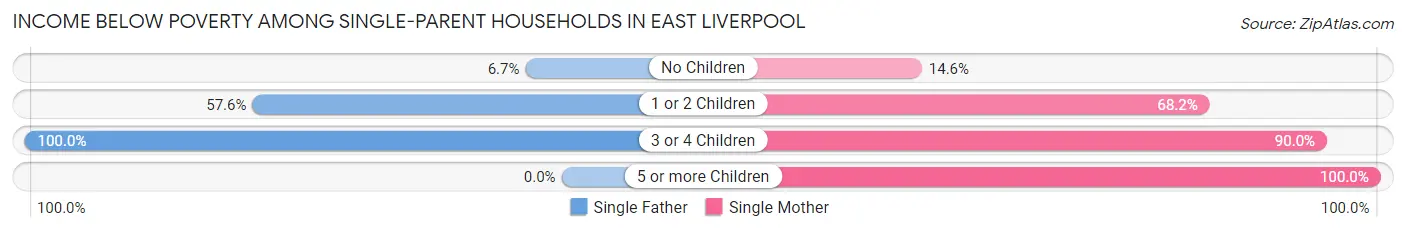
| Children | Single Father | Single Mother |
| No Children | 6 (6.7%) | 23 (14.6%) |
| 1 or 2 Children | 91 (57.6%) | 289 (68.2%) |
| 3 or 4 Children | 7 (100.0%) | 90 (90.0%) |
| 5 or more Children | 0 (0.0%) | 12 (100.0%) |
| Total | 104 (39.7%) | 414 (59.7%) |
Income Below Poverty Among Married-Couple vs Single-Parent Households in East Liverpool
The poverty data for East Liverpool shows that 116 of the married-couple family households (8.3%) and 518 of the single-parent households (54.2%) are living below the poverty level. Within the married-couple family households, those with 1 or 2 children have the highest poverty rate, with 66 households (13.7%) falling below the poverty line. Among the single-parent households, those with 3 or 4 children have the highest poverty rate, with 97 household (90.6%) living below poverty.
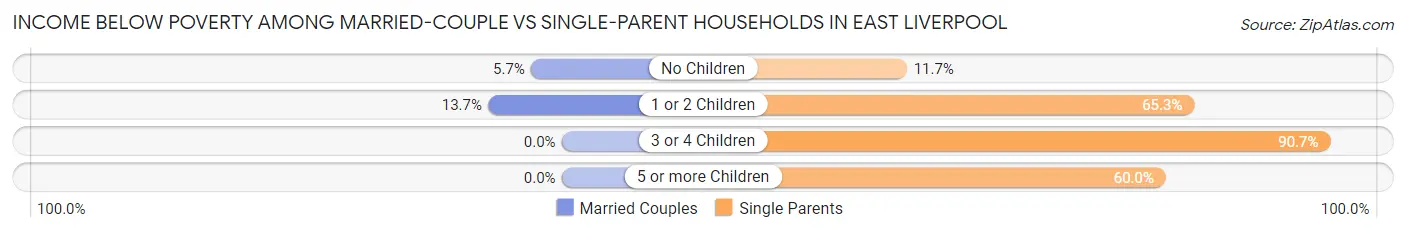
| Children | Married-Couple Families | Single-Parent Households |
| No Children | 50 (5.7%) | 29 (11.7%) |
| 1 or 2 Children | 66 (13.7%) | 380 (65.3%) |
| 3 or 4 Children | 0 (0.0%) | 97 (90.6%) |
| 5 or more Children | 0 (0.0%) | 12 (60.0%) |
| Total | 116 (8.3%) | 518 (54.2%) |
Race in East Liverpool
The most populous races in East Liverpool are White / Caucasian (8,499 | 85.3%), Two or more Races (961 | 9.6%), and Black / African American (442 | 4.4%).
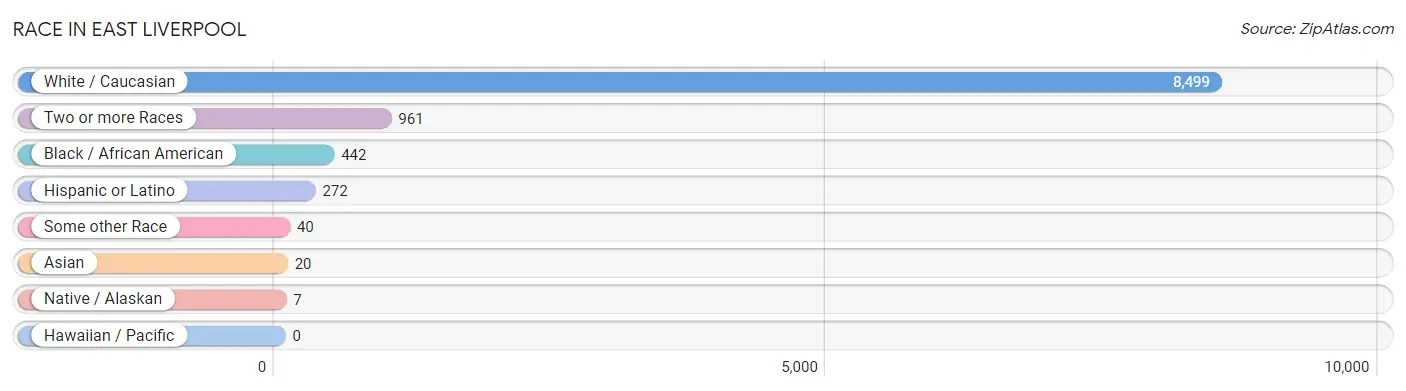
| Race | # Population | % Population |
| Asian | 20 | 0.2% |
| Black / African American | 442 | 4.4% |
| Hawaiian / Pacific | 0 | 0.0% |
| Hispanic or Latino | 272 | 2.7% |
| Native / Alaskan | 7 | 0.1% |
| White / Caucasian | 8,499 | 85.3% |
| Two or more Races | 961 | 9.6% |
| Some other Race | 40 | 0.4% |
| Total | 9,969 | 100.0% |
Ancestry in East Liverpool
The most populous ancestries reported in East Liverpool are German (1,763 | 17.7%), Irish (1,532 | 15.4%), English (1,163 | 11.7%), Italian (1,074 | 10.8%), and American (809 | 8.1%), together accounting for 63.6% of all East Liverpool residents.
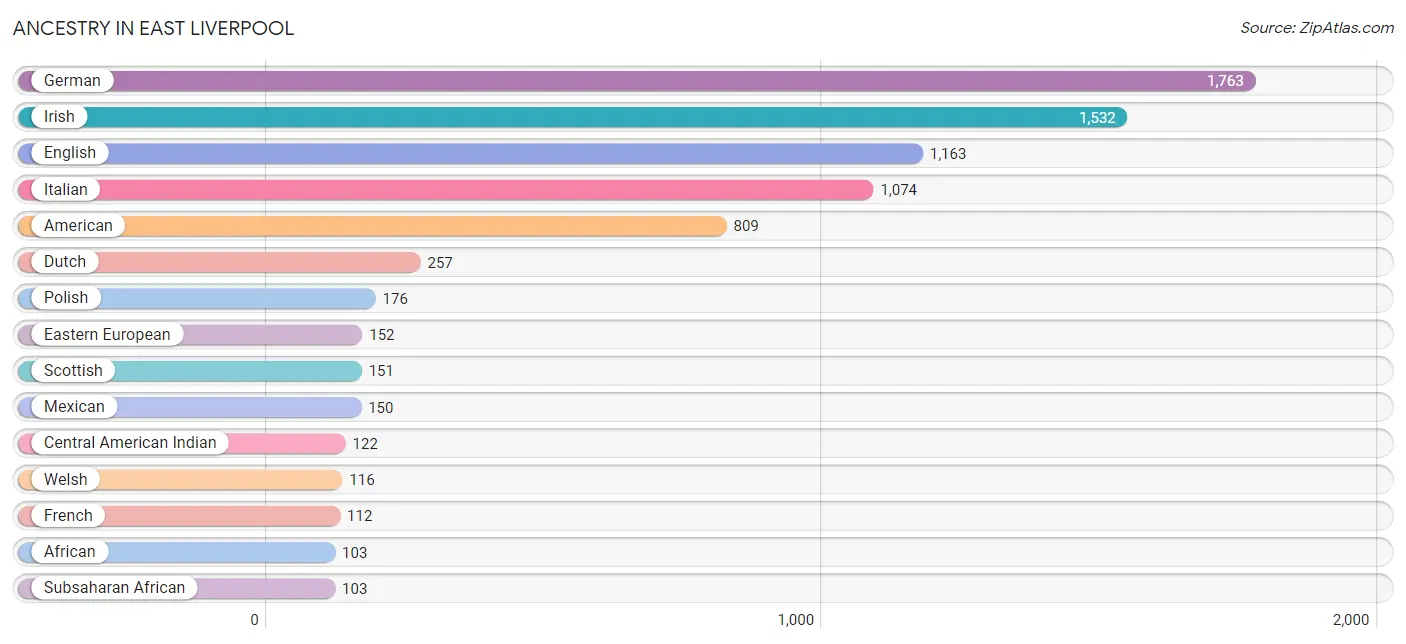
| Ancestry | # Population | % Population |
| African | 103 | 1.0% |
| American | 809 | 8.1% |
| Apache | 7 | 0.1% |
| Austrian | 13 | 0.1% |
| Central American Indian | 122 | 1.2% |
| Cherokee | 10 | 0.1% |
| Croatian | 31 | 0.3% |
| Czech | 38 | 0.4% |
| Danish | 16 | 0.2% |
| Dutch | 257 | 2.6% |
| Eastern European | 152 | 1.5% |
| English | 1,163 | 11.7% |
| European | 60 | 0.6% |
| French | 112 | 1.1% |
| German | 1,763 | 17.7% |
| Greek | 57 | 0.6% |
| Hungarian | 39 | 0.4% |
| Irish | 1,532 | 15.4% |
| Italian | 1,074 | 10.8% |
| Laotian | 44 | 0.4% |
| Lithuanian | 3 | 0.0% |
| Mexican | 150 | 1.5% |
| Norwegian | 37 | 0.4% |
| Polish | 176 | 1.8% |
| Russian | 54 | 0.5% |
| Scotch-Irish | 78 | 0.8% |
| Scottish | 151 | 1.5% |
| Serbian | 37 | 0.4% |
| Slavic | 8 | 0.1% |
| Slovak | 52 | 0.5% |
| Sri Lankan | 20 | 0.2% |
| Subsaharan African | 103 | 1.0% |
| Swedish | 34 | 0.3% |
| Ukrainian | 6 | 0.1% |
| Welsh | 116 | 1.2% | View All 35 Rows |
Immigrants in East Liverpool
The most numerous immigrant groups reported in East Liverpool came from Asia (46 | 0.5%), Indonesia (26 | 0.3%), South Eastern Asia (26 | 0.3%), India (20 | 0.2%), and South Central Asia (20 | 0.2%), together accounting for 1.4% of all East Liverpool residents.
| Immigration Origin | # Population | % Population |
| Asia | 46 | 0.5% |
| Europe | 12 | 0.1% |
| India | 20 | 0.2% |
| Indonesia | 26 | 0.3% |
| Ireland | 12 | 0.1% |
| Northern Europe | 12 | 0.1% |
| South Central Asia | 20 | 0.2% |
| South Eastern Asia | 26 | 0.3% | View All 8 Rows |
Sex and Age in East Liverpool
Sex and Age in East Liverpool
The most populous age groups in East Liverpool are 60 to 64 Years (450 | 9.1%) for men and 30 to 34 Years (425 | 8.4%) for women.
| Age Bracket | Male | Female |
| Under 5 Years | 357 (7.2%) | 418 (8.3%) |
| 5 to 9 Years | 439 (8.9%) | 392 (7.8%) |
| 10 to 14 Years | 387 (7.8%) | 381 (7.6%) |
| 15 to 19 Years | 223 (4.5%) | 239 (4.8%) |
| 20 to 24 Years | 246 (5.0%) | 271 (5.4%) |
| 25 to 29 Years | 313 (6.3%) | 381 (7.6%) |
| 30 to 34 Years | 302 (6.1%) | 425 (8.4%) |
| 35 to 39 Years | 324 (6.6%) | 169 (3.4%) |
| 40 to 44 Years | 222 (4.5%) | 242 (4.8%) |
| 45 to 49 Years | 305 (6.2%) | 248 (4.9%) |
| 50 to 54 Years | 283 (5.7%) | 324 (6.4%) |
| 55 to 59 Years | 337 (6.8%) | 296 (5.9%) |
| 60 to 64 Years | 450 (9.1%) | 315 (6.3%) |
| 65 to 69 Years | 444 (9.0%) | 410 (8.1%) |
| 70 to 74 Years | 171 (3.5%) | 222 (4.4%) |
| 75 to 79 Years | 70 (1.4%) | 118 (2.3%) |
| 80 to 84 Years | 27 (0.5%) | 85 (1.7%) |
| 85 Years and over | 34 (0.7%) | 99 (2.0%) |
| Total | 4,934 (100.0%) | 5,035 (100.0%) |
Families and Households in East Liverpool
Median Family Size in East Liverpool
The median family size in East Liverpool is 3.25 persons per family, with single female/mother families (694 | 29.4%) accounting for the largest median family size of 3.68 persons per family. On the other hand, single male/father families (262 | 11.1%) represent the smallest median family size with 2.60 persons per family.
| Family Type | # Families | Family Size |
| Married-Couple | 1,401 (59.4%) | 3.17 |
| Single Male/Father | 262 (11.1%) | 2.60 |
| Single Female/Mother | 694 (29.4%) | 3.68 |
| Total Families | 2,357 (100.0%) | 3.25 |
Median Household Size in East Liverpool
The median household size in East Liverpool is 2.52 persons per household, with single female/mother households (694 | 17.8%) accounting for the largest median household size of 3.91 persons per household. non-family households (1,539 | 39.5%) represent the smallest median household size with 1.17 persons per household.
| Household Type | # Households | Household Size |
| Married-Couple | 1,401 (36.0%) | 3.23 |
| Single Male/Father | 262 (6.7%) | 2.97 |
| Single Female/Mother | 694 (17.8%) | 3.91 |
| Non-family | 1,539 (39.5%) | 1.17 |
| Total Households | 3,896 (100.0%) | 2.52 |
Household Size by Marriage Status in East Liverpool
Out of a total of 3,896 households in East Liverpool, 2,357 (60.5%) are family households, while 1,539 (39.5%) are nonfamily households. The most numerous type of family households are 2-person households, comprising 1,057, and the most common type of nonfamily households are 1-person households, comprising 1,325.
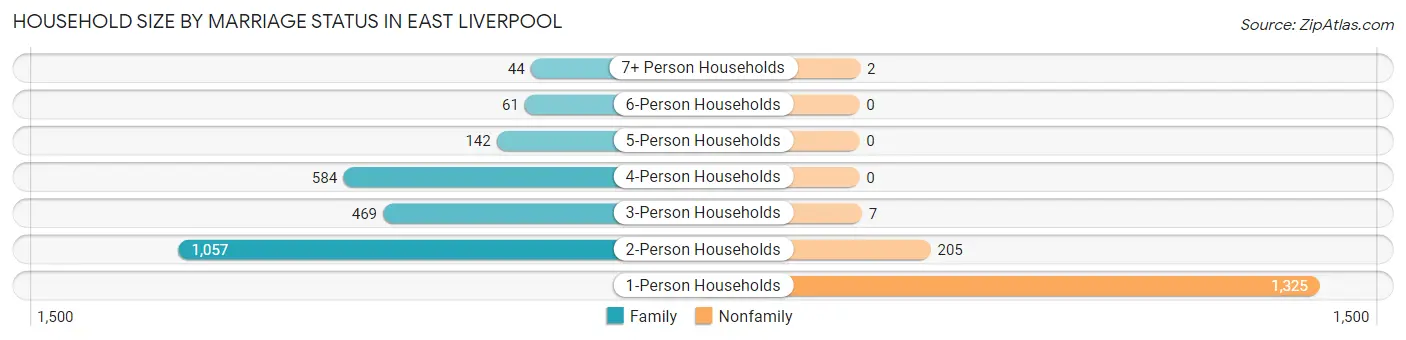
| Household Size | Family Households | Nonfamily Households |
| 1-Person Households | - | 1,325 (34.0%) |
| 2-Person Households | 1,057 (27.1%) | 205 (5.3%) |
| 3-Person Households | 469 (12.0%) | 7 (0.2%) |
| 4-Person Households | 584 (15.0%) | 0 (0.0%) |
| 5-Person Households | 142 (3.6%) | 0 (0.0%) |
| 6-Person Households | 61 (1.6%) | 0 (0.0%) |
| 7+ Person Households | 44 (1.1%) | 2 (0.1%) |
| Total | 2,357 (60.5%) | 1,539 (39.5%) |
Female Fertility in East Liverpool
Fertility by Age in East Liverpool
Average fertility rate in East Liverpool is 152.0 births per 1,000 women. Women in the age bracket of 20 to 34 years have the highest fertility rate with 260.0 births per 1,000 women. Women in the age bracket of 20 to 34 years acount for 92.7% of all women with births.
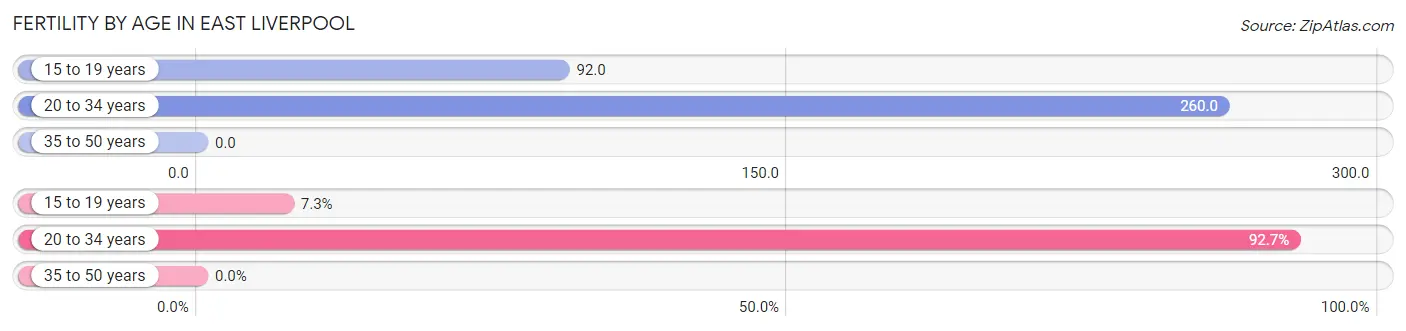
| Age Bracket | Women with Births | Births / 1,000 Women |
| 15 to 19 years | 22 (7.3%) | 92.0 |
| 20 to 34 years | 280 (92.7%) | 260.0 |
| 35 to 50 years | 0 (0.0%) | 0.0 |
| Total | 302 (100.0%) | 152.0 |
Fertility by Age by Marriage Status in East Liverpool
57.0% of women with births (302) in East Liverpool are married. The highest percentage of unmarried women with births falls into 15 to 19 years age bracket with 100.0% of them unmarried at the time of birth, while the lowest percentage of unmarried women with births belong to 20 to 34 years age bracket with 38.6% of them unmarried.
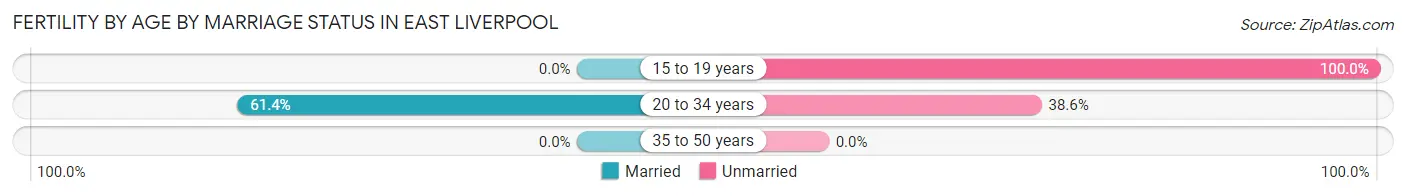
| Age Bracket | Married | Unmarried |
| 15 to 19 years | 0 (0.0%) | 22 (100.0%) |
| 20 to 34 years | 172 (61.4%) | 108 (38.6%) |
| 35 to 50 years | 0 (0.0%) | 0 (0.0%) |
| Total | 172 (57.0%) | 130 (43.0%) |
Fertility by Education in East Liverpool
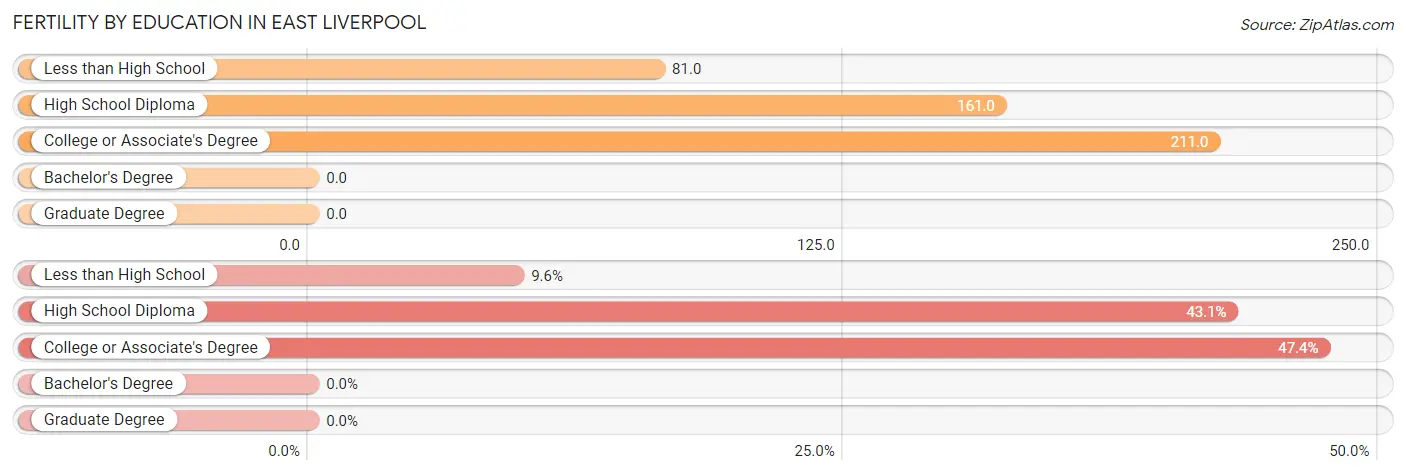
| Educational Attainment | Women with Births | Births / 1,000 Women |
| Less than High School | 29 (9.6%) | 81.0 |
| High School Diploma | 130 (43.0%) | 161.0 |
| College or Associate's Degree | 143 (47.3%) | 211.0 |
| Bachelor's Degree | 0 (0.0%) | 0.0 |
| Graduate Degree | 0 (0.0%) | 0.0 |
| Total | 302 (100.0%) | 152.0 |
Fertility by Education by Marriage Status in East Liverpool
43.0% of women with births in East Liverpool are unmarried. Women with the educational attainment of college or associate's degree are most likely to be married with 80.4% of them married at childbirth, while women with the educational attainment of less than high school are least likely to be married with 100.0% of them unmarried at childbirth.
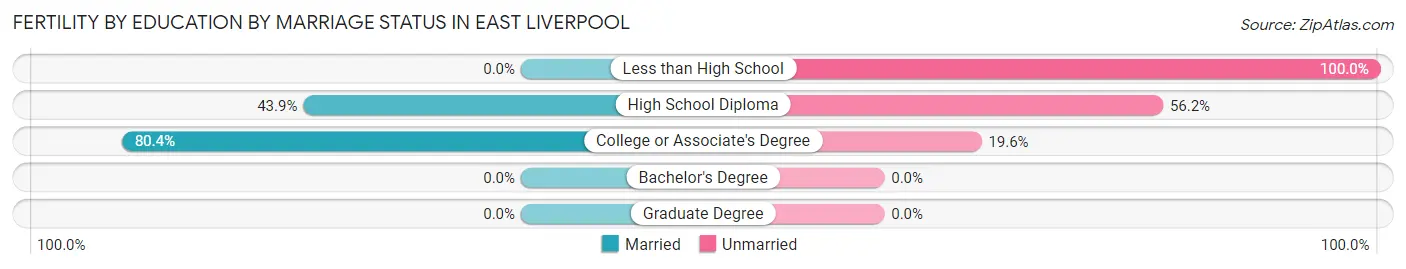
| Educational Attainment | Married | Unmarried |
| Less than High School | 0 (0.0%) | 29 (100.0%) |
| High School Diploma | 57 (43.9%) | 73 (56.1%) |
| College or Associate's Degree | 115 (80.4%) | 28 (19.6%) |
| Bachelor's Degree | 0 (0.0%) | 0 (0.0%) |
| Graduate Degree | 0 (0.0%) | 0 (0.0%) |
| Total | 172 (57.0%) | 130 (43.0%) |
Employment Characteristics in East Liverpool
Employment by Class of Employer in East Liverpool
Among the 3,643 employed individuals in East Liverpool, private company employees (2,793 | 76.7%), not-for-profit organizations (265 | 7.3%), and state government employees (197 | 5.4%) make up the most common classes of employment.
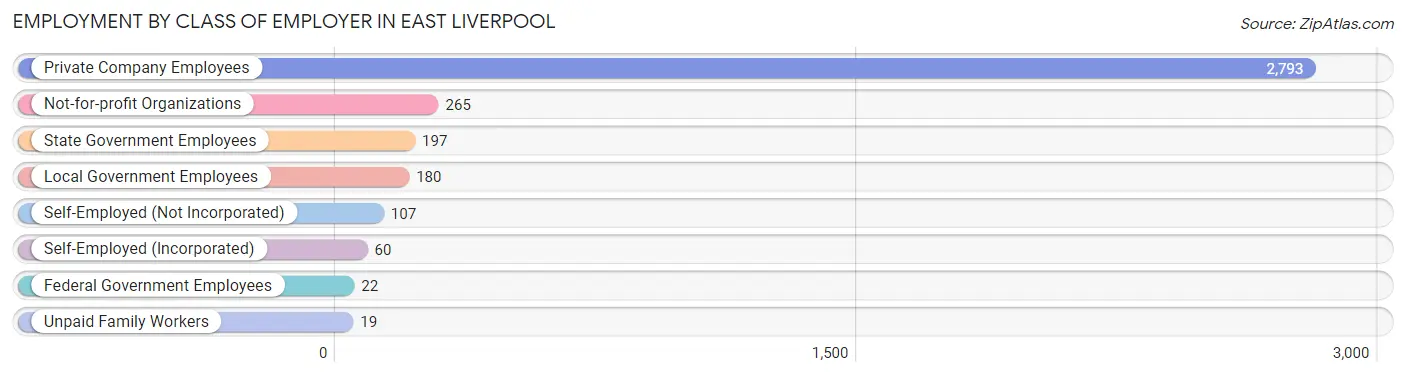
| Employer Class | # Employees | % Employees |
| Private Company Employees | 2,793 | 76.7% |
| Self-Employed (Incorporated) | 60 | 1.7% |
| Self-Employed (Not Incorporated) | 107 | 2.9% |
| Not-for-profit Organizations | 265 | 7.3% |
| Local Government Employees | 180 | 4.9% |
| State Government Employees | 197 | 5.4% |
| Federal Government Employees | 22 | 0.6% |
| Unpaid Family Workers | 19 | 0.5% |
| Total | 3,643 | 100.0% |
Employment Status by Age in East Liverpool
According to the labor force statistics for East Liverpool, out of the total population over 16 years of age (7,497), 53.4% or 4,003 individuals are in the labor force, with 6.1% or 244 of them unemployed. The age group with the highest labor force participation rate is 30 to 34 years, with 81.8% or 595 individuals in the labor force. Within the labor force, the 75 years and over age range has the highest percentage of unemployed individuals, with 75.0% or 9 of them being unemployed.
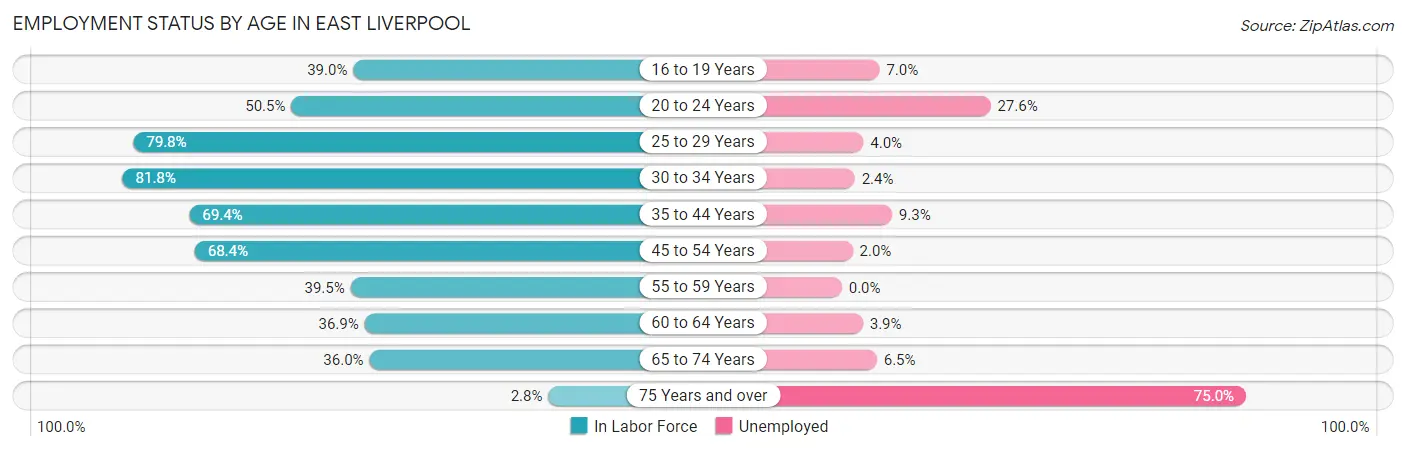
| Age Bracket | In Labor Force | Unemployed |
| 16 to 19 Years | 142 (39.0%) | 10 (7.0%) |
| 20 to 24 Years | 261 (50.5%) | 72 (27.6%) |
| 25 to 29 Years | 554 (79.8%) | 22 (4.0%) |
| 30 to 34 Years | 595 (81.8%) | 14 (2.4%) |
| 35 to 44 Years | 664 (69.4%) | 62 (9.3%) |
| 45 to 54 Years | 793 (68.4%) | 16 (2.0%) |
| 55 to 59 Years | 250 (39.5%) | 0 (0.0%) |
| 60 to 64 Years | 282 (36.9%) | 11 (3.9%) |
| 65 to 74 Years | 449 (36.0%) | 29 (6.5%) |
| 75 Years and over | 12 (2.8%) | 9 (75.0%) |
| Total | 4,003 (53.4%) | 244 (6.1%) |
Employment Status by Educational Attainment in East Liverpool
According to labor force statistics for East Liverpool, 63.6% of individuals (3,139) out of the total population between 25 and 64 years of age (4,936) are in the labor force, with 4.0% or 126 of them being unemployed. The group with the highest labor force participation rate are those with the educational attainment of bachelor's degree or higher, with 78.0% or 343 individuals in the labor force. Within the labor force, individuals with less than high school education have the highest percentage of unemployment, with 10.7% or 21 of them being unemployed.
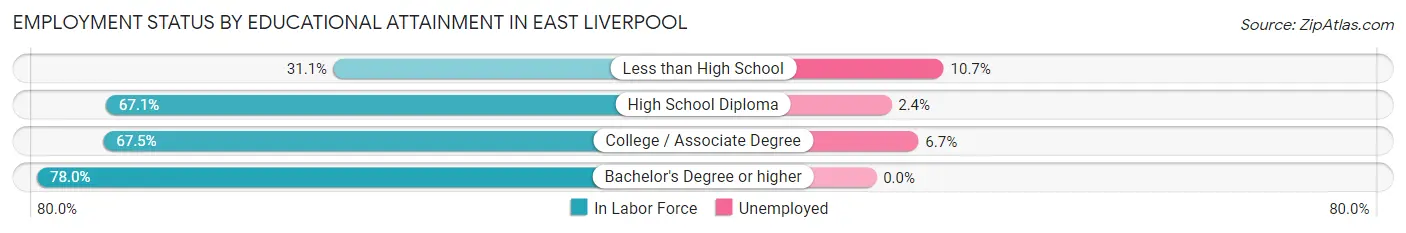
| Educational Attainment | In Labor Force | Unemployed |
| Less than High School | 196 (31.1%) | 68 (10.7%) |
| High School Diploma | 1,635 (67.1%) | 58 (2.4%) |
| College / Associate Degree | 965 (67.5%) | 96 (6.7%) |
| Bachelor's Degree or higher | 343 (78.0%) | 0 (0.0%) |
| Total | 3,139 (63.6%) | 197 (4.0%) |
Employment Occupations by Sex in East Liverpool
Management, Business, Science and Arts Occupations
The most common Management, Business, Science and Arts occupations in East Liverpool are Health Diagnosing & Treating (284 | 7.6%), Community & Social Service (155 | 4.1%), Computers, Engineering & Science (100 | 2.7%), Health Technologists (99 | 2.6%), and Management (94 | 2.5%).
Management, Business, Science and Arts Occupations by Sex
Within the Management, Business, Science and Arts occupations in East Liverpool, the most male-oriented occupations are Computers & Mathematics (100.0%), Life, Physical & Social Science (100.0%), and Arts, Media & Entertainment (100.0%), while the most female-oriented occupations are Legal Services & Support (100.0%), Health Diagnosing & Treating (83.5%), and Business & Financial (66.7%).
| Occupation | Male | Female |
| Management | 35 (37.2%) | 59 (62.8%) |
| Business & Financial | 9 (33.3%) | 18 (66.7%) |
| Computers, Engineering & Science | 92 (92.0%) | 8 (8.0%) |
| Computers & Mathematics | 17 (100.0%) | 0 (0.0%) |
| Architecture & Engineering | 41 (83.7%) | 8 (16.3%) |
| Life, Physical & Social Science | 34 (100.0%) | 0 (0.0%) |
| Community & Social Service | 57 (36.8%) | 98 (63.2%) |
| Education, Arts & Media | 18 (40.0%) | 27 (60.0%) |
| Legal Services & Support | 0 (0.0%) | 18 (100.0%) |
| Education Instruction & Library | 32 (37.7%) | 53 (62.4%) |
| Arts, Media & Entertainment | 7 (100.0%) | 0 (0.0%) |
| Health Diagnosing & Treating | 47 (16.6%) | 237 (83.5%) |
| Health Technologists | 42 (42.4%) | 57 (57.6%) |
| Total (Category) | 240 (36.4%) | 420 (63.6%) |
| Total (Overall) | 1,829 (48.7%) | 1,928 (51.3%) |
Services Occupations
The most common Services occupations in East Liverpool are Food Preparation & Serving (403 | 10.7%), Healthcare Support (251 | 6.7%), Security & Protection (199 | 5.3%), Personal Care & Service (117 | 3.1%), and Law Enforcement (112 | 3.0%).
Services Occupations by Sex
Within the Services occupations in East Liverpool, the most male-oriented occupations are Law Enforcement (100.0%), Security & Protection (88.4%), and Cleaning & Maintenance (84.3%), while the most female-oriented occupations are Personal Care & Service (100.0%), Healthcare Support (96.4%), and Food Preparation & Serving (68.0%).
| Occupation | Male | Female |
| Healthcare Support | 9 (3.6%) | 242 (96.4%) |
| Security & Protection | 176 (88.4%) | 23 (11.6%) |
| Firefighting & Prevention | 64 (73.6%) | 23 (26.4%) |
| Law Enforcement | 112 (100.0%) | 0 (0.0%) |
| Food Preparation & Serving | 129 (32.0%) | 274 (68.0%) |
| Cleaning & Maintenance | 86 (84.3%) | 16 (15.7%) |
| Personal Care & Service | 0 (0.0%) | 117 (100.0%) |
| Total (Category) | 400 (37.3%) | 672 (62.7%) |
| Total (Overall) | 1,829 (48.7%) | 1,928 (51.3%) |
Sales and Office Occupations
The most common Sales and Office occupations in East Liverpool are Office & Administration (546 | 14.5%), and Sales & Related (317 | 8.4%).
Sales and Office Occupations by Sex
| Occupation | Male | Female |
| Sales & Related | 111 (35.0%) | 206 (65.0%) |
| Office & Administration | 89 (16.3%) | 457 (83.7%) |
| Total (Category) | 200 (23.2%) | 663 (76.8%) |
| Total (Overall) | 1,829 (48.7%) | 1,928 (51.3%) |
Natural Resources, Construction and Maintenance Occupations
The most common Natural Resources, Construction and Maintenance occupations in East Liverpool are Construction & Extraction (157 | 4.2%), Installation, Maintenance & Repair (71 | 1.9%), and Farming, Fishing & Forestry (18 | 0.5%).
Natural Resources, Construction and Maintenance Occupations by Sex
| Occupation | Male | Female |
| Farming, Fishing & Forestry | 9 (50.0%) | 9 (50.0%) |
| Construction & Extraction | 157 (100.0%) | 0 (0.0%) |
| Installation, Maintenance & Repair | 71 (100.0%) | 0 (0.0%) |
| Total (Category) | 237 (96.3%) | 9 (3.7%) |
| Total (Overall) | 1,829 (48.7%) | 1,928 (51.3%) |
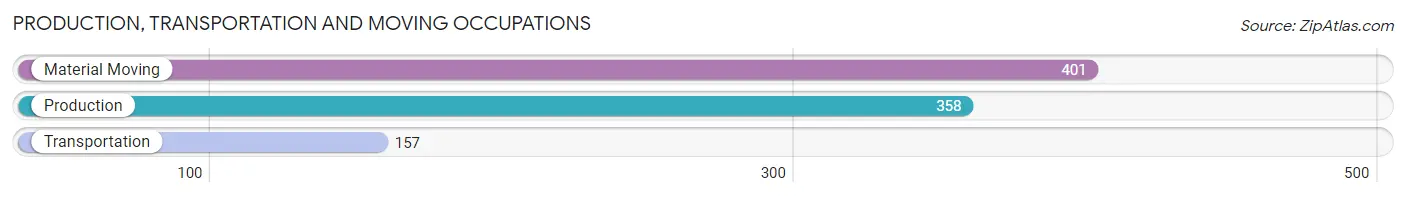
Production, Transportation and Moving Occupations
The most common Production, Transportation and Moving occupations in East Liverpool are Material Moving (401 | 10.7%), Production (358 | 9.5%), and Transportation (157 | 4.2%).
Production, Transportation and Moving Occupations by Sex
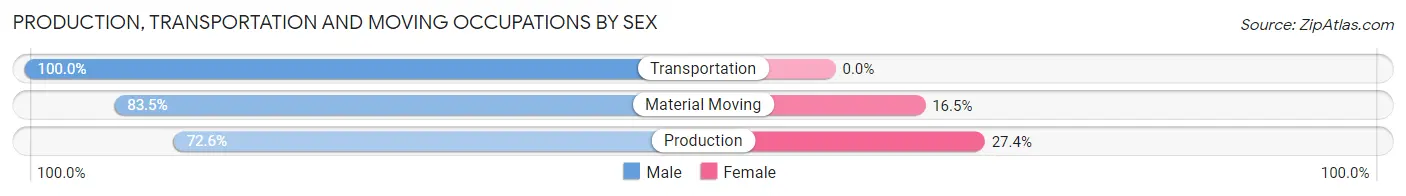
| Occupation | Male | Female |
| Production | 260 (72.6%) | 98 (27.4%) |
| Transportation | 157 (100.0%) | 0 (0.0%) |
| Material Moving | 335 (83.5%) | 66 (16.5%) |
| Total (Category) | 752 (82.1%) | 164 (17.9%) |
| Total (Overall) | 1,829 (48.7%) | 1,928 (51.3%) |
Employment Industries by Sex in East Liverpool
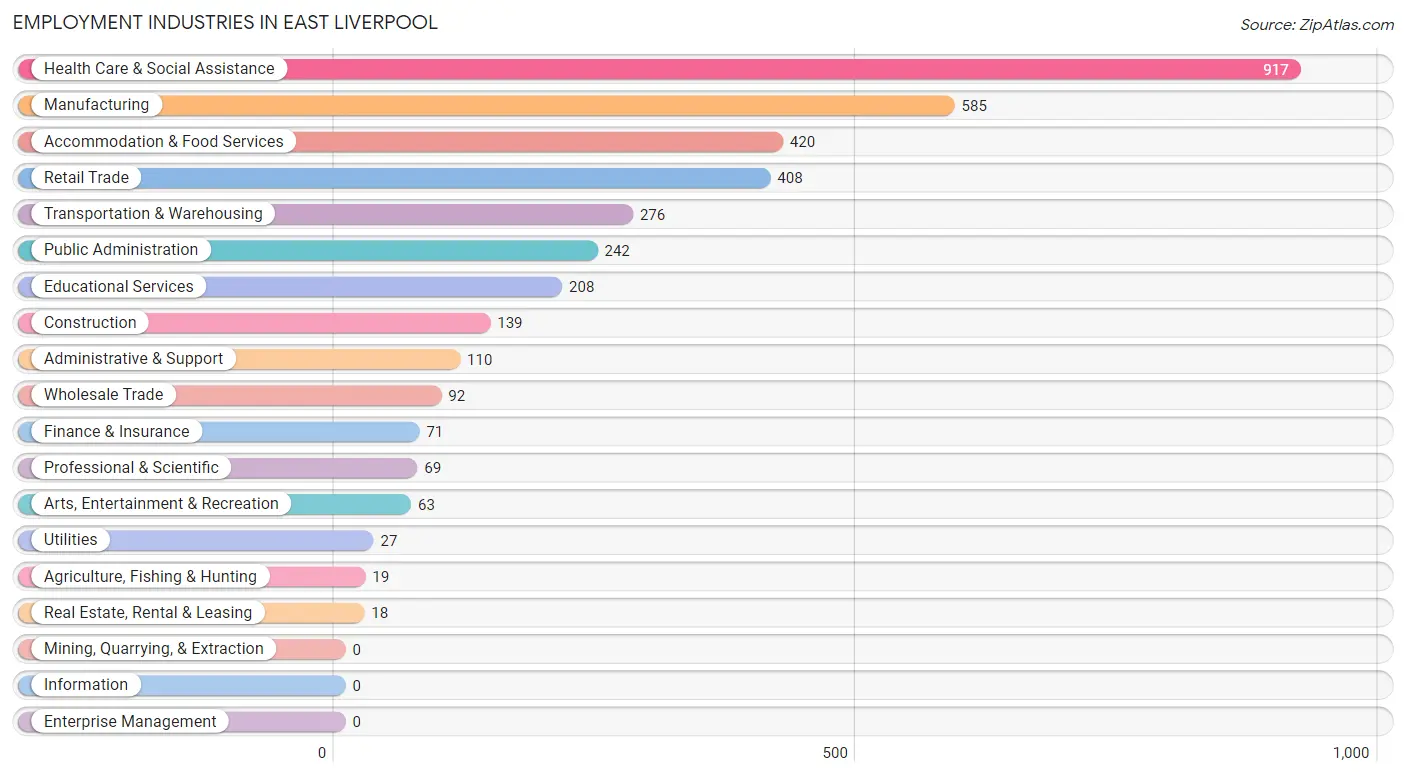
Employment Industries in East Liverpool
The major employment industries in East Liverpool include Health Care & Social Assistance (917 | 24.4%), Manufacturing (585 | 15.6%), Accommodation & Food Services (420 | 11.2%), Retail Trade (408 | 10.9%), and Transportation & Warehousing (276 | 7.3%).
Employment Industries by Sex in East Liverpool
The East Liverpool industries that see more men than women are Construction (100.0%), Transportation & Warehousing (97.1%), and Administrative & Support (90.0%), whereas the industries that tend to have a higher number of women are Health Care & Social Assistance (87.8%), Educational Services (73.6%), and Arts, Entertainment & Recreation (68.2%).
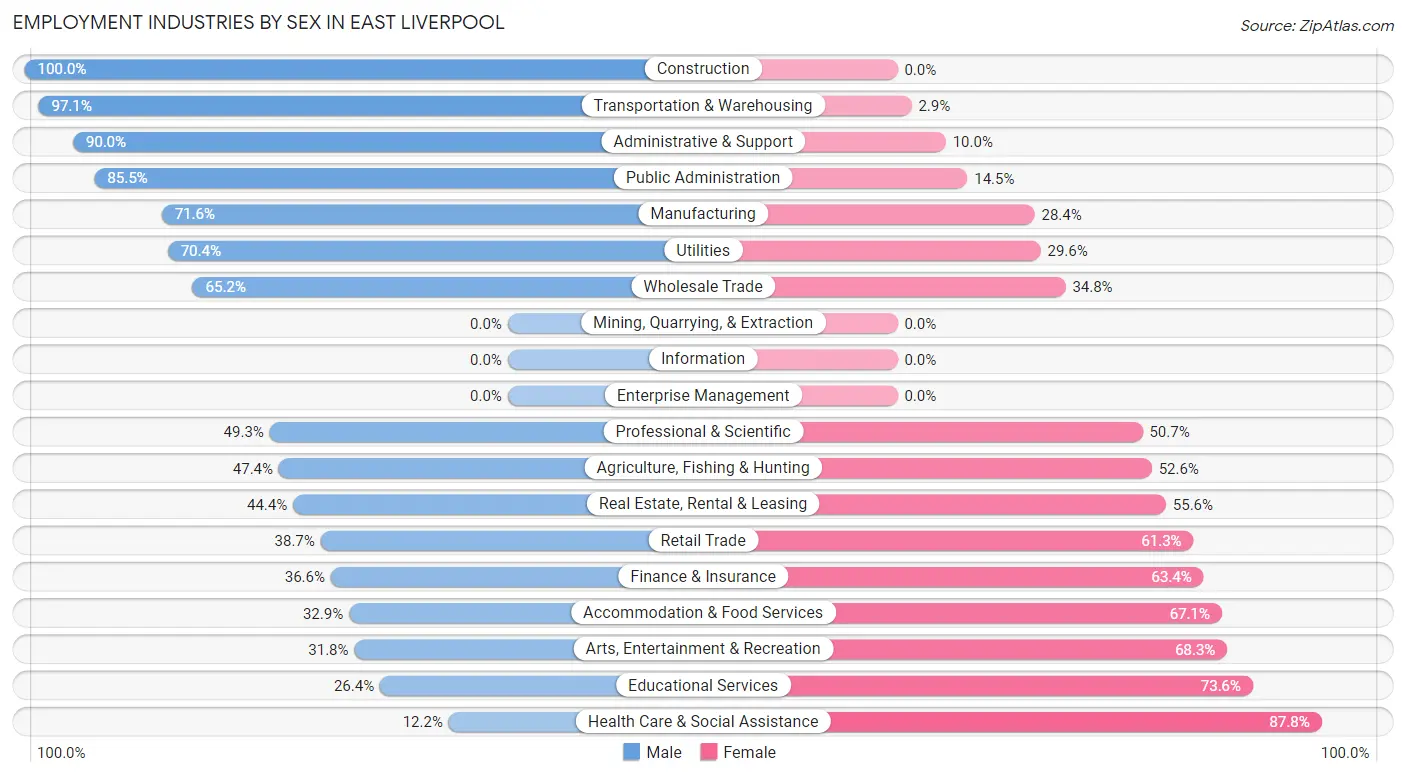
| Industry | Male | Female |
| Agriculture, Fishing & Hunting | 9 (47.4%) | 10 (52.6%) |
| Mining, Quarrying, & Extraction | 0 (0.0%) | 0 (0.0%) |
| Construction | 139 (100.0%) | 0 (0.0%) |
| Manufacturing | 419 (71.6%) | 166 (28.4%) |
| Wholesale Trade | 60 (65.2%) | 32 (34.8%) |
| Retail Trade | 158 (38.7%) | 250 (61.3%) |
| Transportation & Warehousing | 268 (97.1%) | 8 (2.9%) |
| Utilities | 19 (70.4%) | 8 (29.6%) |
| Information | 0 (0.0%) | 0 (0.0%) |
| Finance & Insurance | 26 (36.6%) | 45 (63.4%) |
| Real Estate, Rental & Leasing | 8 (44.4%) | 10 (55.6%) |
| Professional & Scientific | 34 (49.3%) | 35 (50.7%) |
| Enterprise Management | 0 (0.0%) | 0 (0.0%) |
| Administrative & Support | 99 (90.0%) | 11 (10.0%) |
| Educational Services | 55 (26.4%) | 153 (73.6%) |
| Health Care & Social Assistance | 112 (12.2%) | 805 (87.8%) |
| Arts, Entertainment & Recreation | 20 (31.8%) | 43 (68.2%) |
| Accommodation & Food Services | 138 (32.9%) | 282 (67.1%) |
| Public Administration | 207 (85.5%) | 35 (14.5%) |
| Total | 1,829 (48.7%) | 1,928 (51.3%) |
Education in East Liverpool
School Enrollment in East Liverpool
The most common levels of schooling among the 2,215 students in East Liverpool are elementary school (658 | 29.7%), middle school (542 | 24.5%), and high school (497 | 22.4%).
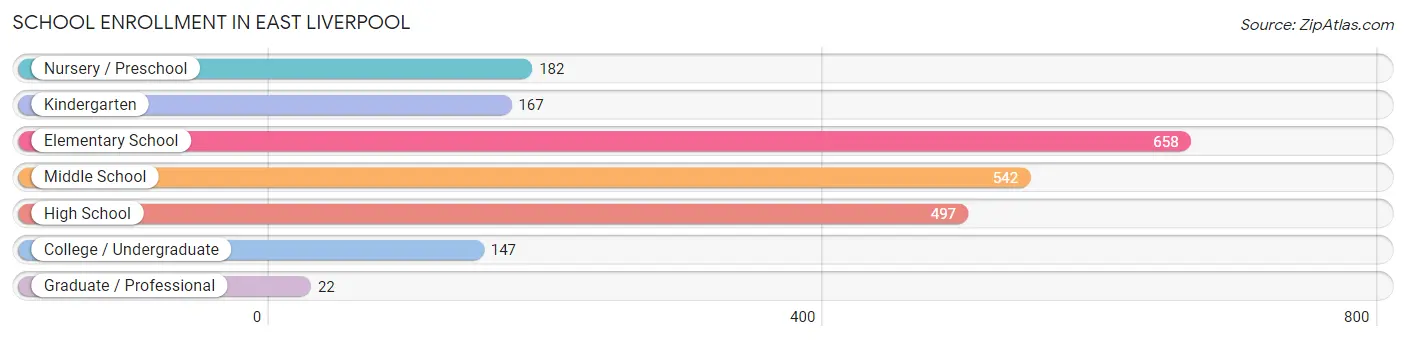
| School Level | # Students | % Students |
| Nursery / Preschool | 182 | 8.2% |
| Kindergarten | 167 | 7.5% |
| Elementary School | 658 | 29.7% |
| Middle School | 542 | 24.5% |
| High School | 497 | 22.4% |
| College / Undergraduate | 147 | 6.6% |
| Graduate / Professional | 22 | 1.0% |
| Total | 2,215 | 100.0% |
School Enrollment by Age by Funding Source in East Liverpool
Out of a total of 2,215 students who are enrolled in schools in East Liverpool, 179 (8.1%) attend a private institution, while the remaining 2,036 (91.9%) are enrolled in public schools. The age group of 25 to 34 year olds has the highest likelihood of being enrolled in private schools, with 9 (37.5% in the age bracket) enrolled. Conversely, the age group of 10 to 14 year olds has the lowest likelihood of being enrolled in a private school, with 711 (96.1% in the age bracket) attending a public institution.
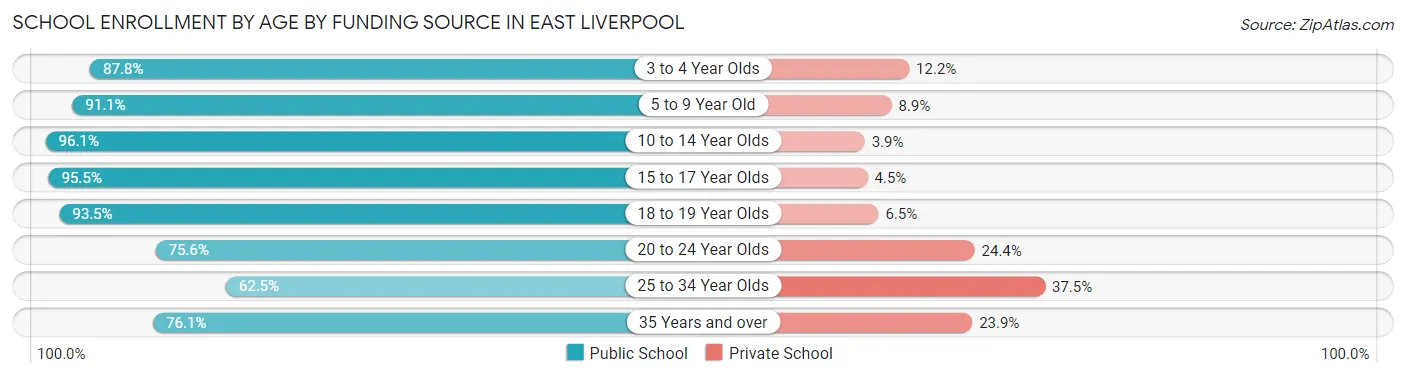
| Age Bracket | Public School | Private School |
| 3 to 4 Year Olds | 108 (87.8%) | 15 (12.2%) |
| 5 to 9 Year Old | 727 (91.1%) | 71 (8.9%) |
| 10 to 14 Year Olds | 711 (96.1%) | 29 (3.9%) |
| 15 to 17 Year Olds | 257 (95.5%) | 12 (4.5%) |
| 18 to 19 Year Olds | 101 (93.5%) | 7 (6.5%) |
| 20 to 24 Year Olds | 62 (75.6%) | 20 (24.4%) |
| 25 to 34 Year Olds | 15 (62.5%) | 9 (37.5%) |
| 35 Years and over | 54 (76.1%) | 17 (23.9%) |
| Total | 2,036 (91.9%) | 179 (8.1%) |
Educational Attainment by Field of Study in East Liverpool
Education (118 | 19.6%), science & technology (99 | 16.4%), liberal arts & history (57 | 9.5%), business (53 | 8.8%), and communications (46 | 7.6%) are the most common fields of study among 603 individuals in East Liverpool who have obtained a bachelor's degree or higher.
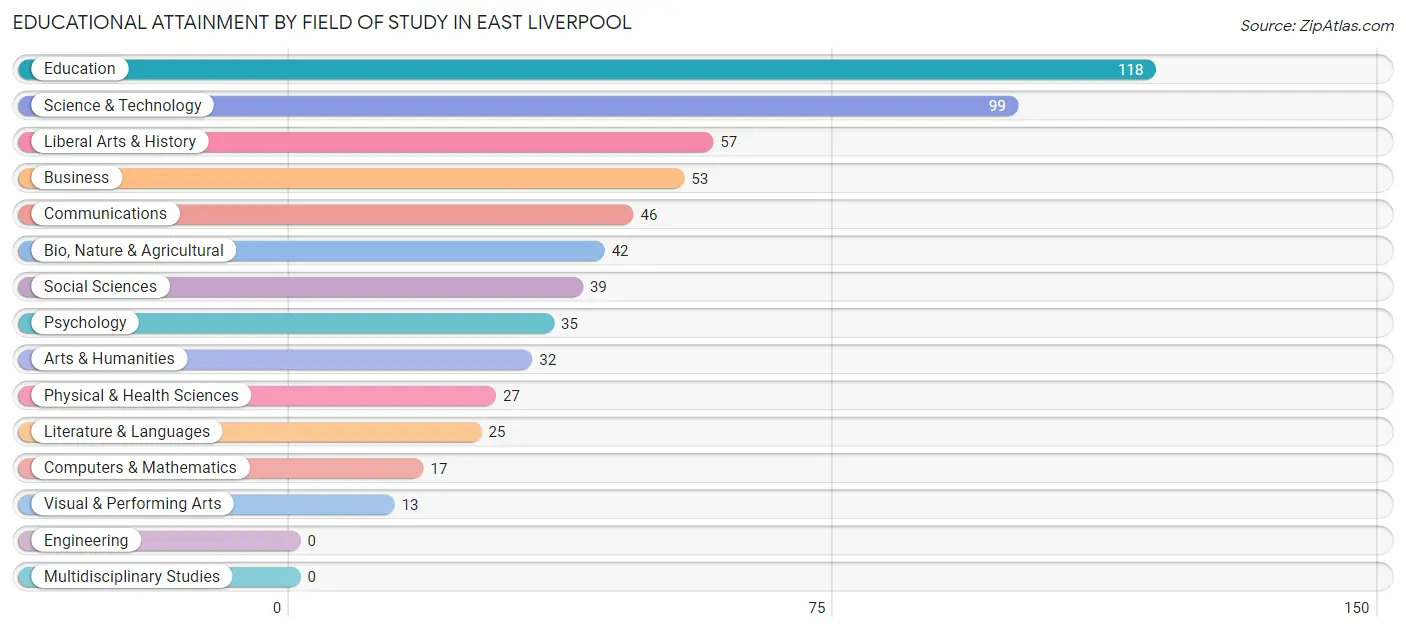
| Field of Study | # Graduates | % Graduates |
| Computers & Mathematics | 17 | 2.8% |
| Bio, Nature & Agricultural | 42 | 7.0% |
| Physical & Health Sciences | 27 | 4.5% |
| Psychology | 35 | 5.8% |
| Social Sciences | 39 | 6.5% |
| Engineering | 0 | 0.0% |
| Multidisciplinary Studies | 0 | 0.0% |
| Science & Technology | 99 | 16.4% |
| Business | 53 | 8.8% |
| Education | 118 | 19.6% |
| Literature & Languages | 25 | 4.2% |
| Liberal Arts & History | 57 | 9.5% |
| Visual & Performing Arts | 13 | 2.2% |
| Communications | 46 | 7.6% |
| Arts & Humanities | 32 | 5.3% |
| Total | 603 | 100.0% |
Transportation & Commute in East Liverpool
Vehicle Availability by Sex in East Liverpool
The most prevalent vehicle ownership categories in East Liverpool are males with 2 vehicles (792, accounting for 44.2%) and females with 2 vehicles (687, making up 42.9%).
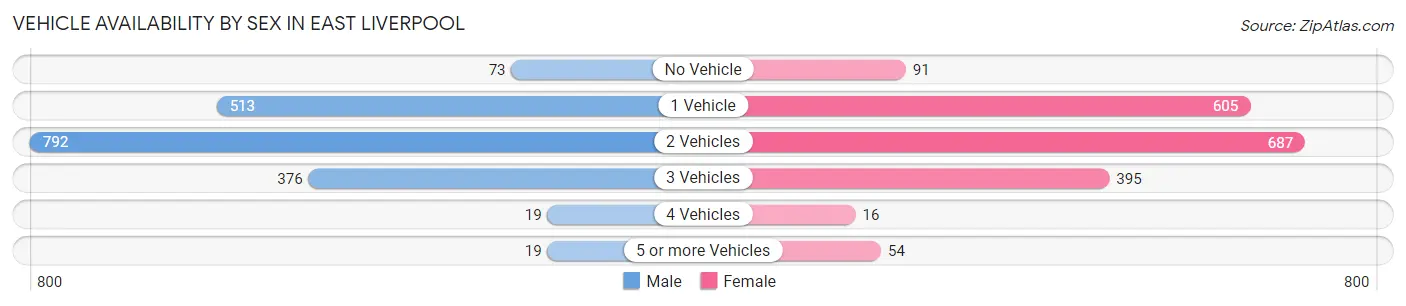
| Vehicles Available | Male | Female |
| No Vehicle | 73 (4.1%) | 91 (4.9%) |
| 1 Vehicle | 513 (28.6%) | 605 (32.7%) |
| 2 Vehicles | 792 (44.2%) | 687 (37.2%) |
| 3 Vehicles | 376 (21.0%) | 395 (21.4%) |
| 4 Vehicles | 19 (1.1%) | 16 (0.9%) |
| 5 or more Vehicles | 19 (1.1%) | 54 (2.9%) |
| Total | 1,792 (100.0%) | 1,848 (100.0%) |
Commute Time in East Liverpool
The most frequently occuring commute durations in East Liverpool are 5 to 9 minutes (879 commuters, 24.8%), 10 to 14 minutes (540 commuters, 15.2%), and 45 to 59 minutes (418 commuters, 11.8%).
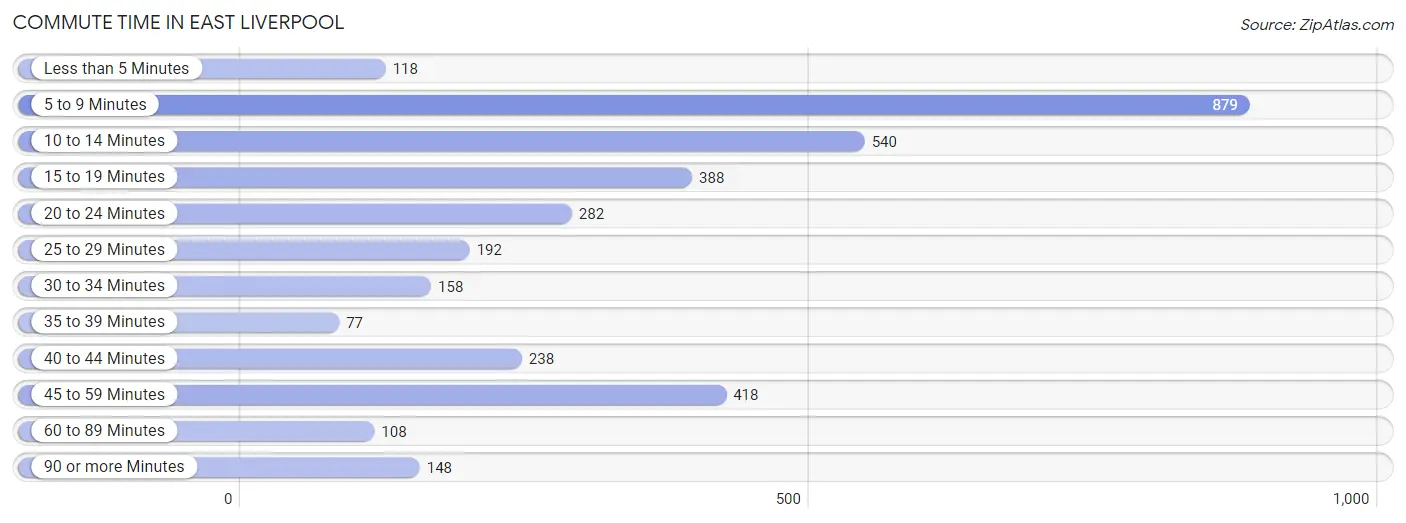
| Commute Time | # Commuters | % Commuters |
| Less than 5 Minutes | 118 | 3.3% |
| 5 to 9 Minutes | 879 | 24.8% |
| 10 to 14 Minutes | 540 | 15.2% |
| 15 to 19 Minutes | 388 | 10.9% |
| 20 to 24 Minutes | 282 | 8.0% |
| 25 to 29 Minutes | 192 | 5.4% |
| 30 to 34 Minutes | 158 | 4.5% |
| 35 to 39 Minutes | 77 | 2.2% |
| 40 to 44 Minutes | 238 | 6.7% |
| 45 to 59 Minutes | 418 | 11.8% |
| 60 to 89 Minutes | 108 | 3.0% |
| 90 or more Minutes | 148 | 4.2% |
Commute Time by Sex in East Liverpool
The most common commute times in East Liverpool are 45 to 59 minutes (334 commuters, 19.0%) for males and 5 to 9 minutes (626 commuters, 35.1%) for females.
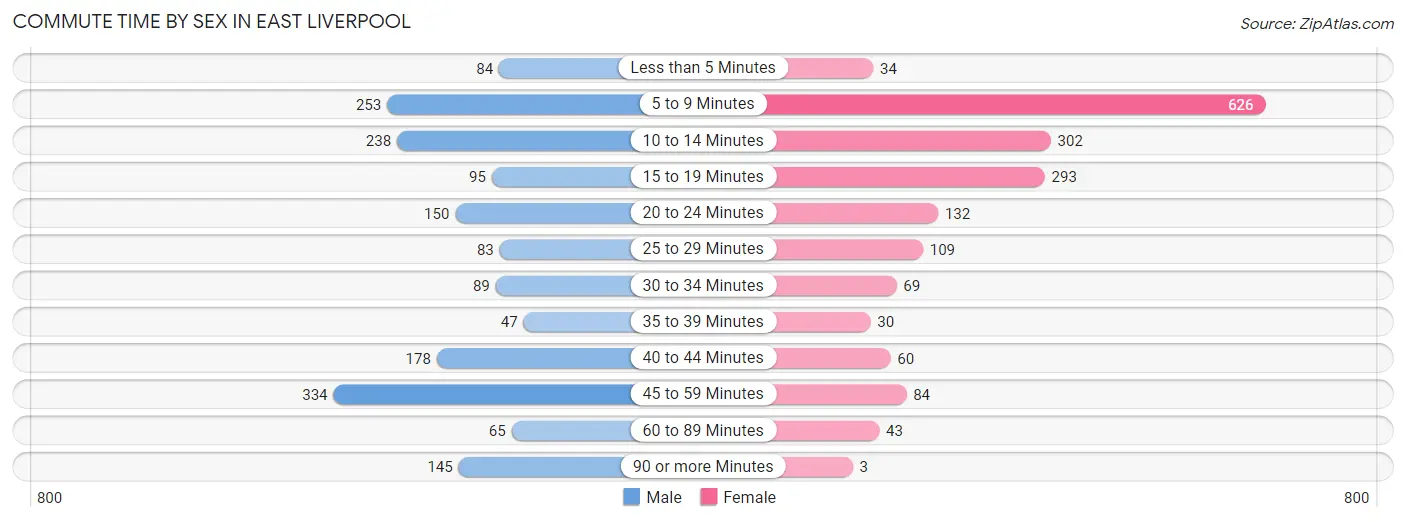
| Commute Time | Male | Female |
| Less than 5 Minutes | 84 (4.8%) | 34 (1.9%) |
| 5 to 9 Minutes | 253 (14.4%) | 626 (35.1%) |
| 10 to 14 Minutes | 238 (13.5%) | 302 (16.9%) |
| 15 to 19 Minutes | 95 (5.4%) | 293 (16.4%) |
| 20 to 24 Minutes | 150 (8.5%) | 132 (7.4%) |
| 25 to 29 Minutes | 83 (4.7%) | 109 (6.1%) |
| 30 to 34 Minutes | 89 (5.1%) | 69 (3.9%) |
| 35 to 39 Minutes | 47 (2.7%) | 30 (1.7%) |
| 40 to 44 Minutes | 178 (10.1%) | 60 (3.4%) |
| 45 to 59 Minutes | 334 (19.0%) | 84 (4.7%) |
| 60 to 89 Minutes | 65 (3.7%) | 43 (2.4%) |
| 90 or more Minutes | 145 (8.2%) | 3 (0.2%) |
Time of Departure to Work by Sex in East Liverpool
The most frequent times of departure to work in East Liverpool are 12:00 AM to 4:59 AM (529, 30.0%) for males and 12:00 AM to 4:59 AM (385, 21.6%) for females.
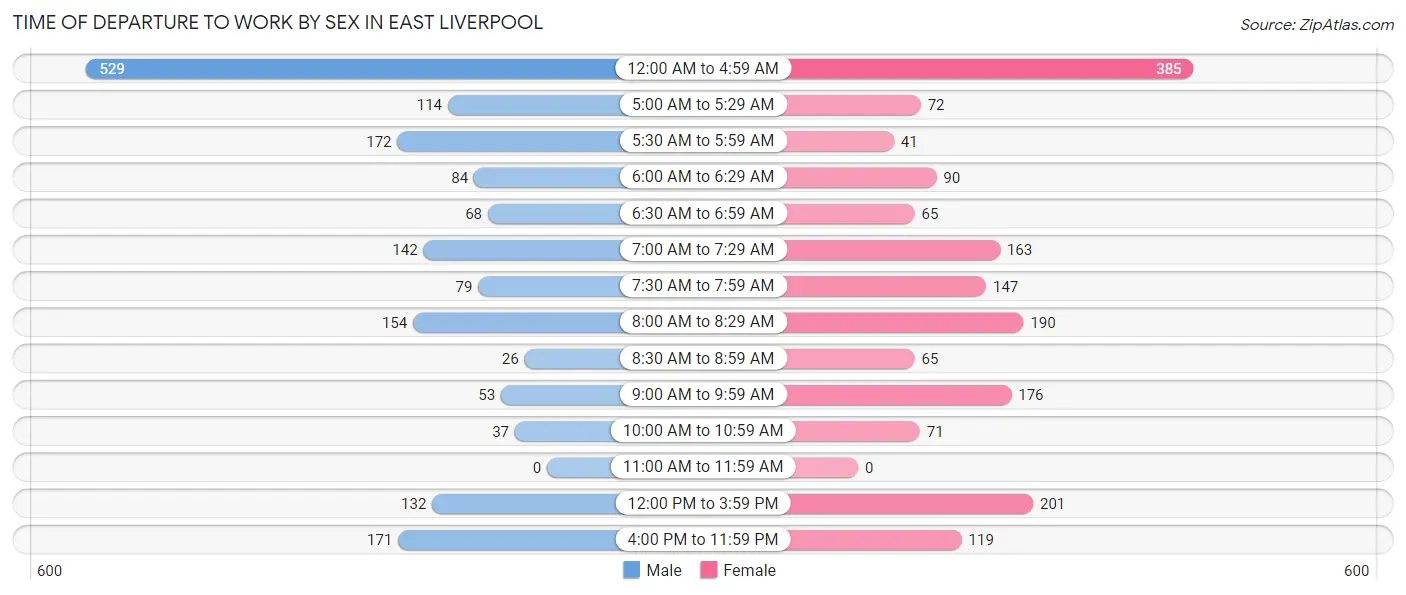
| Time of Departure | Male | Female |
| 12:00 AM to 4:59 AM | 529 (30.0%) | 385 (21.6%) |
| 5:00 AM to 5:29 AM | 114 (6.5%) | 72 (4.0%) |
| 5:30 AM to 5:59 AM | 172 (9.8%) | 41 (2.3%) |
| 6:00 AM to 6:29 AM | 84 (4.8%) | 90 (5.0%) |
| 6:30 AM to 6:59 AM | 68 (3.9%) | 65 (3.6%) |
| 7:00 AM to 7:29 AM | 142 (8.1%) | 163 (9.1%) |
| 7:30 AM to 7:59 AM | 79 (4.5%) | 147 (8.2%) |
| 8:00 AM to 8:29 AM | 154 (8.7%) | 190 (10.6%) |
| 8:30 AM to 8:59 AM | 26 (1.5%) | 65 (3.6%) |
| 9:00 AM to 9:59 AM | 53 (3.0%) | 176 (9.9%) |
| 10:00 AM to 10:59 AM | 37 (2.1%) | 71 (4.0%) |
| 11:00 AM to 11:59 AM | 0 (0.0%) | 0 (0.0%) |
| 12:00 PM to 3:59 PM | 132 (7.5%) | 201 (11.3%) |
| 4:00 PM to 11:59 PM | 171 (9.7%) | 119 (6.7%) |
| Total | 1,761 (100.0%) | 1,785 (100.0%) |
Housing Occupancy in East Liverpool
Occupancy by Ownership in East Liverpool
Of the total 3,896 dwellings in East Liverpool, owner-occupied units account for 2,084 (53.5%), while renter-occupied units make up 1,812 (46.5%).
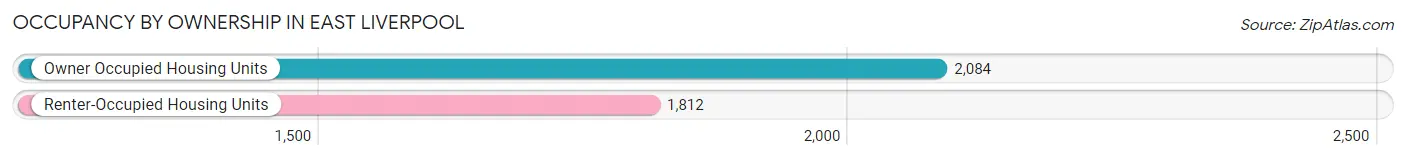
| Occupancy | # Housing Units | % Housing Units |
| Owner Occupied Housing Units | 2,084 | 53.5% |
| Renter-Occupied Housing Units | 1,812 | 46.5% |
| Total Occupied Housing Units | 3,896 | 100.0% |
Occupancy by Household Size in East Liverpool
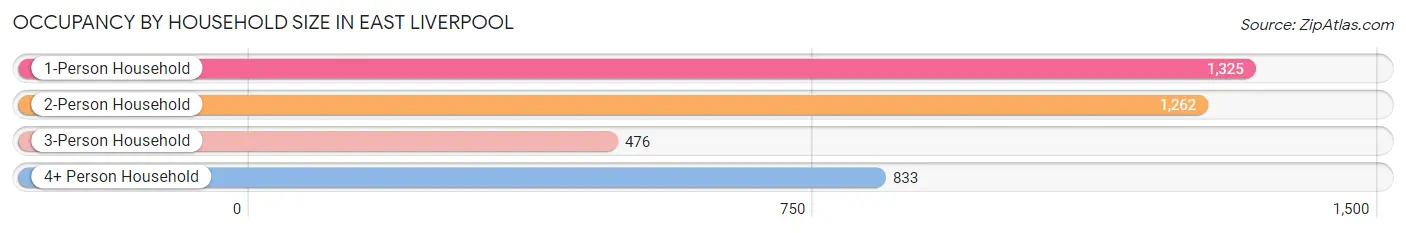
| Household Size | # Housing Units | % Housing Units |
| 1-Person Household | 1,325 | 34.0% |
| 2-Person Household | 1,262 | 32.4% |
| 3-Person Household | 476 | 12.2% |
| 4+ Person Household | 833 | 21.4% |
| Total Housing Units | 3,896 | 100.0% |
Occupancy by Ownership by Household Size in East Liverpool
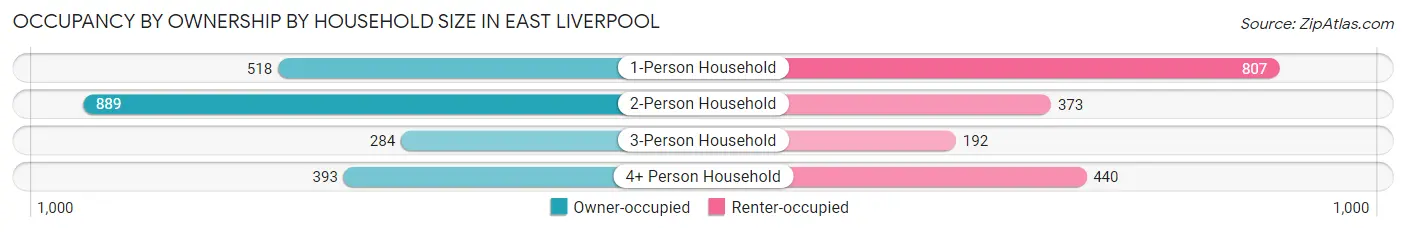
| Household Size | Owner-occupied | Renter-occupied |
| 1-Person Household | 518 (39.1%) | 807 (60.9%) |
| 2-Person Household | 889 (70.4%) | 373 (29.6%) |
| 3-Person Household | 284 (59.7%) | 192 (40.3%) |
| 4+ Person Household | 393 (47.2%) | 440 (52.8%) |
| Total Housing Units | 2,084 (53.5%) | 1,812 (46.5%) |
Occupancy by Educational Attainment in East Liverpool
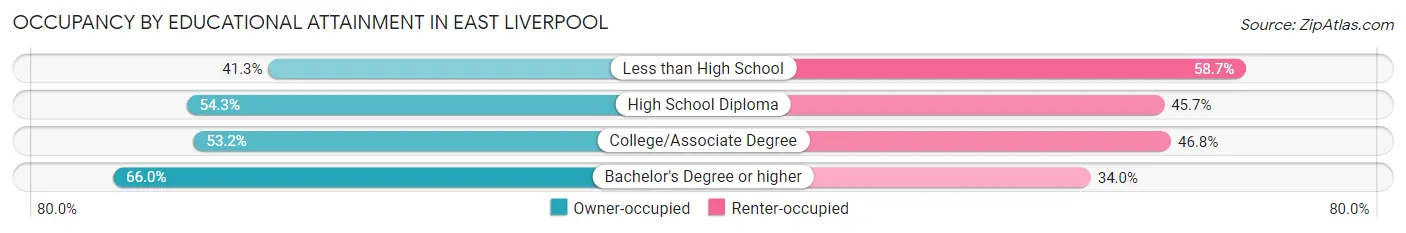
| Household Size | Owner-occupied | Renter-occupied |
| Less than High School | 167 (41.3%) | 237 (58.7%) |
| High School Diploma | 1,110 (54.3%) | 934 (45.7%) |
| College/Associate Degree | 619 (53.2%) | 544 (46.8%) |
| Bachelor's Degree or higher | 188 (66.0%) | 97 (34.0%) |
Occupancy by Age of Householder in East Liverpool
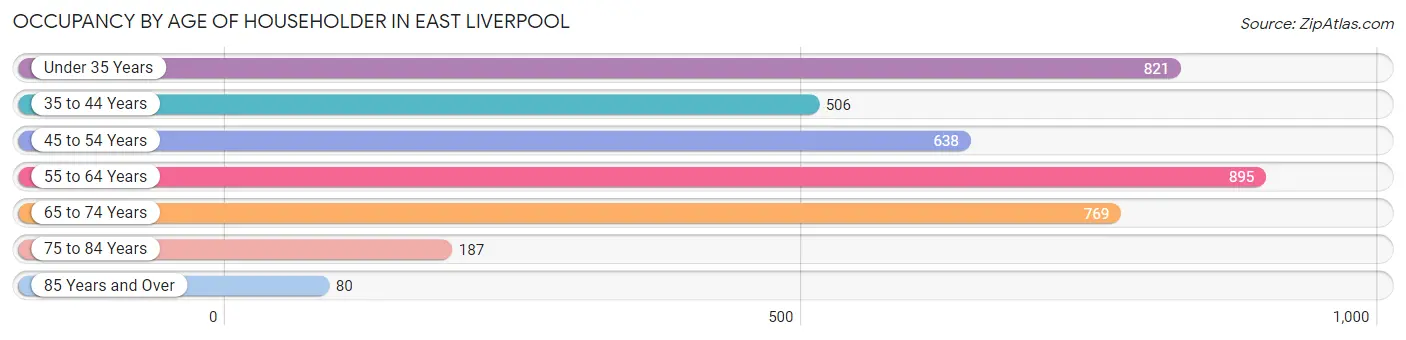
| Age Bracket | # Households | % Households |
| Under 35 Years | 821 | 21.1% |
| 35 to 44 Years | 506 | 13.0% |
| 45 to 54 Years | 638 | 16.4% |
| 55 to 64 Years | 895 | 23.0% |
| 65 to 74 Years | 769 | 19.7% |
| 75 to 84 Years | 187 | 4.8% |
| 85 Years and Over | 80 | 2.1% |
| Total | 3,896 | 100.0% |
Housing Finances in East Liverpool
Median Income by Occupancy in East Liverpool
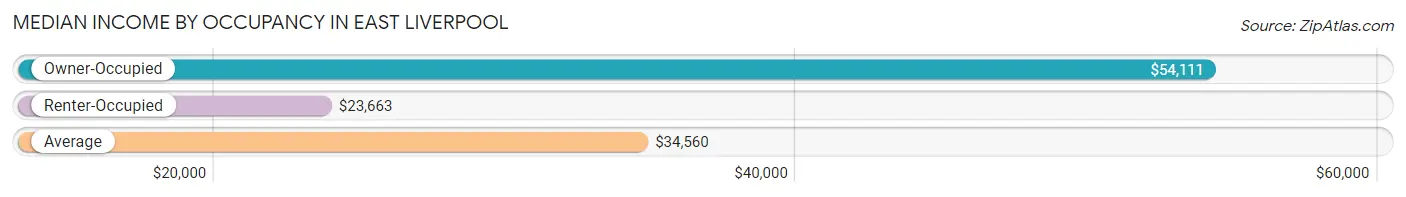
| Occupancy Type | # Households | Median Income |
| Owner-Occupied | 2,084 (53.5%) | $54,111 |
| Renter-Occupied | 1,812 (46.5%) | $23,663 |
| Average | 3,896 (100.0%) | $34,560 |
Occupancy by Householder Income Bracket in East Liverpool
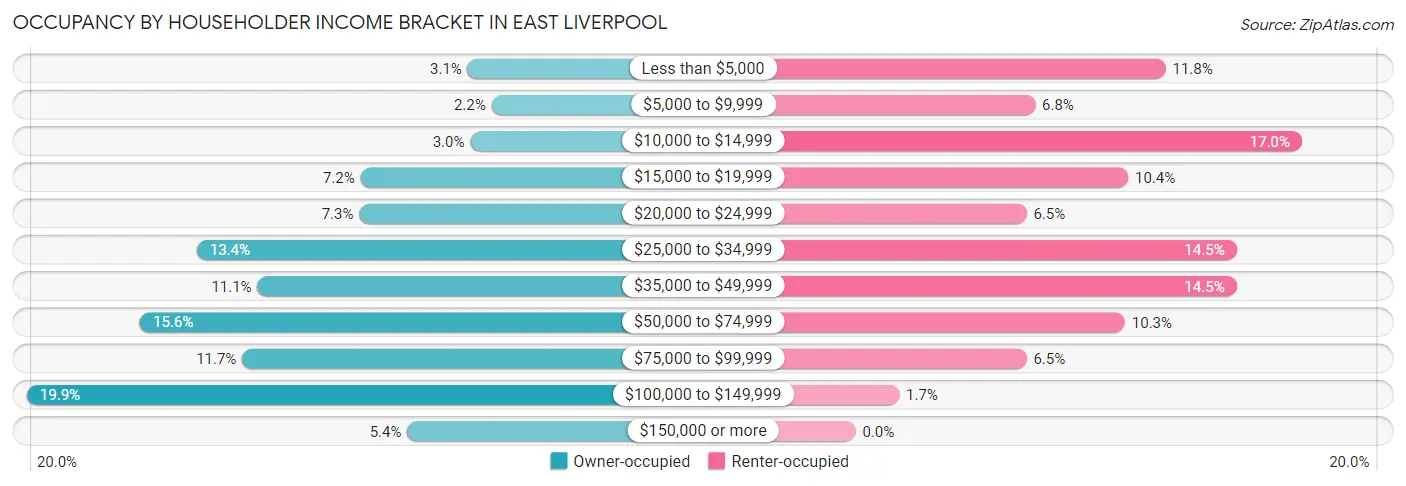
| Income Bracket | Owner-occupied | Renter-occupied |
| Less than $5,000 | 65 (3.1%) | 214 (11.8%) |
| $5,000 to $9,999 | 46 (2.2%) | 124 (6.8%) |
| $10,000 to $14,999 | 63 (3.0%) | 308 (17.0%) |
| $15,000 to $19,999 | 150 (7.2%) | 188 (10.4%) |
| $20,000 to $24,999 | 151 (7.2%) | 118 (6.5%) |
| $25,000 to $34,999 | 280 (13.4%) | 263 (14.5%) |
| $35,000 to $49,999 | 232 (11.1%) | 263 (14.5%) |
| $50,000 to $74,999 | 325 (15.6%) | 186 (10.3%) |
| $75,000 to $99,999 | 244 (11.7%) | 118 (6.5%) |
| $100,000 to $149,999 | 415 (19.9%) | 30 (1.7%) |
| $150,000 or more | 113 (5.4%) | 0 (0.0%) |
| Total | 2,084 (100.0%) | 1,812 (100.0%) |
Monthly Housing Cost Tiers in East Liverpool
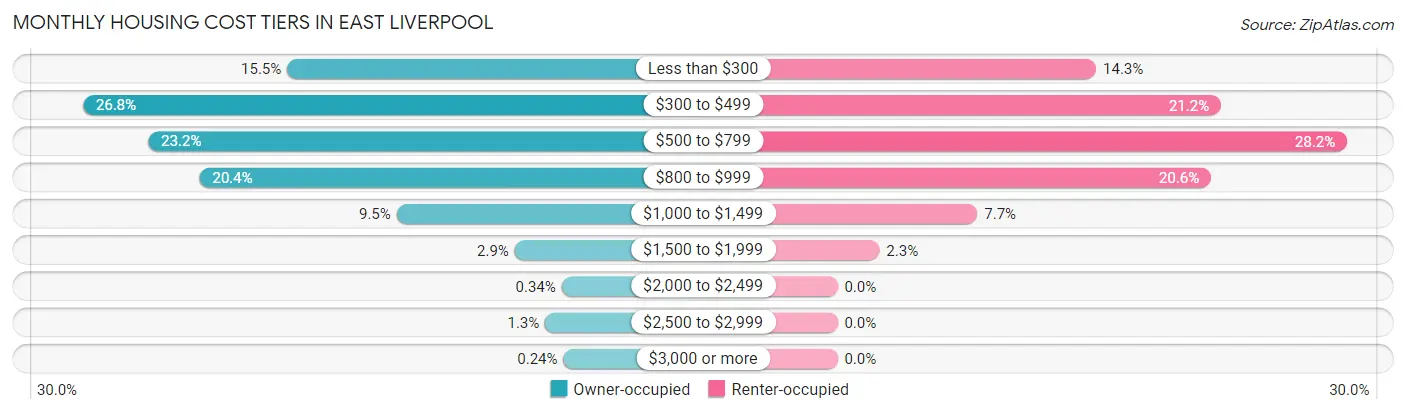
| Monthly Cost | Owner-occupied | Renter-occupied |
| Less than $300 | 323 (15.5%) | 259 (14.3%) |
| $300 to $499 | 558 (26.8%) | 384 (21.2%) |
| $500 to $799 | 483 (23.2%) | 510 (28.1%) |
| $800 to $999 | 424 (20.3%) | 374 (20.6%) |
| $1,000 to $1,499 | 197 (9.5%) | 140 (7.7%) |
| $1,500 to $1,999 | 61 (2.9%) | 42 (2.3%) |
| $2,000 to $2,499 | 7 (0.3%) | 0 (0.0%) |
| $2,500 to $2,999 | 26 (1.3%) | 0 (0.0%) |
| $3,000 or more | 5 (0.2%) | 0 (0.0%) |
| Total | 2,084 (100.0%) | 1,812 (100.0%) |
Physical Housing Characteristics in East Liverpool
Housing Structures in East Liverpool
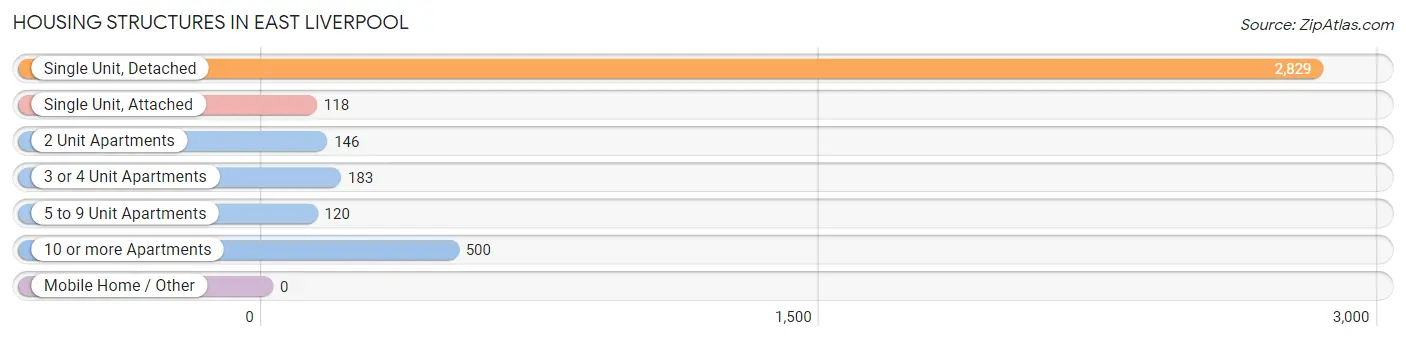
| Structure Type | # Housing Units | % Housing Units |
| Single Unit, Detached | 2,829 | 72.6% |
| Single Unit, Attached | 118 | 3.0% |
| 2 Unit Apartments | 146 | 3.7% |
| 3 or 4 Unit Apartments | 183 | 4.7% |
| 5 to 9 Unit Apartments | 120 | 3.1% |
| 10 or more Apartments | 500 | 12.8% |
| Mobile Home / Other | 0 | 0.0% |
| Total | 3,896 | 100.0% |
Housing Structures by Occupancy in East Liverpool
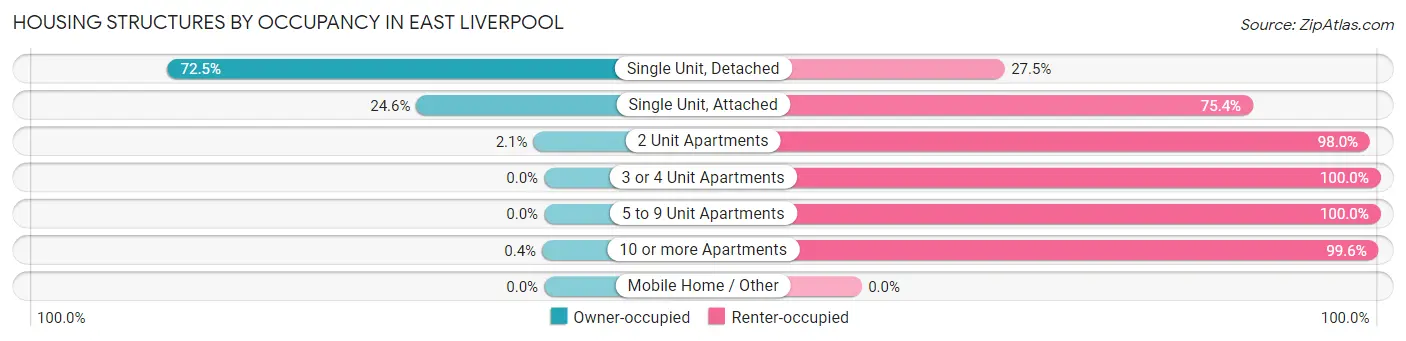
| Structure Type | Owner-occupied | Renter-occupied |
| Single Unit, Detached | 2,050 (72.5%) | 779 (27.5%) |
| Single Unit, Attached | 29 (24.6%) | 89 (75.4%) |
| 2 Unit Apartments | 3 (2.1%) | 143 (98.0%) |
| 3 or 4 Unit Apartments | 0 (0.0%) | 183 (100.0%) |
| 5 to 9 Unit Apartments | 0 (0.0%) | 120 (100.0%) |
| 10 or more Apartments | 2 (0.4%) | 498 (99.6%) |
| Mobile Home / Other | 0 (0.0%) | 0 (0.0%) |
| Total | 2,084 (53.5%) | 1,812 (46.5%) |
Housing Structures by Number of Rooms in East Liverpool
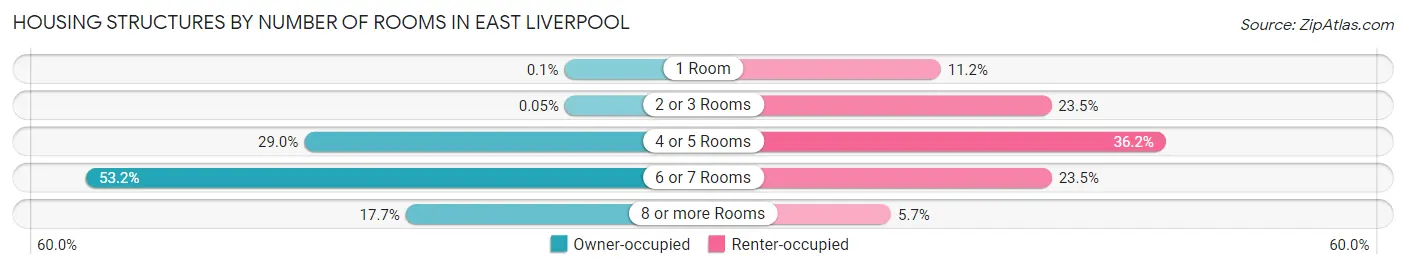
| Number of Rooms | Owner-occupied | Renter-occupied |
| 1 Room | 2 (0.1%) | 203 (11.2%) |
| 2 or 3 Rooms | 1 (0.1%) | 425 (23.4%) |
| 4 or 5 Rooms | 604 (29.0%) | 655 (36.1%) |
| 6 or 7 Rooms | 1,108 (53.2%) | 426 (23.5%) |
| 8 or more Rooms | 369 (17.7%) | 103 (5.7%) |
| Total | 2,084 (100.0%) | 1,812 (100.0%) |
Housing Structure by Heating Type in East Liverpool
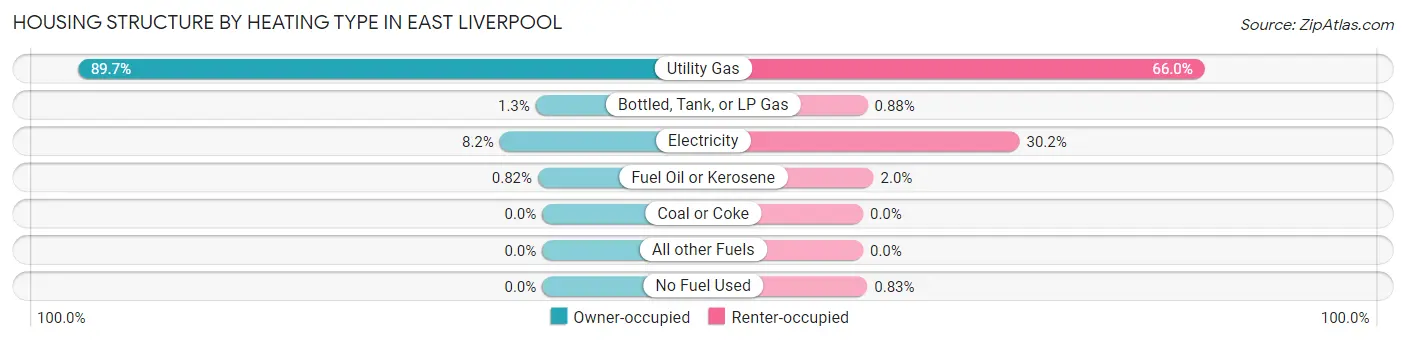
| Heating Type | Owner-occupied | Renter-occupied |
| Utility Gas | 1,870 (89.7%) | 1,196 (66.0%) |
| Bottled, Tank, or LP Gas | 26 (1.3%) | 16 (0.9%) |
| Electricity | 171 (8.2%) | 548 (30.2%) |
| Fuel Oil or Kerosene | 17 (0.8%) | 37 (2.0%) |
| Coal or Coke | 0 (0.0%) | 0 (0.0%) |
| All other Fuels | 0 (0.0%) | 0 (0.0%) |
| No Fuel Used | 0 (0.0%) | 15 (0.8%) |
| Total | 2,084 (100.0%) | 1,812 (100.0%) |
Household Vehicle Usage in East Liverpool
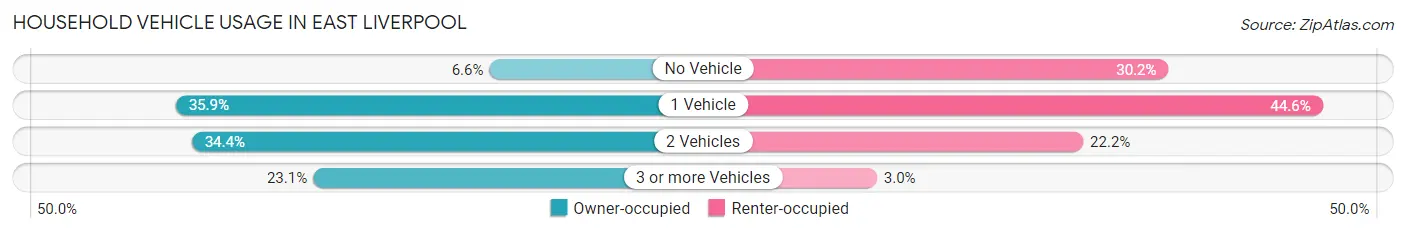
| Vehicles per Household | Owner-occupied | Renter-occupied |
| No Vehicle | 138 (6.6%) | 547 (30.2%) |
| 1 Vehicle | 748 (35.9%) | 808 (44.6%) |
| 2 Vehicles | 717 (34.4%) | 403 (22.2%) |
| 3 or more Vehicles | 481 (23.1%) | 54 (3.0%) |
| Total | 2,084 (100.0%) | 1,812 (100.0%) |
Real Estate & Mortgages in East Liverpool
Real Estate and Mortgage Overview in East Liverpool
| Characteristic | Without Mortgage | With Mortgage |
| Housing Units | 1,029 | 1,055 |
| Median Property Value | $47,000 | $84,000 |
| Median Household Income | $32,138 | $49 |
| Monthly Housing Costs | $364 | $2 |
| Real Estate Taxes | $702 | $75 |
Property Value by Mortgage Status in East Liverpool
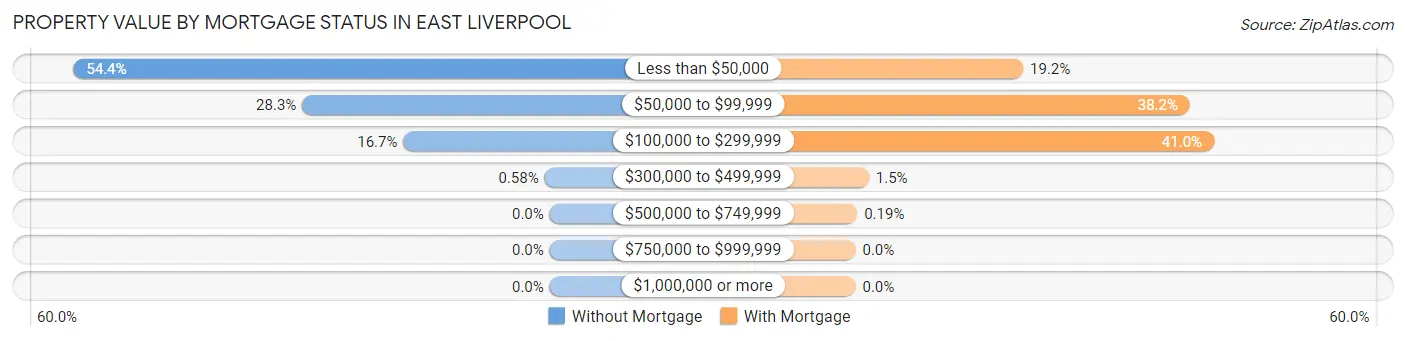
| Property Value | Without Mortgage | With Mortgage |
| Less than $50,000 | 560 (54.4%) | 202 (19.2%) |
| $50,000 to $99,999 | 291 (28.3%) | 403 (38.2%) |
| $100,000 to $299,999 | 172 (16.7%) | 432 (40.9%) |
| $300,000 to $499,999 | 6 (0.6%) | 16 (1.5%) |
| $500,000 to $749,999 | 0 (0.0%) | 2 (0.2%) |
| $750,000 to $999,999 | 0 (0.0%) | 0 (0.0%) |
| $1,000,000 or more | 0 (0.0%) | 0 (0.0%) |
| Total | 1,029 (100.0%) | 1,055 (100.0%) |
Household Income by Mortgage Status in East Liverpool
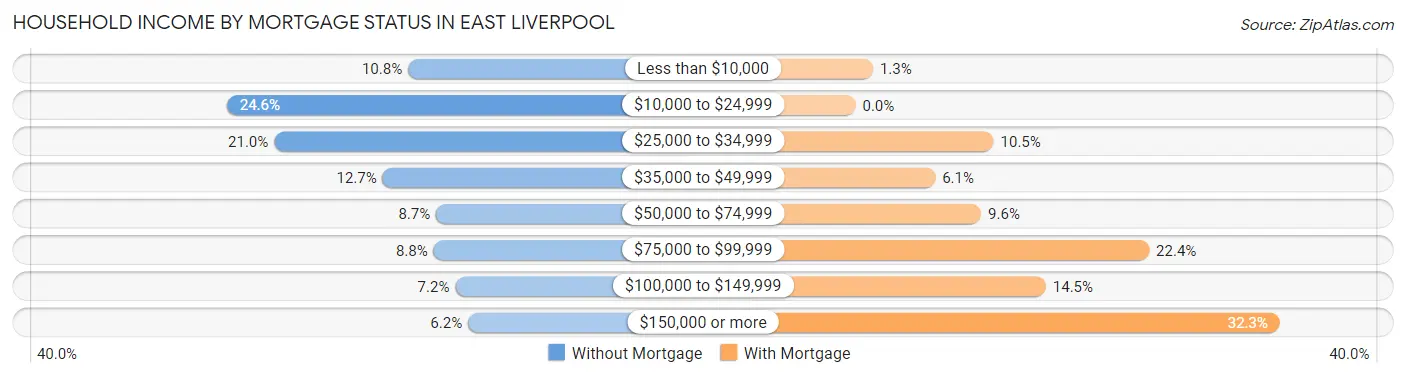
| Household Income | Without Mortgage | With Mortgage |
| Less than $10,000 | 111 (10.8%) | 14 (1.3%) |
| $10,000 to $24,999 | 253 (24.6%) | 0 (0.0%) |
| $25,000 to $34,999 | 216 (21.0%) | 111 (10.5%) |
| $35,000 to $49,999 | 131 (12.7%) | 64 (6.1%) |
| $50,000 to $74,999 | 89 (8.6%) | 101 (9.6%) |
| $75,000 to $99,999 | 91 (8.8%) | 236 (22.4%) |
| $100,000 to $149,999 | 74 (7.2%) | 153 (14.5%) |
| $150,000 or more | 64 (6.2%) | 341 (32.3%) |
| Total | 1,029 (100.0%) | 1,055 (100.0%) |
Property Value to Household Income Ratio in East Liverpool
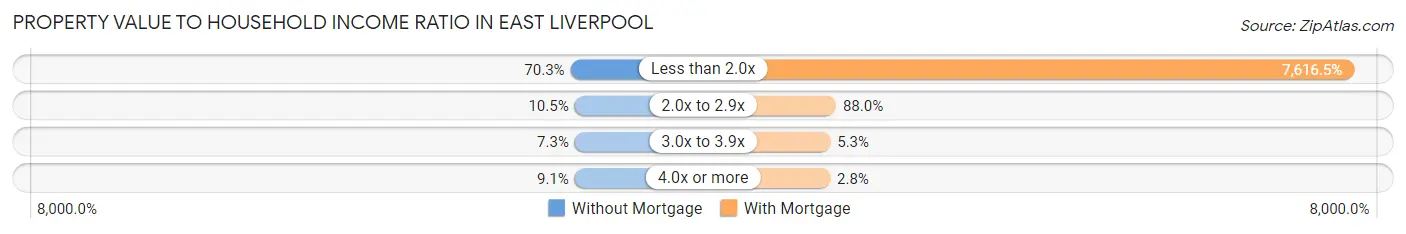
| Value-to-Income Ratio | Without Mortgage | With Mortgage |
| Less than 2.0x | 723 (70.3%) | 80,354 (7,616.5%) |
| 2.0x to 2.9x | 108 (10.5%) | 928 (88.0%) |
| 3.0x to 3.9x | 75 (7.3%) | 56 (5.3%) |
| 4.0x or more | 94 (9.1%) | 29 (2.8%) |
| Total | 1,029 (100.0%) | 1,055 (100.0%) |
Real Estate Taxes by Mortgage Status in East Liverpool
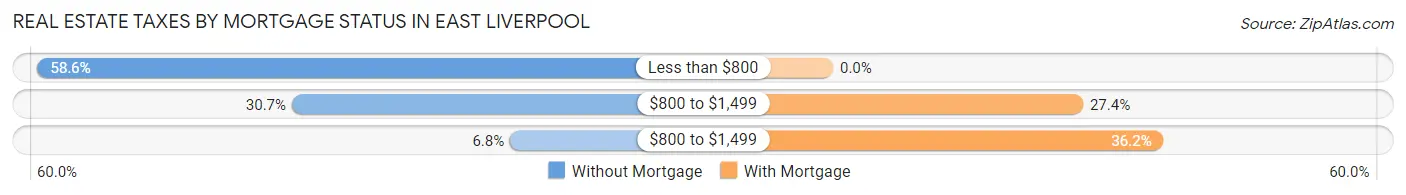
| Property Taxes | Without Mortgage | With Mortgage |
| Less than $800 | 603 (58.6%) | 0 (0.0%) |
| $800 to $1,499 | 316 (30.7%) | 289 (27.4%) |
| $800 to $1,499 | 70 (6.8%) | 382 (36.2%) |
| Total | 1,029 (100.0%) | 1,055 (100.0%) |
Health & Disability in East Liverpool
Health Insurance Coverage by Age in East Liverpool
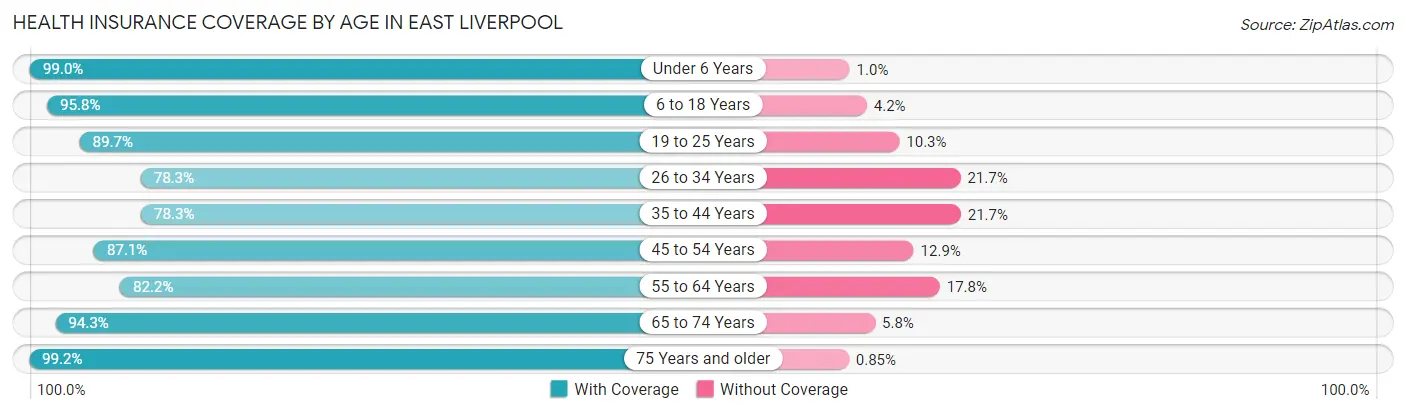
| Age Bracket | With Coverage | Without Coverage |
| Under 6 Years | 888 (99.0%) | 9 (1.0%) |
| 6 to 18 Years | 1,799 (95.8%) | 79 (4.2%) |
| 19 to 25 Years | 568 (89.7%) | 65 (10.3%) |
| 26 to 34 Years | 1,070 (78.3%) | 296 (21.7%) |
| 35 to 44 Years | 749 (78.3%) | 208 (21.7%) |
| 45 to 54 Years | 1,010 (87.1%) | 150 (12.9%) |
| 55 to 64 Years | 1,149 (82.2%) | 249 (17.8%) |
| 65 to 74 Years | 1,114 (94.3%) | 68 (5.8%) |
| 75 Years and older | 350 (99.2%) | 3 (0.9%) |
| Total | 8,697 (88.5%) | 1,127 (11.5%) |
Health Insurance Coverage by Citizenship Status in East Liverpool
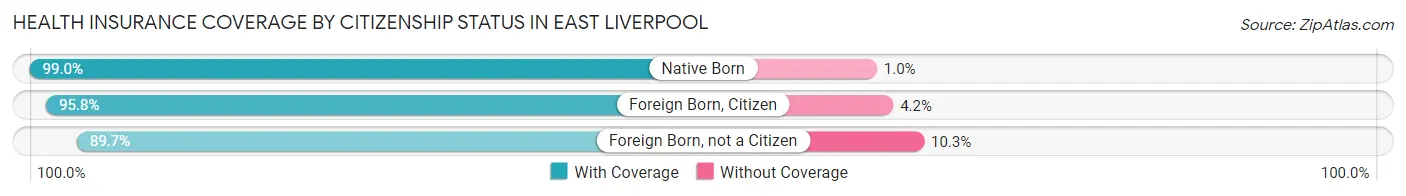
| Citizenship Status | With Coverage | Without Coverage |
| Native Born | 888 (99.0%) | 9 (1.0%) |
| Foreign Born, Citizen | 1,799 (95.8%) | 79 (4.2%) |
| Foreign Born, not a Citizen | 568 (89.7%) | 65 (10.3%) |
Health Insurance Coverage by Household Income in East Liverpool
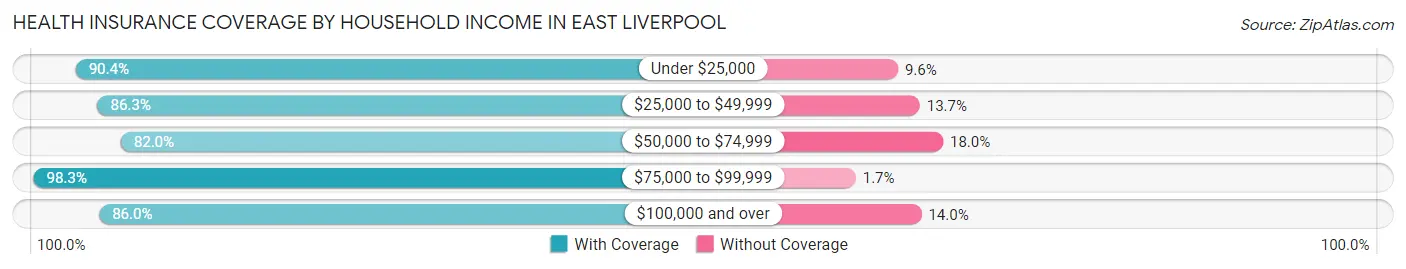
| Household Income | With Coverage | Without Coverage |
| Under $25,000 | 2,696 (90.4%) | 286 (9.6%) |
| $25,000 to $49,999 | 2,133 (86.3%) | 338 (13.7%) |
| $50,000 to $74,999 | 1,095 (82.0%) | 241 (18.0%) |
| $75,000 to $99,999 | 1,291 (98.3%) | 22 (1.7%) |
| $100,000 and over | 1,476 (86.0%) | 240 (14.0%) |
Public vs Private Health Insurance Coverage by Age in East Liverpool
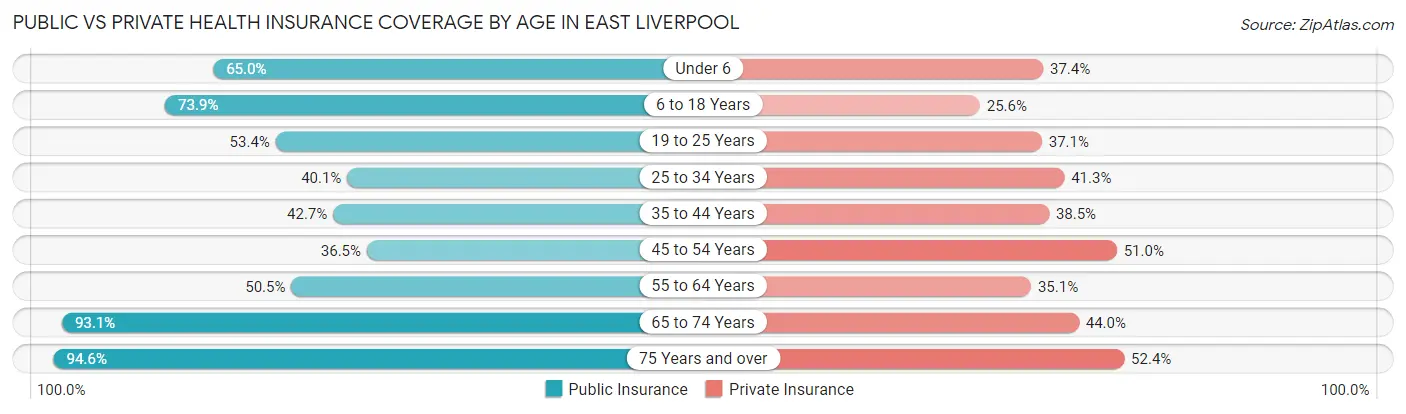
| Age Bracket | Public Insurance | Private Insurance |
| Under 6 | 583 (65.0%) | 335 (37.3%) |
| 6 to 18 Years | 1,388 (73.9%) | 481 (25.6%) |
| 19 to 25 Years | 338 (53.4%) | 235 (37.1%) |
| 25 to 34 Years | 548 (40.1%) | 564 (41.3%) |
| 35 to 44 Years | 409 (42.7%) | 368 (38.5%) |
| 45 to 54 Years | 423 (36.5%) | 592 (51.0%) |
| 55 to 64 Years | 706 (50.5%) | 491 (35.1%) |
| 65 to 74 Years | 1,100 (93.1%) | 520 (44.0%) |
| 75 Years and over | 334 (94.6%) | 185 (52.4%) |
| Total | 5,829 (59.3%) | 3,771 (38.4%) |
Disability Status by Sex by Age in East Liverpool
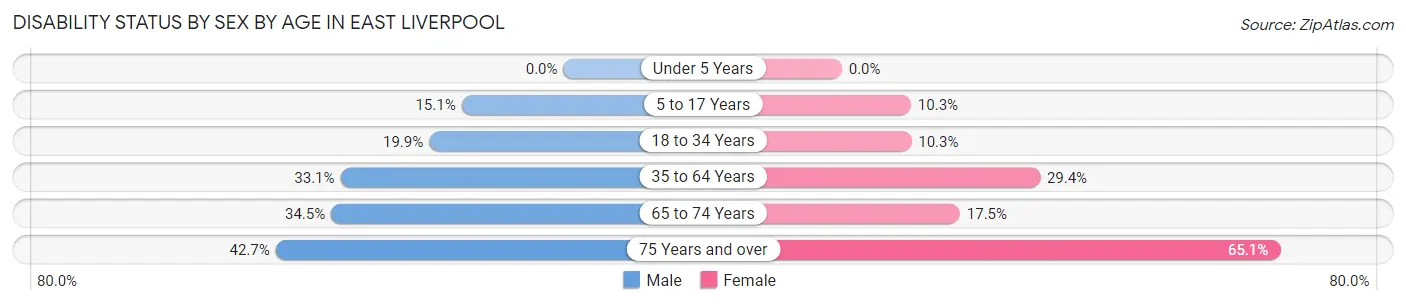
| Age Bracket | Male | Female |
| Under 5 Years | 0 (0.0%) | 0 (0.0%) |
| 5 to 17 Years | 141 (15.1%) | 96 (10.3%) |
| 18 to 34 Years | 195 (19.9%) | 119 (10.3%) |
| 35 to 64 Years | 636 (33.1%) | 469 (29.4%) |
| 65 to 74 Years | 207 (34.5%) | 102 (17.5%) |
| 75 Years and over | 53 (42.7%) | 149 (65.1%) |
Disability Class by Sex by Age in East Liverpool
Disability Class: Hearing Difficulty
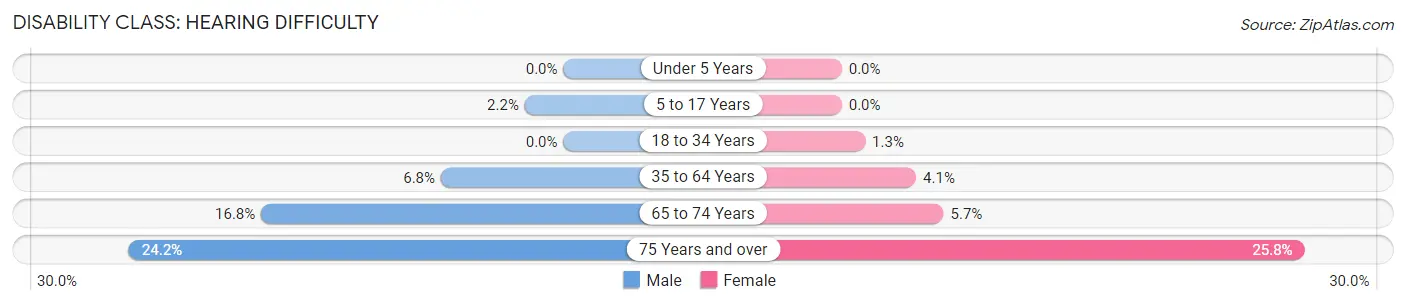
| Age Bracket | Male | Female |
| Under 5 Years | 0 (0.0%) | 0 (0.0%) |
| 5 to 17 Years | 20 (2.1%) | 0 (0.0%) |
| 18 to 34 Years | 0 (0.0%) | 15 (1.3%) |
| 35 to 64 Years | 131 (6.8%) | 66 (4.1%) |
| 65 to 74 Years | 101 (16.8%) | 33 (5.7%) |
| 75 Years and over | 30 (24.2%) | 59 (25.8%) |
Disability Class: Vision Difficulty
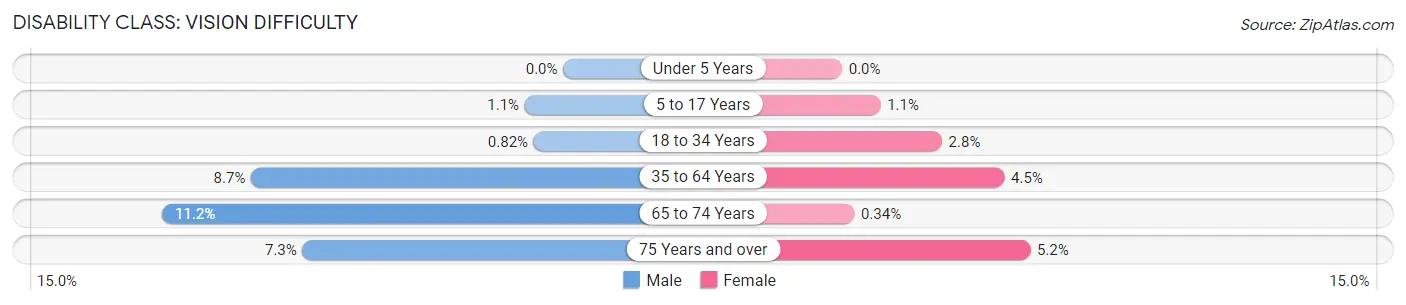
| Age Bracket | Male | Female |
| Under 5 Years | 0 (0.0%) | 0 (0.0%) |
| 5 to 17 Years | 10 (1.1%) | 10 (1.1%) |
| 18 to 34 Years | 8 (0.8%) | 32 (2.8%) |
| 35 to 64 Years | 167 (8.7%) | 72 (4.5%) |
| 65 to 74 Years | 67 (11.2%) | 2 (0.3%) |
| 75 Years and over | 9 (7.3%) | 12 (5.2%) |
Disability Class: Cognitive Difficulty
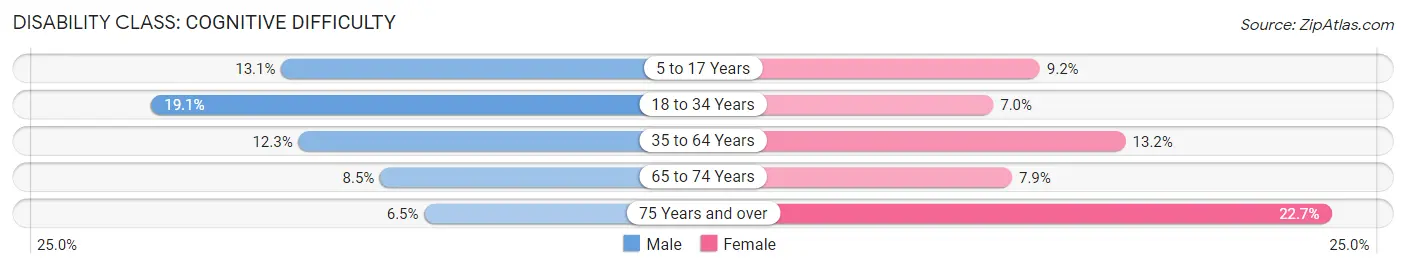
| Age Bracket | Male | Female |
| 5 to 17 Years | 122 (13.1%) | 86 (9.2%) |
| 18 to 34 Years | 187 (19.1%) | 81 (7.0%) |
| 35 to 64 Years | 236 (12.3%) | 210 (13.2%) |
| 65 to 74 Years | 51 (8.5%) | 46 (7.9%) |
| 75 Years and over | 8 (6.5%) | 52 (22.7%) |
Disability Class: Ambulatory Difficulty
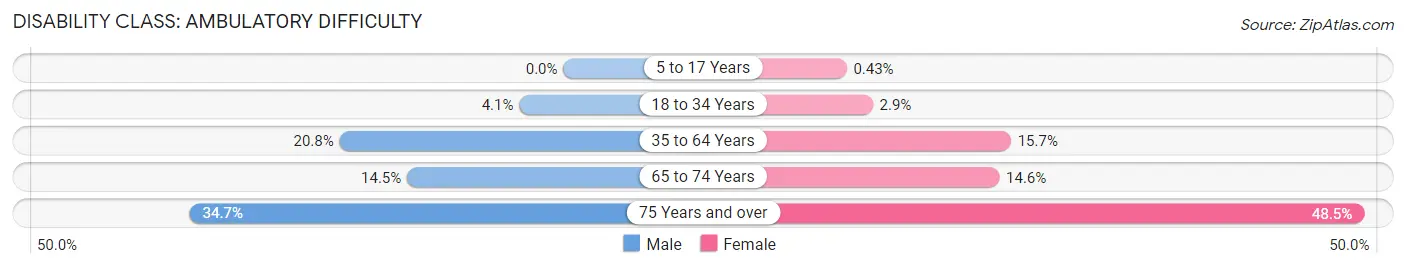
| Age Bracket | Male | Female |
| 5 to 17 Years | 0 (0.0%) | 4 (0.4%) |
| 18 to 34 Years | 40 (4.1%) | 33 (2.9%) |
| 35 to 64 Years | 399 (20.8%) | 250 (15.7%) |
| 65 to 74 Years | 87 (14.5%) | 85 (14.6%) |
| 75 Years and over | 43 (34.7%) | 111 (48.5%) |
Disability Class: Self-Care Difficulty
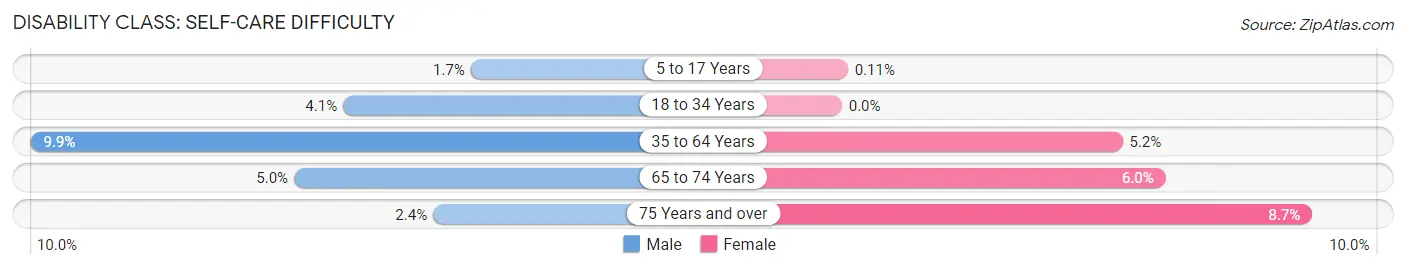
| Age Bracket | Male | Female |
| 5 to 17 Years | 16 (1.7%) | 1 (0.1%) |
| 18 to 34 Years | 40 (4.1%) | 0 (0.0%) |
| 35 to 64 Years | 190 (9.9%) | 83 (5.2%) |
| 65 to 74 Years | 30 (5.0%) | 35 (6.0%) |
| 75 Years and over | 3 (2.4%) | 20 (8.7%) |
Technology Access in East Liverpool
Computing Device Access in East Liverpool
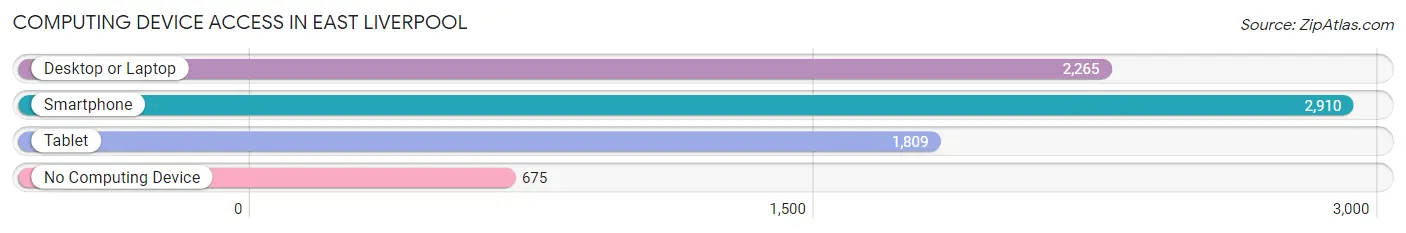
| Device Type | # Households | % Households |
| Desktop or Laptop | 2,265 | 58.1% |
| Smartphone | 2,910 | 74.7% |
| Tablet | 1,809 | 46.4% |
| No Computing Device | 675 | 17.3% |
| Total | 3,896 | 100.0% |
Internet Access in East Liverpool
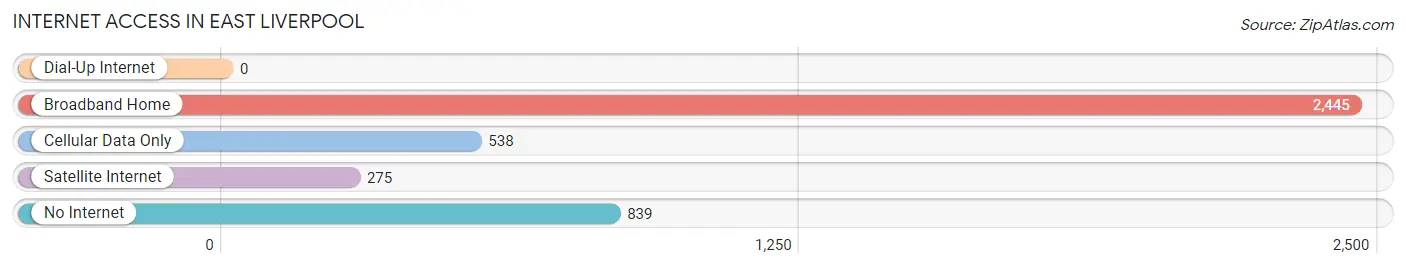
| Internet Type | # Households | % Households |
| Dial-Up Internet | 0 | 0.0% |
| Broadband Home | 2,445 | 62.8% |
| Cellular Data Only | 538 | 13.8% |
| Satellite Internet | 275 | 7.1% |
| No Internet | 839 | 21.5% |
| Total | 3,896 | 100.0% |
East Liverpool Summary
History
The city of East Liverpool, Ohio is located in Columbiana County, Ohio, along the Ohio River. It is the largest city in the county and is known as the “Pottery Capital of the World” due to its long history of pottery production. The city was founded in 1802 by Thomas Fawcett, a potter from England, and was originally known as St. Clair. The city was renamed East Liverpool in 1834 after the city of Liverpool, England.
East Liverpool has a long history of pottery production, beginning in the early 19th century. The city was home to several pottery companies, including the American Encaustic Tiling Company, the American Pottery Company, and the East Liverpool Potteries. These companies produced a variety of pottery items, including dinnerware, tiles, and figurines. The pottery industry was a major employer in the city and helped to drive its economy.
The city was also home to several other industries, including steel production, glass production, and coal mining. The steel industry was particularly important to the city’s economy, as it provided jobs for many of the city’s residents. The city was also home to several glass factories, which produced a variety of glass items, including bottles, jars, and windows.
East Liverpool was also an important transportation hub in the 19th and early 20th centuries. The city was home to several railroads, including the Pennsylvania Railroad, the Baltimore and Ohio Railroad, and the Wheeling and Lake Erie Railroad. These railroads connected the city to other parts of Ohio and the Midwest. The city was also home to several canals, which connected the city to other parts of the Ohio River Valley.
Geography
East Liverpool is located in Columbiana County, Ohio, along the Ohio River. The city is situated at the confluence of the Ohio and Beaver Rivers, and is approximately 40 miles northwest of Pittsburgh, Pennsylvania. The city has a total area of 8.3 square miles, of which 8.2 square miles is land and 0.1 square miles is water.
The city is located in the Appalachian Plateau region of Ohio, and is characterized by rolling hills and valleys. The city is located in a humid continental climate zone, with hot summers and cold winters. The average annual temperature is around 50 degrees Fahrenheit, and the average annual precipitation is around 40 inches.
Economy
East Liverpool’s economy is largely driven by the manufacturing sector. The city is home to several manufacturing companies, including the American Encaustic Tiling Company, the American Pottery Company, and the East Liverpool Potteries. These companies produce a variety of pottery items, including dinnerware, tiles, and figurines. The city is also home to several steel production companies, glass production companies, and coal mining companies.
The city is also home to several retail stores, restaurants, and other businesses. The city is home to several banks, including the East Liverpool Bank and Trust Company, the First National Bank of East Liverpool, and the East Liverpool Savings and Loan Association. The city is also home to several hospitals, including the East Liverpool City Hospital and the East Liverpool Regional Medical Center.
Demographics
As of the 2010 census, the city of East Liverpool had a population of 11,195. The population was spread out, with 48.3% male and 51.7% female. The median age was 41.7 years. The racial makeup of the city was 95.2% White, 2.2% African American, 0.3% Native American, 0.3% Asian, 0.1% Pacific Islander, 0.4% from other races, and 1.5% from two or more races. Hispanic or Latino of any race were 1.2% of the population.
The median household income in East Liverpool was $30,945, and the median family income was $37,917. The per capita income for the city was $17,845. About 17.2% of the population was below the poverty line. The city’s unemployment rate was 8.2% in 2010.
Common Questions
What is Per Capita Income in East Liverpool?
Per Capita income in East Liverpool is $20,649.
What is the Median Family Income in East Liverpool?
Median Family Income in East Liverpool is $45,327.
What is the Median Household income in East Liverpool?
Median Household Income in East Liverpool is $34,560.
What is Income or Wage Gap in East Liverpool?
Income or Wage Gap in East Liverpool is 34.9%.
Women in East Liverpool earn 65.1 cents for every dollar earned by a man.
What is Family Income Deficit in East Liverpool?
Family Income Deficit in East Liverpool is $11,485.
Families that are below poverty line in East Liverpool earn $11,485 less on average than the poverty threshold level.
What is Inequality or Gini Index in East Liverpool?
Inequality or Gini Index in East Liverpool is 0.48.
What is the Total Population of East Liverpool?
Total Population of East Liverpool is 9,969.
What is the Total Male Population of East Liverpool?
Total Male Population of East Liverpool is 4,934.
What is the Total Female Population of East Liverpool?
Total Female Population of East Liverpool is 5,035.
What is the Ratio of Males per 100 Females in East Liverpool?
There are 97.99 Males per 100 Females in East Liverpool.
What is the Ratio of Females per 100 Males in East Liverpool?
There are 102.05 Females per 100 Males in East Liverpool.
What is the Median Population Age in East Liverpool?
Median Population Age in East Liverpool is 37.4 Years.
What is the Average Family Size in East Liverpool
Average Family Size in East Liverpool is 3.2 People.
What is the Average Household Size in East Liverpool
Average Household Size in East Liverpool is 2.5 People.
How Large is the Labor Force in East Liverpool?
There are 4,003 People in the Labor Forcein in East Liverpool.
What is the Percentage of People in the Labor Force in East Liverpool?
53.4% of People are in the Labor Force in East Liverpool.
What is the Unemployment Rate in East Liverpool?
Unemployment Rate in East Liverpool is 6.1%.