Zip Codes with the Highest Percentage of Population Employed in Security & Protection in Cleveland, OH

RELATED REPORTS & OPTIONS

Security & Protection
Population
Families and Households
Female Fertility
Female Fertility (Unmarried)
Race (Community Size)
Race (Percentage)
Ancestry (Community Size)
AfghanAfricanAlbanianAlsatianAmericanApacheArabArgentineanArmenianAustralianAustrianBahamianBangladeshiBarbadianBelgianBelizeanBhutaneseBlackfeetBrazilianBritishBritish West IndianBulgarianBurmeseCajunCambodianCanadianCape VerdeanCarpatho RusynCelticCentral AmericanCentral American IndianCherokeeChickasawChileanChippewaChoctawColombianComancheCosta RicanCreekCroatianCubanCzechCzechoslovakianDanishDelawareDominicanDutchDutch West IndianEastern EuropeanEcuadorianEgyptianEnglishEstonianEthiopianEuropeanFilipinoFinnishFrenchFrench American IndianFrench CanadianGermanGhanaianGreekGuamanian / ChamorroGuatemalanGuyaneseHaitianHonduranHungarianIcelanderIndian (Asian)IndonesianIranianIraqiIrishIroquoisIsraeliItalianJamaicanJapaneseJordanianKoreanLaotianLatvianLebaneseLiberianLithuanianLumbeeLuxembourgerMacedonianMalaysianMexicanMexican American IndianMongolianMoroccanNative HawaiianNavajoNicaraguanNigerianNorthern EuropeanNorwegianPakistaniPalestinianPanamanianParaguayanPennsylvania GermanPeruvianPolishPortuguesePuebloPuerto RicanRomanianRussianSalvadoranSamoanScandinavianScotch-IrishScottishSeminoleSerbianSierra LeoneanSiouxSlavicSlovakSloveneSomaliSouth AfricanSouth AmericanSouth American IndianSpaniardSpanishSri LankanSubsaharan AfricanSudaneseSwedishSwissSyrianThaiTrinidadian and TobagonianTurkishU.S. Virgin IslanderUgandanUkrainianUruguayanVenezuelanVietnameseWelshWest IndianYaquiYugoslavianZimbabwean
Ancestry (Percentage)
AfghanAfricanAlbanianAlsatianAmericanApacheArabArgentineanArmenianAustralianAustrianBahamianBangladeshiBarbadianBelgianBelizeanBhutaneseBlackfeetBrazilianBritishBritish West IndianBulgarianBurmeseCajunCambodianCanadianCape VerdeanCarpatho RusynCelticCentral AmericanCentral American IndianCherokeeChickasawChileanChippewaChoctawColombianComancheCosta RicanCreekCroatianCubanCzechCzechoslovakianDanishDelawareDominicanDutchDutch West IndianEastern EuropeanEcuadorianEgyptianEnglishEstonianEthiopianEuropeanFilipinoFinnishFrenchFrench American IndianFrench CanadianGermanGhanaianGreekGuamanian / ChamorroGuatemalanGuyaneseHaitianHonduranHungarianIcelanderIndian (Asian)IndonesianIranianIraqiIrishIroquoisIsraeliItalianJamaicanJapaneseJordanianKoreanLaotianLatvianLebaneseLiberianLithuanianLumbeeLuxembourgerMacedonianMalaysianMexicanMexican American IndianMongolianMoroccanNative HawaiianNavajoNicaraguanNigerianNorthern EuropeanNorwegianPakistaniPalestinianPanamanianParaguayanPennsylvania GermanPeruvianPolishPortuguesePuebloPuerto RicanRomanianRussianSalvadoranSamoanScandinavianScotch-IrishScottishSeminoleSerbianSierra LeoneanSiouxSlavicSlovakSloveneSomaliSouth AfricanSouth AmericanSouth American IndianSpaniardSpanishSri LankanSubsaharan AfricanSudaneseSwedishSwissSyrianThaiTrinidadian and TobagonianTurkishU.S. Virgin IslanderUgandanUkrainianUruguayanVenezuelanVietnameseWelshWest IndianYaquiYugoslavianZimbabwean
Immigrant Origin (Total)
AfghanistanAfricaAlbaniaArgentinaAsiaAustraliaAustriaBangladeshBarbadosBelarusBelgiumBelizeBosnia and HerzegovinaBrazilBulgariaBurma / MyanmarCambodiaCanadaCaribbeanCentral AmericaChileChinaColombiaCongoCosta RicaCroatiaCubaCzechoslovakiaDominican RepublicEastern AfricaEastern AsiaEastern EuropeEcuadorEgyptEl SalvadorEnglandEthiopiaEuropeFranceGermanyGhanaGreeceGuatemalaGuyanaHaitiHondurasHong KongHungaryIndiaIndonesiaIranIraqIrelandIsraelItalyJamaicaJapanJordanKazakhstanKenyaKoreaKuwaitLaosLatin AmericaLatviaLebanonLiberiaLithuaniaMalaysiaMexicoMiddle AfricaMoldovaMoroccoNepalNetherlandsNicaraguaNigeriaNorthern AfricaNorthern EuropeOceaniaPakistanPanamaPeruPhilippinesPolandRomaniaRussiaSaudi ArabiaScotlandSerbiaSierra LeoneSingaporeSomaliaSouth AfricaSouth AmericaSouth Central AsiaSouth Eastern AsiaSouthern EuropeSpainSri LankaSudanSwedenSyriaTaiwanThailandTrinidad and TobagoTurkeyUgandaUkraineUruguayUzbekistanVenezuelaVietnamWest IndiesWestern AfricaWestern AsiaWestern EuropeZaireZimbabwe
Immigrant Origin (Percentage)
AfghanistanAfricaAlbaniaArgentinaAsiaAustraliaAustriaBangladeshBarbadosBelarusBelgiumBelizeBosnia and HerzegovinaBrazilBulgariaBurma / MyanmarCambodiaCanadaCaribbeanCentral AmericaChileChinaColombiaCongoCosta RicaCroatiaCubaCzechoslovakiaDominican RepublicEastern AfricaEastern AsiaEastern EuropeEcuadorEgyptEl SalvadorEnglandEthiopiaEuropeFranceGermanyGhanaGreeceGuatemalaGuyanaHaitiHondurasHong KongHungaryIndiaIndonesiaIranIraqIrelandIsraelItalyJamaicaJapanJordanKazakhstanKenyaKoreaKuwaitLaosLatin AmericaLatviaLebanonLiberiaLithuaniaMalaysiaMexicoMiddle AfricaMoldovaMoroccoNepalNetherlandsNicaraguaNigeriaNorthern AfricaNorthern EuropeOceaniaPakistanPanamaPeruPhilippinesPolandRomaniaRussiaSaudi ArabiaScotlandSerbiaSierra LeoneSingaporeSomaliaSouth AfricaSouth AmericaSouth Central AsiaSouth Eastern AsiaSouthern EuropeSpainSri LankaSudanSwedenSyriaTaiwanThailandTrinidad and TobagoTurkeyUgandaUkraineUruguayUzbekistanVenezuelaVietnamWest IndiesWestern AfricaWestern AsiaWestern EuropeZaireZimbabwe
Income
Income (Families)
Income (Households)
Poverty
Poverty (Families)
Unemployment
Employment Occupations
Employment Industries
Employer Class
Commute Time
Commute Means
School Enrollment
Education by Degree Field
Occupancy
Finances
Physical Characteristics
Cleveland
Compare Zip Codes
Comparison Subject

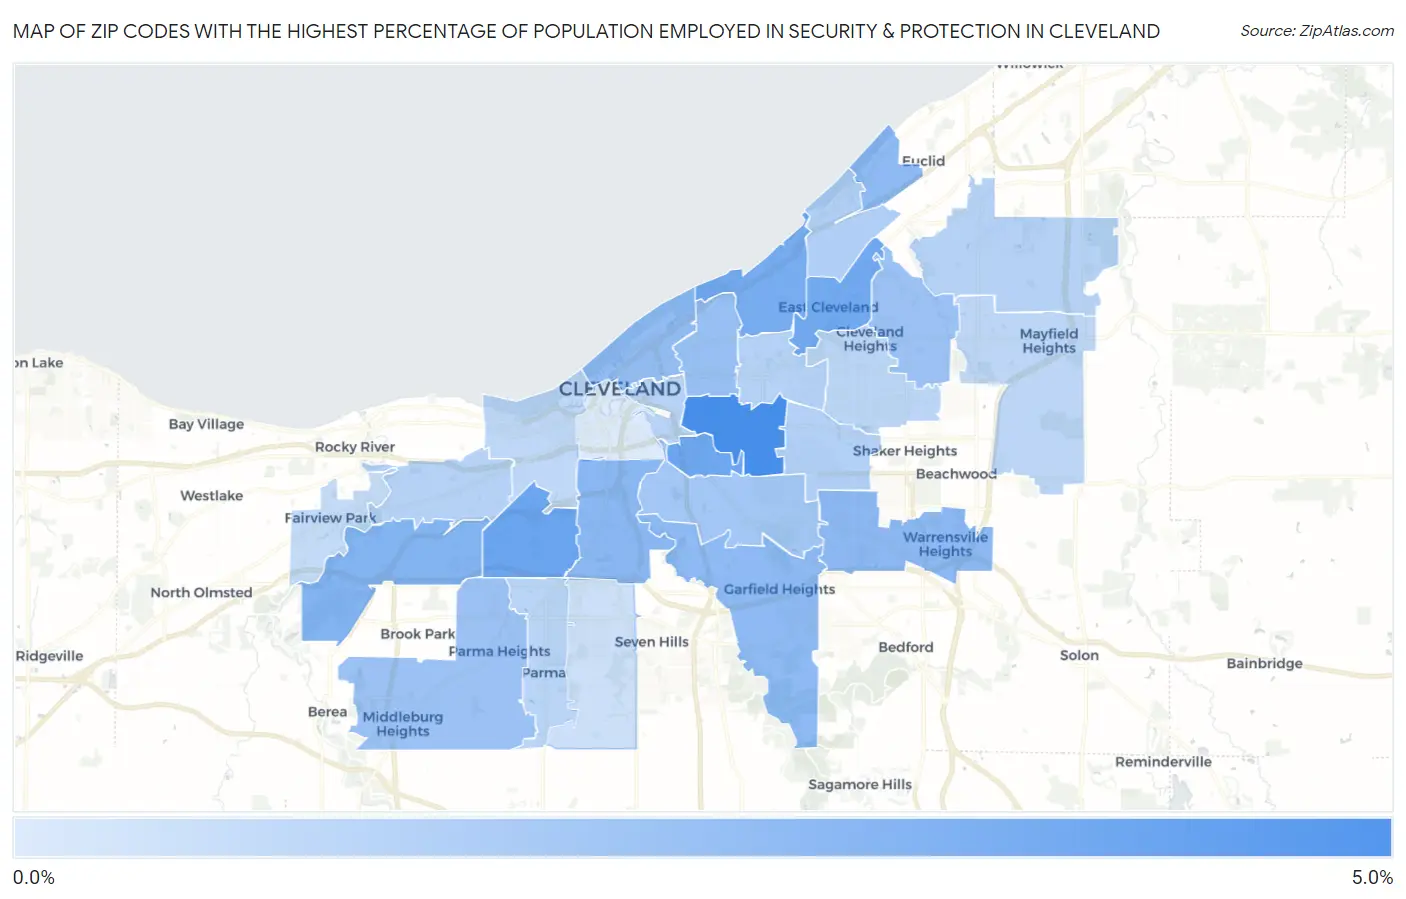
Map of Zip Codes with the Highest Percentage of Population Employed in Security & Protection in Cleveland

0.0%
5.0%
Zip Codes with the Highest Percentage of Population Employed in Security & Protection in Cleveland Map

Zip Codes with the Highest Percentage of Population Employed in Security & Protection in Cleveland, OH

Zip Code % Employed vs State vs National
1.441044.6%1.9%(+2.68)#642.1%(+2.44)#3,464
2.441443.6%1.9%(+1.71)#1172.1%(+1.47)#5,365
3.441273.5%1.9%(+1.62)#1262.1%(+1.39)#5,587
4.441123.4%1.9%(+1.50)#1342.1%(+1.26)#5,892
5.441083.3%1.9%(+1.39)#1462.1%(+1.15)#6,245
6.441353.0%1.9%(+1.11)#1852.1%(+0.870)#7,154
7.441092.9%1.9%(+0.958)#2142.1%(+0.720)#7,785
8.441282.8%1.9%(+0.893)#2232.1%(+0.655)#8,109
9.441192.7%1.9%(+0.807)#2352.1%(+0.569)#8,455
10.441252.7%1.9%(+0.791)#2422.1%(+0.553)#8,530
11.441142.6%1.9%(+0.719)#2532.1%(+0.480)#8,879
12.441032.5%1.9%(+0.549)#2842.1%(+0.311)#9,737
13.441212.4%1.9%(+0.534)#2892.1%(+0.296)#9,825
14.441302.4%1.9%(+0.533)#2902.1%(+0.295)#9,833
15.441052.2%1.9%(+0.294)#3482.1%(+0.056)#11,232
16.441101.8%1.9%(-0.063)#4482.1%(-0.301)#13,583
17.441201.8%1.9%(-0.146)#4672.1%(-0.385)#14,199
18.441111.7%1.9%(-0.195)#4852.1%(-0.433)#14,557
19.441431.7%1.9%(-0.204)#4892.1%(-0.442)#14,631
20.441061.7%1.9%(-0.229)#4952.1%(-0.468)#14,822
21.441151.6%1.9%(-0.269)#5092.1%(-0.507)#15,106
22.441291.6%1.9%(-0.338)#5242.1%(-0.576)#15,626
23.441181.5%1.9%(-0.363)#5332.1%(-0.602)#15,818
24.441241.5%1.9%(-0.369)#5382.1%(-0.607)#15,871
25.441021.5%1.9%(-0.420)#5562.1%(-0.658)#16,287
26.441261.4%1.9%(-0.543)#6042.1%(-0.781)#17,200
27.441341.1%1.9%(-0.767)#6882.1%(-1.01)#18,961
28.441130.71%1.9%(-1.20)#8192.1%(-1.44)#22,032

Common Questions

What are the Top 10 Zip Codes with the Highest Percentage of Population Employed in Security & Protection in Cleveland, OH?
Top 10 Zip Codes with the Highest Percentage of Population Employed in Security & Protection in Cleveland, OH are:
#1
4.6%
#2
3.6%
#3
3.5%
#4
3.4%
#5
3.3%
#6
3.0%
#7
2.9%
#8
2.8%
#9
2.7%
#10
2.7%
What zip code has the Highest Percentage of Population Employed in Security & Protection in Cleveland, OH?
44104 has the Highest Percentage of Population Employed in Security & Protection in Cleveland, OH with 4.6%.
What is the Percentage of Population Employed in Security & Protection in Cleveland, OH?
Percentage of Population Employed in Security & Protection in Cleveland is 2.3%.
What is the Percentage of Population Employed in Security & Protection in Ohio?
Percentage of Population Employed in Security & Protection in Ohio is 1.9%.
What is the Percentage of Population Employed in Security & Protection in the United States?
Percentage of Population Employed in Security & Protection in the United States is 2.1%.