Antioch, OH Map & Demographics
Antioch Map
Antioch Overview
$20,091
PER CAPITA INCOME
$18,750
AVG HOUSEHOLD INCOME
0.56
INEQUALITY / GINI INDEX
47
TOTAL POPULATION
28
MALE POPULATION
19
FEMALE POPULATION
147.37
MALES / 100 FEMALES
67.86
FEMALES / 100 MALES
45.8
MEDIAN AGE
2.1
AVG FAMILY SIZE
1.6
AVG HOUSEHOLD SIZE
20
LABOR FORCE [ PEOPLE ]
47.6%
PERCENT IN LABOR FORCE
30.0%
UNEMPLOYMENT RATE
Antioch Area Codes
Income in Antioch
Income Overview in Antioch
| Characteristic | Number | Measure |
| Per Capita Income | 47 | $20,091 |
| Median Family Income | 17 | $0 |
| Mean Family Income | 17 | $45,794 |
| Median Household Income | 29 | $18,750 |
| Mean Household Income | 29 | $34,410 |
| Income Deficit | 17 | $0 |
| Wage / Income Gap (%) | 47 | 0.00% |
| Wage / Income Gap ($) | 47 | 100.00¢ per $1 |
| Gini / Inequality Index | 47 | 0.56 |
Earnings by Sex in Antioch
| Sex | Number | Average Earnings |
| Male | 17 (80.9%) | $0 |
| Female | 4 (19.1%) | $0 |
| Total | 21 (100.0%) | $0 |
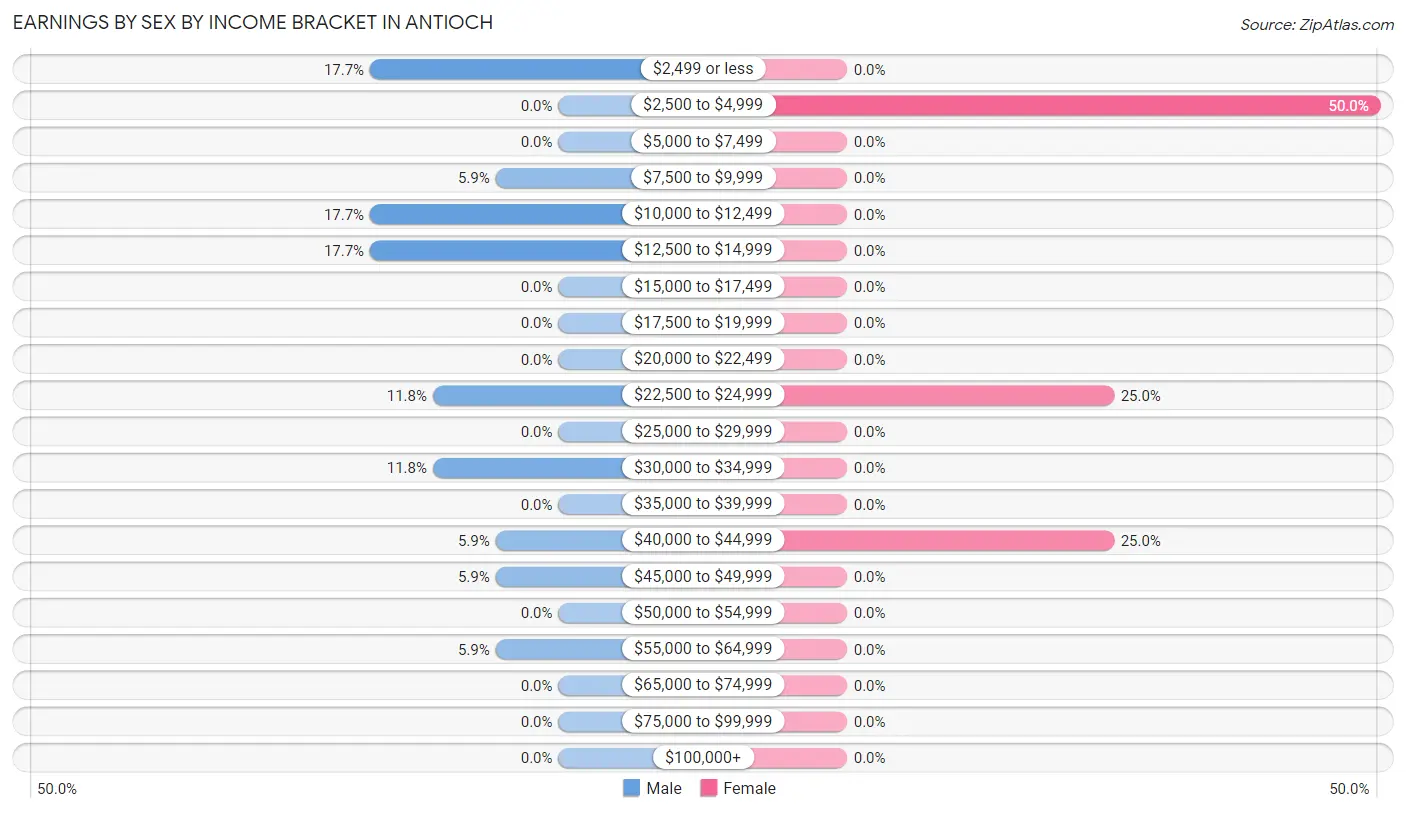
Earnings by Sex by Income Bracket in Antioch
The most common earnings brackets in Antioch are $2,499 or less for men (3 | 17.6%) and $2,500 to $4,999 for women (2 | 50.0%).
| Income | Male | Female |
| $2,499 or less | 3 (17.6%) | 0 (0.0%) |
| $2,500 to $4,999 | 0 (0.0%) | 2 (50.0%) |
| $5,000 to $7,499 | 0 (0.0%) | 0 (0.0%) |
| $7,500 to $9,999 | 1 (5.9%) | 0 (0.0%) |
| $10,000 to $12,499 | 3 (17.6%) | 0 (0.0%) |
| $12,500 to $14,999 | 3 (17.6%) | 0 (0.0%) |
| $15,000 to $17,499 | 0 (0.0%) | 0 (0.0%) |
| $17,500 to $19,999 | 0 (0.0%) | 0 (0.0%) |
| $20,000 to $22,499 | 0 (0.0%) | 0 (0.0%) |
| $22,500 to $24,999 | 2 (11.8%) | 1 (25.0%) |
| $25,000 to $29,999 | 0 (0.0%) | 0 (0.0%) |
| $30,000 to $34,999 | 2 (11.8%) | 0 (0.0%) |
| $35,000 to $39,999 | 0 (0.0%) | 0 (0.0%) |
| $40,000 to $44,999 | 1 (5.9%) | 1 (25.0%) |
| $45,000 to $49,999 | 1 (5.9%) | 0 (0.0%) |
| $50,000 to $54,999 | 0 (0.0%) | 0 (0.0%) |
| $55,000 to $64,999 | 1 (5.9%) | 0 (0.0%) |
| $65,000 to $74,999 | 0 (0.0%) | 0 (0.0%) |
| $75,000 to $99,999 | 0 (0.0%) | 0 (0.0%) |
| $100,000+ | 0 (0.0%) | 0 (0.0%) |
| Total | 17 (100.0%) | 4 (100.0%) |
Earnings by Sex by Educational Attainment in Antioch
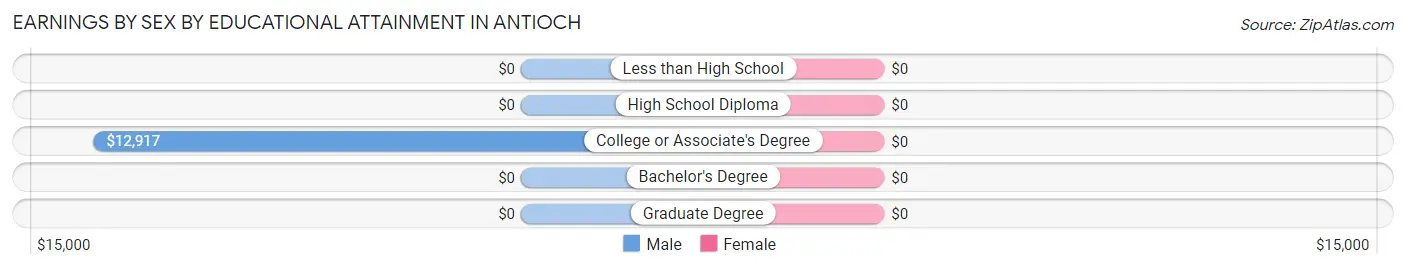
| Educational Attainment | Male Income | Female Income |
| Less than High School | - | - |
| High School Diploma | - | - |
| College or Associate's Degree | $12,917 | $0 |
| Bachelor's Degree | - | - |
| Graduate Degree | - | - |
| Total | - | - |
Family Income in Antioch
Family Income Brackets in Antioch
According to the Antioch family income data, there are 5 families falling into the $15,000 to $24,999 income range, which is the most common income bracket and makes up 29.4% of all families.
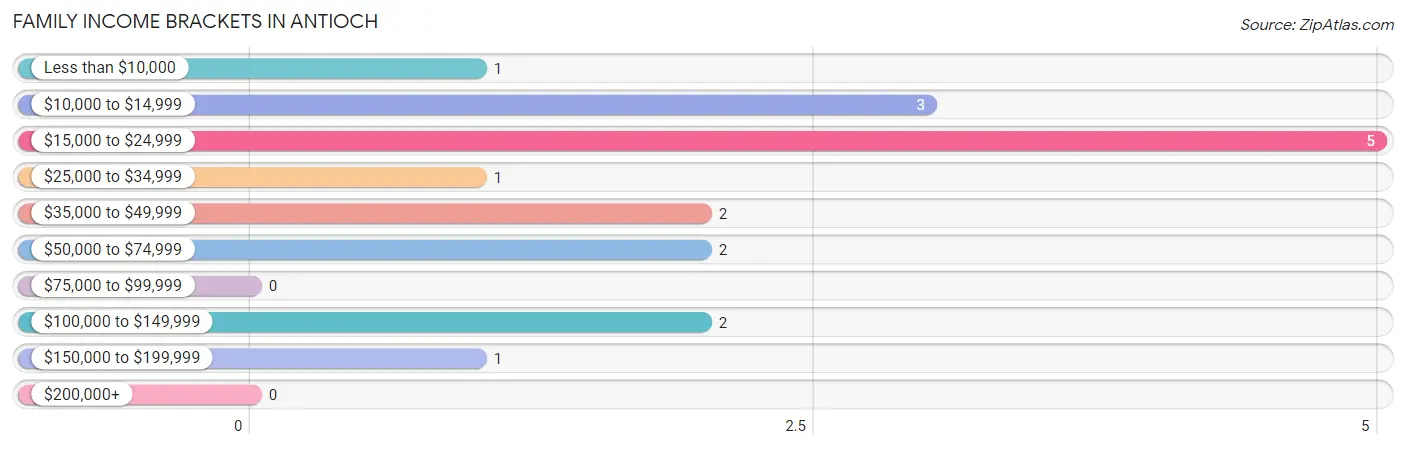
| Income Bracket | # Families | % Families |
| Less than $10,000 | 1 | 5.9% |
| $10,000 to $14,999 | 3 | 17.6% |
| $15,000 to $24,999 | 5 | 29.4% |
| $25,000 to $34,999 | 1 | 5.9% |
| $35,000 to $49,999 | 2 | 11.8% |
| $50,000 to $74,999 | 2 | 11.8% |
| $75,000 to $99,999 | 0 | 0.0% |
| $100,000 to $149,999 | 2 | 11.8% |
| $150,000 to $199,999 | 1 | 5.9% |
| $200,000+ | 0 | 0.0% |
Family Income by Famaliy Size in Antioch
2-person families (11 | 64.7%) account for the highest median family income in Antioch with $43,750 per family, while 2-person families (11 | 64.7%) have the highest median income of $21,875 per family member.
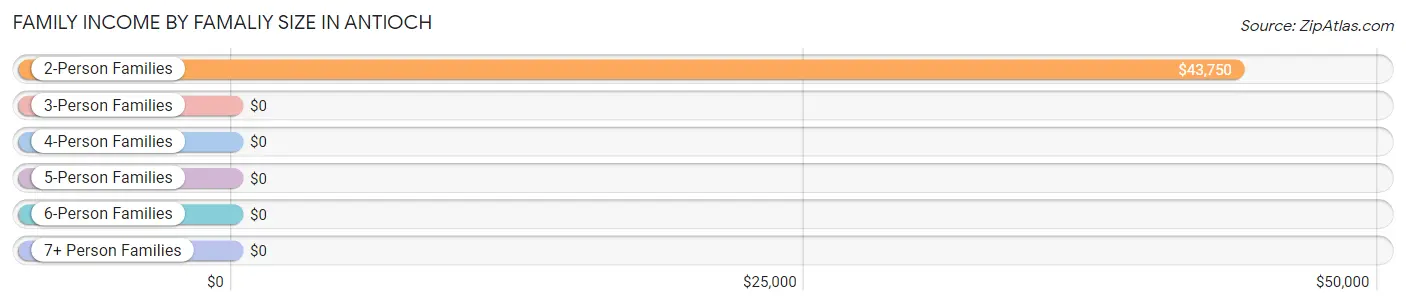
| Income Bracket | # Families | Median Income |
| 2-Person Families | 11 (64.7%) | $43,750 |
| 3-Person Families | 3 (17.6%) | $0 |
| 4-Person Families | 2 (11.8%) | $0 |
| 5-Person Families | 1 (5.9%) | $0 |
| 6-Person Families | 0 (0.0%) | $0 |
| 7+ Person Families | 0 (0.0%) | $0 |
| Total | 17 (100.0%) | $0 |
Family Income by Number of Earners in Antioch
| Number of Earners | # Families | Median Income |
| No Earners | 4 (23.5%) | $0 |
| 1 Earner | 7 (41.2%) | $0 |
| 2 Earners | 6 (35.3%) | $0 |
| 3+ Earners | 0 (0.0%) | $0 |
| Total | 17 (100.0%) | $0 |
Household Income in Antioch
Household Income Brackets in Antioch
With 9 households falling in the category, the $15,000 to $24,999 income range is the most frequent in Antioch, accounting for 31.0% of all households.
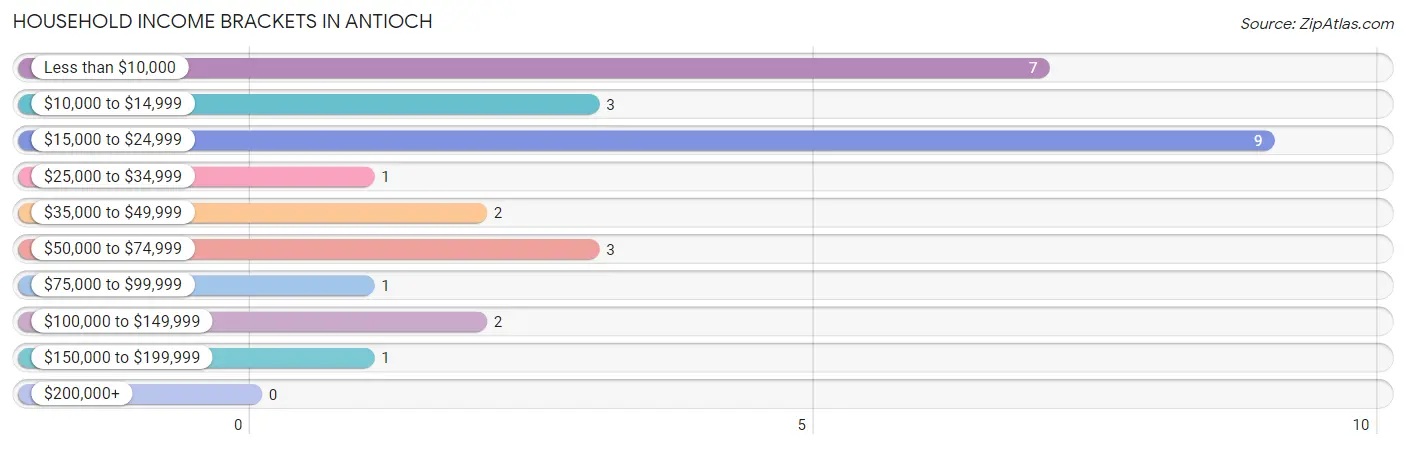
| Income Bracket | # Households | % Households |
| Less than $10,000 | 7 | 24.1% |
| $10,000 to $14,999 | 3 | 10.3% |
| $15,000 to $24,999 | 9 | 31.0% |
| $25,000 to $34,999 | 1 | 3.4% |
| $35,000 to $49,999 | 2 | 6.9% |
| $50,000 to $74,999 | 3 | 10.3% |
| $75,000 to $99,999 | 1 | 3.4% |
| $100,000 to $149,999 | 2 | 6.9% |
| $150,000 to $199,999 | 1 | 3.4% |
| $200,000+ | 0 | 0.0% |
Household Income by Householder Age in Antioch
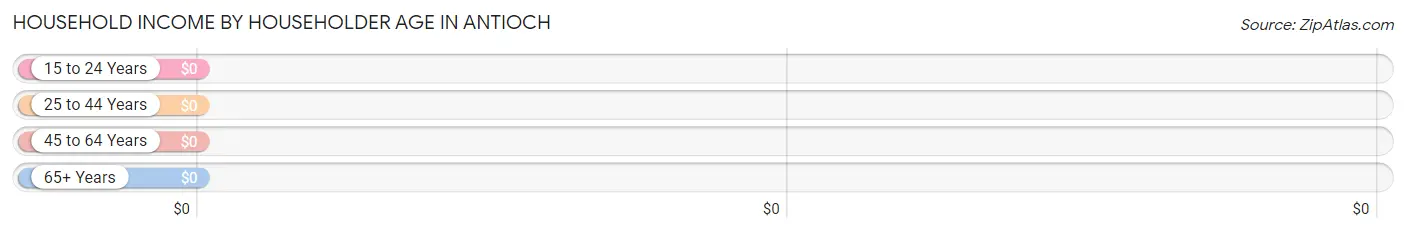
| Income Bracket | # Households | Median Income |
| 15 to 24 Years | 0 (0.0%) | $0 |
| 25 to 44 Years | 12 (41.4%) | $0 |
| 45 to 64 Years | 8 (27.6%) | $0 |
| 65+ Years | 9 (31.0%) | $0 |
| Total | 29 (100.0%) | $18,750 |
Poverty in Antioch
Income Below Poverty by Sex and Age in Antioch
With 46.4% poverty level for males and 52.6% for females among the residents of Antioch, 6 to 11 year old males and under 5 year old females are the most vulnerable to poverty, with 1 males (100.0%) and 2 females (100.0%) in their respective age groups living below the poverty level.
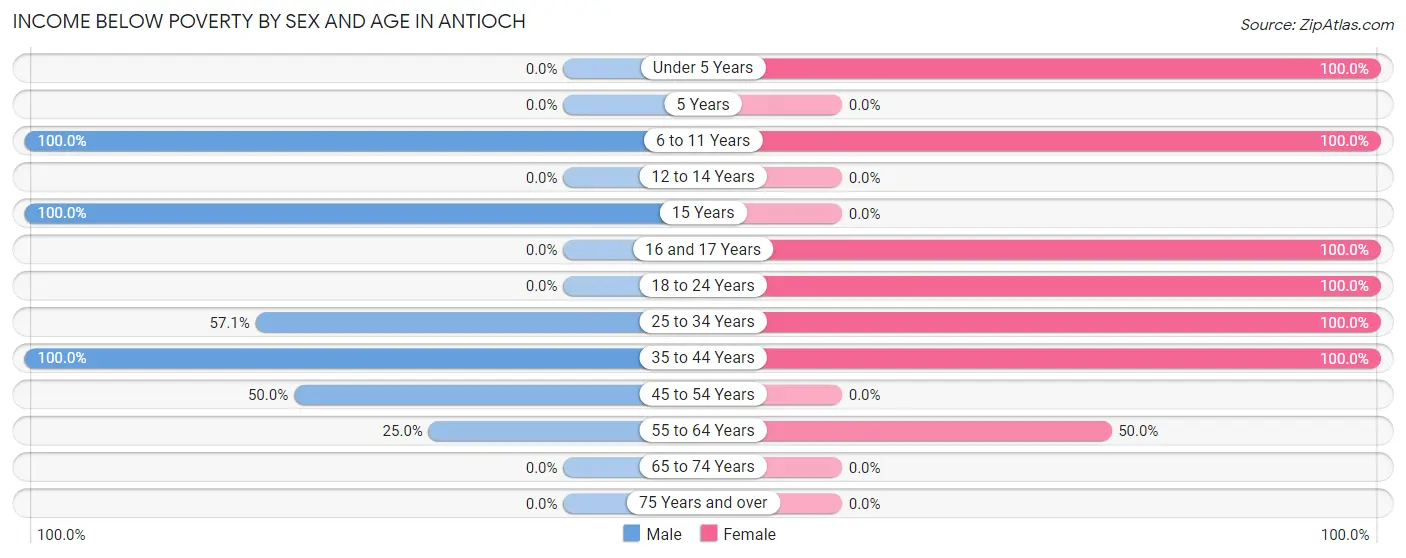
| Age Bracket | Male | Female |
| Under 5 Years | 0 (0.0%) | 2 (100.0%) |
| 5 Years | 0 (0.0%) | 0 (0.0%) |
| 6 to 11 Years | 1 (100.0%) | 1 (100.0%) |
| 12 to 14 Years | 0 (0.0%) | 0 (0.0%) |
| 15 Years | 1 (100.0%) | 0 (0.0%) |
| 16 and 17 Years | 0 (0.0%) | 1 (100.0%) |
| 18 to 24 Years | 0 (0.0%) | 1 (100.0%) |
| 25 to 34 Years | 4 (57.1%) | 2 (100.0%) |
| 35 to 44 Years | 4 (100.0%) | 2 (100.0%) |
| 45 to 54 Years | 2 (50.0%) | 0 (0.0%) |
| 55 to 64 Years | 1 (25.0%) | 1 (50.0%) |
| 65 to 74 Years | 0 (0.0%) | 0 (0.0%) |
| 75 Years and over | 0 (0.0%) | 0 (0.0%) |
| Total | 13 (46.4%) | 10 (52.6%) |
Income Above Poverty by Sex and Age in Antioch
According to the poverty statistics in Antioch, males aged 65 to 74 years and females aged 45 to 54 years are the age groups that are most secure financially, with 100.0% of males and 100.0% of females in these age groups living above the poverty line.
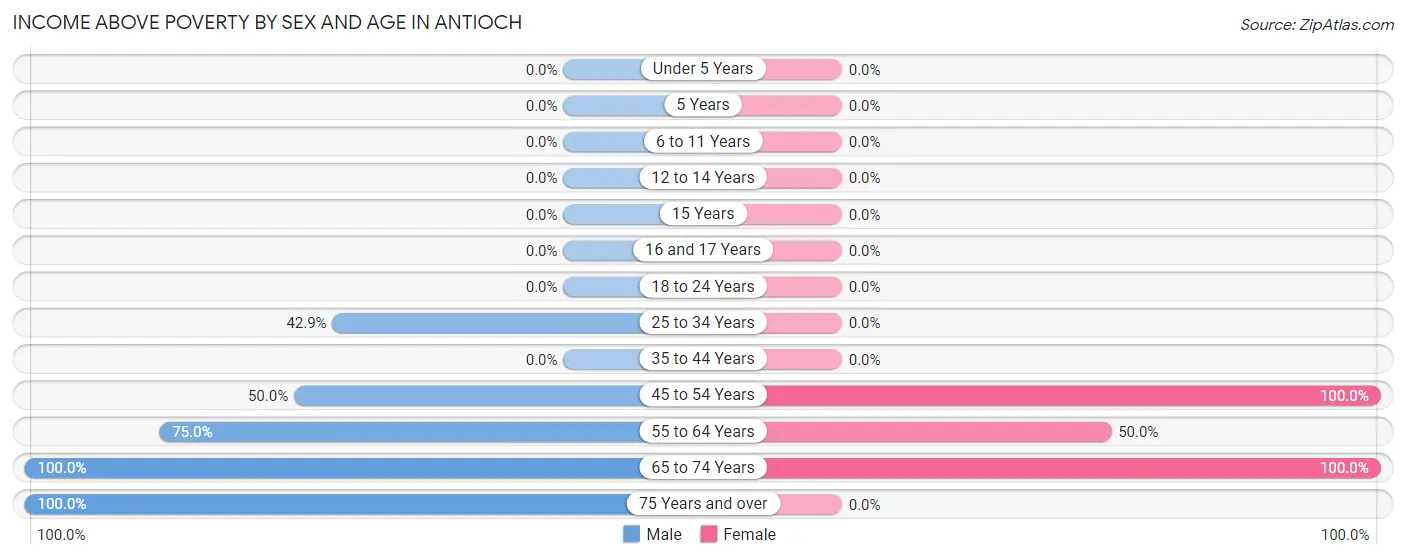
| Age Bracket | Male | Female |
| Under 5 Years | 0 (0.0%) | 0 (0.0%) |
| 5 Years | 0 (0.0%) | 0 (0.0%) |
| 6 to 11 Years | 0 (0.0%) | 0 (0.0%) |
| 12 to 14 Years | 0 (0.0%) | 0 (0.0%) |
| 15 Years | 0 (0.0%) | 0 (0.0%) |
| 16 and 17 Years | 0 (0.0%) | 0 (0.0%) |
| 18 to 24 Years | 0 (0.0%) | 0 (0.0%) |
| 25 to 34 Years | 3 (42.9%) | 0 (0.0%) |
| 35 to 44 Years | 0 (0.0%) | 0 (0.0%) |
| 45 to 54 Years | 2 (50.0%) | 2 (100.0%) |
| 55 to 64 Years | 3 (75.0%) | 1 (50.0%) |
| 65 to 74 Years | 6 (100.0%) | 6 (100.0%) |
| 75 Years and over | 1 (100.0%) | 0 (0.0%) |
| Total | 15 (53.6%) | 9 (47.4%) |
Income Below Poverty Among Married-Couple Families in Antioch
The poverty statistics for married-couple families in Antioch show that 35.7% or 5 of the total 14 families live below the poverty line. Families with 1 or 2 children have the highest poverty rate of 100.0%, comprising of 3 families. On the other hand, families with no children have the lowest poverty rate of 10.0%, which includes 1 families.
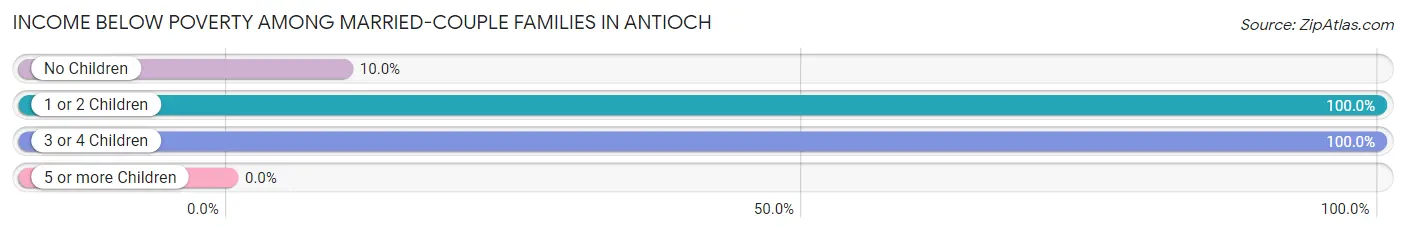
| Children | Above Poverty | Below Poverty |
| No Children | 9 (90.0%) | 1 (10.0%) |
| 1 or 2 Children | 0 (0.0%) | 3 (100.0%) |
| 3 or 4 Children | 0 (0.0%) | 1 (100.0%) |
| 5 or more Children | 0 (0.0%) | 0 (0.0%) |
| Total | 9 (64.3%) | 5 (35.7%) |
Income Below Poverty Among Single-Parent Households in Antioch
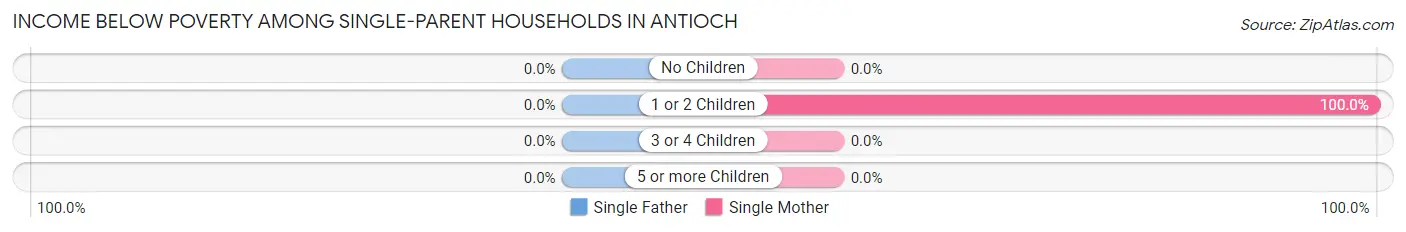
| Children | Single Father | Single Mother |
| No Children | 0 (0.0%) | 0 (0.0%) |
| 1 or 2 Children | 0 (0.0%) | 2 (100.0%) |
| 3 or 4 Children | 0 (0.0%) | 0 (0.0%) |
| 5 or more Children | 0 (0.0%) | 0 (0.0%) |
| Total | 0 (0.0%) | 2 (100.0%) |
Income Below Poverty Among Married-Couple vs Single-Parent Households in Antioch
The poverty data for Antioch shows that 5 of the married-couple family households (35.7%) and 2 of the single-parent households (66.7%) are living below the poverty level. Within the married-couple family households, those with 1 or 2 children have the highest poverty rate, with 3 households (100.0%) falling below the poverty line. Among the single-parent households, those with 1 or 2 children have the highest poverty rate, with 2 household (100.0%) living below poverty.
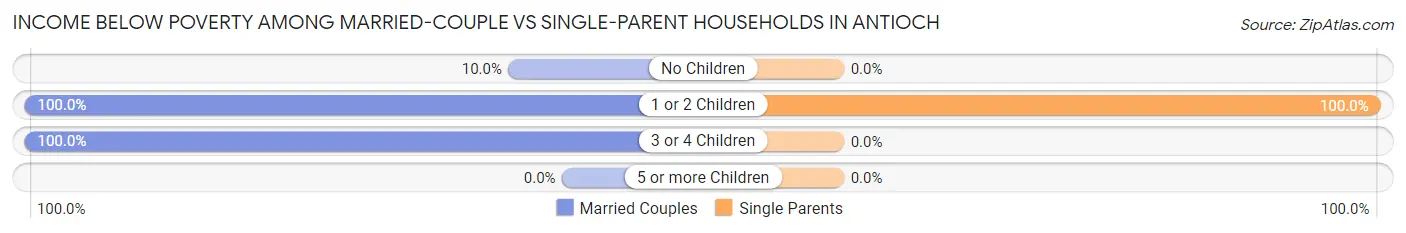
| Children | Married-Couple Families | Single-Parent Households |
| No Children | 1 (10.0%) | 0 (0.0%) |
| 1 or 2 Children | 3 (100.0%) | 2 (100.0%) |
| 3 or 4 Children | 1 (100.0%) | 0 (0.0%) |
| 5 or more Children | 0 (0.0%) | 0 (0.0%) |
| Total | 5 (35.7%) | 2 (66.7%) |
Race in Antioch
The most populous races in Antioch are White / Caucasian (37 | 78.7%), Two or more Races (9 | 19.2%), and Hispanic or Latino (4 | 8.5%).
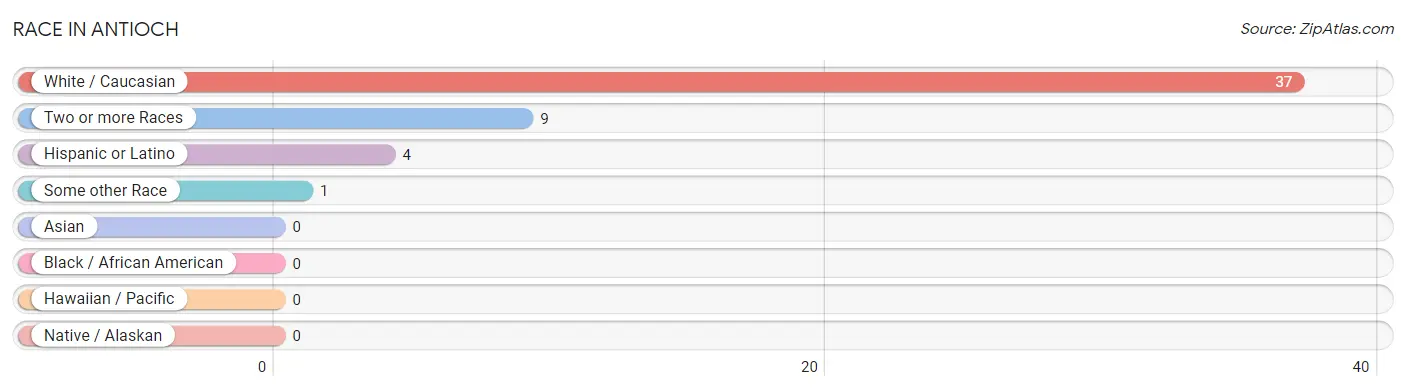
| Race | # Population | % Population |
| Asian | 0 | 0.0% |
| Black / African American | 0 | 0.0% |
| Hawaiian / Pacific | 0 | 0.0% |
| Hispanic or Latino | 4 | 8.5% |
| Native / Alaskan | 0 | 0.0% |
| White / Caucasian | 37 | 78.7% |
| Two or more Races | 9 | 19.2% |
| Some other Race | 1 | 2.1% |
| Total | 47 | 100.0% |
Ancestry in Antioch
The most populous ancestries reported in Antioch are German (19 | 40.4%), Irish (13 | 27.7%), American (5 | 10.6%), English (4 | 8.5%), and Mexican (4 | 8.5%), together accounting for 95.8% of all Antioch residents.
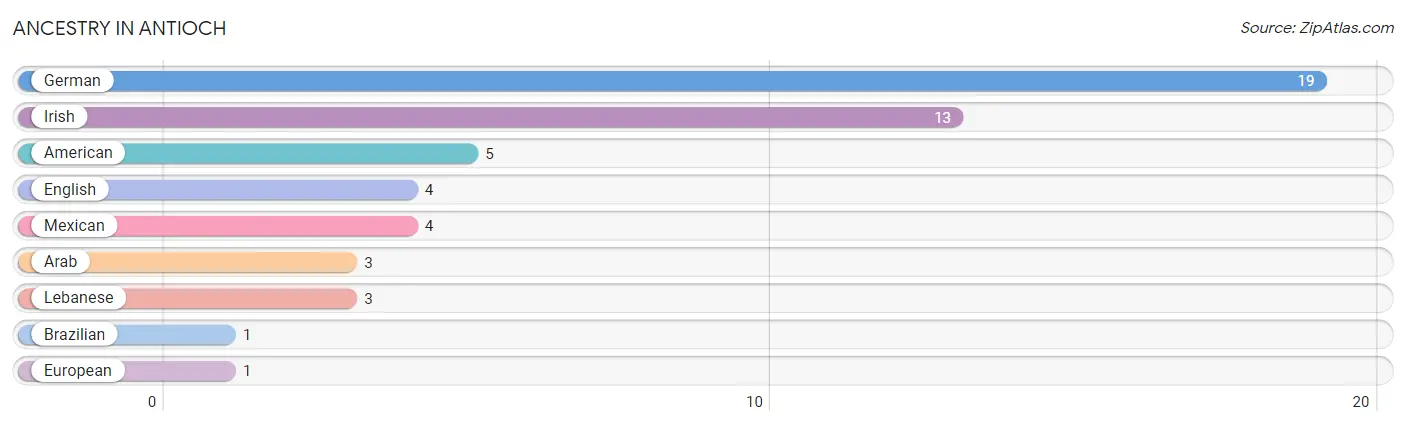
| Ancestry | # Population | % Population |
| American | 5 | 10.6% |
| Arab | 3 | 6.4% |
| Brazilian | 1 | 2.1% |
| English | 4 | 8.5% |
| European | 1 | 2.1% |
| German | 19 | 40.4% |
| Irish | 13 | 27.7% |
| Lebanese | 3 | 6.4% |
| Mexican | 4 | 8.5% | View All 9 Rows |
Immigrants in Antioch
The most numerous immigrant groups reported in Antioch came from Brazil (1 | 2.1%), Latin America (1 | 2.1%), and South America (1 | 2.1%), together accounting for 6.4% of all Antioch residents.
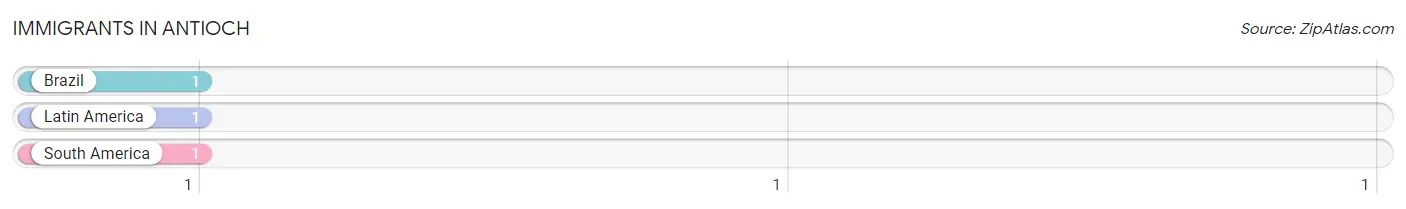
| Immigration Origin | # Population | % Population |
| Brazil | 1 | 2.1% |
| Latin America | 1 | 2.1% |
| South America | 1 | 2.1% | View All 3 Rows |
Sex and Age in Antioch
Sex and Age in Antioch
The most populous age groups in Antioch are 25 to 29 Years (6 | 21.4%) for men and 65 to 69 Years (3 | 15.8%) for women.
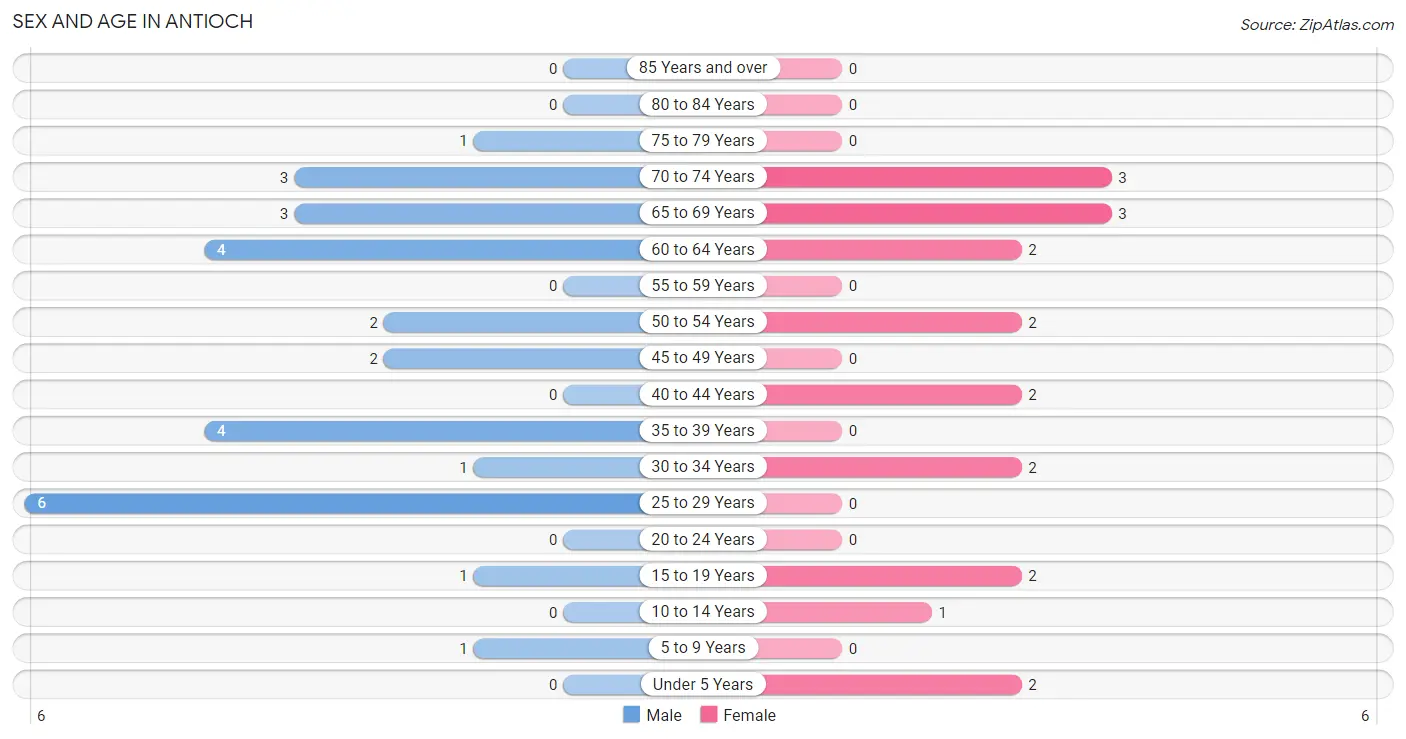
| Age Bracket | Male | Female |
| Under 5 Years | 0 (0.0%) | 2 (10.5%) |
| 5 to 9 Years | 1 (3.6%) | 0 (0.0%) |
| 10 to 14 Years | 0 (0.0%) | 1 (5.3%) |
| 15 to 19 Years | 1 (3.6%) | 2 (10.5%) |
| 20 to 24 Years | 0 (0.0%) | 0 (0.0%) |
| 25 to 29 Years | 6 (21.4%) | 0 (0.0%) |
| 30 to 34 Years | 1 (3.6%) | 2 (10.5%) |
| 35 to 39 Years | 4 (14.3%) | 0 (0.0%) |
| 40 to 44 Years | 0 (0.0%) | 2 (10.5%) |
| 45 to 49 Years | 2 (7.1%) | 0 (0.0%) |
| 50 to 54 Years | 2 (7.1%) | 2 (10.5%) |
| 55 to 59 Years | 0 (0.0%) | 0 (0.0%) |
| 60 to 64 Years | 4 (14.3%) | 2 (10.5%) |
| 65 to 69 Years | 3 (10.7%) | 3 (15.8%) |
| 70 to 74 Years | 3 (10.7%) | 3 (15.8%) |
| 75 to 79 Years | 1 (3.6%) | 0 (0.0%) |
| 80 to 84 Years | 0 (0.0%) | 0 (0.0%) |
| 85 Years and over | 0 (0.0%) | 0 (0.0%) |
| Total | 28 (100.0%) | 19 (100.0%) |
Families and Households in Antioch
Median Family Size in Antioch
The median family size in Antioch is 2.06 persons per family, with single female/mother families (2 | 11.8%) accounting for the largest median family size of 2.5 persons per family. On the other hand, married-couple families (14 | 82.4%) represent the smallest median family size with 2.00 persons per family.
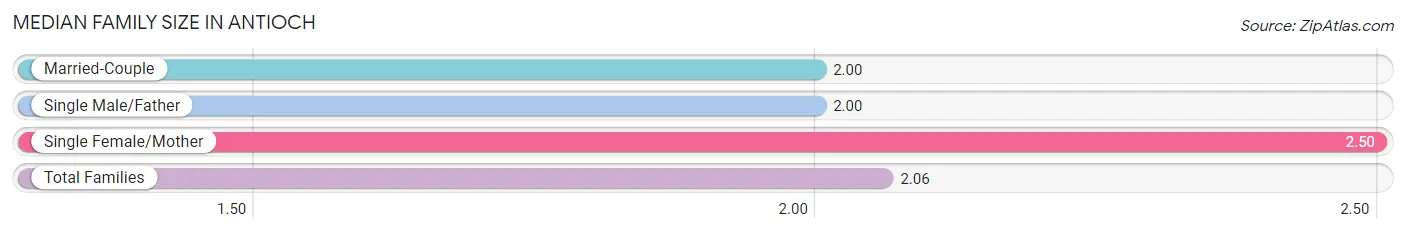
| Family Type | # Families | Family Size |
| Married-Couple | 14 (82.4%) | 2.00 |
| Single Male/Father | 1 (5.9%) | 2.00 |
| Single Female/Mother | 2 (11.8%) | 2.50 |
| Total Families | 17 (100.0%) | 2.06 |
Median Household Size in Antioch
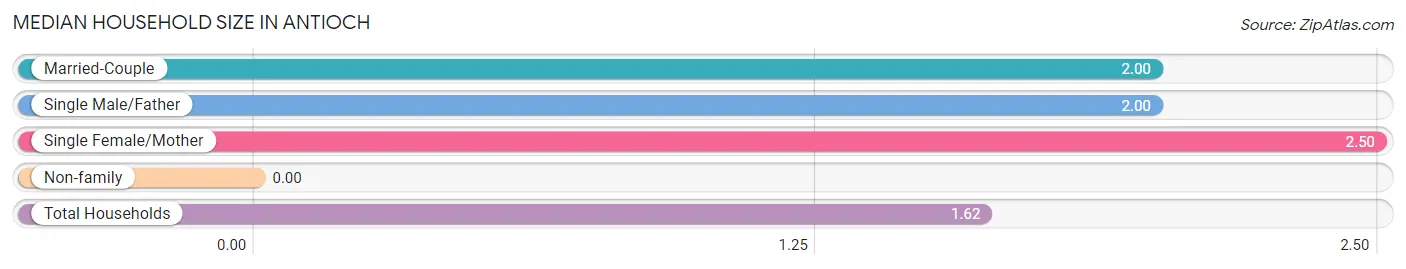
| Household Type | # Households | Household Size |
| Married-Couple | 14 (48.3%) | 2.00 |
| Single Male/Father | 1 (3.5%) | 2.00 |
| Single Female/Mother | 2 (6.9%) | 2.50 |
| Non-family | 12 (41.4%) | - |
| Total Households | 29 (100.0%) | 1.62 |
Household Size by Marriage Status in Antioch
Out of a total of 29 households in Antioch, 17 (58.6%) are family households, while 12 (41.4%) are nonfamily households. The most numerous type of family households are 2-person households, comprising 11, and the most common type of nonfamily households are 1-person households, comprising 12.
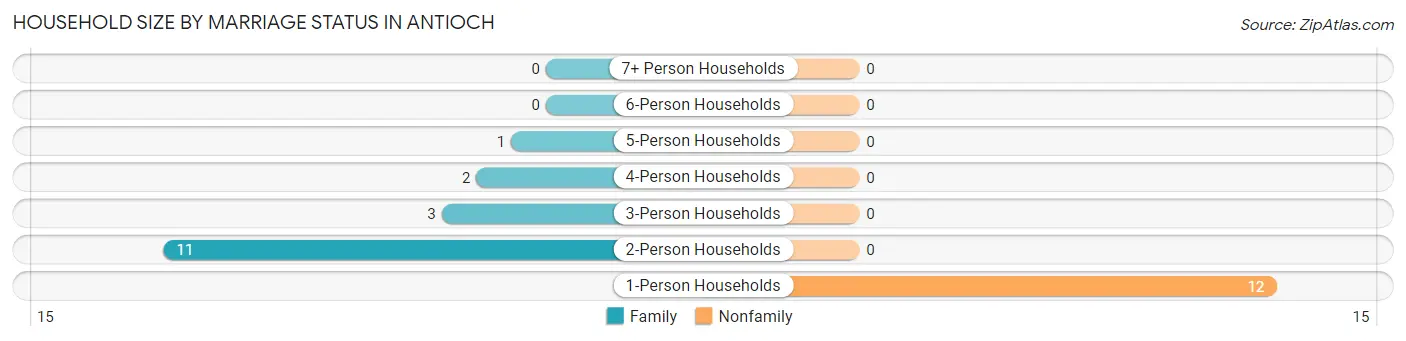
| Household Size | Family Households | Nonfamily Households |
| 1-Person Households | - | 12 (41.4%) |
| 2-Person Households | 11 (37.9%) | 0 (0.0%) |
| 3-Person Households | 3 (10.3%) | 0 (0.0%) |
| 4-Person Households | 2 (6.9%) | 0 (0.0%) |
| 5-Person Households | 1 (3.5%) | 0 (0.0%) |
| 6-Person Households | 0 (0.0%) | 0 (0.0%) |
| 7+ Person Households | 0 (0.0%) | 0 (0.0%) |
| Total | 17 (58.6%) | 12 (41.4%) |
Female Fertility in Antioch
Fertility by Age in Antioch
| Age Bracket | Women with Births | Births / 1,000 Women |
| 15 to 19 years | 0 (0.0%) | 0.0 |
| 20 to 34 years | 0 (0.0%) | 0.0 |
| 35 to 50 years | 0 (0.0%) | 0.0 |
| Total | 0 (0.0%) | 0.0 |
Fertility by Age by Marriage Status in Antioch
| Age Bracket | Married | Unmarried |
| 15 to 19 years | 0 (0.0%) | 0 (0.0%) |
| 20 to 34 years | 0 (0.0%) | 0 (0.0%) |
| 35 to 50 years | 0 (0.0%) | 0 (0.0%) |
| Total | 0 (0.0%) | 0 (0.0%) |
Fertility by Education in Antioch
| Educational Attainment | Women with Births | Births / 1,000 Women |
| Less than High School | 0 (0.0%) | 0.0 |
| High School Diploma | 0 (0.0%) | 0.0 |
| College or Associate's Degree | 0 (0.0%) | 0.0 |
| Bachelor's Degree | 0 (0.0%) | 0.0 |
| Graduate Degree | 0 (0.0%) | 0.0 |
| Total | 0 (0.0%) | 0.0 |
Fertility by Education by Marriage Status in Antioch
| Educational Attainment | Married | Unmarried |
| Less than High School | 0 (0.0%) | 0 (0.0%) |
| High School Diploma | 0 (0.0%) | 0 (0.0%) |
| College or Associate's Degree | 0 (0.0%) | 0 (0.0%) |
| Bachelor's Degree | 0 (0.0%) | 0 (0.0%) |
| Graduate Degree | 0 (0.0%) | 0 (0.0%) |
| Total | 0 (0.0%) | 0 (0.0%) |
Employment Characteristics in Antioch
Employment by Class of Employer in Antioch
Among the 14 employed individuals in Antioch, private company employees (11 | 78.6%), not-for-profit organizations (2 | 14.3%), and local government employees (1 | 7.1%) make up the most common classes of employment.
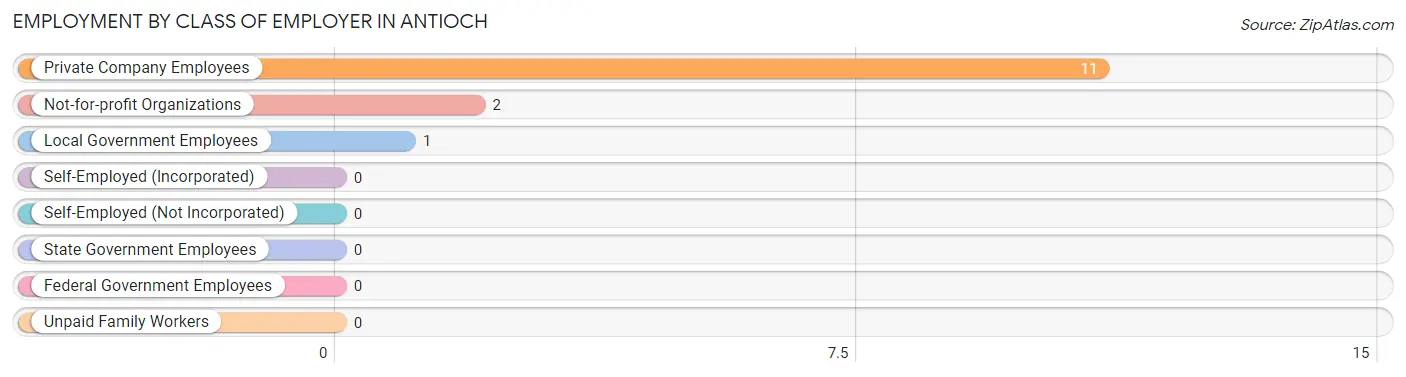
| Employer Class | # Employees | % Employees |
| Private Company Employees | 11 | 78.6% |
| Self-Employed (Incorporated) | 0 | 0.0% |
| Self-Employed (Not Incorporated) | 0 | 0.0% |
| Not-for-profit Organizations | 2 | 14.3% |
| Local Government Employees | 1 | 7.1% |
| State Government Employees | 0 | 0.0% |
| Federal Government Employees | 0 | 0.0% |
| Unpaid Family Workers | 0 | 0.0% |
| Total | 14 | 100.0% |
Employment Status by Age in Antioch
According to the labor force statistics for Antioch, out of the total population over 16 years of age (42), 47.6% or 20 individuals are in the labor force, with 30.0% or 6 of them unemployed. The age group with the highest labor force participation rate is 25 to 29 years, with 100.0% or 6 individuals in the labor force. Within the labor force, the 35 to 44 years age range has the highest percentage of unemployed individuals, with 100.0% or 4 of them being unemployed.
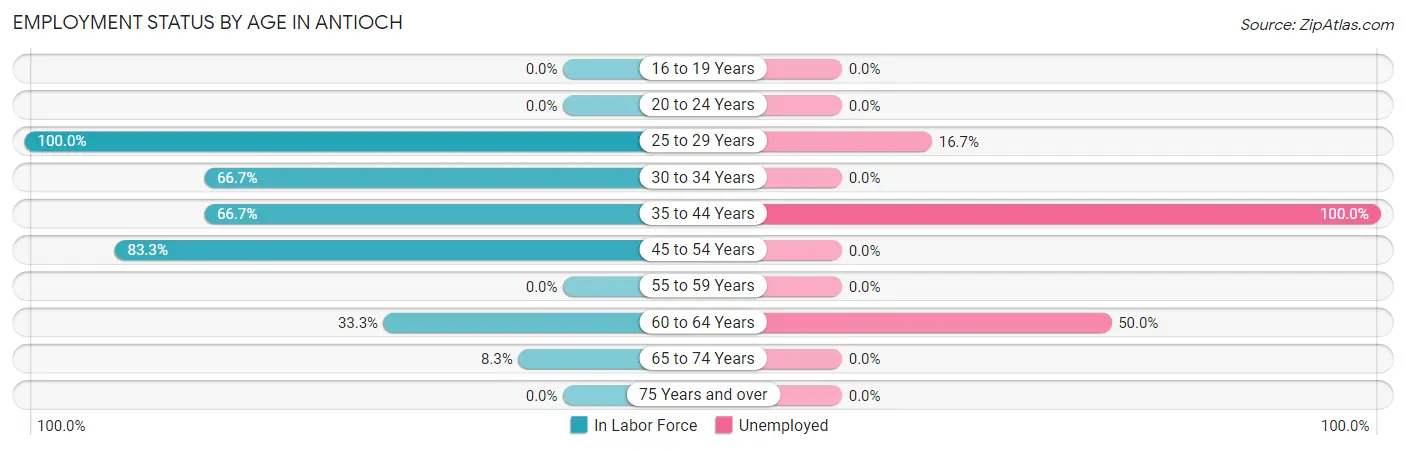
| Age Bracket | In Labor Force | Unemployed |
| 16 to 19 Years | 0 (0.0%) | 0 (0.0%) |
| 20 to 24 Years | 0 (0.0%) | 0 (0.0%) |
| 25 to 29 Years | 6 (100.0%) | 1 (16.7%) |
| 30 to 34 Years | 2 (66.7%) | 0 (0.0%) |
| 35 to 44 Years | 4 (66.7%) | 4 (100.0%) |
| 45 to 54 Years | 5 (83.3%) | 0 (0.0%) |
| 55 to 59 Years | 0 (0.0%) | 0 (0.0%) |
| 60 to 64 Years | 2 (33.3%) | 1 (50.0%) |
| 65 to 74 Years | 1 (8.3%) | 0 (0.0%) |
| 75 Years and over | 0 (0.0%) | 0 (0.0%) |
| Total | 20 (47.6%) | 6 (30.0%) |
Employment Status by Educational Attainment in Antioch
According to labor force statistics for Antioch, 70.4% of individuals (19) out of the total population between 25 and 64 years of age (27) are in the labor force, with 31.6% or 6 of them being unemployed. The group with the highest labor force participation rate are those with the educational attainment of bachelor's degree or higher, with 100.0% or 1 individuals in the labor force. Within the labor force, individuals with high school diploma education have the highest percentage of unemployment, with 33.3% or 2 of them being unemployed.
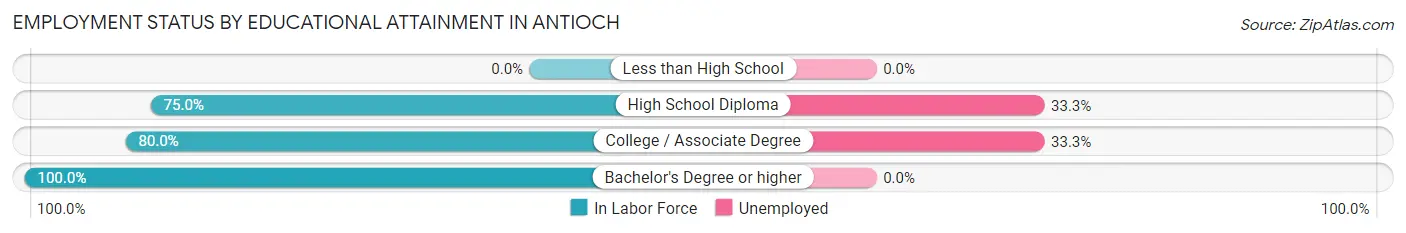
| Educational Attainment | In Labor Force | Unemployed |
| Less than High School | 0 (0.0%) | 0 (0.0%) |
| High School Diploma | 6 (75.0%) | 3 (33.3%) |
| College / Associate Degree | 12 (80.0%) | 5 (33.3%) |
| Bachelor's Degree or higher | 1 (100.0%) | 0 (0.0%) |
| Total | 19 (70.4%) | 9 (31.6%) |
Employment Occupations by Sex in Antioch
Management, Business, Science and Arts Occupations
The most common Management, Business, Science and Arts occupations in Antioch are Management (2 | 14.3%), Community & Social Service (1 | 7.1%), and Education Instruction & Library (1 | 7.1%).
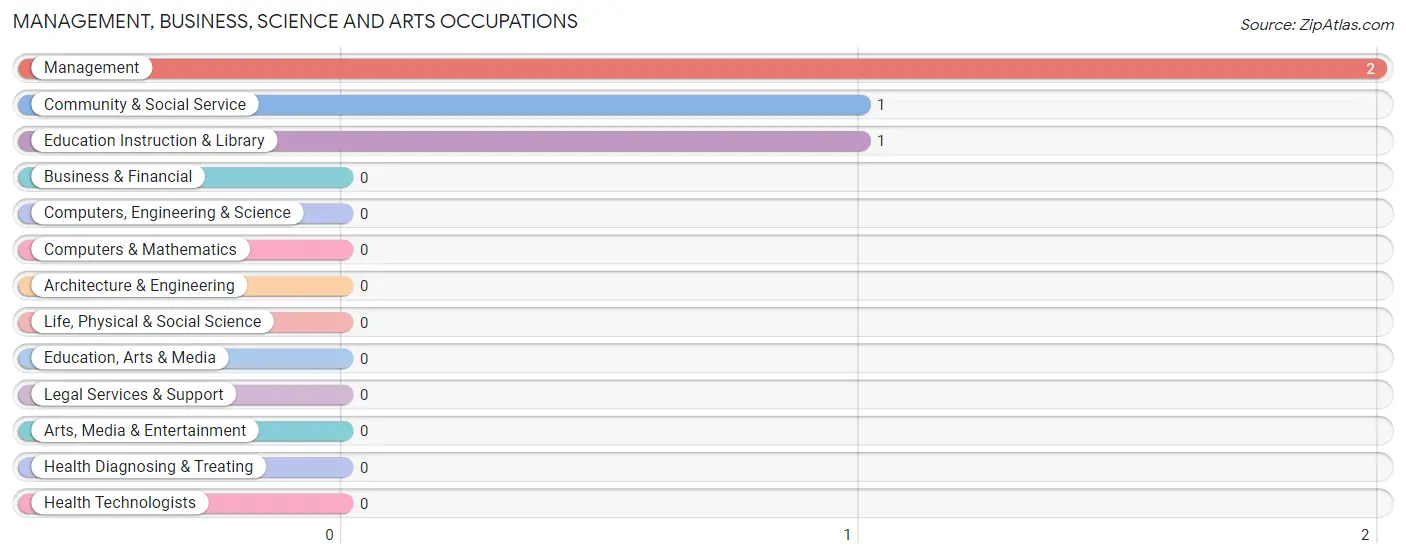
Management, Business, Science and Arts Occupations by Sex
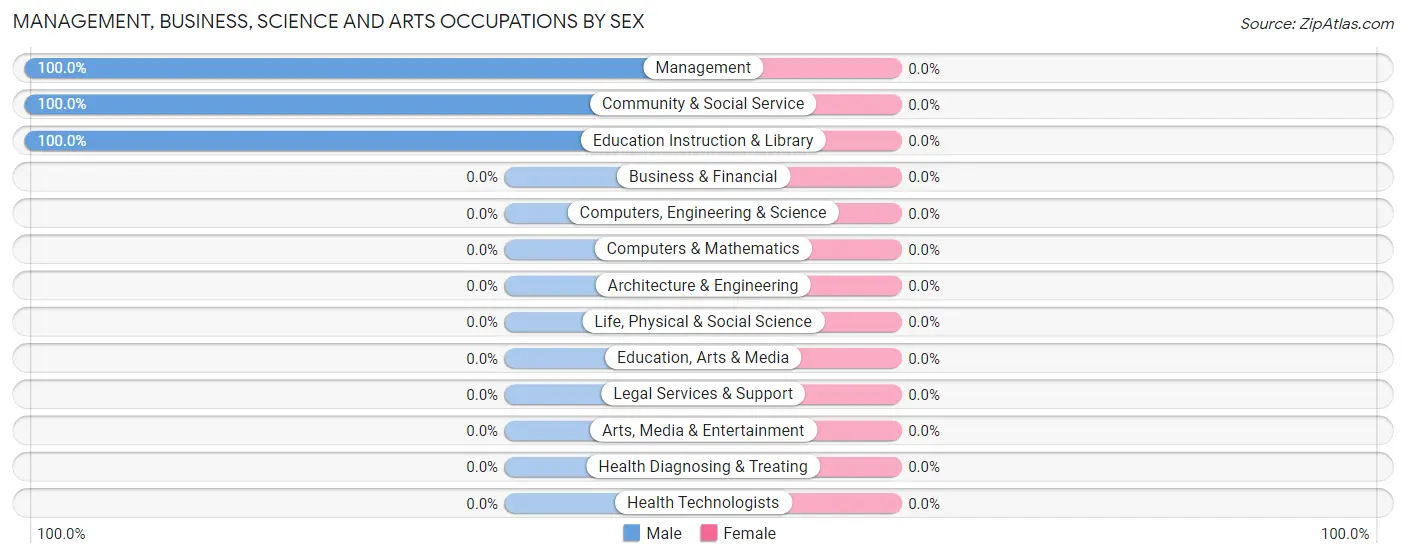
| Occupation | Male | Female |
| Management | 2 (100.0%) | 0 (0.0%) |
| Business & Financial | 0 (0.0%) | 0 (0.0%) |
| Computers, Engineering & Science | 0 (0.0%) | 0 (0.0%) |
| Computers & Mathematics | 0 (0.0%) | 0 (0.0%) |
| Architecture & Engineering | 0 (0.0%) | 0 (0.0%) |
| Life, Physical & Social Science | 0 (0.0%) | 0 (0.0%) |
| Community & Social Service | 1 (100.0%) | 0 (0.0%) |
| Education, Arts & Media | 0 (0.0%) | 0 (0.0%) |
| Legal Services & Support | 0 (0.0%) | 0 (0.0%) |
| Education Instruction & Library | 1 (100.0%) | 0 (0.0%) |
| Arts, Media & Entertainment | 0 (0.0%) | 0 (0.0%) |
| Health Diagnosing & Treating | 0 (0.0%) | 0 (0.0%) |
| Health Technologists | 0 (0.0%) | 0 (0.0%) |
| Total (Category) | 3 (100.0%) | 0 (0.0%) |
| Total (Overall) | 12 (85.7%) | 2 (14.3%) |
Services Occupations
The most common Services occupations in Antioch are Security & Protection (2 | 14.3%), Firefighting & Prevention (2 | 14.3%), and Personal Care & Service (1 | 7.1%).
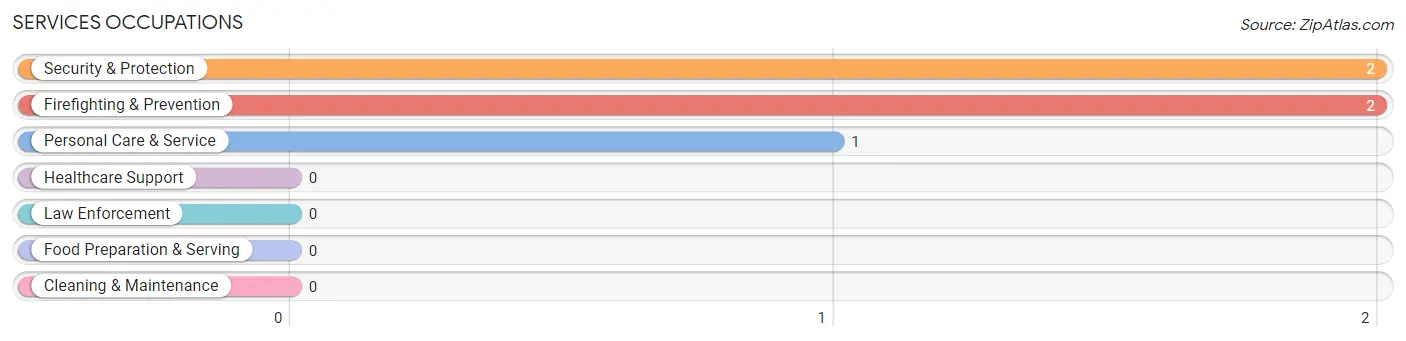
Services Occupations by Sex
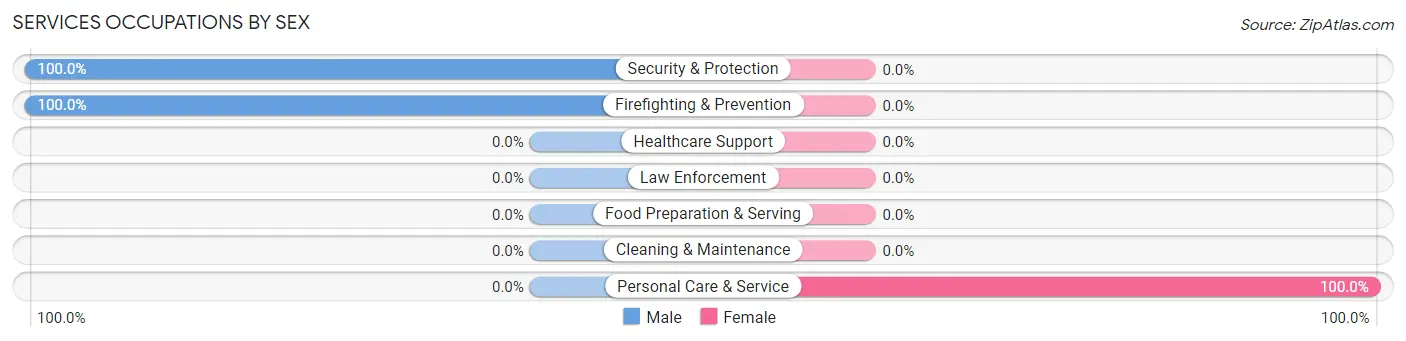
| Occupation | Male | Female |
| Healthcare Support | 0 (0.0%) | 0 (0.0%) |
| Security & Protection | 2 (100.0%) | 0 (0.0%) |
| Firefighting & Prevention | 2 (100.0%) | 0 (0.0%) |
| Law Enforcement | 0 (0.0%) | 0 (0.0%) |
| Food Preparation & Serving | 0 (0.0%) | 0 (0.0%) |
| Cleaning & Maintenance | 0 (0.0%) | 0 (0.0%) |
| Personal Care & Service | 0 (0.0%) | 1 (100.0%) |
| Total (Category) | 2 (66.7%) | 1 (33.3%) |
| Total (Overall) | 12 (85.7%) | 2 (14.3%) |
Sales and Office Occupations
The most common Sales and Office occupations in Antioch are , and Office & Administration (4 | 28.6%).
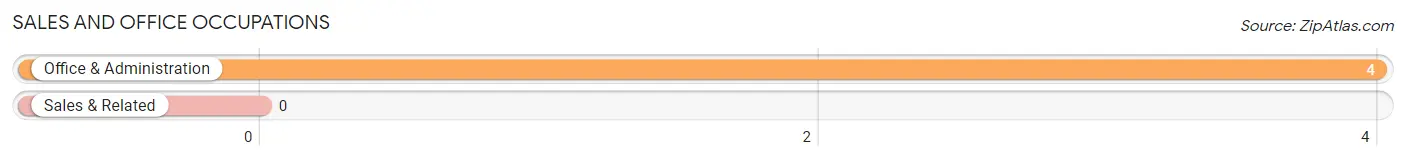
Sales and Office Occupations by Sex
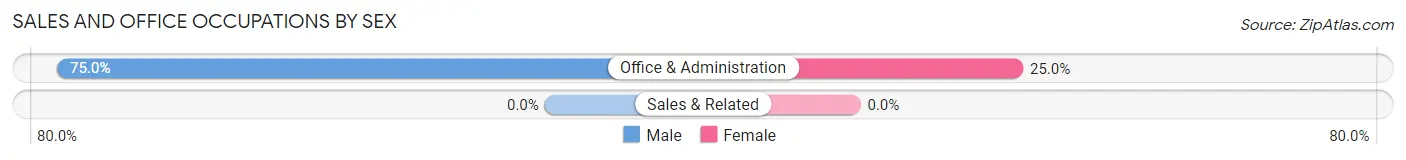
| Occupation | Male | Female |
| Sales & Related | 0 (0.0%) | 0 (0.0%) |
| Office & Administration | 3 (75.0%) | 1 (25.0%) |
| Total (Category) | 3 (75.0%) | 1 (25.0%) |
| Total (Overall) | 12 (85.7%) | 2 (14.3%) |
Natural Resources, Construction and Maintenance Occupations
The most common Natural Resources, Construction and Maintenance occupations in Antioch are , and Construction & Extraction (1 | 7.1%).
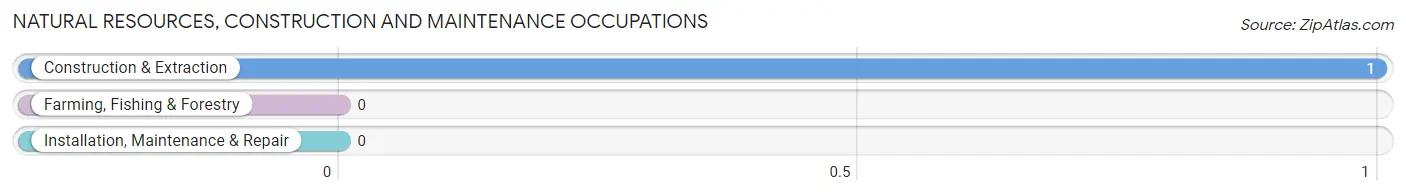
Natural Resources, Construction and Maintenance Occupations by Sex
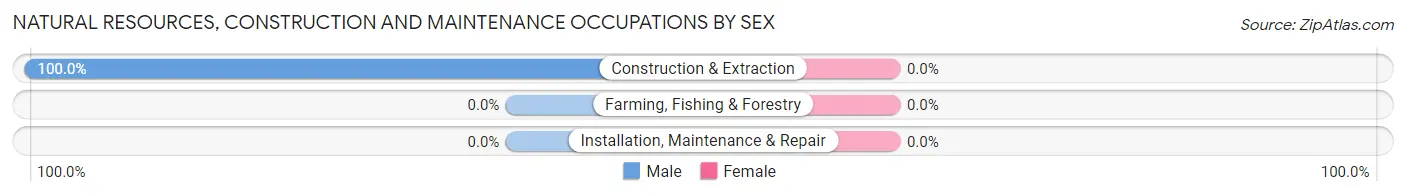
| Occupation | Male | Female |
| Farming, Fishing & Forestry | 0 (0.0%) | 0 (0.0%) |
| Construction & Extraction | 1 (100.0%) | 0 (0.0%) |
| Installation, Maintenance & Repair | 0 (0.0%) | 0 (0.0%) |
| Total (Category) | 1 (100.0%) | 0 (0.0%) |
| Total (Overall) | 12 (85.7%) | 2 (14.3%) |
Production, Transportation and Moving Occupations
The most common Production, Transportation and Moving occupations in Antioch are , and Transportation (3 | 21.4%).
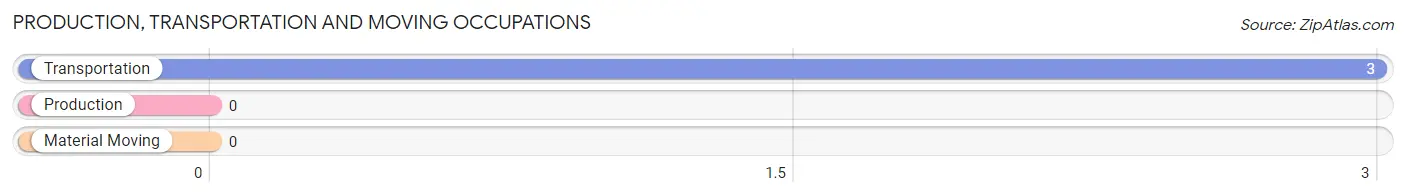
Production, Transportation and Moving Occupations by Sex
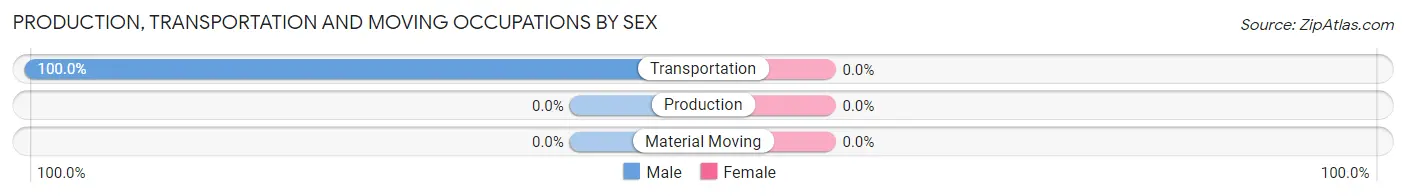
| Occupation | Male | Female |
| Production | 0 (0.0%) | 0 (0.0%) |
| Transportation | 3 (100.0%) | 0 (0.0%) |
| Material Moving | 0 (0.0%) | 0 (0.0%) |
| Total (Category) | 3 (100.0%) | 0 (0.0%) |
| Total (Overall) | 12 (85.7%) | 2 (14.3%) |
Employment Industries by Sex in Antioch
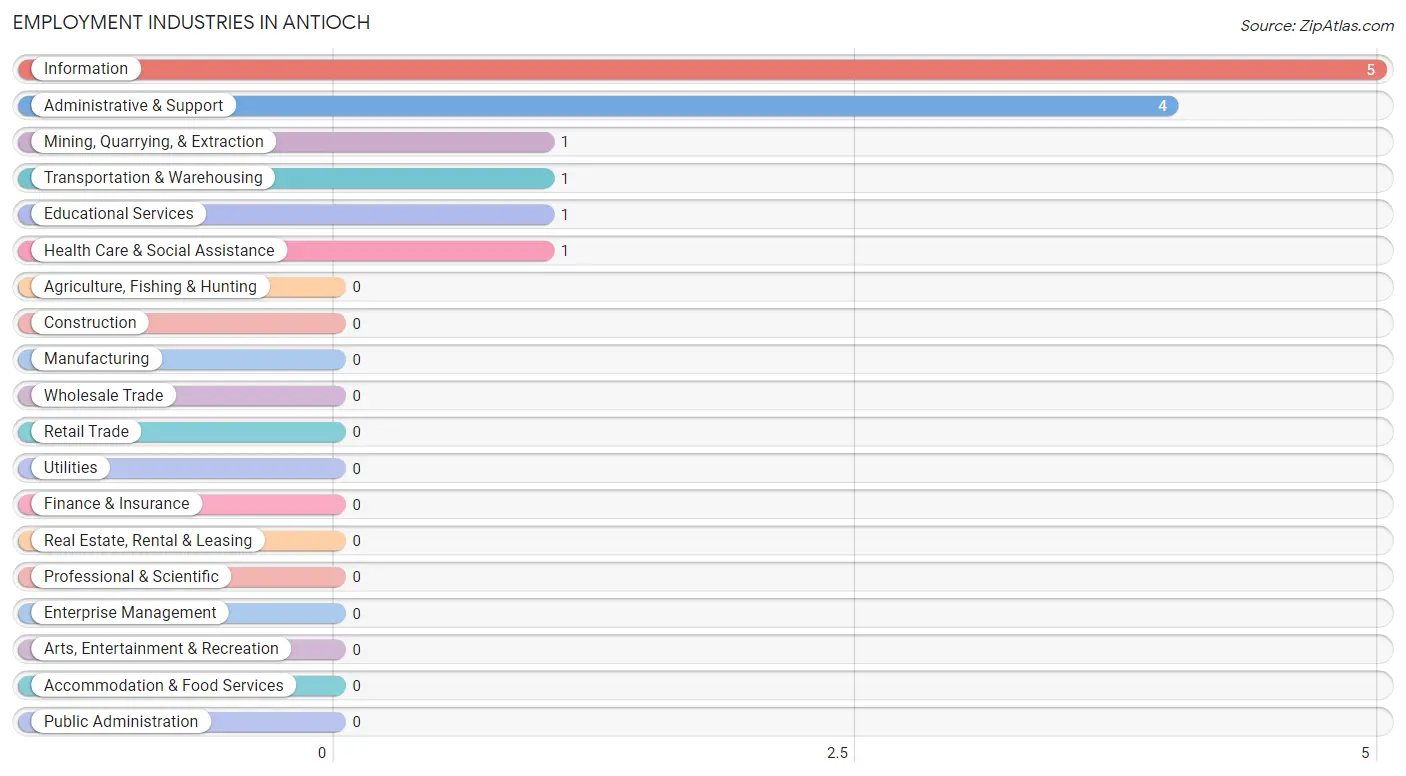
Employment Industries in Antioch
The major employment industries in Antioch include Information (5 | 35.7%), Administrative & Support (4 | 28.6%), Mining, Quarrying, & Extraction (1 | 7.1%), Transportation & Warehousing (1 | 7.1%), and Educational Services (1 | 7.1%).
Employment Industries by Sex in Antioch
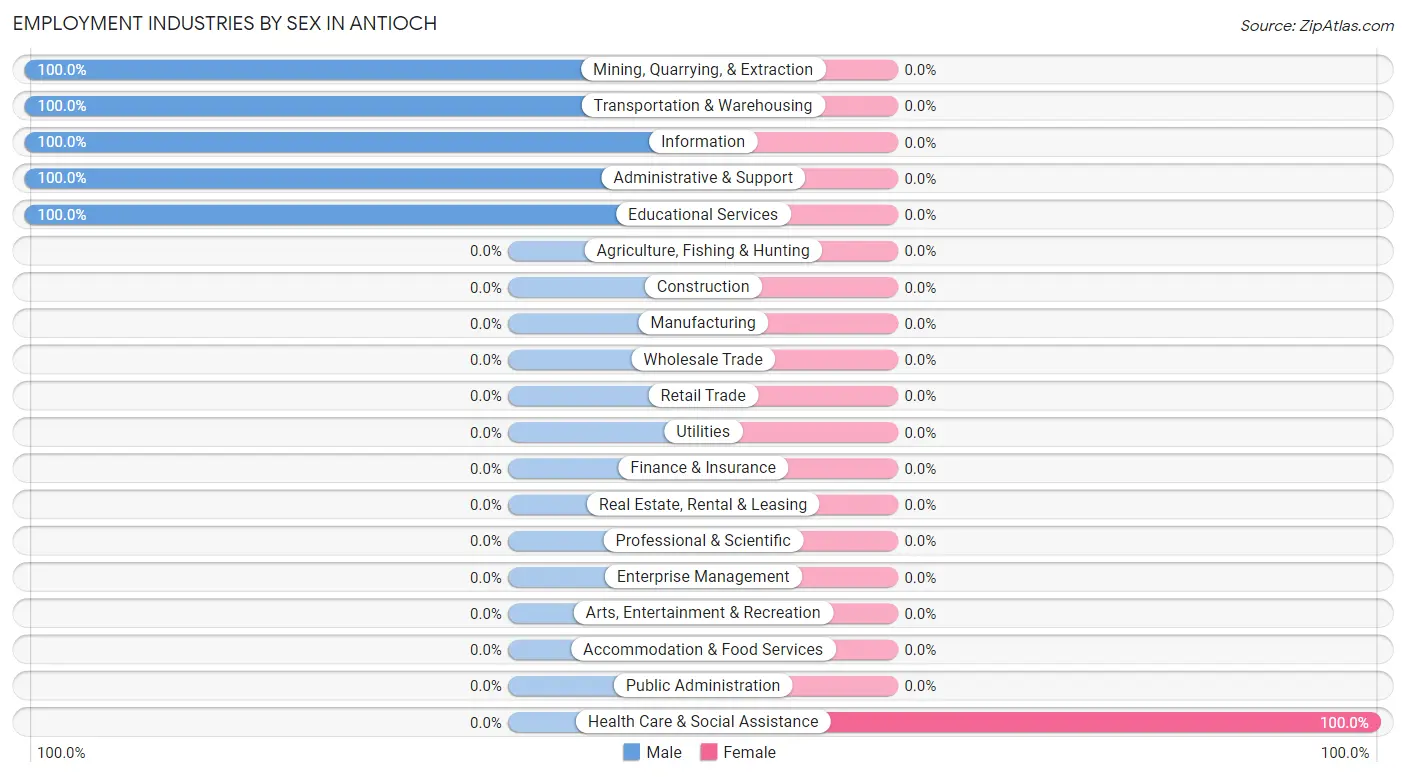
| Industry | Male | Female |
| Agriculture, Fishing & Hunting | 0 (0.0%) | 0 (0.0%) |
| Mining, Quarrying, & Extraction | 1 (100.0%) | 0 (0.0%) |
| Construction | 0 (0.0%) | 0 (0.0%) |
| Manufacturing | 0 (0.0%) | 0 (0.0%) |
| Wholesale Trade | 0 (0.0%) | 0 (0.0%) |
| Retail Trade | 0 (0.0%) | 0 (0.0%) |
| Transportation & Warehousing | 1 (100.0%) | 0 (0.0%) |
| Utilities | 0 (0.0%) | 0 (0.0%) |
| Information | 5 (100.0%) | 0 (0.0%) |
| Finance & Insurance | 0 (0.0%) | 0 (0.0%) |
| Real Estate, Rental & Leasing | 0 (0.0%) | 0 (0.0%) |
| Professional & Scientific | 0 (0.0%) | 0 (0.0%) |
| Enterprise Management | 0 (0.0%) | 0 (0.0%) |
| Administrative & Support | 4 (100.0%) | 0 (0.0%) |
| Educational Services | 1 (100.0%) | 0 (0.0%) |
| Health Care & Social Assistance | 0 (0.0%) | 1 (100.0%) |
| Arts, Entertainment & Recreation | 0 (0.0%) | 0 (0.0%) |
| Accommodation & Food Services | 0 (0.0%) | 0 (0.0%) |
| Public Administration | 0 (0.0%) | 0 (0.0%) |
| Total | 12 (85.7%) | 2 (14.3%) |
Education in Antioch
School Enrollment in Antioch
The most common levels of schooling among the 6 students in Antioch are high school (3 | 50.0%), nursery / preschool (1 | 16.7%), and elementary school (1 | 16.7%).
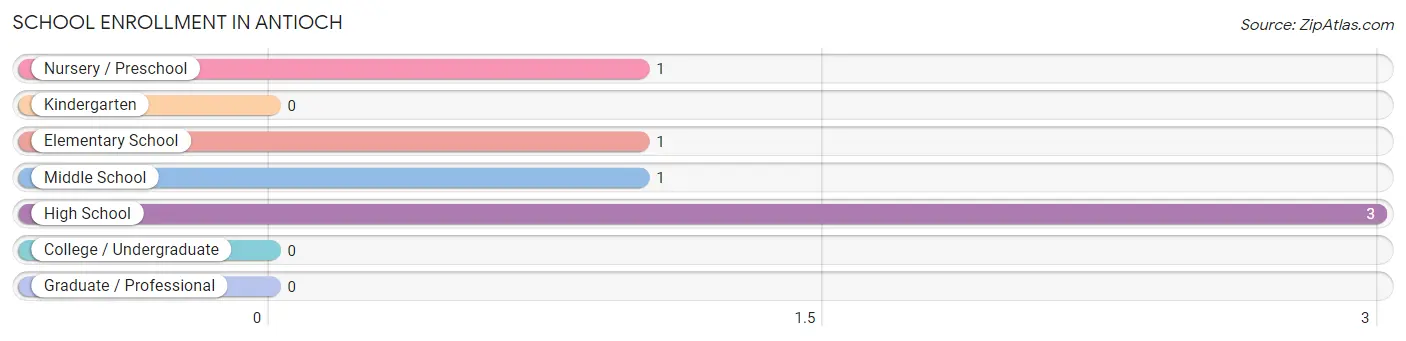
| School Level | # Students | % Students |
| Nursery / Preschool | 1 | 16.7% |
| Kindergarten | 0 | 0.0% |
| Elementary School | 1 | 16.7% |
| Middle School | 1 | 16.7% |
| High School | 3 | 50.0% |
| College / Undergraduate | 0 | 0.0% |
| Graduate / Professional | 0 | 0.0% |
| Total | 6 | 100.0% |
School Enrollment by Age by Funding Source in Antioch
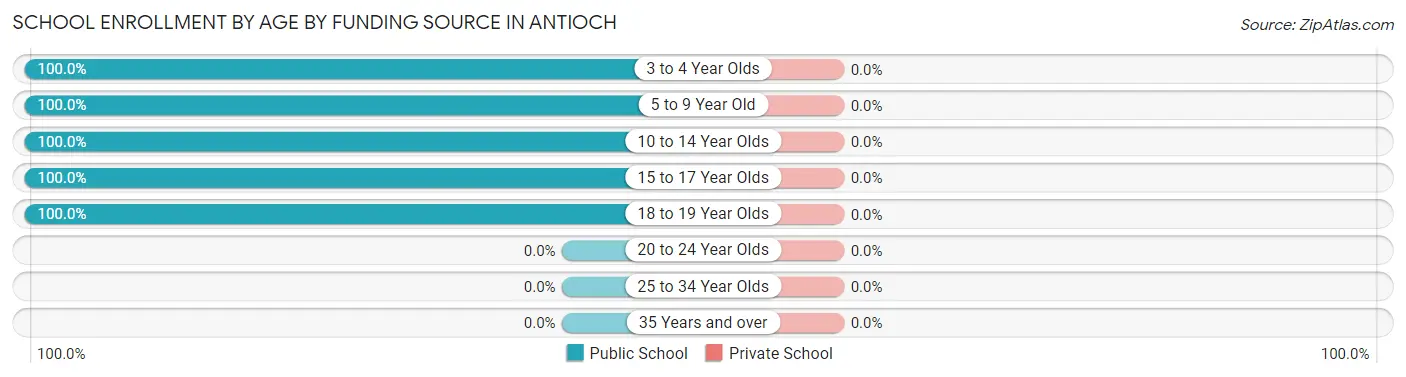
| Age Bracket | Public School | Private School |
| 3 to 4 Year Olds | 1 (100.0%) | 0 (0.0%) |
| 5 to 9 Year Old | 1 (100.0%) | 0 (0.0%) |
| 10 to 14 Year Olds | 1 (100.0%) | 0 (0.0%) |
| 15 to 17 Year Olds | 2 (100.0%) | 0 (0.0%) |
| 18 to 19 Year Olds | 1 (100.0%) | 0 (0.0%) |
| 20 to 24 Year Olds | 0 (0.0%) | 0 (0.0%) |
| 25 to 34 Year Olds | 0 (0.0%) | 0 (0.0%) |
| 35 Years and over | 0 (0.0%) | 0 (0.0%) |
| Total | 6 (100.0%) | 0 (0.0%) |
Educational Attainment by Field of Study in Antioch
, and liberal arts & history (1 | 100.0%) are the most common fields of study among 1 individuals in Antioch who have obtained a bachelor's degree or higher.
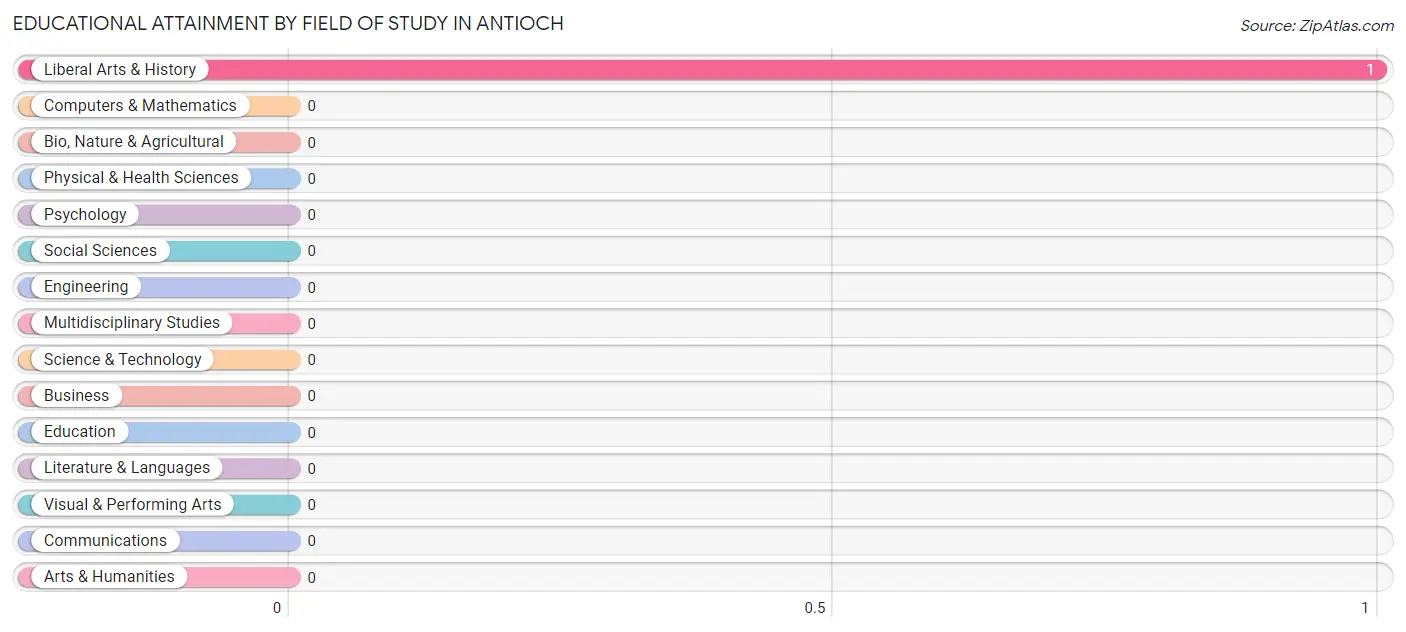
| Field of Study | # Graduates | % Graduates |
| Computers & Mathematics | 0 | 0.0% |
| Bio, Nature & Agricultural | 0 | 0.0% |
| Physical & Health Sciences | 0 | 0.0% |
| Psychology | 0 | 0.0% |
| Social Sciences | 0 | 0.0% |
| Engineering | 0 | 0.0% |
| Multidisciplinary Studies | 0 | 0.0% |
| Science & Technology | 0 | 0.0% |
| Business | 0 | 0.0% |
| Education | 0 | 0.0% |
| Literature & Languages | 0 | 0.0% |
| Liberal Arts & History | 1 | 100.0% |
| Visual & Performing Arts | 0 | 0.0% |
| Communications | 0 | 0.0% |
| Arts & Humanities | 0 | 0.0% |
| Total | 1 | 100.0% |
Transportation & Commute in Antioch
Vehicle Availability by Sex in Antioch
The most prevalent vehicle ownership categories in Antioch are males with 1 vehicle (5, accounting for 41.7%) and females with 1 vehicle (0, making up 250.0%).
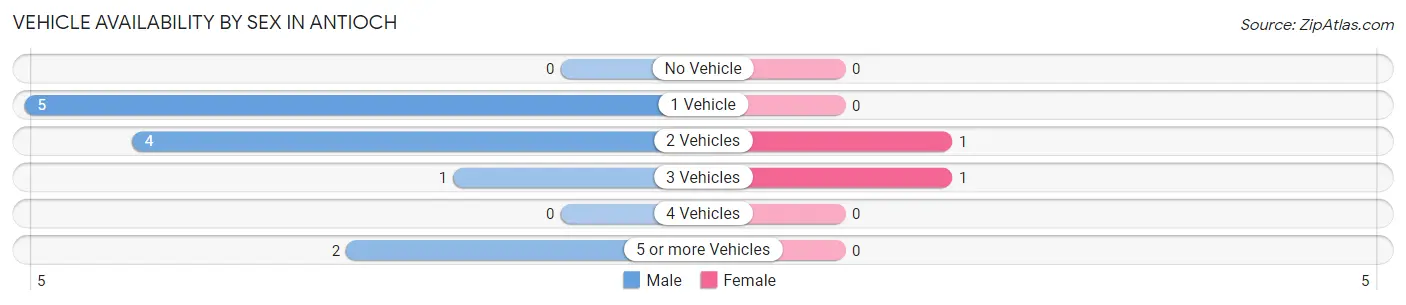
| Vehicles Available | Male | Female |
| No Vehicle | 0 (0.0%) | 0 (0.0%) |
| 1 Vehicle | 5 (41.7%) | 0 (0.0%) |
| 2 Vehicles | 4 (33.3%) | 1 (50.0%) |
| 3 Vehicles | 1 (8.3%) | 1 (50.0%) |
| 4 Vehicles | 0 (0.0%) | 0 (0.0%) |
| 5 or more Vehicles | 2 (16.7%) | 0 (0.0%) |
| Total | 12 (100.0%) | 2 (100.0%) |
Commute Time in Antioch
The most frequently occuring commute durations in Antioch are 20 to 24 minutes (5 commuters, 35.7%), 60 to 89 minutes (3 commuters, 21.4%), and 90 or more minutes (3 commuters, 21.4%).
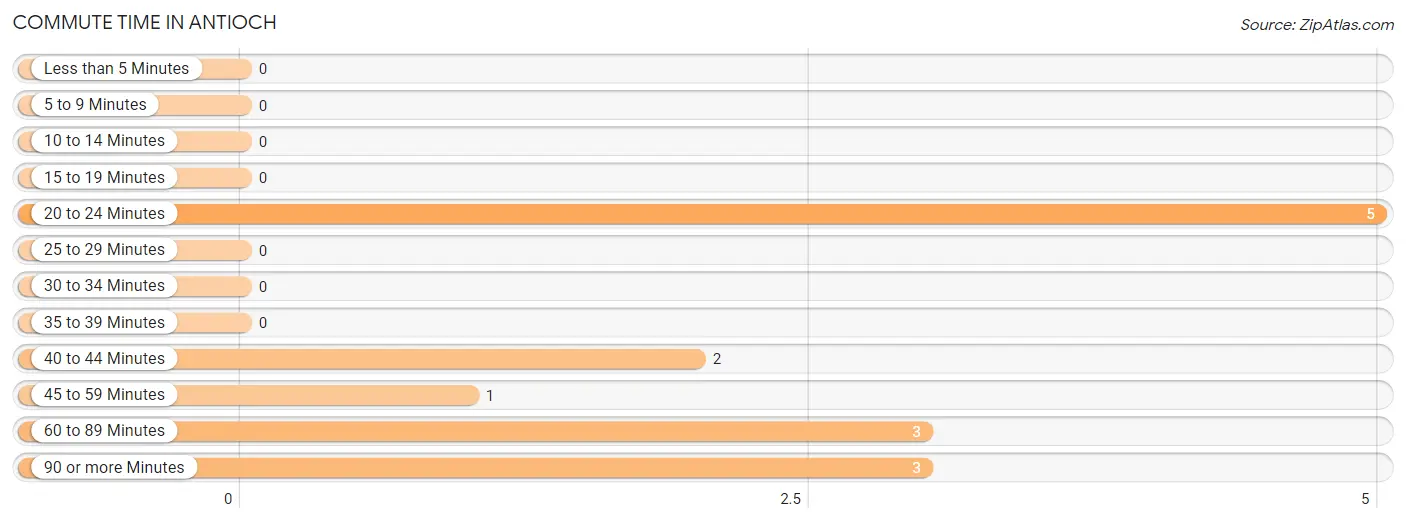
| Commute Time | # Commuters | % Commuters |
| Less than 5 Minutes | 0 | 0.0% |
| 5 to 9 Minutes | 0 | 0.0% |
| 10 to 14 Minutes | 0 | 0.0% |
| 15 to 19 Minutes | 0 | 0.0% |
| 20 to 24 Minutes | 5 | 35.7% |
| 25 to 29 Minutes | 0 | 0.0% |
| 30 to 34 Minutes | 0 | 0.0% |
| 35 to 39 Minutes | 0 | 0.0% |
| 40 to 44 Minutes | 2 | 14.3% |
| 45 to 59 Minutes | 1 | 7.1% |
| 60 to 89 Minutes | 3 | 21.4% |
| 90 or more Minutes | 3 | 21.4% |
Commute Time by Sex in Antioch
The most common commute times in Antioch are 20 to 24 minutes (4 commuters, 33.3%) for males and 20 to 24 minutes (1 commuters, 50.0%) for females.
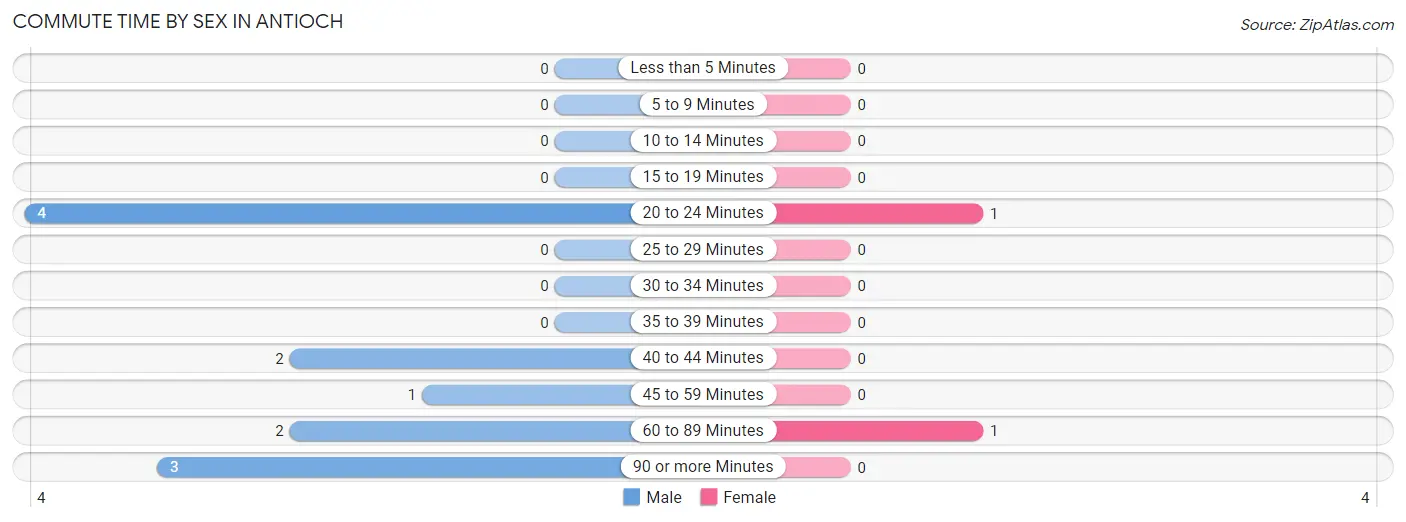
| Commute Time | Male | Female |
| Less than 5 Minutes | 0 (0.0%) | 0 (0.0%) |
| 5 to 9 Minutes | 0 (0.0%) | 0 (0.0%) |
| 10 to 14 Minutes | 0 (0.0%) | 0 (0.0%) |
| 15 to 19 Minutes | 0 (0.0%) | 0 (0.0%) |
| 20 to 24 Minutes | 4 (33.3%) | 1 (50.0%) |
| 25 to 29 Minutes | 0 (0.0%) | 0 (0.0%) |
| 30 to 34 Minutes | 0 (0.0%) | 0 (0.0%) |
| 35 to 39 Minutes | 0 (0.0%) | 0 (0.0%) |
| 40 to 44 Minutes | 2 (16.7%) | 0 (0.0%) |
| 45 to 59 Minutes | 1 (8.3%) | 0 (0.0%) |
| 60 to 89 Minutes | 2 (16.7%) | 1 (50.0%) |
| 90 or more Minutes | 3 (25.0%) | 0 (0.0%) |
Time of Departure to Work by Sex in Antioch
The most frequent times of departure to work in Antioch are 6:30 AM to 6:59 AM (3, 25.0%) for males and 6:30 AM to 6:59 AM (1, 50.0%) for females.
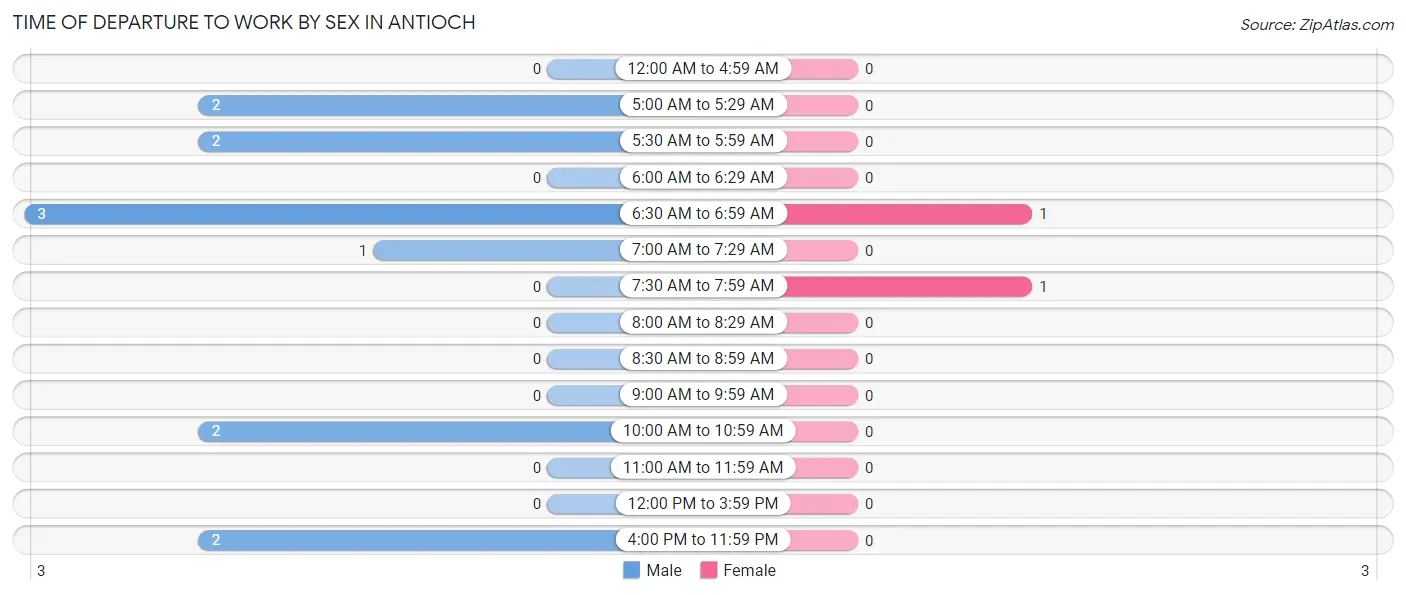
| Time of Departure | Male | Female |
| 12:00 AM to 4:59 AM | 0 (0.0%) | 0 (0.0%) |
| 5:00 AM to 5:29 AM | 2 (16.7%) | 0 (0.0%) |
| 5:30 AM to 5:59 AM | 2 (16.7%) | 0 (0.0%) |
| 6:00 AM to 6:29 AM | 0 (0.0%) | 0 (0.0%) |
| 6:30 AM to 6:59 AM | 3 (25.0%) | 1 (50.0%) |
| 7:00 AM to 7:29 AM | 1 (8.3%) | 0 (0.0%) |
| 7:30 AM to 7:59 AM | 0 (0.0%) | 1 (50.0%) |
| 8:00 AM to 8:29 AM | 0 (0.0%) | 0 (0.0%) |
| 8:30 AM to 8:59 AM | 0 (0.0%) | 0 (0.0%) |
| 9:00 AM to 9:59 AM | 0 (0.0%) | 0 (0.0%) |
| 10:00 AM to 10:59 AM | 2 (16.7%) | 0 (0.0%) |
| 11:00 AM to 11:59 AM | 0 (0.0%) | 0 (0.0%) |
| 12:00 PM to 3:59 PM | 0 (0.0%) | 0 (0.0%) |
| 4:00 PM to 11:59 PM | 2 (16.7%) | 0 (0.0%) |
| Total | 12 (100.0%) | 2 (100.0%) |
Housing Occupancy in Antioch
Occupancy by Ownership in Antioch
Of the total 29 dwellings in Antioch, owner-occupied units account for 15 (51.7%), while renter-occupied units make up 14 (48.3%).
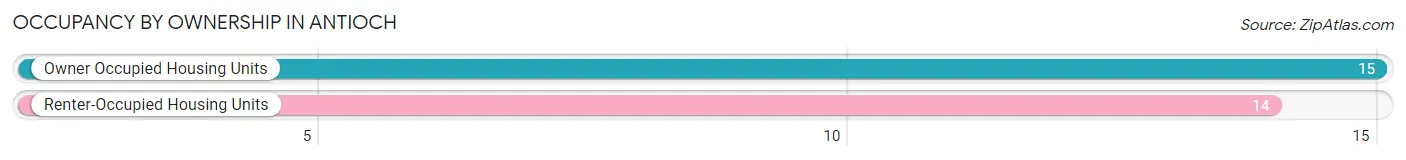
| Occupancy | # Housing Units | % Housing Units |
| Owner Occupied Housing Units | 15 | 51.7% |
| Renter-Occupied Housing Units | 14 | 48.3% |
| Total Occupied Housing Units | 29 | 100.0% |
Occupancy by Household Size in Antioch
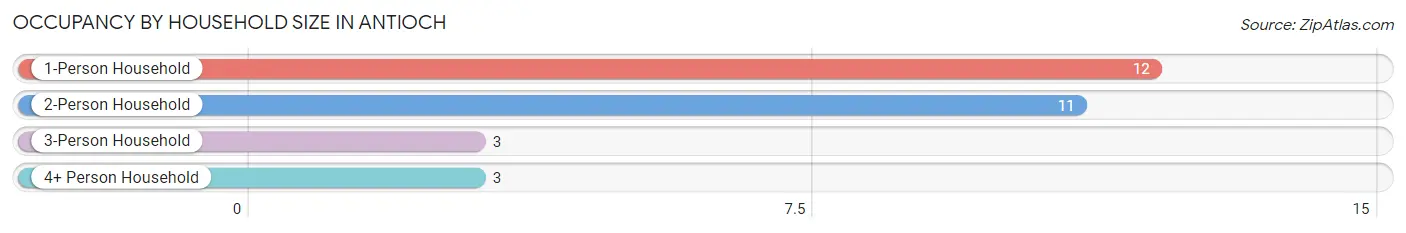
| Household Size | # Housing Units | % Housing Units |
| 1-Person Household | 12 | 41.4% |
| 2-Person Household | 11 | 37.9% |
| 3-Person Household | 3 | 10.3% |
| 4+ Person Household | 3 | 10.3% |
| Total Housing Units | 29 | 100.0% |
Occupancy by Ownership by Household Size in Antioch
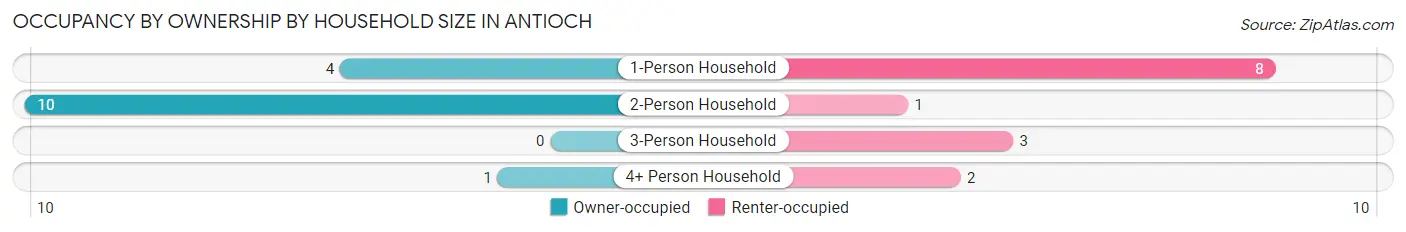
| Household Size | Owner-occupied | Renter-occupied |
| 1-Person Household | 4 (33.3%) | 8 (66.7%) |
| 2-Person Household | 10 (90.9%) | 1 (9.1%) |
| 3-Person Household | 0 (0.0%) | 3 (100.0%) |
| 4+ Person Household | 1 (33.3%) | 2 (66.7%) |
| Total Housing Units | 15 (51.7%) | 14 (48.3%) |
Occupancy by Educational Attainment in Antioch
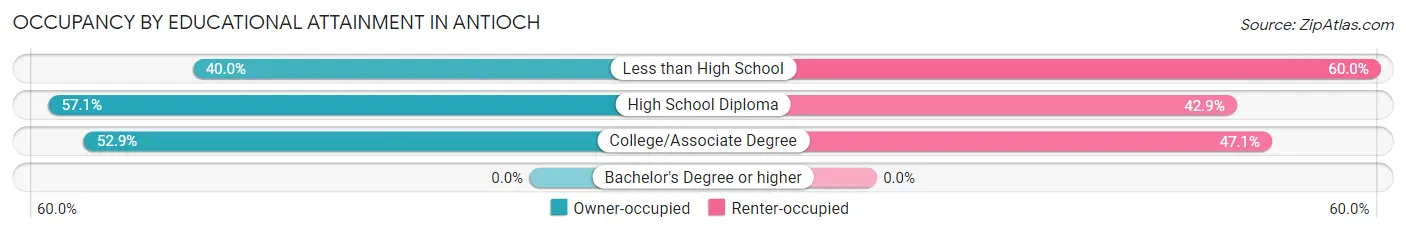
| Household Size | Owner-occupied | Renter-occupied |
| Less than High School | 2 (40.0%) | 3 (60.0%) |
| High School Diploma | 4 (57.1%) | 3 (42.9%) |
| College/Associate Degree | 9 (52.9%) | 8 (47.1%) |
| Bachelor's Degree or higher | 0 (0.0%) | 0 (0.0%) |
Occupancy by Age of Householder in Antioch
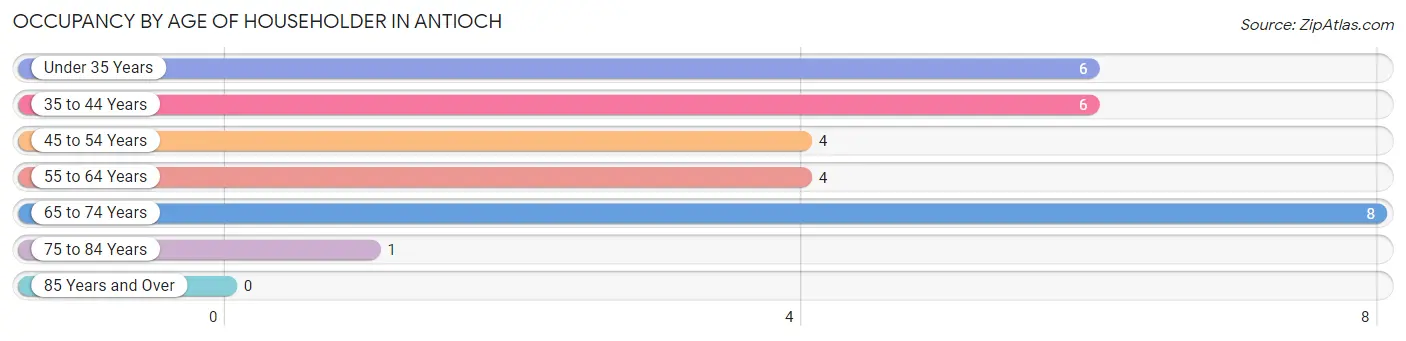
| Age Bracket | # Households | % Households |
| Under 35 Years | 6 | 20.7% |
| 35 to 44 Years | 6 | 20.7% |
| 45 to 54 Years | 4 | 13.8% |
| 55 to 64 Years | 4 | 13.8% |
| 65 to 74 Years | 8 | 27.6% |
| 75 to 84 Years | 1 | 3.5% |
| 85 Years and Over | 0 | 0.0% |
| Total | 29 | 100.0% |
Housing Finances in Antioch
Median Income by Occupancy in Antioch
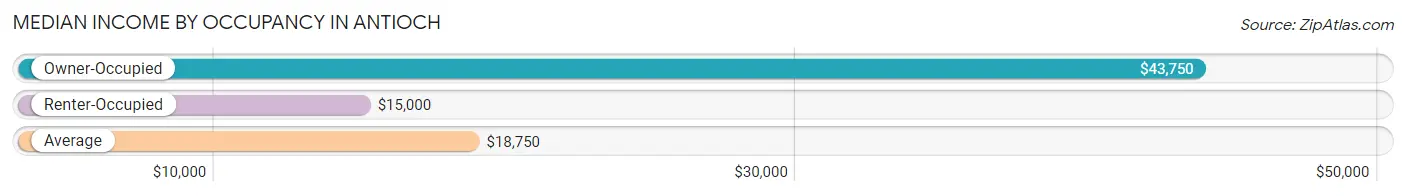
| Occupancy Type | # Households | Median Income |
| Owner-Occupied | 15 (51.7%) | $43,750 |
| Renter-Occupied | 14 (48.3%) | $15,000 |
| Average | 29 (100.0%) | $18,750 |
Occupancy by Householder Income Bracket in Antioch
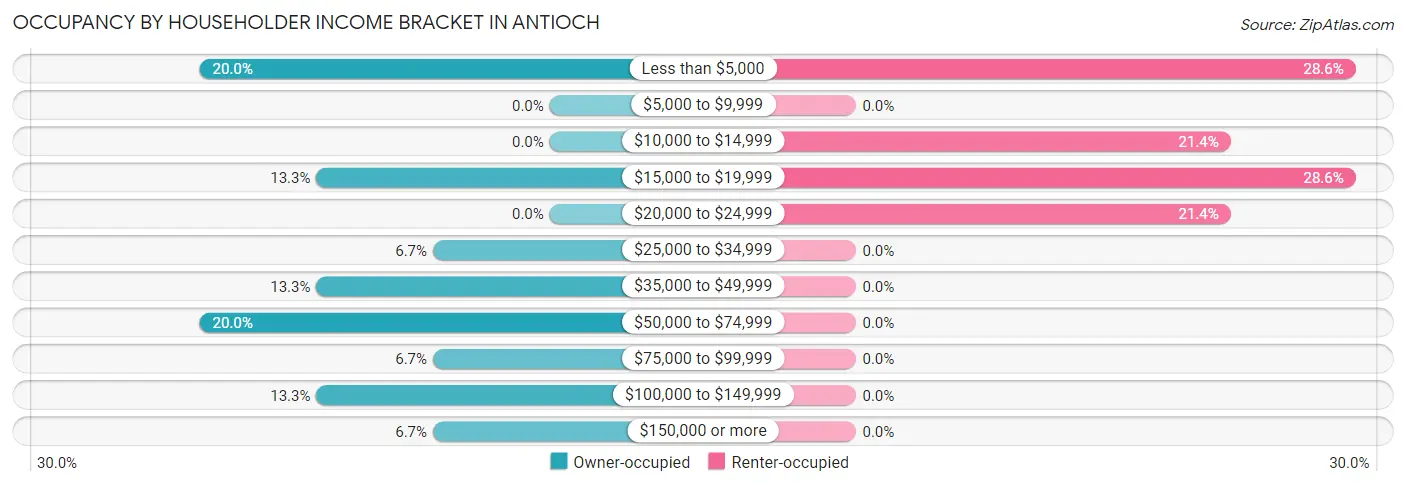
| Income Bracket | Owner-occupied | Renter-occupied |
| Less than $5,000 | 3 (20.0%) | 4 (28.6%) |
| $5,000 to $9,999 | 0 (0.0%) | 0 (0.0%) |
| $10,000 to $14,999 | 0 (0.0%) | 3 (21.4%) |
| $15,000 to $19,999 | 2 (13.3%) | 4 (28.6%) |
| $20,000 to $24,999 | 0 (0.0%) | 3 (21.4%) |
| $25,000 to $34,999 | 1 (6.7%) | 0 (0.0%) |
| $35,000 to $49,999 | 2 (13.3%) | 0 (0.0%) |
| $50,000 to $74,999 | 3 (20.0%) | 0 (0.0%) |
| $75,000 to $99,999 | 1 (6.7%) | 0 (0.0%) |
| $100,000 to $149,999 | 2 (13.3%) | 0 (0.0%) |
| $150,000 or more | 1 (6.7%) | 0 (0.0%) |
| Total | 15 (100.0%) | 14 (100.0%) |
Monthly Housing Cost Tiers in Antioch
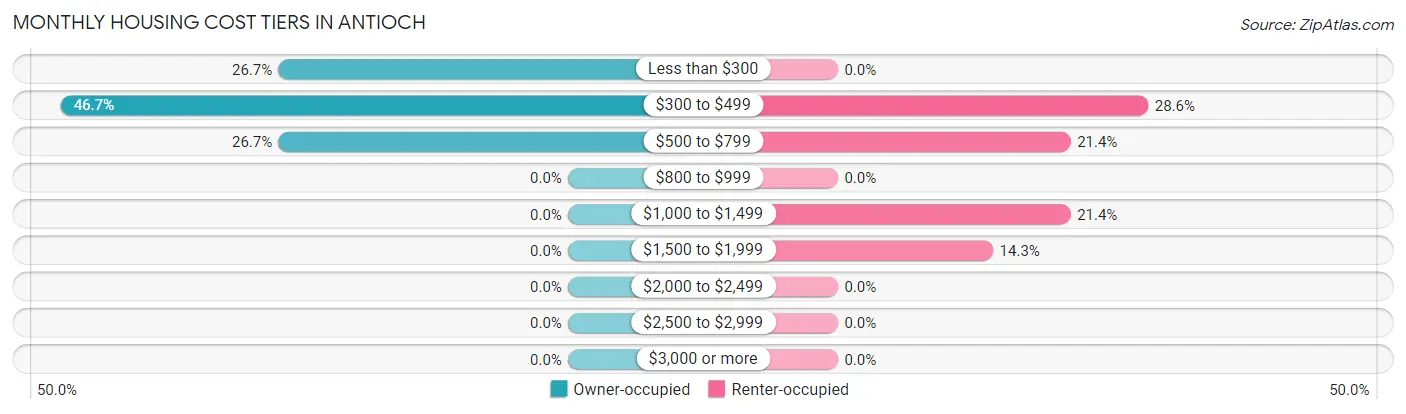
| Monthly Cost | Owner-occupied | Renter-occupied |
| Less than $300 | 4 (26.7%) | 0 (0.0%) |
| $300 to $499 | 7 (46.7%) | 4 (28.6%) |
| $500 to $799 | 4 (26.7%) | 3 (21.4%) |
| $800 to $999 | 0 (0.0%) | 0 (0.0%) |
| $1,000 to $1,499 | 0 (0.0%) | 3 (21.4%) |
| $1,500 to $1,999 | 0 (0.0%) | 2 (14.3%) |
| $2,000 to $2,499 | 0 (0.0%) | 0 (0.0%) |
| $2,500 to $2,999 | 0 (0.0%) | 0 (0.0%) |
| $3,000 or more | 0 (0.0%) | 0 (0.0%) |
| Total | 15 (100.0%) | 14 (100.0%) |
Physical Housing Characteristics in Antioch
Housing Structures in Antioch
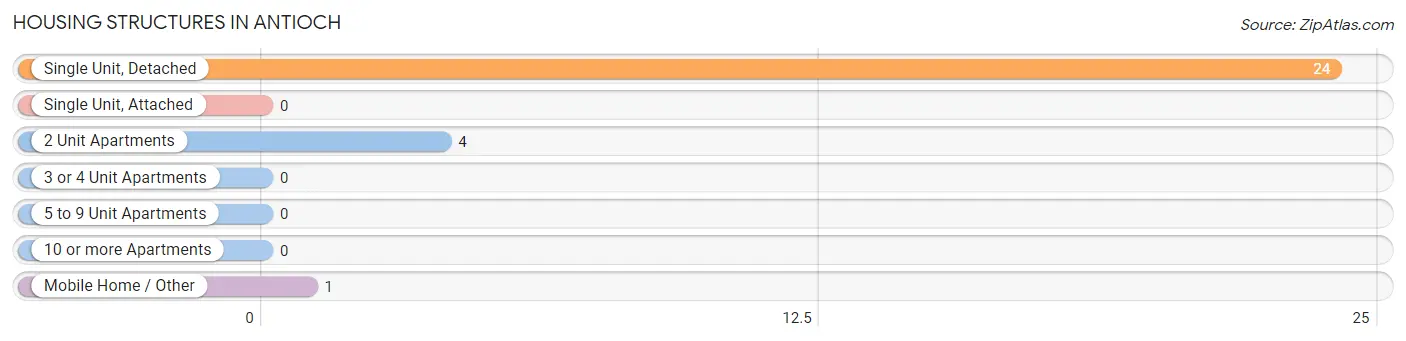
| Structure Type | # Housing Units | % Housing Units |
| Single Unit, Detached | 24 | 82.8% |
| Single Unit, Attached | 0 | 0.0% |
| 2 Unit Apartments | 4 | 13.8% |
| 3 or 4 Unit Apartments | 0 | 0.0% |
| 5 to 9 Unit Apartments | 0 | 0.0% |
| 10 or more Apartments | 0 | 0.0% |
| Mobile Home / Other | 1 | 3.5% |
| Total | 29 | 100.0% |
Housing Structures by Occupancy in Antioch
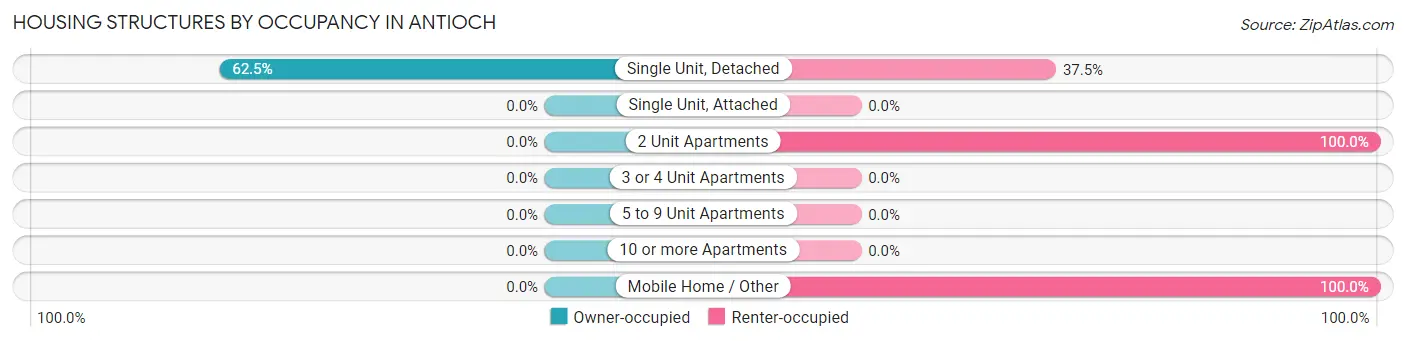
| Structure Type | Owner-occupied | Renter-occupied |
| Single Unit, Detached | 15 (62.5%) | 9 (37.5%) |
| Single Unit, Attached | 0 (0.0%) | 0 (0.0%) |
| 2 Unit Apartments | 0 (0.0%) | 4 (100.0%) |
| 3 or 4 Unit Apartments | 0 (0.0%) | 0 (0.0%) |
| 5 to 9 Unit Apartments | 0 (0.0%) | 0 (0.0%) |
| 10 or more Apartments | 0 (0.0%) | 0 (0.0%) |
| Mobile Home / Other | 0 (0.0%) | 1 (100.0%) |
| Total | 15 (51.7%) | 14 (48.3%) |
Housing Structures by Number of Rooms in Antioch
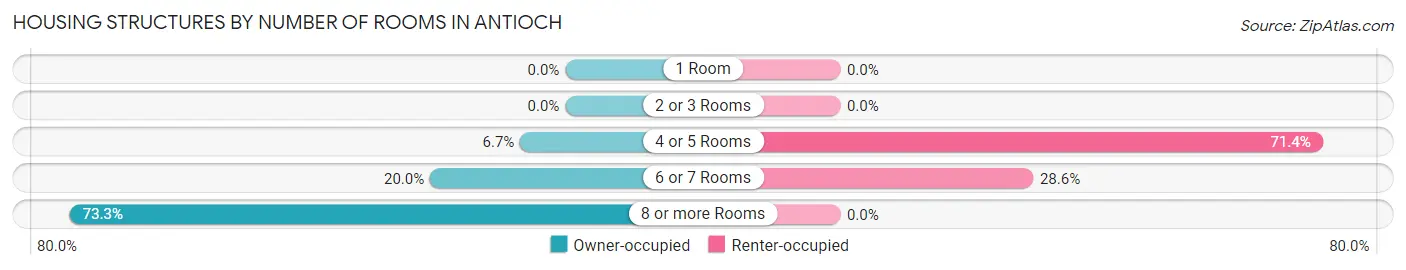
| Number of Rooms | Owner-occupied | Renter-occupied |
| 1 Room | 0 (0.0%) | 0 (0.0%) |
| 2 or 3 Rooms | 0 (0.0%) | 0 (0.0%) |
| 4 or 5 Rooms | 1 (6.7%) | 10 (71.4%) |
| 6 or 7 Rooms | 3 (20.0%) | 4 (28.6%) |
| 8 or more Rooms | 11 (73.3%) | 0 (0.0%) |
| Total | 15 (100.0%) | 14 (100.0%) |
Housing Structure by Heating Type in Antioch
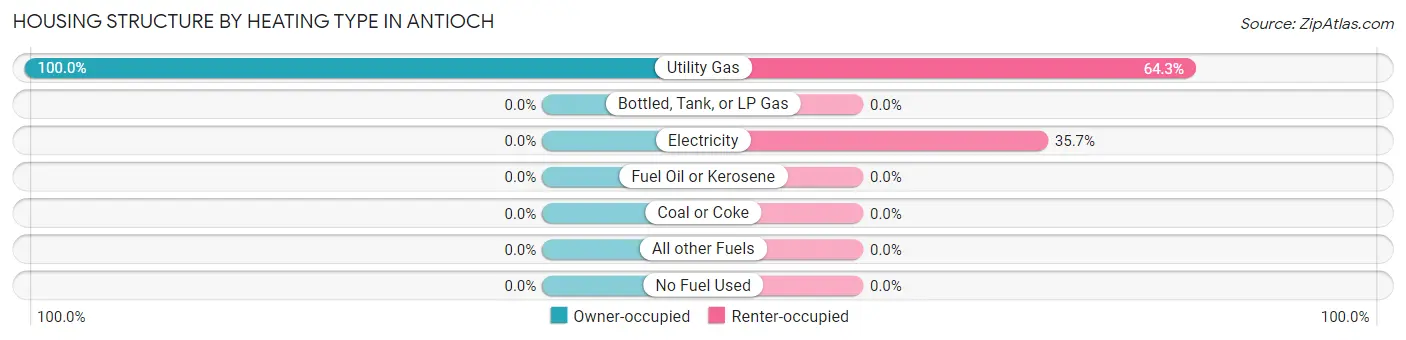
| Heating Type | Owner-occupied | Renter-occupied |
| Utility Gas | 15 (100.0%) | 9 (64.3%) |
| Bottled, Tank, or LP Gas | 0 (0.0%) | 0 (0.0%) |
| Electricity | 0 (0.0%) | 5 (35.7%) |
| Fuel Oil or Kerosene | 0 (0.0%) | 0 (0.0%) |
| Coal or Coke | 0 (0.0%) | 0 (0.0%) |
| All other Fuels | 0 (0.0%) | 0 (0.0%) |
| No Fuel Used | 0 (0.0%) | 0 (0.0%) |
| Total | 15 (100.0%) | 14 (100.0%) |
Household Vehicle Usage in Antioch
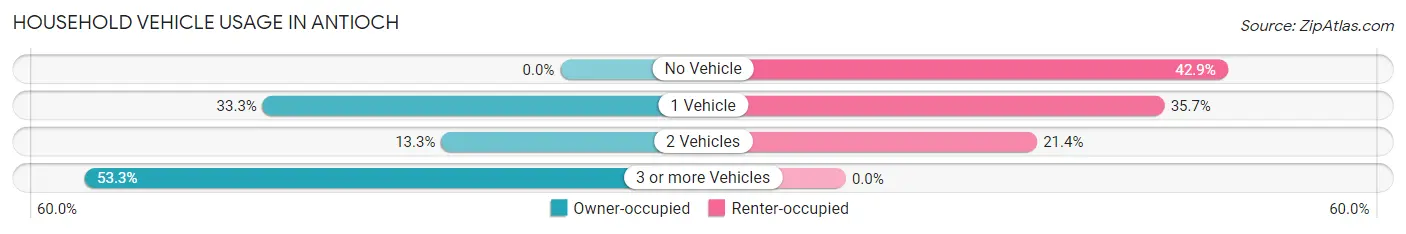
| Vehicles per Household | Owner-occupied | Renter-occupied |
| No Vehicle | 0 (0.0%) | 6 (42.9%) |
| 1 Vehicle | 5 (33.3%) | 5 (35.7%) |
| 2 Vehicles | 2 (13.3%) | 3 (21.4%) |
| 3 or more Vehicles | 8 (53.3%) | 0 (0.0%) |
| Total | 15 (100.0%) | 14 (100.0%) |
Real Estate & Mortgages in Antioch
Real Estate and Mortgage Overview in Antioch
| Characteristic | Without Mortgage | With Mortgage |
| Housing Units | 9 | 6 |
| Median Property Value | $62,500 | $0 |
| Median Household Income | - | - |
| Monthly Housing Costs | $375 | $0 |
| Real Estate Taxes | $475 | $0 |
Property Value by Mortgage Status in Antioch
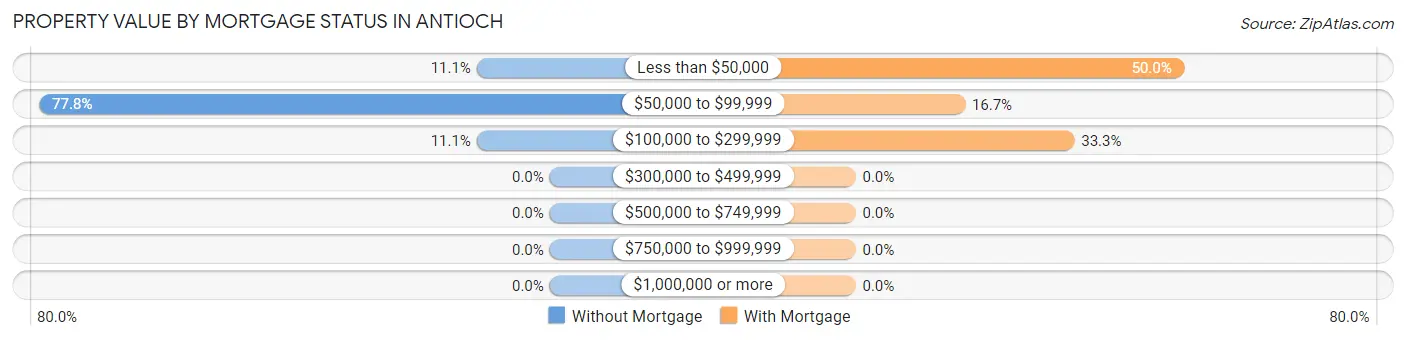
| Property Value | Without Mortgage | With Mortgage |
| Less than $50,000 | 1 (11.1%) | 3 (50.0%) |
| $50,000 to $99,999 | 7 (77.8%) | 1 (16.7%) |
| $100,000 to $299,999 | 1 (11.1%) | 2 (33.3%) |
| $300,000 to $499,999 | 0 (0.0%) | 0 (0.0%) |
| $500,000 to $749,999 | 0 (0.0%) | 0 (0.0%) |
| $750,000 to $999,999 | 0 (0.0%) | 0 (0.0%) |
| $1,000,000 or more | 0 (0.0%) | 0 (0.0%) |
| Total | 9 (100.0%) | 6 (100.0%) |
Household Income by Mortgage Status in Antioch
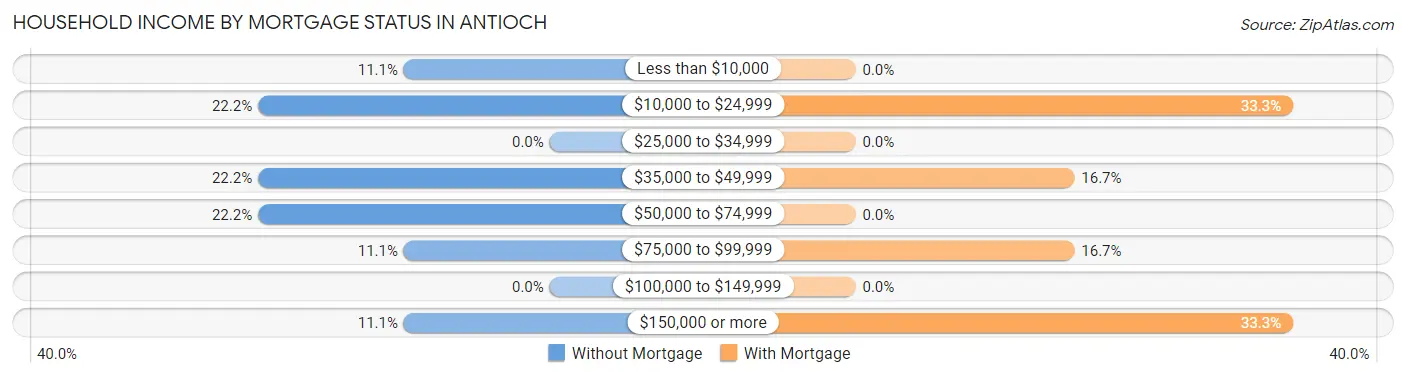
| Household Income | Without Mortgage | With Mortgage |
| Less than $10,000 | 1 (11.1%) | 0 (0.0%) |
| $10,000 to $24,999 | 2 (22.2%) | 2 (33.3%) |
| $25,000 to $34,999 | 0 (0.0%) | 0 (0.0%) |
| $35,000 to $49,999 | 2 (22.2%) | 1 (16.7%) |
| $50,000 to $74,999 | 2 (22.2%) | 0 (0.0%) |
| $75,000 to $99,999 | 1 (11.1%) | 1 (16.7%) |
| $100,000 to $149,999 | 0 (0.0%) | 0 (0.0%) |
| $150,000 or more | 1 (11.1%) | 2 (33.3%) |
| Total | 9 (100.0%) | 6 (100.0%) |
Property Value to Household Income Ratio in Antioch
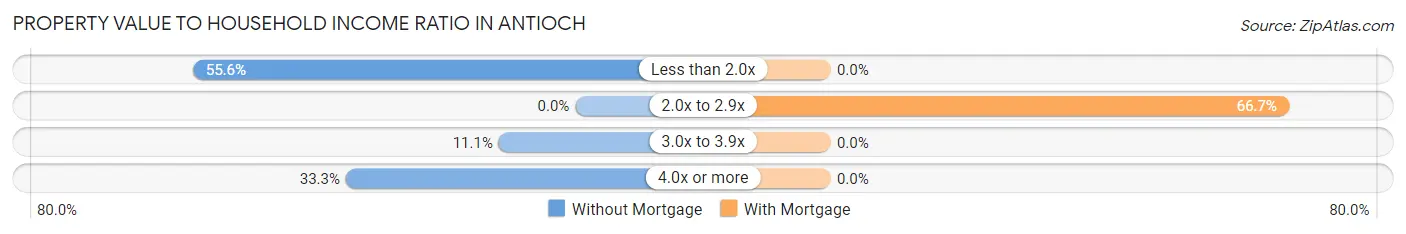
| Value-to-Income Ratio | Without Mortgage | With Mortgage |
| Less than 2.0x | 5 (55.6%) | 0 (0.0%) |
| 2.0x to 2.9x | 0 (0.0%) | 4 (66.7%) |
| 3.0x to 3.9x | 1 (11.1%) | 0 (0.0%) |
| 4.0x or more | 3 (33.3%) | 0 (0.0%) |
| Total | 9 (100.0%) | 6 (100.0%) |
Real Estate Taxes by Mortgage Status in Antioch
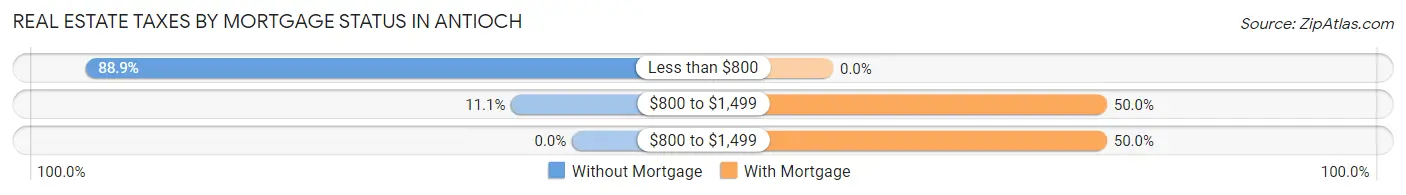
| Property Taxes | Without Mortgage | With Mortgage |
| Less than $800 | 8 (88.9%) | 0 (0.0%) |
| $800 to $1,499 | 1 (11.1%) | 3 (50.0%) |
| $800 to $1,499 | 0 (0.0%) | 3 (50.0%) |
| Total | 9 (100.0%) | 6 (100.0%) |
Health & Disability in Antioch
Health Insurance Coverage by Age in Antioch
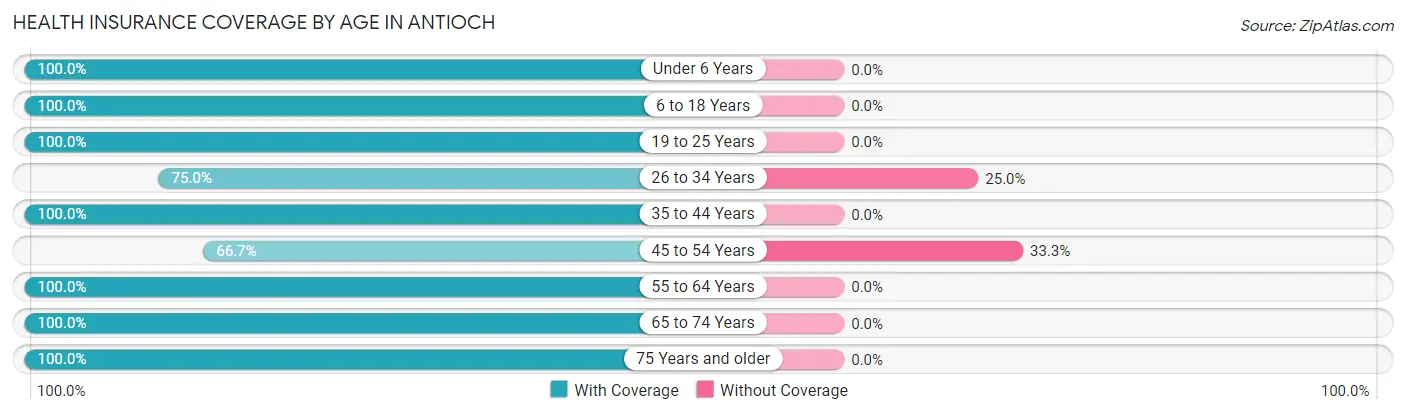
| Age Bracket | With Coverage | Without Coverage |
| Under 6 Years | 2 (100.0%) | 0 (0.0%) |
| 6 to 18 Years | 4 (100.0%) | 0 (0.0%) |
| 19 to 25 Years | 6 (100.0%) | 0 (0.0%) |
| 26 to 34 Years | 3 (75.0%) | 1 (25.0%) |
| 35 to 44 Years | 6 (100.0%) | 0 (0.0%) |
| 45 to 54 Years | 4 (66.7%) | 2 (33.3%) |
| 55 to 64 Years | 6 (100.0%) | 0 (0.0%) |
| 65 to 74 Years | 12 (100.0%) | 0 (0.0%) |
| 75 Years and older | 1 (100.0%) | 0 (0.0%) |
| Total | 44 (93.6%) | 3 (6.4%) |
Health Insurance Coverage by Citizenship Status in Antioch
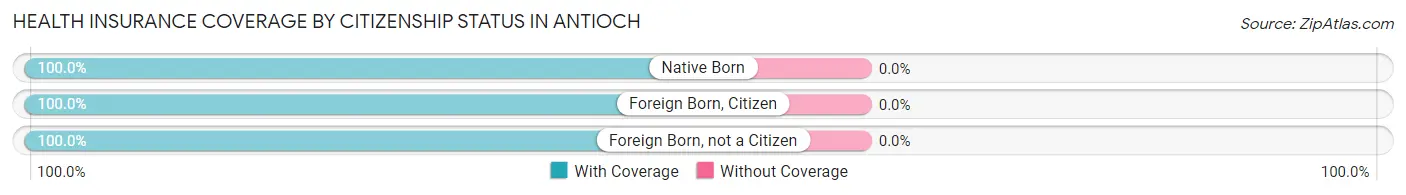
| Citizenship Status | With Coverage | Without Coverage |
| Native Born | 2 (100.0%) | 0 (0.0%) |
| Foreign Born, Citizen | 4 (100.0%) | 0 (0.0%) |
| Foreign Born, not a Citizen | 6 (100.0%) | 0 (0.0%) |
Health Insurance Coverage by Household Income in Antioch
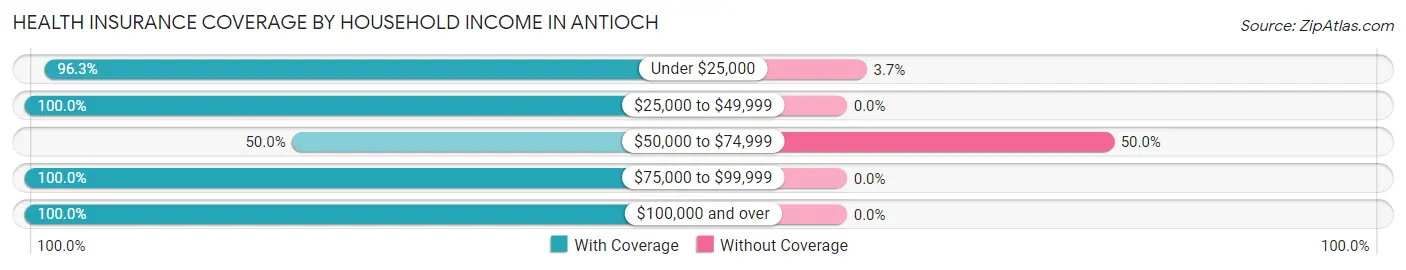
| Household Income | With Coverage | Without Coverage |
| Under $25,000 | 26 (96.3%) | 1 (3.7%) |
| $25,000 to $49,999 | 10 (100.0%) | 0 (0.0%) |
| $50,000 to $74,999 | 2 (50.0%) | 2 (50.0%) |
| $75,000 to $99,999 | 1 (100.0%) | 0 (0.0%) |
| $100,000 and over | 5 (100.0%) | 0 (0.0%) |
Public vs Private Health Insurance Coverage by Age in Antioch
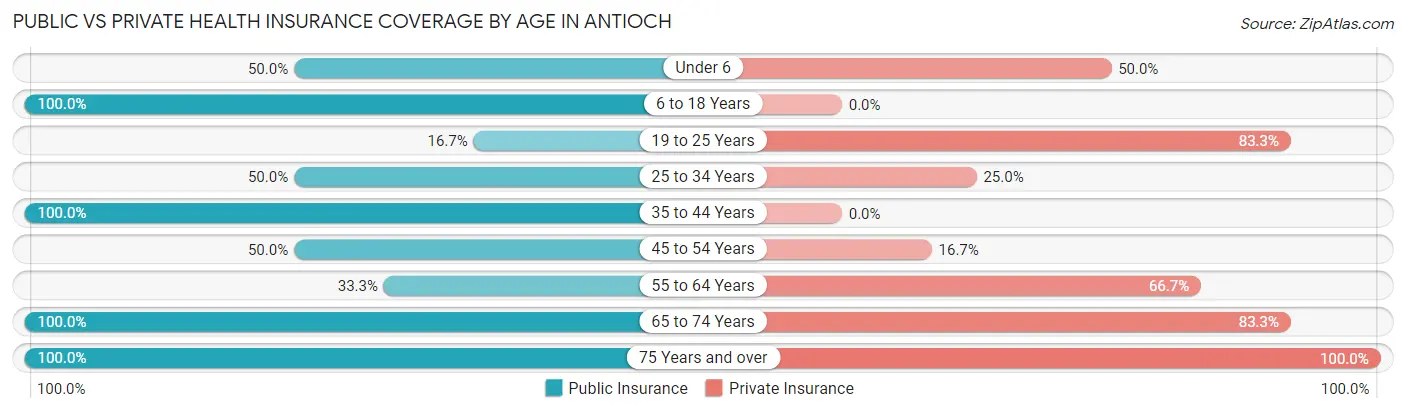
| Age Bracket | Public Insurance | Private Insurance |
| Under 6 | 1 (50.0%) | 1 (50.0%) |
| 6 to 18 Years | 4 (100.0%) | 0 (0.0%) |
| 19 to 25 Years | 1 (16.7%) | 5 (83.3%) |
| 25 to 34 Years | 2 (50.0%) | 1 (25.0%) |
| 35 to 44 Years | 6 (100.0%) | 0 (0.0%) |
| 45 to 54 Years | 3 (50.0%) | 1 (16.7%) |
| 55 to 64 Years | 2 (33.3%) | 4 (66.7%) |
| 65 to 74 Years | 12 (100.0%) | 10 (83.3%) |
| 75 Years and over | 1 (100.0%) | 1 (100.0%) |
| Total | 32 (68.1%) | 23 (48.9%) |
Disability Status by Sex by Age in Antioch
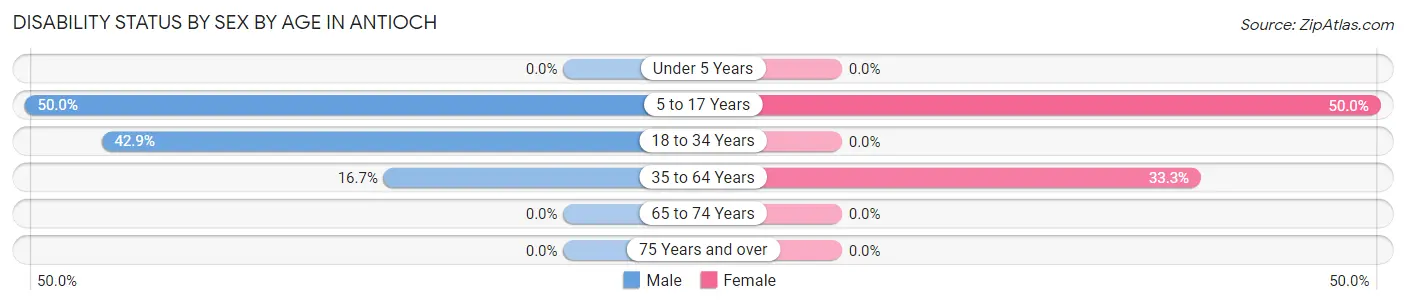
| Age Bracket | Male | Female |
| Under 5 Years | 0 (0.0%) | 0 (0.0%) |
| 5 to 17 Years | 1 (50.0%) | 1 (50.0%) |
| 18 to 34 Years | 3 (42.9%) | 0 (0.0%) |
| 35 to 64 Years | 2 (16.7%) | 2 (33.3%) |
| 65 to 74 Years | 0 (0.0%) | 0 (0.0%) |
| 75 Years and over | 0 (0.0%) | 0 (0.0%) |
Disability Class by Sex by Age in Antioch
Disability Class: Hearing Difficulty
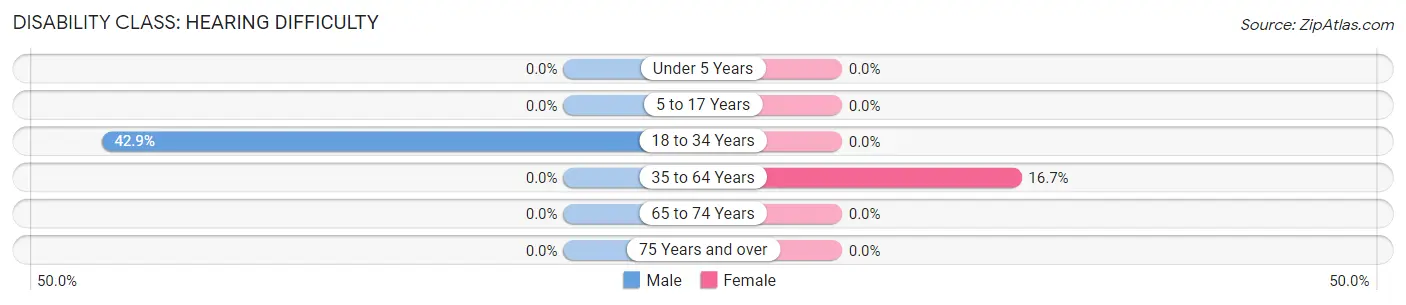
| Age Bracket | Male | Female |
| Under 5 Years | 0 (0.0%) | 0 (0.0%) |
| 5 to 17 Years | 0 (0.0%) | 0 (0.0%) |
| 18 to 34 Years | 3 (42.9%) | 0 (0.0%) |
| 35 to 64 Years | 0 (0.0%) | 1 (16.7%) |
| 65 to 74 Years | 0 (0.0%) | 0 (0.0%) |
| 75 Years and over | 0 (0.0%) | 0 (0.0%) |
Disability Class: Vision Difficulty
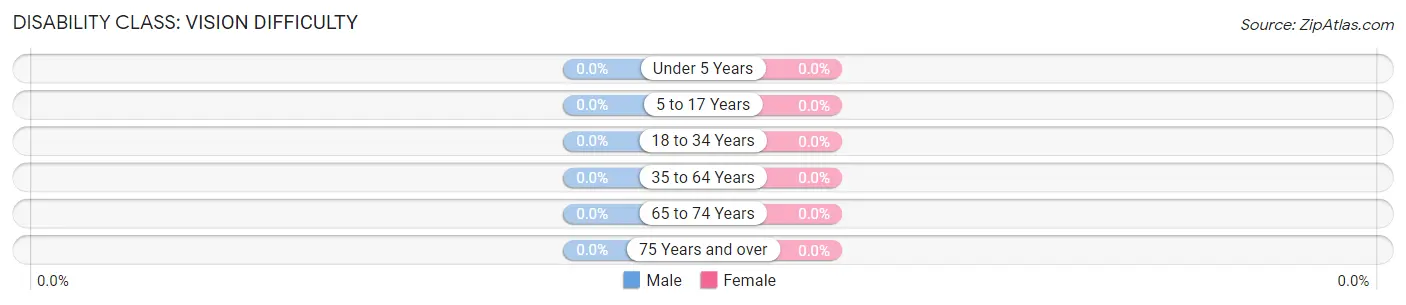
| Age Bracket | Male | Female |
| Under 5 Years | 0 (0.0%) | 0 (0.0%) |
| 5 to 17 Years | 0 (0.0%) | 0 (0.0%) |
| 18 to 34 Years | 0 (0.0%) | 0 (0.0%) |
| 35 to 64 Years | 0 (0.0%) | 0 (0.0%) |
| 65 to 74 Years | 0 (0.0%) | 0 (0.0%) |
| 75 Years and over | 0 (0.0%) | 0 (0.0%) |
Disability Class: Cognitive Difficulty
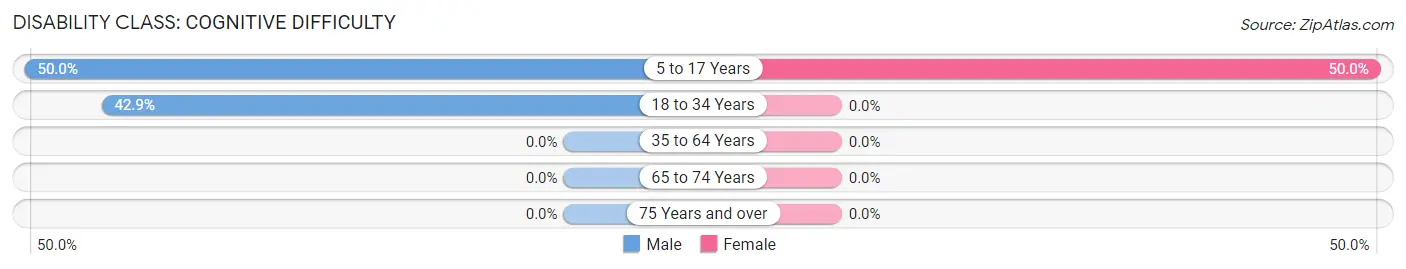
| Age Bracket | Male | Female |
| 5 to 17 Years | 1 (50.0%) | 1 (50.0%) |
| 18 to 34 Years | 3 (42.9%) | 0 (0.0%) |
| 35 to 64 Years | 0 (0.0%) | 0 (0.0%) |
| 65 to 74 Years | 0 (0.0%) | 0 (0.0%) |
| 75 Years and over | 0 (0.0%) | 0 (0.0%) |
Disability Class: Ambulatory Difficulty
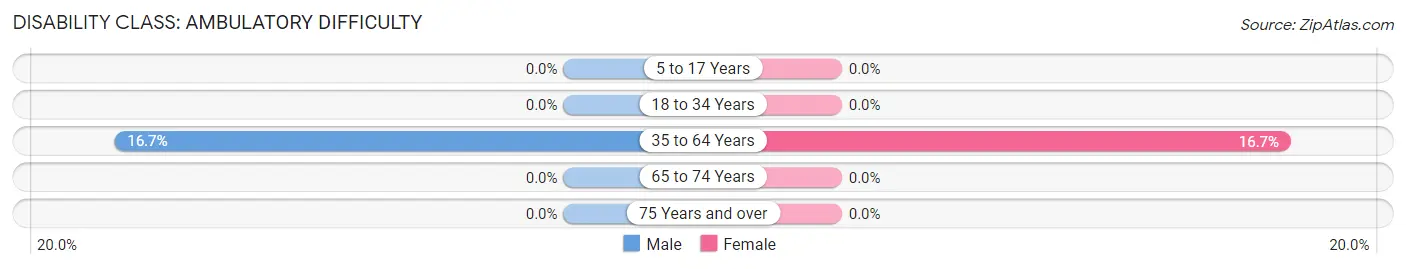
| Age Bracket | Male | Female |
| 5 to 17 Years | 0 (0.0%) | 0 (0.0%) |
| 18 to 34 Years | 0 (0.0%) | 0 (0.0%) |
| 35 to 64 Years | 2 (16.7%) | 1 (16.7%) |
| 65 to 74 Years | 0 (0.0%) | 0 (0.0%) |
| 75 Years and over | 0 (0.0%) | 0 (0.0%) |
Disability Class: Self-Care Difficulty
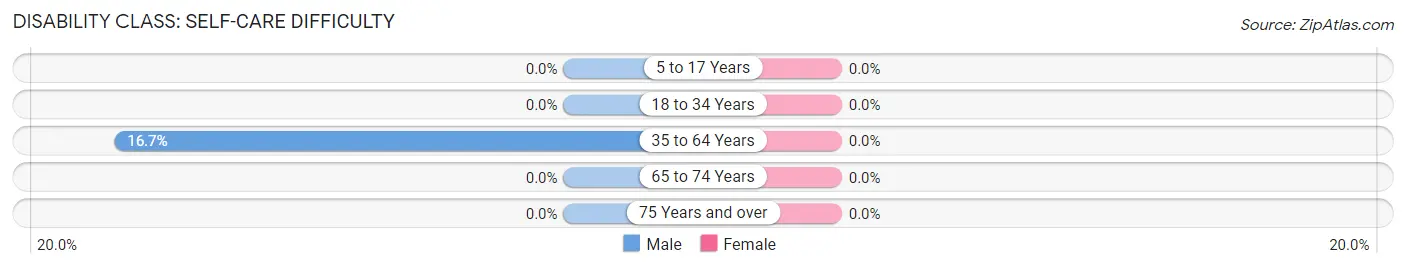
| Age Bracket | Male | Female |
| 5 to 17 Years | 0 (0.0%) | 0 (0.0%) |
| 18 to 34 Years | 0 (0.0%) | 0 (0.0%) |
| 35 to 64 Years | 2 (16.7%) | 0 (0.0%) |
| 65 to 74 Years | 0 (0.0%) | 0 (0.0%) |
| 75 Years and over | 0 (0.0%) | 0 (0.0%) |
Technology Access in Antioch
Computing Device Access in Antioch
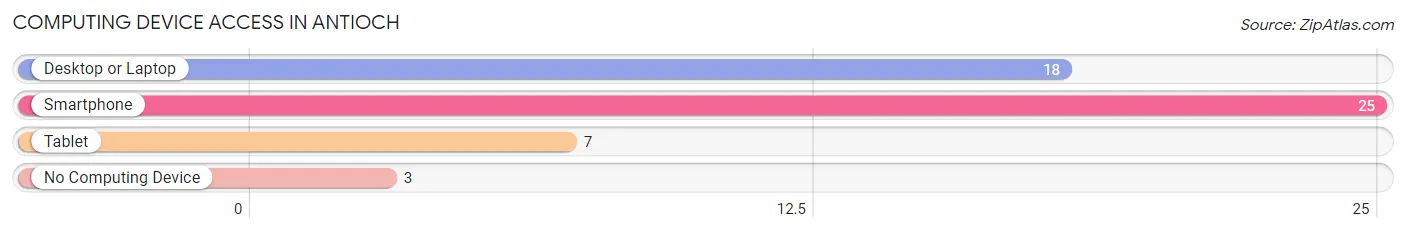
| Device Type | # Households | % Households |
| Desktop or Laptop | 18 | 62.1% |
| Smartphone | 25 | 86.2% |
| Tablet | 7 | 24.1% |
| No Computing Device | 3 | 10.3% |
| Total | 29 | 100.0% |
Internet Access in Antioch
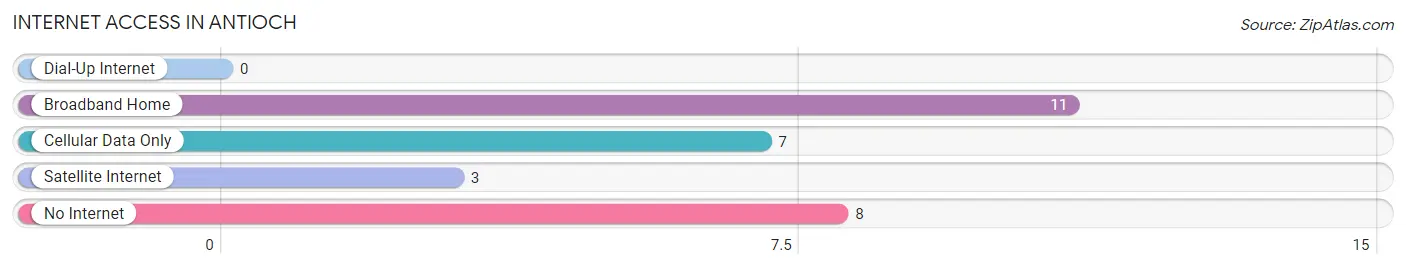
| Internet Type | # Households | % Households |
| Dial-Up Internet | 0 | 0.0% |
| Broadband Home | 11 | 37.9% |
| Cellular Data Only | 7 | 24.1% |
| Satellite Internet | 3 | 10.3% |
| No Internet | 8 | 27.6% |
| Total | 29 | 100.0% |
Antioch Summary
Antioch, Ohio is a small village located in the southeastern corner of Ohio, in the county of Belmont. It is situated on the Ohio River, just south of the city of Wheeling, West Virginia. The village has a population of approximately 1,000 people, and is part of the Wheeling Metropolitan Statistical Area.
History
The area that is now Antioch was first settled in the early 1800s by a group of German immigrants. The village was originally known as “New Germany”, and was later renamed Antioch in 1837. The name was chosen in honor of the ancient city of Antioch, located in modern-day Turkey.
The village was incorporated in 1845, and the first mayor was elected in 1846. During the 19th century, Antioch was a thriving river port, and was home to several industries, including a flour mill, a sawmill, and a brickyard.
In the early 20th century, the village experienced a period of decline, as the industries that had once been the backbone of the local economy began to close. However, the village was able to survive, and in the late 20th century, it experienced a period of revitalization.
Geography
Antioch is located in the southeastern corner of Ohio, in the county of Belmont. It is situated on the Ohio River, just south of the city of Wheeling, West Virginia. The village is located in a rural area, and is surrounded by rolling hills and farmland.
The village is located at an elevation of 845 feet above sea level. The climate is humid continental, with hot summers and cold winters. The average annual temperature is 52 degrees Fahrenheit, and the average annual precipitation is 40 inches.
Economy
The economy of Antioch is largely based on agriculture and tourism. The village is home to several small businesses, including a grocery store, a hardware store, and a restaurant. The village also has a small industrial park, which is home to several light manufacturing companies.
The village is also home to several tourist attractions, including a historic covered bridge, a museum, and a nature preserve. The village also hosts several annual festivals, including the Antioch Apple Festival and the Antioch Music Festival.
Demographics
As of the 2010 census, the population of Antioch was 1,000 people. The racial makeup of the village was 97.2% White, 0.7% African American, 0.3% Native American, 0.3% Asian, and 1.5% from other races. The median household income was $37,500, and the median family income was $45,000.
The village is served by the Belmont County School District, which includes two elementary schools, one middle school, and one high school. The village is also home to a branch of the Belmont County Library.
Conclusion
Antioch is a small village located in the southeastern corner of Ohio, in the county of Belmont. It is situated on the Ohio River, just south of the city of Wheeling, West Virginia. The village has a population of approximately 1,000 people, and is part of the Wheeling Metropolitan Statistical Area. The economy of Antioch is largely based on agriculture and tourism, and the village is home to several small businesses and tourist attractions. The village is served by the Belmont County School District, and is home to a branch of the Belmont County Library.
Common Questions
What is Per Capita Income in Antioch?
Per Capita income in Antioch is $20,091.
What is the Median Household income in Antioch?
Median Household Income in Antioch is $18,750.
What is Inequality or Gini Index in Antioch?
Inequality or Gini Index in Antioch is 0.56.
What is the Total Population of Antioch?
Total Population of Antioch is 47.
What is the Total Male Population of Antioch?
Total Male Population of Antioch is 28.
What is the Total Female Population of Antioch?
Total Female Population of Antioch is 19.
What is the Ratio of Males per 100 Females in Antioch?
There are 147.37 Males per 100 Females in Antioch.
What is the Ratio of Females per 100 Males in Antioch?
There are 67.86 Females per 100 Males in Antioch.
What is the Median Population Age in Antioch?
Median Population Age in Antioch is 45.8 Years.
What is the Average Family Size in Antioch
Average Family Size in Antioch is 2.1 People.
What is the Average Household Size in Antioch
Average Household Size in Antioch is 1.6 People.
How Large is the Labor Force in Antioch?
There are 20 People in the Labor Forcein in Antioch.
What is the Percentage of People in the Labor Force in Antioch?
47.6% of People are in the Labor Force in Antioch.
What is the Unemployment Rate in Antioch?
Unemployment Rate in Antioch is 30.0%.