Zip Codes with the Highest Percentage of Population Employed in Security & Protection in Cincinnati, OH

RELATED REPORTS & OPTIONS

Security & Protection
Population
Families and Households
Female Fertility
Female Fertility (Unmarried)
Race (Community Size)
Race (Percentage)
Ancestry (Community Size)
AfghanAfricanAlbanianAlsatianAmericanApacheArabArgentineanArmenianAustralianAustrianBarbadianBelgianBhutaneseBlackfeetBolivianBrazilianBritishBritish West IndianBulgarianBurmeseCanadianCape VerdeanCarpatho RusynCelticCentral AmericanCentral American IndianCherokeeCheyenneChileanChippewaChoctawColombianCosta RicanCreeCreekCroatianCubanCzechCzechoslovakianDanishDominicanDutchEastern EuropeanEcuadorianEgyptianEnglishEstonianEthiopianEuropeanFilipinoFinnishFrenchFrench American IndianFrench CanadianGermanGerman RussianGhanaianGreekGuamanian / ChamorroGuatemalanGuyaneseHaitianHonduranHungarianIcelanderIndian (Asian)IndonesianInupiatIranianIraqiIrishIroquoisIsraeliItalianJamaicanJapaneseJordanianKenyanKoreanLaotianLatvianLebaneseLithuanianLuxembourgerMacedonianMalaysianMexicanMexican American IndianMongolianMoroccanNative HawaiianNavajoNew ZealanderNicaraguanNigerianNorthern EuropeanNorwegianOkinawanPakistaniPalestinianPanamanianParaguayanPennsylvania GermanPeruvianPolishPortuguesePuerto RicanRomanianRussianSalvadoranSamoanScandinavianScotch-IrishScottishSeminoleSenegaleseSerbianSierra LeoneanSiouxSlavicSlovakSloveneSouth AfricanSouth AmericanSouth American IndianSpaniardSpanishSpanish AmericanSri LankanSubsaharan AfricanSudaneseSwedishSwissSyrianThaiTrinidadian and TobagonianTurkishUgandanUkrainianVenezuelanVietnameseWelshWest IndianYugoslavianZimbabwean
Ancestry (Percentage)
AfghanAfricanAlbanianAlsatianAmericanApacheArabArgentineanArmenianAustralianAustrianBarbadianBelgianBhutaneseBlackfeetBolivianBrazilianBritishBritish West IndianBulgarianBurmeseCanadianCape VerdeanCarpatho RusynCelticCentral AmericanCentral American IndianCherokeeCheyenneChileanChippewaChoctawColombianCosta RicanCreeCreekCroatianCubanCzechCzechoslovakianDanishDominicanDutchEastern EuropeanEcuadorianEgyptianEnglishEstonianEthiopianEuropeanFilipinoFinnishFrenchFrench American IndianFrench CanadianGermanGerman RussianGhanaianGreekGuamanian / ChamorroGuatemalanGuyaneseHaitianHonduranHungarianIcelanderIndian (Asian)IndonesianInupiatIranianIraqiIrishIroquoisIsraeliItalianJamaicanJapaneseJordanianKenyanKoreanLaotianLatvianLebaneseLithuanianLuxembourgerMacedonianMalaysianMexicanMexican American IndianMongolianMoroccanNative HawaiianNavajoNew ZealanderNicaraguanNigerianNorthern EuropeanNorwegianOkinawanPakistaniPalestinianPanamanianParaguayanPennsylvania GermanPeruvianPolishPortuguesePuerto RicanRomanianRussianSalvadoranSamoanScandinavianScotch-IrishScottishSeminoleSenegaleseSerbianSierra LeoneanSiouxSlavicSlovakSloveneSouth AfricanSouth AmericanSouth American IndianSpaniardSpanishSpanish AmericanSri LankanSubsaharan AfricanSudaneseSwedishSwissSyrianThaiTrinidadian and TobagonianTurkishUgandanUkrainianVenezuelanVietnameseWelshWest IndianYugoslavianZimbabwean
Immigrant Origin (Total)
AfghanistanAfricaArgentinaAsiaAustraliaAustriaBahamasBangladeshBelarusBelgiumBosnia and HerzegovinaBrazilBulgariaBurma / MyanmarCambodiaCameroonCanadaCaribbeanCentral AmericaChileChinaColombiaCongoCosta RicaCroatiaCubaCzechoslovakiaDominicaDominican RepublicEastern AfricaEastern AsiaEastern EuropeEcuadorEgyptEl SalvadorEnglandEritreaEthiopiaEuropeFranceGermanyGhanaGreeceGuatemalaGuyanaHaitiHondurasHong KongHungaryIndiaIndonesiaIranIraqIrelandIsraelItalyJamaicaJapanJordanKazakhstanKenyaKoreaKuwaitLaosLatin AmericaLatviaLebanonLiberiaLithuaniaMalaysiaMexicoMicronesiaMiddle AfricaMoldovaMoroccoNepalNetherlandsNicaraguaNigeriaNorth MacedoniaNorthern AfricaNorthern EuropeNorwayOceaniaPakistanPanamaPeruPhilippinesPolandRomaniaRussiaSaudi ArabiaScotlandSenegalSerbiaSierra LeoneSingaporeSouth AfricaSouth AmericaSouth Central AsiaSouth Eastern AsiaSouthern EuropeSpainSri LankaSudanSwedenSwitzerlandSyriaTaiwanThailandTrinidad and TobagoTurkeyUgandaUkraineUruguayUzbekistanVenezuelaVietnamWestern AfricaWestern AsiaWestern EuropeZimbabwe
Immigrant Origin (Percentage)
AfghanistanAfricaArgentinaAsiaAustraliaAustriaBahamasBangladeshBelarusBelgiumBosnia and HerzegovinaBrazilBulgariaBurma / MyanmarCambodiaCameroonCanadaCaribbeanCentral AmericaChileChinaColombiaCongoCosta RicaCroatiaCubaCzechoslovakiaDominicaDominican RepublicEastern AfricaEastern AsiaEastern EuropeEcuadorEgyptEl SalvadorEnglandEritreaEthiopiaEuropeFranceGermanyGhanaGreeceGuatemalaGuyanaHaitiHondurasHong KongHungaryIndiaIndonesiaIranIraqIrelandIsraelItalyJamaicaJapanJordanKazakhstanKenyaKoreaKuwaitLaosLatin AmericaLatviaLebanonLiberiaLithuaniaMalaysiaMexicoMicronesiaMiddle AfricaMoldovaMoroccoNepalNetherlandsNicaraguaNigeriaNorth MacedoniaNorthern AfricaNorthern EuropeNorwayOceaniaPakistanPanamaPeruPhilippinesPolandRomaniaRussiaSaudi ArabiaScotlandSenegalSerbiaSierra LeoneSingaporeSouth AfricaSouth AmericaSouth Central AsiaSouth Eastern AsiaSouthern EuropeSpainSri LankaSudanSwedenSwitzerlandSyriaTaiwanThailandTrinidad and TobagoTurkeyUgandaUkraineUruguayUzbekistanVenezuelaVietnamWestern AfricaWestern AsiaWestern EuropeZimbabwe
Income
Income (Families)
Income (Households)
Poverty
Poverty (Families)
Unemployment
Employment Occupations
Employment Industries
Employer Class
Commute Time
Commute Means
School Enrollment
Education by Degree Field
Occupancy
Finances
Physical Characteristics
Cincinnati
Compare Zip Codes
Comparison Subject

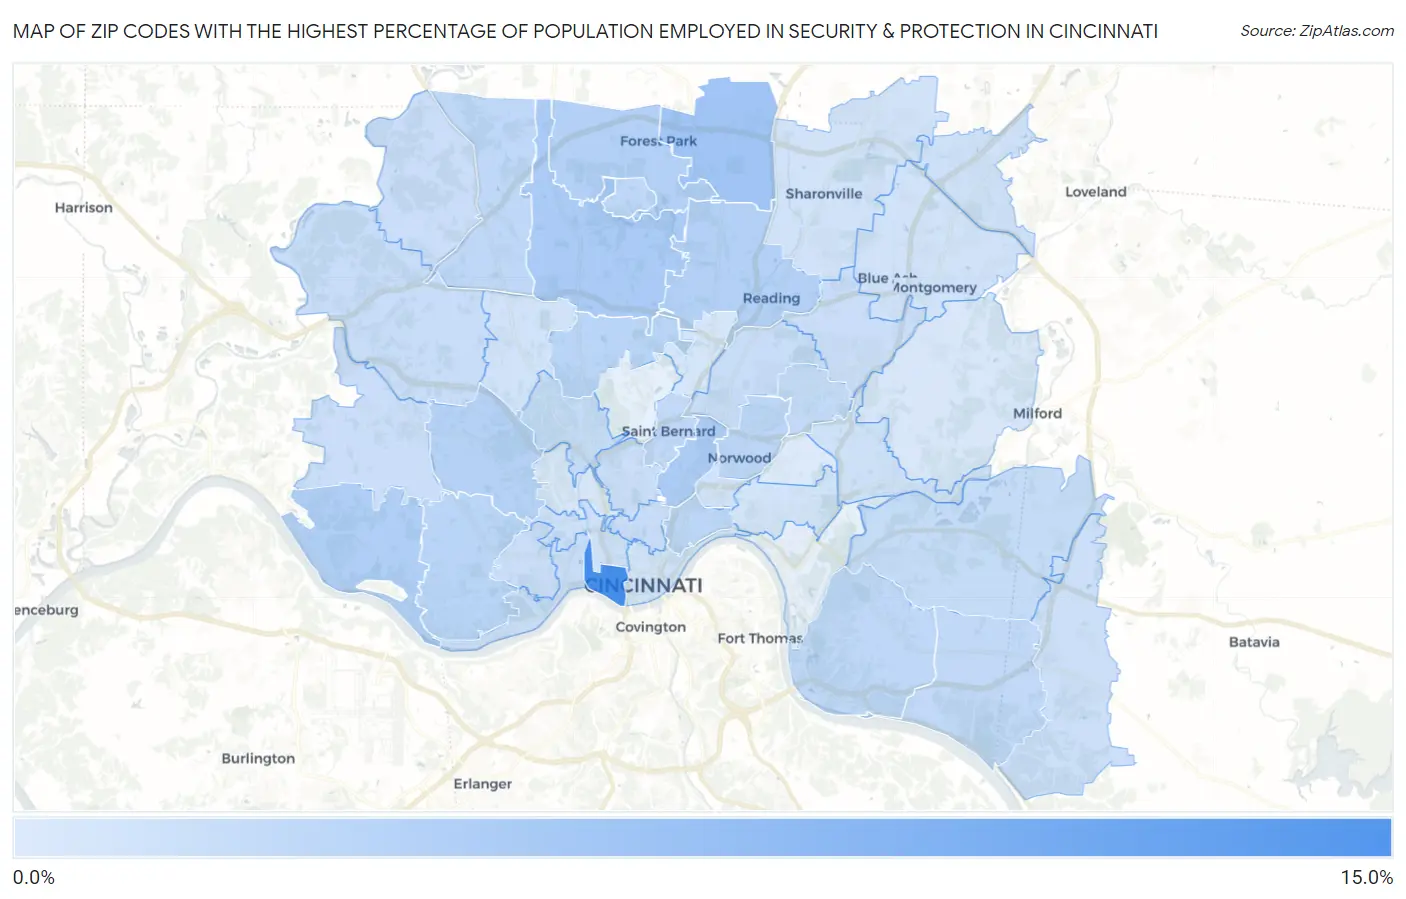
Map of Zip Codes with the Highest Percentage of Population Employed in Security & Protection in Cincinnati

0.0%
15.0%
Zip Codes with the Highest Percentage of Population Employed in Security & Protection in Cincinnati Map

Zip Codes with the Highest Percentage of Population Employed in Security & Protection in Cincinnati, OH

Zip Code % Employed vs State vs National
1.4520310.6%1.9%(+8.65)#82.1%(+8.42)#696
2.452464.3%1.9%(+2.34)#782.1%(+2.11)#4,020
3.452313.5%1.9%(+1.59)#1292.1%(+1.35)#5,668
4.452293.4%1.9%(+1.46)#1402.1%(+1.22)#6,031
5.452333.1%1.9%(+1.23)#1702.1%(+0.996)#6,720
6.452403.0%1.9%(+1.10)#1872.1%(+0.865)#7,176
7.452152.9%1.9%(+1.02)#1992.1%(+0.779)#7,525
8.452112.8%1.9%(+0.870)#2262.1%(+0.632)#8,193
9.452382.4%1.9%(+0.511)#2932.1%(+0.272)#9,950
10.452242.4%1.9%(+0.485)#2982.1%(+0.246)#10,081
11.452062.4%1.9%(+0.478)#3012.1%(+0.240)#10,111
12.452122.3%1.9%(+0.379)#3252.1%(+0.141)#10,707
13.452182.2%1.9%(+0.305)#3462.1%(+0.067)#11,161
14.452302.2%1.9%(+0.289)#3502.1%(+0.051)#11,260
15.452512.2%1.9%(+0.257)#3592.1%(+0.019)#11,458
16.452172.1%1.9%(+0.155)#3872.1%(-0.084)#12,159
17.452552.0%1.9%(+0.123)#3942.1%(-0.115)#12,352
18.452131.8%1.9%(-0.118)#4622.1%(-0.356)#14,010
19.452231.7%1.9%(-0.221)#4932.1%(-0.459)#14,762
20.452441.6%1.9%(-0.266)#5082.1%(-0.504)#15,088
21.452471.6%1.9%(-0.335)#5232.1%(-0.573)#15,603
22.452371.6%1.9%(-0.355)#5292.1%(-0.593)#15,767
23.452191.5%1.9%(-0.364)#5342.1%(-0.602)#15,821
24.452041.5%1.9%(-0.422)#5582.1%(-0.660)#16,307
25.452051.5%1.9%(-0.451)#5682.1%(-0.689)#16,500
26.452361.4%1.9%(-0.468)#5742.1%(-0.707)#16,650
27.452481.4%1.9%(-0.472)#5762.1%(-0.711)#16,677
28.452521.4%1.9%(-0.486)#5852.1%(-0.725)#16,778
29.452201.3%1.9%(-0.598)#6182.1%(-0.837)#17,640
30.452451.2%1.9%(-0.667)#6442.1%(-0.905)#18,175
31.452141.2%1.9%(-0.711)#6662.1%(-0.949)#18,507
32.452271.1%1.9%(-0.823)#7072.1%(-1.06)#19,380
33.452491.1%1.9%(-0.850)#7122.1%(-1.09)#19,582
34.452410.94%1.9%(-0.968)#7582.1%(-1.21)#20,492
35.452390.92%1.9%(-0.988)#7642.1%(-1.23)#20,635
36.452020.92%1.9%(-0.988)#7652.1%(-1.23)#20,637
37.452070.88%1.9%(-1.03)#7832.1%(-1.27)#20,939
38.452420.86%1.9%(-1.05)#7872.1%(-1.29)#21,025
39.452080.81%1.9%(-1.10)#7982.1%(-1.33)#21,332
40.452160.60%1.9%(-1.31)#8542.1%(-1.55)#22,654
41.452250.52%1.9%(-1.39)#8692.1%(-1.63)#23,120
42.452430.46%1.9%(-1.45)#8802.1%(-1.69)#23,444
43.452090.16%1.9%(-1.75)#9262.1%(-1.99)#24,613

Common Questions

What are the Top 10 Zip Codes with the Highest Percentage of Population Employed in Security & Protection in Cincinnati, OH?
Top 10 Zip Codes with the Highest Percentage of Population Employed in Security & Protection in Cincinnati, OH are:
#1
10.6%
#2
4.3%
#3
3.5%
#4
3.4%
#5
3.1%
#6
3.0%
#7
2.9%
#8
2.8%
#9
2.4%
#10
2.4%
What zip code has the Highest Percentage of Population Employed in Security & Protection in Cincinnati, OH?
45203 has the Highest Percentage of Population Employed in Security & Protection in Cincinnati, OH with 10.6%.
What is the Percentage of Population Employed in Security & Protection in Cincinnati, OH?
Percentage of Population Employed in Security & Protection in Cincinnati is 1.7%.
What is the Percentage of Population Employed in Security & Protection in Ohio?
Percentage of Population Employed in Security & Protection in Ohio is 1.9%.
What is the Percentage of Population Employed in Security & Protection in the United States?
Percentage of Population Employed in Security & Protection in the United States is 2.1%.