Zip Codes with the Highest Percentage of Population Employed in Security & Protection in Cuyahoga Falls, OH
RELATED REPORTS & OPTIONS
Security & Protection
Cuyahoga Falls
Compare Zip Codes
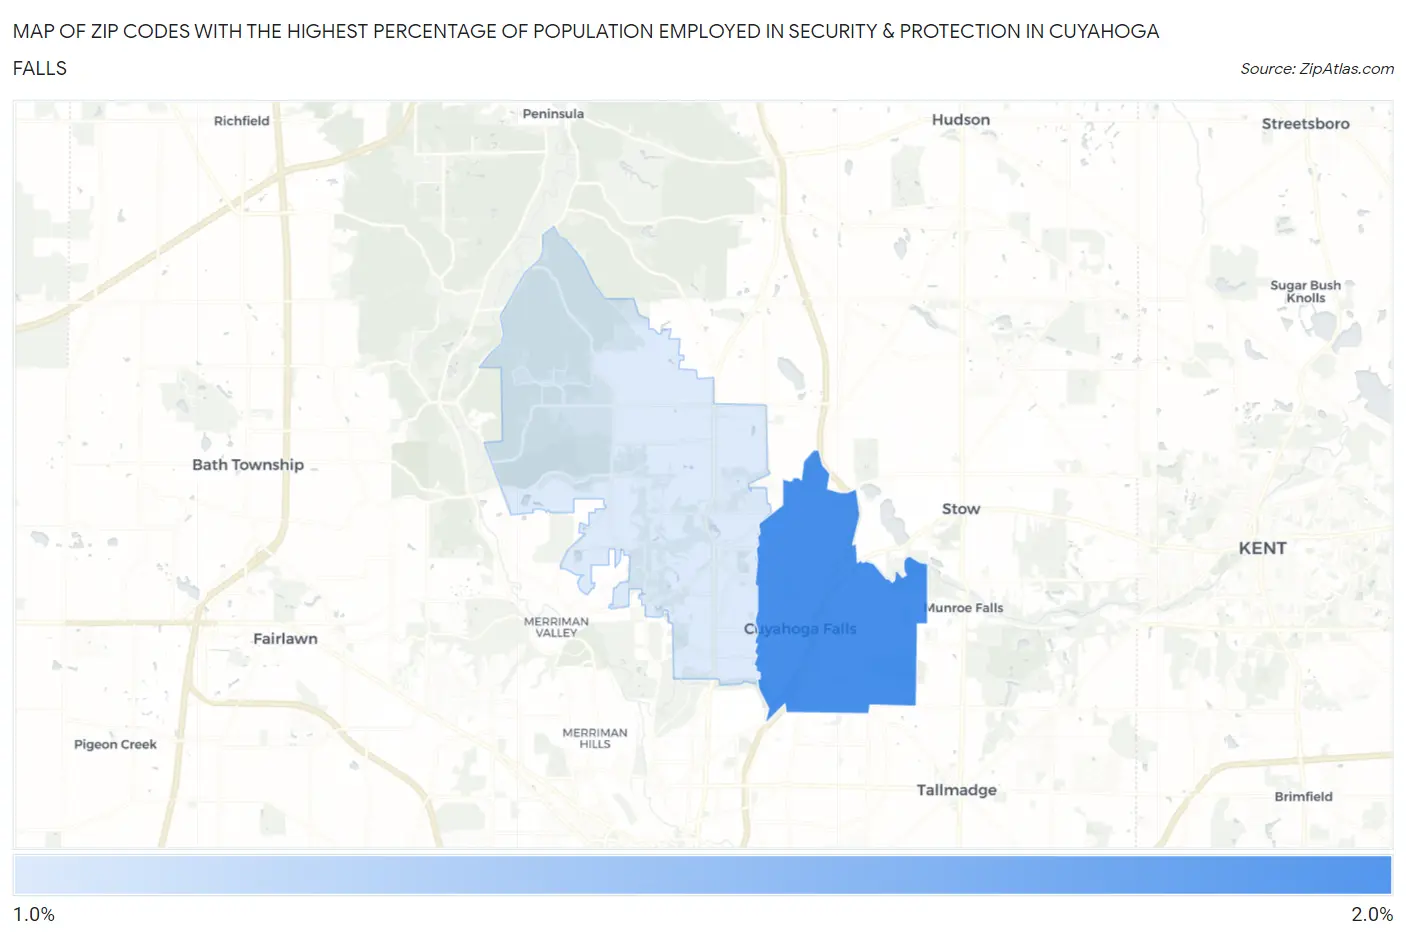
Map of Zip Codes with the Highest Percentage of Population Employed in Security & Protection in Cuyahoga Falls
1.6%
1.7%
Zip Codes with the Highest Percentage of Population Employed in Security & Protection in Cuyahoga Falls, OH
| Zip Code | % Employed | vs State | vs National | |
| 1. | 44221 | 1.7% | 1.9%(-0.165)#475 | 2.1%(-0.403)#14,345 |
| 2. | 44223 | 1.6% | 1.9%(-0.264)#507 | 2.1%(-0.502)#15,072 |
1
Common Questions
What are the Top Zip Codes with the Highest Percentage of Population Employed in Security & Protection in Cuyahoga Falls, OH?
Top Zip Codes with the Highest Percentage of Population Employed in Security & Protection in Cuyahoga Falls, OH are:
What zip code has the Highest Percentage of Population Employed in Security & Protection in Cuyahoga Falls, OH?
44221 has the Highest Percentage of Population Employed in Security & Protection in Cuyahoga Falls, OH with 1.7%.
What is the Percentage of Population Employed in Security & Protection in Cuyahoga Falls, OH?
Percentage of Population Employed in Security & Protection in Cuyahoga Falls is 1.6%.
What is the Percentage of Population Employed in Security & Protection in Ohio?
Percentage of Population Employed in Security & Protection in Ohio is 1.9%.
What is the Percentage of Population Employed in Security & Protection in the United States?
Percentage of Population Employed in Security & Protection in the United States is 2.1%.