Zip Codes with the Highest Percentage of Population Employed in Security & Protection in Ohio
RELATED REPORTS & OPTIONS
Security & Protection
Ohio
Compare Zip Codes
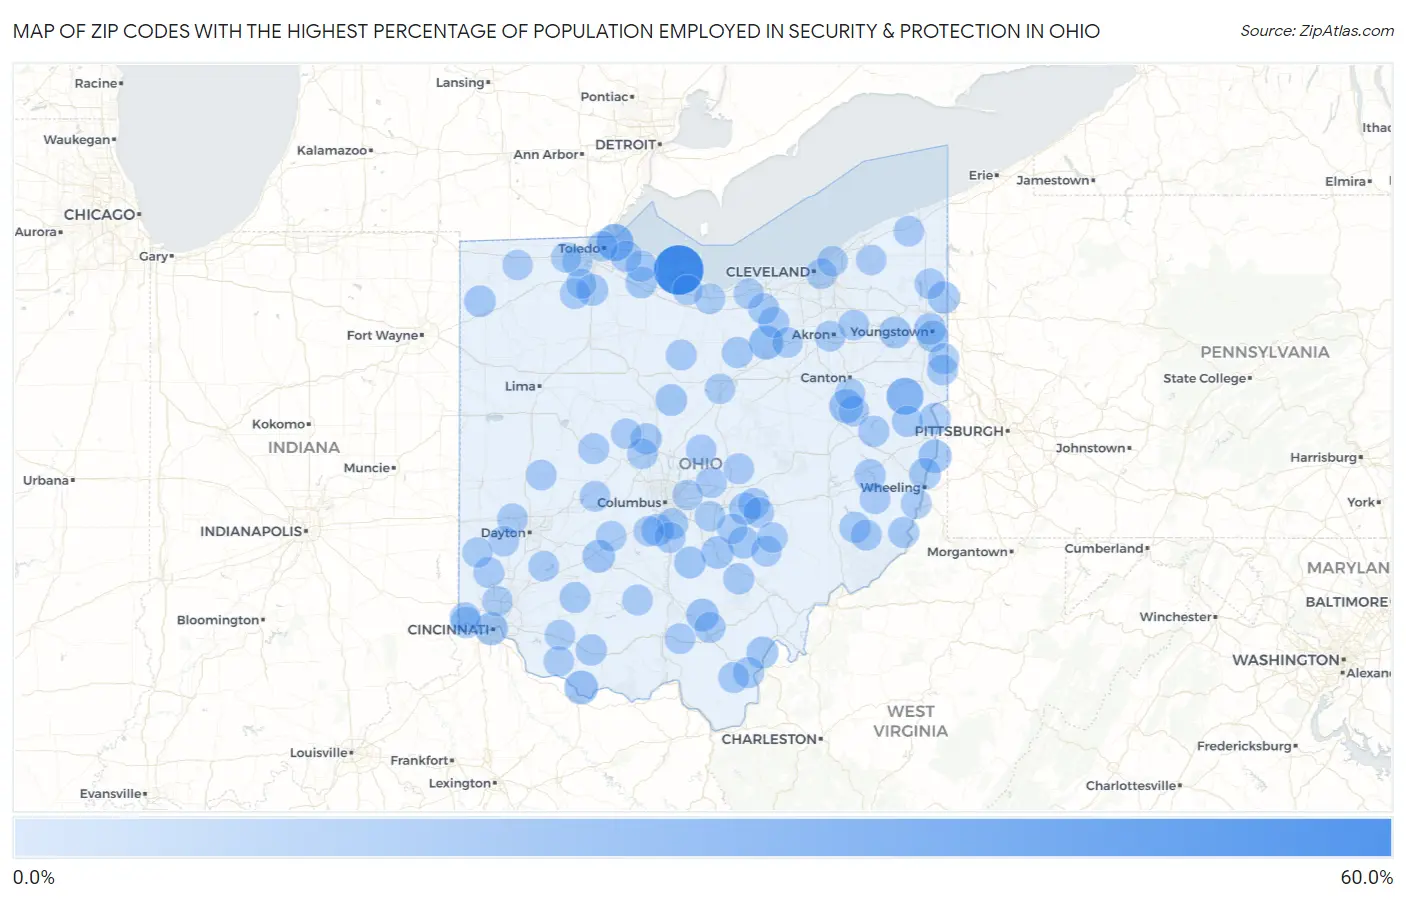
Map of Zip Codes with the Highest Percentage of Population Employed in Security & Protection in Ohio
0.0%
60.0%
Zip Codes with the Highest Percentage of Population Employed in Security & Protection in Ohio
| Zip Code | % Employed | vs State | vs National | |
| 1. | 43433 | 53.5% | 1.9%(+51.6)#1 | 2.1%(+51.3)#31 |
| 2. | 43434 | 20.7% | 1.9%(+18.8)#2 | 2.1%(+18.5)#184 |
| 3. | 43962 | 20.5% | 1.9%(+18.6)#3 | 2.1%(+18.4)#187 |
| 4. | 44235 | 13.4% | 1.9%(+11.4)#4 | 2.1%(+11.2)#457 |
| 5. | 44697 | 12.8% | 1.9%(+10.9)#5 | 2.1%(+10.7)#485 |
| 6. | 45101 | 12.4% | 1.9%(+10.5)#6 | 2.1%(+10.3)#513 |
| 7. | 43913 | 11.2% | 1.9%(+9.27)#7 | 2.1%(+9.03)#628 |
| 8. | 45203 | 10.6% | 1.9%(+8.65)#8 | 2.1%(+8.42)#696 |
| 9. | 43142 | 10.0% | 1.9%(+8.09)#9 | 2.1%(+7.85)#766 |
| 10. | 45672 | 9.5% | 1.9%(+7.60)#10 | 2.1%(+7.37)#836 |
| 11. | 43155 | 9.3% | 1.9%(+7.39)#11 | 2.1%(+7.15)#862 |
| 12. | 44404 | 8.4% | 1.9%(+6.46)#12 | 2.1%(+6.22)#1,053 |
| 13. | 43116 | 8.2% | 1.9%(+6.34)#13 | 2.1%(+6.10)#1,085 |
| 14. | 43739 | 8.2% | 1.9%(+6.25)#14 | 2.1%(+6.01)#1,106 |
| 15. | 43748 | 7.8% | 1.9%(+5.90)#15 | 2.1%(+5.66)#1,237 |
| 16. | 45620 | 7.6% | 1.9%(+5.74)#16 | 2.1%(+5.50)#1,279 |
| 17. | 43156 | 7.6% | 1.9%(+5.70)#17 | 2.1%(+5.46)#1,293 |
| 18. | 44429 | 7.6% | 1.9%(+5.64)#18 | 2.1%(+5.40)#1,312 |
| 19. | 43971 | 7.4% | 1.9%(+5.52)#19 | 2.1%(+5.28)#1,357 |
| 20. | 43314 | 7.3% | 1.9%(+5.42)#20 | 2.1%(+5.18)#1,390 |
| 21. | 43536 | 7.1% | 1.9%(+5.23)#21 | 2.1%(+4.99)#1,476 |
| 22. | 43442 | 7.1% | 1.9%(+5.18)#22 | 2.1%(+4.94)#1,495 |
| 23. | 44510 | 7.1% | 1.9%(+5.17)#23 | 2.1%(+4.93)#1,498 |
| 24. | 44507 | 6.9% | 1.9%(+5.03)#24 | 2.1%(+4.80)#1,558 |
| 25. | 43403 | 6.8% | 1.9%(+4.93)#25 | 2.1%(+4.69)#1,611 |
| 26. | 43961 | 6.8% | 1.9%(+4.86)#26 | 2.1%(+4.62)#1,646 |
| 27. | 43983 | 6.7% | 1.9%(+4.76)#27 | 2.1%(+4.52)#1,702 |
| 28. | 45052 | 6.3% | 1.9%(+4.43)#28 | 2.1%(+4.19)#1,870 |
| 29. | 43458 | 6.3% | 1.9%(+4.41)#29 | 2.1%(+4.17)#1,889 |
| 30. | 43740 | 6.3% | 1.9%(+4.39)#30 | 2.1%(+4.15)#1,899 |
| 31. | 45697 | 6.3% | 1.9%(+4.36)#31 | 2.1%(+4.13)#1,909 |
| 32. | 43788 | 6.2% | 1.9%(+4.30)#32 | 2.1%(+4.06)#1,948 |
| 33. | 43468 | 6.1% | 1.9%(+4.24)#33 | 2.1%(+4.00)#1,988 |
| 34. | 43217 | 6.1% | 1.9%(+4.17)#34 | 2.1%(+3.93)#2,027 |
| 35. | 43908 | 6.0% | 1.9%(+4.14)#35 | 2.1%(+3.90)#2,045 |
| 36. | 43158 | 6.0% | 1.9%(+4.13)#36 | 2.1%(+3.90)#2,049 |
| 37. | 44874 | 6.0% | 1.9%(+4.13)#37 | 2.1%(+3.89)#2,053 |
| 38. | 44695 | 6.0% | 1.9%(+4.10)#38 | 2.1%(+3.87)#2,067 |
| 39. | 43915 | 5.9% | 1.9%(+3.97)#39 | 2.1%(+3.73)#2,153 |
| 40. | 43066 | 5.7% | 1.9%(+3.83)#40 | 2.1%(+3.59)#2,258 |
| 41. | 44253 | 5.7% | 1.9%(+3.78)#41 | 2.1%(+3.54)#2,290 |
| 42. | 45146 | 5.6% | 1.9%(+3.67)#42 | 2.1%(+3.44)#2,381 |
| 43. | 44454 | 5.6% | 1.9%(+3.67)#43 | 2.1%(+3.43)#2,390 |
| 44. | 45631 | 5.6% | 1.9%(+3.66)#44 | 2.1%(+3.42)#2,398 |
| 45. | 44050 | 5.5% | 1.9%(+3.60)#45 | 2.1%(+3.36)#2,449 |
| 46. | 43754 | 5.5% | 1.9%(+3.55)#46 | 2.1%(+3.31)#2,486 |
| 47. | 45621 | 5.4% | 1.9%(+3.50)#47 | 2.1%(+3.26)#2,533 |
| 48. | 44413 | 5.4% | 1.9%(+3.48)#48 | 2.1%(+3.24)#2,554 |
| 49. | 45658 | 5.3% | 1.9%(+3.44)#49 | 2.1%(+3.20)#2,591 |
| 50. | 43360 | 5.3% | 1.9%(+3.43)#50 | 2.1%(+3.19)#2,596 |
| 51. | 43001 | 5.1% | 1.9%(+3.21)#51 | 2.1%(+2.97)#2,790 |
| 52. | 44854 | 5.0% | 1.9%(+3.08)#52 | 2.1%(+2.85)#2,934 |
| 53. | 45062 | 5.0% | 1.9%(+3.05)#53 | 2.1%(+2.82)#2,967 |
| 54. | 43103 | 4.9% | 1.9%(+3.01)#54 | 2.1%(+2.77)#3,016 |
| 55. | 43730 | 4.9% | 1.9%(+2.98)#55 | 2.1%(+2.75)#3,053 |
| 56. | 43071 | 4.8% | 1.9%(+2.90)#56 | 2.1%(+2.67)#3,165 |
| 57. | 45681 | 4.8% | 1.9%(+2.90)#57 | 2.1%(+2.66)#3,167 |
| 58. | 44010 | 4.7% | 1.9%(+2.81)#58 | 2.1%(+2.57)#3,274 |
| 59. | 43010 | 4.6% | 1.9%(+2.72)#59 | 2.1%(+2.48)#3,393 |
| 60. | 43713 | 4.6% | 1.9%(+2.70)#60 | 2.1%(+2.47)#3,417 |
| 61. | 43760 | 4.6% | 1.9%(+2.69)#61 | 2.1%(+2.45)#3,440 |
| 62. | 45315 | 4.6% | 1.9%(+2.69)#62 | 2.1%(+2.45)#3,449 |
| 63. | 44307 | 4.6% | 1.9%(+2.69)#63 | 2.1%(+2.45)#3,453 |
| 64. | 44104 | 4.6% | 1.9%(+2.68)#64 | 2.1%(+2.44)#3,464 |
| 65. | 45326 | 4.6% | 1.9%(+2.68)#65 | 2.1%(+2.44)#3,469 |
| 66. | 45068 | 4.6% | 1.9%(+2.65)#66 | 2.1%(+2.41)#3,510 |
| 67. | 44243 | 4.6% | 1.9%(+2.65)#67 | 2.1%(+2.41)#3,517 |
| 68. | 45613 | 4.6% | 1.9%(+2.64)#68 | 2.1%(+2.40)#3,522 |
| 69. | 44417 | 4.5% | 1.9%(+2.61)#69 | 2.1%(+2.37)#3,582 |
| 70. | 43061 | 4.5% | 1.9%(+2.55)#70 | 2.1%(+2.31)#3,664 |
| 71. | 43947 | 4.5% | 1.9%(+2.55)#71 | 2.1%(+2.31)#3,668 |
| 72. | 43011 | 4.4% | 1.9%(+2.52)#72 | 2.1%(+2.28)#3,730 |
| 73. | 43151 | 4.4% | 1.9%(+2.51)#73 | 2.1%(+2.28)#3,738 |
| 74. | 44117 | 4.4% | 1.9%(+2.46)#74 | 2.1%(+2.22)#3,821 |
| 75. | 43146 | 4.3% | 1.9%(+2.41)#75 | 2.1%(+2.18)#3,897 |
| 76. | 45325 | 4.3% | 1.9%(+2.41)#76 | 2.1%(+2.17)#3,919 |
| 77. | 43731 | 4.3% | 1.9%(+2.39)#77 | 2.1%(+2.15)#3,944 |
| 78. | 45246 | 4.3% | 1.9%(+2.34)#78 | 2.1%(+2.11)#4,020 |
| 79. | 43542 | 4.2% | 1.9%(+2.33)#79 | 2.1%(+2.10)#4,034 |
| 80. | 44001 | 4.2% | 1.9%(+2.32)#80 | 2.1%(+2.08)#4,075 |
| 81. | 43004 | 4.2% | 1.9%(+2.31)#81 | 2.1%(+2.07)#4,093 |
| 82. | 44846 | 4.2% | 1.9%(+2.29)#82 | 2.1%(+2.06)#4,116 |
| 83. | 44656 | 4.2% | 1.9%(+2.27)#83 | 2.1%(+2.04)#4,156 |
| 84. | 43344 | 4.2% | 1.9%(+2.25)#84 | 2.1%(+2.01)#4,196 |
| 85. | 43569 | 4.1% | 1.9%(+2.23)#85 | 2.1%(+1.99)#4,223 |
| 86. | 43620 | 4.1% | 1.9%(+2.20)#86 | 2.1%(+1.96)#4,278 |
| 87. | 43150 | 4.1% | 1.9%(+2.19)#87 | 2.1%(+1.95)#4,295 |
| 88. | 45033 | 4.1% | 1.9%(+2.15)#88 | 2.1%(+1.91)#4,373 |
| 89. | 43105 | 4.1% | 1.9%(+2.15)#89 | 2.1%(+1.91)#4,383 |
| 90. | 44024 | 4.0% | 1.9%(+2.13)#90 | 2.1%(+1.89)#4,424 |
| 91. | 44251 | 4.0% | 1.9%(+2.12)#91 | 2.1%(+1.88)#4,430 |
| 92. | 45154 | 4.0% | 1.9%(+2.10)#92 | 2.1%(+1.86)#4,480 |
| 93. | 43565 | 4.0% | 1.9%(+2.07)#93 | 2.1%(+1.83)#4,537 |
| 94. | 43558 | 4.0% | 1.9%(+2.06)#94 | 2.1%(+1.82)#4,552 |
| 95. | 45311 | 3.9% | 1.9%(+2.04)#95 | 2.1%(+1.80)#4,591 |
| 96. | 45121 | 3.9% | 1.9%(+2.03)#96 | 2.1%(+1.79)#4,600 |
| 97. | 44824 | 3.9% | 1.9%(+2.00)#97 | 2.1%(+1.76)#4,670 |
| 98. | 44626 | 3.9% | 1.9%(+1.97)#98 | 2.1%(+1.73)#4,735 |
| 99. | 44907 | 3.9% | 1.9%(+1.95)#99 | 2.1%(+1.72)#4,767 |
| 100. | 43502 | 3.9% | 1.9%(+1.95)#100 | 2.1%(+1.71)#4,791 |
Common Questions
What are the Top 10 Zip Codes with the Highest Percentage of Population Employed in Security & Protection in Ohio?
Top 10 Zip Codes with the Highest Percentage of Population Employed in Security & Protection in Ohio are:
What zip code has the Highest Percentage of Population Employed in Security & Protection in Ohio?
43433 has the Highest Percentage of Population Employed in Security & Protection in Ohio with 53.5%.
What is the Percentage of Population Employed in Security & Protection in the State of Ohio?
Percentage of Population Employed in Security & Protection in Ohio is 1.9%.
What is the Percentage of Population Employed in Security & Protection in the United States?
Percentage of Population Employed in Security & Protection in the United States is 2.1%.