North College Hill, OH Map & Demographics
North College Hill Map
North College Hill Overview
$24,273
PER CAPITA INCOME
$66,399
AVG FAMILY INCOME
$51,971
AVG HOUSEHOLD INCOME
1.2%
WAGE / INCOME GAP [ % ]
98.8¢/ $1
WAGE / INCOME GAP [ $ ]
$15,091
FAMILY INCOME DEFICIT
0.40
INEQUALITY / GINI INDEX
9,602
TOTAL POPULATION
4,493
MALE POPULATION
5,109
FEMALE POPULATION
87.94
MALES / 100 FEMALES
113.71
FEMALES / 100 MALES
33.4
MEDIAN AGE
3.3
AVG FAMILY SIZE
2.5
AVG HOUSEHOLD SIZE
4,767
LABOR FORCE [ PEOPLE ]
64.2%
PERCENT IN LABOR FORCE
8.8%
UNEMPLOYMENT RATE
North College Hill Area Codes
Income in North College Hill
Income Overview in North College Hill
Per Capita Income in North College Hill is $24,273, while median incomes of families and households are $66,399 and $51,971 respectively.
| Characteristic | Number | Measure |
| Per Capita Income | 9,602 | $24,273 |
| Median Family Income | 2,265 | $66,399 |
| Mean Family Income | 2,265 | $66,771 |
| Median Household Income | 3,753 | $51,971 |
| Mean Household Income | 3,753 | $59,996 |
| Income Deficit | 2,265 | $15,091 |
| Wage / Income Gap (%) | 9,602 | 1.16% |
| Wage / Income Gap ($) | 9,602 | 98.84¢ per $1 |
| Gini / Inequality Index | 9,602 | 0.40 |
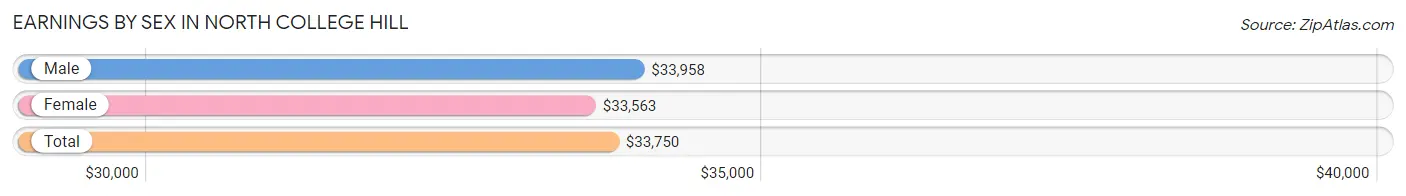
Earnings by Sex in North College Hill
Average Earnings in North College Hill are $33,750, $33,958 for men and $33,563 for women, a difference of 1.2%.
| Sex | Number | Average Earnings |
| Male | 2,343 (47.3%) | $33,958 |
| Female | 2,606 (52.7%) | $33,563 |
| Total | 4,949 (100.0%) | $33,750 |
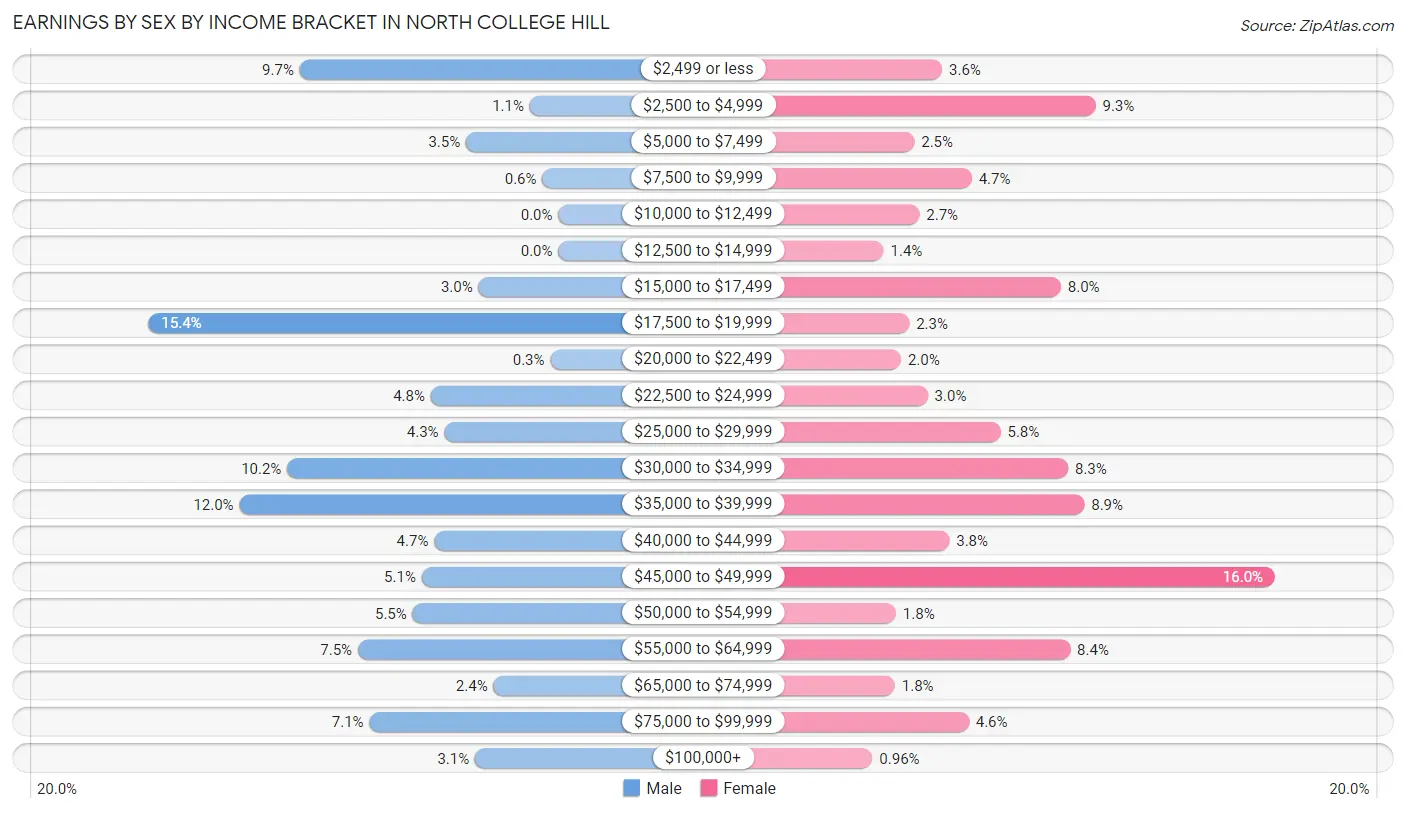
Earnings by Sex by Income Bracket in North College Hill
The most common earnings brackets in North College Hill are $17,500 to $19,999 for men (360 | 15.4%) and $45,000 to $49,999 for women (418 | 16.0%).
| Income | Male | Female |
| $2,499 or less | 227 (9.7%) | 93 (3.6%) |
| $2,500 to $4,999 | 25 (1.1%) | 243 (9.3%) |
| $5,000 to $7,499 | 81 (3.5%) | 66 (2.5%) |
| $7,500 to $9,999 | 14 (0.6%) | 122 (4.7%) |
| $10,000 to $12,499 | 0 (0.0%) | 71 (2.7%) |
| $12,500 to $14,999 | 0 (0.0%) | 36 (1.4%) |
| $15,000 to $17,499 | 70 (3.0%) | 209 (8.0%) |
| $17,500 to $19,999 | 360 (15.4%) | 61 (2.3%) |
| $20,000 to $22,499 | 7 (0.3%) | 53 (2.0%) |
| $22,500 to $24,999 | 112 (4.8%) | 79 (3.0%) |
| $25,000 to $29,999 | 100 (4.3%) | 150 (5.8%) |
| $30,000 to $34,999 | 238 (10.2%) | 216 (8.3%) |
| $35,000 to $39,999 | 280 (11.9%) | 232 (8.9%) |
| $40,000 to $44,999 | 109 (4.6%) | 100 (3.8%) |
| $45,000 to $49,999 | 120 (5.1%) | 418 (16.0%) |
| $50,000 to $54,999 | 128 (5.5%) | 48 (1.8%) |
| $55,000 to $64,999 | 176 (7.5%) | 218 (8.4%) |
| $65,000 to $74,999 | 57 (2.4%) | 47 (1.8%) |
| $75,000 to $99,999 | 166 (7.1%) | 119 (4.6%) |
| $100,000+ | 73 (3.1%) | 25 (1.0%) |
| Total | 2,343 (100.0%) | 2,606 (100.0%) |
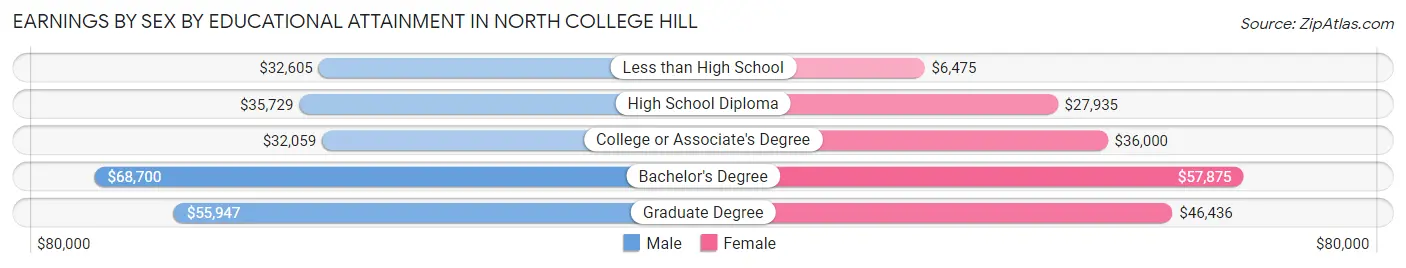
Earnings by Sex by Educational Attainment in North College Hill
Average earnings in North College Hill are $37,661 for men and $35,828 for women, a difference of 4.9%. Men with an educational attainment of bachelor's degree enjoy the highest average annual earnings of $68,700, while those with college or associate's degree education earn the least with $32,059. Women with an educational attainment of bachelor's degree earn the most with the average annual earnings of $57,875, while those with less than high school education have the smallest earnings of $6,475.
| Educational Attainment | Male Income | Female Income |
| Less than High School | $32,605 | $6,475 |
| High School Diploma | $35,729 | $27,935 |
| College or Associate's Degree | $32,059 | $36,000 |
| Bachelor's Degree | $68,700 | $57,875 |
| Graduate Degree | $55,947 | $46,436 |
| Total | $37,661 | $35,828 |
Family Income in North College Hill
Family Income Brackets in North College Hill
According to the North College Hill family income data, there are 555 families falling into the $100,000 to $149,999 income range, which is the most common income bracket and makes up 24.5% of all families.
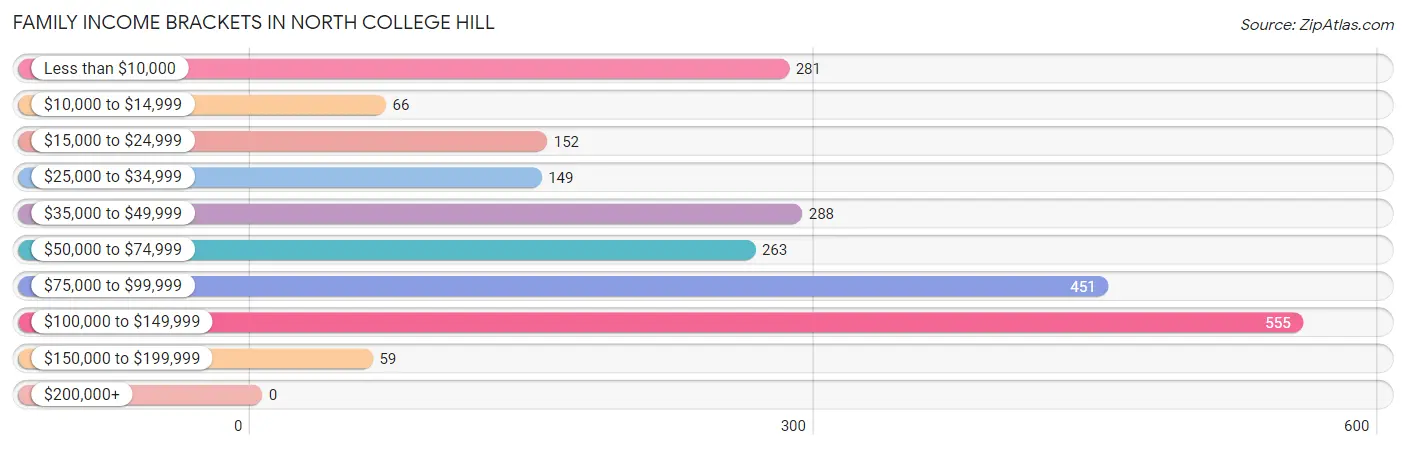
| Income Bracket | # Families | % Families |
| Less than $10,000 | 281 | 12.4% |
| $10,000 to $14,999 | 66 | 2.9% |
| $15,000 to $24,999 | 152 | 6.7% |
| $25,000 to $34,999 | 149 | 6.6% |
| $35,000 to $49,999 | 288 | 12.7% |
| $50,000 to $74,999 | 263 | 11.6% |
| $75,000 to $99,999 | 451 | 19.9% |
| $100,000 to $149,999 | 555 | 24.5% |
| $150,000 to $199,999 | 59 | 2.6% |
| $200,000+ | 0 | 0.0% |
Family Income by Famaliy Size in North College Hill
5-person families (65 | 2.9%) account for the highest median family income in North College Hill with $94,917 per family, while 2-person families (990 | 43.7%) have the highest median income of $30,104 per family member.
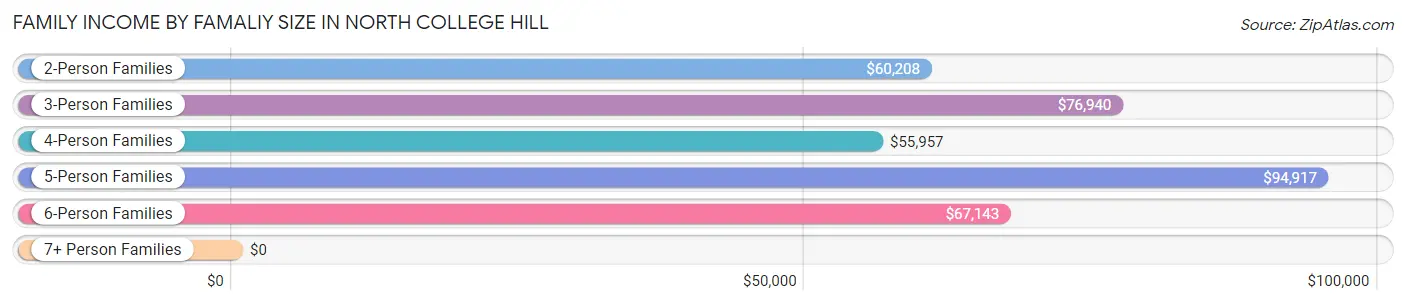
| Income Bracket | # Families | Median Income |
| 2-Person Families | 990 (43.7%) | $60,208 |
| 3-Person Families | 641 (28.3%) | $76,940 |
| 4-Person Families | 416 (18.4%) | $55,957 |
| 5-Person Families | 65 (2.9%) | $94,917 |
| 6-Person Families | 122 (5.4%) | $67,143 |
| 7+ Person Families | 31 (1.4%) | $0 |
| Total | 2,265 (100.0%) | $66,399 |
Family Income by Number of Earners in North College Hill
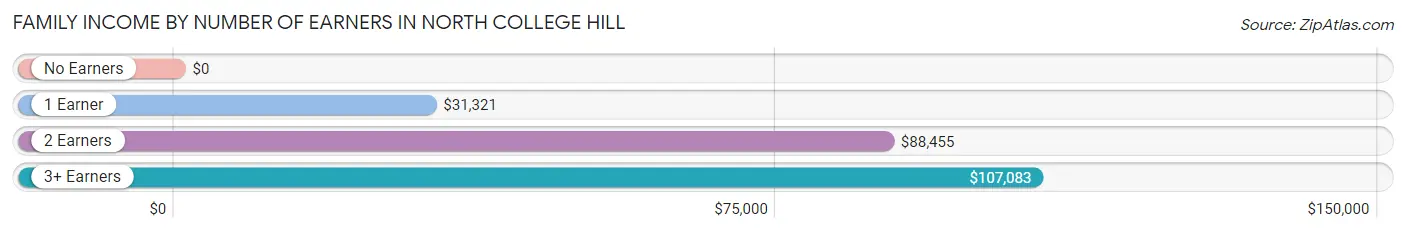
| Number of Earners | # Families | Median Income |
| No Earners | 264 (11.7%) | $0 |
| 1 Earner | 883 (39.0%) | $31,321 |
| 2 Earners | 970 (42.8%) | $88,455 |
| 3+ Earners | 148 (6.5%) | $107,083 |
| Total | 2,265 (100.0%) | $66,399 |
Household Income in North College Hill
Household Income Brackets in North College Hill
With 736 households falling in the category, the $100,000 to $149,999 income range is the most frequent in North College Hill, accounting for 19.6% of all households.
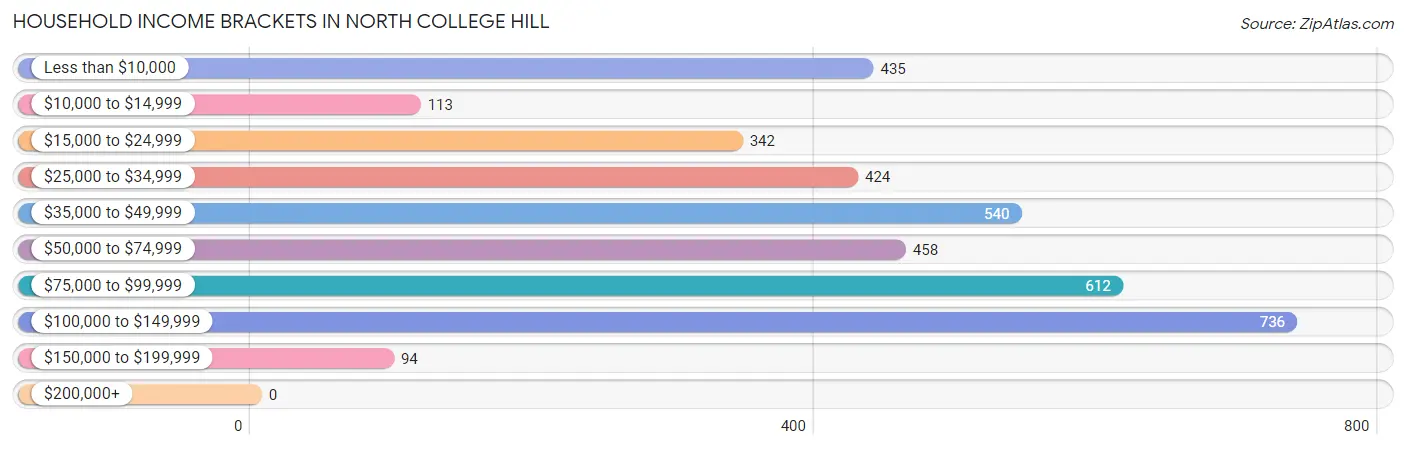
| Income Bracket | # Households | % Households |
| Less than $10,000 | 435 | 11.6% |
| $10,000 to $14,999 | 113 | 3.0% |
| $15,000 to $24,999 | 342 | 9.1% |
| $25,000 to $34,999 | 424 | 11.3% |
| $35,000 to $49,999 | 540 | 14.4% |
| $50,000 to $74,999 | 458 | 12.2% |
| $75,000 to $99,999 | 612 | 16.3% |
| $100,000 to $149,999 | 736 | 19.6% |
| $150,000 to $199,999 | 94 | 2.5% |
| $200,000+ | 0 | 0.0% |
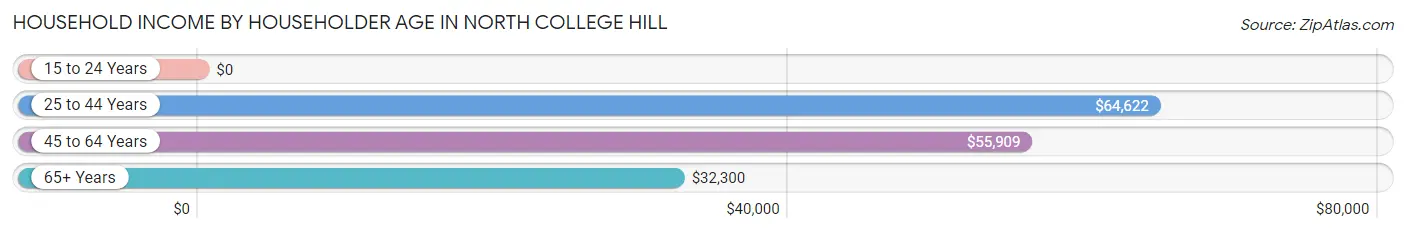
Household Income by Householder Age in North College Hill
The median household income in North College Hill is $51,971, with the highest median household income of $64,622 found in the 25 to 44 years age bracket for the primary householder. A total of 1,357 households (36.2%) fall into this category. Meanwhile, the 15 to 24 years age bracket for the primary householder has the lowest median household income of $0, with 60 households (1.6%) in this group.
| Income Bracket | # Households | Median Income |
| 15 to 24 Years | 60 (1.6%) | $0 |
| 25 to 44 Years | 1,357 (36.2%) | $64,622 |
| 45 to 64 Years | 1,542 (41.1%) | $55,909 |
| 65+ Years | 794 (21.2%) | $32,300 |
| Total | 3,753 (100.0%) | $51,971 |
Poverty in North College Hill
Income Below Poverty by Sex and Age in North College Hill
With 23.6% poverty level for males and 24.8% for females among the residents of North College Hill, 6 to 11 year old males and under 5 year old females are the most vulnerable to poverty, with 503 males (76.8%) and 59 females (53.1%) in their respective age groups living below the poverty level.
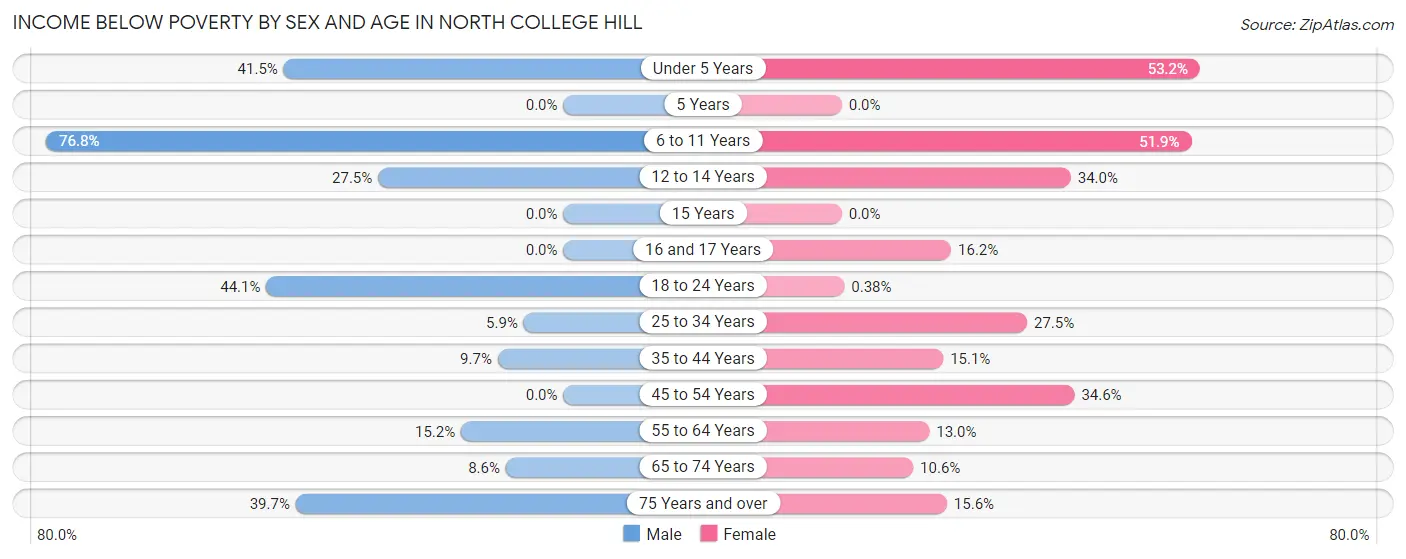
| Age Bracket | Male | Female |
| Under 5 Years | 76 (41.5%) | 59 (53.1%) |
| 5 Years | 0 (0.0%) | 0 (0.0%) |
| 6 to 11 Years | 503 (76.8%) | 328 (51.9%) |
| 12 to 14 Years | 52 (27.5%) | 67 (34.0%) |
| 15 Years | 0 (0.0%) | 0 (0.0%) |
| 16 and 17 Years | 0 (0.0%) | 25 (16.2%) |
| 18 to 24 Years | 191 (44.1%) | 1 (0.4%) |
| 25 to 34 Years | 54 (5.9%) | 293 (27.5%) |
| 35 to 44 Years | 38 (9.7%) | 83 (15.1%) |
| 45 to 54 Years | 0 (0.0%) | 208 (34.5%) |
| 55 to 64 Years | 72 (15.2%) | 73 (13.0%) |
| 65 to 74 Years | 26 (8.6%) | 53 (10.6%) |
| 75 Years and over | 31 (39.7%) | 37 (15.6%) |
| Total | 1,043 (23.6%) | 1,227 (24.8%) |
Income Above Poverty by Sex and Age in North College Hill
According to the poverty statistics in North College Hill, males aged 5 years and females aged 5 years are the age groups that are most secure financially, with 100.0% of males and 100.0% of females in these age groups living above the poverty line.
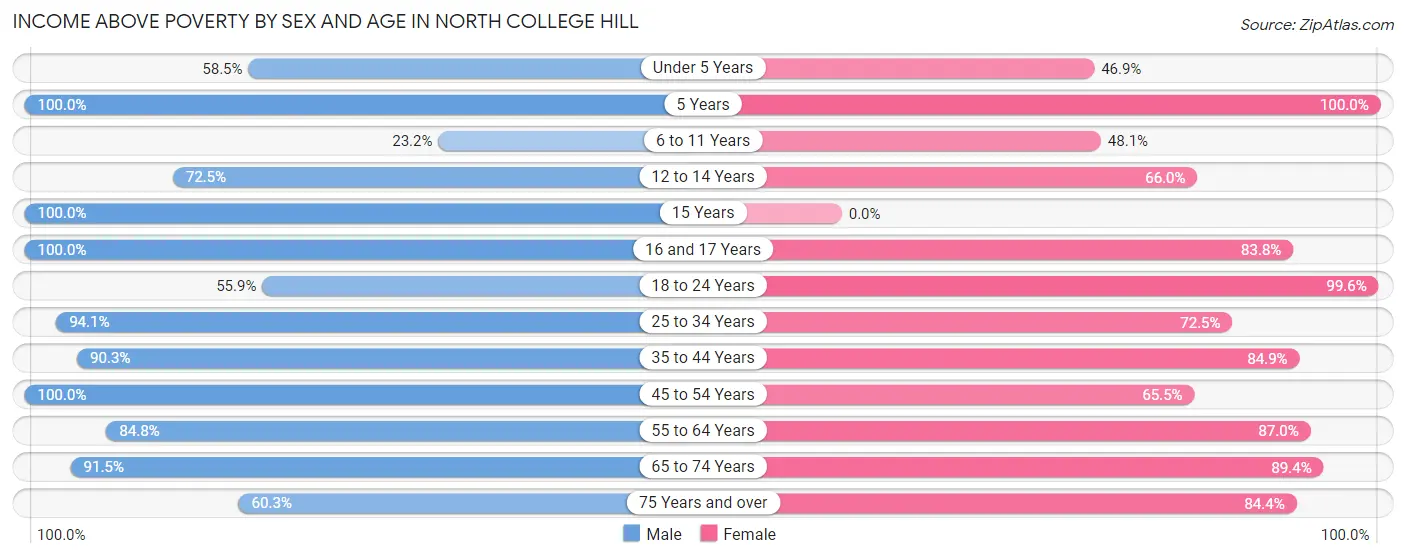
| Age Bracket | Male | Female |
| Under 5 Years | 107 (58.5%) | 52 (46.9%) |
| 5 Years | 31 (100.0%) | 79 (100.0%) |
| 6 to 11 Years | 152 (23.2%) | 304 (48.1%) |
| 12 to 14 Years | 137 (72.5%) | 130 (66.0%) |
| 15 Years | 100 (100.0%) | 0 (0.0%) |
| 16 and 17 Years | 61 (100.0%) | 129 (83.8%) |
| 18 to 24 Years | 242 (55.9%) | 265 (99.6%) |
| 25 to 34 Years | 865 (94.1%) | 772 (72.5%) |
| 35 to 44 Years | 352 (90.3%) | 468 (84.9%) |
| 45 to 54 Years | 599 (100.0%) | 394 (65.4%) |
| 55 to 64 Years | 402 (84.8%) | 489 (87.0%) |
| 65 to 74 Years | 278 (91.4%) | 447 (89.4%) |
| 75 Years and over | 47 (60.3%) | 200 (84.4%) |
| Total | 3,373 (76.4%) | 3,729 (75.2%) |
Income Below Poverty Among Married-Couple Families in North College Hill
The poverty statistics for married-couple families in North College Hill show that 4.9% or 50 of the total 1,019 families live below the poverty line. Families with no children have the highest poverty rate of 7.1%, comprising of 36 families. On the other hand, families with 3 or 4 children have the lowest poverty rate of 0.0%, which includes 0 families.
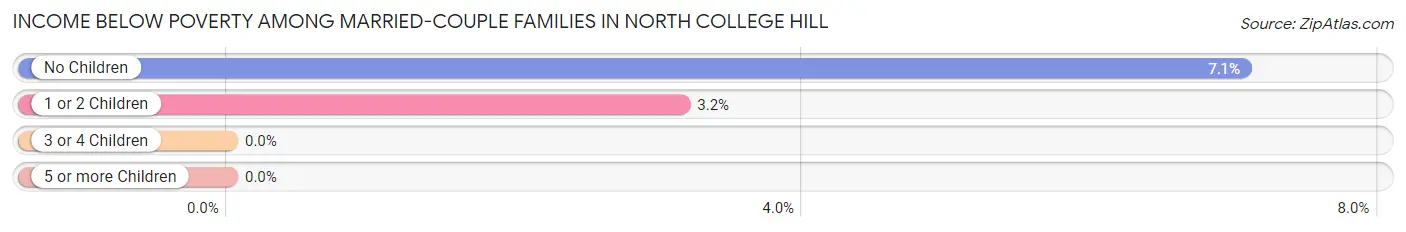
| Children | Above Poverty | Below Poverty |
| No Children | 474 (92.9%) | 36 (7.1%) |
| 1 or 2 Children | 430 (96.9%) | 14 (3.2%) |
| 3 or 4 Children | 65 (100.0%) | 0 (0.0%) |
| 5 or more Children | 0 (0.0%) | 0 (0.0%) |
| Total | 969 (95.1%) | 50 (4.9%) |
Income Below Poverty Among Single-Parent Households in North College Hill
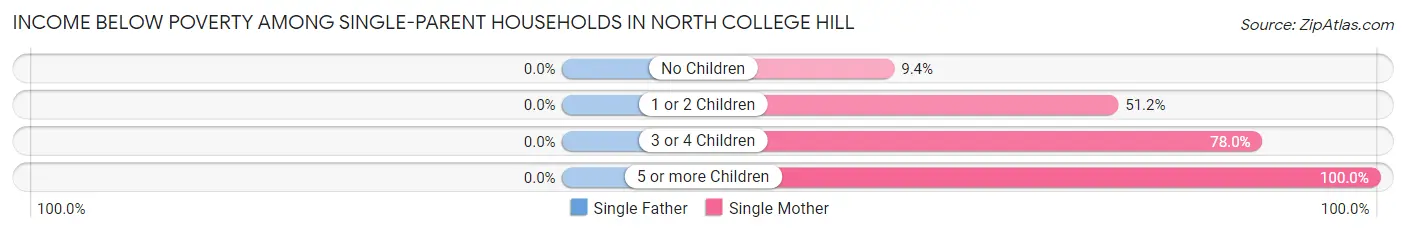
| Children | Single Father | Single Mother |
| No Children | 0 (0.0%) | 43 (9.4%) |
| 1 or 2 Children | 0 (0.0%) | 223 (51.1%) |
| 3 or 4 Children | 0 (0.0%) | 124 (78.0%) |
| 5 or more Children | 0 (0.0%) | 31 (100.0%) |
| Total | 0 (0.0%) | 421 (38.9%) |
Income Below Poverty Among Married-Couple vs Single-Parent Households in North College Hill
The poverty data for North College Hill shows that 50 of the married-couple family households (4.9%) and 421 of the single-parent households (33.8%) are living below the poverty level. Within the married-couple family households, those with no children have the highest poverty rate, with 36 households (7.1%) falling below the poverty line. Among the single-parent households, those with 5 or more children have the highest poverty rate, with 31 household (100.0%) living below poverty.
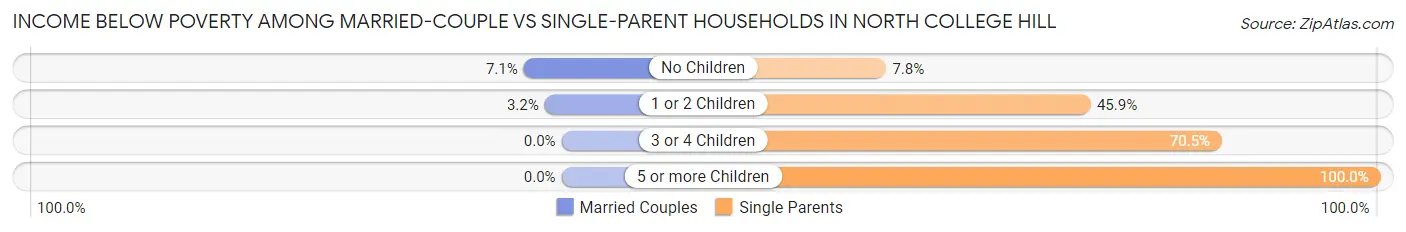
| Children | Married-Couple Families | Single-Parent Households |
| No Children | 36 (7.1%) | 43 (7.8%) |
| 1 or 2 Children | 14 (3.2%) | 223 (45.9%) |
| 3 or 4 Children | 0 (0.0%) | 124 (70.5%) |
| 5 or more Children | 0 (0.0%) | 31 (100.0%) |
| Total | 50 (4.9%) | 421 (33.8%) |
Race in North College Hill
The most populous races in North College Hill are Black / African American (5,793 | 60.3%), White / Caucasian (3,233 | 33.7%), and Two or more Races (543 | 5.7%).
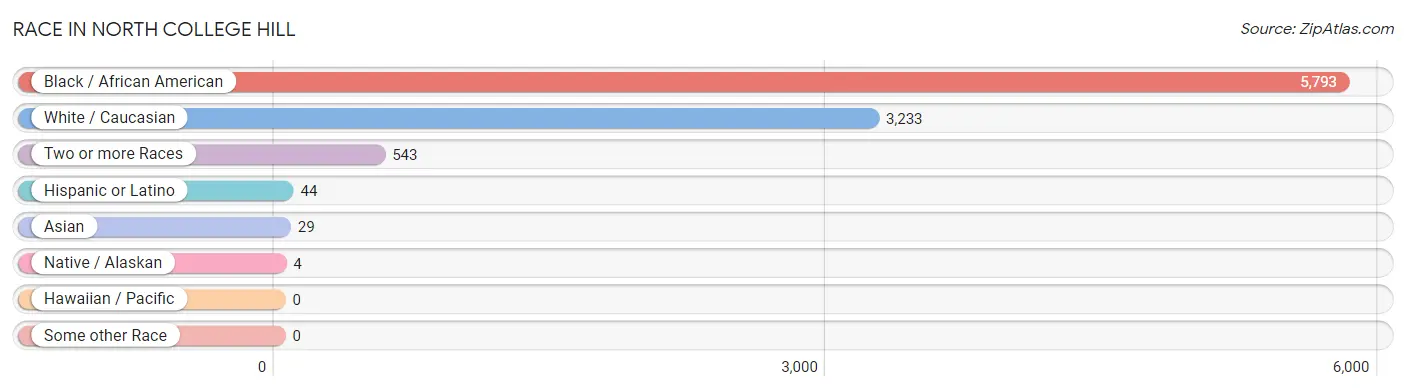
| Race | # Population | % Population |
| Asian | 29 | 0.3% |
| Black / African American | 5,793 | 60.3% |
| Hawaiian / Pacific | 0 | 0.0% |
| Hispanic or Latino | 44 | 0.5% |
| Native / Alaskan | 4 | 0.0% |
| White / Caucasian | 3,233 | 33.7% |
| Two or more Races | 543 | 5.7% |
| Some other Race | 0 | 0.0% |
| Total | 9,602 | 100.0% |
Ancestry in North College Hill
The most populous ancestries reported in North College Hill are German (1,324 | 13.8%), Irish (844 | 8.8%), English (501 | 5.2%), American (304 | 3.2%), and Cherokee (273 | 2.8%), together accounting for 33.8% of all North College Hill residents.
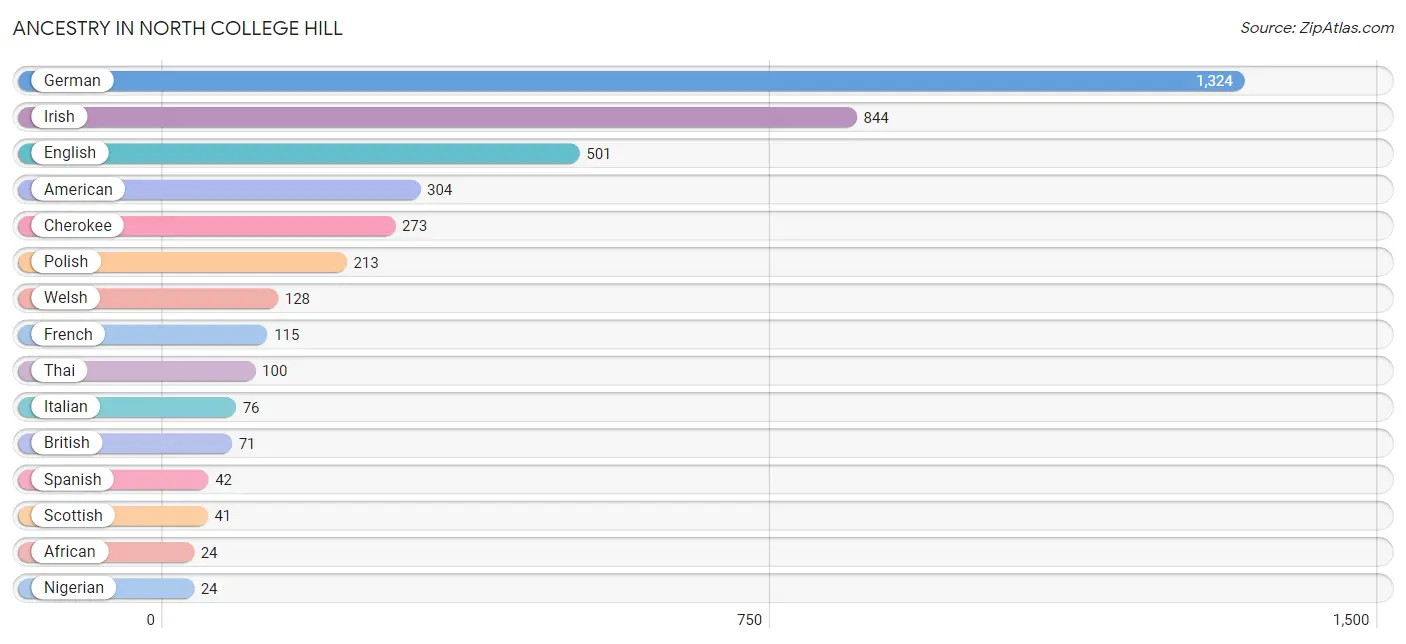
| Ancestry | # Population | % Population |
| African | 24 | 0.3% |
| American | 304 | 3.2% |
| British | 71 | 0.7% |
| Cherokee | 273 | 2.8% |
| Choctaw | 1 | 0.0% |
| Dutch | 15 | 0.2% |
| English | 501 | 5.2% |
| French | 115 | 1.2% |
| German | 1,324 | 13.8% |
| Hungarian | 10 | 0.1% |
| Irish | 844 | 8.8% |
| Italian | 76 | 0.8% |
| Nigerian | 24 | 0.3% |
| Polish | 213 | 2.2% |
| Puerto Rican | 2 | 0.0% |
| Romanian | 9 | 0.1% |
| Russian | 17 | 0.2% |
| Scottish | 41 | 0.4% |
| Slovak | 18 | 0.2% |
| Spanish | 42 | 0.4% |
| Subsaharan African | 24 | 0.3% |
| Swiss | 17 | 0.2% |
| Thai | 100 | 1.0% |
| Welsh | 128 | 1.3% | View All 24 Rows |
Immigrants in North College Hill
The most numerous immigrant groups reported in North College Hill came from Africa (24 | 0.3%), Nigeria (24 | 0.3%), Western Africa (24 | 0.3%), Asia (15 | 0.2%), and India (15 | 0.2%), together accounting for 1.1% of all North College Hill residents.
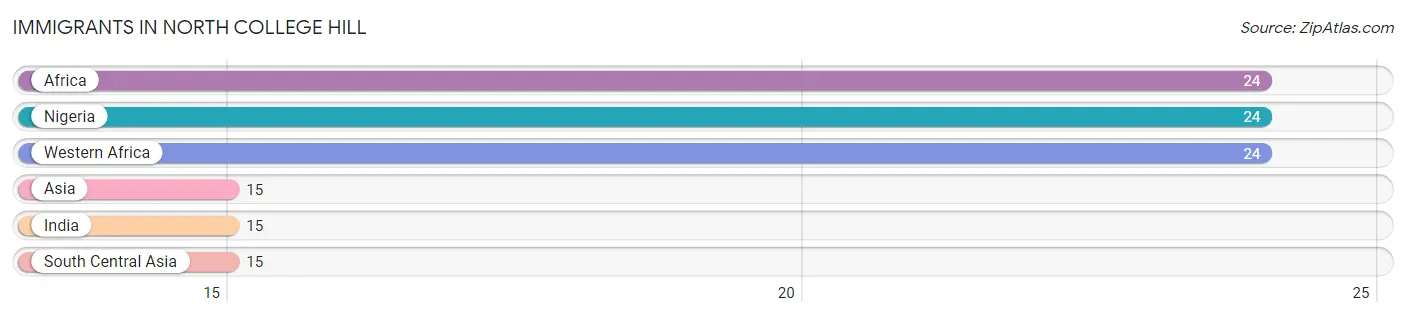
| Immigration Origin | # Population | % Population |
| Africa | 24 | 0.3% |
| Asia | 15 | 0.2% |
| India | 15 | 0.2% |
| Nigeria | 24 | 0.3% |
| South Central Asia | 15 | 0.2% |
| Western Africa | 24 | 0.3% | View All 6 Rows |
Sex and Age in North College Hill
Sex and Age in North College Hill
The most populous age groups in North College Hill are 30 to 34 Years (582 | 13.0%) for men and 25 to 29 Years (619 | 12.1%) for women.
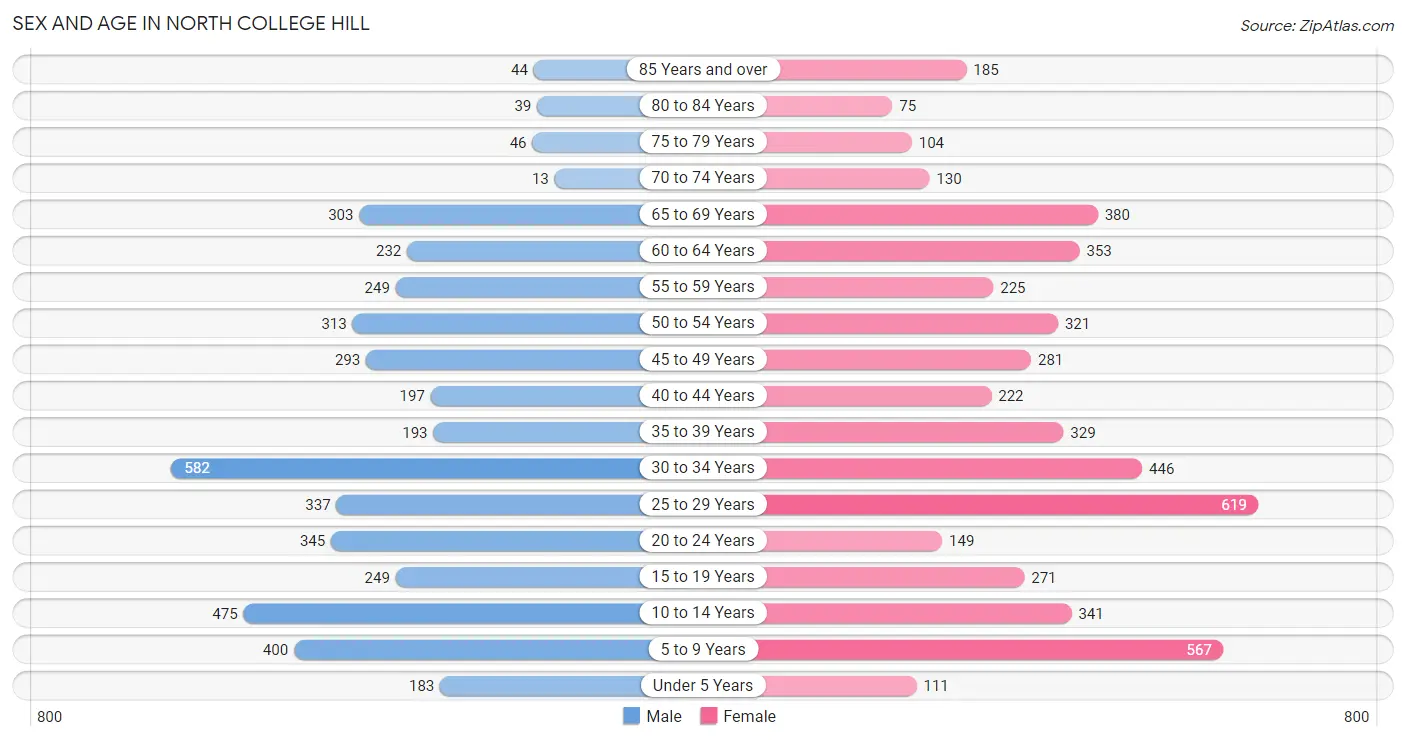
| Age Bracket | Male | Female |
| Under 5 Years | 183 (4.1%) | 111 (2.2%) |
| 5 to 9 Years | 400 (8.9%) | 567 (11.1%) |
| 10 to 14 Years | 475 (10.6%) | 341 (6.7%) |
| 15 to 19 Years | 249 (5.5%) | 271 (5.3%) |
| 20 to 24 Years | 345 (7.7%) | 149 (2.9%) |
| 25 to 29 Years | 337 (7.5%) | 619 (12.1%) |
| 30 to 34 Years | 582 (13.0%) | 446 (8.7%) |
| 35 to 39 Years | 193 (4.3%) | 329 (6.4%) |
| 40 to 44 Years | 197 (4.4%) | 222 (4.3%) |
| 45 to 49 Years | 293 (6.5%) | 281 (5.5%) |
| 50 to 54 Years | 313 (7.0%) | 321 (6.3%) |
| 55 to 59 Years | 249 (5.5%) | 225 (4.4%) |
| 60 to 64 Years | 232 (5.2%) | 353 (6.9%) |
| 65 to 69 Years | 303 (6.7%) | 380 (7.4%) |
| 70 to 74 Years | 13 (0.3%) | 130 (2.5%) |
| 75 to 79 Years | 46 (1.0%) | 104 (2.0%) |
| 80 to 84 Years | 39 (0.9%) | 75 (1.5%) |
| 85 Years and over | 44 (1.0%) | 185 (3.6%) |
| Total | 4,493 (100.0%) | 5,109 (100.0%) |
Families and Households in North College Hill
Median Family Size in North College Hill
The median family size in North College Hill is 3.27 persons per family, with single female/mother families (1,082 | 47.8%) accounting for the largest median family size of 3.61 persons per family. On the other hand, single male/father families (164 | 7.2%) represent the smallest median family size with 2.27 persons per family.
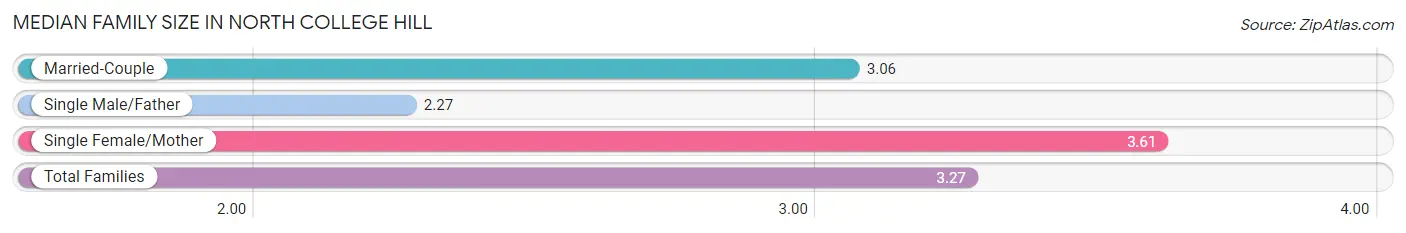
| Family Type | # Families | Family Size |
| Married-Couple | 1,019 (45.0%) | 3.06 |
| Single Male/Father | 164 (7.2%) | 2.27 |
| Single Female/Mother | 1,082 (47.8%) | 3.61 |
| Total Families | 2,265 (100.0%) | 3.27 |
Median Household Size in North College Hill
The median household size in North College Hill is 2.49 persons per household, with single female/mother households (1,082 | 28.8%) accounting for the largest median household size of 3.73 persons per household. non-family households (1,488 | 39.7%) represent the smallest median household size with 1.22 persons per household.
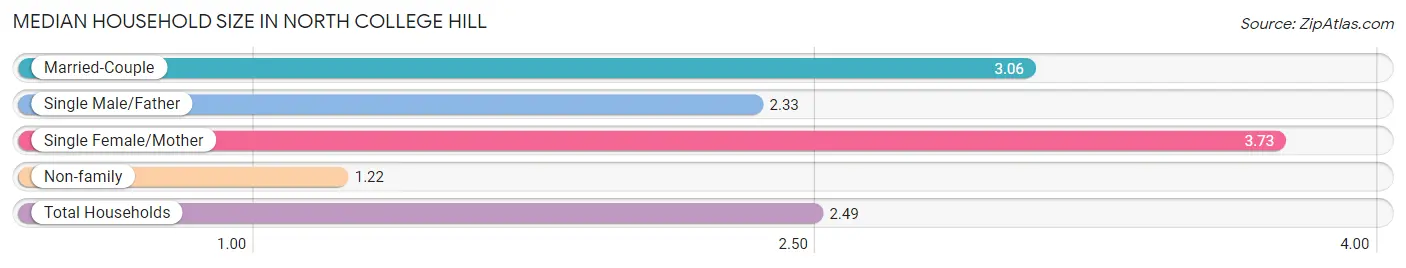
| Household Type | # Households | Household Size |
| Married-Couple | 1,019 (27.2%) | 3.06 |
| Single Male/Father | 164 (4.4%) | 2.33 |
| Single Female/Mother | 1,082 (28.8%) | 3.73 |
| Non-family | 1,488 (39.7%) | 1.22 |
| Total Households | 3,753 (100.0%) | 2.49 |
Household Size by Marriage Status in North College Hill
Out of a total of 3,753 households in North College Hill, 2,265 (60.4%) are family households, while 1,488 (39.7%) are nonfamily households. The most numerous type of family households are 2-person households, comprising 923, and the most common type of nonfamily households are 1-person households, comprising 1,188.
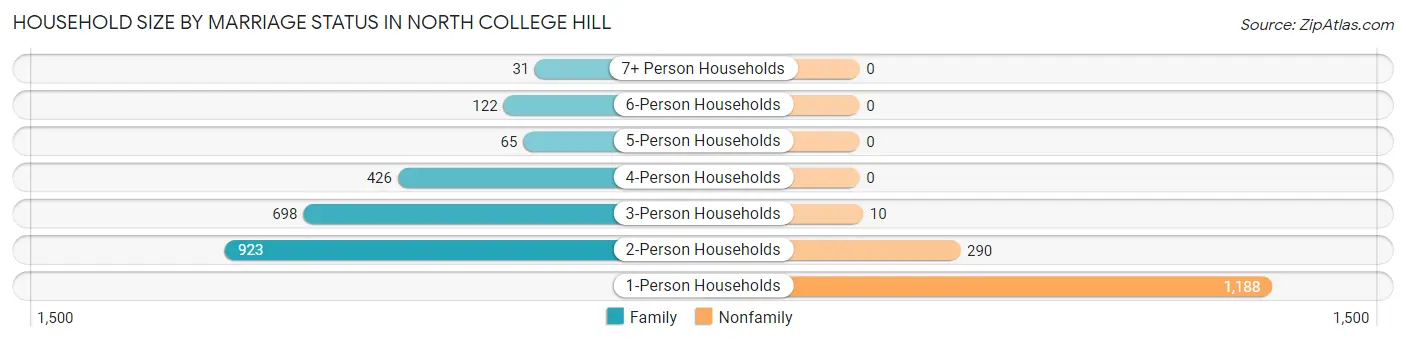
| Household Size | Family Households | Nonfamily Households |
| 1-Person Households | - | 1,188 (31.7%) |
| 2-Person Households | 923 (24.6%) | 290 (7.7%) |
| 3-Person Households | 698 (18.6%) | 10 (0.3%) |
| 4-Person Households | 426 (11.4%) | 0 (0.0%) |
| 5-Person Households | 65 (1.7%) | 0 (0.0%) |
| 6-Person Households | 122 (3.3%) | 0 (0.0%) |
| 7+ Person Households | 31 (0.8%) | 0 (0.0%) |
| Total | 2,265 (60.4%) | 1,488 (39.7%) |
Female Fertility in North College Hill
Fertility by Age in North College Hill
Average fertility rate in North College Hill is 7.0 births per 1,000 women. Women in the age bracket of 20 to 34 years have the highest fertility rate with 14.0 births per 1,000 women. Women in the age bracket of 20 to 34 years acount for 100.0% of all women with births.
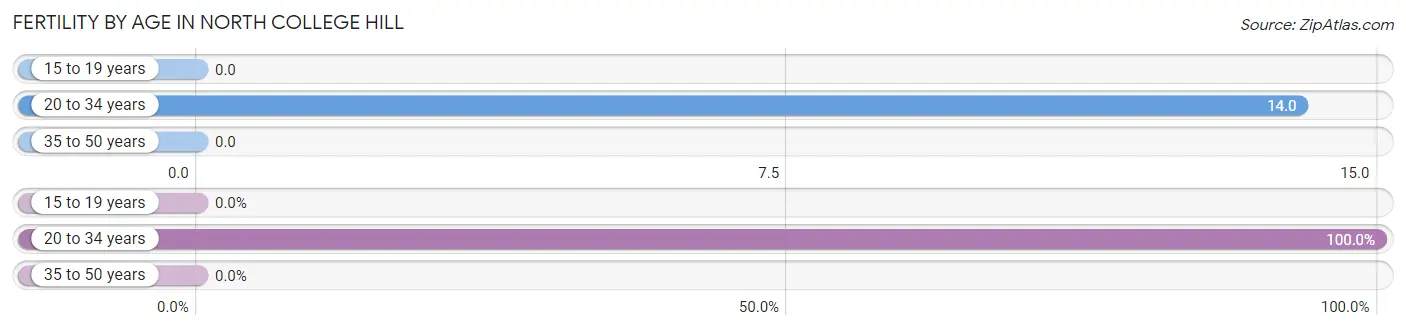
| Age Bracket | Women with Births | Births / 1,000 Women |
| 15 to 19 years | 0 (0.0%) | 0.0 |
| 20 to 34 years | 17 (100.0%) | 14.0 |
| 35 to 50 years | 0 (0.0%) | 0.0 |
| Total | 17 (100.0%) | 7.0 |
Fertility by Age by Marriage Status in North College Hill
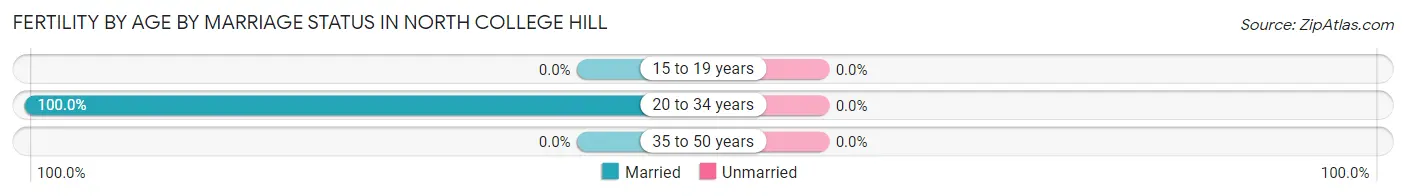
| Age Bracket | Married | Unmarried |
| 15 to 19 years | 0 (0.0%) | 0 (0.0%) |
| 20 to 34 years | 17 (100.0%) | 0 (0.0%) |
| 35 to 50 years | 0 (0.0%) | 0 (0.0%) |
| Total | 17 (100.0%) | 0 (0.0%) |
Fertility by Education in North College Hill
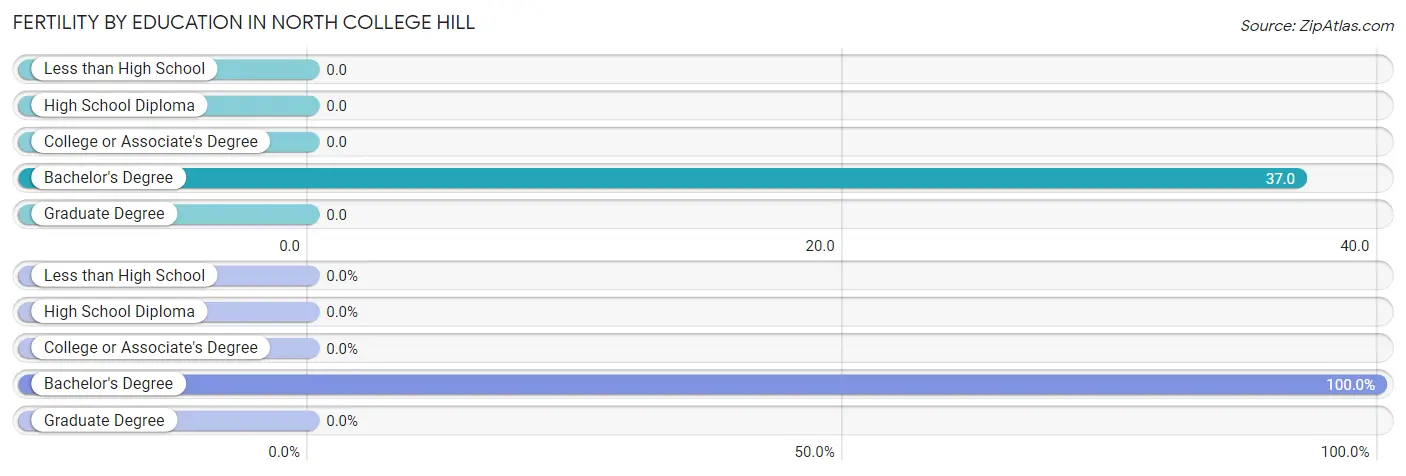
| Educational Attainment | Women with Births | Births / 1,000 Women |
| Less than High School | 0 (0.0%) | 0.0 |
| High School Diploma | 0 (0.0%) | 0.0 |
| College or Associate's Degree | 0 (0.0%) | 0.0 |
| Bachelor's Degree | 17 (100.0%) | 37.0 |
| Graduate Degree | 0 (0.0%) | 0.0 |
| Total | 17 (100.0%) | 7.0 |
Fertility by Education by Marriage Status in North College Hill
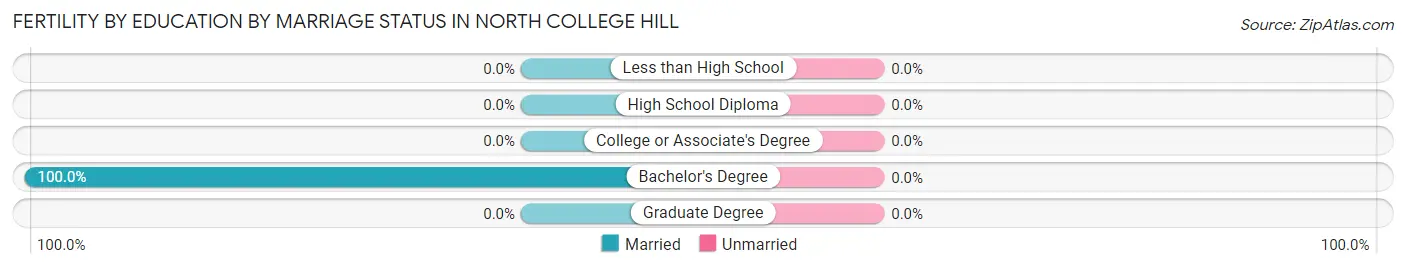
| Educational Attainment | Married | Unmarried |
| Less than High School | 0 (0.0%) | 0 (0.0%) |
| High School Diploma | 0 (0.0%) | 0 (0.0%) |
| College or Associate's Degree | 0 (0.0%) | 0 (0.0%) |
| Bachelor's Degree | 17 (100.0%) | 0 (0.0%) |
| Graduate Degree | 0 (0.0%) | 0 (0.0%) |
| Total | 17 (100.0%) | 0 (0.0%) |
Employment Characteristics in North College Hill
Employment by Class of Employer in North College Hill
Among the 4,303 employed individuals in North College Hill, private company employees (3,345 | 77.7%), not-for-profit organizations (374 | 8.7%), and local government employees (185 | 4.3%) make up the most common classes of employment.
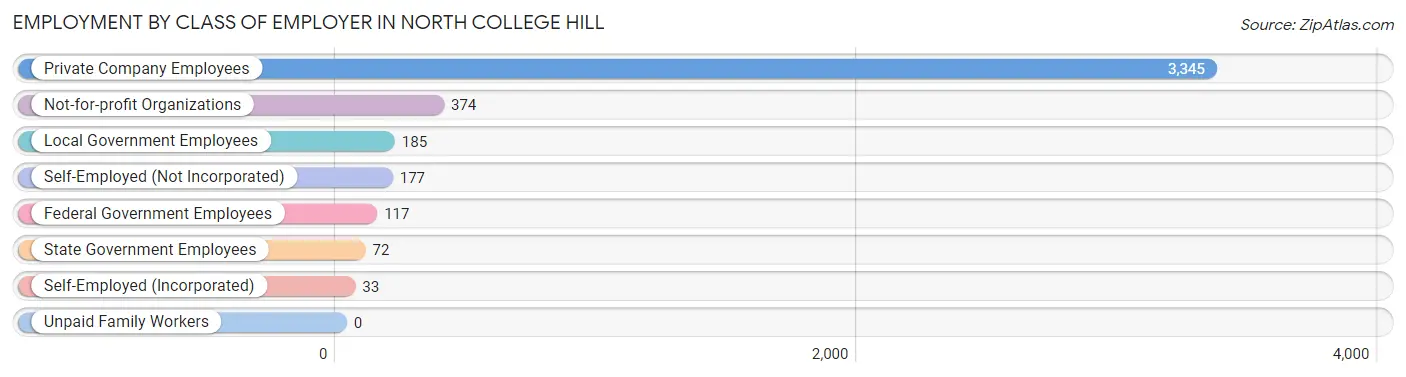
| Employer Class | # Employees | % Employees |
| Private Company Employees | 3,345 | 77.7% |
| Self-Employed (Incorporated) | 33 | 0.8% |
| Self-Employed (Not Incorporated) | 177 | 4.1% |
| Not-for-profit Organizations | 374 | 8.7% |
| Local Government Employees | 185 | 4.3% |
| State Government Employees | 72 | 1.7% |
| Federal Government Employees | 117 | 2.7% |
| Unpaid Family Workers | 0 | 0.0% |
| Total | 4,303 | 100.0% |
Employment Status by Age in North College Hill
According to the labor force statistics for North College Hill, out of the total population over 16 years of age (7,425), 64.2% or 4,767 individuals are in the labor force, with 8.8% or 419 of them unemployed. The age group with the highest labor force participation rate is 25 to 29 years, with 85.4% or 816 individuals in the labor force. Within the labor force, the 20 to 24 years age range has the highest percentage of unemployed individuals, with 16.5% or 69 of them being unemployed.
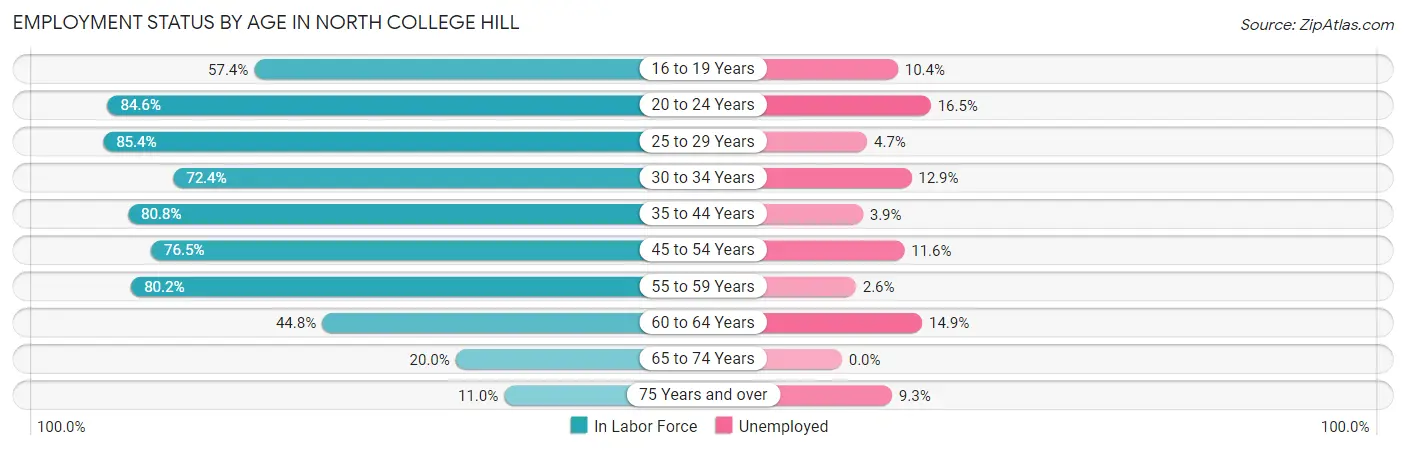
| Age Bracket | In Labor Force | Unemployed |
| 16 to 19 Years | 241 (57.4%) | 25 (10.4%) |
| 20 to 24 Years | 418 (84.6%) | 69 (16.5%) |
| 25 to 29 Years | 816 (85.4%) | 38 (4.7%) |
| 30 to 34 Years | 744 (72.4%) | 96 (12.9%) |
| 35 to 44 Years | 760 (80.8%) | 30 (3.9%) |
| 45 to 54 Years | 924 (76.5%) | 107 (11.6%) |
| 55 to 59 Years | 380 (80.2%) | 10 (2.6%) |
| 60 to 64 Years | 262 (44.8%) | 39 (14.9%) |
| 65 to 74 Years | 165 (20.0%) | 0 (0.0%) |
| 75 Years and over | 54 (11.0%) | 5 (9.3%) |
| Total | 4,767 (64.2%) | 419 (8.8%) |
Employment Status by Educational Attainment in North College Hill
According to labor force statistics for North College Hill, 74.8% of individuals (3,884) out of the total population between 25 and 64 years of age (5,192) are in the labor force, with 8.2% or 318 of them being unemployed. The group with the highest labor force participation rate are those with the educational attainment of college / associate degree, with 89.1% or 1,651 individuals in the labor force. Within the labor force, individuals with less than high school education have the highest percentage of unemployment, with 19.7% or 48 of them being unemployed.
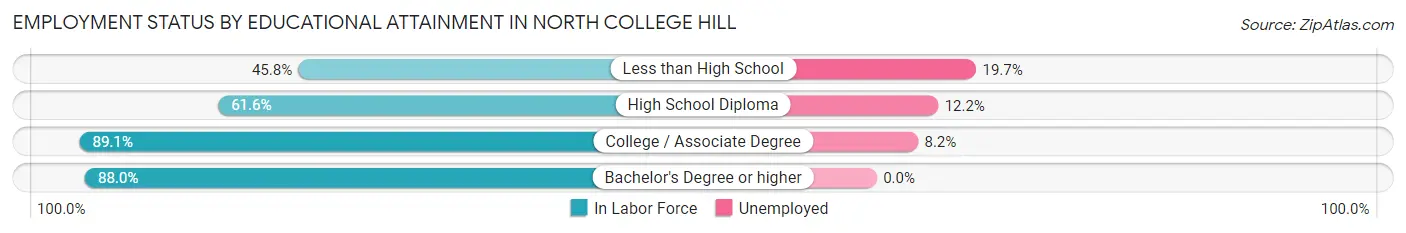
| Educational Attainment | In Labor Force | Unemployed |
| Less than High School | 244 (45.8%) | 105 (19.7%) |
| High School Diploma | 1,117 (61.6%) | 221 (12.2%) |
| College / Associate Degree | 1,651 (89.1%) | 152 (8.2%) |
| Bachelor's Degree or higher | 874 (88.0%) | 0 (0.0%) |
| Total | 3,884 (74.8%) | 426 (8.2%) |
Employment Occupations by Sex in North College Hill
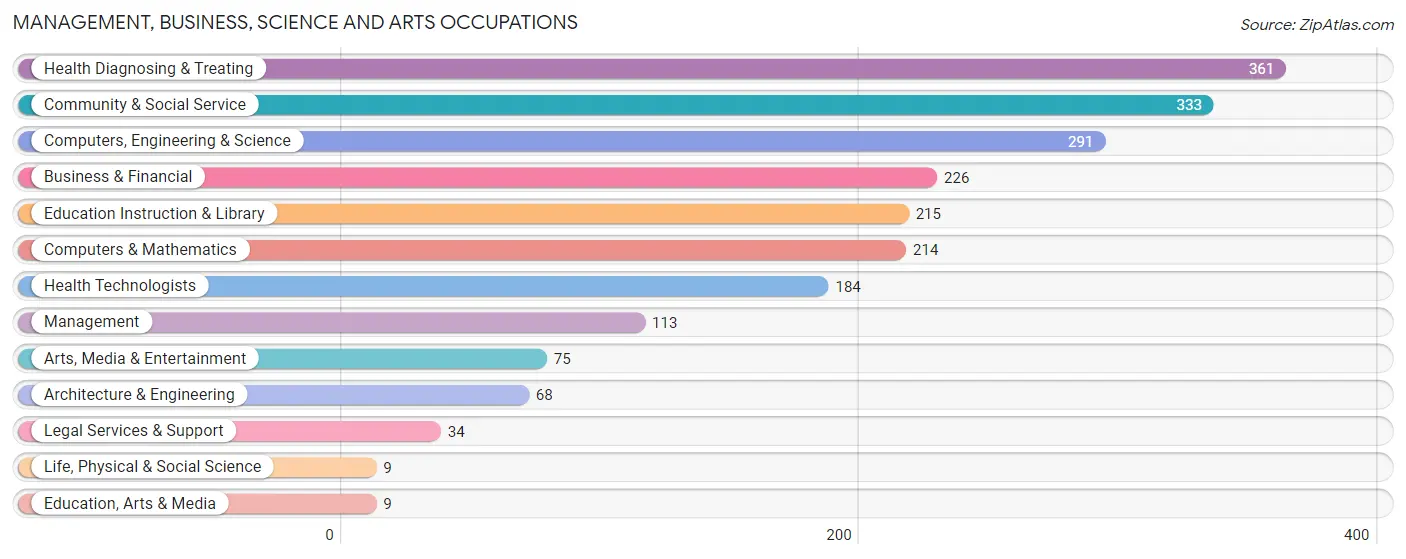
Management, Business, Science and Arts Occupations
The most common Management, Business, Science and Arts occupations in North College Hill are Health Diagnosing & Treating (361 | 8.3%), Community & Social Service (333 | 7.7%), Computers, Engineering & Science (291 | 6.7%), Business & Financial (226 | 5.2%), and Education Instruction & Library (215 | 5.0%).
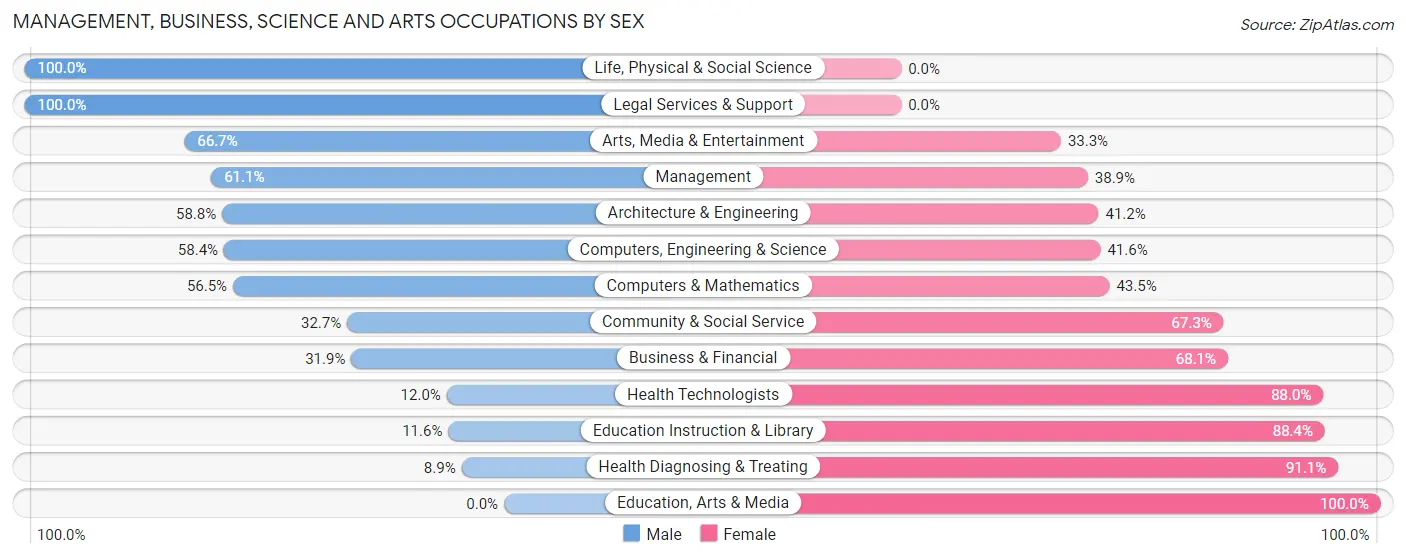
Management, Business, Science and Arts Occupations by Sex
Within the Management, Business, Science and Arts occupations in North College Hill, the most male-oriented occupations are Life, Physical & Social Science (100.0%), Legal Services & Support (100.0%), and Arts, Media & Entertainment (66.7%), while the most female-oriented occupations are Education, Arts & Media (100.0%), Health Diagnosing & Treating (91.1%), and Education Instruction & Library (88.4%).
| Occupation | Male | Female |
| Management | 69 (61.1%) | 44 (38.9%) |
| Business & Financial | 72 (31.9%) | 154 (68.1%) |
| Computers, Engineering & Science | 170 (58.4%) | 121 (41.6%) |
| Computers & Mathematics | 121 (56.5%) | 93 (43.5%) |
| Architecture & Engineering | 40 (58.8%) | 28 (41.2%) |
| Life, Physical & Social Science | 9 (100.0%) | 0 (0.0%) |
| Community & Social Service | 109 (32.7%) | 224 (67.3%) |
| Education, Arts & Media | 0 (0.0%) | 9 (100.0%) |
| Legal Services & Support | 34 (100.0%) | 0 (0.0%) |
| Education Instruction & Library | 25 (11.6%) | 190 (88.4%) |
| Arts, Media & Entertainment | 50 (66.7%) | 25 (33.3%) |
| Health Diagnosing & Treating | 32 (8.9%) | 329 (91.1%) |
| Health Technologists | 22 (12.0%) | 162 (88.0%) |
| Total (Category) | 452 (34.1%) | 872 (65.9%) |
| Total (Overall) | 2,109 (48.5%) | 2,236 (51.5%) |
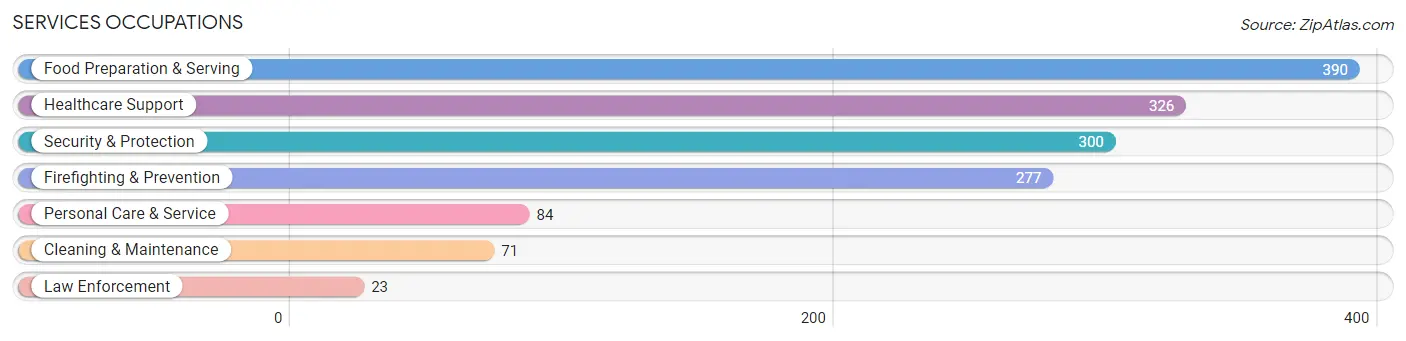
Services Occupations
The most common Services occupations in North College Hill are Food Preparation & Serving (390 | 9.0%), Healthcare Support (326 | 7.5%), Security & Protection (300 | 6.9%), Firefighting & Prevention (277 | 6.4%), and Personal Care & Service (84 | 1.9%).
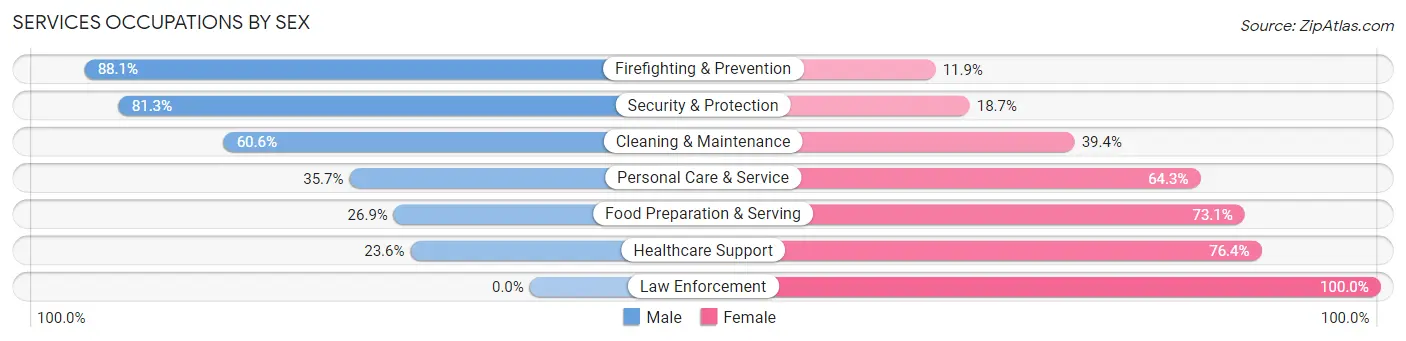
Services Occupations by Sex
Within the Services occupations in North College Hill, the most male-oriented occupations are Firefighting & Prevention (88.1%), Security & Protection (81.3%), and Cleaning & Maintenance (60.6%), while the most female-oriented occupations are Law Enforcement (100.0%), Healthcare Support (76.4%), and Food Preparation & Serving (73.1%).
| Occupation | Male | Female |
| Healthcare Support | 77 (23.6%) | 249 (76.4%) |
| Security & Protection | 244 (81.3%) | 56 (18.7%) |
| Firefighting & Prevention | 244 (88.1%) | 33 (11.9%) |
| Law Enforcement | 0 (0.0%) | 23 (100.0%) |
| Food Preparation & Serving | 105 (26.9%) | 285 (73.1%) |
| Cleaning & Maintenance | 43 (60.6%) | 28 (39.4%) |
| Personal Care & Service | 30 (35.7%) | 54 (64.3%) |
| Total (Category) | 499 (42.6%) | 672 (57.4%) |
| Total (Overall) | 2,109 (48.5%) | 2,236 (51.5%) |
Sales and Office Occupations
The most common Sales and Office occupations in North College Hill are Office & Administration (618 | 14.2%), and Sales & Related (319 | 7.3%).
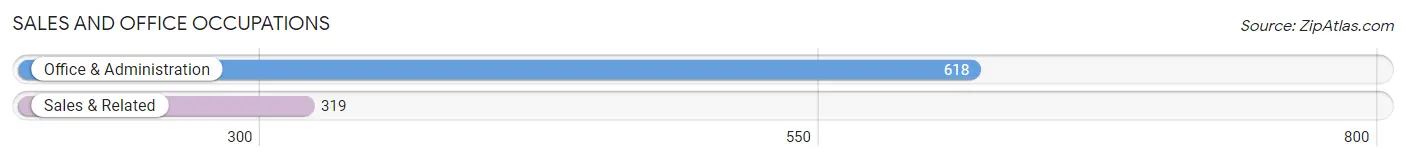
Sales and Office Occupations by Sex
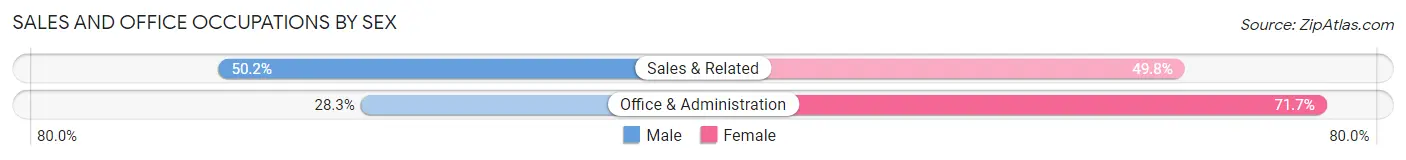
| Occupation | Male | Female |
| Sales & Related | 160 (50.2%) | 159 (49.8%) |
| Office & Administration | 175 (28.3%) | 443 (71.7%) |
| Total (Category) | 335 (35.7%) | 602 (64.2%) |
| Total (Overall) | 2,109 (48.5%) | 2,236 (51.5%) |
Natural Resources, Construction and Maintenance Occupations
The most common Natural Resources, Construction and Maintenance occupations in North College Hill are Installation, Maintenance & Repair (239 | 5.5%), and Construction & Extraction (228 | 5.2%).
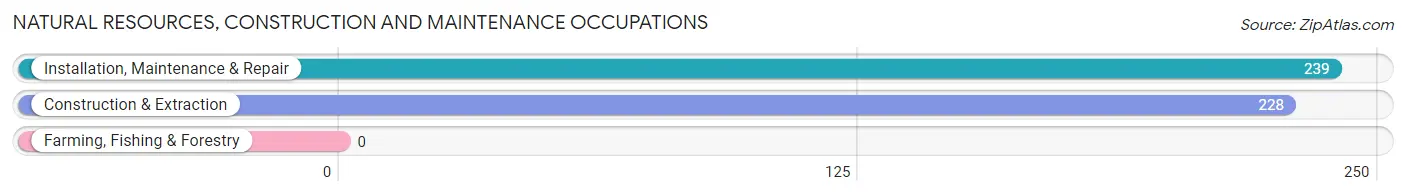
Natural Resources, Construction and Maintenance Occupations by Sex
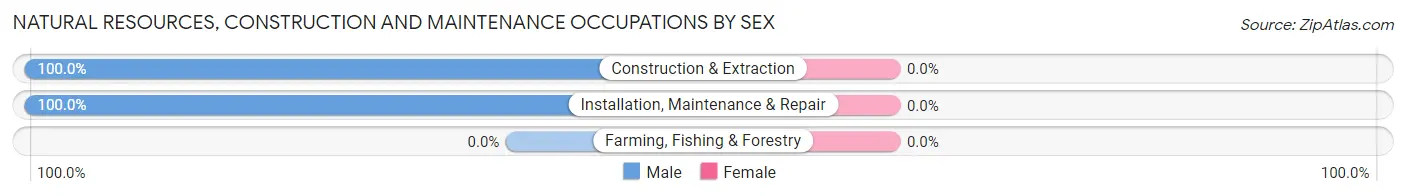
| Occupation | Male | Female |
| Farming, Fishing & Forestry | 0 (0.0%) | 0 (0.0%) |
| Construction & Extraction | 228 (100.0%) | 0 (0.0%) |
| Installation, Maintenance & Repair | 239 (100.0%) | 0 (0.0%) |
| Total (Category) | 467 (100.0%) | 0 (0.0%) |
| Total (Overall) | 2,109 (48.5%) | 2,236 (51.5%) |
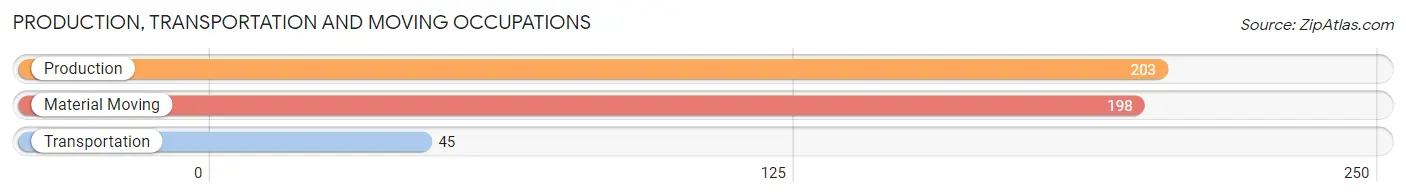
Production, Transportation and Moving Occupations
The most common Production, Transportation and Moving occupations in North College Hill are Production (203 | 4.7%), Material Moving (198 | 4.6%), and Transportation (45 | 1.0%).
Production, Transportation and Moving Occupations by Sex
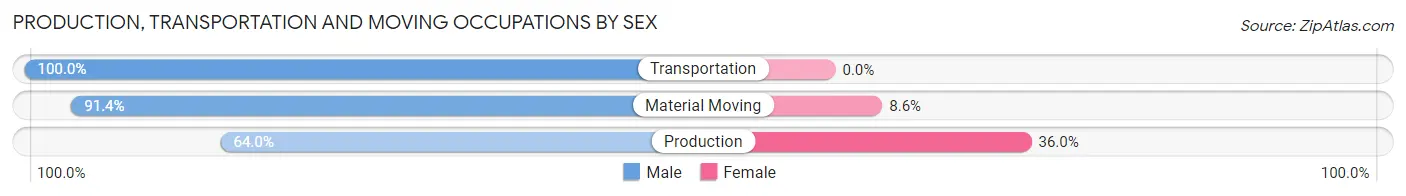
| Occupation | Male | Female |
| Production | 130 (64.0%) | 73 (36.0%) |
| Transportation | 45 (100.0%) | 0 (0.0%) |
| Material Moving | 181 (91.4%) | 17 (8.6%) |
| Total (Category) | 356 (79.8%) | 90 (20.2%) |
| Total (Overall) | 2,109 (48.5%) | 2,236 (51.5%) |
Employment Industries by Sex in North College Hill
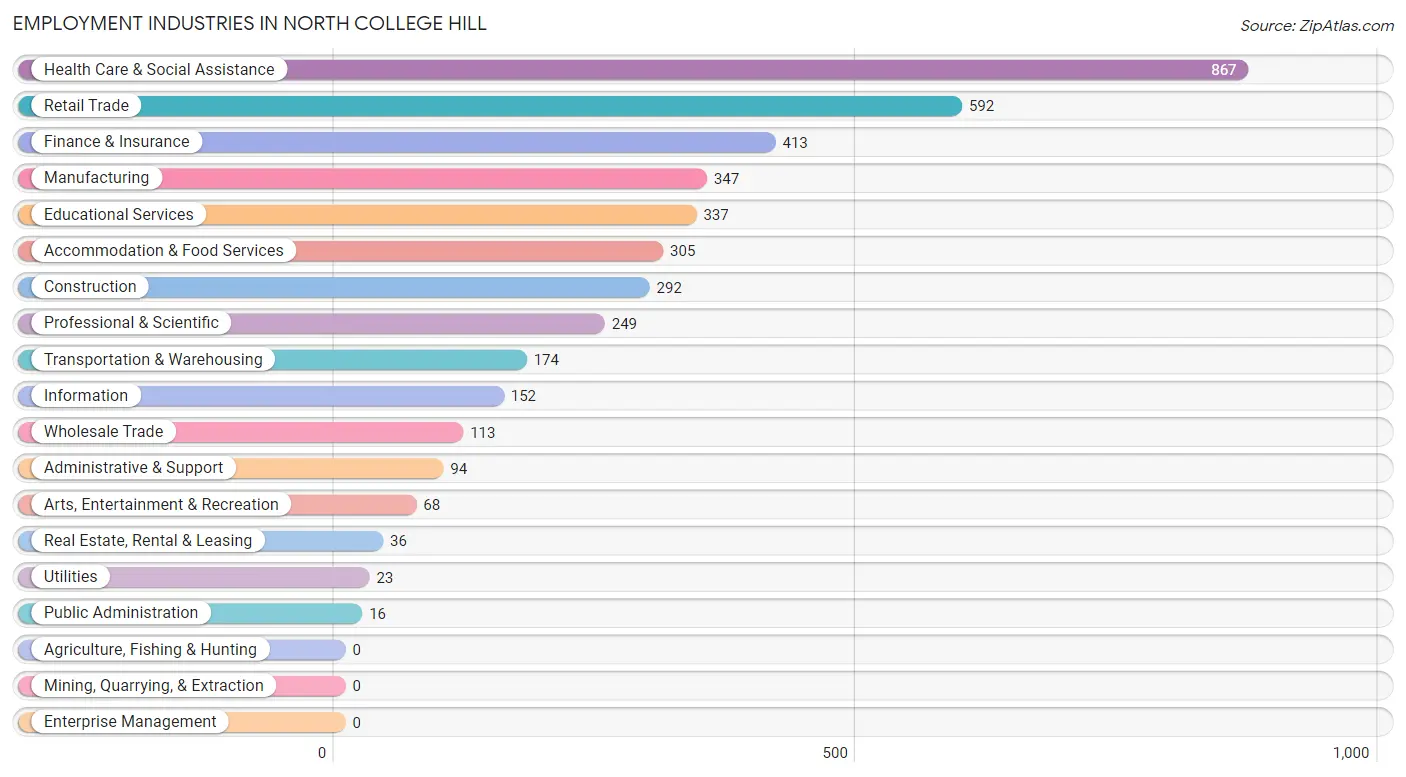
Employment Industries in North College Hill
The major employment industries in North College Hill include Health Care & Social Assistance (867 | 20.0%), Retail Trade (592 | 13.6%), Finance & Insurance (413 | 9.5%), Manufacturing (347 | 8.0%), and Educational Services (337 | 7.8%).
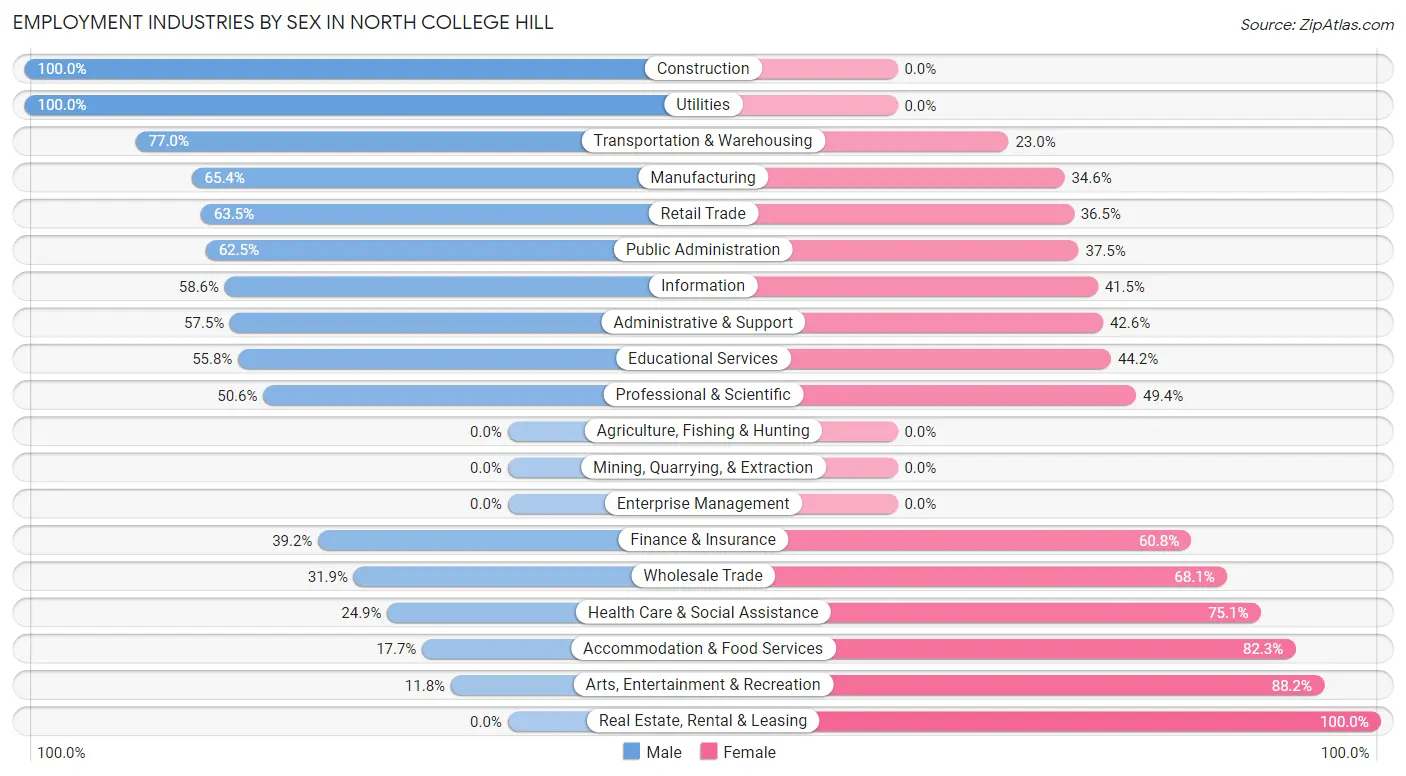
Employment Industries by Sex in North College Hill
The North College Hill industries that see more men than women are Construction (100.0%), Utilities (100.0%), and Transportation & Warehousing (77.0%), whereas the industries that tend to have a higher number of women are Real Estate, Rental & Leasing (100.0%), Arts, Entertainment & Recreation (88.2%), and Accommodation & Food Services (82.3%).
| Industry | Male | Female |
| Agriculture, Fishing & Hunting | 0 (0.0%) | 0 (0.0%) |
| Mining, Quarrying, & Extraction | 0 (0.0%) | 0 (0.0%) |
| Construction | 292 (100.0%) | 0 (0.0%) |
| Manufacturing | 227 (65.4%) | 120 (34.6%) |
| Wholesale Trade | 36 (31.9%) | 77 (68.1%) |
| Retail Trade | 376 (63.5%) | 216 (36.5%) |
| Transportation & Warehousing | 134 (77.0%) | 40 (23.0%) |
| Utilities | 23 (100.0%) | 0 (0.0%) |
| Information | 89 (58.6%) | 63 (41.4%) |
| Finance & Insurance | 162 (39.2%) | 251 (60.8%) |
| Real Estate, Rental & Leasing | 0 (0.0%) | 36 (100.0%) |
| Professional & Scientific | 126 (50.6%) | 123 (49.4%) |
| Enterprise Management | 0 (0.0%) | 0 (0.0%) |
| Administrative & Support | 54 (57.5%) | 40 (42.5%) |
| Educational Services | 188 (55.8%) | 149 (44.2%) |
| Health Care & Social Assistance | 216 (24.9%) | 651 (75.1%) |
| Arts, Entertainment & Recreation | 8 (11.8%) | 60 (88.2%) |
| Accommodation & Food Services | 54 (17.7%) | 251 (82.3%) |
| Public Administration | 10 (62.5%) | 6 (37.5%) |
| Total | 2,109 (48.5%) | 2,236 (51.5%) |
Education in North College Hill
School Enrollment in North College Hill
The most common levels of schooling among the 2,750 students in North College Hill are elementary school (876 | 31.9%), middle school (655 | 23.8%), and high school (550 | 20.0%).
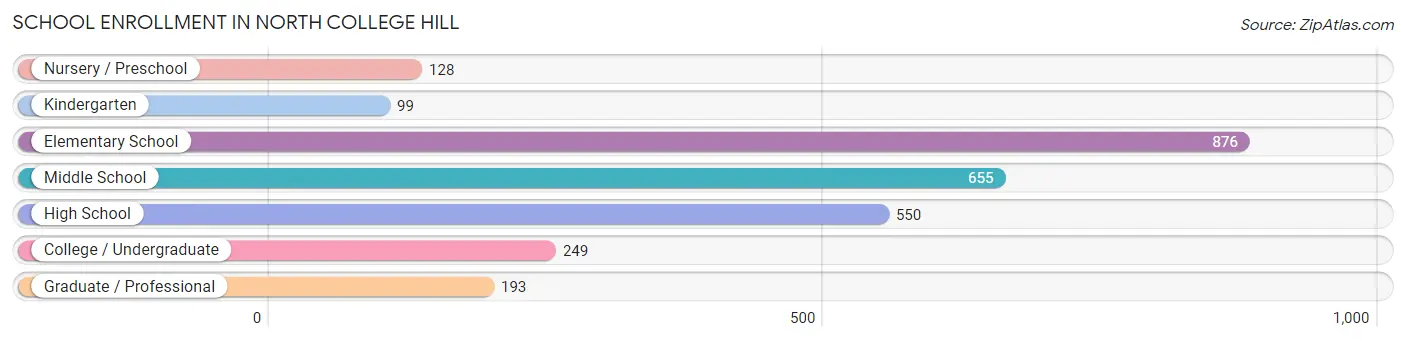
| School Level | # Students | % Students |
| Nursery / Preschool | 128 | 4.6% |
| Kindergarten | 99 | 3.6% |
| Elementary School | 876 | 31.9% |
| Middle School | 655 | 23.8% |
| High School | 550 | 20.0% |
| College / Undergraduate | 249 | 9.0% |
| Graduate / Professional | 193 | 7.0% |
| Total | 2,750 | 100.0% |
School Enrollment by Age by Funding Source in North College Hill
Out of a total of 2,750 students who are enrolled in schools in North College Hill, 456 (16.6%) attend a private institution, while the remaining 2,294 (83.4%) are enrolled in public schools. The age group of 3 to 4 year olds has the highest likelihood of being enrolled in private schools, with 34 (54.0% in the age bracket) enrolled. Conversely, the age group of 18 to 19 year olds has the lowest likelihood of being enrolled in a private school, with 188 (100.0% in the age bracket) attending a public institution.
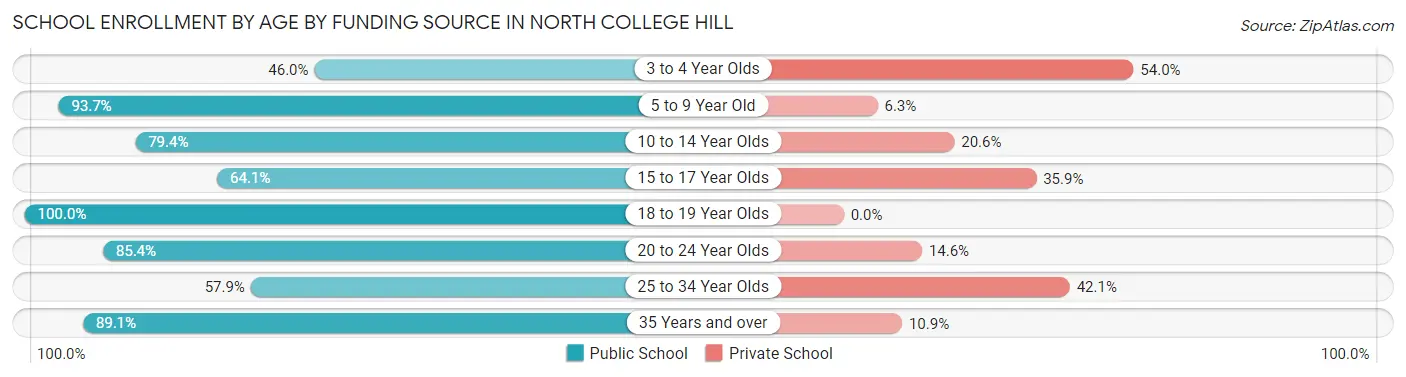
| Age Bracket | Public School | Private School |
| 3 to 4 Year Olds | 29 (46.0%) | 34 (54.0%) |
| 5 to 9 Year Old | 906 (93.7%) | 61 (6.3%) |
| 10 to 14 Year Olds | 624 (79.4%) | 162 (20.6%) |
| 15 to 17 Year Olds | 202 (64.1%) | 113 (35.9%) |
| 18 to 19 Year Olds | 188 (100.0%) | 0 (0.0%) |
| 20 to 24 Year Olds | 82 (85.4%) | 14 (14.6%) |
| 25 to 34 Year Olds | 66 (57.9%) | 48 (42.1%) |
| 35 Years and over | 197 (89.1%) | 24 (10.9%) |
| Total | 2,294 (83.4%) | 456 (16.6%) |
Educational Attainment by Field of Study in North College Hill
Business (188 | 16.3%), liberal arts & history (151 | 13.1%), education (147 | 12.7%), visual & performing arts (129 | 11.2%), and psychology (118 | 10.2%) are the most common fields of study among 1,155 individuals in North College Hill who have obtained a bachelor's degree or higher.
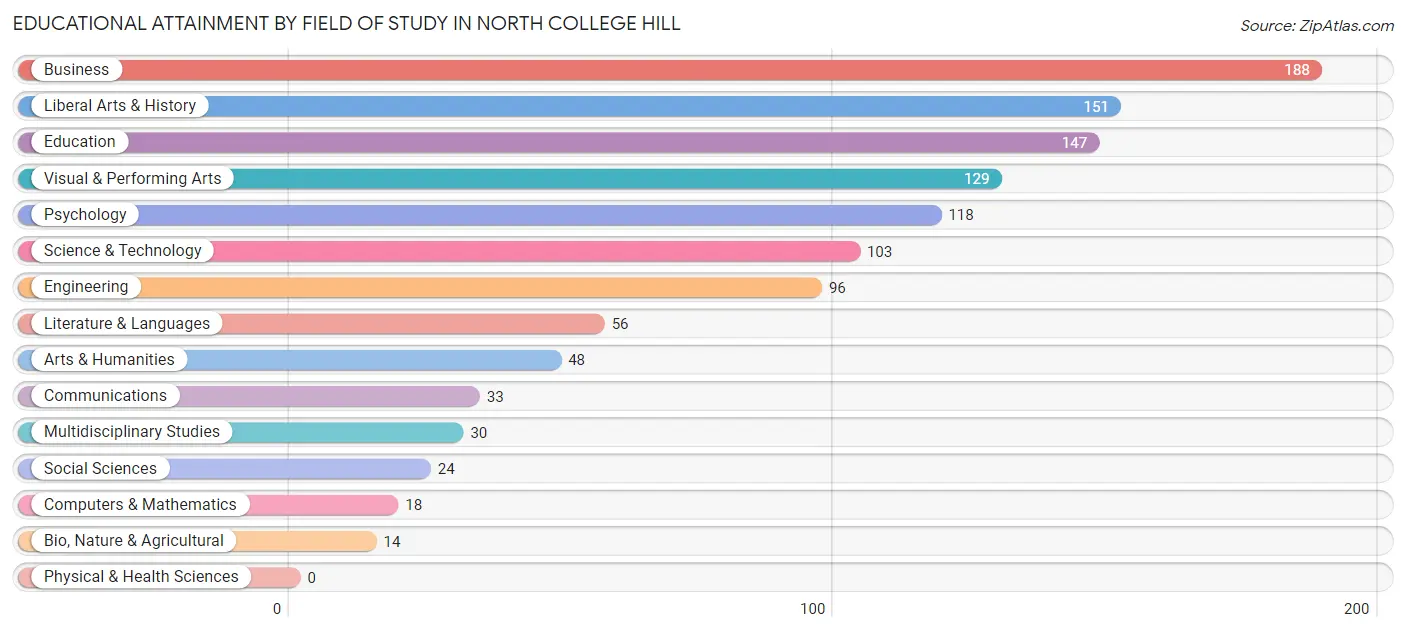
| Field of Study | # Graduates | % Graduates |
| Computers & Mathematics | 18 | 1.6% |
| Bio, Nature & Agricultural | 14 | 1.2% |
| Physical & Health Sciences | 0 | 0.0% |
| Psychology | 118 | 10.2% |
| Social Sciences | 24 | 2.1% |
| Engineering | 96 | 8.3% |
| Multidisciplinary Studies | 30 | 2.6% |
| Science & Technology | 103 | 8.9% |
| Business | 188 | 16.3% |
| Education | 147 | 12.7% |
| Literature & Languages | 56 | 4.9% |
| Liberal Arts & History | 151 | 13.1% |
| Visual & Performing Arts | 129 | 11.2% |
| Communications | 33 | 2.9% |
| Arts & Humanities | 48 | 4.2% |
| Total | 1,155 | 100.0% |
Transportation & Commute in North College Hill
Vehicle Availability by Sex in North College Hill
The most prevalent vehicle ownership categories in North College Hill are males with 2 vehicles (1,087, accounting for 52.0%) and females with 2 vehicles (1,128, making up 49.3%).
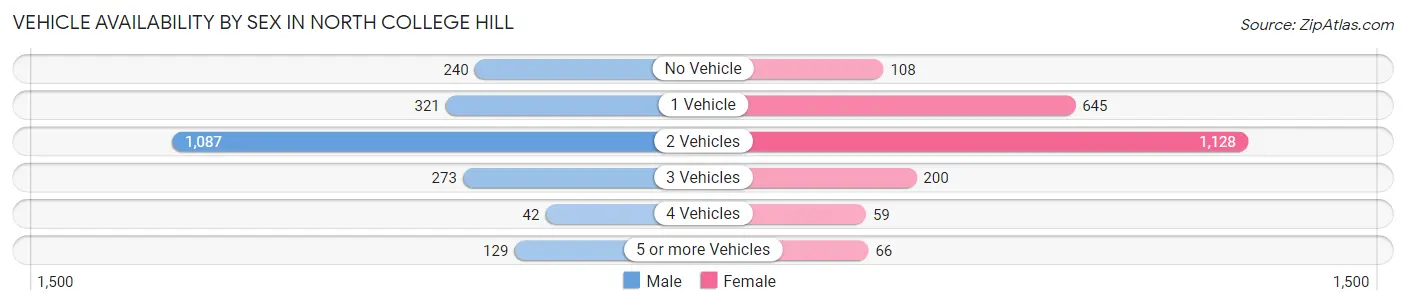
| Vehicles Available | Male | Female |
| No Vehicle | 240 (11.5%) | 108 (4.9%) |
| 1 Vehicle | 321 (15.3%) | 645 (29.2%) |
| 2 Vehicles | 1,087 (52.0%) | 1,128 (51.1%) |
| 3 Vehicles | 273 (13.1%) | 200 (9.1%) |
| 4 Vehicles | 42 (2.0%) | 59 (2.7%) |
| 5 or more Vehicles | 129 (6.2%) | 66 (3.0%) |
| Total | 2,092 (100.0%) | 2,206 (100.0%) |
Commute Time in North College Hill
The most frequently occuring commute durations in North College Hill are 20 to 24 minutes (945 commuters, 23.1%), 30 to 34 minutes (728 commuters, 17.8%), and 10 to 14 minutes (435 commuters, 10.6%).
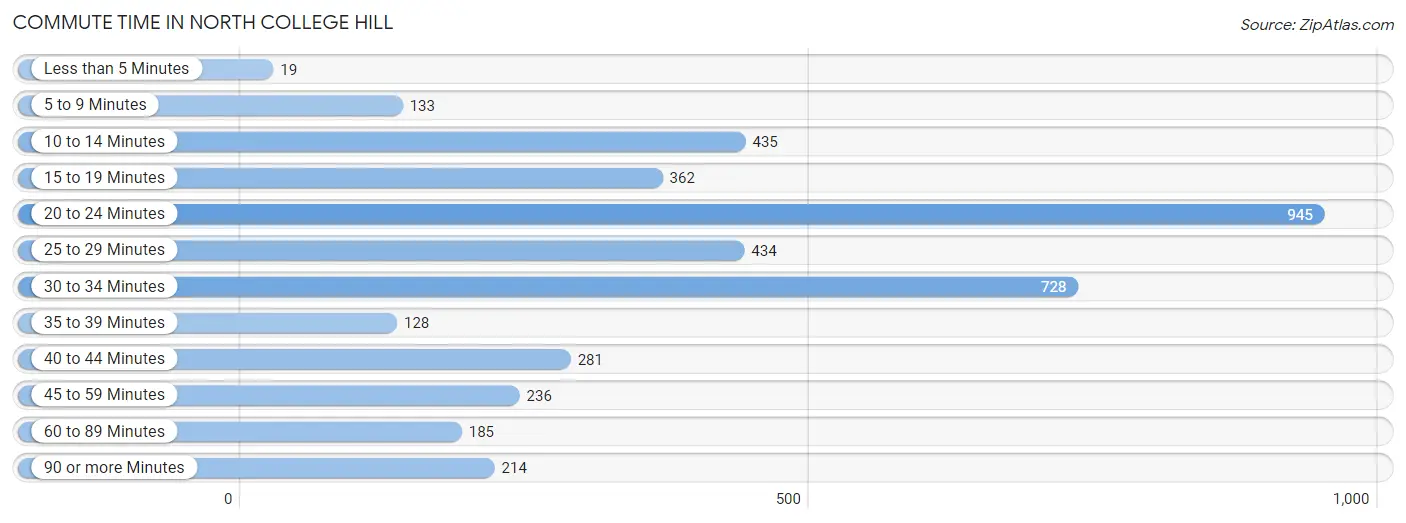
| Commute Time | # Commuters | % Commuters |
| Less than 5 Minutes | 19 | 0.5% |
| 5 to 9 Minutes | 133 | 3.2% |
| 10 to 14 Minutes | 435 | 10.6% |
| 15 to 19 Minutes | 362 | 8.8% |
| 20 to 24 Minutes | 945 | 23.1% |
| 25 to 29 Minutes | 434 | 10.6% |
| 30 to 34 Minutes | 728 | 17.8% |
| 35 to 39 Minutes | 128 | 3.1% |
| 40 to 44 Minutes | 281 | 6.9% |
| 45 to 59 Minutes | 236 | 5.8% |
| 60 to 89 Minutes | 185 | 4.5% |
| 90 or more Minutes | 214 | 5.2% |
Commute Time by Sex in North College Hill
The most common commute times in North College Hill are 20 to 24 minutes (473 commuters, 23.9%) for males and 20 to 24 minutes (472 commuters, 22.3%) for females.
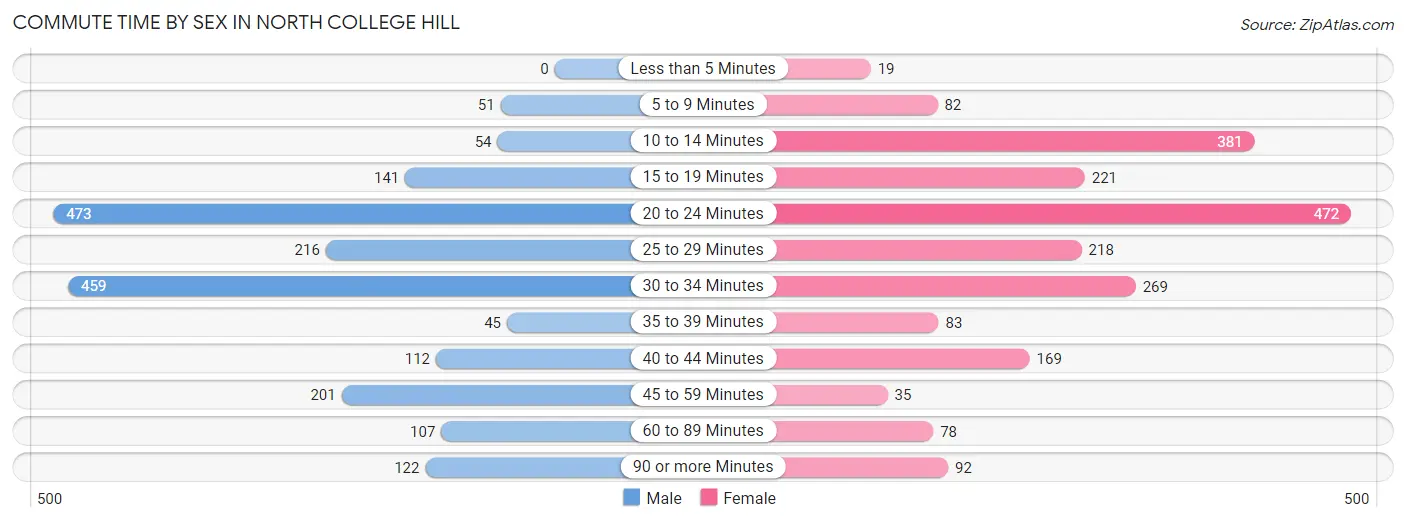
| Commute Time | Male | Female |
| Less than 5 Minutes | 0 (0.0%) | 19 (0.9%) |
| 5 to 9 Minutes | 51 (2.6%) | 82 (3.9%) |
| 10 to 14 Minutes | 54 (2.7%) | 381 (18.0%) |
| 15 to 19 Minutes | 141 (7.1%) | 221 (10.4%) |
| 20 to 24 Minutes | 473 (23.9%) | 472 (22.3%) |
| 25 to 29 Minutes | 216 (10.9%) | 218 (10.3%) |
| 30 to 34 Minutes | 459 (23.2%) | 269 (12.7%) |
| 35 to 39 Minutes | 45 (2.3%) | 83 (3.9%) |
| 40 to 44 Minutes | 112 (5.7%) | 169 (8.0%) |
| 45 to 59 Minutes | 201 (10.2%) | 35 (1.7%) |
| 60 to 89 Minutes | 107 (5.4%) | 78 (3.7%) |
| 90 or more Minutes | 122 (6.2%) | 92 (4.3%) |
Time of Departure to Work by Sex in North College Hill
The most frequent times of departure to work in North College Hill are 7:00 AM to 7:29 AM (297, 15.0%) for males and 7:00 AM to 7:29 AM (403, 19.0%) for females.
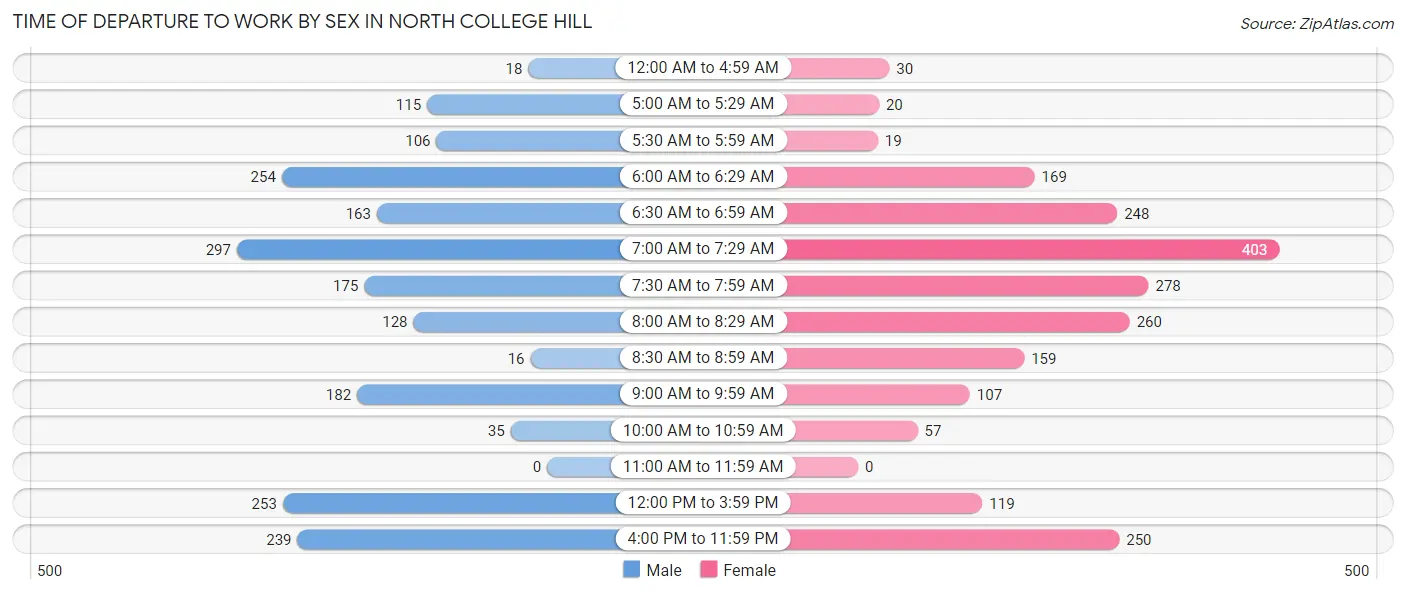
| Time of Departure | Male | Female |
| 12:00 AM to 4:59 AM | 18 (0.9%) | 30 (1.4%) |
| 5:00 AM to 5:29 AM | 115 (5.8%) | 20 (0.9%) |
| 5:30 AM to 5:59 AM | 106 (5.3%) | 19 (0.9%) |
| 6:00 AM to 6:29 AM | 254 (12.8%) | 169 (8.0%) |
| 6:30 AM to 6:59 AM | 163 (8.2%) | 248 (11.7%) |
| 7:00 AM to 7:29 AM | 297 (15.0%) | 403 (19.0%) |
| 7:30 AM to 7:59 AM | 175 (8.8%) | 278 (13.1%) |
| 8:00 AM to 8:29 AM | 128 (6.5%) | 260 (12.3%) |
| 8:30 AM to 8:59 AM | 16 (0.8%) | 159 (7.5%) |
| 9:00 AM to 9:59 AM | 182 (9.2%) | 107 (5.1%) |
| 10:00 AM to 10:59 AM | 35 (1.8%) | 57 (2.7%) |
| 11:00 AM to 11:59 AM | 0 (0.0%) | 0 (0.0%) |
| 12:00 PM to 3:59 PM | 253 (12.8%) | 119 (5.6%) |
| 4:00 PM to 11:59 PM | 239 (12.1%) | 250 (11.8%) |
| Total | 1,981 (100.0%) | 2,119 (100.0%) |
Housing Occupancy in North College Hill
Occupancy by Ownership in North College Hill
Of the total 3,753 dwellings in North College Hill, owner-occupied units account for 2,095 (55.8%), while renter-occupied units make up 1,658 (44.2%).
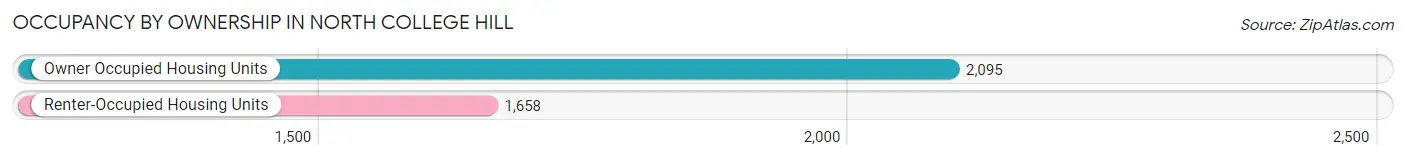
| Occupancy | # Housing Units | % Housing Units |
| Owner Occupied Housing Units | 2,095 | 55.8% |
| Renter-Occupied Housing Units | 1,658 | 44.2% |
| Total Occupied Housing Units | 3,753 | 100.0% |
Occupancy by Household Size in North College Hill
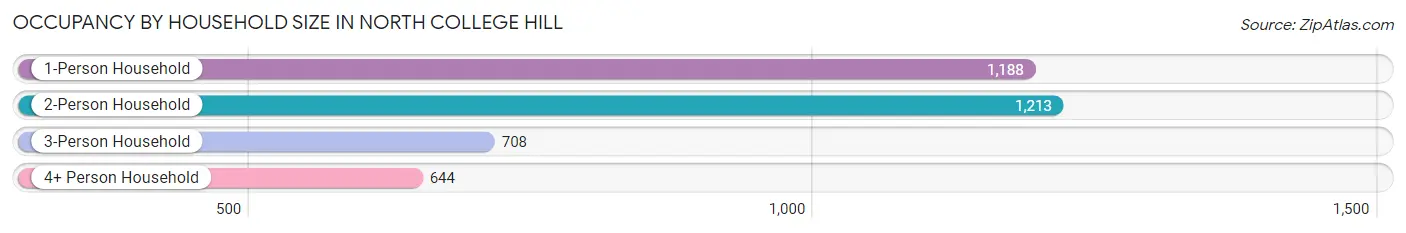
| Household Size | # Housing Units | % Housing Units |
| 1-Person Household | 1,188 | 31.7% |
| 2-Person Household | 1,213 | 32.3% |
| 3-Person Household | 708 | 18.9% |
| 4+ Person Household | 644 | 17.2% |
| Total Housing Units | 3,753 | 100.0% |
Occupancy by Ownership by Household Size in North College Hill
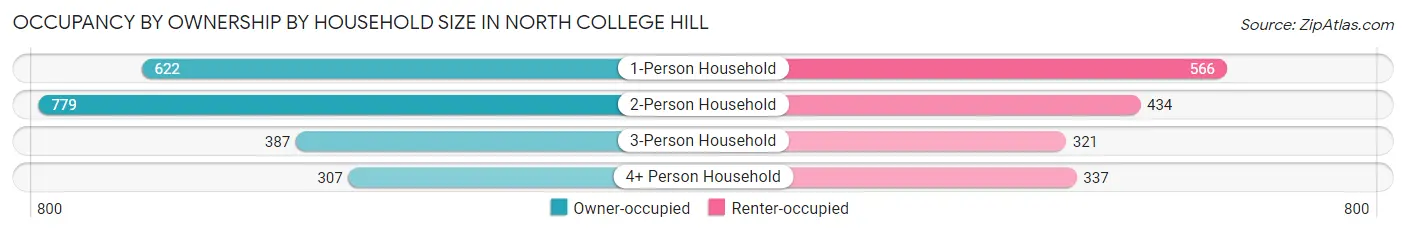
| Household Size | Owner-occupied | Renter-occupied |
| 1-Person Household | 622 (52.4%) | 566 (47.6%) |
| 2-Person Household | 779 (64.2%) | 434 (35.8%) |
| 3-Person Household | 387 (54.7%) | 321 (45.3%) |
| 4+ Person Household | 307 (47.7%) | 337 (52.3%) |
| Total Housing Units | 2,095 (55.8%) | 1,658 (44.2%) |
Occupancy by Educational Attainment in North College Hill
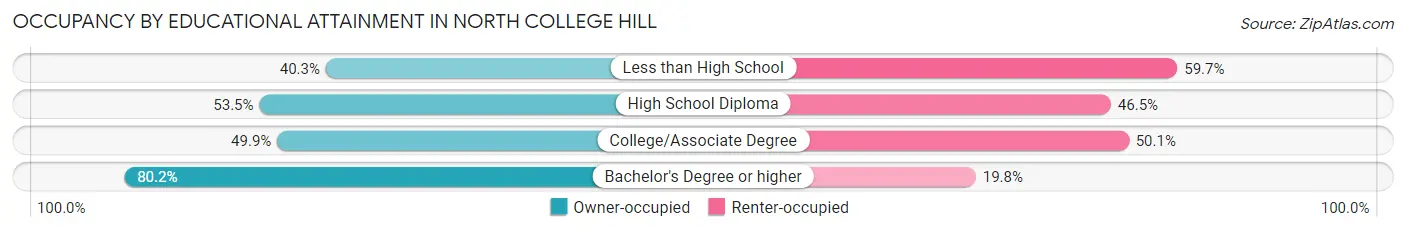
| Household Size | Owner-occupied | Renter-occupied |
| Less than High School | 193 (40.3%) | 286 (59.7%) |
| High School Diploma | 610 (53.5%) | 531 (46.5%) |
| College/Associate Degree | 691 (49.9%) | 693 (50.1%) |
| Bachelor's Degree or higher | 601 (80.2%) | 148 (19.8%) |
Occupancy by Age of Householder in North College Hill
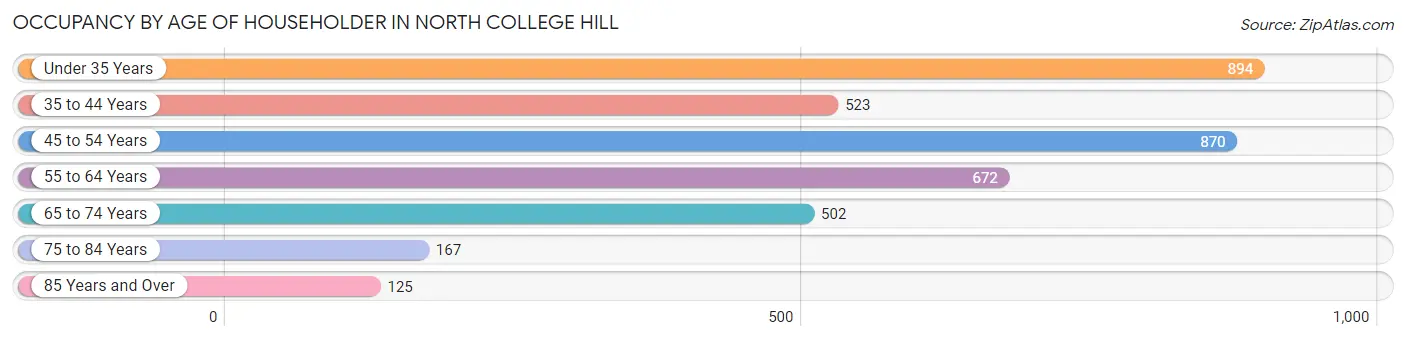
| Age Bracket | # Households | % Households |
| Under 35 Years | 894 | 23.8% |
| 35 to 44 Years | 523 | 13.9% |
| 45 to 54 Years | 870 | 23.2% |
| 55 to 64 Years | 672 | 17.9% |
| 65 to 74 Years | 502 | 13.4% |
| 75 to 84 Years | 167 | 4.4% |
| 85 Years and Over | 125 | 3.3% |
| Total | 3,753 | 100.0% |
Housing Finances in North College Hill
Median Income by Occupancy in North College Hill
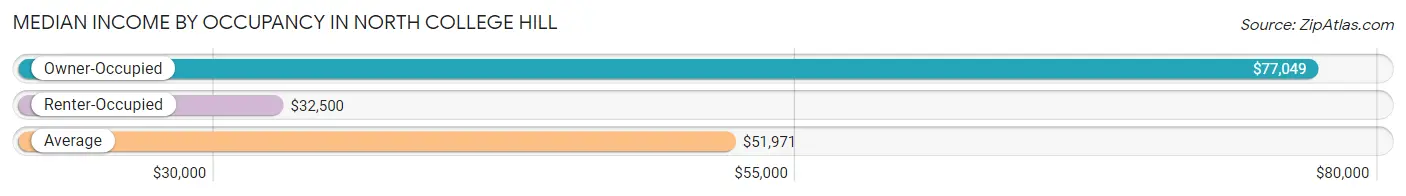
| Occupancy Type | # Households | Median Income |
| Owner-Occupied | 2,095 (55.8%) | $77,049 |
| Renter-Occupied | 1,658 (44.2%) | $32,500 |
| Average | 3,753 (100.0%) | $51,971 |
Occupancy by Householder Income Bracket in North College Hill
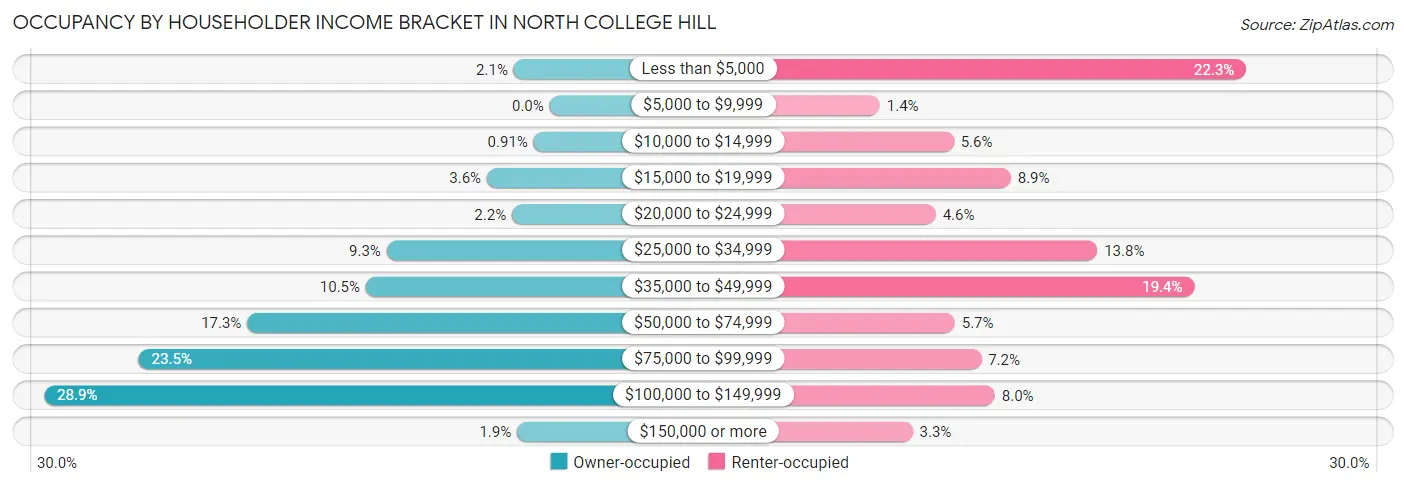
| Income Bracket | Owner-occupied | Renter-occupied |
| Less than $5,000 | 43 (2.1%) | 370 (22.3%) |
| $5,000 to $9,999 | 0 (0.0%) | 23 (1.4%) |
| $10,000 to $14,999 | 19 (0.9%) | 93 (5.6%) |
| $15,000 to $19,999 | 75 (3.6%) | 147 (8.9%) |
| $20,000 to $24,999 | 45 (2.1%) | 76 (4.6%) |
| $25,000 to $34,999 | 195 (9.3%) | 229 (13.8%) |
| $35,000 to $49,999 | 220 (10.5%) | 321 (19.4%) |
| $50,000 to $74,999 | 362 (17.3%) | 94 (5.7%) |
| $75,000 to $99,999 | 492 (23.5%) | 119 (7.2%) |
| $100,000 to $149,999 | 605 (28.9%) | 132 (8.0%) |
| $150,000 or more | 39 (1.9%) | 54 (3.3%) |
| Total | 2,095 (100.0%) | 1,658 (100.0%) |
Monthly Housing Cost Tiers in North College Hill
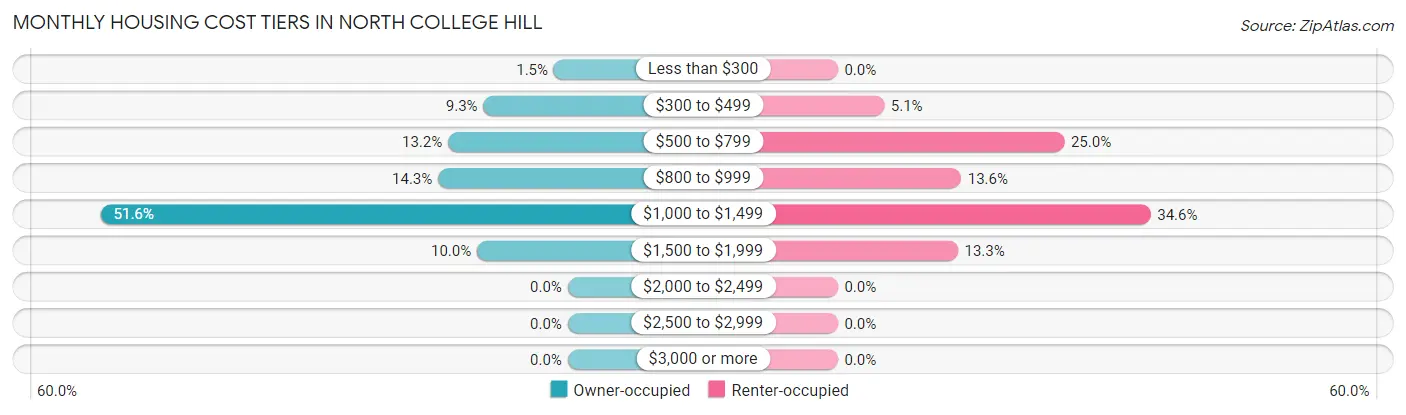
| Monthly Cost | Owner-occupied | Renter-occupied |
| Less than $300 | 32 (1.5%) | 0 (0.0%) |
| $300 to $499 | 195 (9.3%) | 85 (5.1%) |
| $500 to $799 | 277 (13.2%) | 415 (25.0%) |
| $800 to $999 | 300 (14.3%) | 226 (13.6%) |
| $1,000 to $1,499 | 1,081 (51.6%) | 573 (34.6%) |
| $1,500 to $1,999 | 210 (10.0%) | 220 (13.3%) |
| $2,000 to $2,499 | 0 (0.0%) | 0 (0.0%) |
| $2,500 to $2,999 | 0 (0.0%) | 0 (0.0%) |
| $3,000 or more | 0 (0.0%) | 0 (0.0%) |
| Total | 2,095 (100.0%) | 1,658 (100.0%) |
Physical Housing Characteristics in North College Hill
Housing Structures in North College Hill
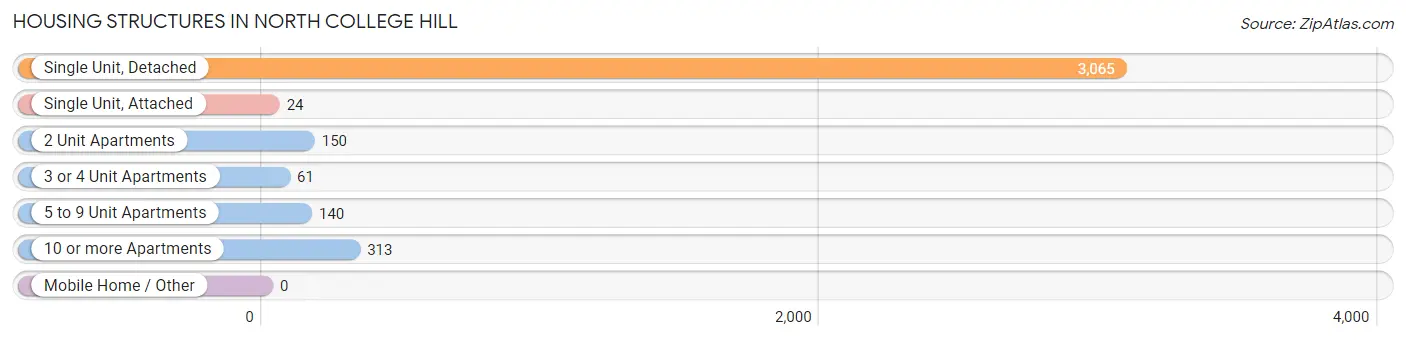
| Structure Type | # Housing Units | % Housing Units |
| Single Unit, Detached | 3,065 | 81.7% |
| Single Unit, Attached | 24 | 0.6% |
| 2 Unit Apartments | 150 | 4.0% |
| 3 or 4 Unit Apartments | 61 | 1.6% |
| 5 to 9 Unit Apartments | 140 | 3.7% |
| 10 or more Apartments | 313 | 8.3% |
| Mobile Home / Other | 0 | 0.0% |
| Total | 3,753 | 100.0% |
Housing Structures by Occupancy in North College Hill
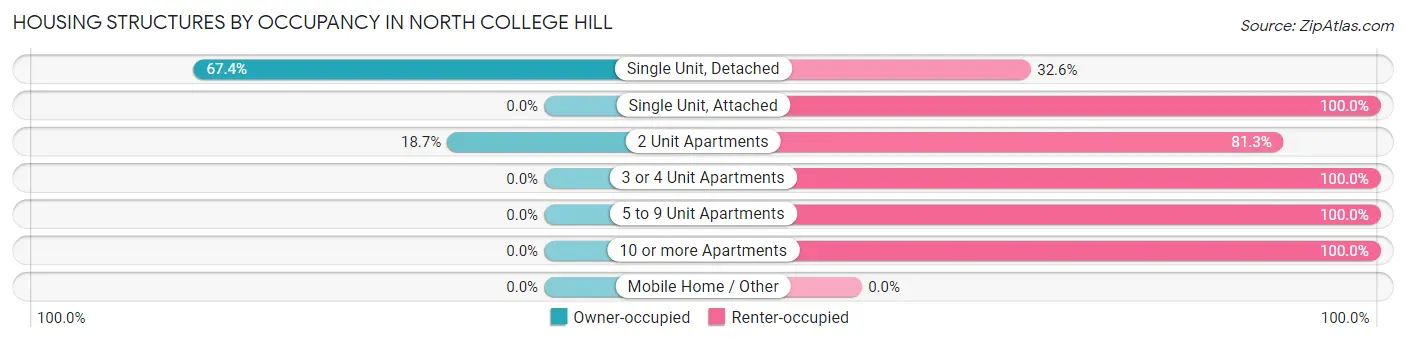
| Structure Type | Owner-occupied | Renter-occupied |
| Single Unit, Detached | 2,067 (67.4%) | 998 (32.6%) |
| Single Unit, Attached | 0 (0.0%) | 24 (100.0%) |
| 2 Unit Apartments | 28 (18.7%) | 122 (81.3%) |
| 3 or 4 Unit Apartments | 0 (0.0%) | 61 (100.0%) |
| 5 to 9 Unit Apartments | 0 (0.0%) | 140 (100.0%) |
| 10 or more Apartments | 0 (0.0%) | 313 (100.0%) |
| Mobile Home / Other | 0 (0.0%) | 0 (0.0%) |
| Total | 2,095 (55.8%) | 1,658 (44.2%) |
Housing Structures by Number of Rooms in North College Hill
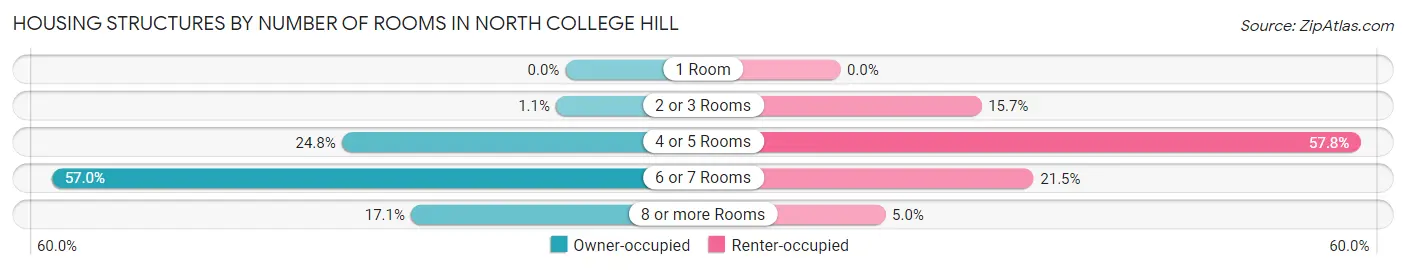
| Number of Rooms | Owner-occupied | Renter-occupied |
| 1 Room | 0 (0.0%) | 0 (0.0%) |
| 2 or 3 Rooms | 22 (1.1%) | 260 (15.7%) |
| 4 or 5 Rooms | 520 (24.8%) | 959 (57.8%) |
| 6 or 7 Rooms | 1,194 (57.0%) | 356 (21.5%) |
| 8 or more Rooms | 359 (17.1%) | 83 (5.0%) |
| Total | 2,095 (100.0%) | 1,658 (100.0%) |
Housing Structure by Heating Type in North College Hill
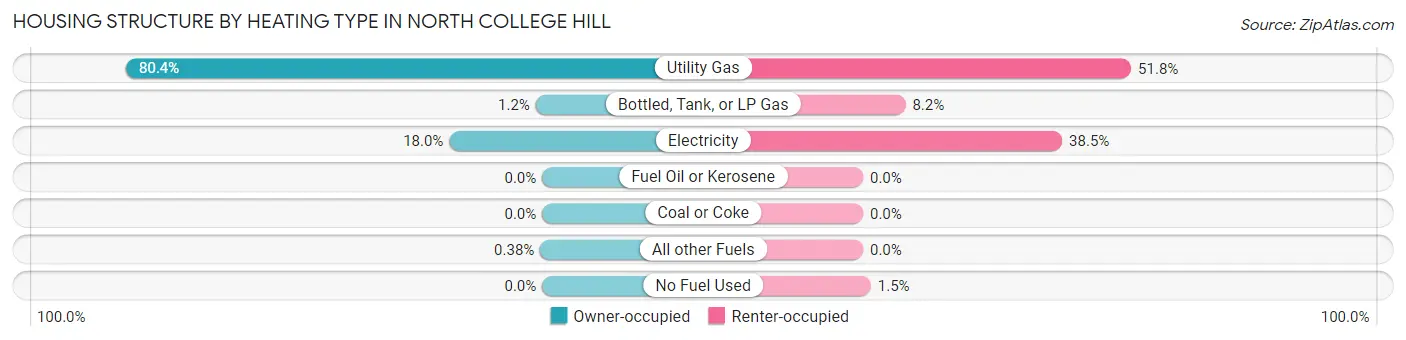
| Heating Type | Owner-occupied | Renter-occupied |
| Utility Gas | 1,685 (80.4%) | 859 (51.8%) |
| Bottled, Tank, or LP Gas | 26 (1.2%) | 136 (8.2%) |
| Electricity | 376 (17.9%) | 638 (38.5%) |
| Fuel Oil or Kerosene | 0 (0.0%) | 0 (0.0%) |
| Coal or Coke | 0 (0.0%) | 0 (0.0%) |
| All other Fuels | 8 (0.4%) | 0 (0.0%) |
| No Fuel Used | 0 (0.0%) | 25 (1.5%) |
| Total | 2,095 (100.0%) | 1,658 (100.0%) |
Household Vehicle Usage in North College Hill
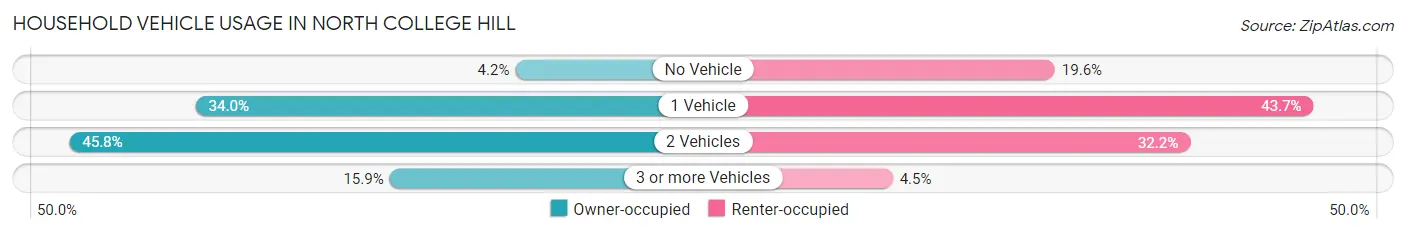
| Vehicles per Household | Owner-occupied | Renter-occupied |
| No Vehicle | 88 (4.2%) | 325 (19.6%) |
| 1 Vehicle | 713 (34.0%) | 725 (43.7%) |
| 2 Vehicles | 960 (45.8%) | 534 (32.2%) |
| 3 or more Vehicles | 334 (15.9%) | 74 (4.5%) |
| Total | 2,095 (100.0%) | 1,658 (100.0%) |
Real Estate & Mortgages in North College Hill
Real Estate and Mortgage Overview in North College Hill
| Characteristic | Without Mortgage | With Mortgage |
| Housing Units | 353 | 1,742 |
| Median Property Value | $103,000 | $113,300 |
| Median Household Income | $71,458 | $23 |
| Monthly Housing Costs | $472 | $0 |
| Real Estate Taxes | $1,433 | $105 |
Property Value by Mortgage Status in North College Hill
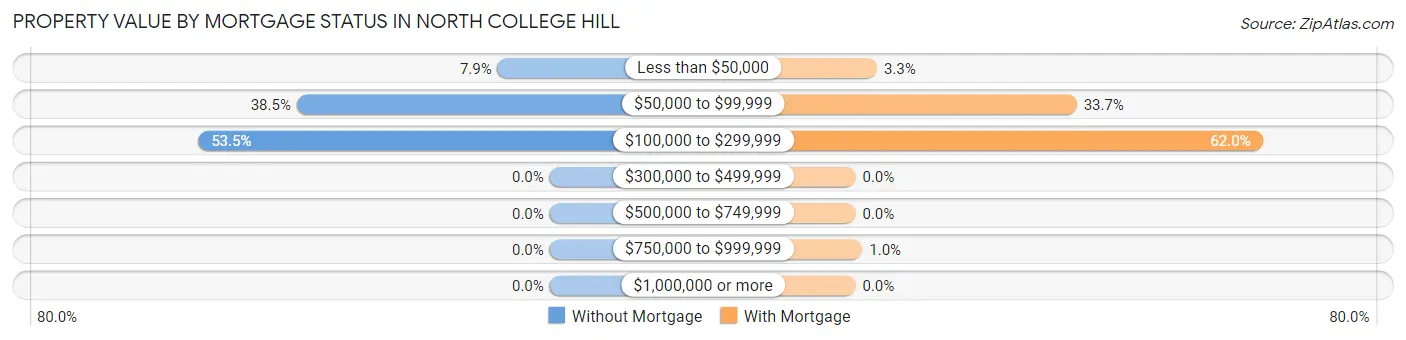
| Property Value | Without Mortgage | With Mortgage |
| Less than $50,000 | 28 (7.9%) | 57 (3.3%) |
| $50,000 to $99,999 | 136 (38.5%) | 587 (33.7%) |
| $100,000 to $299,999 | 189 (53.5%) | 1,080 (62.0%) |
| $300,000 to $499,999 | 0 (0.0%) | 0 (0.0%) |
| $500,000 to $749,999 | 0 (0.0%) | 0 (0.0%) |
| $750,000 to $999,999 | 0 (0.0%) | 18 (1.0%) |
| $1,000,000 or more | 0 (0.0%) | 0 (0.0%) |
| Total | 353 (100.0%) | 1,742 (100.0%) |
Household Income by Mortgage Status in North College Hill
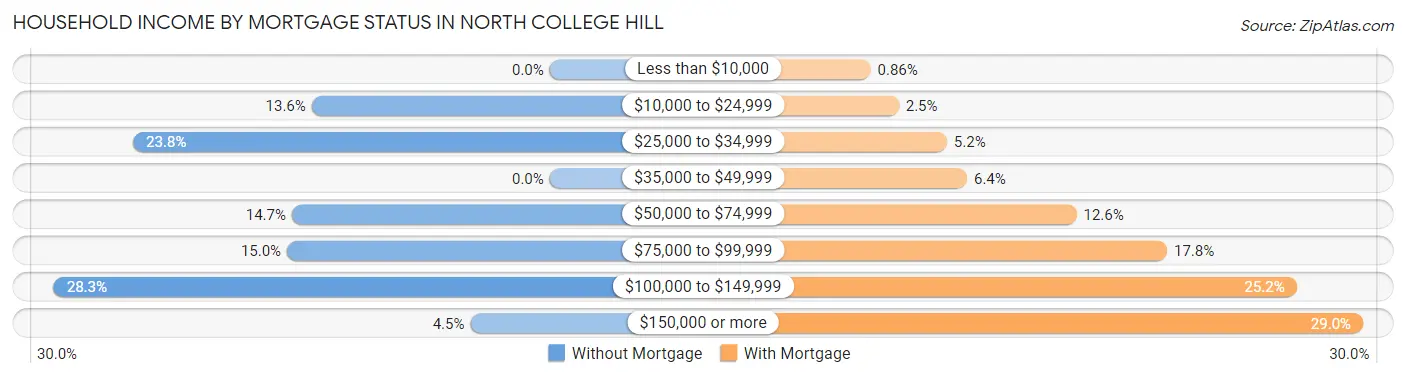
| Household Income | Without Mortgage | With Mortgage |
| Less than $10,000 | 0 (0.0%) | 15 (0.9%) |
| $10,000 to $24,999 | 48 (13.6%) | 43 (2.5%) |
| $25,000 to $34,999 | 84 (23.8%) | 91 (5.2%) |
| $35,000 to $49,999 | 0 (0.0%) | 111 (6.4%) |
| $50,000 to $74,999 | 52 (14.7%) | 220 (12.6%) |
| $75,000 to $99,999 | 53 (15.0%) | 310 (17.8%) |
| $100,000 to $149,999 | 100 (28.3%) | 439 (25.2%) |
| $150,000 or more | 16 (4.5%) | 505 (29.0%) |
| Total | 353 (100.0%) | 1,742 (100.0%) |
Property Value to Household Income Ratio in North College Hill
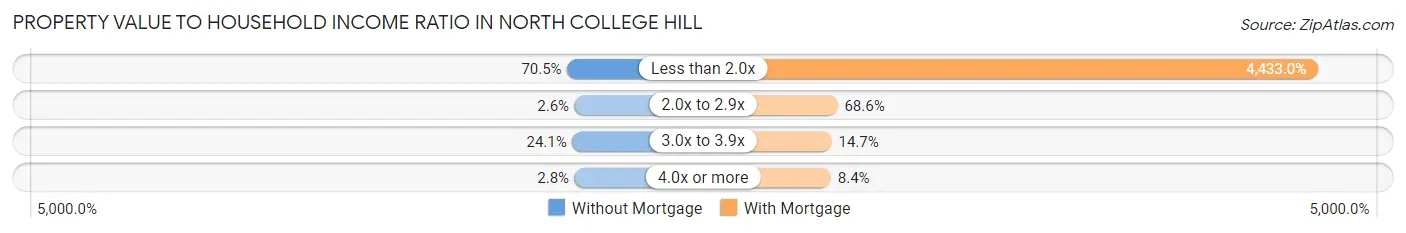
| Value-to-Income Ratio | Without Mortgage | With Mortgage |
| Less than 2.0x | 249 (70.5%) | 77,222 (4,433.0%) |
| 2.0x to 2.9x | 9 (2.5%) | 1,195 (68.6%) |
| 3.0x to 3.9x | 85 (24.1%) | 256 (14.7%) |
| 4.0x or more | 10 (2.8%) | 147 (8.4%) |
| Total | 353 (100.0%) | 1,742 (100.0%) |
Real Estate Taxes by Mortgage Status in North College Hill
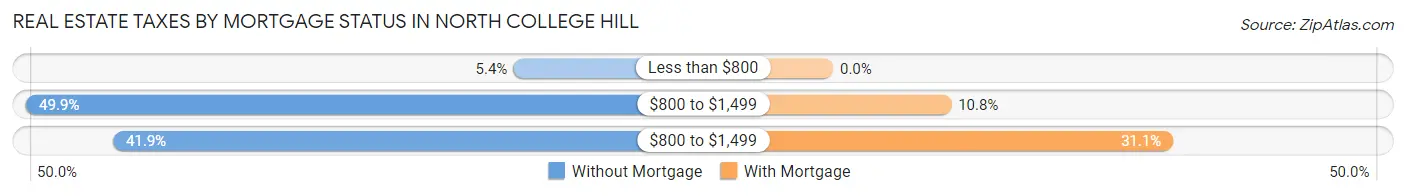
| Property Taxes | Without Mortgage | With Mortgage |
| Less than $800 | 19 (5.4%) | 0 (0.0%) |
| $800 to $1,499 | 176 (49.9%) | 188 (10.8%) |
| $800 to $1,499 | 148 (41.9%) | 541 (31.1%) |
| Total | 353 (100.0%) | 1,742 (100.0%) |
Health & Disability in North College Hill
Health Insurance Coverage by Age in North College Hill
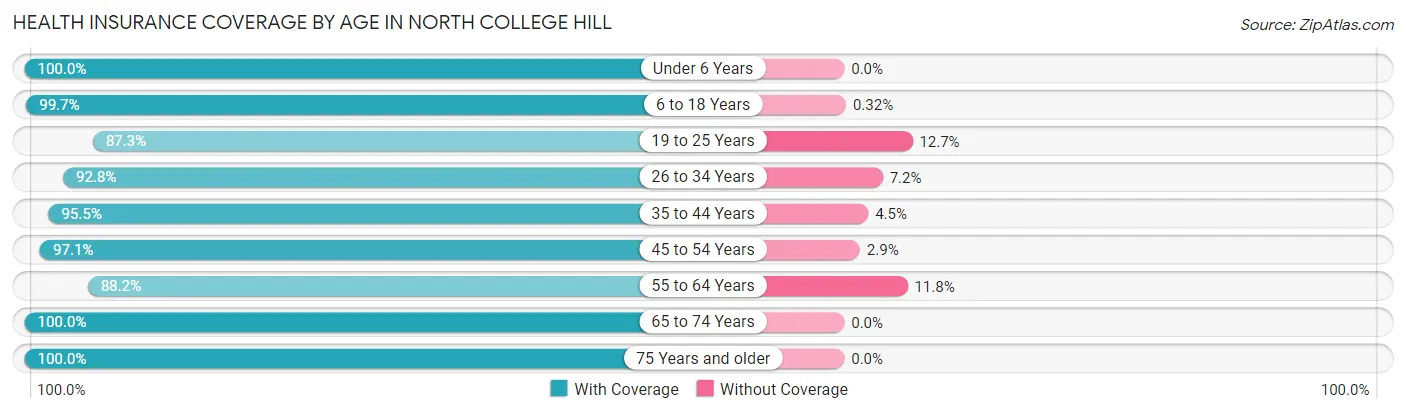
| Age Bracket | With Coverage | Without Coverage |
| Under 6 Years | 404 (100.0%) | 0 (0.0%) |
| 6 to 18 Years | 2,165 (99.7%) | 7 (0.3%) |
| 19 to 25 Years | 611 (87.3%) | 89 (12.7%) |
| 26 to 34 Years | 1,670 (92.8%) | 129 (7.2%) |
| 35 to 44 Years | 899 (95.5%) | 42 (4.5%) |
| 45 to 54 Years | 1,166 (97.1%) | 35 (2.9%) |
| 55 to 64 Years | 914 (88.2%) | 122 (11.8%) |
| 65 to 74 Years | 804 (100.0%) | 0 (0.0%) |
| 75 Years and older | 315 (100.0%) | 0 (0.0%) |
| Total | 8,948 (95.5%) | 424 (4.5%) |
Health Insurance Coverage by Citizenship Status in North College Hill
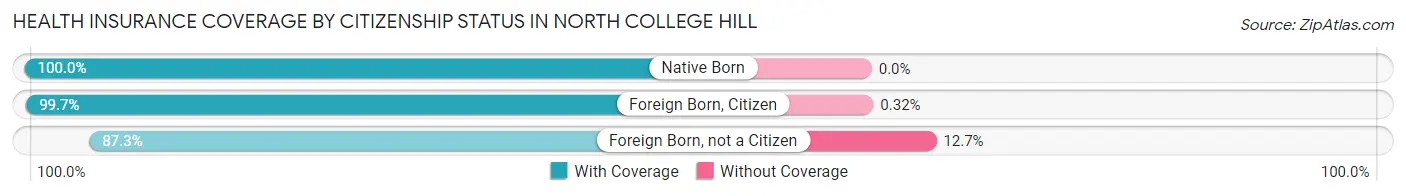
| Citizenship Status | With Coverage | Without Coverage |
| Native Born | 404 (100.0%) | 0 (0.0%) |
| Foreign Born, Citizen | 2,165 (99.7%) | 7 (0.3%) |
| Foreign Born, not a Citizen | 611 (87.3%) | 89 (12.7%) |
Health Insurance Coverage by Household Income in North College Hill
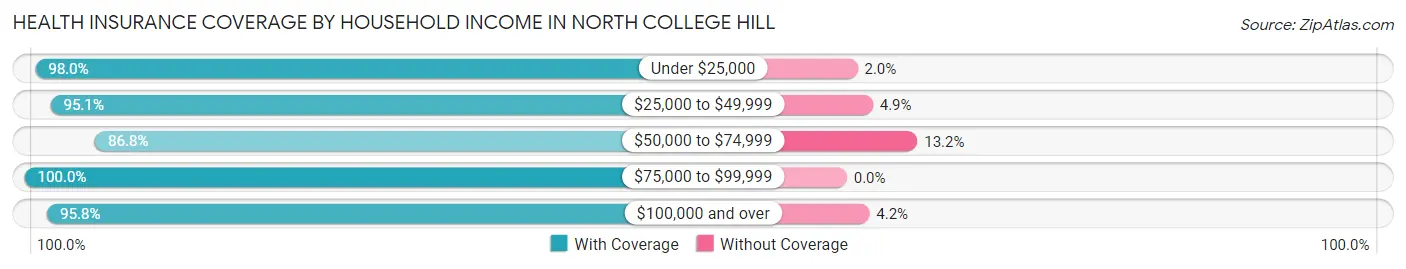
| Household Income | With Coverage | Without Coverage |
| Under $25,000 | 2,099 (98.0%) | 43 (2.0%) |
| $25,000 to $49,999 | 1,799 (95.1%) | 92 (4.9%) |
| $50,000 to $74,999 | 1,209 (86.8%) | 184 (13.2%) |
| $75,000 to $99,999 | 1,484 (100.0%) | 0 (0.0%) |
| $100,000 and over | 2,339 (95.8%) | 103 (4.2%) |
Public vs Private Health Insurance Coverage by Age in North College Hill
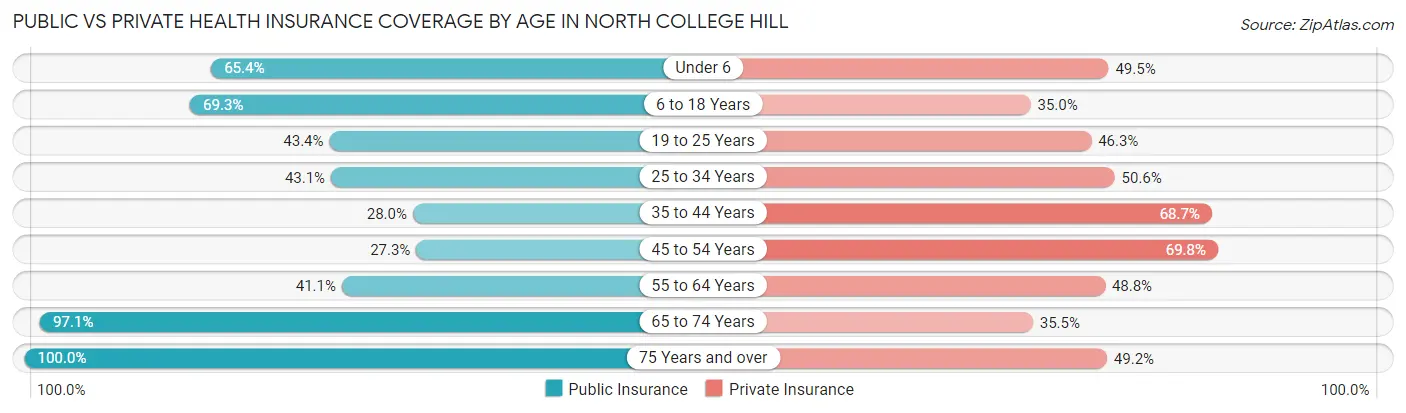
| Age Bracket | Public Insurance | Private Insurance |
| Under 6 | 264 (65.3%) | 200 (49.5%) |
| 6 to 18 Years | 1,505 (69.3%) | 761 (35.0%) |
| 19 to 25 Years | 304 (43.4%) | 324 (46.3%) |
| 25 to 34 Years | 776 (43.1%) | 911 (50.6%) |
| 35 to 44 Years | 263 (28.0%) | 646 (68.6%) |
| 45 to 54 Years | 328 (27.3%) | 838 (69.8%) |
| 55 to 64 Years | 426 (41.1%) | 506 (48.8%) |
| 65 to 74 Years | 781 (97.1%) | 285 (35.4%) |
| 75 Years and over | 315 (100.0%) | 155 (49.2%) |
| Total | 4,962 (52.9%) | 4,626 (49.4%) |
Disability Status by Sex by Age in North College Hill
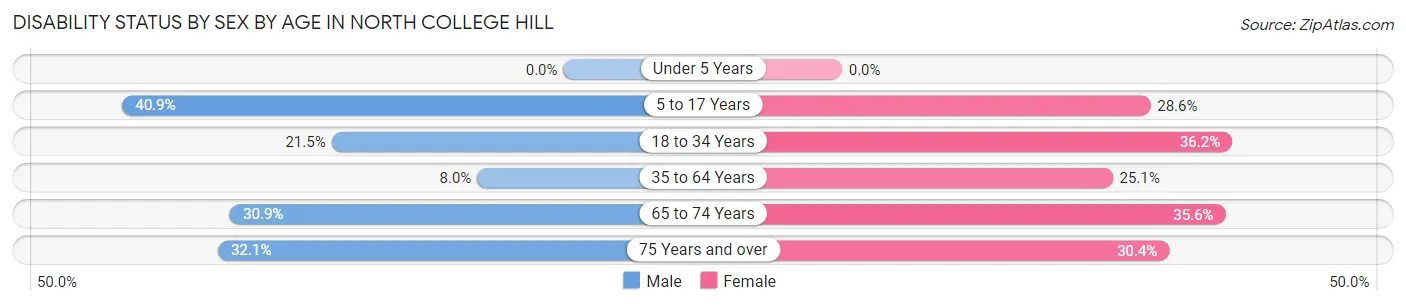
| Age Bracket | Male | Female |
| Under 5 Years | 0 (0.0%) | 0 (0.0%) |
| 5 to 17 Years | 424 (40.9%) | 304 (28.6%) |
| 18 to 34 Years | 291 (21.5%) | 482 (36.2%) |
| 35 to 64 Years | 117 (8.0%) | 431 (25.1%) |
| 65 to 74 Years | 94 (30.9%) | 178 (35.6%) |
| 75 Years and over | 25 (32.1%) | 72 (30.4%) |
Disability Class by Sex by Age in North College Hill
Disability Class: Hearing Difficulty
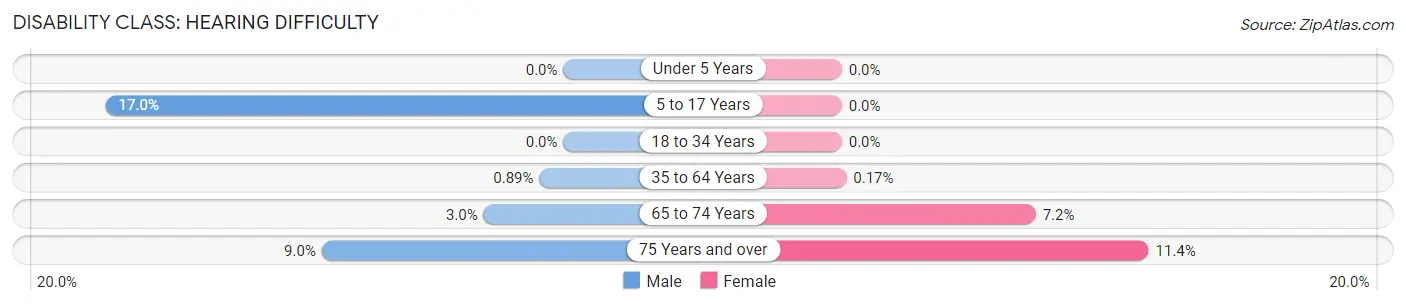
| Age Bracket | Male | Female |
| Under 5 Years | 0 (0.0%) | 0 (0.0%) |
| 5 to 17 Years | 176 (17.0%) | 0 (0.0%) |
| 18 to 34 Years | 0 (0.0%) | 0 (0.0%) |
| 35 to 64 Years | 13 (0.9%) | 3 (0.2%) |
| 65 to 74 Years | 9 (3.0%) | 36 (7.2%) |
| 75 Years and over | 7 (9.0%) | 27 (11.4%) |
Disability Class: Vision Difficulty
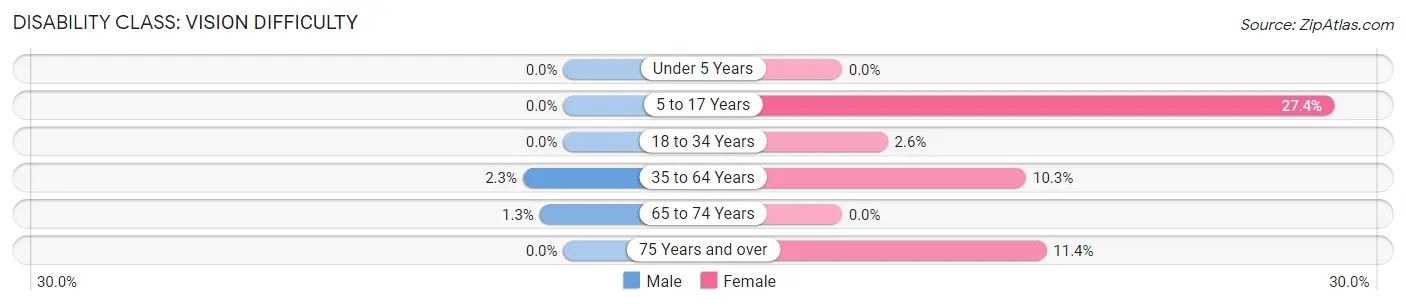
| Age Bracket | Male | Female |
| Under 5 Years | 0 (0.0%) | 0 (0.0%) |
| 5 to 17 Years | 0 (0.0%) | 291 (27.4%) |
| 18 to 34 Years | 0 (0.0%) | 34 (2.5%) |
| 35 to 64 Years | 33 (2.3%) | 176 (10.3%) |
| 65 to 74 Years | 4 (1.3%) | 0 (0.0%) |
| 75 Years and over | 0 (0.0%) | 27 (11.4%) |
Disability Class: Cognitive Difficulty
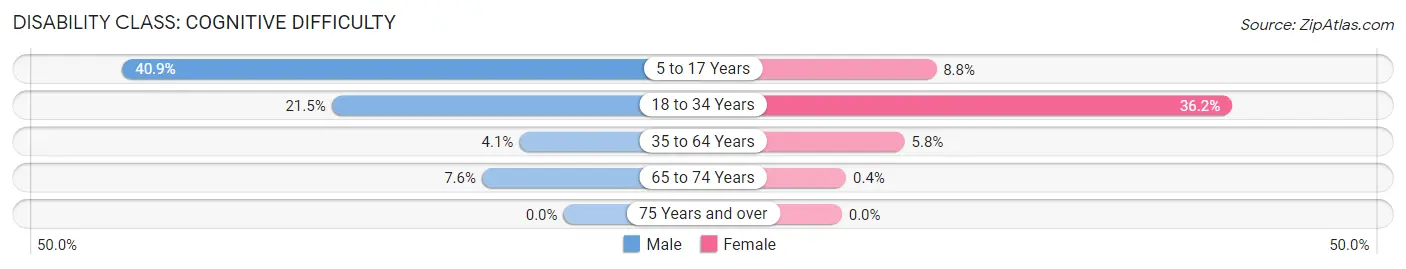
| Age Bracket | Male | Female |
| 5 to 17 Years | 424 (40.9%) | 93 (8.8%) |
| 18 to 34 Years | 291 (21.5%) | 482 (36.2%) |
| 35 to 64 Years | 60 (4.1%) | 100 (5.8%) |
| 65 to 74 Years | 23 (7.6%) | 2 (0.4%) |
| 75 Years and over | 0 (0.0%) | 0 (0.0%) |
Disability Class: Ambulatory Difficulty
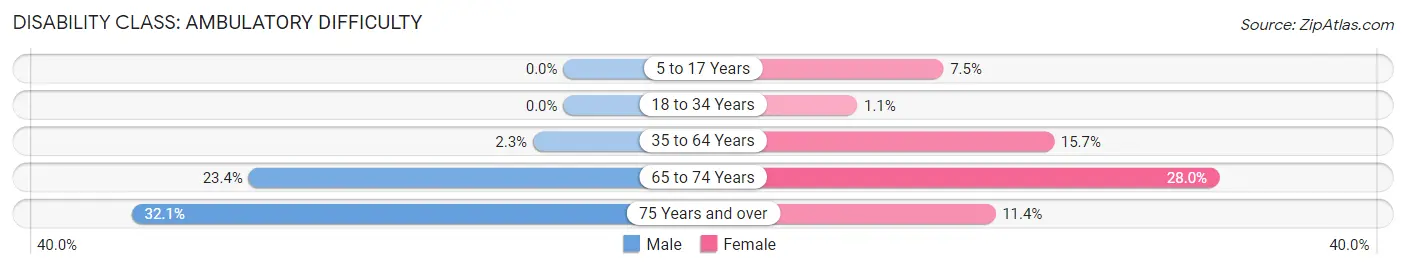
| Age Bracket | Male | Female |
| 5 to 17 Years | 0 (0.0%) | 80 (7.5%) |
| 18 to 34 Years | 0 (0.0%) | 15 (1.1%) |
| 35 to 64 Years | 33 (2.3%) | 270 (15.7%) |
| 65 to 74 Years | 71 (23.4%) | 140 (28.0%) |
| 75 Years and over | 25 (32.1%) | 27 (11.4%) |
Disability Class: Self-Care Difficulty
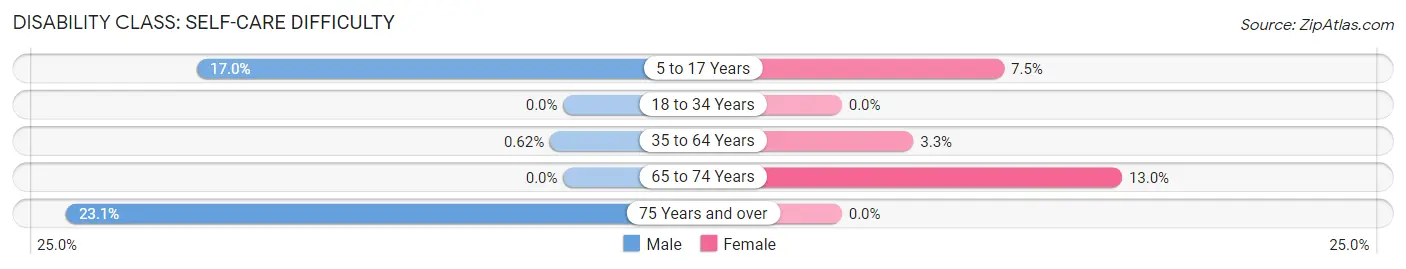
| Age Bracket | Male | Female |
| 5 to 17 Years | 176 (17.0%) | 80 (7.5%) |
| 18 to 34 Years | 0 (0.0%) | 0 (0.0%) |
| 35 to 64 Years | 9 (0.6%) | 57 (3.3%) |
| 65 to 74 Years | 0 (0.0%) | 65 (13.0%) |
| 75 Years and over | 18 (23.1%) | 0 (0.0%) |
Technology Access in North College Hill
Computing Device Access in North College Hill
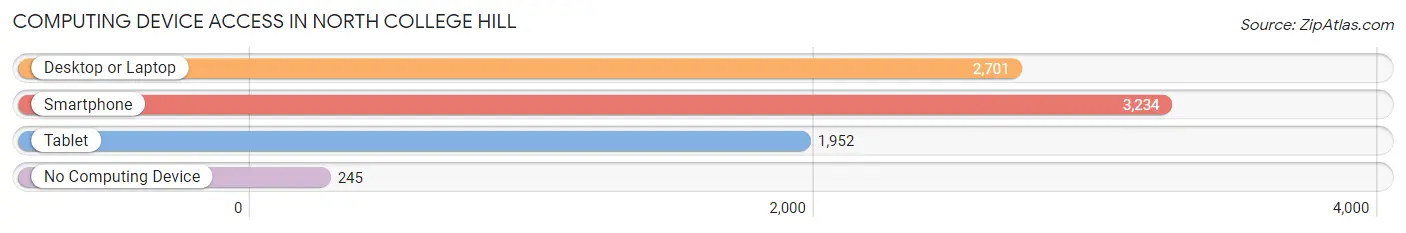
| Device Type | # Households | % Households |
| Desktop or Laptop | 2,701 | 72.0% |
| Smartphone | 3,234 | 86.2% |
| Tablet | 1,952 | 52.0% |
| No Computing Device | 245 | 6.5% |
| Total | 3,753 | 100.0% |
Internet Access in North College Hill
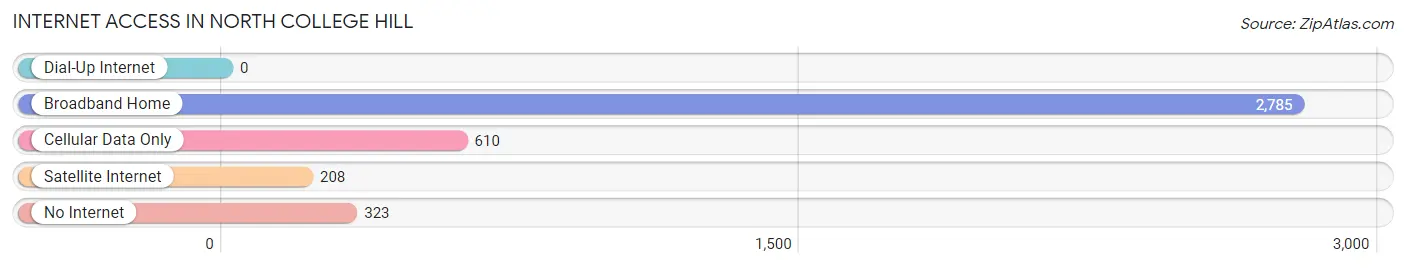
| Internet Type | # Households | % Households |
| Dial-Up Internet | 0 | 0.0% |
| Broadband Home | 2,785 | 74.2% |
| Cellular Data Only | 610 | 16.3% |
| Satellite Internet | 208 | 5.5% |
| No Internet | 323 | 8.6% |
| Total | 3,753 | 100.0% |
North College Hill Summary
North College Hill is a city located in Hamilton County, Ohio, United States. It is a suburb of Cincinnati and is part of the Cincinnati Metropolitan Statistical Area. The population was 8,945 at the 2010 census.
History
North College Hill was founded in 1817 by a group of settlers from North Carolina. The town was originally known as North Carolina Hill, but the name was changed to North College Hill in 1867. The town was incorporated in 1868 and was named after the nearby College Hill neighborhood of Cincinnati.
The town was originally a farming community, but it began to grow in the late 19th century when the Cincinnati, Hamilton and Dayton Railroad was built through the area. The railroad brought new businesses and industries to the area, and the population began to grow.
In the early 20th century, North College Hill was a popular destination for people looking to escape the hustle and bustle of the city. The town was known for its quiet streets and peaceful atmosphere.
Geography
North College Hill is located at 39°14′N 84°30′W (39.23, -84.50). According to the United States Census Bureau, the city has a total area of 2.2 square miles (5.7 km2), all land.
Economy
North College Hill is a primarily residential community, but it does have some businesses and industries. The largest employer in the city is the North College Hill City School District, which employs over 500 people. Other major employers include the North College Hill Post Office, the North College Hill Fire Department, and the North College Hill Police Department.
Demographics
As of the census of 2010, there were 8,945 people, 3,845 households, and 2,541 families residing in the city. The population density was 4,072.2 people per square mile (1,569.2/km2). There were 4,093 housing units at an average density of 1,845.2 per square mile (715.2/km2). The racial makeup of the city was 79.2% White, 15.2% African American, 0.3% Native American, 1.2% Asian, 0.1% Pacific Islander, 1.2% from other races, and 3.0% from two or more races. Hispanic or Latino of any race were 3.2% of the population.
There were 3,845 households, out of which 28.2% had children under the age of 18 living with them, 43.2% were married couples living together, 16.2% had a female householder with no husband present, and 35.7% were non-families. 30.2% of all households were made up of individuals, and 11.2% had someone living alone who was 65 years of age or older. The average household size was 2.32 and the average family size was 2.90.
In the city, the population was spread out, with 23.2% under the age of 18, 8.2% from 18 to 24, 28.2% from 25 to 44, 25.2% from 45 to 64, and 15.2% who were 65 years of age or older. The median age was 38 years. For every 100 females, there were 91.2 males. For every 100 females age 18 and over, there were 87.2 males.
The median income for a household in the city was $41,944, and the median income for a family was $50,944. Males had a median income of $37,944 versus $30,944 for females. The per capita income for the city was $20,944. About 6.2% of families and 8.2% of the population were below the poverty line, including 11.2% of those under age 18 and 6.2% of those age 65 or over.
Common Questions
What is Per Capita Income in North College Hill?
Per Capita income in North College Hill is $24,273.
What is the Median Family Income in North College Hill?
Median Family Income in North College Hill is $66,399.
What is the Median Household income in North College Hill?
Median Household Income in North College Hill is $51,971.
What is Income or Wage Gap in North College Hill?
Income or Wage Gap in North College Hill is 1.2%.
Women in North College Hill earn 98.8 cents for every dollar earned by a man.
What is Family Income Deficit in North College Hill?
Family Income Deficit in North College Hill is $15,091.
Families that are below poverty line in North College Hill earn $15,091 less on average than the poverty threshold level.
What is Inequality or Gini Index in North College Hill?
Inequality or Gini Index in North College Hill is 0.40.
What is the Total Population of North College Hill?
Total Population of North College Hill is 9,602.
What is the Total Male Population of North College Hill?
Total Male Population of North College Hill is 4,493.
What is the Total Female Population of North College Hill?
Total Female Population of North College Hill is 5,109.
What is the Ratio of Males per 100 Females in North College Hill?
There are 87.94 Males per 100 Females in North College Hill.
What is the Ratio of Females per 100 Males in North College Hill?
There are 113.71 Females per 100 Males in North College Hill.
What is the Median Population Age in North College Hill?
Median Population Age in North College Hill is 33.4 Years.
What is the Average Family Size in North College Hill
Average Family Size in North College Hill is 3.3 People.
What is the Average Household Size in North College Hill
Average Household Size in North College Hill is 2.5 People.
How Large is the Labor Force in North College Hill?
There are 4,767 People in the Labor Forcein in North College Hill.
What is the Percentage of People in the Labor Force in North College Hill?
64.2% of People are in the Labor Force in North College Hill.
What is the Unemployment Rate in North College Hill?
Unemployment Rate in North College Hill is 8.8%.