Oceola, OH Map & Demographics
Oceola Map
Oceola Overview
$46,016
PER CAPITA INCOME
$93,942
AVG FAMILY INCOME
$65,781
AVG HOUSEHOLD INCOME
23.2%
WAGE / INCOME GAP [ % ]
76.8¢/ $1
WAGE / INCOME GAP [ $ ]
0.41
INEQUALITY / GINI INDEX
237
TOTAL POPULATION
75
MALE POPULATION
162
FEMALE POPULATION
46.30
MALES / 100 FEMALES
216.00
FEMALES / 100 MALES
26.0
MEDIAN AGE
3.9
AVG FAMILY SIZE
2.4
AVG HOUSEHOLD SIZE
142
LABOR FORCE [ PEOPLE ]
94.7%
PERCENT IN LABOR FORCE
Oceola Area Codes
Income in Oceola
Income Overview in Oceola
Per Capita Income in Oceola is $46,016, while median incomes of families and households are $93,942 and $65,781 respectively.
| Characteristic | Number | Measure |
| Per Capita Income | 237 | $46,016 |
| Median Family Income | 35 | $93,942 |
| Mean Family Income | 35 | $107,017 |
| Median Household Income | 97 | $65,781 |
| Mean Household Income | 97 | $109,132 |
| Income Deficit | 35 | $0 |
| Wage / Income Gap (%) | 237 | 23.17% |
| Wage / Income Gap ($) | 237 | 76.83¢ per $1 |
| Gini / Inequality Index | 237 | 0.41 |
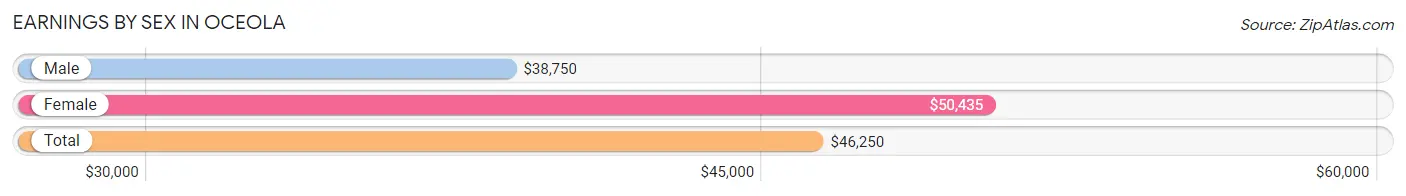
Earnings by Sex in Oceola
Average Earnings in Oceola are $46,250, $38,750 for men and $50,435 for women, a difference of 23.2%.
| Sex | Number | Average Earnings |
| Male | 42 (29.6%) | $38,750 |
| Female | 100 (70.4%) | $50,435 |
| Total | 142 (100.0%) | $46,250 |
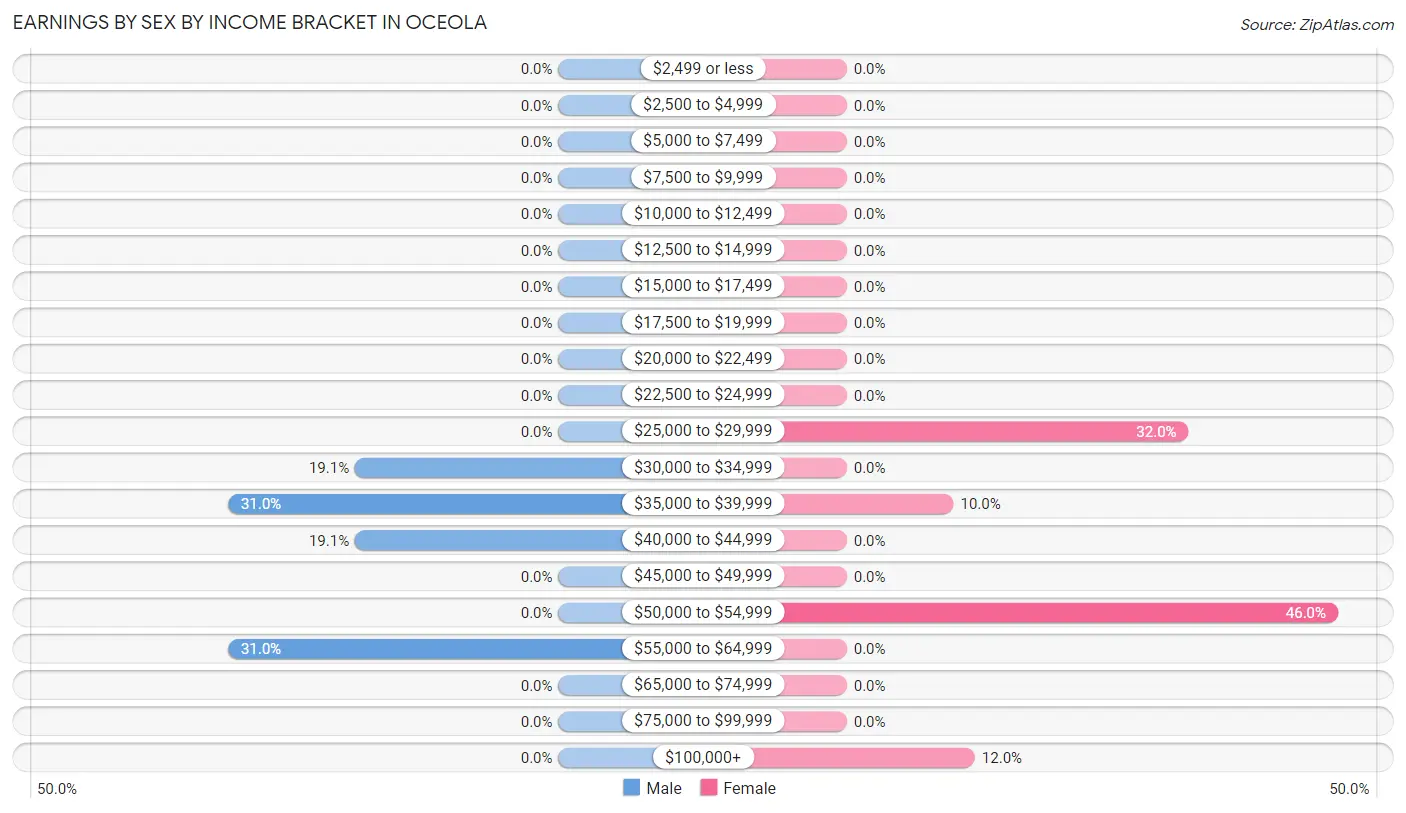
Earnings by Sex by Income Bracket in Oceola
The most common earnings brackets in Oceola are $35,000 to $39,999 for men (13 | 30.9%) and $50,000 to $54,999 for women (46 | 46.0%).
| Income | Male | Female |
| $2,499 or less | 0 (0.0%) | 0 (0.0%) |
| $2,500 to $4,999 | 0 (0.0%) | 0 (0.0%) |
| $5,000 to $7,499 | 0 (0.0%) | 0 (0.0%) |
| $7,500 to $9,999 | 0 (0.0%) | 0 (0.0%) |
| $10,000 to $12,499 | 0 (0.0%) | 0 (0.0%) |
| $12,500 to $14,999 | 0 (0.0%) | 0 (0.0%) |
| $15,000 to $17,499 | 0 (0.0%) | 0 (0.0%) |
| $17,500 to $19,999 | 0 (0.0%) | 0 (0.0%) |
| $20,000 to $22,499 | 0 (0.0%) | 0 (0.0%) |
| $22,500 to $24,999 | 0 (0.0%) | 0 (0.0%) |
| $25,000 to $29,999 | 0 (0.0%) | 32 (32.0%) |
| $30,000 to $34,999 | 8 (19.1%) | 0 (0.0%) |
| $35,000 to $39,999 | 13 (30.9%) | 10 (10.0%) |
| $40,000 to $44,999 | 8 (19.1%) | 0 (0.0%) |
| $45,000 to $49,999 | 0 (0.0%) | 0 (0.0%) |
| $50,000 to $54,999 | 0 (0.0%) | 46 (46.0%) |
| $55,000 to $64,999 | 13 (30.9%) | 0 (0.0%) |
| $65,000 to $74,999 | 0 (0.0%) | 0 (0.0%) |
| $75,000 to $99,999 | 0 (0.0%) | 0 (0.0%) |
| $100,000+ | 0 (0.0%) | 12 (12.0%) |
| Total | 42 (100.0%) | 100 (100.0%) |
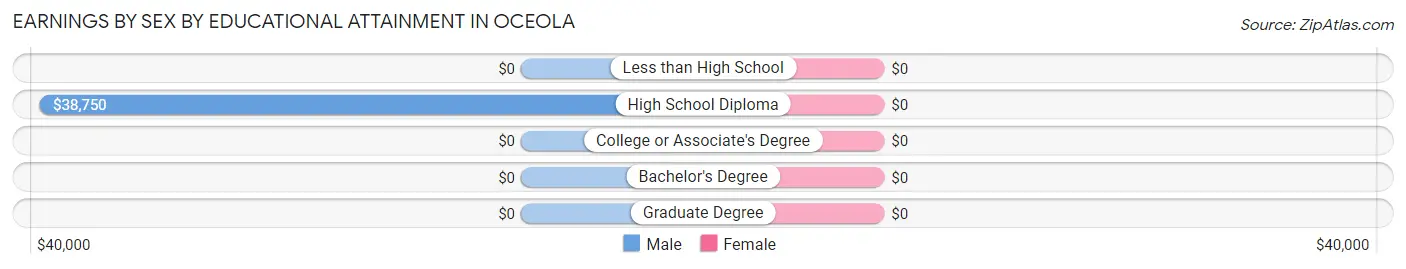
Earnings by Sex by Educational Attainment in Oceola
| Educational Attainment | Male Income | Female Income |
| Less than High School | - | - |
| High School Diploma | $38,750 | $0 |
| College or Associate's Degree | - | - |
| Bachelor's Degree | - | - |
| Graduate Degree | - | - |
| Total | $38,750 | $50,842 |
Family Income in Oceola
Family Income Brackets in Oceola
According to the Oceola family income data, there are 23 families falling into the $75,000 to $99,999 income range, which is the most common income bracket and makes up 65.7% of all families.
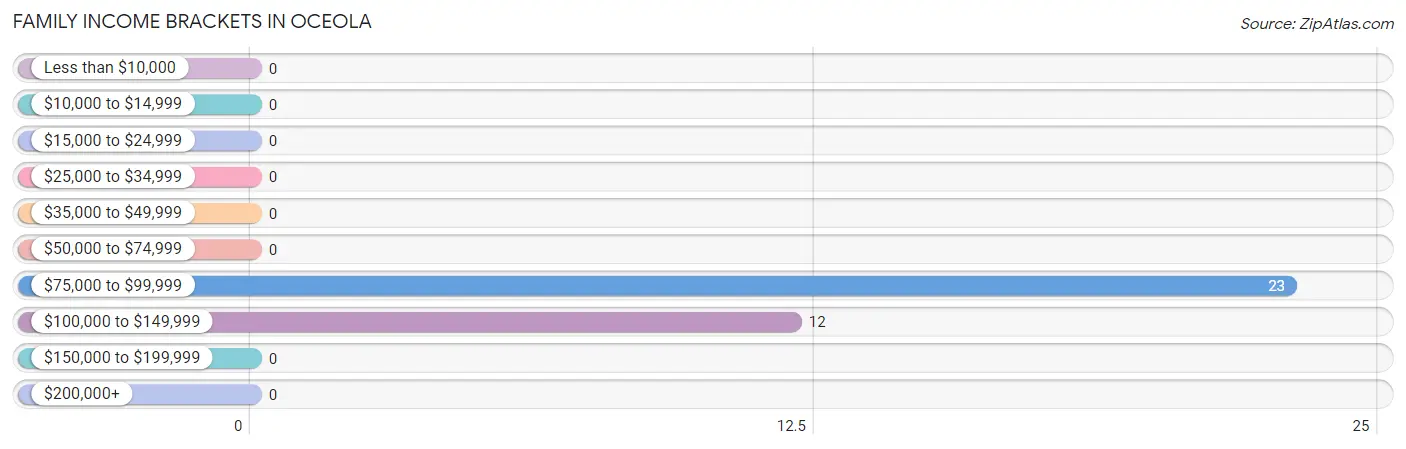
| Income Bracket | # Families | % Families |
| Less than $10,000 | 0 | 0.0% |
| $10,000 to $14,999 | 0 | 0.0% |
| $15,000 to $24,999 | 0 | 0.0% |
| $25,000 to $34,999 | 0 | 0.0% |
| $35,000 to $49,999 | 0 | 0.0% |
| $50,000 to $74,999 | 0 | 0.0% |
| $75,000 to $99,999 | 23 | 65.7% |
| $100,000 to $149,999 | 12 | 34.3% |
| $150,000 to $199,999 | 0 | 0.0% |
| $200,000+ | 0 | 0.0% |
Family Income by Famaliy Size in Oceola
| Income Bracket | # Families | Median Income |
| 2-Person Families | 0 (0.0%) | $0 |
| 3-Person Families | 10 (28.6%) | $0 |
| 4-Person Families | 12 (34.3%) | $0 |
| 5-Person Families | 13 (37.1%) | $0 |
| 6-Person Families | 0 (0.0%) | $0 |
| 7+ Person Families | 0 (0.0%) | $0 |
| Total | 35 (100.0%) | $93,942 |
Family Income by Number of Earners in Oceola
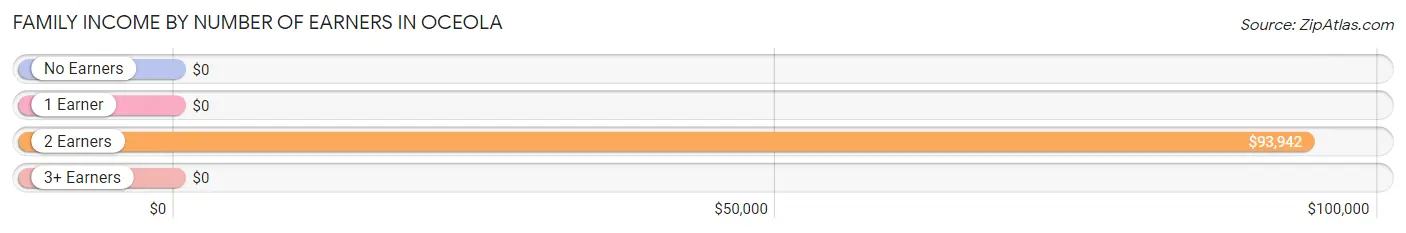
| Number of Earners | # Families | Median Income |
| No Earners | 0 (0.0%) | $0 |
| 1 Earner | 0 (0.0%) | $0 |
| 2 Earners | 35 (100.0%) | $93,942 |
| 3+ Earners | 0 (0.0%) | $0 |
| Total | 35 (100.0%) | $93,942 |
Household Income in Oceola
Household Income Brackets in Oceola
With 54 households falling in the category, the $50,000 to $74,999 income range is the most frequent in Oceola, accounting for 55.7% of all households.
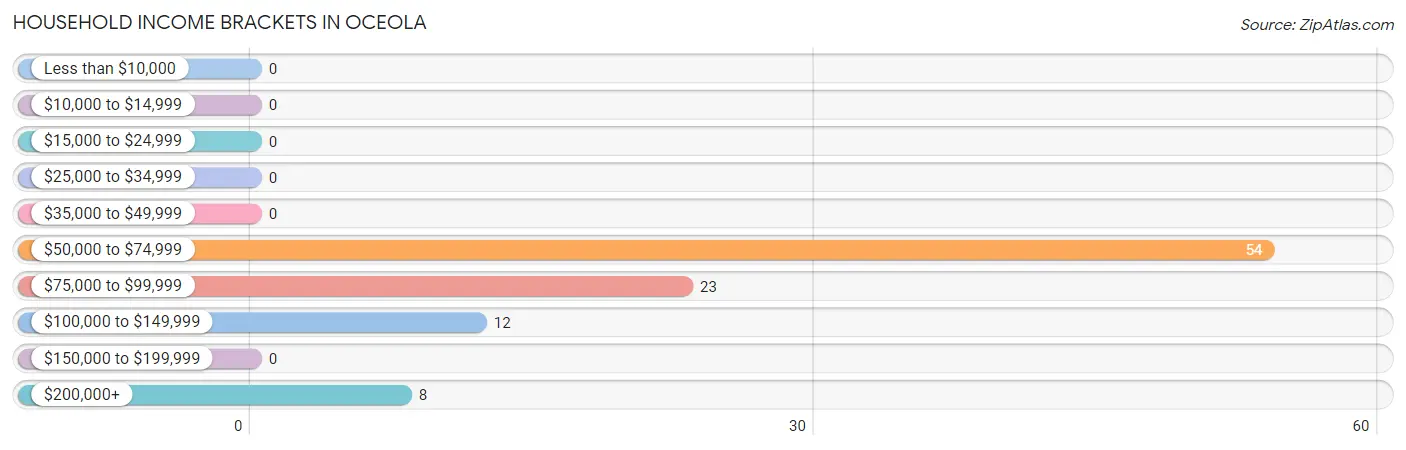
| Income Bracket | # Households | % Households |
| Less than $10,000 | 0 | 0.0% |
| $10,000 to $14,999 | 0 | 0.0% |
| $15,000 to $24,999 | 0 | 0.0% |
| $25,000 to $34,999 | 0 | 0.0% |
| $35,000 to $49,999 | 0 | 0.0% |
| $50,000 to $74,999 | 54 | 55.7% |
| $75,000 to $99,999 | 23 | 23.7% |
| $100,000 to $149,999 | 12 | 12.4% |
| $150,000 to $199,999 | 0 | 0.0% |
| $200,000+ | 8 | 8.2% |
Household Income by Householder Age in Oceola
The median household income in Oceola is $65,781, with the highest median household income of $93,173 found in the 25 to 44 years age bracket for the primary householder. A total of 43 households (44.3%) fall into this category.
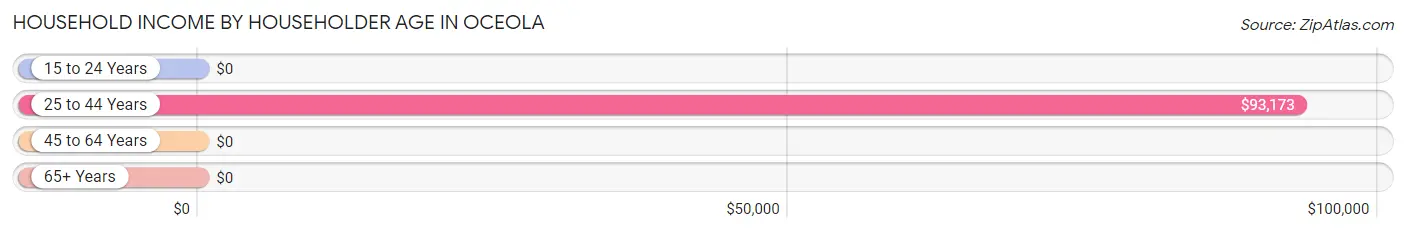
| Income Bracket | # Households | Median Income |
| 15 to 24 Years | 0 (0.0%) | $0 |
| 25 to 44 Years | 43 (44.3%) | $93,173 |
| 45 to 64 Years | 46 (47.4%) | $0 |
| 65+ Years | 8 (8.3%) | $0 |
| Total | 97 (100.0%) | $65,781 |
Poverty in Oceola
Income Below Poverty by Sex and Age in Oceola
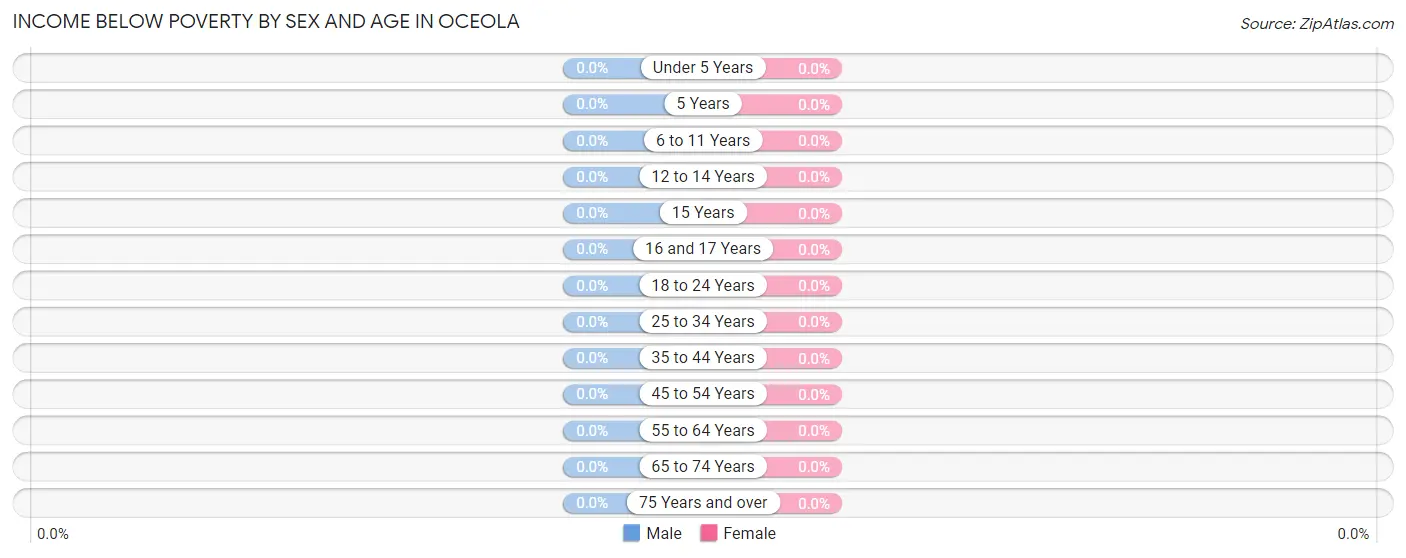
| Age Bracket | Male | Female |
| Under 5 Years | 0 (0.0%) | 0 (0.0%) |
| 5 Years | 0 (0.0%) | 0 (0.0%) |
| 6 to 11 Years | 0 (0.0%) | 0 (0.0%) |
| 12 to 14 Years | 0 (0.0%) | 0 (0.0%) |
| 15 Years | 0 (0.0%) | 0 (0.0%) |
| 16 and 17 Years | 0 (0.0%) | 0 (0.0%) |
| 18 to 24 Years | 0 (0.0%) | 0 (0.0%) |
| 25 to 34 Years | 0 (0.0%) | 0 (0.0%) |
| 35 to 44 Years | 0 (0.0%) | 0 (0.0%) |
| 45 to 54 Years | 0 (0.0%) | 0 (0.0%) |
| 55 to 64 Years | 0 (0.0%) | 0 (0.0%) |
| 65 to 74 Years | 0 (0.0%) | 0 (0.0%) |
| 75 Years and over | 0 (0.0%) | 0 (0.0%) |
| Total | 0 (0.0%) | 0 (0.0%) |
Income Above Poverty by Sex and Age in Oceola
According to the poverty statistics in Oceola, males aged 5 years and females aged under 5 years are the age groups that are most secure financially, with 100.0% of males and 100.0% of females in these age groups living above the poverty line.
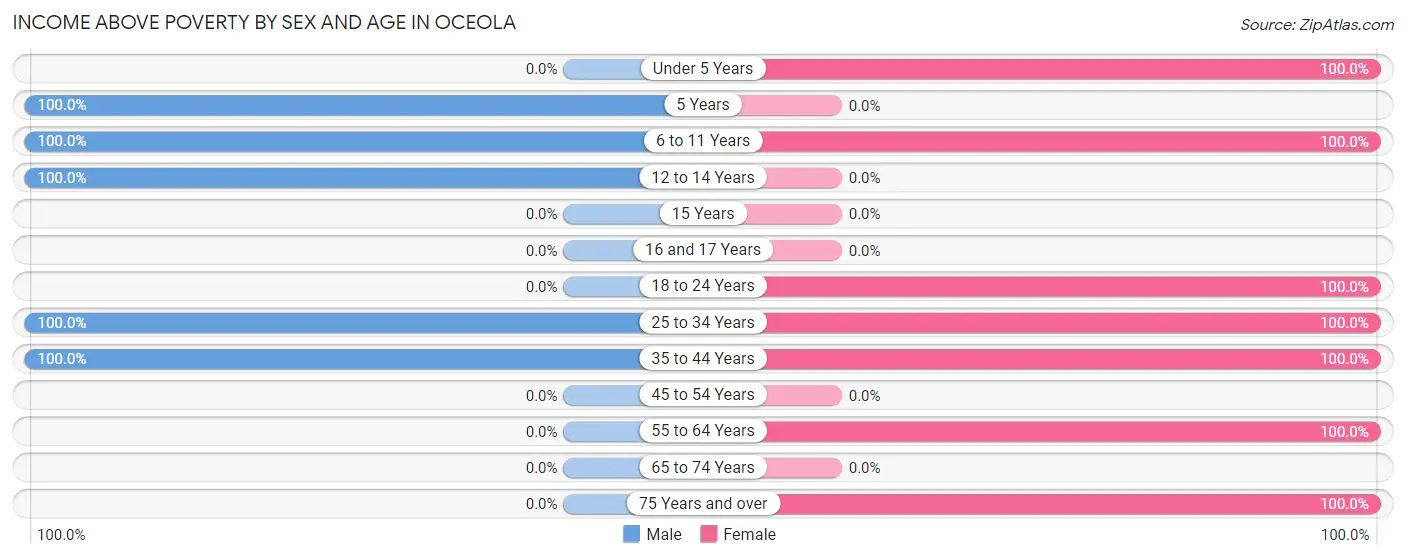
| Age Bracket | Male | Female |
| Under 5 Years | 0 (0.0%) | 21 (100.0%) |
| 5 Years | 12 (100.0%) | 0 (0.0%) |
| 6 to 11 Years | 11 (100.0%) | 10 (100.0%) |
| 12 to 14 Years | 10 (100.0%) | 0 (0.0%) |
| 15 Years | 0 (0.0%) | 0 (0.0%) |
| 16 and 17 Years | 0 (0.0%) | 0 (0.0%) |
| 18 to 24 Years | 0 (0.0%) | 15 (100.0%) |
| 25 to 34 Years | 29 (100.0%) | 27 (100.0%) |
| 35 to 44 Years | 13 (100.0%) | 12 (100.0%) |
| 45 to 54 Years | 0 (0.0%) | 0 (0.0%) |
| 55 to 64 Years | 0 (0.0%) | 46 (100.0%) |
| 65 to 74 Years | 0 (0.0%) | 0 (0.0%) |
| 75 Years and over | 0 (0.0%) | 8 (100.0%) |
| Total | 75 (100.0%) | 139 (100.0%) |
Income Below Poverty Among Married-Couple Families in Oceola
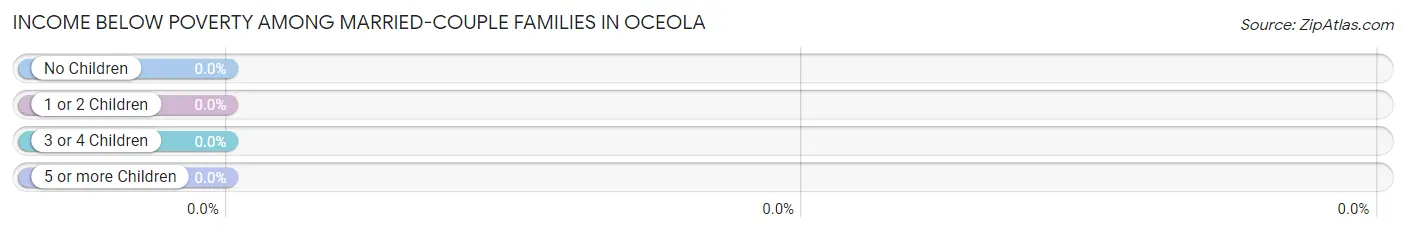
| Children | Above Poverty | Below Poverty |
| No Children | 0 (0.0%) | 0 (0.0%) |
| 1 or 2 Children | 22 (100.0%) | 0 (0.0%) |
| 3 or 4 Children | 13 (100.0%) | 0 (0.0%) |
| 5 or more Children | 0 (0.0%) | 0 (0.0%) |
| Total | 35 (100.0%) | 0 (0.0%) |
Income Below Poverty Among Single-Parent Households in Oceola
| Children | Single Father | Single Mother |
| No Children | 0 (0.0%) | 0 (0.0%) |
| 1 or 2 Children | 0 (0.0%) | 0 (0.0%) |
| 3 or 4 Children | 0 (0.0%) | 0 (0.0%) |
| 5 or more Children | 0 (0.0%) | 0 (0.0%) |
| Total | 0 (0.0%) | 0 (0.0%) |
Income Below Poverty Among Married-Couple vs Single-Parent Households in Oceola
| Children | Married-Couple Families | Single-Parent Households |
| No Children | 0 (0.0%) | 0 (0.0%) |
| 1 or 2 Children | 0 (0.0%) | 0 (0.0%) |
| 3 or 4 Children | 0 (0.0%) | 0 (0.0%) |
| 5 or more Children | 0 (0.0%) | 0 (0.0%) |
| Total | 0 (0.0%) | 0 (0.0%) |
Race in Oceola
The most populous races in Oceola are , and White / Caucasian (237 | 100.0%).
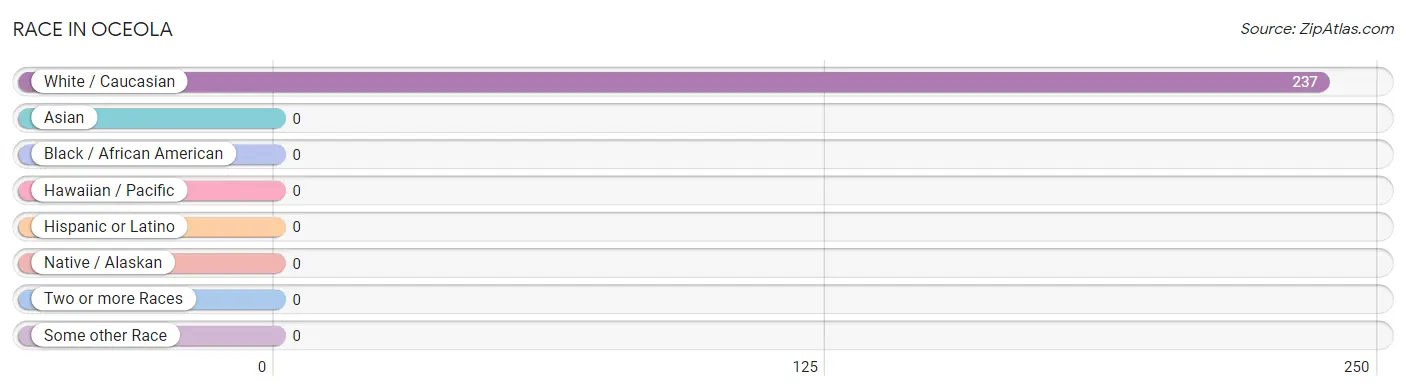
| Race | # Population | % Population |
| Asian | 0 | 0.0% |
| Black / African American | 0 | 0.0% |
| Hawaiian / Pacific | 0 | 0.0% |
| Hispanic or Latino | 0 | 0.0% |
| Native / Alaskan | 0 | 0.0% |
| White / Caucasian | 237 | 100.0% |
| Two or more Races | 0 | 0.0% |
| Some other Race | 0 | 0.0% |
| Total | 237 | 100.0% |
Ancestry in Oceola
The most populous ancestries reported in Oceola are German (105 | 44.3%), and American (68 | 28.7%), together accounting for 73.0% of all Oceola residents.
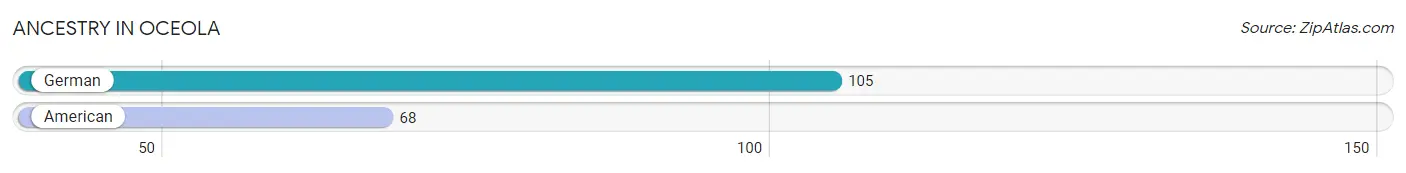
| Ancestry | # Population | % Population |
| American | 68 | 28.7% |
| German | 105 | 44.3% | View All 2 Rows |
Immigrants in Oceola

| Immigration Origin | # Population | % Population | View All 0 Rows |
Sex and Age in Oceola
Sex and Age in Oceola
The most populous age groups in Oceola are 5 to 9 Years (23 | 30.7%) for men and 55 to 59 Years (46 | 28.4%) for women.
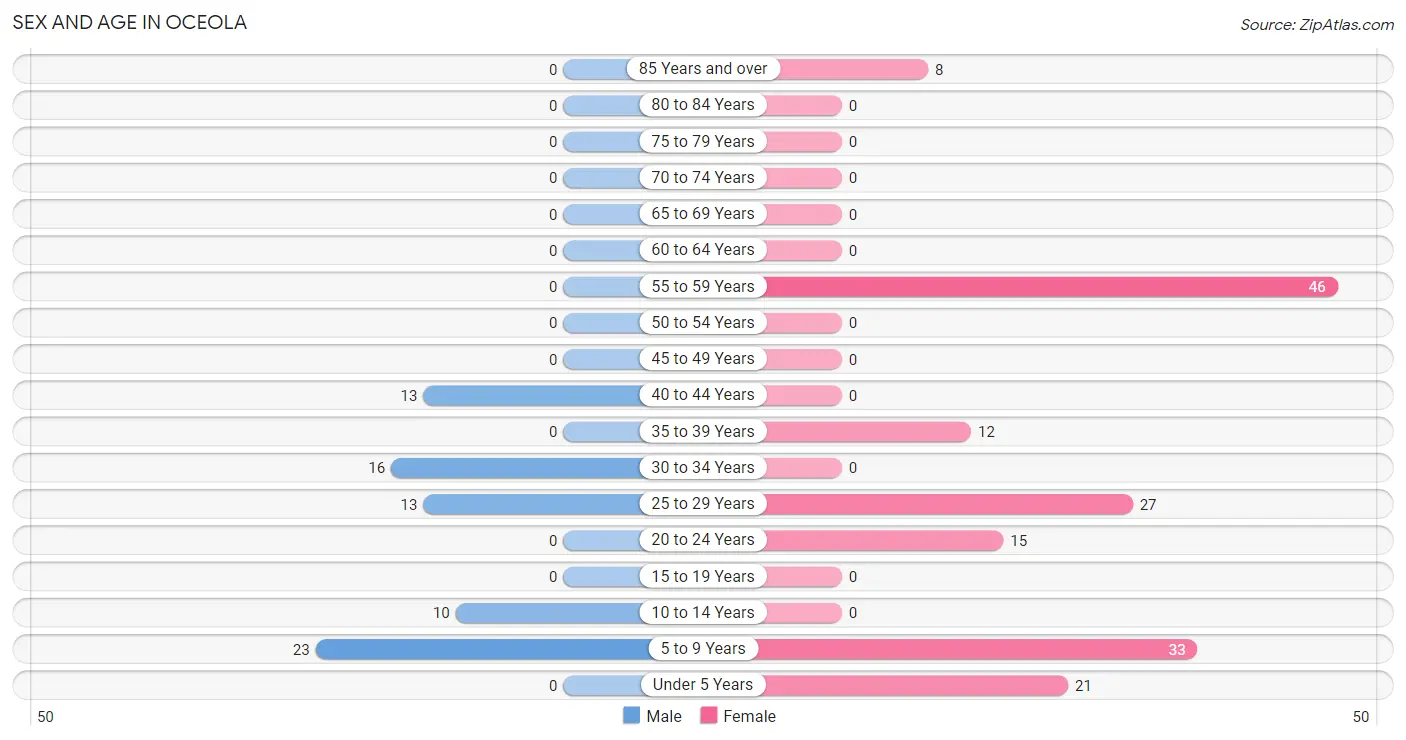
| Age Bracket | Male | Female |
| Under 5 Years | 0 (0.0%) | 21 (13.0%) |
| 5 to 9 Years | 23 (30.7%) | 33 (20.4%) |
| 10 to 14 Years | 10 (13.3%) | 0 (0.0%) |
| 15 to 19 Years | 0 (0.0%) | 0 (0.0%) |
| 20 to 24 Years | 0 (0.0%) | 15 (9.3%) |
| 25 to 29 Years | 13 (17.3%) | 27 (16.7%) |
| 30 to 34 Years | 16 (21.3%) | 0 (0.0%) |
| 35 to 39 Years | 0 (0.0%) | 12 (7.4%) |
| 40 to 44 Years | 13 (17.3%) | 0 (0.0%) |
| 45 to 49 Years | 0 (0.0%) | 0 (0.0%) |
| 50 to 54 Years | 0 (0.0%) | 0 (0.0%) |
| 55 to 59 Years | 0 (0.0%) | 46 (28.4%) |
| 60 to 64 Years | 0 (0.0%) | 0 (0.0%) |
| 65 to 69 Years | 0 (0.0%) | 0 (0.0%) |
| 70 to 74 Years | 0 (0.0%) | 0 (0.0%) |
| 75 to 79 Years | 0 (0.0%) | 0 (0.0%) |
| 80 to 84 Years | 0 (0.0%) | 0 (0.0%) |
| 85 Years and over | 0 (0.0%) | 8 (4.9%) |
| Total | 75 (100.0%) | 162 (100.0%) |
Families and Households in Oceola
Median Family Size in Oceola
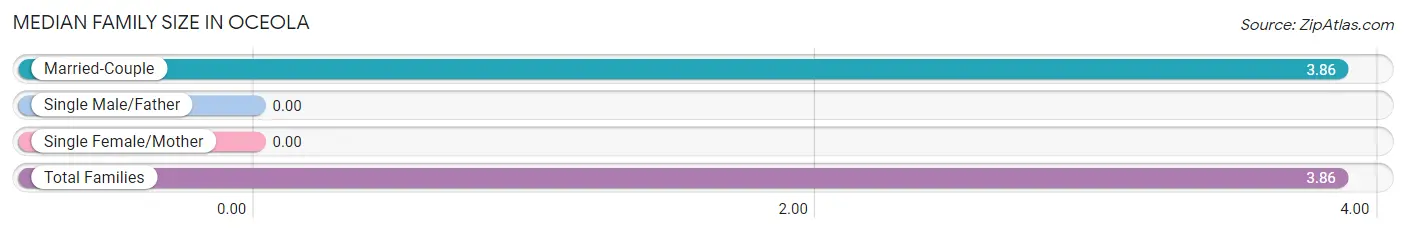
| Family Type | # Families | Family Size |
| Married-Couple | 35 (100.0%) | 3.86 |
| Single Male/Father | 0 (0.0%) | - |
| Single Female/Mother | 0 (0.0%) | - |
| Total Families | 35 (100.0%) | 3.86 |
Median Household Size in Oceola
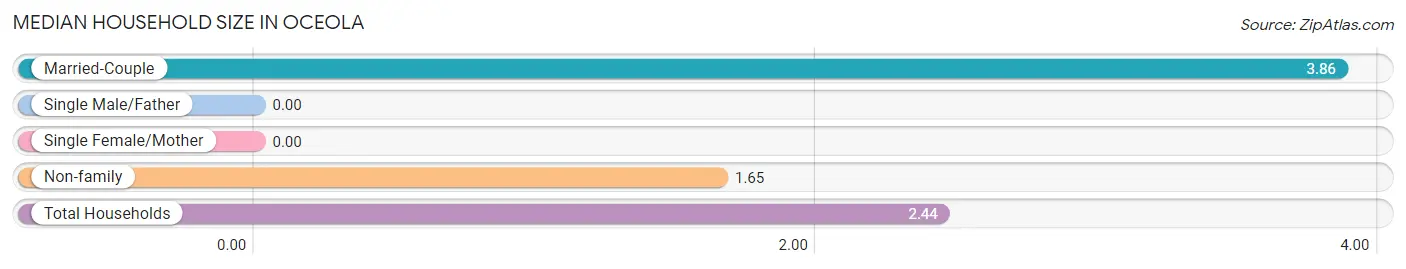
| Household Type | # Households | Household Size |
| Married-Couple | 35 (36.1%) | 3.86 |
| Single Male/Father | 0 (0.0%) | - |
| Single Female/Mother | 0 (0.0%) | - |
| Non-family | 62 (63.9%) | 1.65 |
| Total Households | 97 (100.0%) | 2.44 |
Household Size by Marriage Status in Oceola
Out of a total of 97 households in Oceola, 35 (36.1%) are family households, while 62 (63.9%) are nonfamily households. The most numerous type of family households are 5-person households, comprising 13, and the most common type of nonfamily households are 1-person households, comprising 54.
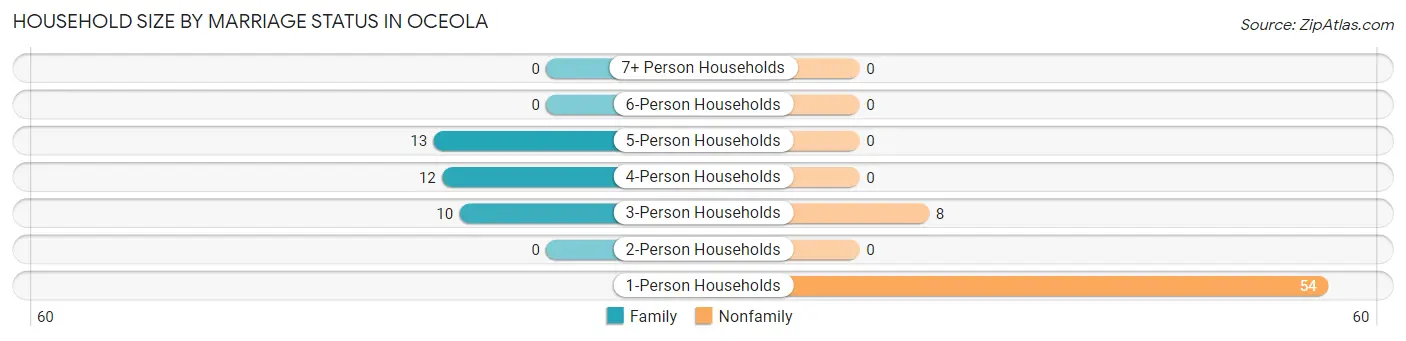
| Household Size | Family Households | Nonfamily Households |
| 1-Person Households | - | 54 (55.7%) |
| 2-Person Households | 0 (0.0%) | 0 (0.0%) |
| 3-Person Households | 10 (10.3%) | 8 (8.3%) |
| 4-Person Households | 12 (12.4%) | 0 (0.0%) |
| 5-Person Households | 13 (13.4%) | 0 (0.0%) |
| 6-Person Households | 0 (0.0%) | 0 (0.0%) |
| 7+ Person Households | 0 (0.0%) | 0 (0.0%) |
| Total | 35 (36.1%) | 62 (63.9%) |
Female Fertility in Oceola
Fertility by Age in Oceola
| Age Bracket | Women with Births | Births / 1,000 Women |
| 15 to 19 years | 0 (0.0%) | 0.0 |
| 20 to 34 years | 0 (0.0%) | 0.0 |
| 35 to 50 years | 0 (0.0%) | 0.0 |
| Total | 0 (0.0%) | 0.0 |
Fertility by Age by Marriage Status in Oceola
| Age Bracket | Married | Unmarried |
| 15 to 19 years | 0 (0.0%) | 0 (0.0%) |
| 20 to 34 years | 0 (0.0%) | 0 (0.0%) |
| 35 to 50 years | 0 (0.0%) | 0 (0.0%) |
| Total | 0 (0.0%) | 0 (0.0%) |
Fertility by Education in Oceola
| Educational Attainment | Women with Births | Births / 1,000 Women |
| Less than High School | 0 (0.0%) | 0.0 |
| High School Diploma | 0 (0.0%) | 0.0 |
| College or Associate's Degree | 0 (0.0%) | 0.0 |
| Bachelor's Degree | 0 (0.0%) | 0.0 |
| Graduate Degree | 0 (0.0%) | 0.0 |
| Total | 0 (0.0%) | 0.0 |
Fertility by Education by Marriage Status in Oceola
| Educational Attainment | Married | Unmarried |
| Less than High School | 0 (0.0%) | 0 (0.0%) |
| High School Diploma | 0 (0.0%) | 0 (0.0%) |
| College or Associate's Degree | 0 (0.0%) | 0 (0.0%) |
| Bachelor's Degree | 0 (0.0%) | 0 (0.0%) |
| Graduate Degree | 0 (0.0%) | 0 (0.0%) |
| Total | 0 (0.0%) | 0 (0.0%) |
Employment Characteristics in Oceola
Employment by Class of Employer in Oceola
Among the 142 employed individuals in Oceola, private company employees (124 | 87.3%), not-for-profit organizations (10 | 7.0%), and local government employees (8 | 5.6%) make up the most common classes of employment.
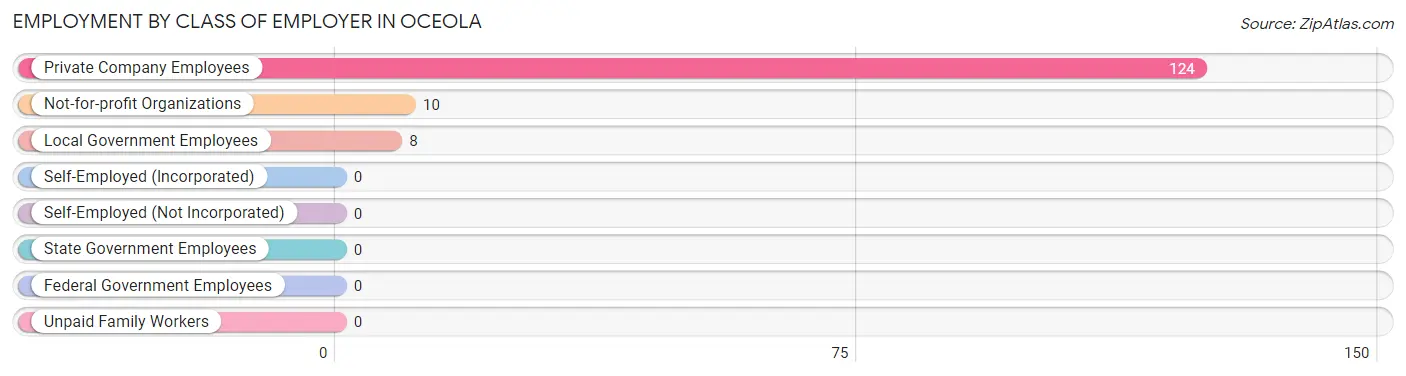
| Employer Class | # Employees | % Employees |
| Private Company Employees | 124 | 87.3% |
| Self-Employed (Incorporated) | 0 | 0.0% |
| Self-Employed (Not Incorporated) | 0 | 0.0% |
| Not-for-profit Organizations | 10 | 7.0% |
| Local Government Employees | 8 | 5.6% |
| State Government Employees | 0 | 0.0% |
| Federal Government Employees | 0 | 0.0% |
| Unpaid Family Workers | 0 | 0.0% |
| Total | 142 | 100.0% |
Employment Status by Age in Oceola
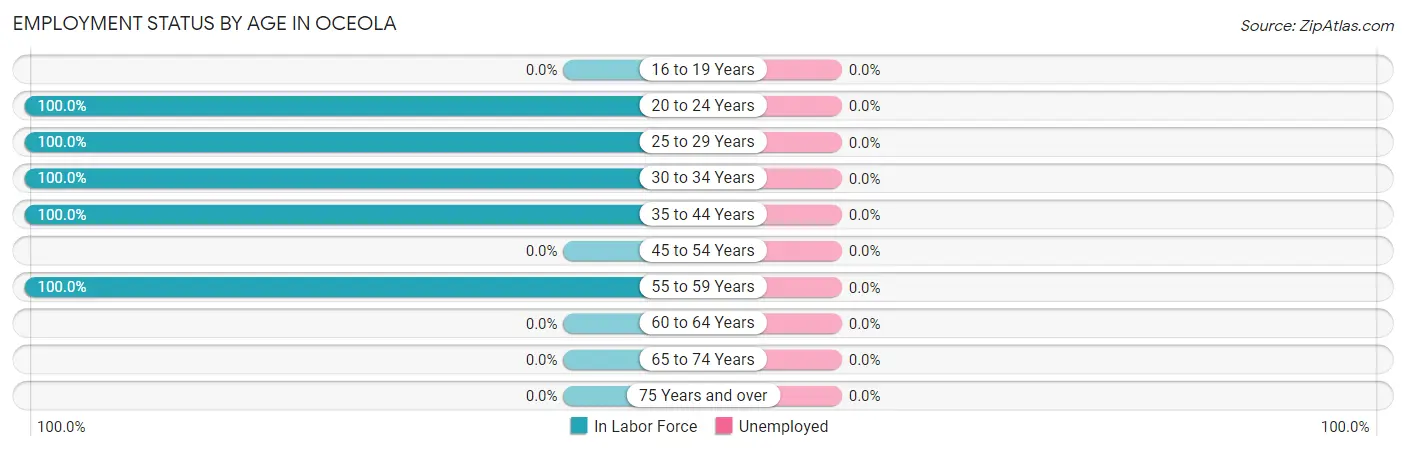
| Age Bracket | In Labor Force | Unemployed |
| 16 to 19 Years | 0 (0.0%) | 0 (0.0%) |
| 20 to 24 Years | 15 (100.0%) | 0 (0.0%) |
| 25 to 29 Years | 40 (100.0%) | 0 (0.0%) |
| 30 to 34 Years | 16 (100.0%) | 0 (0.0%) |
| 35 to 44 Years | 25 (100.0%) | 0 (0.0%) |
| 45 to 54 Years | 0 (0.0%) | 0 (0.0%) |
| 55 to 59 Years | 46 (100.0%) | 0 (0.0%) |
| 60 to 64 Years | 0 (0.0%) | 0 (0.0%) |
| 65 to 74 Years | 0 (0.0%) | 0 (0.0%) |
| 75 Years and over | 0 (0.0%) | 0 (0.0%) |
| Total | 142 (94.7%) | 0 (0.0%) |
Employment Status by Educational Attainment in Oceola
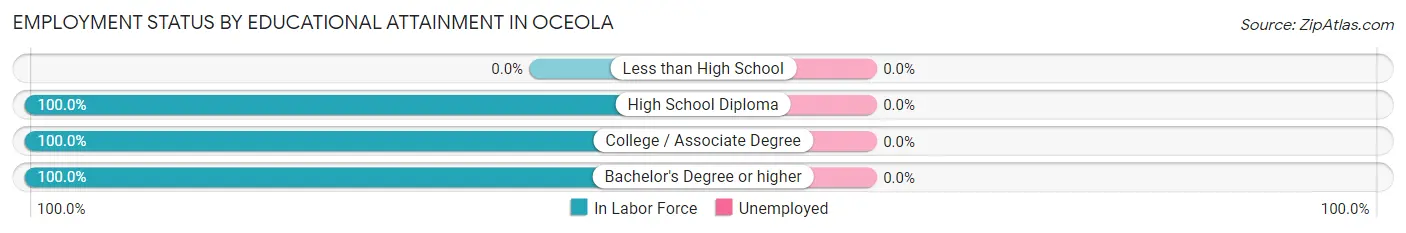
| Educational Attainment | In Labor Force | Unemployed |
| Less than High School | 0 (0.0%) | 0 (0.0%) |
| High School Diploma | 88 (100.0%) | 0 (0.0%) |
| College / Associate Degree | 27 (100.0%) | 0 (0.0%) |
| Bachelor's Degree or higher | 12 (100.0%) | 0 (0.0%) |
| Total | 127 (100.0%) | 0 (0.0%) |
Employment Occupations by Sex in Oceola
Management, Business, Science and Arts Occupations
The most common Management, Business, Science and Arts occupations in Oceola are Health Diagnosing & Treating (22 | 15.5%), Health Technologists (22 | 15.5%), and Management (13 | 9.1%).
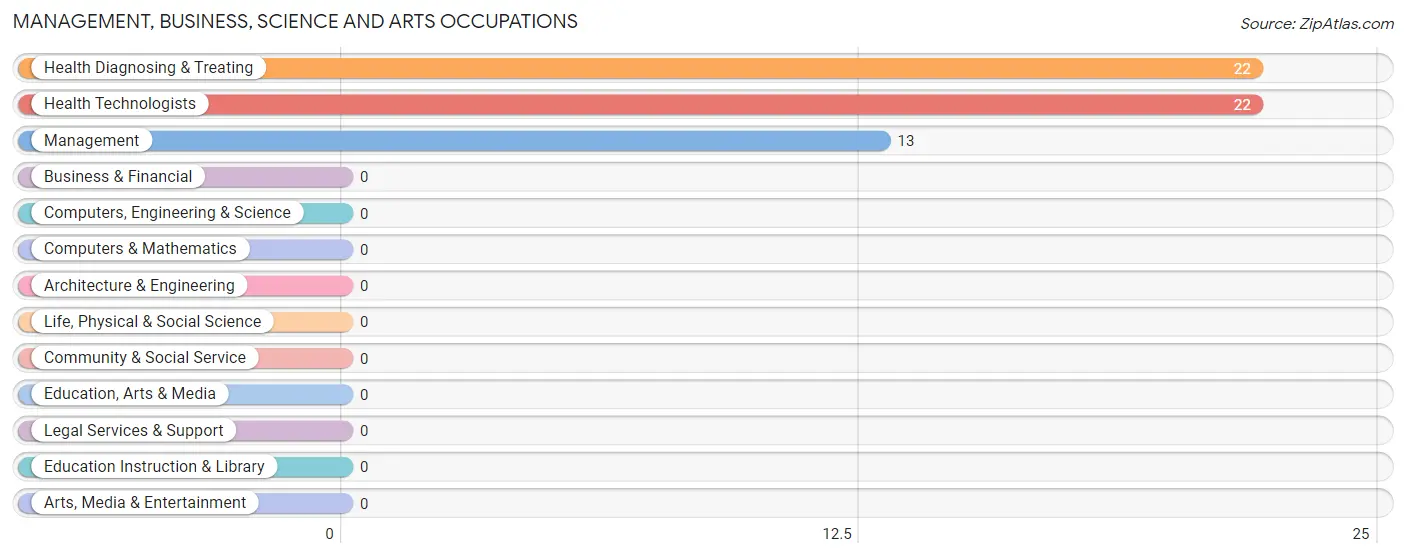
Management, Business, Science and Arts Occupations by Sex
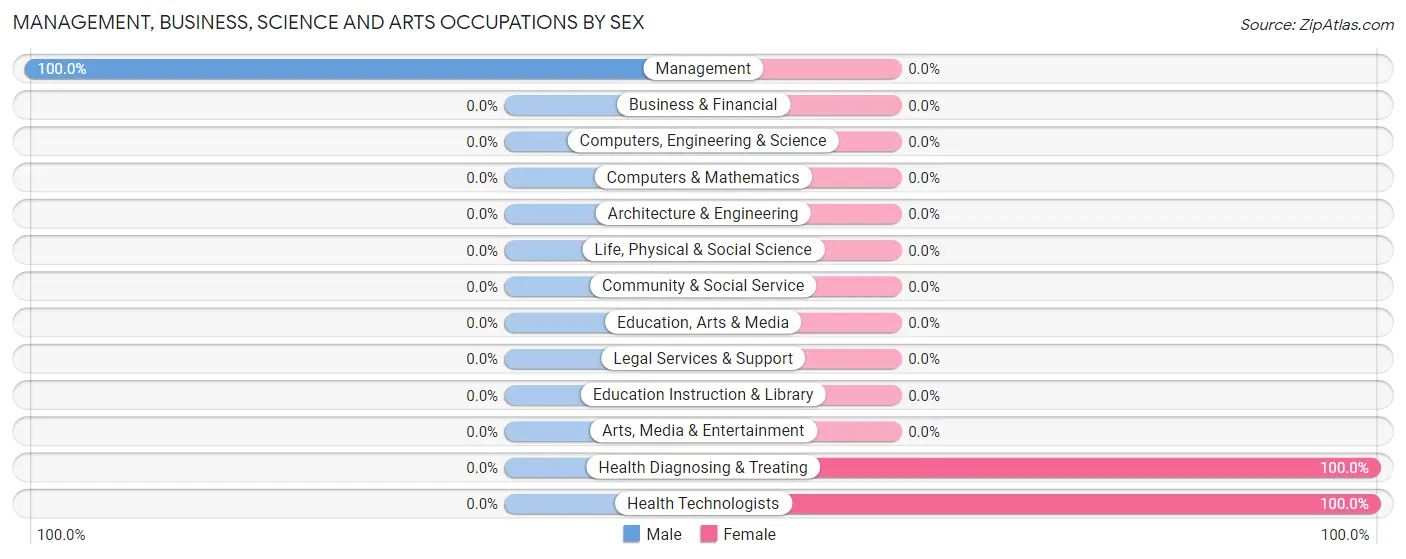
| Occupation | Male | Female |
| Management | 13 (100.0%) | 0 (0.0%) |
| Business & Financial | 0 (0.0%) | 0 (0.0%) |
| Computers, Engineering & Science | 0 (0.0%) | 0 (0.0%) |
| Computers & Mathematics | 0 (0.0%) | 0 (0.0%) |
| Architecture & Engineering | 0 (0.0%) | 0 (0.0%) |
| Life, Physical & Social Science | 0 (0.0%) | 0 (0.0%) |
| Community & Social Service | 0 (0.0%) | 0 (0.0%) |
| Education, Arts & Media | 0 (0.0%) | 0 (0.0%) |
| Legal Services & Support | 0 (0.0%) | 0 (0.0%) |
| Education Instruction & Library | 0 (0.0%) | 0 (0.0%) |
| Arts, Media & Entertainment | 0 (0.0%) | 0 (0.0%) |
| Health Diagnosing & Treating | 0 (0.0%) | 22 (100.0%) |
| Health Technologists | 0 (0.0%) | 22 (100.0%) |
| Total (Category) | 13 (37.1%) | 22 (62.9%) |
| Total (Overall) | 42 (29.6%) | 100 (70.4%) |
Services Occupations
The most common Services occupations in Oceola are Security & Protection (8 | 5.6%), and Law Enforcement (8 | 5.6%).
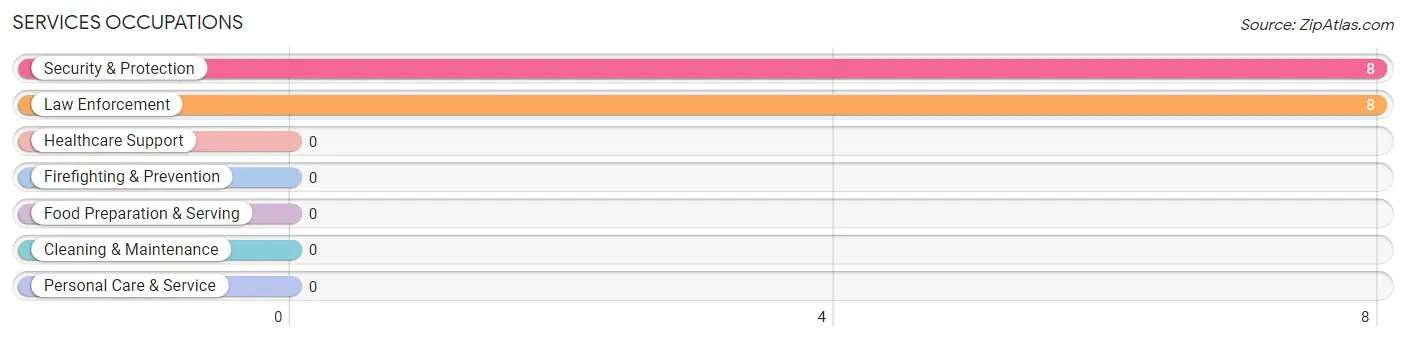
Services Occupations by Sex
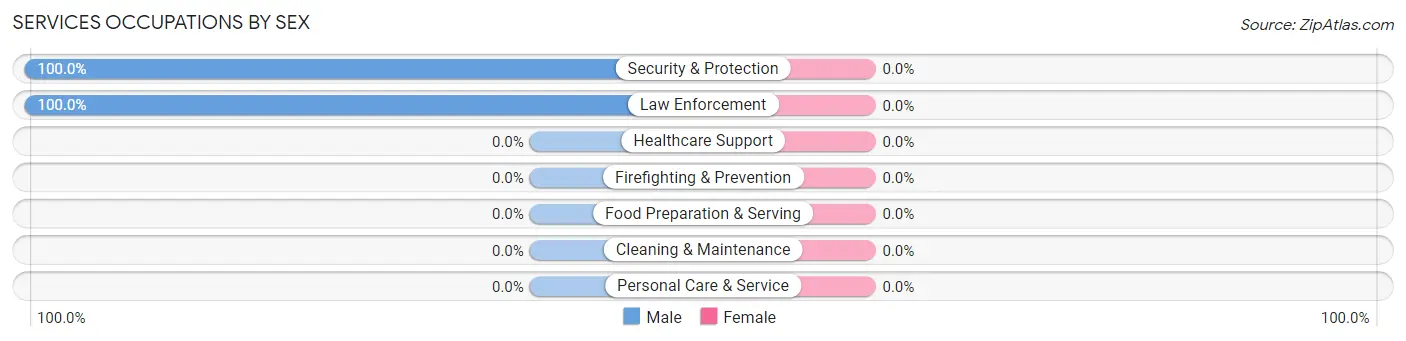
| Occupation | Male | Female |
| Healthcare Support | 0 (0.0%) | 0 (0.0%) |
| Security & Protection | 8 (100.0%) | 0 (0.0%) |
| Firefighting & Prevention | 0 (0.0%) | 0 (0.0%) |
| Law Enforcement | 8 (100.0%) | 0 (0.0%) |
| Food Preparation & Serving | 0 (0.0%) | 0 (0.0%) |
| Cleaning & Maintenance | 0 (0.0%) | 0 (0.0%) |
| Personal Care & Service | 0 (0.0%) | 0 (0.0%) |
| Total (Category) | 8 (100.0%) | 0 (0.0%) |
| Total (Overall) | 42 (29.6%) | 100 (70.4%) |
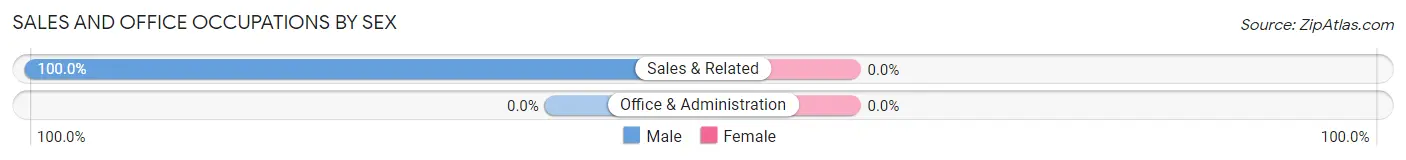
Sales and Office Occupations
The most common Sales and Office occupations in Oceola are , and Sales & Related (8 | 5.6%).
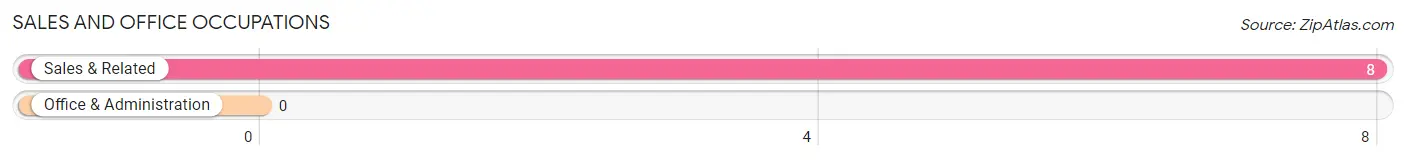
Sales and Office Occupations by Sex
| Occupation | Male | Female |
| Sales & Related | 8 (100.0%) | 0 (0.0%) |
| Office & Administration | 0 (0.0%) | 0 (0.0%) |
| Total (Category) | 8 (100.0%) | 0 (0.0%) |
| Total (Overall) | 42 (29.6%) | 100 (70.4%) |
Natural Resources, Construction and Maintenance Occupations
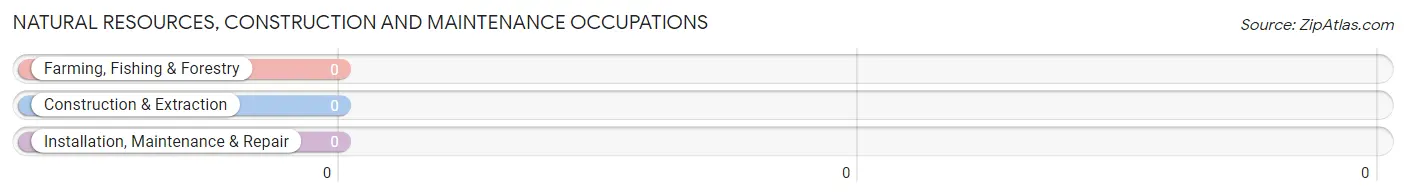
Natural Resources, Construction and Maintenance Occupations by Sex
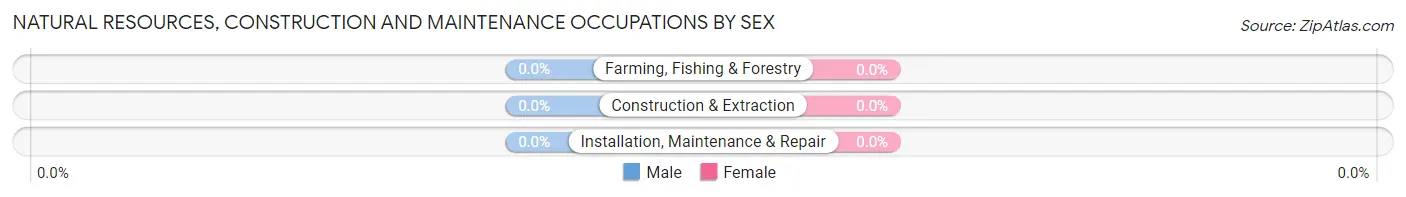
| Occupation | Male | Female |
| Farming, Fishing & Forestry | 0 (0.0%) | 0 (0.0%) |
| Construction & Extraction | 0 (0.0%) | 0 (0.0%) |
| Installation, Maintenance & Repair | 0 (0.0%) | 0 (0.0%) |
| Total (Category) | 0 (0.0%) | 0 (0.0%) |
| Total (Overall) | 42 (29.6%) | 100 (70.4%) |
Production, Transportation and Moving Occupations
The most common Production, Transportation and Moving occupations in Oceola are Production (63 | 44.4%), Material Moving (15 | 10.6%), and Transportation (13 | 9.1%).
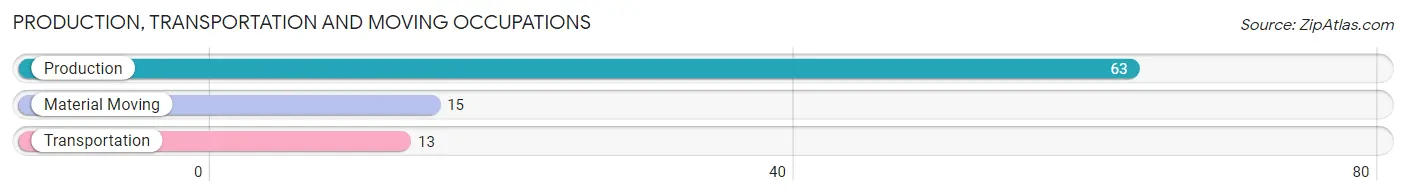
Production, Transportation and Moving Occupations by Sex
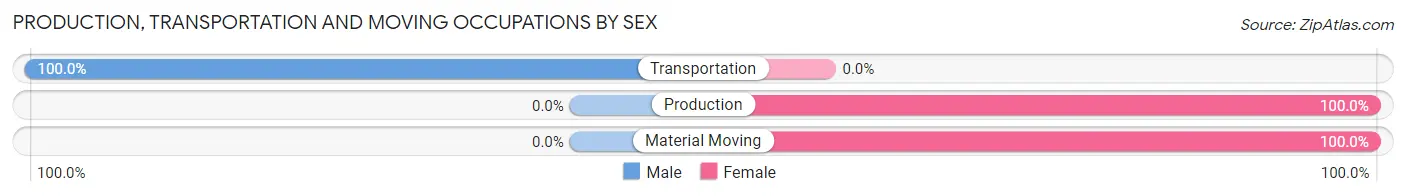
| Occupation | Male | Female |
| Production | 0 (0.0%) | 63 (100.0%) |
| Transportation | 13 (100.0%) | 0 (0.0%) |
| Material Moving | 0 (0.0%) | 15 (100.0%) |
| Total (Category) | 13 (14.3%) | 78 (85.7%) |
| Total (Overall) | 42 (29.6%) | 100 (70.4%) |
Employment Industries by Sex in Oceola
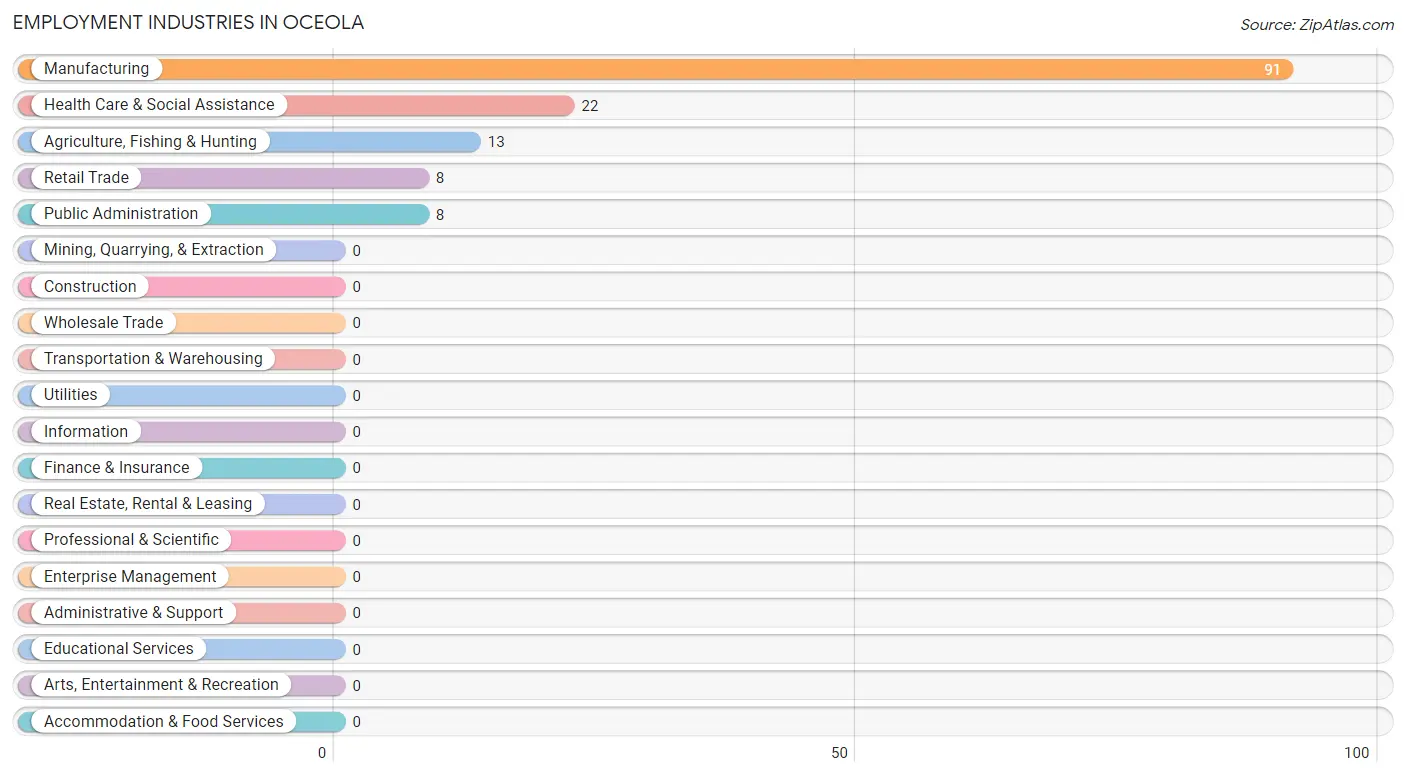
Employment Industries in Oceola
The major employment industries in Oceola include Manufacturing (91 | 64.1%), Health Care & Social Assistance (22 | 15.5%), Agriculture, Fishing & Hunting (13 | 9.1%), Retail Trade (8 | 5.6%), and Public Administration (8 | 5.6%).
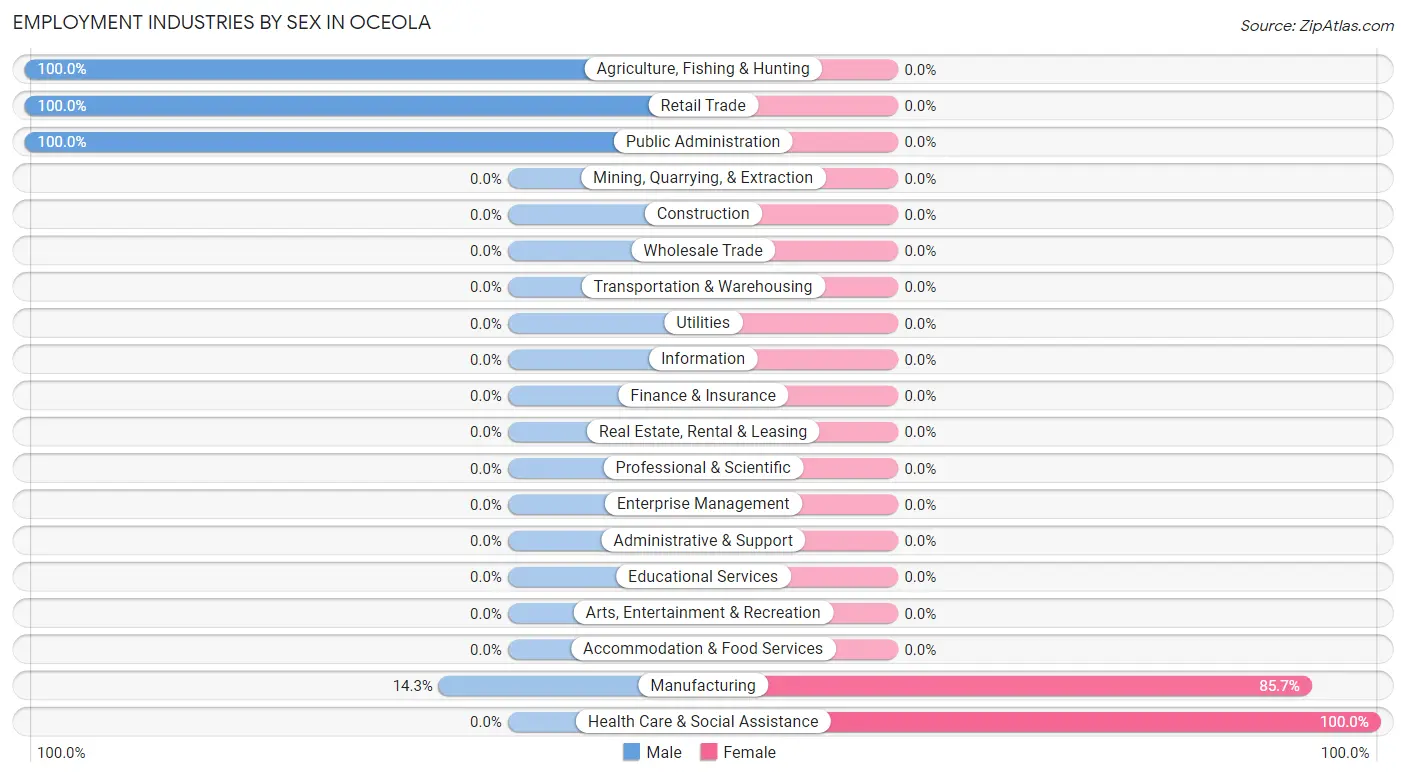
Employment Industries by Sex in Oceola
The Oceola industries that see more men than women are Agriculture, Fishing & Hunting (100.0%), Retail Trade (100.0%), and Public Administration (100.0%), whereas the industries that tend to have a higher number of women are Health Care & Social Assistance (100.0%), and Manufacturing (85.7%).
| Industry | Male | Female |
| Agriculture, Fishing & Hunting | 13 (100.0%) | 0 (0.0%) |
| Mining, Quarrying, & Extraction | 0 (0.0%) | 0 (0.0%) |
| Construction | 0 (0.0%) | 0 (0.0%) |
| Manufacturing | 13 (14.3%) | 78 (85.7%) |
| Wholesale Trade | 0 (0.0%) | 0 (0.0%) |
| Retail Trade | 8 (100.0%) | 0 (0.0%) |
| Transportation & Warehousing | 0 (0.0%) | 0 (0.0%) |
| Utilities | 0 (0.0%) | 0 (0.0%) |
| Information | 0 (0.0%) | 0 (0.0%) |
| Finance & Insurance | 0 (0.0%) | 0 (0.0%) |
| Real Estate, Rental & Leasing | 0 (0.0%) | 0 (0.0%) |
| Professional & Scientific | 0 (0.0%) | 0 (0.0%) |
| Enterprise Management | 0 (0.0%) | 0 (0.0%) |
| Administrative & Support | 0 (0.0%) | 0 (0.0%) |
| Educational Services | 0 (0.0%) | 0 (0.0%) |
| Health Care & Social Assistance | 0 (0.0%) | 22 (100.0%) |
| Arts, Entertainment & Recreation | 0 (0.0%) | 0 (0.0%) |
| Accommodation & Food Services | 0 (0.0%) | 0 (0.0%) |
| Public Administration | 8 (100.0%) | 0 (0.0%) |
| Total | 42 (29.6%) | 100 (70.4%) |
Education in Oceola
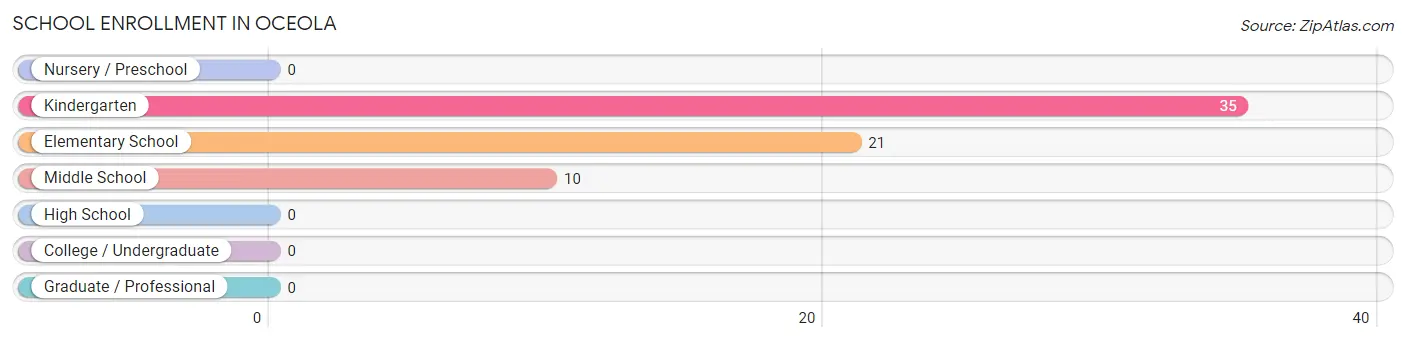
School Enrollment in Oceola
The most common levels of schooling among the 66 students in Oceola are kindergarten (35 | 53.0%), elementary school (21 | 31.8%), and middle school (10 | 15.1%).
| School Level | # Students | % Students |
| Nursery / Preschool | 0 | 0.0% |
| Kindergarten | 35 | 53.0% |
| Elementary School | 21 | 31.8% |
| Middle School | 10 | 15.1% |
| High School | 0 | 0.0% |
| College / Undergraduate | 0 | 0.0% |
| Graduate / Professional | 0 | 0.0% |
| Total | 66 | 100.0% |
School Enrollment by Age by Funding Source in Oceola
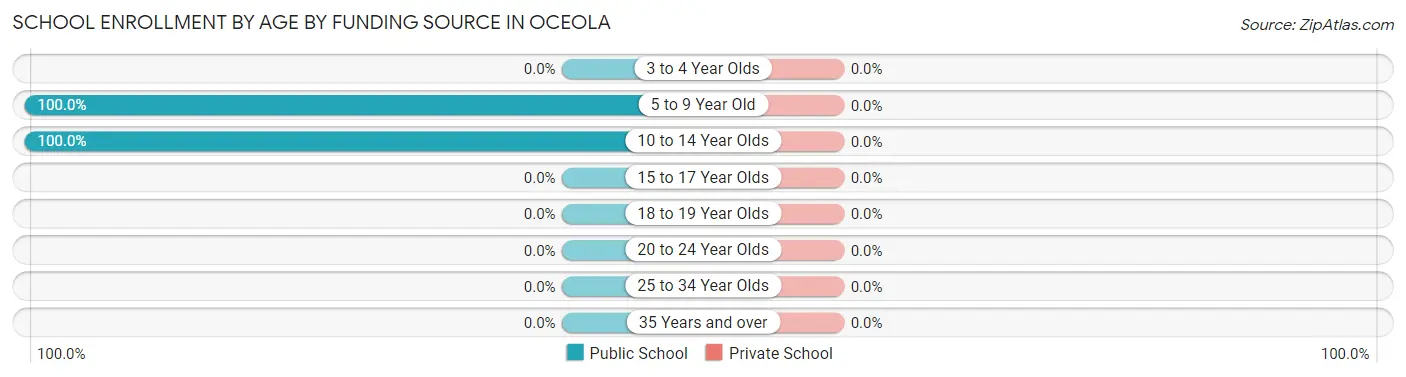
| Age Bracket | Public School | Private School |
| 3 to 4 Year Olds | 0 (0.0%) | 0 (0.0%) |
| 5 to 9 Year Old | 56 (100.0%) | 0 (0.0%) |
| 10 to 14 Year Olds | 10 (100.0%) | 0 (0.0%) |
| 15 to 17 Year Olds | 0 (0.0%) | 0 (0.0%) |
| 18 to 19 Year Olds | 0 (0.0%) | 0 (0.0%) |
| 20 to 24 Year Olds | 0 (0.0%) | 0 (0.0%) |
| 25 to 34 Year Olds | 0 (0.0%) | 0 (0.0%) |
| 35 Years and over | 0 (0.0%) | 0 (0.0%) |
| Total | 66 (100.0%) | 0 (0.0%) |
Educational Attainment by Field of Study in Oceola
, and science & technology (12 | 100.0%) are the most common fields of study among 12 individuals in Oceola who have obtained a bachelor's degree or higher.
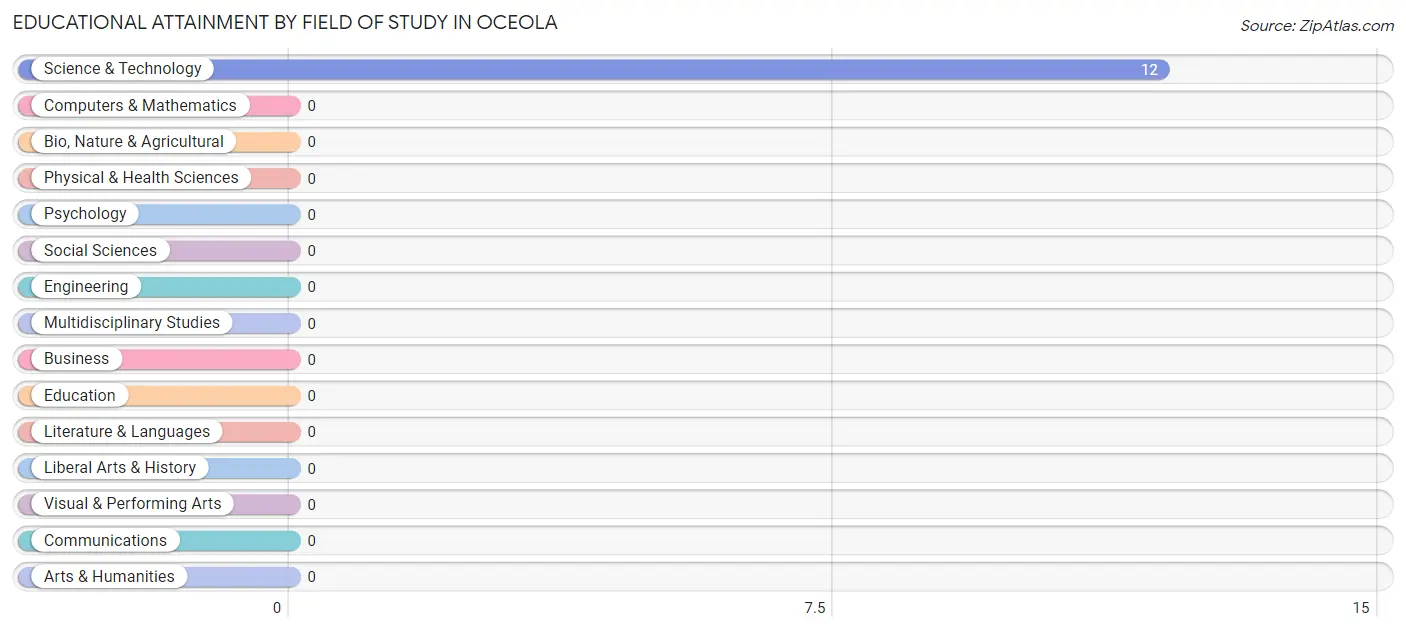
| Field of Study | # Graduates | % Graduates |
| Computers & Mathematics | 0 | 0.0% |
| Bio, Nature & Agricultural | 0 | 0.0% |
| Physical & Health Sciences | 0 | 0.0% |
| Psychology | 0 | 0.0% |
| Social Sciences | 0 | 0.0% |
| Engineering | 0 | 0.0% |
| Multidisciplinary Studies | 0 | 0.0% |
| Science & Technology | 12 | 100.0% |
| Business | 0 | 0.0% |
| Education | 0 | 0.0% |
| Literature & Languages | 0 | 0.0% |
| Liberal Arts & History | 0 | 0.0% |
| Visual & Performing Arts | 0 | 0.0% |
| Communications | 0 | 0.0% |
| Arts & Humanities | 0 | 0.0% |
| Total | 12 | 100.0% |
Transportation & Commute in Oceola
Vehicle Availability by Sex in Oceola
The most prevalent vehicle ownership categories in Oceola are males with 2 vehicles (29, accounting for 69.1%) and females with 2 vehicles (42, making up 29.0%).
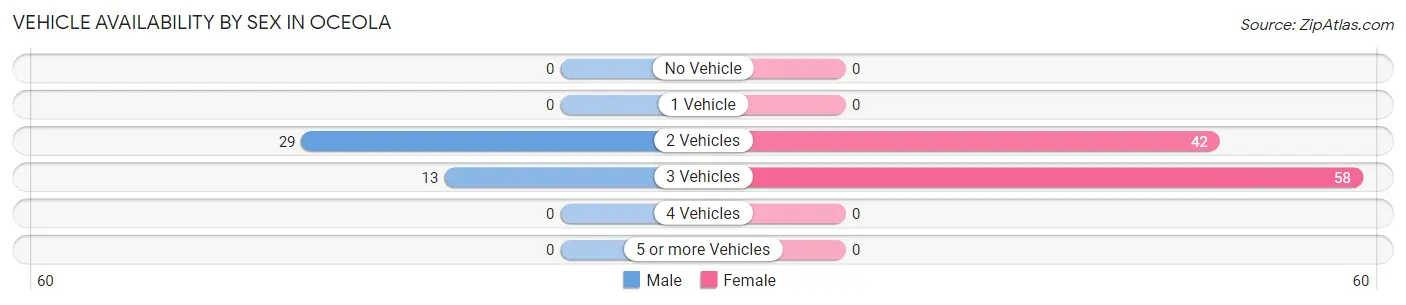
| Vehicles Available | Male | Female |
| No Vehicle | 0 (0.0%) | 0 (0.0%) |
| 1 Vehicle | 0 (0.0%) | 0 (0.0%) |
| 2 Vehicles | 29 (69.1%) | 42 (42.0%) |
| 3 Vehicles | 13 (30.9%) | 58 (58.0%) |
| 4 Vehicles | 0 (0.0%) | 0 (0.0%) |
| 5 or more Vehicles | 0 (0.0%) | 0 (0.0%) |
| Total | 42 (100.0%) | 100 (100.0%) |
Commute Time in Oceola
The most frequently occuring commute durations in Oceola are 20 to 24 minutes (84 commuters, 59.2%), 15 to 19 minutes (15 commuters, 10.6%), and 10 to 14 minutes (13 commuters, 9.1%).
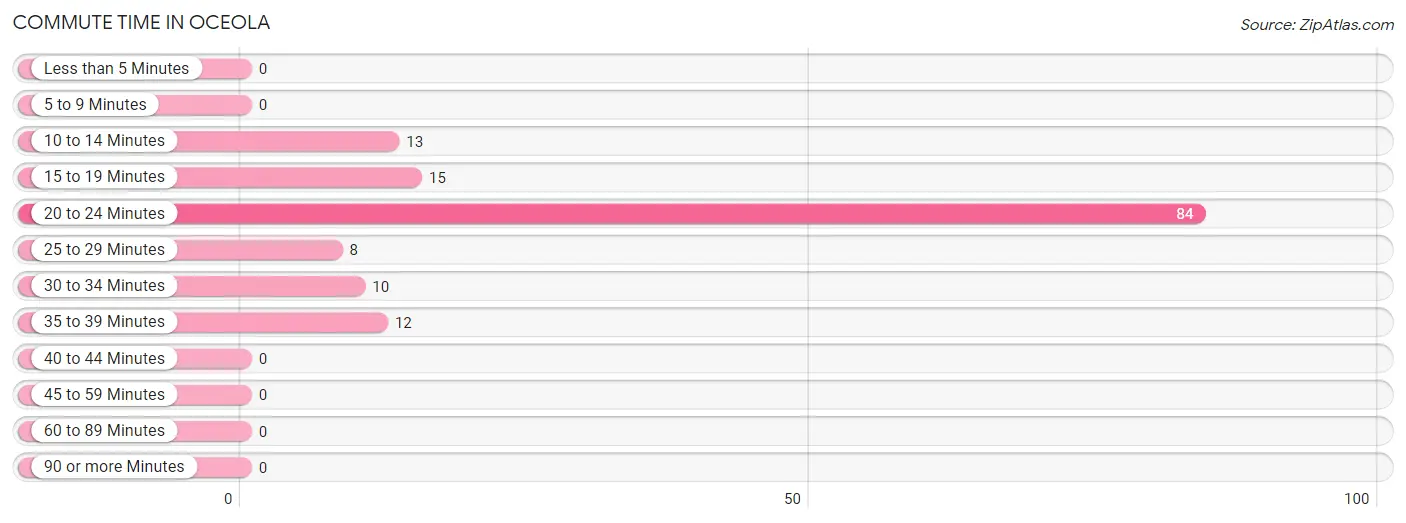
| Commute Time | # Commuters | % Commuters |
| Less than 5 Minutes | 0 | 0.0% |
| 5 to 9 Minutes | 0 | 0.0% |
| 10 to 14 Minutes | 13 | 9.1% |
| 15 to 19 Minutes | 15 | 10.6% |
| 20 to 24 Minutes | 84 | 59.2% |
| 25 to 29 Minutes | 8 | 5.6% |
| 30 to 34 Minutes | 10 | 7.0% |
| 35 to 39 Minutes | 12 | 8.5% |
| 40 to 44 Minutes | 0 | 0.0% |
| 45 to 59 Minutes | 0 | 0.0% |
| 60 to 89 Minutes | 0 | 0.0% |
| 90 or more Minutes | 0 | 0.0% |
Commute Time by Sex in Oceola
The most common commute times in Oceola are 20 to 24 minutes (21 commuters, 50.0%) for males and 20 to 24 minutes (63 commuters, 63.0%) for females.
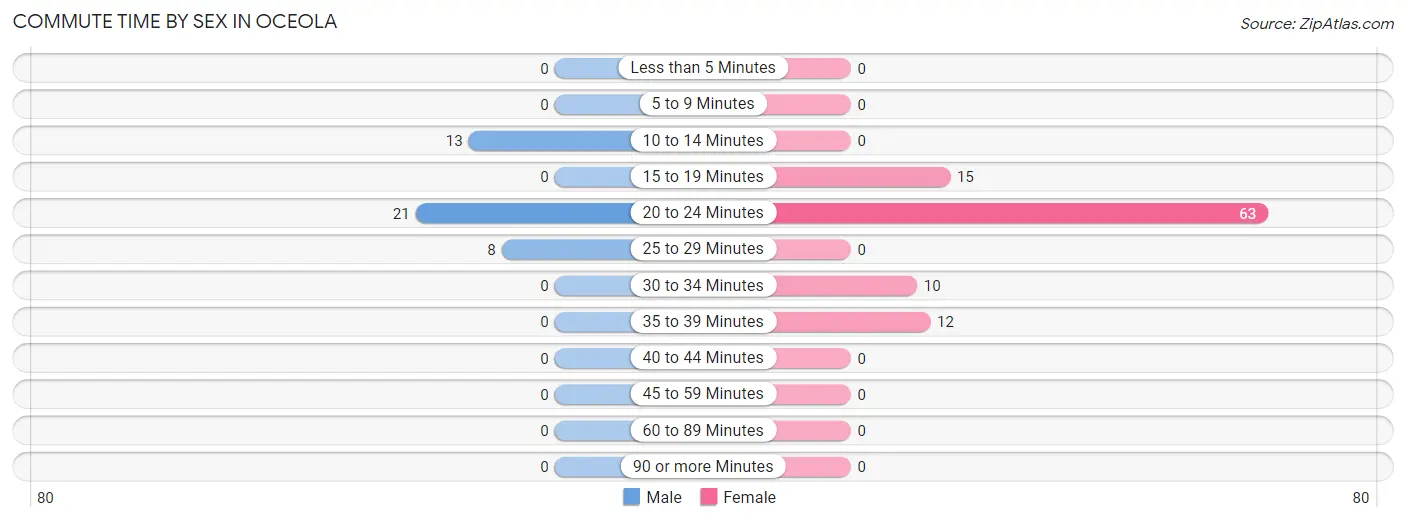
| Commute Time | Male | Female |
| Less than 5 Minutes | 0 (0.0%) | 0 (0.0%) |
| 5 to 9 Minutes | 0 (0.0%) | 0 (0.0%) |
| 10 to 14 Minutes | 13 (30.9%) | 0 (0.0%) |
| 15 to 19 Minutes | 0 (0.0%) | 15 (15.0%) |
| 20 to 24 Minutes | 21 (50.0%) | 63 (63.0%) |
| 25 to 29 Minutes | 8 (19.1%) | 0 (0.0%) |
| 30 to 34 Minutes | 0 (0.0%) | 10 (10.0%) |
| 35 to 39 Minutes | 0 (0.0%) | 12 (12.0%) |
| 40 to 44 Minutes | 0 (0.0%) | 0 (0.0%) |
| 45 to 59 Minutes | 0 (0.0%) | 0 (0.0%) |
| 60 to 89 Minutes | 0 (0.0%) | 0 (0.0%) |
| 90 or more Minutes | 0 (0.0%) | 0 (0.0%) |
Time of Departure to Work by Sex in Oceola
The most frequent times of departure to work in Oceola are 8:00 AM to 8:29 AM (13, 30.9%) for males and 5:30 AM to 5:59 AM (73, 73.0%) for females.
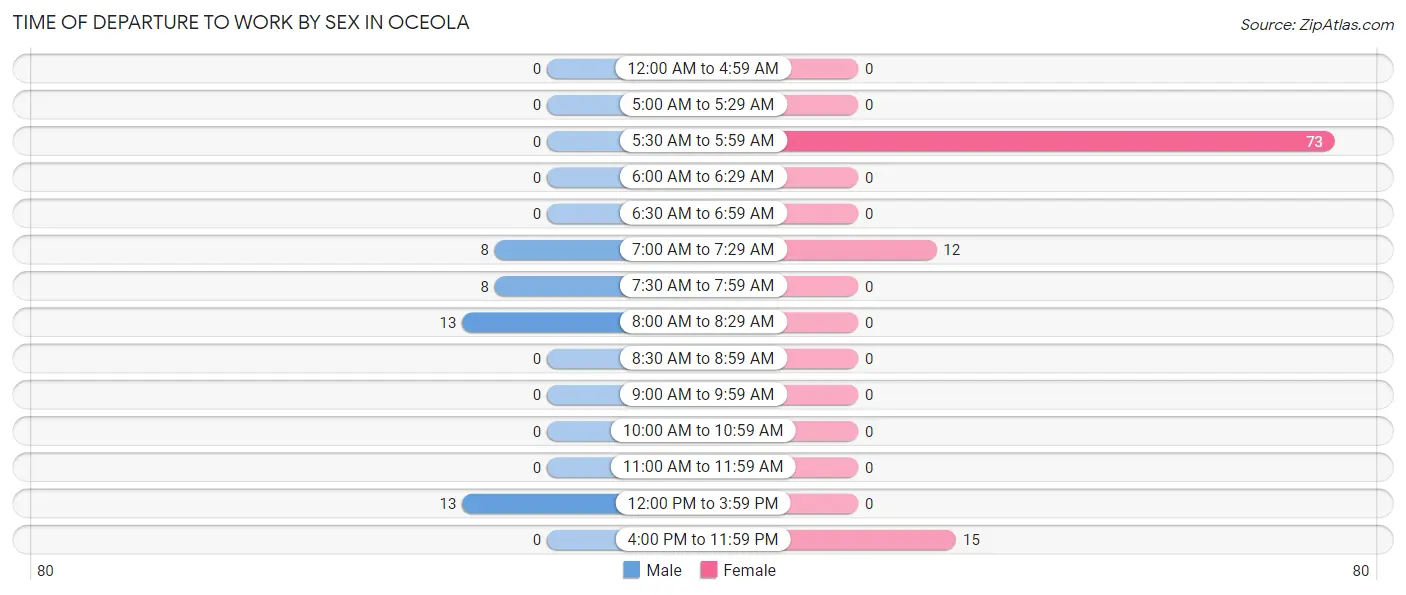
| Time of Departure | Male | Female |
| 12:00 AM to 4:59 AM | 0 (0.0%) | 0 (0.0%) |
| 5:00 AM to 5:29 AM | 0 (0.0%) | 0 (0.0%) |
| 5:30 AM to 5:59 AM | 0 (0.0%) | 73 (73.0%) |
| 6:00 AM to 6:29 AM | 0 (0.0%) | 0 (0.0%) |
| 6:30 AM to 6:59 AM | 0 (0.0%) | 0 (0.0%) |
| 7:00 AM to 7:29 AM | 8 (19.1%) | 12 (12.0%) |
| 7:30 AM to 7:59 AM | 8 (19.1%) | 0 (0.0%) |
| 8:00 AM to 8:29 AM | 13 (30.9%) | 0 (0.0%) |
| 8:30 AM to 8:59 AM | 0 (0.0%) | 0 (0.0%) |
| 9:00 AM to 9:59 AM | 0 (0.0%) | 0 (0.0%) |
| 10:00 AM to 10:59 AM | 0 (0.0%) | 0 (0.0%) |
| 11:00 AM to 11:59 AM | 0 (0.0%) | 0 (0.0%) |
| 12:00 PM to 3:59 PM | 13 (30.9%) | 0 (0.0%) |
| 4:00 PM to 11:59 PM | 0 (0.0%) | 15 (15.0%) |
| Total | 42 (100.0%) | 100 (100.0%) |
Housing Occupancy in Oceola
Occupancy by Ownership in Oceola
Of the total 97 dwellings in Oceola, owner-occupied units account for 74 (76.3%), while renter-occupied units make up 23 (23.7%).
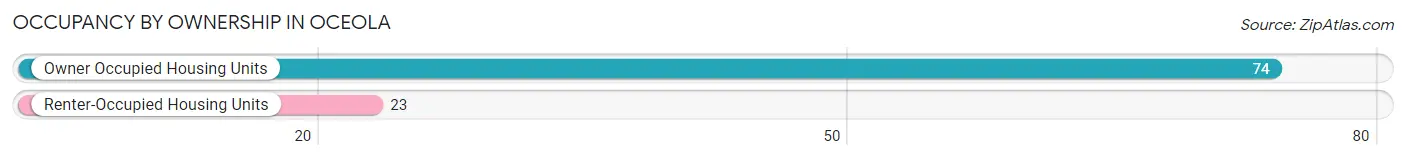
| Occupancy | # Housing Units | % Housing Units |
| Owner Occupied Housing Units | 74 | 76.3% |
| Renter-Occupied Housing Units | 23 | 23.7% |
| Total Occupied Housing Units | 97 | 100.0% |
Occupancy by Household Size in Oceola
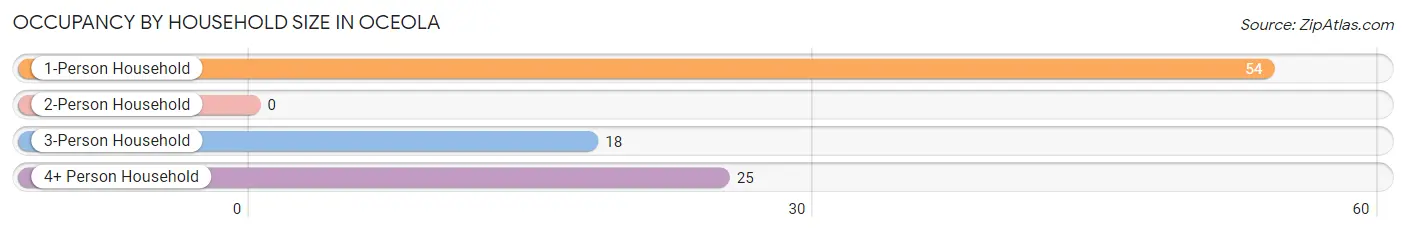
| Household Size | # Housing Units | % Housing Units |
| 1-Person Household | 54 | 55.7% |
| 2-Person Household | 0 | 0.0% |
| 3-Person Household | 18 | 18.6% |
| 4+ Person Household | 25 | 25.8% |
| Total Housing Units | 97 | 100.0% |
Occupancy by Ownership by Household Size in Oceola
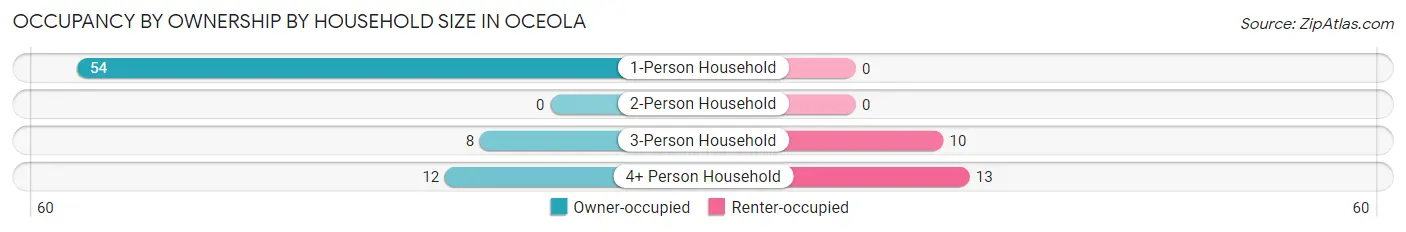
| Household Size | Owner-occupied | Renter-occupied |
| 1-Person Household | 54 (100.0%) | 0 (0.0%) |
| 2-Person Household | 0 (0.0%) | 0 (0.0%) |
| 3-Person Household | 8 (44.4%) | 10 (55.6%) |
| 4+ Person Household | 12 (48.0%) | 13 (52.0%) |
| Total Housing Units | 74 (76.3%) | 23 (23.7%) |
Occupancy by Educational Attainment in Oceola
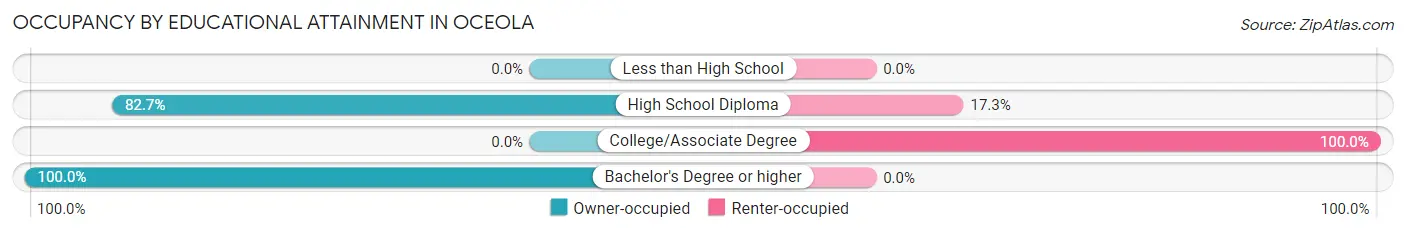
| Household Size | Owner-occupied | Renter-occupied |
| Less than High School | 0 (0.0%) | 0 (0.0%) |
| High School Diploma | 62 (82.7%) | 13 (17.3%) |
| College/Associate Degree | 0 (0.0%) | 10 (100.0%) |
| Bachelor's Degree or higher | 12 (100.0%) | 0 (0.0%) |
Occupancy by Age of Householder in Oceola
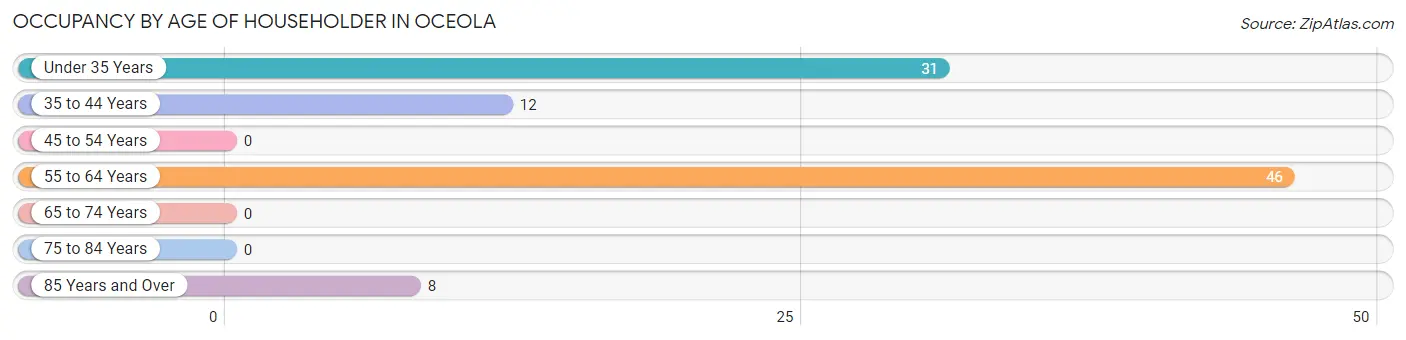
| Age Bracket | # Households | % Households |
| Under 35 Years | 31 | 32.0% |
| 35 to 44 Years | 12 | 12.4% |
| 45 to 54 Years | 0 | 0.0% |
| 55 to 64 Years | 46 | 47.4% |
| 65 to 74 Years | 0 | 0.0% |
| 75 to 84 Years | 0 | 0.0% |
| 85 Years and Over | 8 | 8.3% |
| Total | 97 | 100.0% |
Housing Finances in Oceola
Median Income by Occupancy in Oceola
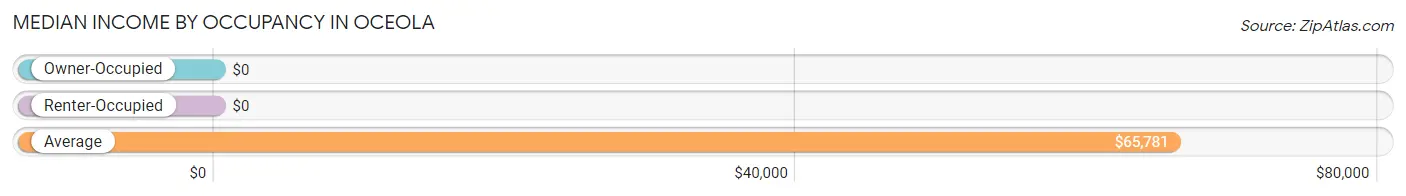
| Occupancy Type | # Households | Median Income |
| Owner-Occupied | 74 (76.3%) | $0 |
| Renter-Occupied | 23 (23.7%) | $0 |
| Average | 97 (100.0%) | $65,781 |
Occupancy by Householder Income Bracket in Oceola
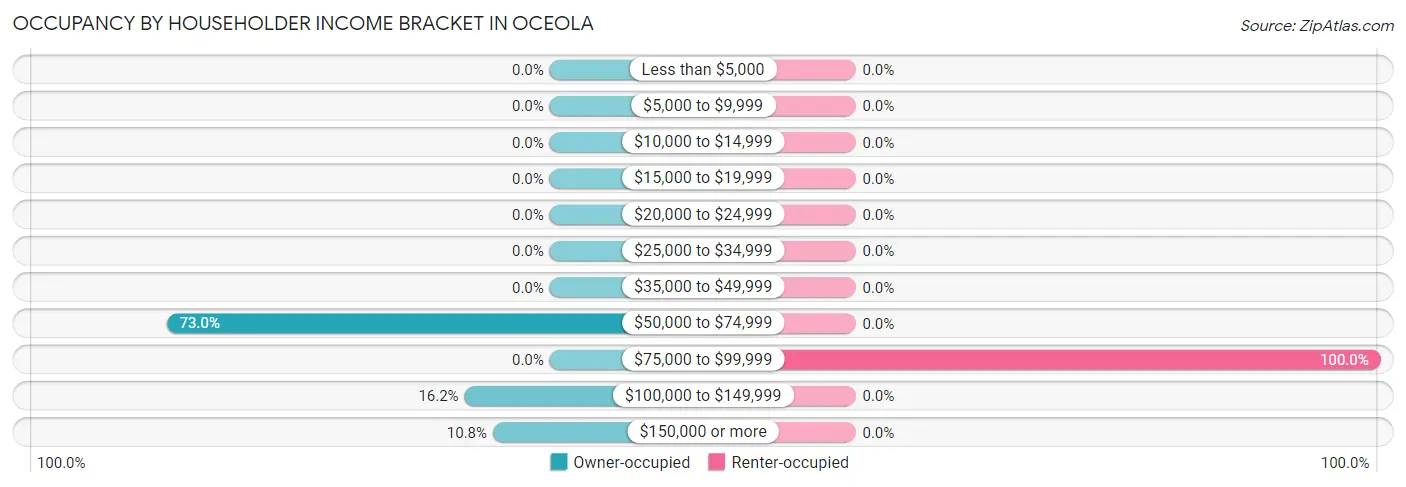
| Income Bracket | Owner-occupied | Renter-occupied |
| Less than $5,000 | 0 (0.0%) | 0 (0.0%) |
| $5,000 to $9,999 | 0 (0.0%) | 0 (0.0%) |
| $10,000 to $14,999 | 0 (0.0%) | 0 (0.0%) |
| $15,000 to $19,999 | 0 (0.0%) | 0 (0.0%) |
| $20,000 to $24,999 | 0 (0.0%) | 0 (0.0%) |
| $25,000 to $34,999 | 0 (0.0%) | 0 (0.0%) |
| $35,000 to $49,999 | 0 (0.0%) | 0 (0.0%) |
| $50,000 to $74,999 | 54 (73.0%) | 0 (0.0%) |
| $75,000 to $99,999 | 0 (0.0%) | 23 (100.0%) |
| $100,000 to $149,999 | 12 (16.2%) | 0 (0.0%) |
| $150,000 or more | 8 (10.8%) | 0 (0.0%) |
| Total | 74 (100.0%) | 23 (100.0%) |
Monthly Housing Cost Tiers in Oceola
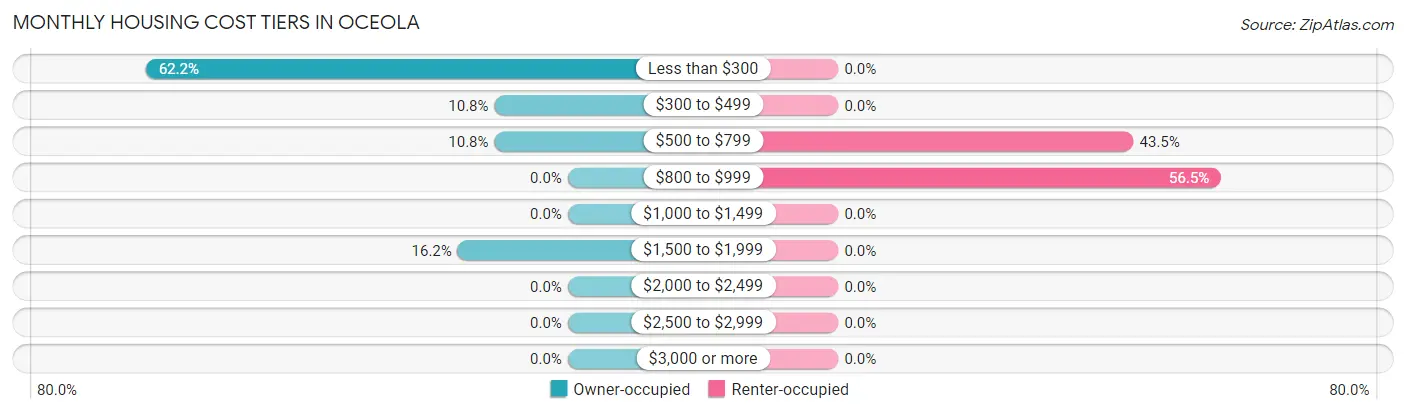
| Monthly Cost | Owner-occupied | Renter-occupied |
| Less than $300 | 46 (62.2%) | 0 (0.0%) |
| $300 to $499 | 8 (10.8%) | 0 (0.0%) |
| $500 to $799 | 8 (10.8%) | 10 (43.5%) |
| $800 to $999 | 0 (0.0%) | 13 (56.5%) |
| $1,000 to $1,499 | 0 (0.0%) | 0 (0.0%) |
| $1,500 to $1,999 | 12 (16.2%) | 0 (0.0%) |
| $2,000 to $2,499 | 0 (0.0%) | 0 (0.0%) |
| $2,500 to $2,999 | 0 (0.0%) | 0 (0.0%) |
| $3,000 or more | 0 (0.0%) | 0 (0.0%) |
| Total | 74 (100.0%) | 23 (100.0%) |
Physical Housing Characteristics in Oceola
Housing Structures in Oceola
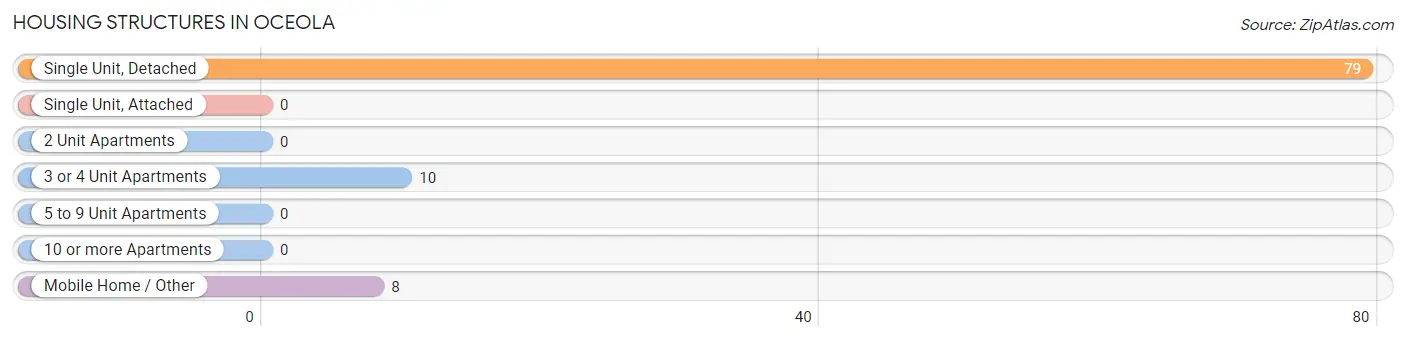
| Structure Type | # Housing Units | % Housing Units |
| Single Unit, Detached | 79 | 81.4% |
| Single Unit, Attached | 0 | 0.0% |
| 2 Unit Apartments | 0 | 0.0% |
| 3 or 4 Unit Apartments | 10 | 10.3% |
| 5 to 9 Unit Apartments | 0 | 0.0% |
| 10 or more Apartments | 0 | 0.0% |
| Mobile Home / Other | 8 | 8.3% |
| Total | 97 | 100.0% |
Housing Structures by Occupancy in Oceola
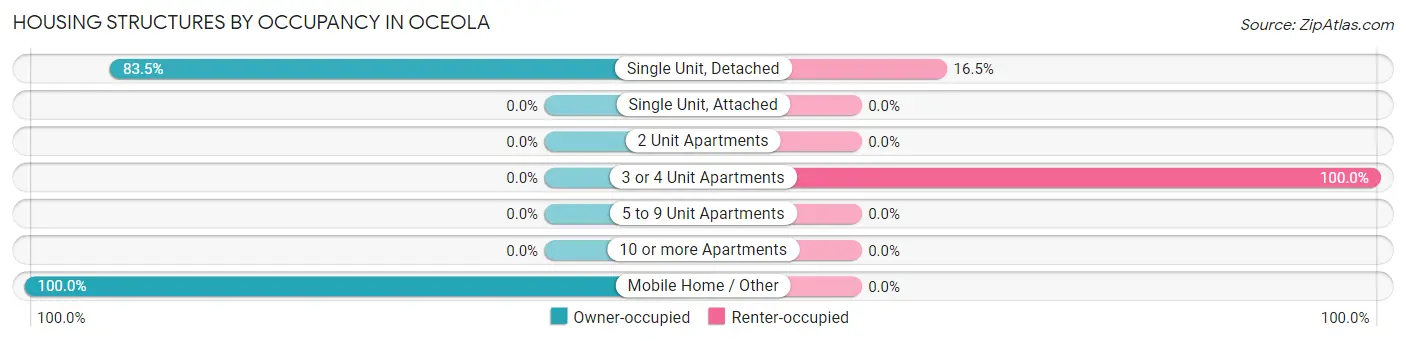
| Structure Type | Owner-occupied | Renter-occupied |
| Single Unit, Detached | 66 (83.5%) | 13 (16.5%) |
| Single Unit, Attached | 0 (0.0%) | 0 (0.0%) |
| 2 Unit Apartments | 0 (0.0%) | 0 (0.0%) |
| 3 or 4 Unit Apartments | 0 (0.0%) | 10 (100.0%) |
| 5 to 9 Unit Apartments | 0 (0.0%) | 0 (0.0%) |
| 10 or more Apartments | 0 (0.0%) | 0 (0.0%) |
| Mobile Home / Other | 8 (100.0%) | 0 (0.0%) |
| Total | 74 (76.3%) | 23 (23.7%) |
Housing Structures by Number of Rooms in Oceola
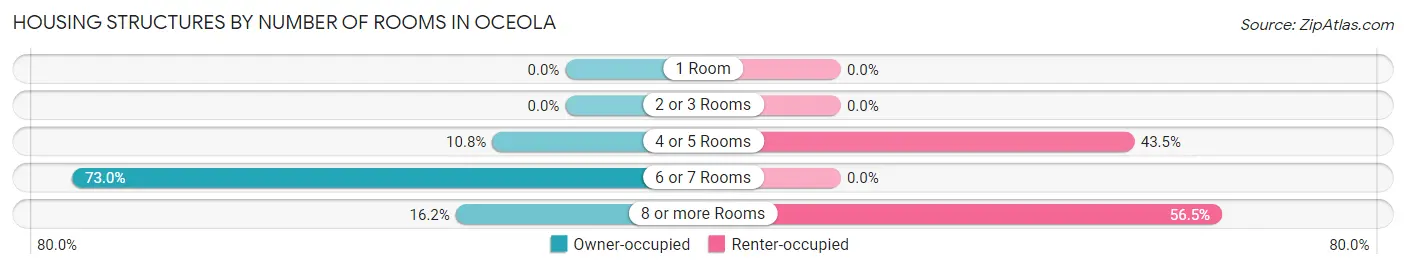
| Number of Rooms | Owner-occupied | Renter-occupied |
| 1 Room | 0 (0.0%) | 0 (0.0%) |
| 2 or 3 Rooms | 0 (0.0%) | 0 (0.0%) |
| 4 or 5 Rooms | 8 (10.8%) | 10 (43.5%) |
| 6 or 7 Rooms | 54 (73.0%) | 0 (0.0%) |
| 8 or more Rooms | 12 (16.2%) | 13 (56.5%) |
| Total | 74 (100.0%) | 23 (100.0%) |
Housing Structure by Heating Type in Oceola
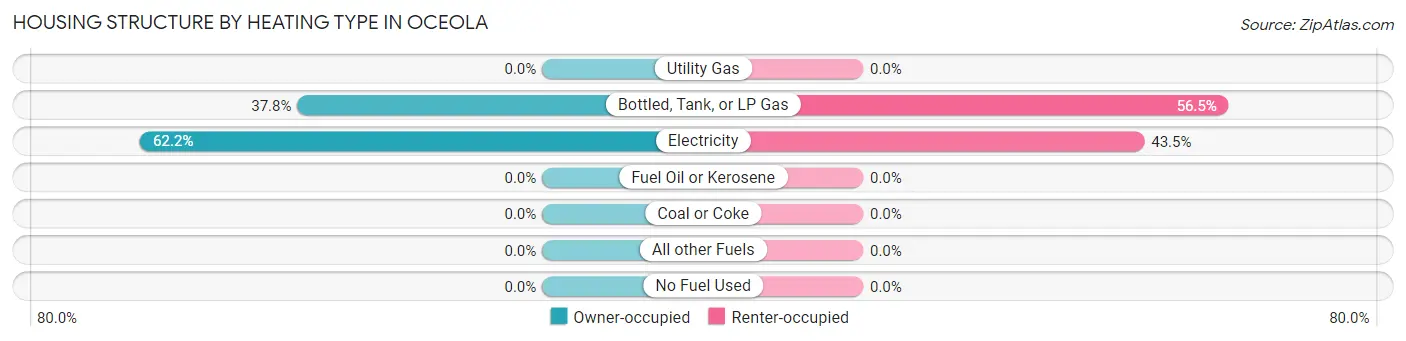
| Heating Type | Owner-occupied | Renter-occupied |
| Utility Gas | 0 (0.0%) | 0 (0.0%) |
| Bottled, Tank, or LP Gas | 28 (37.8%) | 13 (56.5%) |
| Electricity | 46 (62.2%) | 10 (43.5%) |
| Fuel Oil or Kerosene | 0 (0.0%) | 0 (0.0%) |
| Coal or Coke | 0 (0.0%) | 0 (0.0%) |
| All other Fuels | 0 (0.0%) | 0 (0.0%) |
| No Fuel Used | 0 (0.0%) | 0 (0.0%) |
| Total | 74 (100.0%) | 23 (100.0%) |
Household Vehicle Usage in Oceola
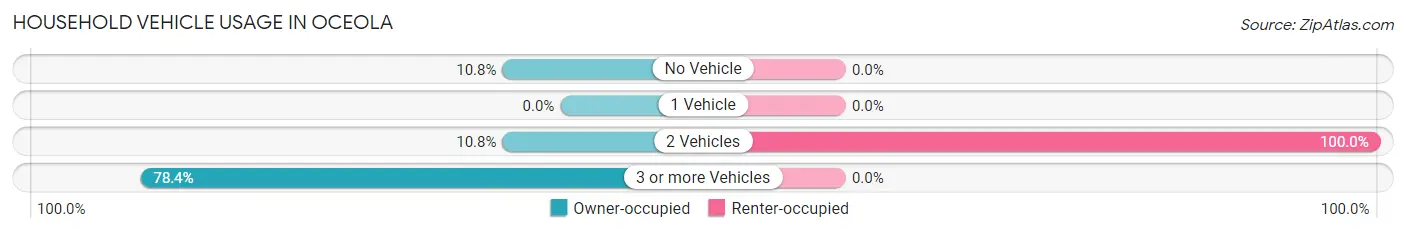
| Vehicles per Household | Owner-occupied | Renter-occupied |
| No Vehicle | 8 (10.8%) | 0 (0.0%) |
| 1 Vehicle | 0 (0.0%) | 0 (0.0%) |
| 2 Vehicles | 8 (10.8%) | 23 (100.0%) |
| 3 or more Vehicles | 58 (78.4%) | 0 (0.0%) |
| Total | 74 (100.0%) | 23 (100.0%) |
Real Estate & Mortgages in Oceola
Real Estate and Mortgage Overview in Oceola
| Characteristic | Without Mortgage | With Mortgage |
| Housing Units | 62 | 12 |
| Median Property Value | $108,200 | $0 |
| Median Household Income | $51,685 | $0 |
| Monthly Housing Costs | $234 | $0 |
| Real Estate Taxes | $700 | $0 |
Property Value by Mortgage Status in Oceola
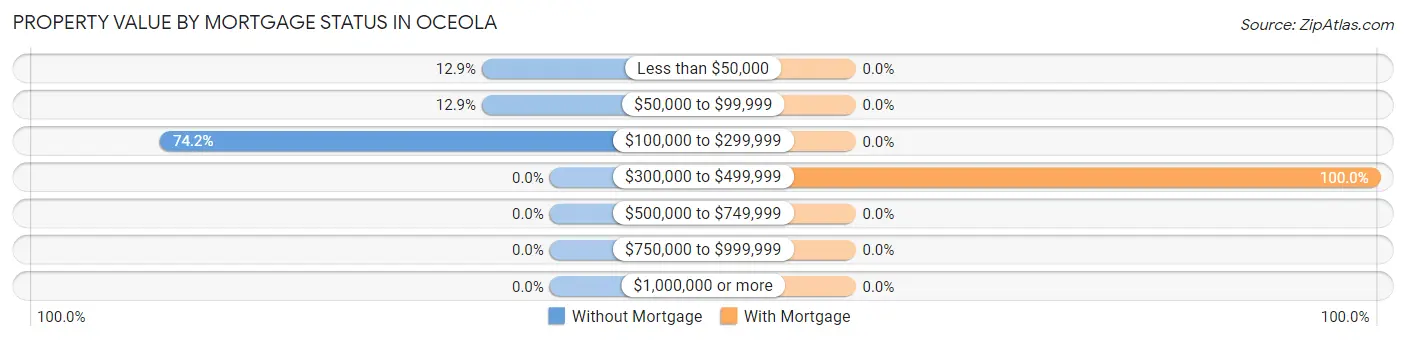
| Property Value | Without Mortgage | With Mortgage |
| Less than $50,000 | 8 (12.9%) | 0 (0.0%) |
| $50,000 to $99,999 | 8 (12.9%) | 0 (0.0%) |
| $100,000 to $299,999 | 46 (74.2%) | 0 (0.0%) |
| $300,000 to $499,999 | 0 (0.0%) | 12 (100.0%) |
| $500,000 to $749,999 | 0 (0.0%) | 0 (0.0%) |
| $750,000 to $999,999 | 0 (0.0%) | 0 (0.0%) |
| $1,000,000 or more | 0 (0.0%) | 0 (0.0%) |
| Total | 62 (100.0%) | 12 (100.0%) |
Household Income by Mortgage Status in Oceola
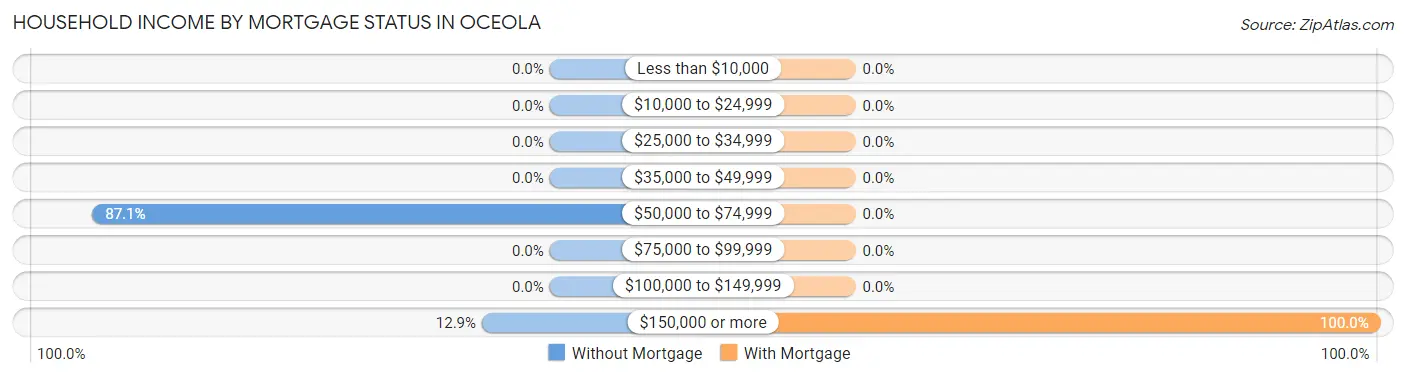
| Household Income | Without Mortgage | With Mortgage |
| Less than $10,000 | 0 (0.0%) | 0 (0.0%) |
| $10,000 to $24,999 | 0 (0.0%) | 0 (0.0%) |
| $25,000 to $34,999 | 0 (0.0%) | 0 (0.0%) |
| $35,000 to $49,999 | 0 (0.0%) | 0 (0.0%) |
| $50,000 to $74,999 | 54 (87.1%) | 0 (0.0%) |
| $75,000 to $99,999 | 0 (0.0%) | 0 (0.0%) |
| $100,000 to $149,999 | 0 (0.0%) | 0 (0.0%) |
| $150,000 or more | 8 (12.9%) | 12 (100.0%) |
| Total | 62 (100.0%) | 12 (100.0%) |
Property Value to Household Income Ratio in Oceola
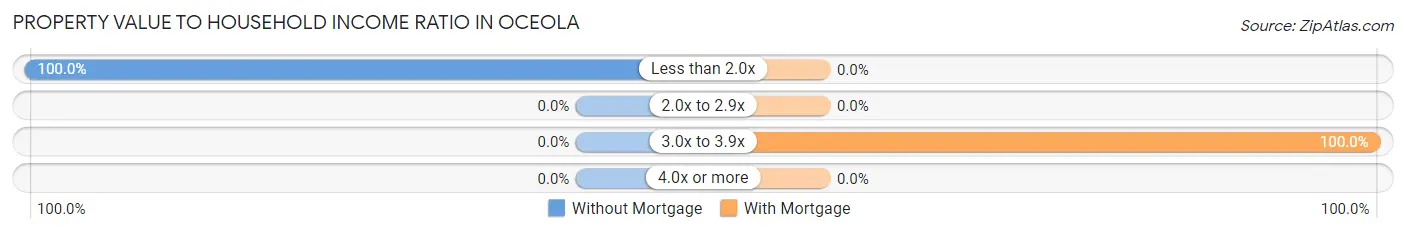
| Value-to-Income Ratio | Without Mortgage | With Mortgage |
| Less than 2.0x | 62 (100.0%) | 0 (0.0%) |
| 2.0x to 2.9x | 0 (0.0%) | 0 (0.0%) |
| 3.0x to 3.9x | 0 (0.0%) | 12 (100.0%) |
| 4.0x or more | 0 (0.0%) | 0 (0.0%) |
| Total | 62 (100.0%) | 12 (100.0%) |
Real Estate Taxes by Mortgage Status in Oceola
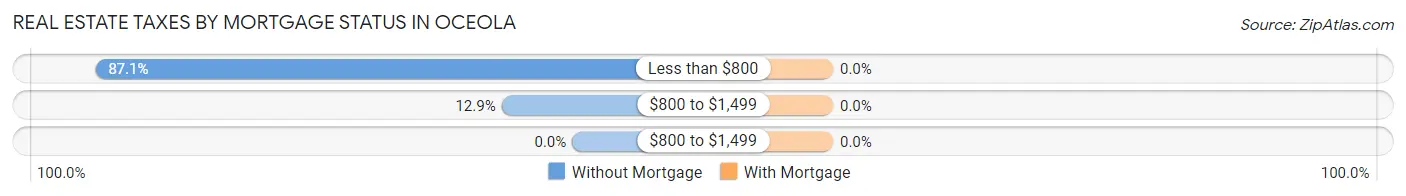
| Property Taxes | Without Mortgage | With Mortgage |
| Less than $800 | 54 (87.1%) | 0 (0.0%) |
| $800 to $1,499 | 8 (12.9%) | 0 (0.0%) |
| $800 to $1,499 | 0 (0.0%) | 0 (0.0%) |
| Total | 62 (100.0%) | 12 (100.0%) |
Health & Disability in Oceola
Health Insurance Coverage by Age in Oceola
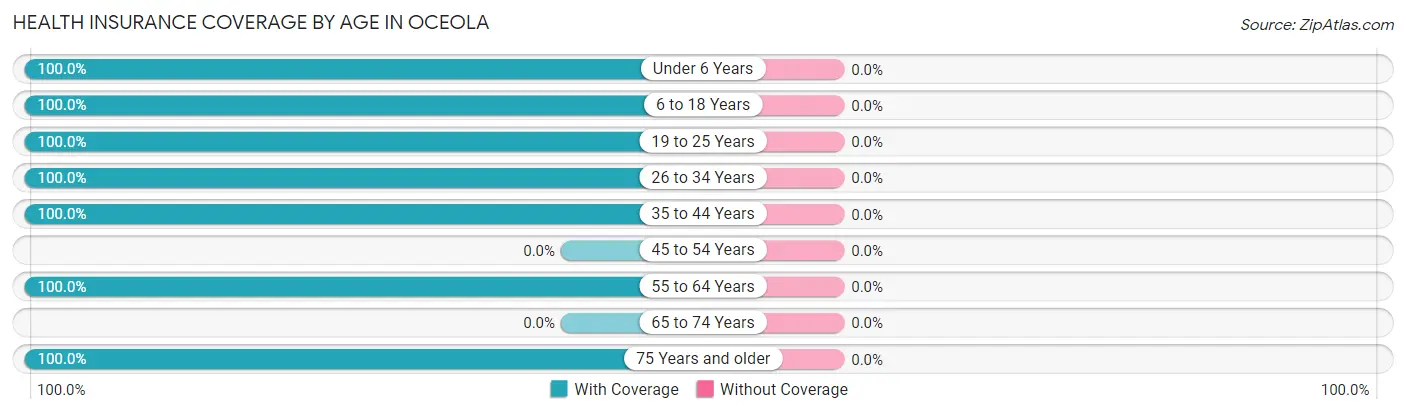
| Age Bracket | With Coverage | Without Coverage |
| Under 6 Years | 33 (100.0%) | 0 (0.0%) |
| 6 to 18 Years | 54 (100.0%) | 0 (0.0%) |
| 19 to 25 Years | 32 (100.0%) | 0 (0.0%) |
| 26 to 34 Years | 39 (100.0%) | 0 (0.0%) |
| 35 to 44 Years | 25 (100.0%) | 0 (0.0%) |
| 45 to 54 Years | 0 (0.0%) | 0 (0.0%) |
| 55 to 64 Years | 46 (100.0%) | 0 (0.0%) |
| 65 to 74 Years | 0 (0.0%) | 0 (0.0%) |
| 75 Years and older | 8 (100.0%) | 0 (0.0%) |
| Total | 237 (100.0%) | 0 (0.0%) |
Health Insurance Coverage by Citizenship Status in Oceola
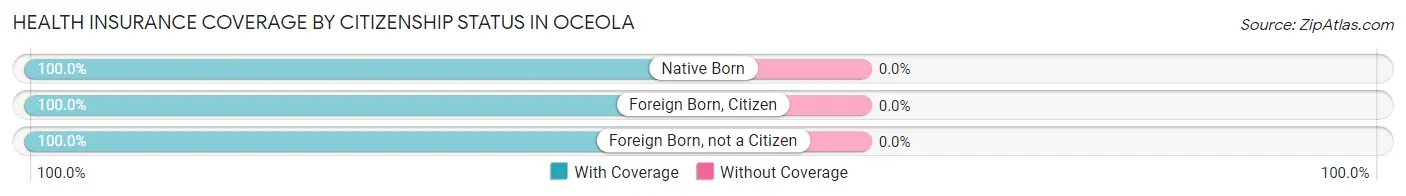
| Citizenship Status | With Coverage | Without Coverage |
| Native Born | 33 (100.0%) | 0 (0.0%) |
| Foreign Born, Citizen | 54 (100.0%) | 0 (0.0%) |
| Foreign Born, not a Citizen | 32 (100.0%) | 0 (0.0%) |
Health Insurance Coverage by Household Income in Oceola
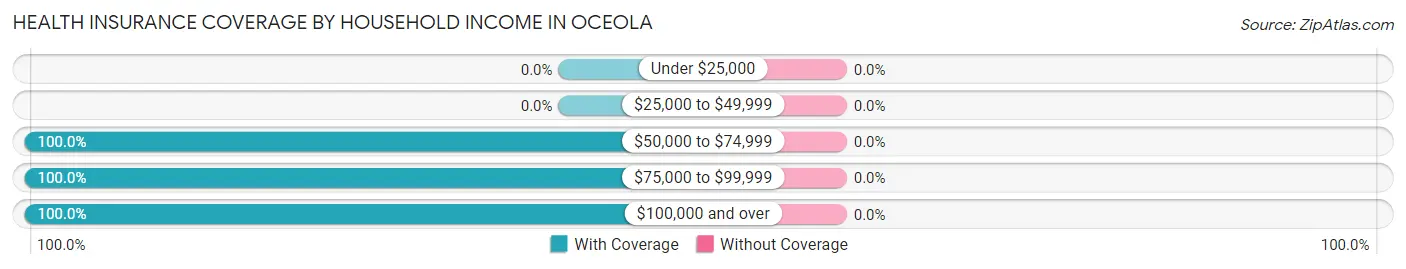
| Household Income | With Coverage | Without Coverage |
| Under $25,000 | 0 (0.0%) | 0 (0.0%) |
| $25,000 to $49,999 | 0 (0.0%) | 0 (0.0%) |
| $50,000 to $74,999 | 94 (100.0%) | 0 (0.0%) |
| $75,000 to $99,999 | 88 (100.0%) | 0 (0.0%) |
| $100,000 and over | 55 (100.0%) | 0 (0.0%) |
Public vs Private Health Insurance Coverage by Age in Oceola
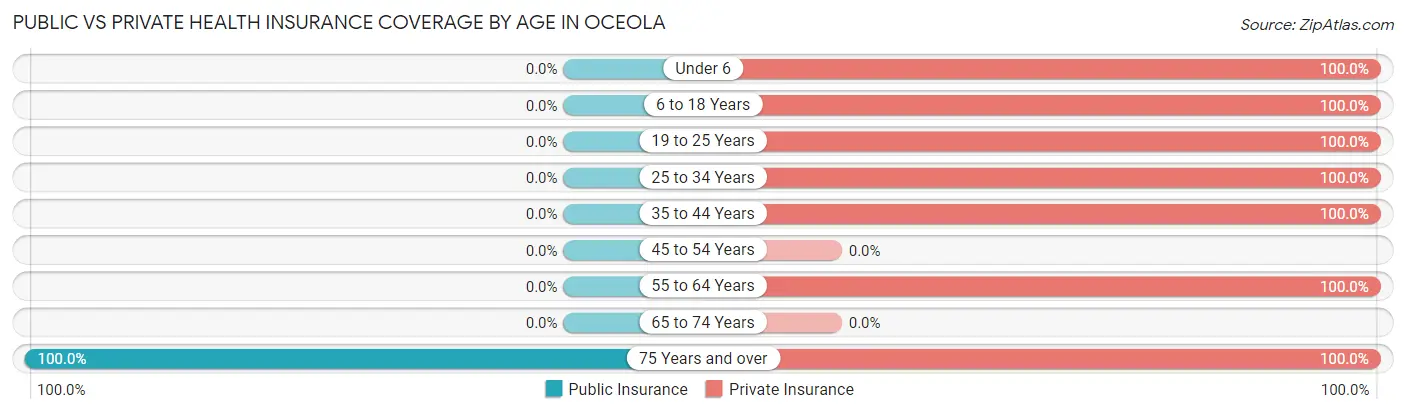
| Age Bracket | Public Insurance | Private Insurance |
| Under 6 | 0 (0.0%) | 33 (100.0%) |
| 6 to 18 Years | 0 (0.0%) | 54 (100.0%) |
| 19 to 25 Years | 0 (0.0%) | 32 (100.0%) |
| 25 to 34 Years | 0 (0.0%) | 39 (100.0%) |
| 35 to 44 Years | 0 (0.0%) | 25 (100.0%) |
| 45 to 54 Years | 0 (0.0%) | 0 (0.0%) |
| 55 to 64 Years | 0 (0.0%) | 46 (100.0%) |
| 65 to 74 Years | 0 (0.0%) | 0 (0.0%) |
| 75 Years and over | 8 (100.0%) | 8 (100.0%) |
| Total | 8 (3.4%) | 237 (100.0%) |
Disability Status by Sex by Age in Oceola
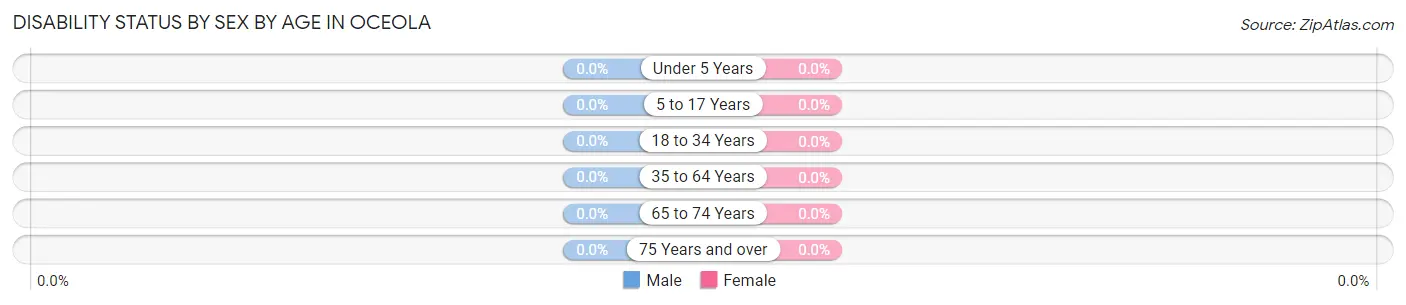
| Age Bracket | Male | Female |
| Under 5 Years | 0 (0.0%) | 0 (0.0%) |
| 5 to 17 Years | 0 (0.0%) | 0 (0.0%) |
| 18 to 34 Years | 0 (0.0%) | 0 (0.0%) |
| 35 to 64 Years | 0 (0.0%) | 0 (0.0%) |
| 65 to 74 Years | 0 (0.0%) | 0 (0.0%) |
| 75 Years and over | 0 (0.0%) | 0 (0.0%) |
Disability Class by Sex by Age in Oceola
Disability Class: Hearing Difficulty
| Age Bracket | Male | Female |
| Under 5 Years | 0 (0.0%) | 0 (0.0%) |
| 5 to 17 Years | 0 (0.0%) | 0 (0.0%) |
| 18 to 34 Years | 0 (0.0%) | 0 (0.0%) |
| 35 to 64 Years | 0 (0.0%) | 0 (0.0%) |
| 65 to 74 Years | 0 (0.0%) | 0 (0.0%) |
| 75 Years and over | 0 (0.0%) | 0 (0.0%) |
Disability Class: Vision Difficulty
| Age Bracket | Male | Female |
| Under 5 Years | 0 (0.0%) | 0 (0.0%) |
| 5 to 17 Years | 0 (0.0%) | 0 (0.0%) |
| 18 to 34 Years | 0 (0.0%) | 0 (0.0%) |
| 35 to 64 Years | 0 (0.0%) | 0 (0.0%) |
| 65 to 74 Years | 0 (0.0%) | 0 (0.0%) |
| 75 Years and over | 0 (0.0%) | 0 (0.0%) |
Disability Class: Cognitive Difficulty
| Age Bracket | Male | Female |
| 5 to 17 Years | 0 (0.0%) | 0 (0.0%) |
| 18 to 34 Years | 0 (0.0%) | 0 (0.0%) |
| 35 to 64 Years | 0 (0.0%) | 0 (0.0%) |
| 65 to 74 Years | 0 (0.0%) | 0 (0.0%) |
| 75 Years and over | 0 (0.0%) | 0 (0.0%) |
Disability Class: Ambulatory Difficulty
| Age Bracket | Male | Female |
| 5 to 17 Years | 0 (0.0%) | 0 (0.0%) |
| 18 to 34 Years | 0 (0.0%) | 0 (0.0%) |
| 35 to 64 Years | 0 (0.0%) | 0 (0.0%) |
| 65 to 74 Years | 0 (0.0%) | 0 (0.0%) |
| 75 Years and over | 0 (0.0%) | 0 (0.0%) |
Disability Class: Self-Care Difficulty
| Age Bracket | Male | Female |
| 5 to 17 Years | 0 (0.0%) | 0 (0.0%) |
| 18 to 34 Years | 0 (0.0%) | 0 (0.0%) |
| 35 to 64 Years | 0 (0.0%) | 0 (0.0%) |
| 65 to 74 Years | 0 (0.0%) | 0 (0.0%) |
| 75 Years and over | 0 (0.0%) | 0 (0.0%) |
Technology Access in Oceola
Computing Device Access in Oceola
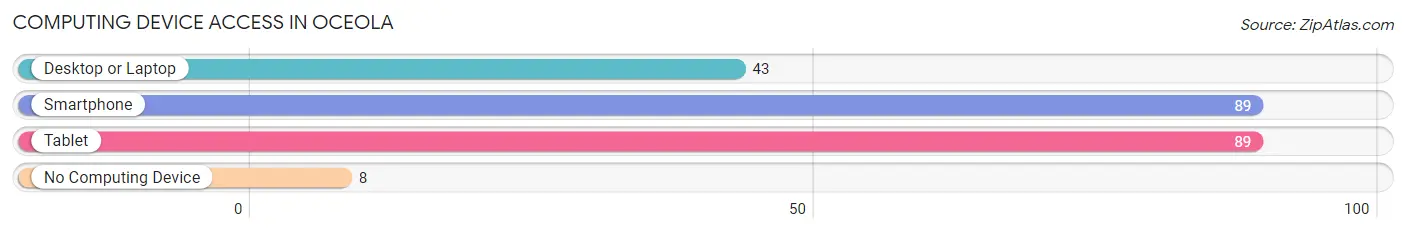
| Device Type | # Households | % Households |
| Desktop or Laptop | 43 | 44.3% |
| Smartphone | 89 | 91.7% |
| Tablet | 89 | 91.7% |
| No Computing Device | 8 | 8.3% |
| Total | 97 | 100.0% |
Internet Access in Oceola
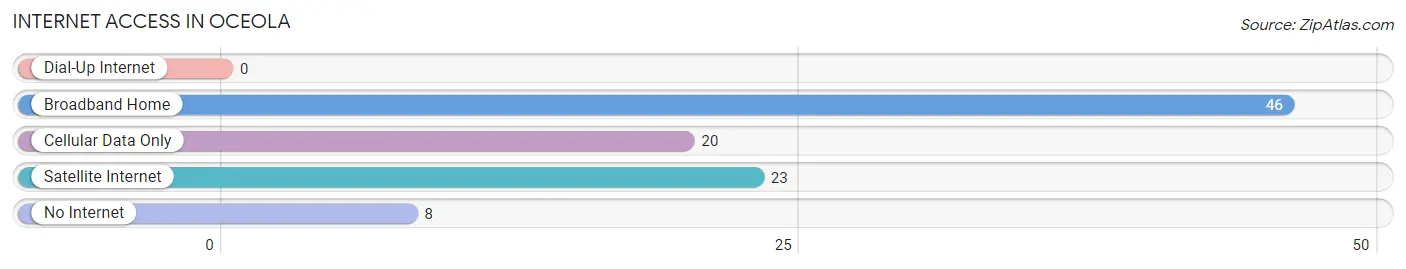
| Internet Type | # Households | % Households |
| Dial-Up Internet | 0 | 0.0% |
| Broadband Home | 46 | 47.4% |
| Cellular Data Only | 20 | 20.6% |
| Satellite Internet | 23 | 23.7% |
| No Internet | 8 | 8.3% |
| Total | 97 | 100.0% |
Oceola Summary
Oceola is a small village located in the state of Ohio, United States. It is situated in the southeastern part of the state, in the county of Coshocton. The village is located on the banks of the Tuscarawas River, and is part of the Coshocton Metropolitan Statistical Area. The population of Oceola was estimated to be 1,093 in the year 2020.
History
Oceola was founded in 1817 by a group of settlers from Pennsylvania. The village was named after the Seminole leader Osceola, who had been a leader in the Seminole Wars. The village was originally known as Oceola Station, and was a stop on the Ohio and Erie Canal. The canal was built in the early 19th century to connect the Ohio River to Lake Erie.
The village grew slowly, and by the mid-19th century, it had become a small farming community. The village was incorporated in 1867, and the first mayor was elected in 1868. The village continued to grow, and by the early 20th century, it had become a small industrial center. The village was home to several factories, including a brickyard, a sawmill, and a flour mill.
Geography
Oceola is located in the southeastern part of Ohio, in the county of Coshocton. The village is situated on the banks of the Tuscarawas River, and is part of the Coshocton Metropolitan Statistical Area. The village is located approximately 40 miles east of Columbus, the state capital.
The village is located in a rural area, and is surrounded by rolling hills and farmland. The village is located in a humid continental climate zone, and experiences hot summers and cold winters. The average annual temperature is around 50 degrees Fahrenheit.
Economy
The economy of Oceola is largely based on agriculture and manufacturing. The village is home to several small businesses, including a grocery store, a hardware store, and a restaurant. The village is also home to several small manufacturing companies, including a plastics factory and a metal fabrication plant.
The village is also home to a number of tourist attractions, including the Oceola Historical Museum, the Oceola Antique Mall, and the Oceola Arts Center. The village is also home to several parks, including the Oceola Community Park and the Oceola Nature Preserve.
Demographics
The population of Oceola was estimated to be 1,093 in the year 2020. The population is largely white, with a small percentage of African Americans and Hispanics. The median age of the population is around 40 years old. The median household income is around $45,000, and the median home value is around $100,000. The village has a low unemployment rate, and the poverty rate is below the national average.
Common Questions
What is Per Capita Income in Oceola?
Per Capita income in Oceola is $46,016.
What is the Median Family Income in Oceola?
Median Family Income in Oceola is $93,942.
What is the Median Household income in Oceola?
Median Household Income in Oceola is $65,781.
What is Income or Wage Gap in Oceola?
Income or Wage Gap in Oceola is 23.2%.
Women in Oceola earn 76.8 cents for every dollar earned by a man.
What is Inequality or Gini Index in Oceola?
Inequality or Gini Index in Oceola is 0.41.
What is the Total Population of Oceola?
Total Population of Oceola is 237.
What is the Total Male Population of Oceola?
Total Male Population of Oceola is 75.
What is the Total Female Population of Oceola?
Total Female Population of Oceola is 162.
What is the Ratio of Males per 100 Females in Oceola?
There are 46.30 Males per 100 Females in Oceola.
What is the Ratio of Females per 100 Males in Oceola?
There are 216.00 Females per 100 Males in Oceola.
What is the Median Population Age in Oceola?
Median Population Age in Oceola is 26.0 Years.
What is the Average Family Size in Oceola
Average Family Size in Oceola is 3.9 People.
What is the Average Household Size in Oceola
Average Household Size in Oceola is 2.4 People.
How Large is the Labor Force in Oceola?
There are 142 People in the Labor Forcein in Oceola.
What is the Percentage of People in the Labor Force in Oceola?
94.7% of People are in the Labor Force in Oceola.