Hide A Way Hills, OH Map & Demographics
Hide A Way Hills Map
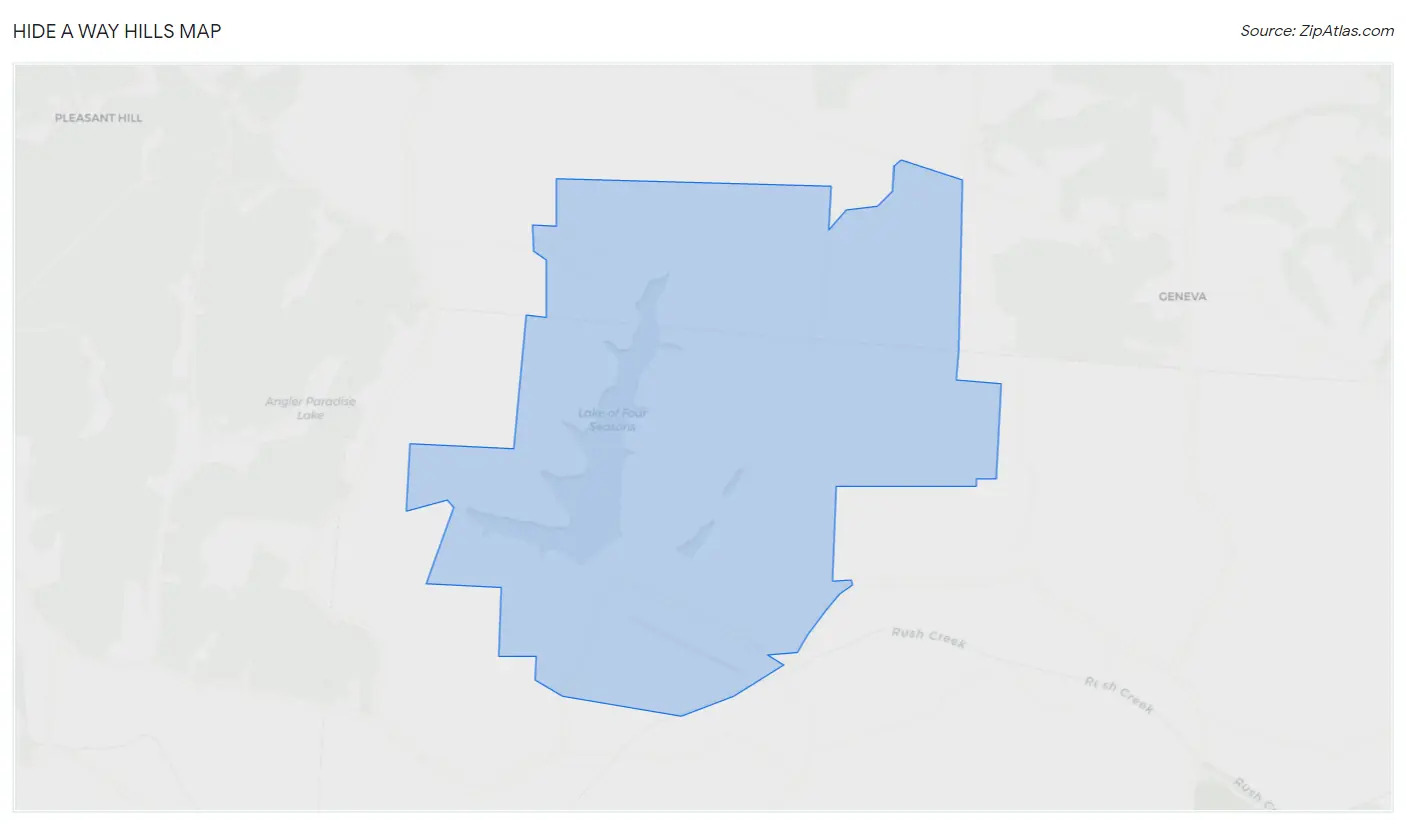
Hide A Way Hills Overview
$35,561
PER CAPITA INCOME
$109,525
AVG FAMILY INCOME
$108,875
AVG HOUSEHOLD INCOME
0.22
INEQUALITY / GINI INDEX
978
TOTAL POPULATION
473
MALE POPULATION
505
FEMALE POPULATION
93.66
MALES / 100 FEMALES
106.77
FEMALES / 100 MALES
53.4
MEDIAN AGE
2.8
AVG FAMILY SIZE
2.7
AVG HOUSEHOLD SIZE
409
LABOR FORCE [ PEOPLE ]
49.2%
PERCENT IN LABOR FORCE
8.1%
UNEMPLOYMENT RATE
Income in Hide A Way Hills
Income Overview in Hide A Way Hills
Per Capita Income in Hide A Way Hills is $35,561, while median incomes of families and households are $109,525 and $108,875 respectively.
| Characteristic | Number | Measure |
| Per Capita Income | 978 | $35,561 |
| Median Family Income | 341 | $109,525 |
| Mean Family Income | 341 | $100,209 |
| Median Household Income | 367 | $108,875 |
| Mean Household Income | 367 | $95,992 |
| Income Deficit | 341 | $0 |
| Wage / Income Gap (%) | 978 | 0.00% |
| Wage / Income Gap ($) | 978 | 100.00¢ per $1 |
| Gini / Inequality Index | 978 | 0.22 |
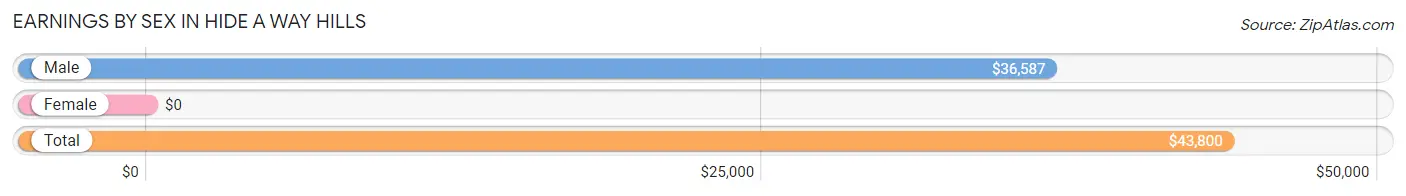
Earnings by Sex in Hide A Way Hills
| Sex | Number | Average Earnings |
| Male | 219 (50.9%) | $36,587 |
| Female | 211 (49.1%) | $0 |
| Total | 430 (100.0%) | $43,800 |
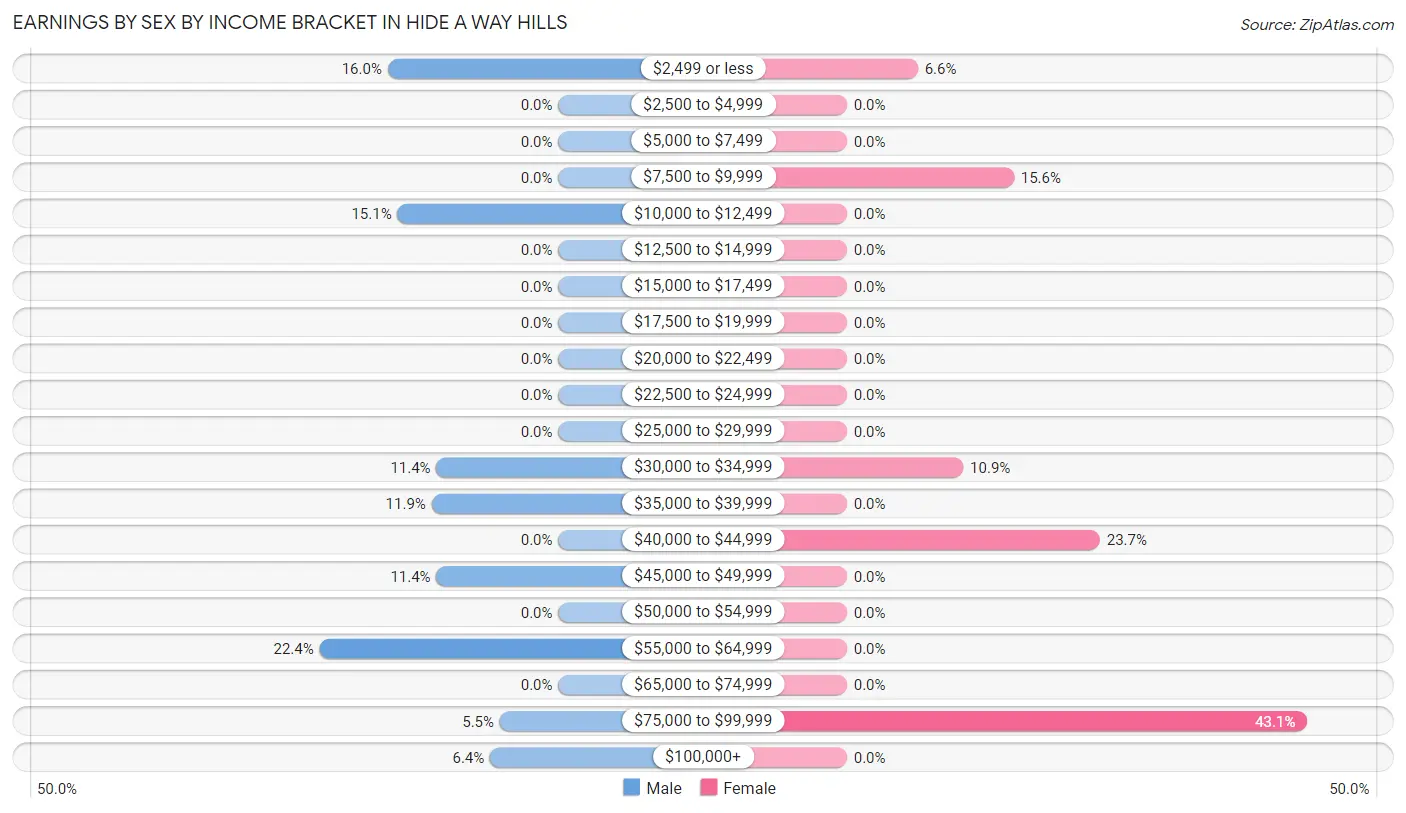
Earnings by Sex by Income Bracket in Hide A Way Hills
The most common earnings brackets in Hide A Way Hills are $55,000 to $64,999 for men (49 | 22.4%) and $75,000 to $99,999 for women (91 | 43.1%).
| Income | Male | Female |
| $2,499 or less | 35 (16.0%) | 14 (6.6%) |
| $2,500 to $4,999 | 0 (0.0%) | 0 (0.0%) |
| $5,000 to $7,499 | 0 (0.0%) | 0 (0.0%) |
| $7,500 to $9,999 | 0 (0.0%) | 33 (15.6%) |
| $10,000 to $12,499 | 33 (15.1%) | 0 (0.0%) |
| $12,500 to $14,999 | 0 (0.0%) | 0 (0.0%) |
| $15,000 to $17,499 | 0 (0.0%) | 0 (0.0%) |
| $17,500 to $19,999 | 0 (0.0%) | 0 (0.0%) |
| $20,000 to $22,499 | 0 (0.0%) | 0 (0.0%) |
| $22,500 to $24,999 | 0 (0.0%) | 0 (0.0%) |
| $25,000 to $29,999 | 0 (0.0%) | 0 (0.0%) |
| $30,000 to $34,999 | 25 (11.4%) | 23 (10.9%) |
| $35,000 to $39,999 | 26 (11.9%) | 0 (0.0%) |
| $40,000 to $44,999 | 0 (0.0%) | 50 (23.7%) |
| $45,000 to $49,999 | 25 (11.4%) | 0 (0.0%) |
| $50,000 to $54,999 | 0 (0.0%) | 0 (0.0%) |
| $55,000 to $64,999 | 49 (22.4%) | 0 (0.0%) |
| $65,000 to $74,999 | 0 (0.0%) | 0 (0.0%) |
| $75,000 to $99,999 | 12 (5.5%) | 91 (43.1%) |
| $100,000+ | 14 (6.4%) | 0 (0.0%) |
| Total | 219 (100.0%) | 211 (100.0%) |
Earnings by Sex by Educational Attainment in Hide A Way Hills
| Educational Attainment | Male Income | Female Income |
| Less than High School | - | - |
| High School Diploma | - | - |
| College or Associate's Degree | - | - |
| Bachelor's Degree | - | - |
| Graduate Degree | - | - |
| Total | $47,600 | $75,192 |
Family Income in Hide A Way Hills
Family Income Brackets in Hide A Way Hills
According to the Hide A Way Hills family income data, there are 199 families falling into the $100,000 to $149,999 income range, which is the most common income bracket and makes up 58.4% of all families.
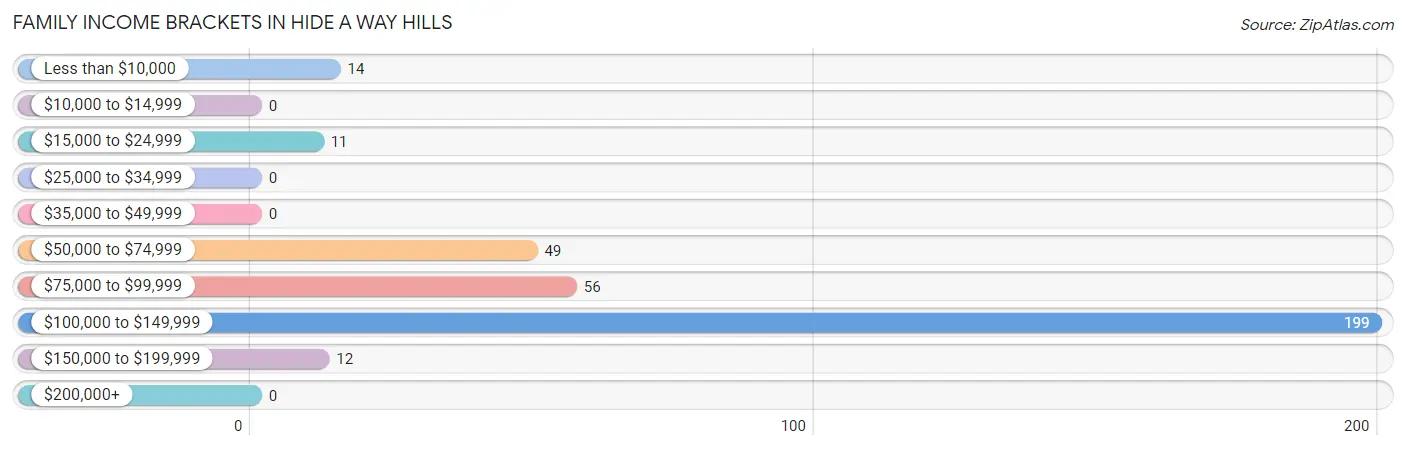
| Income Bracket | # Families | % Families |
| Less than $10,000 | 14 | 4.1% |
| $10,000 to $14,999 | 0 | 0.0% |
| $15,000 to $24,999 | 11 | 3.2% |
| $25,000 to $34,999 | 0 | 0.0% |
| $35,000 to $49,999 | 0 | 0.0% |
| $50,000 to $74,999 | 49 | 14.4% |
| $75,000 to $99,999 | 56 | 16.4% |
| $100,000 to $149,999 | 199 | 58.4% |
| $150,000 to $199,999 | 12 | 3.5% |
| $200,000+ | 0 | 0.0% |
Family Income by Famaliy Size in Hide A Way Hills
2-person families (195 | 57.2%) account for the highest median family income in Hide A Way Hills with $116,958 per family, while 2-person families (195 | 57.2%) have the highest median income of $58,479 per family member.
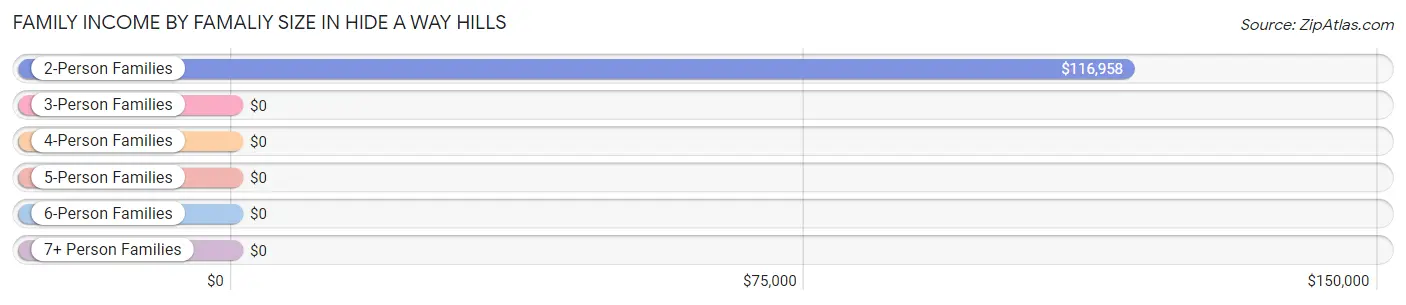
| Income Bracket | # Families | Median Income |
| 2-Person Families | 195 (57.2%) | $116,958 |
| 3-Person Families | 63 (18.5%) | $0 |
| 4-Person Families | 50 (14.7%) | $0 |
| 5-Person Families | 0 (0.0%) | $0 |
| 6-Person Families | 33 (9.7%) | $0 |
| 7+ Person Families | 0 (0.0%) | $0 |
| Total | 341 (100.0%) | $109,525 |
Family Income by Number of Earners in Hide A Way Hills
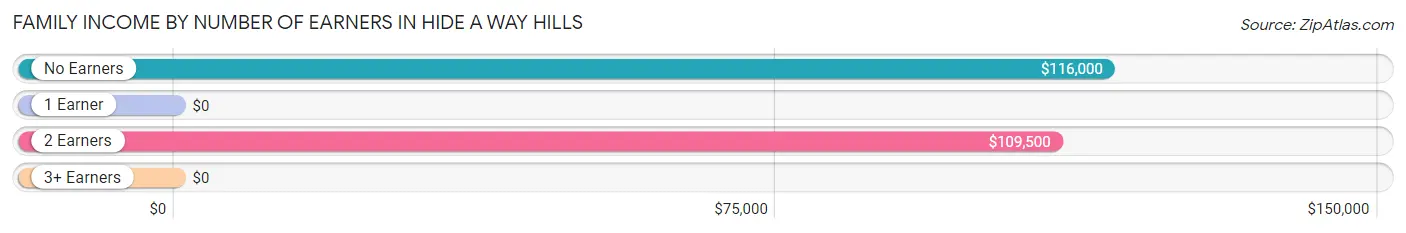
| Number of Earners | # Families | Median Income |
| No Earners | 144 (42.2%) | $116,000 |
| 1 Earner | 14 (4.1%) | $0 |
| 2 Earners | 146 (42.8%) | $109,500 |
| 3+ Earners | 37 (10.8%) | $0 |
| Total | 341 (100.0%) | $109,525 |
Household Income in Hide A Way Hills
Household Income Brackets in Hide A Way Hills
With 199 households falling in the category, the $100,000 to $149,999 income range is the most frequent in Hide A Way Hills, accounting for 54.2% of all households.
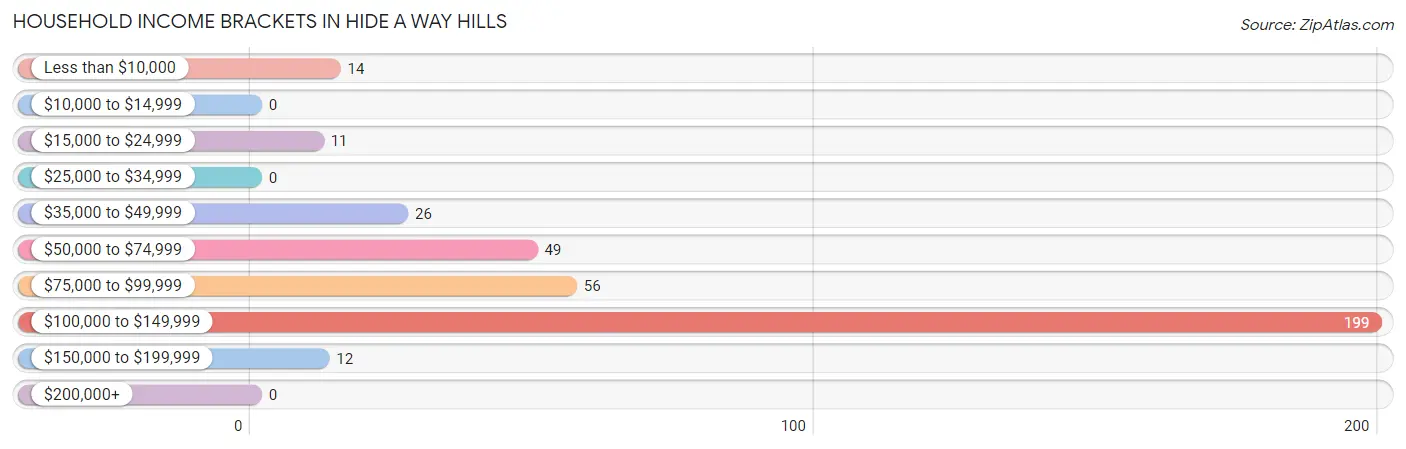
| Income Bracket | # Households | % Households |
| Less than $10,000 | 14 | 3.8% |
| $10,000 to $14,999 | 0 | 0.0% |
| $15,000 to $24,999 | 11 | 3.0% |
| $25,000 to $34,999 | 0 | 0.0% |
| $35,000 to $49,999 | 26 | 7.1% |
| $50,000 to $74,999 | 49 | 13.4% |
| $75,000 to $99,999 | 56 | 15.3% |
| $100,000 to $149,999 | 199 | 54.2% |
| $150,000 to $199,999 | 12 | 3.3% |
| $200,000+ | 0 | 0.0% |
Household Income by Householder Age in Hide A Way Hills
The median household income in Hide A Way Hills is $108,875, with the highest median household income of $117,042 found in the 65+ years age bracket for the primary householder. A total of 169 households (46.1%) fall into this category.
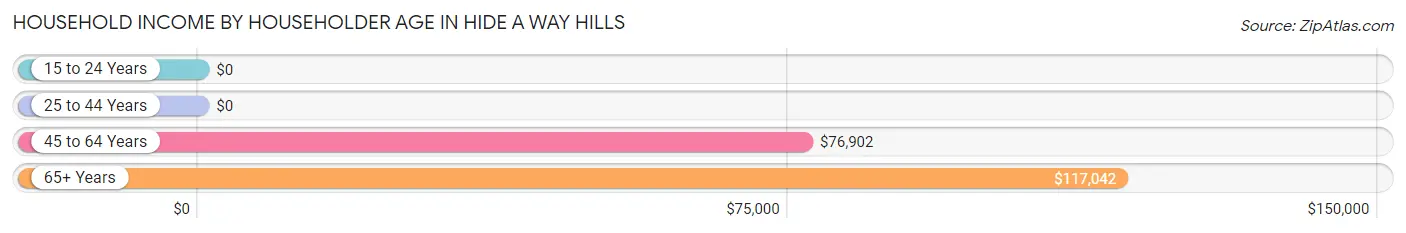
| Income Bracket | # Households | Median Income |
| 15 to 24 Years | 0 (0.0%) | $0 |
| 25 to 44 Years | 83 (22.6%) | $0 |
| 45 to 64 Years | 115 (31.3%) | $76,902 |
| 65+ Years | 169 (46.1%) | $117,042 |
| Total | 367 (100.0%) | $108,875 |
Poverty in Hide A Way Hills
Income Below Poverty by Sex and Age in Hide A Way Hills
With 7.4% poverty level for males and 2.8% for females among the residents of Hide A Way Hills, 18 to 24 year old males and 45 to 54 year old females are the most vulnerable to poverty, with 21 males (30.0%) and 14 females (22.2%) in their respective age groups living below the poverty level.
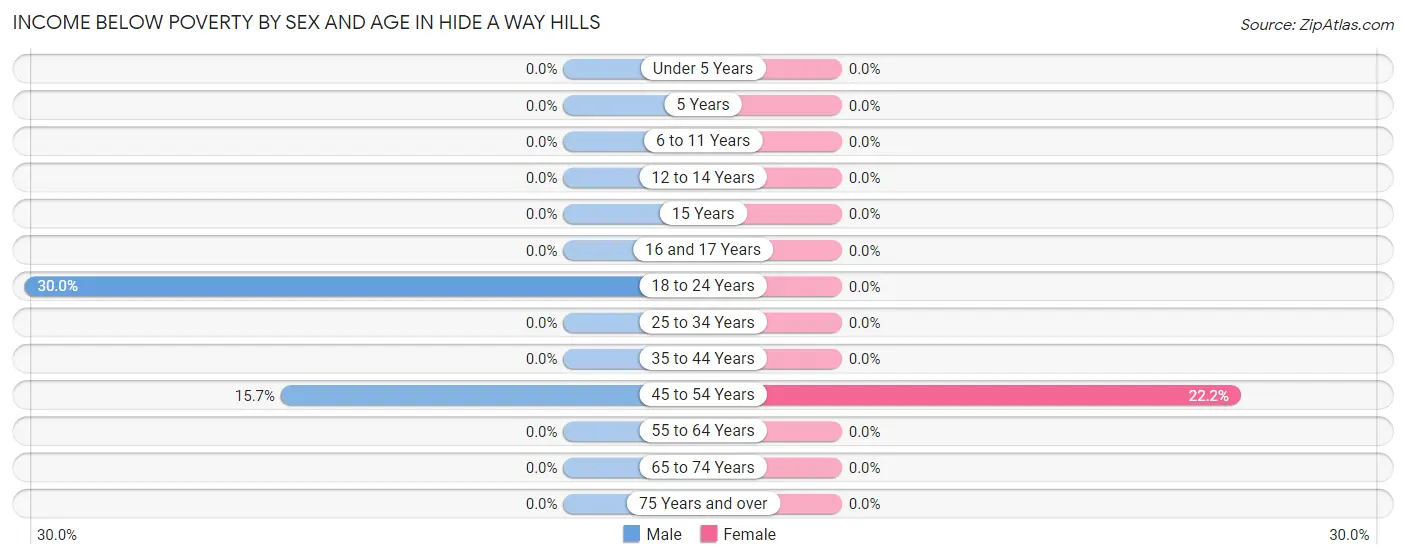
| Age Bracket | Male | Female |
| Under 5 Years | 0 (0.0%) | 0 (0.0%) |
| 5 Years | 0 (0.0%) | 0 (0.0%) |
| 6 to 11 Years | 0 (0.0%) | 0 (0.0%) |
| 12 to 14 Years | 0 (0.0%) | 0 (0.0%) |
| 15 Years | 0 (0.0%) | 0 (0.0%) |
| 16 and 17 Years | 0 (0.0%) | 0 (0.0%) |
| 18 to 24 Years | 21 (30.0%) | 0 (0.0%) |
| 25 to 34 Years | 0 (0.0%) | 0 (0.0%) |
| 35 to 44 Years | 0 (0.0%) | 0 (0.0%) |
| 45 to 54 Years | 14 (15.7%) | 14 (22.2%) |
| 55 to 64 Years | 0 (0.0%) | 0 (0.0%) |
| 65 to 74 Years | 0 (0.0%) | 0 (0.0%) |
| 75 Years and over | 0 (0.0%) | 0 (0.0%) |
| Total | 35 (7.4%) | 14 (2.8%) |
Income Above Poverty by Sex and Age in Hide A Way Hills
According to the poverty statistics in Hide A Way Hills, males aged 6 to 11 years and females aged 6 to 11 years are the age groups that are most secure financially, with 100.0% of males and 100.0% of females in these age groups living above the poverty line.
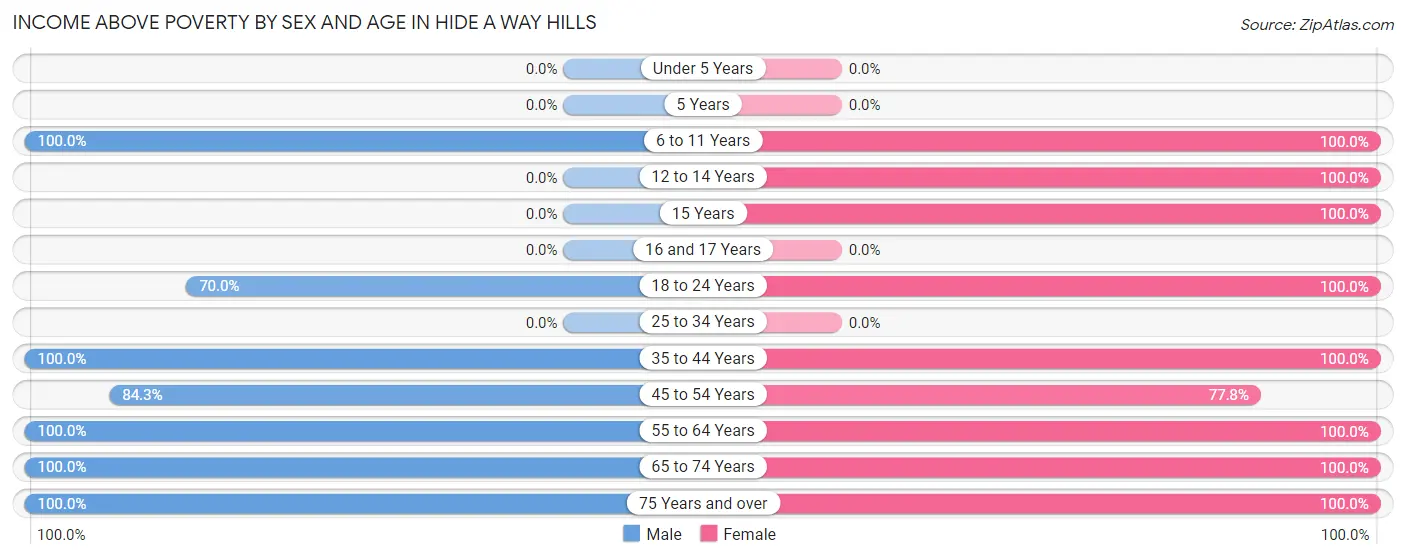
| Age Bracket | Male | Female |
| Under 5 Years | 0 (0.0%) | 0 (0.0%) |
| 5 Years | 0 (0.0%) | 0 (0.0%) |
| 6 to 11 Years | 72 (100.0%) | 17 (100.0%) |
| 12 to 14 Years | 0 (0.0%) | 27 (100.0%) |
| 15 Years | 0 (0.0%) | 30 (100.0%) |
| 16 and 17 Years | 0 (0.0%) | 0 (0.0%) |
| 18 to 24 Years | 49 (70.0%) | 69 (100.0%) |
| 25 to 34 Years | 0 (0.0%) | 0 (0.0%) |
| 35 to 44 Years | 33 (100.0%) | 80 (100.0%) |
| 45 to 54 Years | 75 (84.3%) | 49 (77.8%) |
| 55 to 64 Years | 51 (100.0%) | 80 (100.0%) |
| 65 to 74 Years | 110 (100.0%) | 90 (100.0%) |
| 75 Years and over | 48 (100.0%) | 49 (100.0%) |
| Total | 438 (92.6%) | 491 (97.2%) |
Income Below Poverty Among Married-Couple Families in Hide A Way Hills
The poverty statistics for married-couple families in Hide A Way Hills show that 4.1% or 14 of the total 341 families live below the poverty line. Families with no children have the highest poverty rate of 5.4%, comprising of 14 families. On the other hand, families with 1 or 2 children have the lowest poverty rate of 0.0%, which includes 0 families.
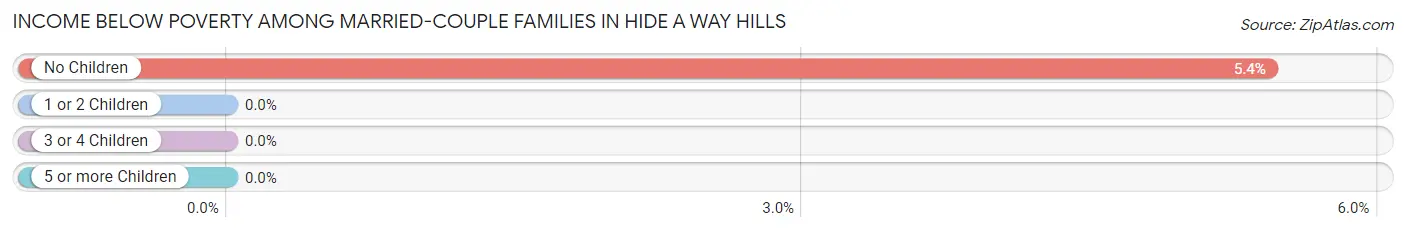
| Children | Above Poverty | Below Poverty |
| No Children | 244 (94.6%) | 14 (5.4%) |
| 1 or 2 Children | 50 (100.0%) | 0 (0.0%) |
| 3 or 4 Children | 33 (100.0%) | 0 (0.0%) |
| 5 or more Children | 0 (0.0%) | 0 (0.0%) |
| Total | 327 (95.9%) | 14 (4.1%) |
Income Below Poverty Among Single-Parent Households in Hide A Way Hills
| Children | Single Father | Single Mother |
| No Children | 0 (0.0%) | 0 (0.0%) |
| 1 or 2 Children | 0 (0.0%) | 0 (0.0%) |
| 3 or 4 Children | 0 (0.0%) | 0 (0.0%) |
| 5 or more Children | 0 (0.0%) | 0 (0.0%) |
| Total | 0 (0.0%) | 0 (0.0%) |
Income Below Poverty Among Married-Couple vs Single-Parent Households in Hide A Way Hills
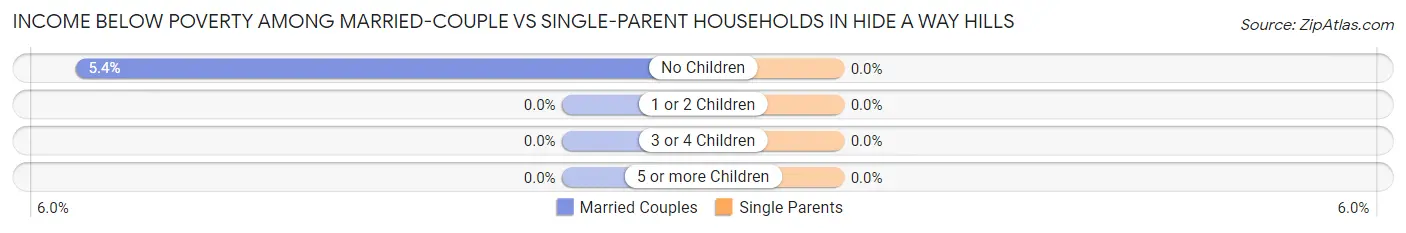
| Children | Married-Couple Families | Single-Parent Households |
| No Children | 14 (5.4%) | 0 (0.0%) |
| 1 or 2 Children | 0 (0.0%) | 0 (0.0%) |
| 3 or 4 Children | 0 (0.0%) | 0 (0.0%) |
| 5 or more Children | 0 (0.0%) | 0 (0.0%) |
| Total | 14 (4.1%) | 0 (0.0%) |
Race in Hide A Way Hills
The most populous races in Hide A Way Hills are White / Caucasian (929 | 95.0%), and Two or more Races (49 | 5.0%).
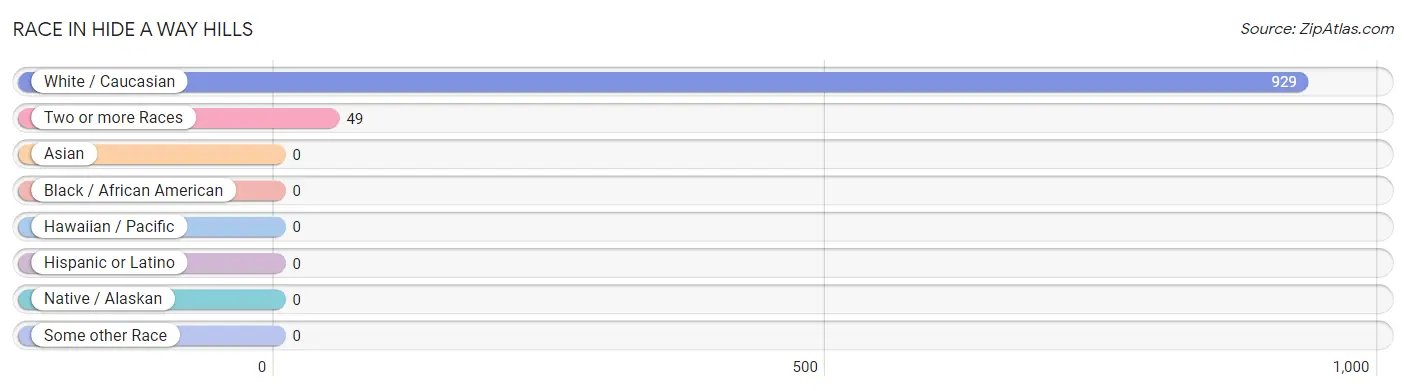
| Race | # Population | % Population |
| Asian | 0 | 0.0% |
| Black / African American | 0 | 0.0% |
| Hawaiian / Pacific | 0 | 0.0% |
| Hispanic or Latino | 0 | 0.0% |
| Native / Alaskan | 0 | 0.0% |
| White / Caucasian | 929 | 95.0% |
| Two or more Races | 49 | 5.0% |
| Some other Race | 0 | 0.0% |
| Total | 978 | 100.0% |
Ancestry in Hide A Way Hills
The most populous ancestries reported in Hide A Way Hills are German (282 | 28.8%), American (193 | 19.7%), Scottish (154 | 15.8%), Irish (71 | 7.3%), and European (61 | 6.2%), together accounting for 77.8% of all Hide A Way Hills residents.
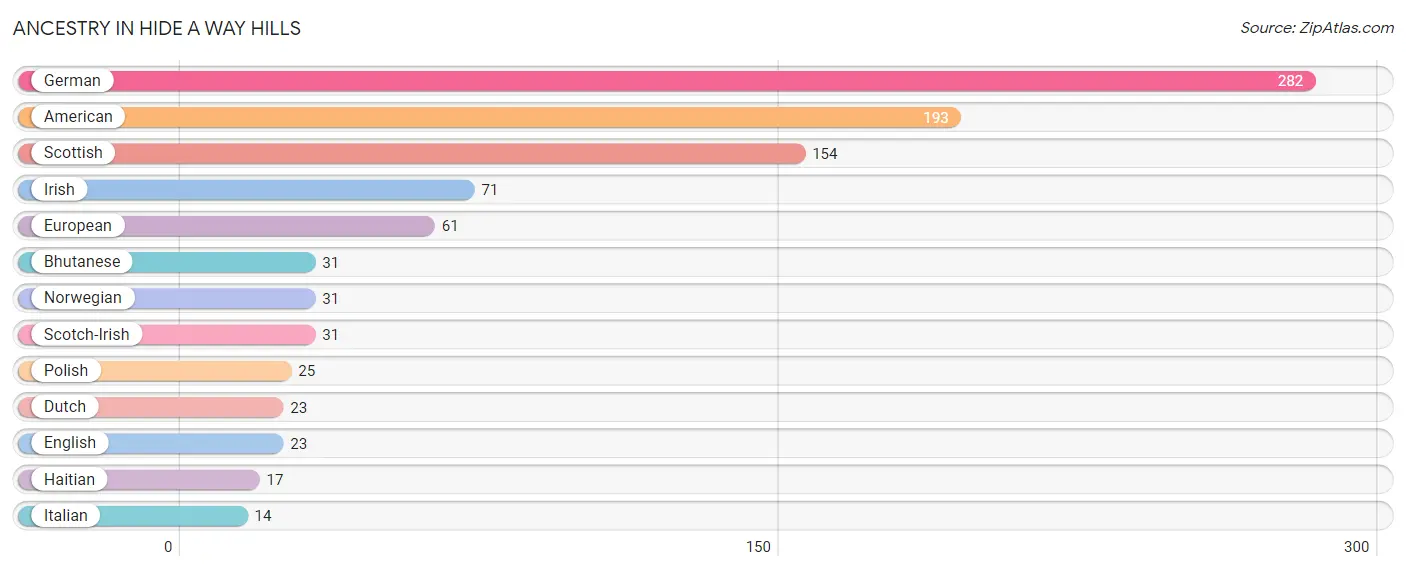
| Ancestry | # Population | % Population |
| American | 193 | 19.7% |
| Bhutanese | 31 | 3.2% |
| Dutch | 23 | 2.4% |
| English | 23 | 2.4% |
| European | 61 | 6.2% |
| German | 282 | 28.8% |
| Haitian | 17 | 1.7% |
| Irish | 71 | 7.3% |
| Italian | 14 | 1.4% |
| Norwegian | 31 | 3.2% |
| Polish | 25 | 2.6% |
| Scotch-Irish | 31 | 3.2% |
| Scottish | 154 | 15.8% | View All 13 Rows |
Immigrants in Hide A Way Hills

| Immigration Origin | # Population | % Population | View All 0 Rows |
Sex and Age in Hide A Way Hills
Sex and Age in Hide A Way Hills
The most populous age groups in Hide A Way Hills are 50 to 54 Years (89 | 18.8%) for men and 40 to 44 Years (80 | 15.8%) for women.
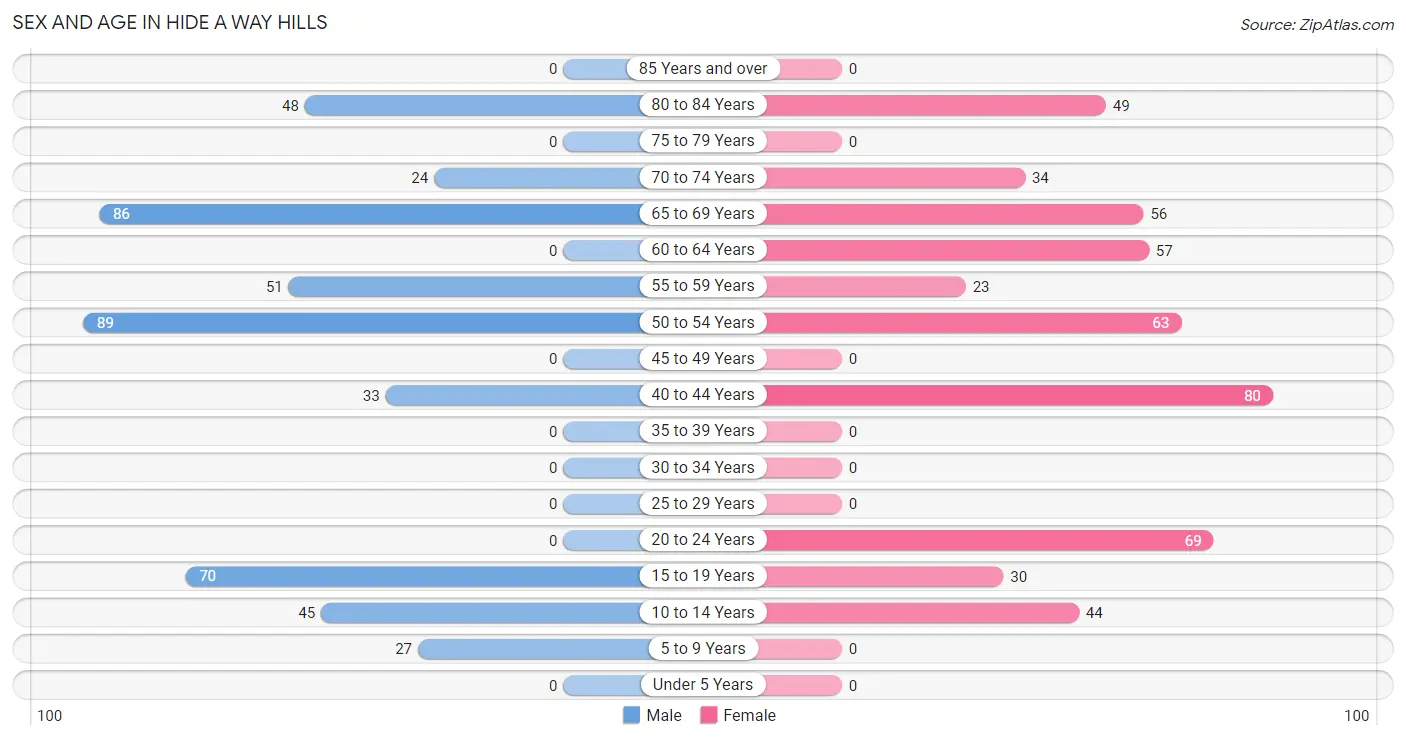
| Age Bracket | Male | Female |
| Under 5 Years | 0 (0.0%) | 0 (0.0%) |
| 5 to 9 Years | 27 (5.7%) | 0 (0.0%) |
| 10 to 14 Years | 45 (9.5%) | 44 (8.7%) |
| 15 to 19 Years | 70 (14.8%) | 30 (5.9%) |
| 20 to 24 Years | 0 (0.0%) | 69 (13.7%) |
| 25 to 29 Years | 0 (0.0%) | 0 (0.0%) |
| 30 to 34 Years | 0 (0.0%) | 0 (0.0%) |
| 35 to 39 Years | 0 (0.0%) | 0 (0.0%) |
| 40 to 44 Years | 33 (7.0%) | 80 (15.8%) |
| 45 to 49 Years | 0 (0.0%) | 0 (0.0%) |
| 50 to 54 Years | 89 (18.8%) | 63 (12.5%) |
| 55 to 59 Years | 51 (10.8%) | 23 (4.5%) |
| 60 to 64 Years | 0 (0.0%) | 57 (11.3%) |
| 65 to 69 Years | 86 (18.2%) | 56 (11.1%) |
| 70 to 74 Years | 24 (5.1%) | 34 (6.7%) |
| 75 to 79 Years | 0 (0.0%) | 0 (0.0%) |
| 80 to 84 Years | 48 (10.2%) | 49 (9.7%) |
| 85 Years and over | 0 (0.0%) | 0 (0.0%) |
| Total | 473 (100.0%) | 505 (100.0%) |
Families and Households in Hide A Way Hills
Median Family Size in Hide A Way Hills
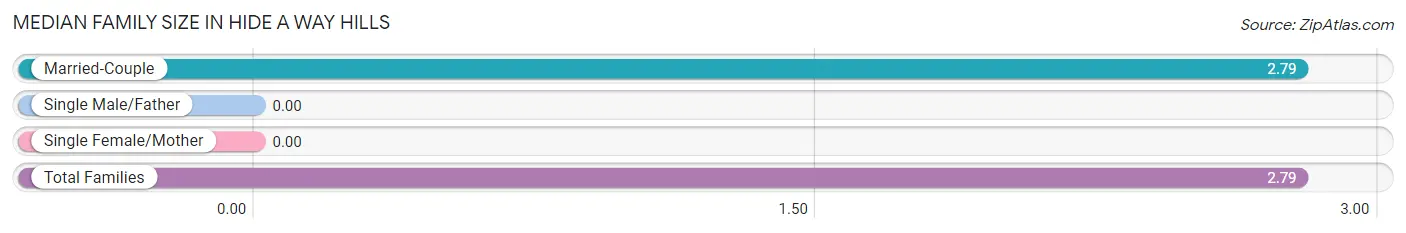
| Family Type | # Families | Family Size |
| Married-Couple | 341 (100.0%) | 2.79 |
| Single Male/Father | 0 (0.0%) | - |
| Single Female/Mother | 0 (0.0%) | - |
| Total Families | 341 (100.0%) | 2.79 |
Median Household Size in Hide A Way Hills
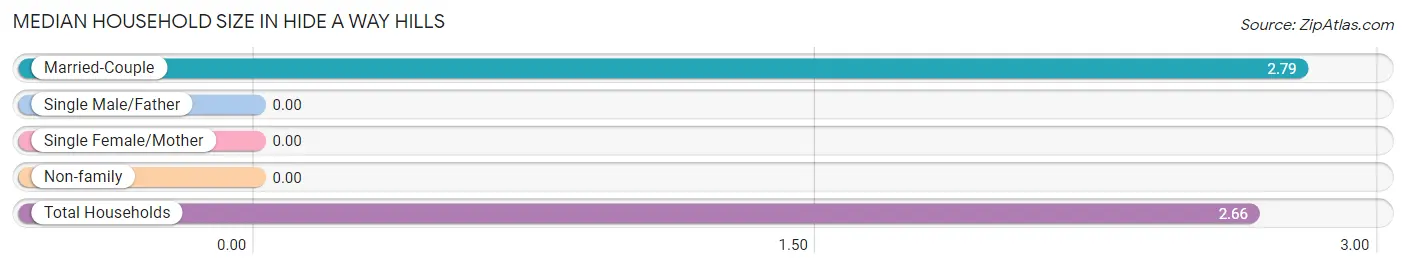
| Household Type | # Households | Household Size |
| Married-Couple | 341 (92.9%) | 2.79 |
| Single Male/Father | 0 (0.0%) | - |
| Single Female/Mother | 0 (0.0%) | - |
| Non-family | 26 (7.1%) | - |
| Total Households | 367 (100.0%) | 2.66 |
Household Size by Marriage Status in Hide A Way Hills
Out of a total of 367 households in Hide A Way Hills, 341 (92.9%) are family households, while 26 (7.1%) are nonfamily households. The most numerous type of family households are 2-person households, comprising 195, and the most common type of nonfamily households are 1-person households, comprising 26.
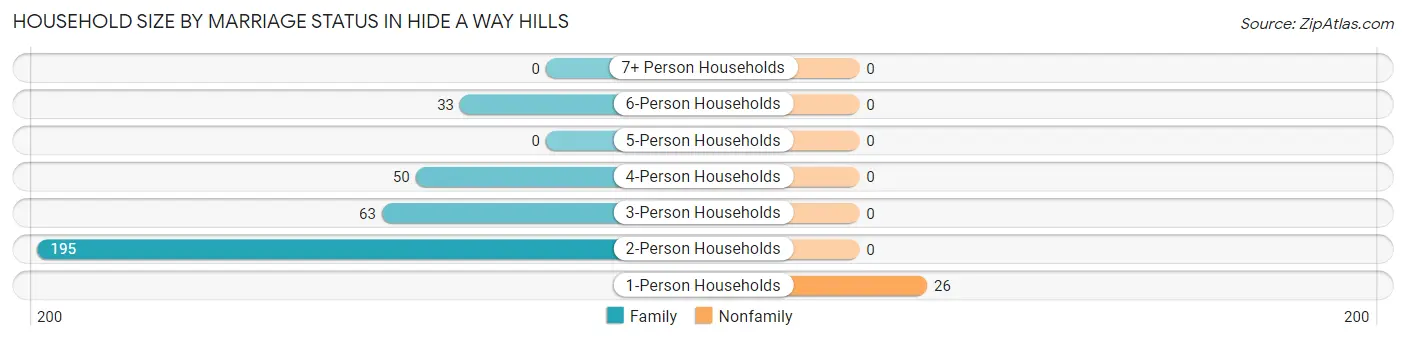
| Household Size | Family Households | Nonfamily Households |
| 1-Person Households | - | 26 (7.1%) |
| 2-Person Households | 195 (53.1%) | 0 (0.0%) |
| 3-Person Households | 63 (17.2%) | 0 (0.0%) |
| 4-Person Households | 50 (13.6%) | 0 (0.0%) |
| 5-Person Households | 0 (0.0%) | 0 (0.0%) |
| 6-Person Households | 33 (9.0%) | 0 (0.0%) |
| 7+ Person Households | 0 (0.0%) | 0 (0.0%) |
| Total | 341 (92.9%) | 26 (7.1%) |
Female Fertility in Hide A Way Hills
Fertility by Age in Hide A Way Hills
| Age Bracket | Women with Births | Births / 1,000 Women |
| 15 to 19 years | 0 (0.0%) | 0.0 |
| 20 to 34 years | 0 (0.0%) | 0.0 |
| 35 to 50 years | 0 (0.0%) | 0.0 |
| Total | 0 (0.0%) | 0.0 |
Fertility by Age by Marriage Status in Hide A Way Hills
| Age Bracket | Married | Unmarried |
| 15 to 19 years | 0 (0.0%) | 0 (0.0%) |
| 20 to 34 years | 0 (0.0%) | 0 (0.0%) |
| 35 to 50 years | 0 (0.0%) | 0 (0.0%) |
| Total | 0 (0.0%) | 0 (0.0%) |
Fertility by Education in Hide A Way Hills
| Educational Attainment | Women with Births | Births / 1,000 Women |
| Less than High School | 0 (0.0%) | 0.0 |
| High School Diploma | 0 (0.0%) | 0.0 |
| College or Associate's Degree | 0 (0.0%) | 0.0 |
| Bachelor's Degree | 0 (0.0%) | 0.0 |
| Graduate Degree | 0 (0.0%) | 0.0 |
| Total | 0 (0.0%) | 0.0 |
Fertility by Education by Marriage Status in Hide A Way Hills
| Educational Attainment | Married | Unmarried |
| Less than High School | 0 (0.0%) | 0 (0.0%) |
| High School Diploma | 0 (0.0%) | 0 (0.0%) |
| College or Associate's Degree | 0 (0.0%) | 0 (0.0%) |
| Bachelor's Degree | 0 (0.0%) | 0 (0.0%) |
| Graduate Degree | 0 (0.0%) | 0 (0.0%) |
| Total | 0 (0.0%) | 0 (0.0%) |
Employment Characteristics in Hide A Way Hills
Employment by Class of Employer in Hide A Way Hills
Among the 376 employed individuals in Hide A Way Hills, private company employees (218 | 58.0%), local government employees (76 | 20.2%), and self-employed (not incorporated) (49 | 13.0%) make up the most common classes of employment.
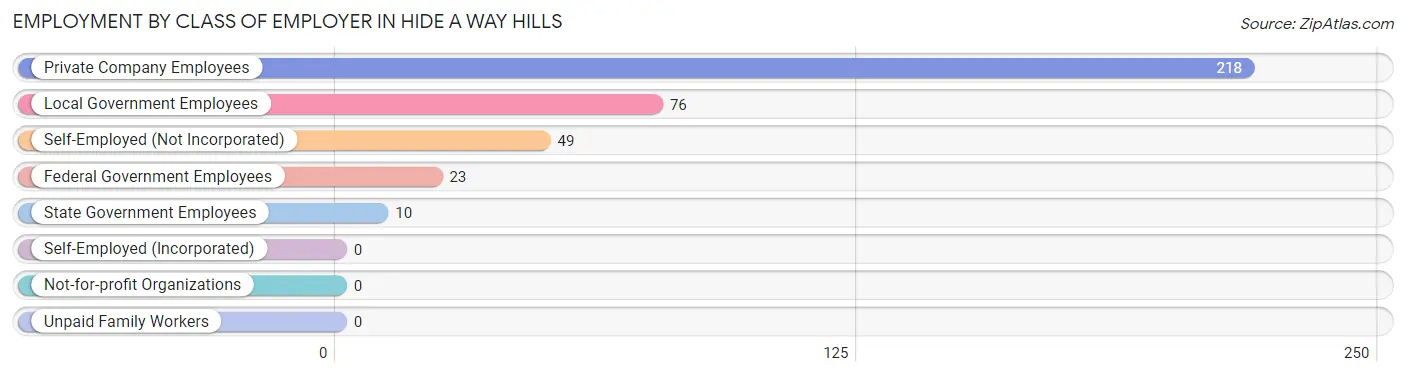
| Employer Class | # Employees | % Employees |
| Private Company Employees | 218 | 58.0% |
| Self-Employed (Incorporated) | 0 | 0.0% |
| Self-Employed (Not Incorporated) | 49 | 13.0% |
| Not-for-profit Organizations | 0 | 0.0% |
| Local Government Employees | 76 | 20.2% |
| State Government Employees | 10 | 2.7% |
| Federal Government Employees | 23 | 6.1% |
| Unpaid Family Workers | 0 | 0.0% |
| Total | 376 | 100.0% |
Employment Status by Age in Hide A Way Hills
According to the labor force statistics for Hide A Way Hills, out of the total population over 16 years of age (832), 49.2% or 409 individuals are in the labor force, with 8.1% or 33 of them unemployed. The age group with the highest labor force participation rate is 35 to 44 years, with 100.0% or 113 individuals in the labor force. Within the labor force, the 35 to 44 years age range has the highest percentage of unemployed individuals, with 29.2% or 33 of them being unemployed.
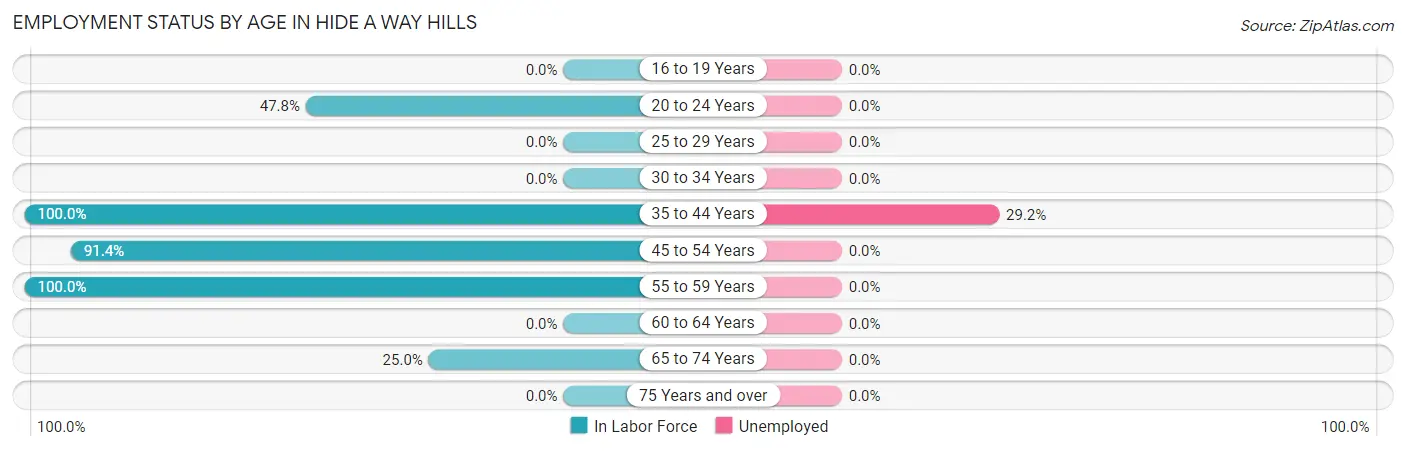
| Age Bracket | In Labor Force | Unemployed |
| 16 to 19 Years | 0 (0.0%) | 0 (0.0%) |
| 20 to 24 Years | 33 (47.8%) | 0 (0.0%) |
| 25 to 29 Years | 0 (0.0%) | 0 (0.0%) |
| 30 to 34 Years | 0 (0.0%) | 0 (0.0%) |
| 35 to 44 Years | 113 (100.0%) | 33 (29.2%) |
| 45 to 54 Years | 139 (91.4%) | 0 (0.0%) |
| 55 to 59 Years | 74 (100.0%) | 0 (0.0%) |
| 60 to 64 Years | 0 (0.0%) | 0 (0.0%) |
| 65 to 74 Years | 50 (25.0%) | 0 (0.0%) |
| 75 Years and over | 0 (0.0%) | 0 (0.0%) |
| Total | 409 (49.2%) | 33 (8.1%) |
Employment Status by Educational Attainment in Hide A Way Hills
According to labor force statistics for Hide A Way Hills, 82.3% of individuals (326) out of the total population between 25 and 64 years of age (396) are in the labor force, with 10.1% or 33 of them being unemployed. The group with the highest labor force participation rate are those with the educational attainment of high school diploma, with 100.0% or 78 individuals in the labor force. Within the labor force, individuals with college / associate degree education have the highest percentage of unemployment, with 24.1% or 33 of them being unemployed.
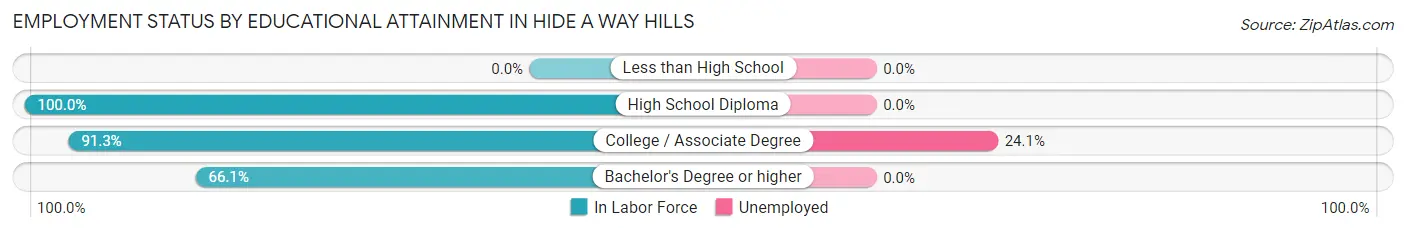
| Educational Attainment | In Labor Force | Unemployed |
| Less than High School | 0 (0.0%) | 0 (0.0%) |
| High School Diploma | 78 (100.0%) | 0 (0.0%) |
| College / Associate Degree | 137 (91.3%) | 36 (24.1%) |
| Bachelor's Degree or higher | 111 (66.1%) | 0 (0.0%) |
| Total | 326 (82.3%) | 40 (10.1%) |
Employment Occupations by Sex in Hide A Way Hills
Management, Business, Science and Arts Occupations
The most common Management, Business, Science and Arts occupations in Hide A Way Hills are Management (78 | 20.7%), Community & Social Service (62 | 16.5%), Arts, Media & Entertainment (52 | 13.8%), Computers, Engineering & Science (42 | 11.2%), and Computers & Mathematics (30 | 8.0%).
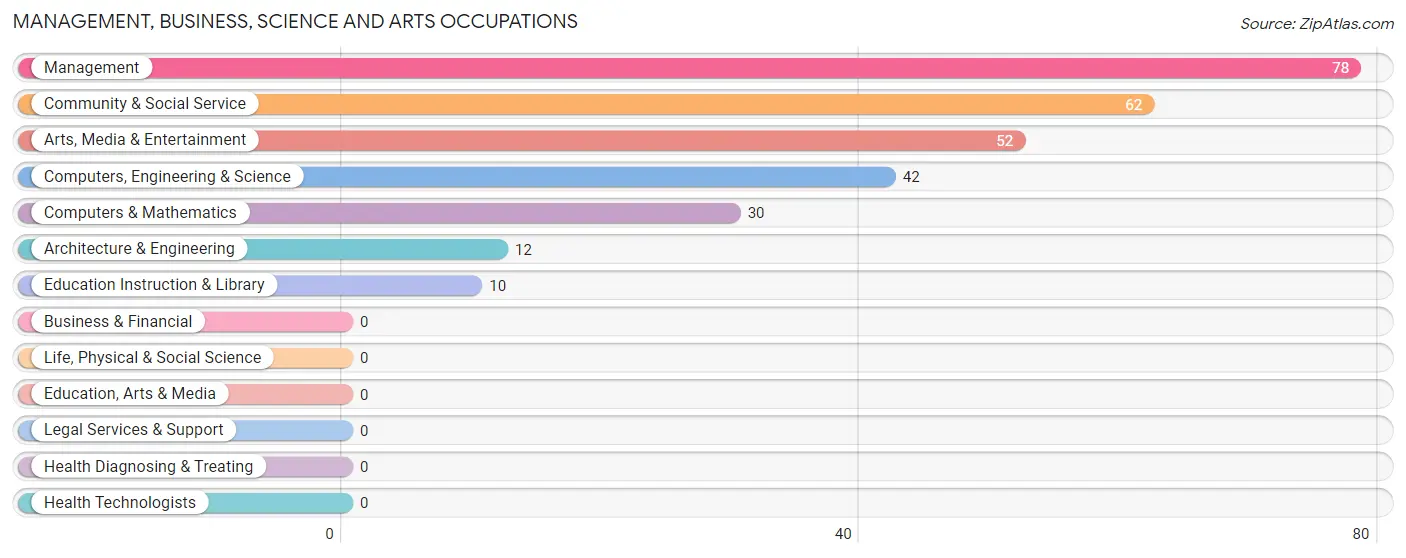
Management, Business, Science and Arts Occupations by Sex
Within the Management, Business, Science and Arts occupations in Hide A Way Hills, the most male-oriented occupations are Architecture & Engineering (100.0%), Management (50.0%), and Arts, Media & Entertainment (50.0%), while the most female-oriented occupations are Computers & Mathematics (100.0%), Education Instruction & Library (100.0%), and Computers, Engineering & Science (71.4%).
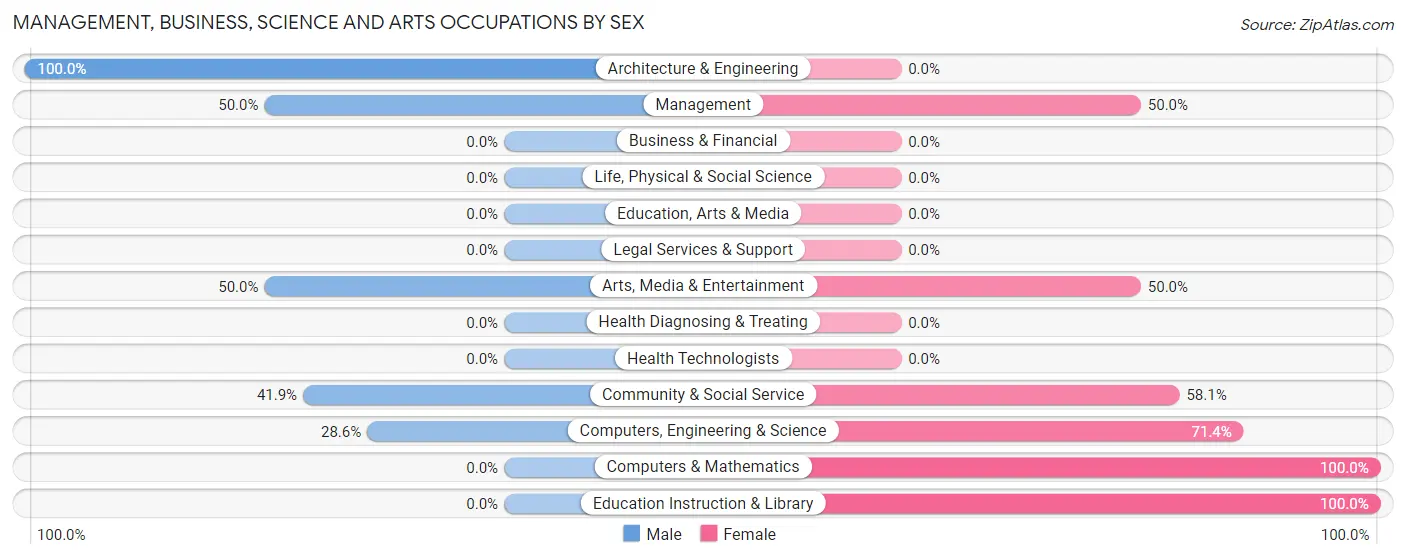
| Occupation | Male | Female |
| Management | 39 (50.0%) | 39 (50.0%) |
| Business & Financial | 0 (0.0%) | 0 (0.0%) |
| Computers, Engineering & Science | 12 (28.6%) | 30 (71.4%) |
| Computers & Mathematics | 0 (0.0%) | 30 (100.0%) |
| Architecture & Engineering | 12 (100.0%) | 0 (0.0%) |
| Life, Physical & Social Science | 0 (0.0%) | 0 (0.0%) |
| Community & Social Service | 26 (41.9%) | 36 (58.1%) |
| Education, Arts & Media | 0 (0.0%) | 0 (0.0%) |
| Legal Services & Support | 0 (0.0%) | 0 (0.0%) |
| Education Instruction & Library | 0 (0.0%) | 10 (100.0%) |
| Arts, Media & Entertainment | 26 (50.0%) | 26 (50.0%) |
| Health Diagnosing & Treating | 0 (0.0%) | 0 (0.0%) |
| Health Technologists | 0 (0.0%) | 0 (0.0%) |
| Total (Category) | 77 (42.3%) | 105 (57.7%) |
| Total (Overall) | 165 (43.9%) | 211 (56.1%) |
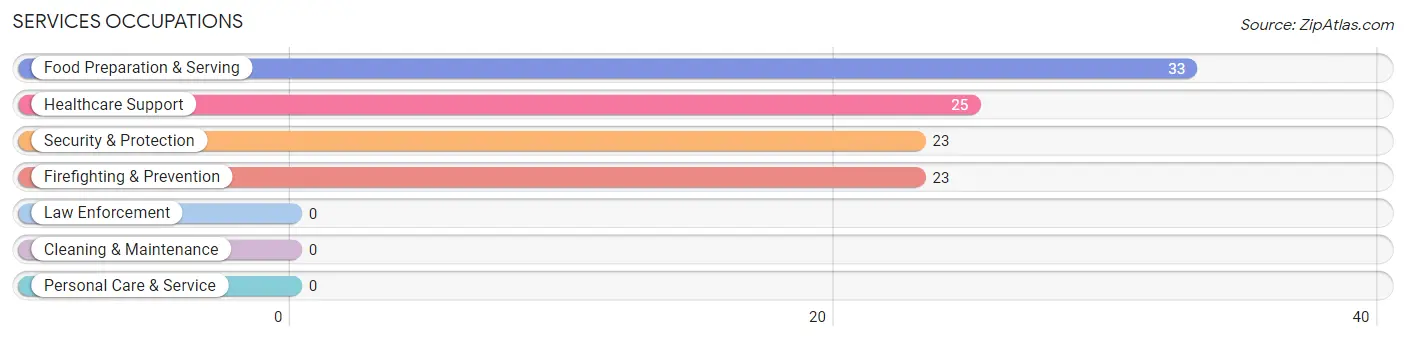
Services Occupations
The most common Services occupations in Hide A Way Hills are Food Preparation & Serving (33 | 8.8%), Healthcare Support (25 | 6.7%), Security & Protection (23 | 6.1%), and Firefighting & Prevention (23 | 6.1%).
Services Occupations by Sex
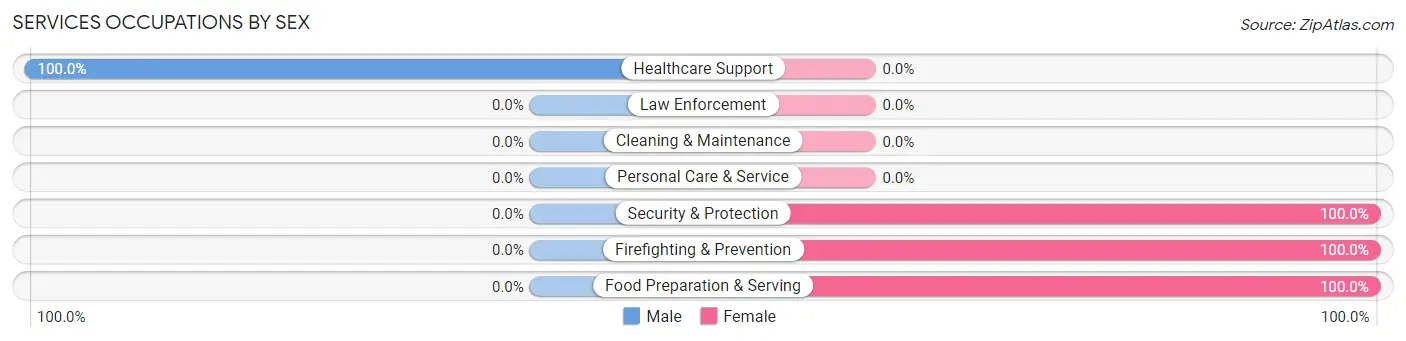
| Occupation | Male | Female |
| Healthcare Support | 25 (100.0%) | 0 (0.0%) |
| Security & Protection | 0 (0.0%) | 23 (100.0%) |
| Firefighting & Prevention | 0 (0.0%) | 23 (100.0%) |
| Law Enforcement | 0 (0.0%) | 0 (0.0%) |
| Food Preparation & Serving | 0 (0.0%) | 33 (100.0%) |
| Cleaning & Maintenance | 0 (0.0%) | 0 (0.0%) |
| Personal Care & Service | 0 (0.0%) | 0 (0.0%) |
| Total (Category) | 25 (30.9%) | 56 (69.1%) |
| Total (Overall) | 165 (43.9%) | 211 (56.1%) |
Sales and Office Occupations
The most common Sales and Office occupations in Hide A Way Hills are , and Office & Administration (50 | 13.3%).
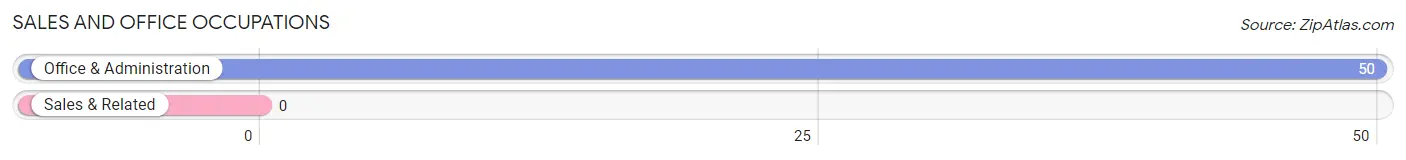
Sales and Office Occupations by Sex
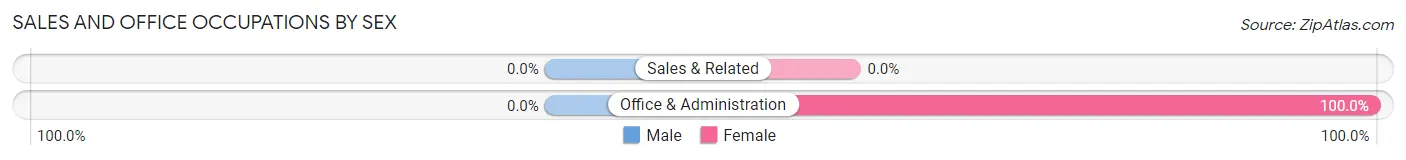
| Occupation | Male | Female |
| Sales & Related | 0 (0.0%) | 0 (0.0%) |
| Office & Administration | 0 (0.0%) | 50 (100.0%) |
| Total (Category) | 0 (0.0%) | 50 (100.0%) |
| Total (Overall) | 165 (43.9%) | 211 (56.1%) |
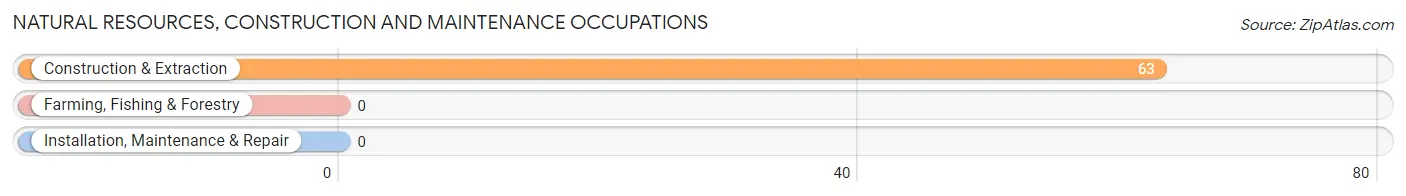
Natural Resources, Construction and Maintenance Occupations
The most common Natural Resources, Construction and Maintenance occupations in Hide A Way Hills are , and Construction & Extraction (63 | 16.8%).
Natural Resources, Construction and Maintenance Occupations by Sex
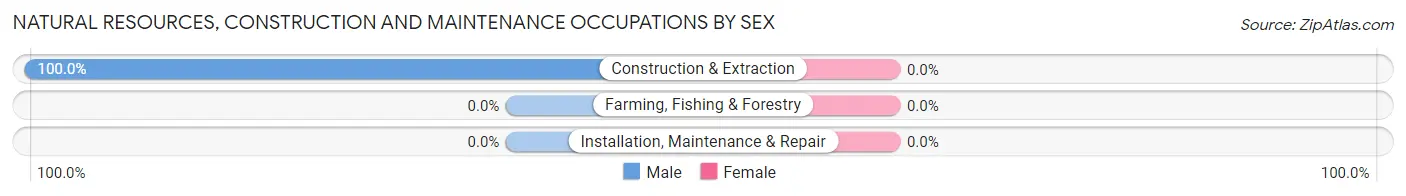
| Occupation | Male | Female |
| Farming, Fishing & Forestry | 0 (0.0%) | 0 (0.0%) |
| Construction & Extraction | 63 (100.0%) | 0 (0.0%) |
| Installation, Maintenance & Repair | 0 (0.0%) | 0 (0.0%) |
| Total (Category) | 63 (100.0%) | 0 (0.0%) |
| Total (Overall) | 165 (43.9%) | 211 (56.1%) |
Production, Transportation and Moving Occupations
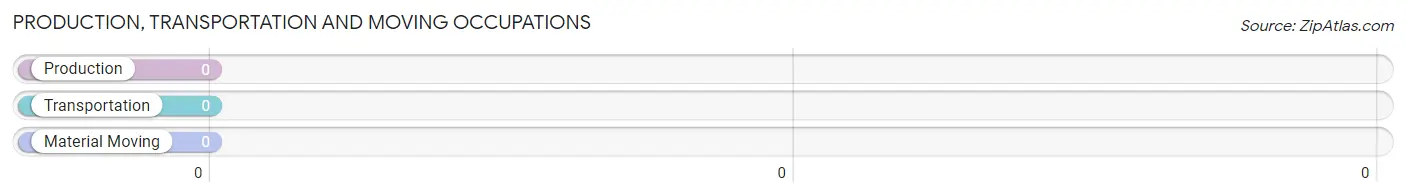
Production, Transportation and Moving Occupations by Sex
| Occupation | Male | Female |
| Production | 0 (0.0%) | 0 (0.0%) |
| Transportation | 0 (0.0%) | 0 (0.0%) |
| Material Moving | 0 (0.0%) | 0 (0.0%) |
| Total (Category) | 0 (0.0%) | 0 (0.0%) |
| Total (Overall) | 165 (43.9%) | 211 (56.1%) |
Employment Industries by Sex in Hide A Way Hills
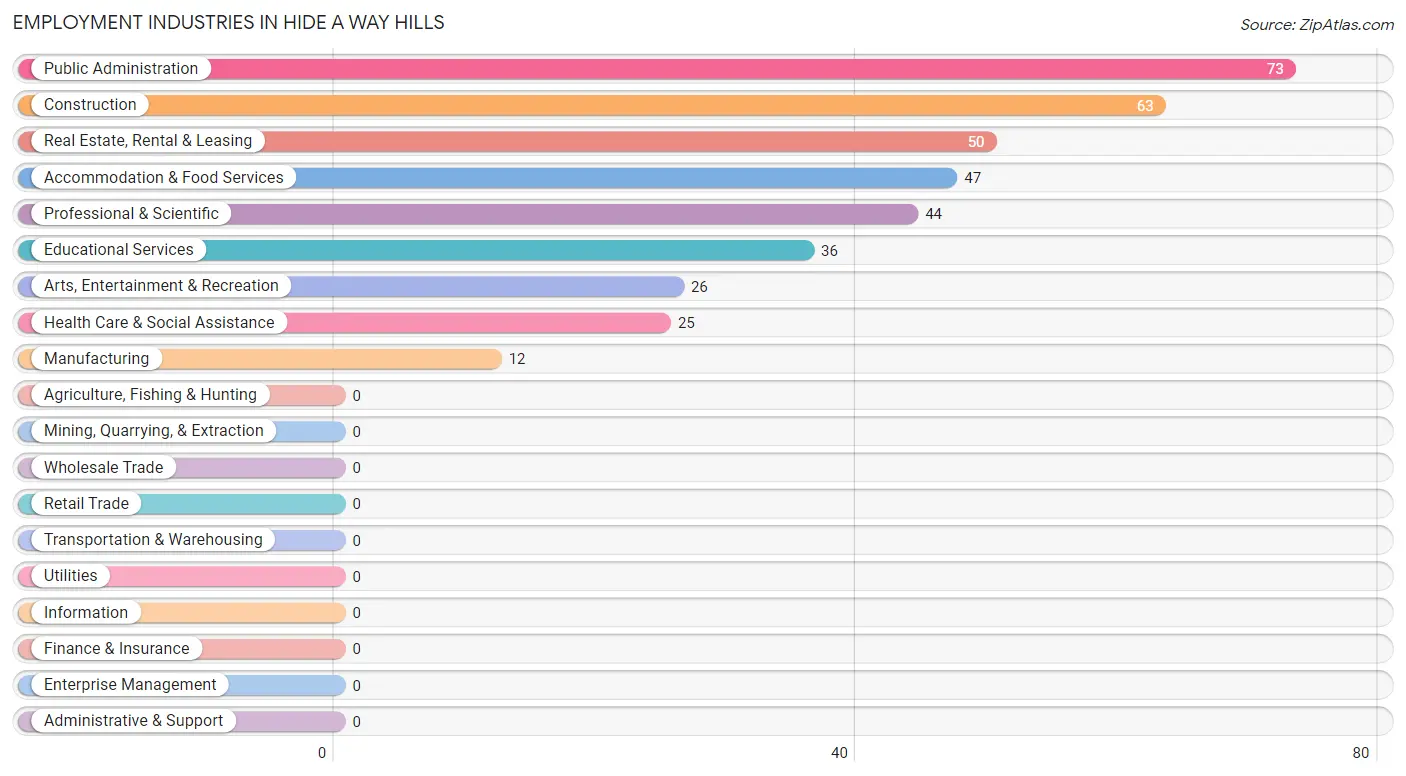
Employment Industries in Hide A Way Hills
The major employment industries in Hide A Way Hills include Public Administration (73 | 19.4%), Construction (63 | 16.8%), Real Estate, Rental & Leasing (50 | 13.3%), Accommodation & Food Services (47 | 12.5%), and Professional & Scientific (44 | 11.7%).
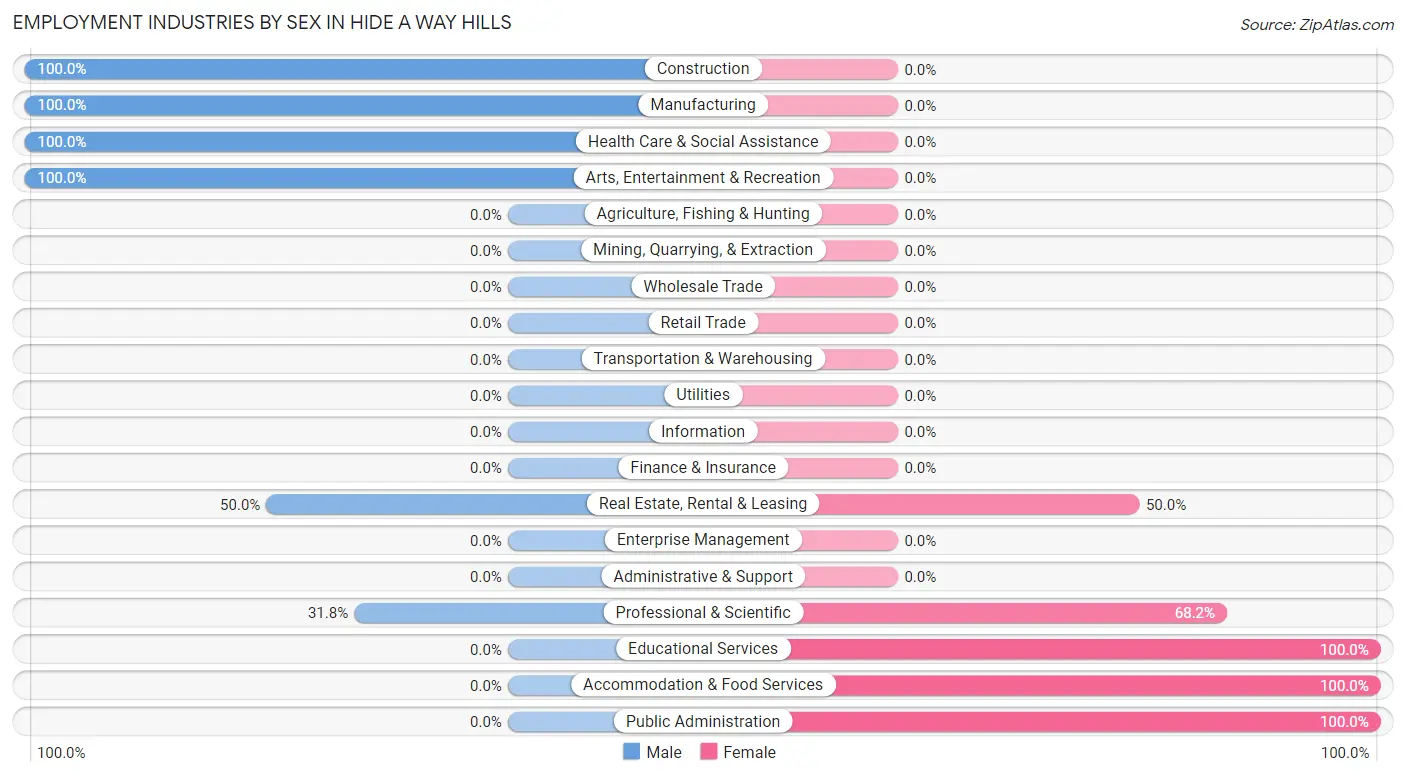
Employment Industries by Sex in Hide A Way Hills
The Hide A Way Hills industries that see more men than women are Construction (100.0%), Manufacturing (100.0%), and Health Care & Social Assistance (100.0%), whereas the industries that tend to have a higher number of women are Educational Services (100.0%), Accommodation & Food Services (100.0%), and Public Administration (100.0%).
| Industry | Male | Female |
| Agriculture, Fishing & Hunting | 0 (0.0%) | 0 (0.0%) |
| Mining, Quarrying, & Extraction | 0 (0.0%) | 0 (0.0%) |
| Construction | 63 (100.0%) | 0 (0.0%) |
| Manufacturing | 12 (100.0%) | 0 (0.0%) |
| Wholesale Trade | 0 (0.0%) | 0 (0.0%) |
| Retail Trade | 0 (0.0%) | 0 (0.0%) |
| Transportation & Warehousing | 0 (0.0%) | 0 (0.0%) |
| Utilities | 0 (0.0%) | 0 (0.0%) |
| Information | 0 (0.0%) | 0 (0.0%) |
| Finance & Insurance | 0 (0.0%) | 0 (0.0%) |
| Real Estate, Rental & Leasing | 25 (50.0%) | 25 (50.0%) |
| Professional & Scientific | 14 (31.8%) | 30 (68.2%) |
| Enterprise Management | 0 (0.0%) | 0 (0.0%) |
| Administrative & Support | 0 (0.0%) | 0 (0.0%) |
| Educational Services | 0 (0.0%) | 36 (100.0%) |
| Health Care & Social Assistance | 25 (100.0%) | 0 (0.0%) |
| Arts, Entertainment & Recreation | 26 (100.0%) | 0 (0.0%) |
| Accommodation & Food Services | 0 (0.0%) | 47 (100.0%) |
| Public Administration | 0 (0.0%) | 73 (100.0%) |
| Total | 165 (43.9%) | 211 (56.1%) |
Education in Hide A Way Hills
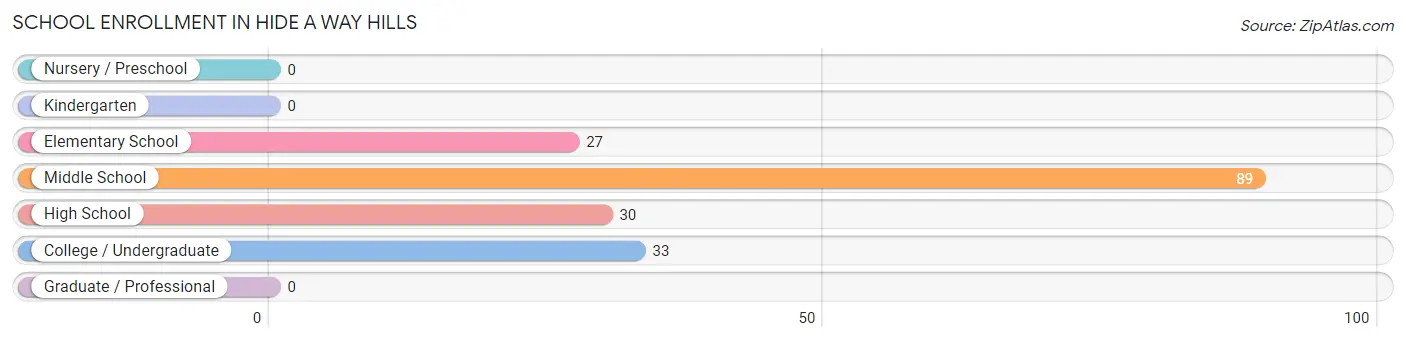
School Enrollment in Hide A Way Hills
The most common levels of schooling among the 179 students in Hide A Way Hills are middle school (89 | 49.7%), college / undergraduate (33 | 18.4%), and high school (30 | 16.8%).
| School Level | # Students | % Students |
| Nursery / Preschool | 0 | 0.0% |
| Kindergarten | 0 | 0.0% |
| Elementary School | 27 | 15.1% |
| Middle School | 89 | 49.7% |
| High School | 30 | 16.8% |
| College / Undergraduate | 33 | 18.4% |
| Graduate / Professional | 0 | 0.0% |
| Total | 179 | 100.0% |
School Enrollment by Age by Funding Source in Hide A Way Hills
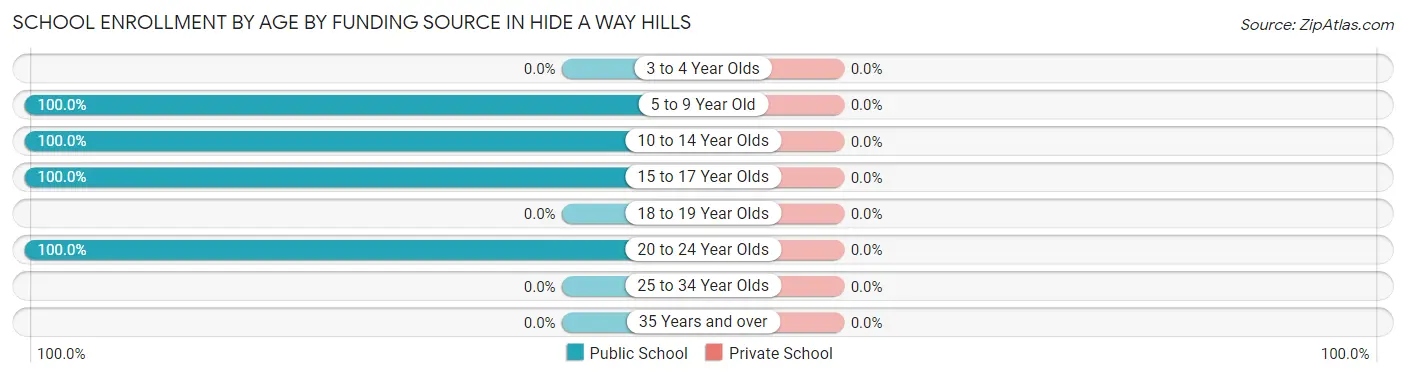
| Age Bracket | Public School | Private School |
| 3 to 4 Year Olds | 0 (0.0%) | 0 (0.0%) |
| 5 to 9 Year Old | 27 (100.0%) | 0 (0.0%) |
| 10 to 14 Year Olds | 89 (100.0%) | 0 (0.0%) |
| 15 to 17 Year Olds | 30 (100.0%) | 0 (0.0%) |
| 18 to 19 Year Olds | 0 (0.0%) | 0 (0.0%) |
| 20 to 24 Year Olds | 33 (100.0%) | 0 (0.0%) |
| 25 to 34 Year Olds | 0 (0.0%) | 0 (0.0%) |
| 35 Years and over | 0 (0.0%) | 0 (0.0%) |
| Total | 179 (100.0%) | 0 (0.0%) |
Educational Attainment by Field of Study in Hide A Way Hills
Communications (80 | 23.7%), bio, nature & agricultural (57 | 16.9%), arts & humanities (49 | 14.5%), education (33 | 9.8%), and physical & health sciences (31 | 9.2%) are the most common fields of study among 337 individuals in Hide A Way Hills who have obtained a bachelor's degree or higher.
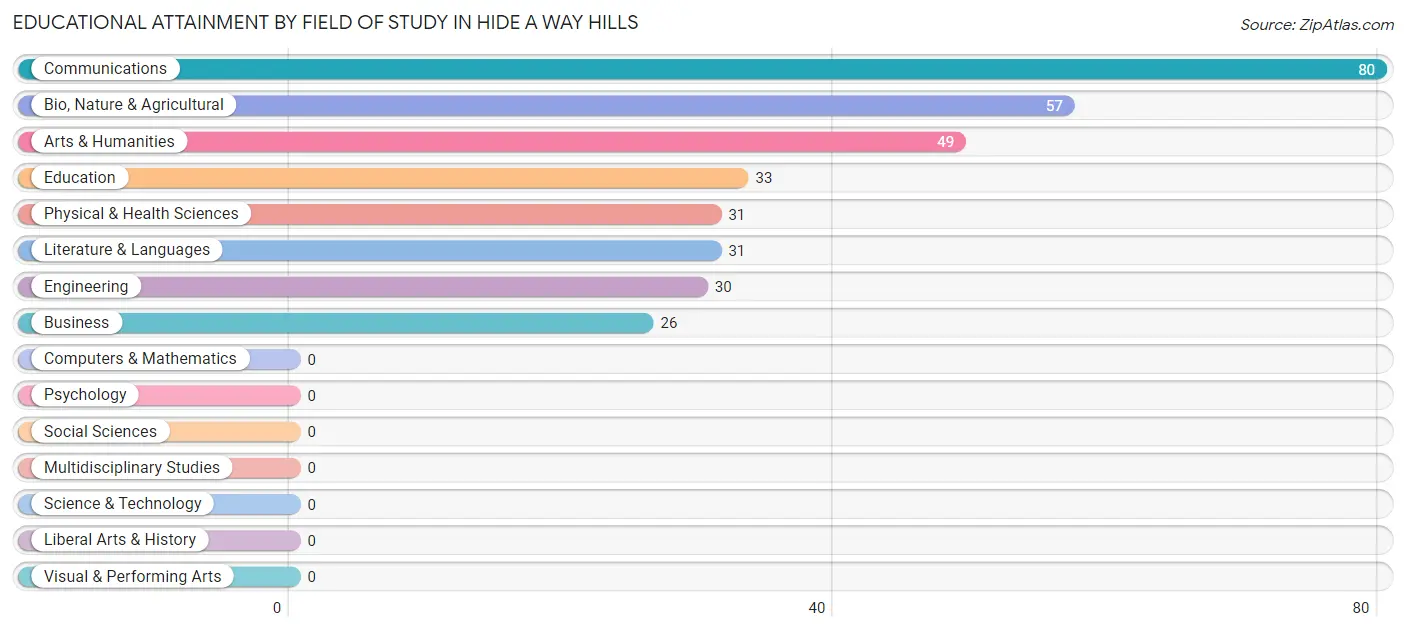
| Field of Study | # Graduates | % Graduates |
| Computers & Mathematics | 0 | 0.0% |
| Bio, Nature & Agricultural | 57 | 16.9% |
| Physical & Health Sciences | 31 | 9.2% |
| Psychology | 0 | 0.0% |
| Social Sciences | 0 | 0.0% |
| Engineering | 30 | 8.9% |
| Multidisciplinary Studies | 0 | 0.0% |
| Science & Technology | 0 | 0.0% |
| Business | 26 | 7.7% |
| Education | 33 | 9.8% |
| Literature & Languages | 31 | 9.2% |
| Liberal Arts & History | 0 | 0.0% |
| Visual & Performing Arts | 0 | 0.0% |
| Communications | 80 | 23.7% |
| Arts & Humanities | 49 | 14.5% |
| Total | 337 | 100.0% |
Transportation & Commute in Hide A Way Hills
Vehicle Availability by Sex in Hide A Way Hills
The most prevalent vehicle ownership categories in Hide A Way Hills are males with 2 vehicles (88, accounting for 53.3%) and females with 2 vehicles (105, making up 41.7%).
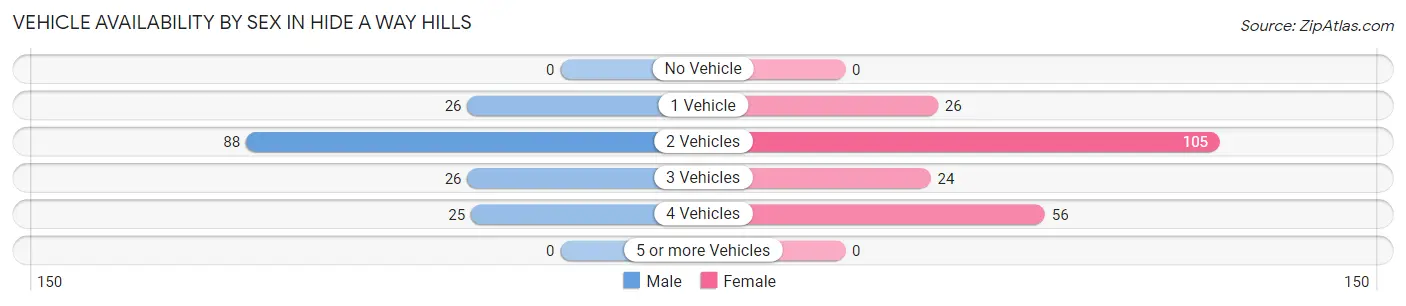
| Vehicles Available | Male | Female |
| No Vehicle | 0 (0.0%) | 0 (0.0%) |
| 1 Vehicle | 26 (15.8%) | 26 (12.3%) |
| 2 Vehicles | 88 (53.3%) | 105 (49.8%) |
| 3 Vehicles | 26 (15.8%) | 24 (11.4%) |
| 4 Vehicles | 25 (15.1%) | 56 (26.5%) |
| 5 or more Vehicles | 0 (0.0%) | 0 (0.0%) |
| Total | 165 (100.0%) | 211 (100.0%) |
Commute Time in Hide A Way Hills
The most frequently occuring commute durations in Hide A Way Hills are 20 to 24 minutes (62 commuters, 25.4%), 15 to 19 minutes (50 commuters, 20.5%), and 35 to 39 minutes (49 commuters, 20.1%).
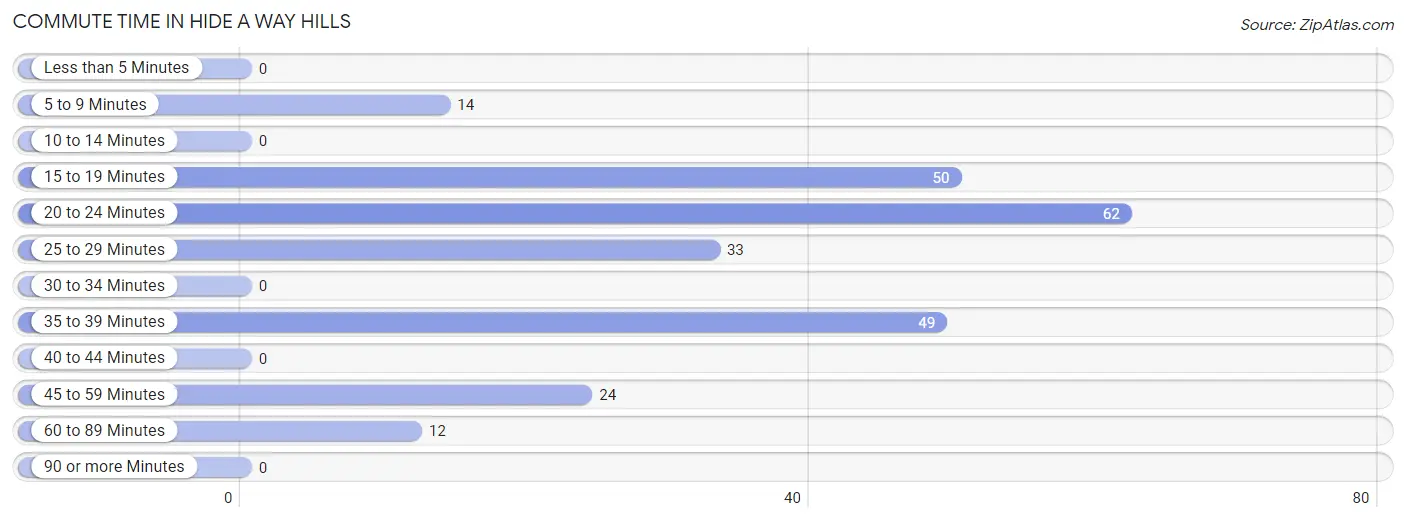
| Commute Time | # Commuters | % Commuters |
| Less than 5 Minutes | 0 | 0.0% |
| 5 to 9 Minutes | 14 | 5.7% |
| 10 to 14 Minutes | 0 | 0.0% |
| 15 to 19 Minutes | 50 | 20.5% |
| 20 to 24 Minutes | 62 | 25.4% |
| 25 to 29 Minutes | 33 | 13.5% |
| 30 to 34 Minutes | 0 | 0.0% |
| 35 to 39 Minutes | 49 | 20.1% |
| 40 to 44 Minutes | 0 | 0.0% |
| 45 to 59 Minutes | 24 | 9.8% |
| 60 to 89 Minutes | 12 | 4.9% |
| 90 or more Minutes | 0 | 0.0% |
Commute Time by Sex in Hide A Way Hills
The most common commute times in Hide A Way Hills are 35 to 39 minutes (49 commuters, 43.0%) for males and 15 to 19 minutes (50 commuters, 38.5%) for females.
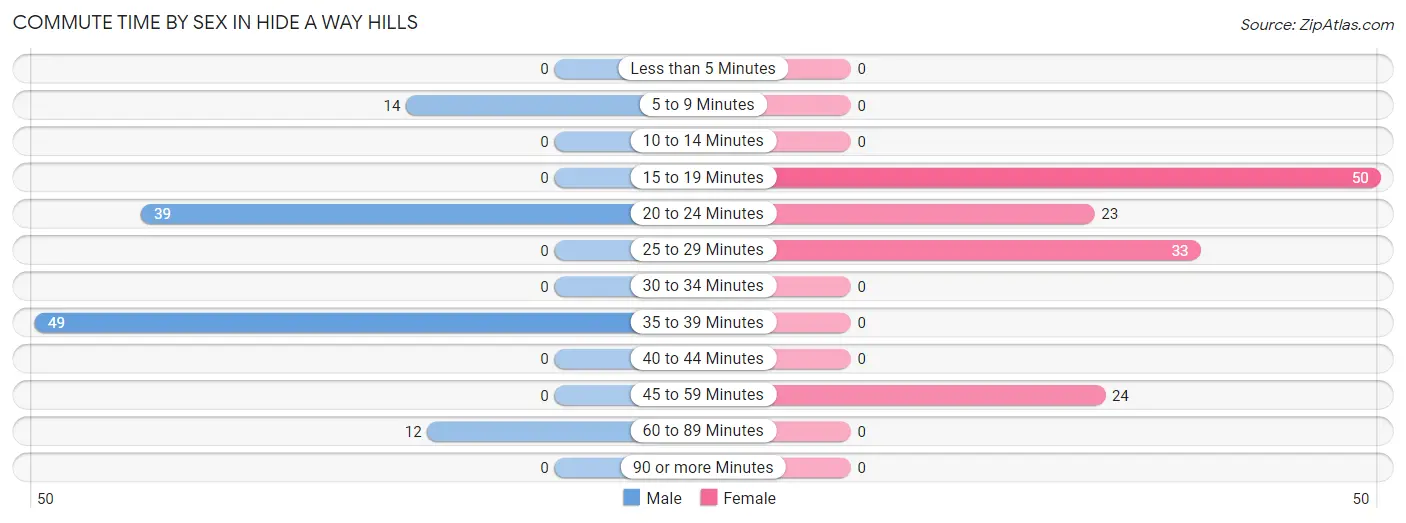
| Commute Time | Male | Female |
| Less than 5 Minutes | 0 (0.0%) | 0 (0.0%) |
| 5 to 9 Minutes | 14 (12.3%) | 0 (0.0%) |
| 10 to 14 Minutes | 0 (0.0%) | 0 (0.0%) |
| 15 to 19 Minutes | 0 (0.0%) | 50 (38.5%) |
| 20 to 24 Minutes | 39 (34.2%) | 23 (17.7%) |
| 25 to 29 Minutes | 0 (0.0%) | 33 (25.4%) |
| 30 to 34 Minutes | 0 (0.0%) | 0 (0.0%) |
| 35 to 39 Minutes | 49 (43.0%) | 0 (0.0%) |
| 40 to 44 Minutes | 0 (0.0%) | 0 (0.0%) |
| 45 to 59 Minutes | 0 (0.0%) | 24 (18.5%) |
| 60 to 89 Minutes | 12 (10.5%) | 0 (0.0%) |
| 90 or more Minutes | 0 (0.0%) | 0 (0.0%) |
Time of Departure to Work by Sex in Hide A Way Hills
The most frequent times of departure to work in Hide A Way Hills are 5:00 AM to 5:29 AM (49, 43.0%) for males and 7:30 AM to 7:59 AM (50, 38.5%) for females.
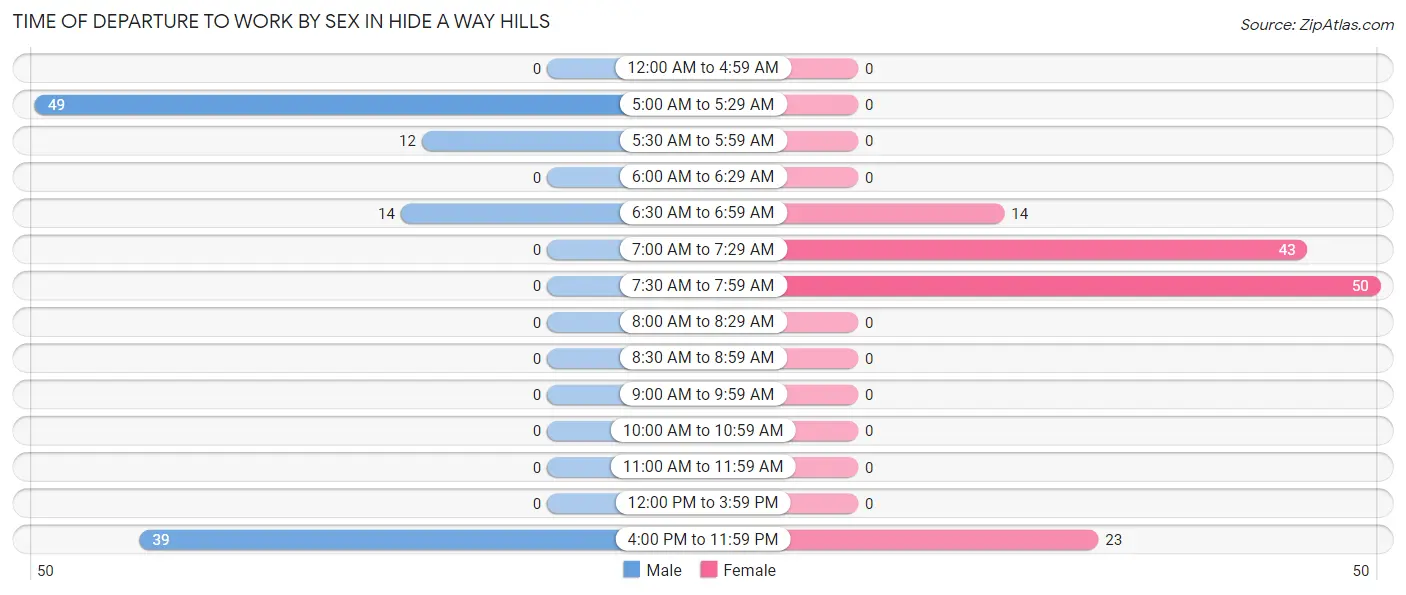
| Time of Departure | Male | Female |
| 12:00 AM to 4:59 AM | 0 (0.0%) | 0 (0.0%) |
| 5:00 AM to 5:29 AM | 49 (43.0%) | 0 (0.0%) |
| 5:30 AM to 5:59 AM | 12 (10.5%) | 0 (0.0%) |
| 6:00 AM to 6:29 AM | 0 (0.0%) | 0 (0.0%) |
| 6:30 AM to 6:59 AM | 14 (12.3%) | 14 (10.8%) |
| 7:00 AM to 7:29 AM | 0 (0.0%) | 43 (33.1%) |
| 7:30 AM to 7:59 AM | 0 (0.0%) | 50 (38.5%) |
| 8:00 AM to 8:29 AM | 0 (0.0%) | 0 (0.0%) |
| 8:30 AM to 8:59 AM | 0 (0.0%) | 0 (0.0%) |
| 9:00 AM to 9:59 AM | 0 (0.0%) | 0 (0.0%) |
| 10:00 AM to 10:59 AM | 0 (0.0%) | 0 (0.0%) |
| 11:00 AM to 11:59 AM | 0 (0.0%) | 0 (0.0%) |
| 12:00 PM to 3:59 PM | 0 (0.0%) | 0 (0.0%) |
| 4:00 PM to 11:59 PM | 39 (34.2%) | 23 (17.7%) |
| Total | 114 (100.0%) | 130 (100.0%) |
Housing Occupancy in Hide A Way Hills
Occupancy by Ownership in Hide A Way Hills
Of the total 367 dwellings in Hide A Way Hills, owner-occupied units account for 356 (97.0%), while renter-occupied units make up 11 (3.0%).
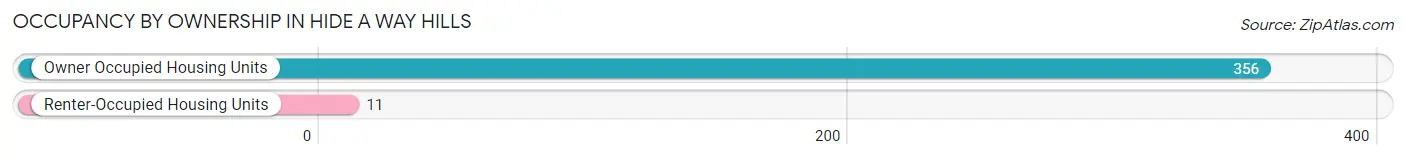
| Occupancy | # Housing Units | % Housing Units |
| Owner Occupied Housing Units | 356 | 97.0% |
| Renter-Occupied Housing Units | 11 | 3.0% |
| Total Occupied Housing Units | 367 | 100.0% |
Occupancy by Household Size in Hide A Way Hills
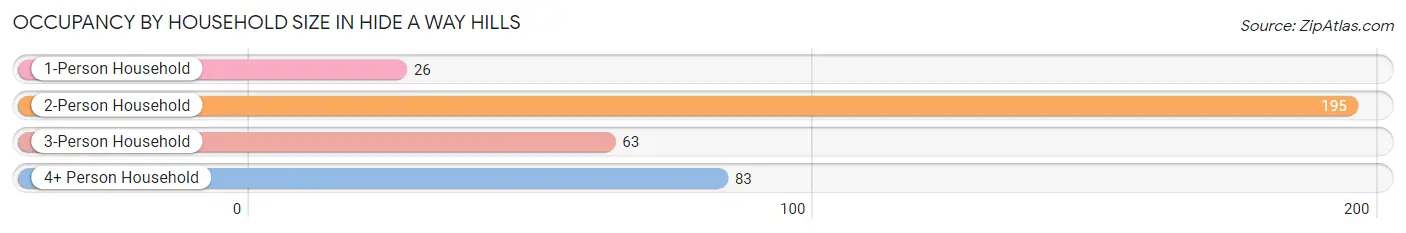
| Household Size | # Housing Units | % Housing Units |
| 1-Person Household | 26 | 7.1% |
| 2-Person Household | 195 | 53.1% |
| 3-Person Household | 63 | 17.2% |
| 4+ Person Household | 83 | 22.6% |
| Total Housing Units | 367 | 100.0% |
Occupancy by Ownership by Household Size in Hide A Way Hills
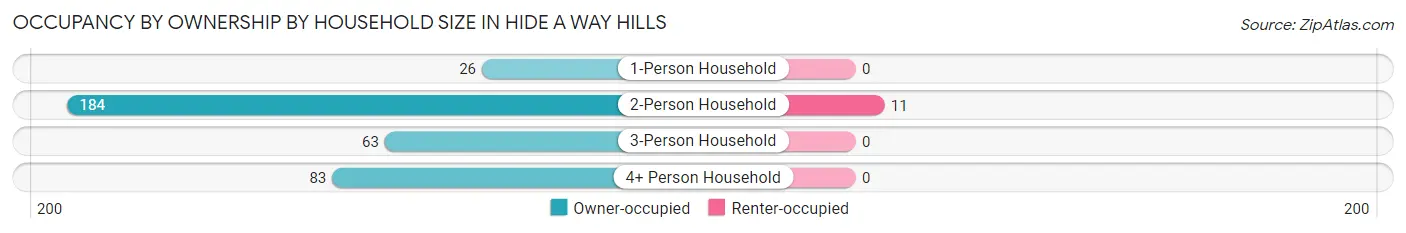
| Household Size | Owner-occupied | Renter-occupied |
| 1-Person Household | 26 (100.0%) | 0 (0.0%) |
| 2-Person Household | 184 (94.4%) | 11 (5.6%) |
| 3-Person Household | 63 (100.0%) | 0 (0.0%) |
| 4+ Person Household | 83 (100.0%) | 0 (0.0%) |
| Total Housing Units | 356 (97.0%) | 11 (3.0%) |
Occupancy by Educational Attainment in Hide A Way Hills
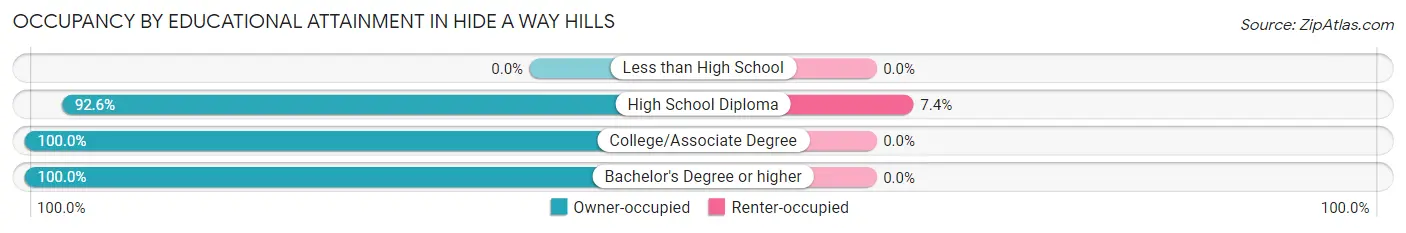
| Household Size | Owner-occupied | Renter-occupied |
| Less than High School | 0 (0.0%) | 0 (0.0%) |
| High School Diploma | 138 (92.6%) | 11 (7.4%) |
| College/Associate Degree | 82 (100.0%) | 0 (0.0%) |
| Bachelor's Degree or higher | 136 (100.0%) | 0 (0.0%) |
Occupancy by Age of Householder in Hide A Way Hills
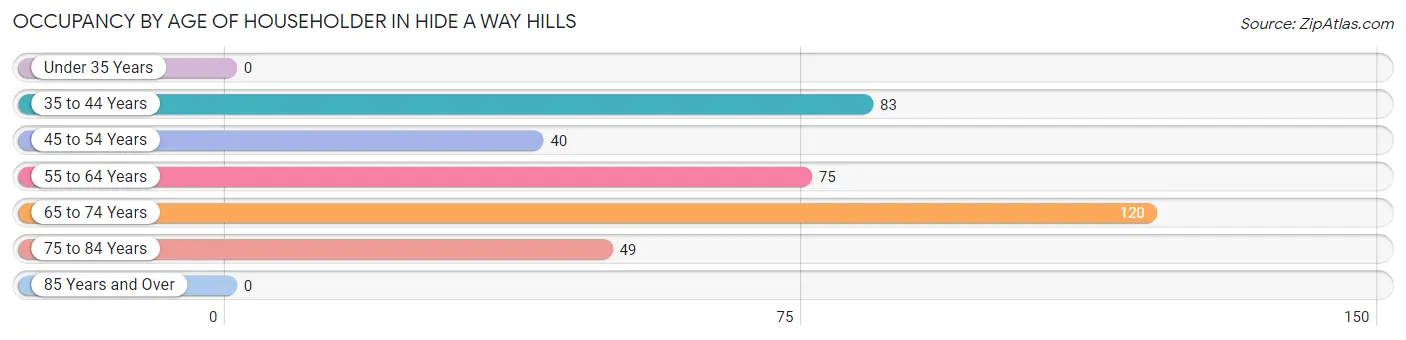
| Age Bracket | # Households | % Households |
| Under 35 Years | 0 | 0.0% |
| 35 to 44 Years | 83 | 22.6% |
| 45 to 54 Years | 40 | 10.9% |
| 55 to 64 Years | 75 | 20.4% |
| 65 to 74 Years | 120 | 32.7% |
| 75 to 84 Years | 49 | 13.4% |
| 85 Years and Over | 0 | 0.0% |
| Total | 367 | 100.0% |
Housing Finances in Hide A Way Hills
Median Income by Occupancy in Hide A Way Hills
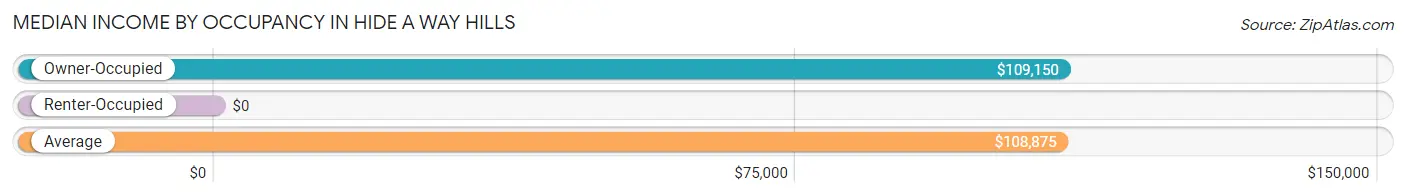
| Occupancy Type | # Households | Median Income |
| Owner-Occupied | 356 (97.0%) | $109,150 |
| Renter-Occupied | 11 (3.0%) | $0 |
| Average | 367 (100.0%) | $108,875 |
Occupancy by Householder Income Bracket in Hide A Way Hills
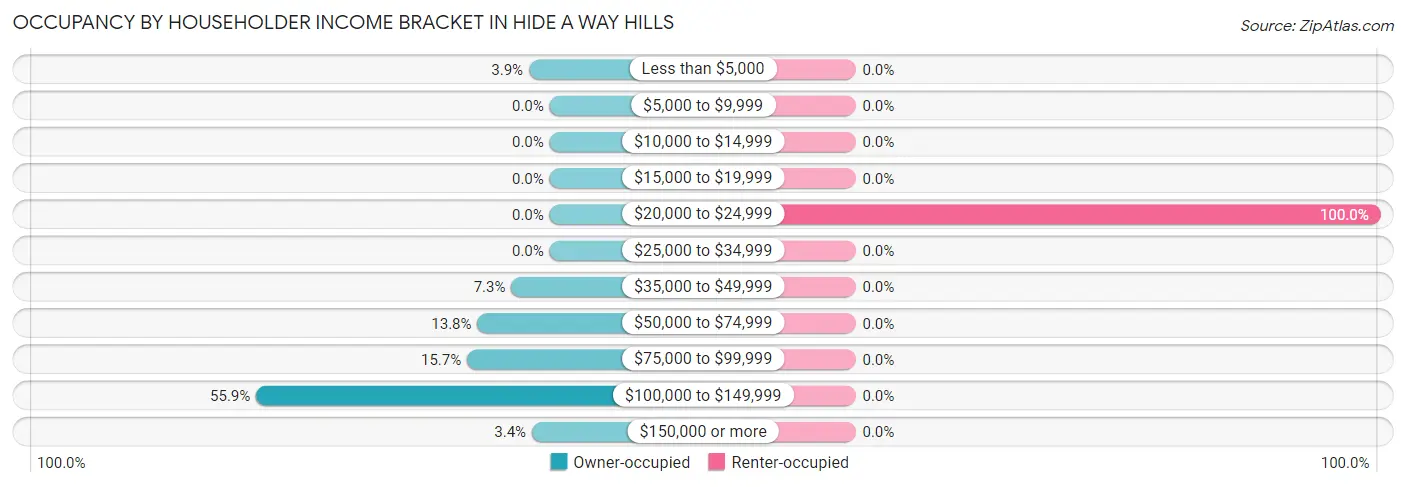
| Income Bracket | Owner-occupied | Renter-occupied |
| Less than $5,000 | 14 (3.9%) | 0 (0.0%) |
| $5,000 to $9,999 | 0 (0.0%) | 0 (0.0%) |
| $10,000 to $14,999 | 0 (0.0%) | 0 (0.0%) |
| $15,000 to $19,999 | 0 (0.0%) | 0 (0.0%) |
| $20,000 to $24,999 | 0 (0.0%) | 11 (100.0%) |
| $25,000 to $34,999 | 0 (0.0%) | 0 (0.0%) |
| $35,000 to $49,999 | 26 (7.3%) | 0 (0.0%) |
| $50,000 to $74,999 | 49 (13.8%) | 0 (0.0%) |
| $75,000 to $99,999 | 56 (15.7%) | 0 (0.0%) |
| $100,000 to $149,999 | 199 (55.9%) | 0 (0.0%) |
| $150,000 or more | 12 (3.4%) | 0 (0.0%) |
| Total | 356 (100.0%) | 11 (100.0%) |
Monthly Housing Cost Tiers in Hide A Way Hills
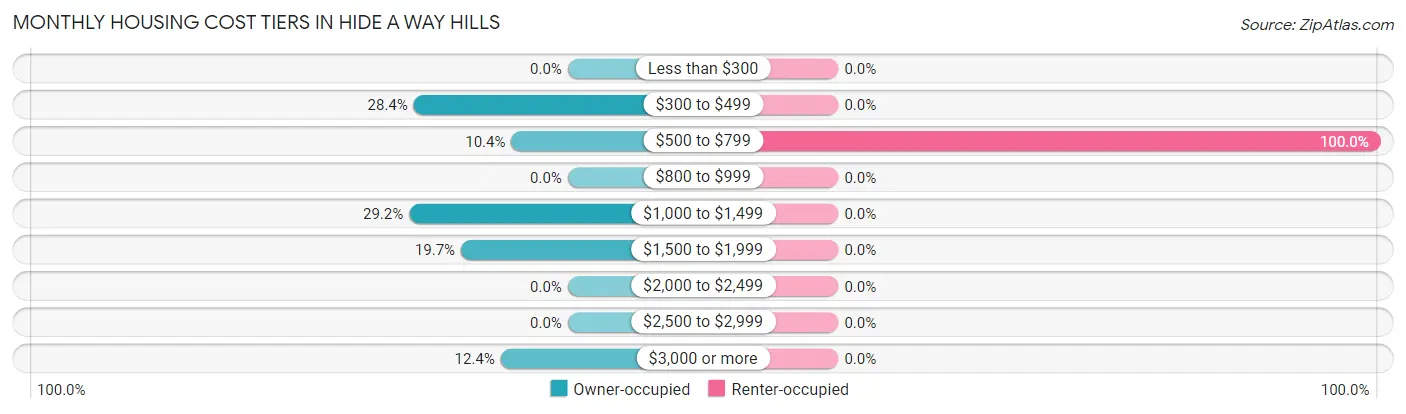
| Monthly Cost | Owner-occupied | Renter-occupied |
| Less than $300 | 0 (0.0%) | 0 (0.0%) |
| $300 to $499 | 101 (28.4%) | 0 (0.0%) |
| $500 to $799 | 37 (10.4%) | 11 (100.0%) |
| $800 to $999 | 0 (0.0%) | 0 (0.0%) |
| $1,000 to $1,499 | 104 (29.2%) | 0 (0.0%) |
| $1,500 to $1,999 | 70 (19.7%) | 0 (0.0%) |
| $2,000 to $2,499 | 0 (0.0%) | 0 (0.0%) |
| $2,500 to $2,999 | 0 (0.0%) | 0 (0.0%) |
| $3,000 or more | 44 (12.4%) | 0 (0.0%) |
| Total | 356 (100.0%) | 11 (100.0%) |
Physical Housing Characteristics in Hide A Way Hills
Housing Structures in Hide A Way Hills
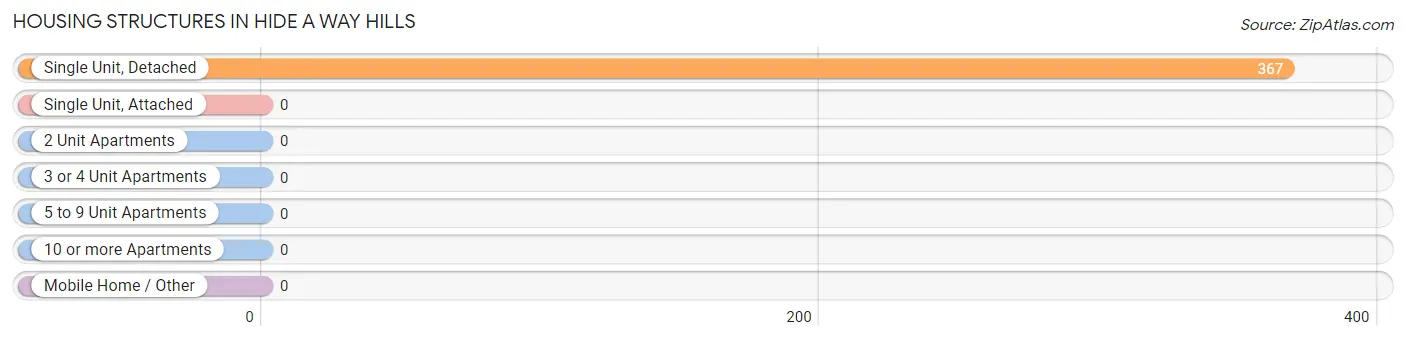
| Structure Type | # Housing Units | % Housing Units |
| Single Unit, Detached | 367 | 100.0% |
| Single Unit, Attached | 0 | 0.0% |
| 2 Unit Apartments | 0 | 0.0% |
| 3 or 4 Unit Apartments | 0 | 0.0% |
| 5 to 9 Unit Apartments | 0 | 0.0% |
| 10 or more Apartments | 0 | 0.0% |
| Mobile Home / Other | 0 | 0.0% |
| Total | 367 | 100.0% |
Housing Structures by Occupancy in Hide A Way Hills
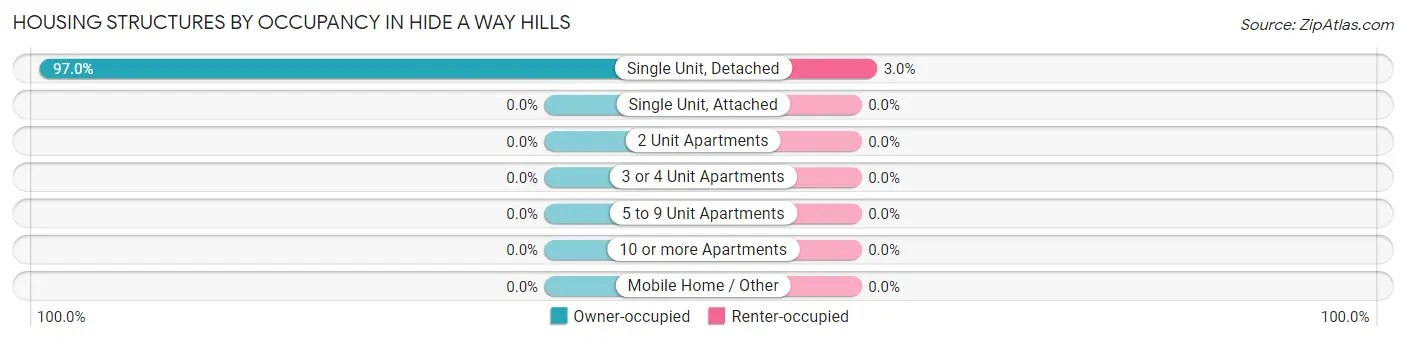
| Structure Type | Owner-occupied | Renter-occupied |
| Single Unit, Detached | 356 (97.0%) | 11 (3.0%) |
| Single Unit, Attached | 0 (0.0%) | 0 (0.0%) |
| 2 Unit Apartments | 0 (0.0%) | 0 (0.0%) |
| 3 or 4 Unit Apartments | 0 (0.0%) | 0 (0.0%) |
| 5 to 9 Unit Apartments | 0 (0.0%) | 0 (0.0%) |
| 10 or more Apartments | 0 (0.0%) | 0 (0.0%) |
| Mobile Home / Other | 0 (0.0%) | 0 (0.0%) |
| Total | 356 (97.0%) | 11 (3.0%) |
Housing Structures by Number of Rooms in Hide A Way Hills
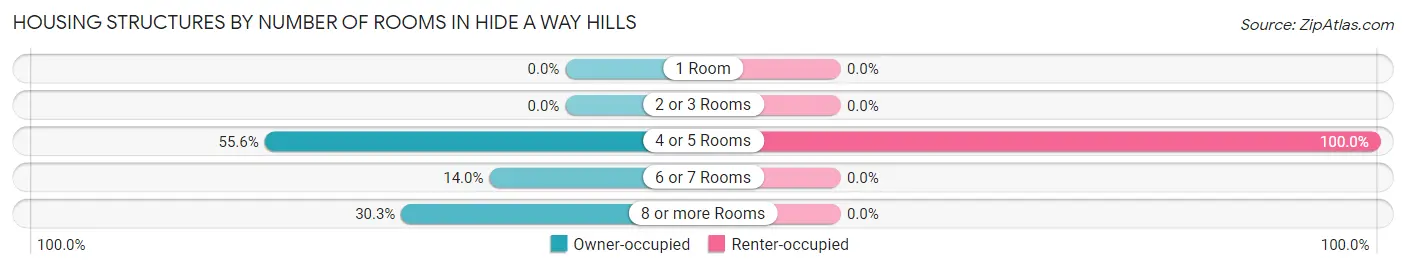
| Number of Rooms | Owner-occupied | Renter-occupied |
| 1 Room | 0 (0.0%) | 0 (0.0%) |
| 2 or 3 Rooms | 0 (0.0%) | 0 (0.0%) |
| 4 or 5 Rooms | 198 (55.6%) | 11 (100.0%) |
| 6 or 7 Rooms | 50 (14.0%) | 0 (0.0%) |
| 8 or more Rooms | 108 (30.3%) | 0 (0.0%) |
| Total | 356 (100.0%) | 11 (100.0%) |
Housing Structure by Heating Type in Hide A Way Hills
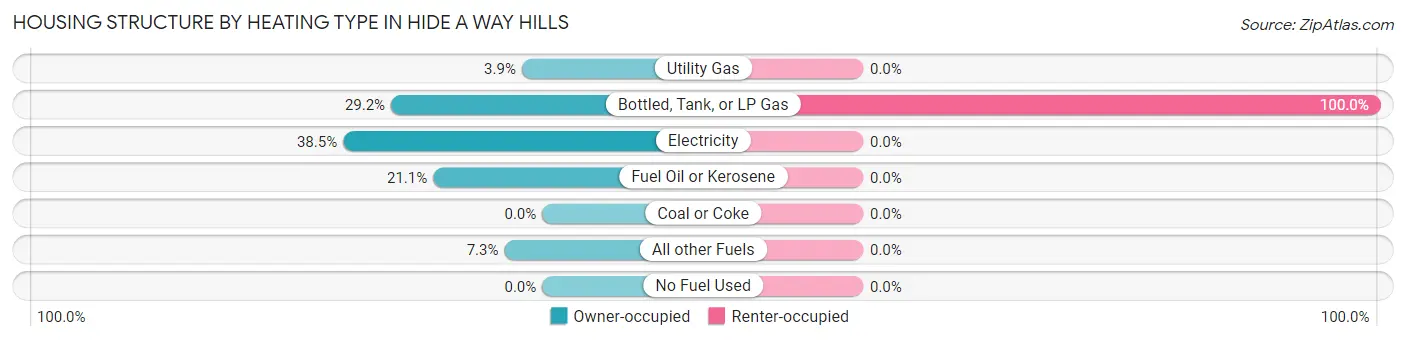
| Heating Type | Owner-occupied | Renter-occupied |
| Utility Gas | 14 (3.9%) | 0 (0.0%) |
| Bottled, Tank, or LP Gas | 104 (29.2%) | 11 (100.0%) |
| Electricity | 137 (38.5%) | 0 (0.0%) |
| Fuel Oil or Kerosene | 75 (21.1%) | 0 (0.0%) |
| Coal or Coke | 0 (0.0%) | 0 (0.0%) |
| All other Fuels | 26 (7.3%) | 0 (0.0%) |
| No Fuel Used | 0 (0.0%) | 0 (0.0%) |
| Total | 356 (100.0%) | 11 (100.0%) |
Household Vehicle Usage in Hide A Way Hills
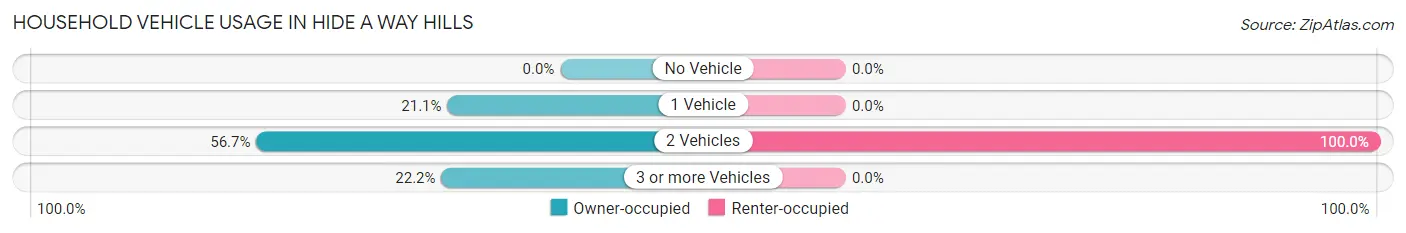
| Vehicles per Household | Owner-occupied | Renter-occupied |
| No Vehicle | 0 (0.0%) | 0 (0.0%) |
| 1 Vehicle | 75 (21.1%) | 0 (0.0%) |
| 2 Vehicles | 202 (56.7%) | 11 (100.0%) |
| 3 or more Vehicles | 79 (22.2%) | 0 (0.0%) |
| Total | 356 (100.0%) | 11 (100.0%) |
Real Estate & Mortgages in Hide A Way Hills
Real Estate and Mortgage Overview in Hide A Way Hills
| Characteristic | Without Mortgage | With Mortgage |
| Housing Units | 124 | 232 |
| Median Property Value | $193,800 | $309,500 |
| Median Household Income | $59,337 | $12 |
| Monthly Housing Costs | $461 | $44 |
| Real Estate Taxes | $1,931 | $0 |
Property Value by Mortgage Status in Hide A Way Hills
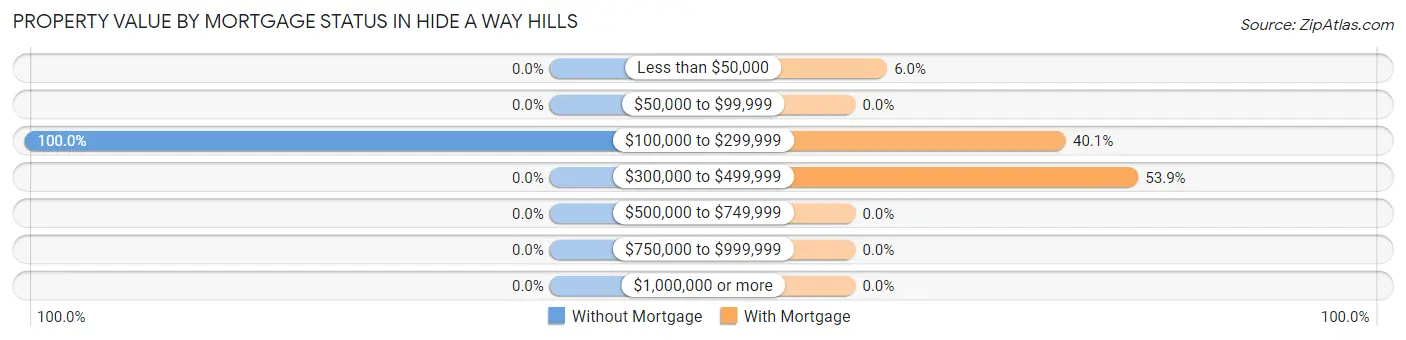
| Property Value | Without Mortgage | With Mortgage |
| Less than $50,000 | 0 (0.0%) | 14 (6.0%) |
| $50,000 to $99,999 | 0 (0.0%) | 0 (0.0%) |
| $100,000 to $299,999 | 124 (100.0%) | 93 (40.1%) |
| $300,000 to $499,999 | 0 (0.0%) | 125 (53.9%) |
| $500,000 to $749,999 | 0 (0.0%) | 0 (0.0%) |
| $750,000 to $999,999 | 0 (0.0%) | 0 (0.0%) |
| $1,000,000 or more | 0 (0.0%) | 0 (0.0%) |
| Total | 124 (100.0%) | 232 (100.0%) |
Household Income by Mortgage Status in Hide A Way Hills
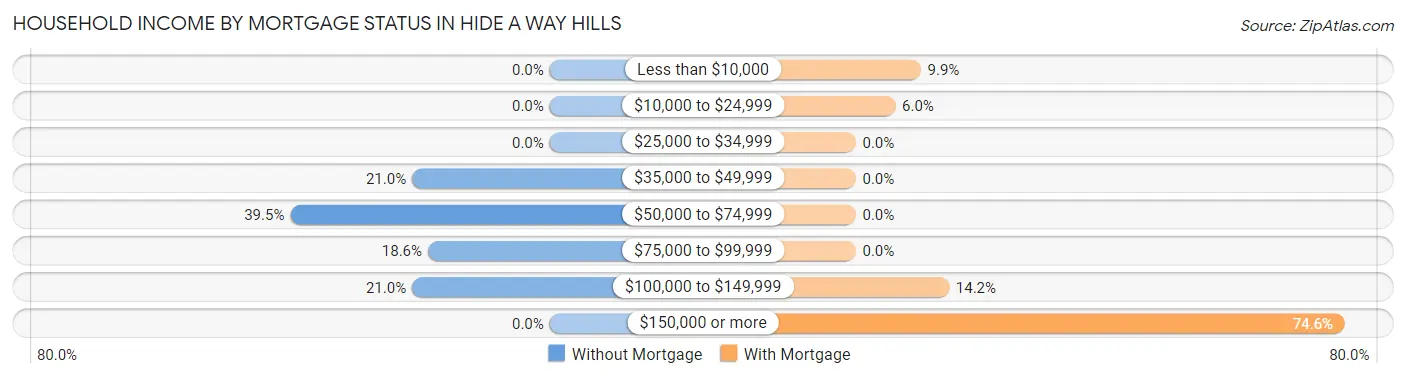
| Household Income | Without Mortgage | With Mortgage |
| Less than $10,000 | 0 (0.0%) | 23 (9.9%) |
| $10,000 to $24,999 | 0 (0.0%) | 14 (6.0%) |
| $25,000 to $34,999 | 0 (0.0%) | 0 (0.0%) |
| $35,000 to $49,999 | 26 (21.0%) | 0 (0.0%) |
| $50,000 to $74,999 | 49 (39.5%) | 0 (0.0%) |
| $75,000 to $99,999 | 23 (18.5%) | 0 (0.0%) |
| $100,000 to $149,999 | 26 (21.0%) | 33 (14.2%) |
| $150,000 or more | 0 (0.0%) | 173 (74.6%) |
| Total | 124 (100.0%) | 232 (100.0%) |
Property Value to Household Income Ratio in Hide A Way Hills
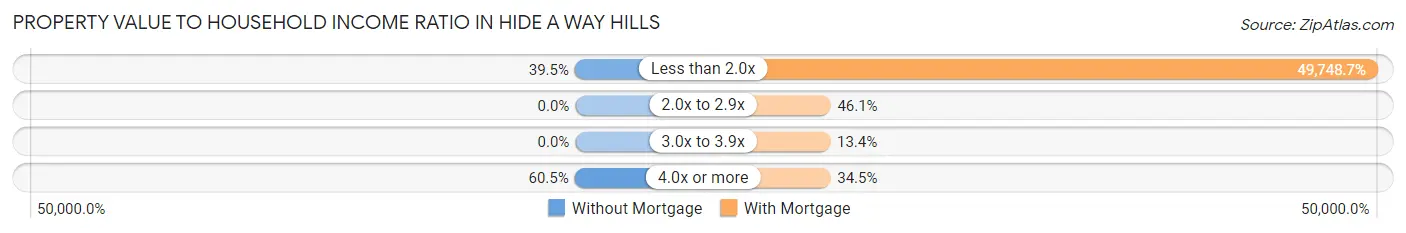
| Value-to-Income Ratio | Without Mortgage | With Mortgage |
| Less than 2.0x | 49 (39.5%) | 115,417 (49,748.7%) |
| 2.0x to 2.9x | 0 (0.0%) | 107 (46.1%) |
| 3.0x to 3.9x | 0 (0.0%) | 31 (13.4%) |
| 4.0x or more | 75 (60.5%) | 80 (34.5%) |
| Total | 124 (100.0%) | 232 (100.0%) |
Real Estate Taxes by Mortgage Status in Hide A Way Hills
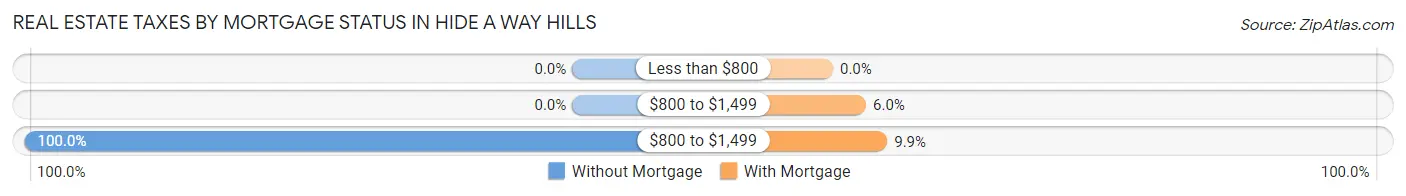
| Property Taxes | Without Mortgage | With Mortgage |
| Less than $800 | 0 (0.0%) | 0 (0.0%) |
| $800 to $1,499 | 0 (0.0%) | 14 (6.0%) |
| $800 to $1,499 | 124 (100.0%) | 23 (9.9%) |
| Total | 124 (100.0%) | 232 (100.0%) |
Health & Disability in Hide A Way Hills
Health Insurance Coverage by Age in Hide A Way Hills
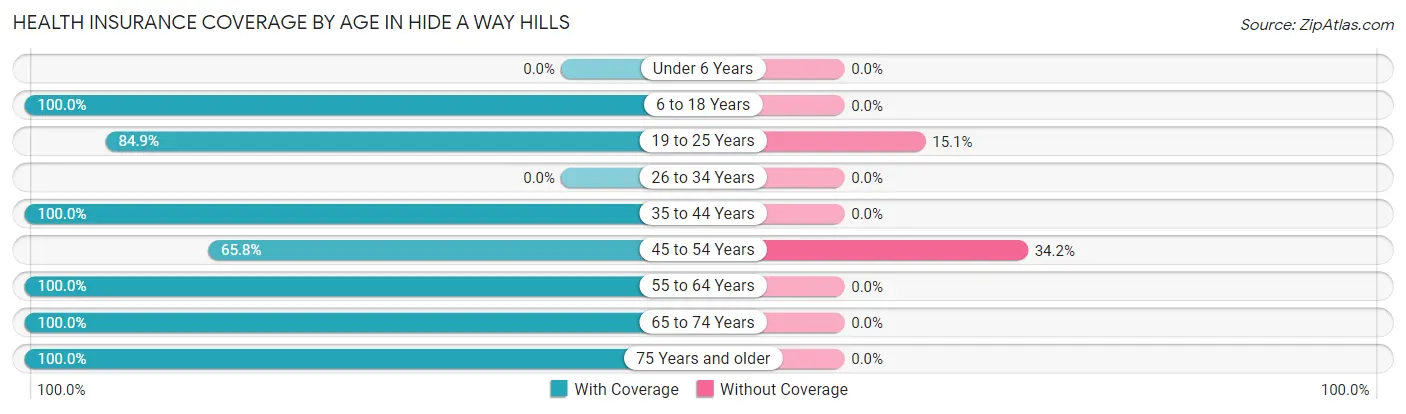
| Age Bracket | With Coverage | Without Coverage |
| Under 6 Years | 0 (0.0%) | 0 (0.0%) |
| 6 to 18 Years | 146 (100.0%) | 0 (0.0%) |
| 19 to 25 Years | 118 (84.9%) | 21 (15.1%) |
| 26 to 34 Years | 0 (0.0%) | 0 (0.0%) |
| 35 to 44 Years | 113 (100.0%) | 0 (0.0%) |
| 45 to 54 Years | 100 (65.8%) | 52 (34.2%) |
| 55 to 64 Years | 131 (100.0%) | 0 (0.0%) |
| 65 to 74 Years | 200 (100.0%) | 0 (0.0%) |
| 75 Years and older | 97 (100.0%) | 0 (0.0%) |
| Total | 905 (92.5%) | 73 (7.5%) |
Health Insurance Coverage by Citizenship Status in Hide A Way Hills
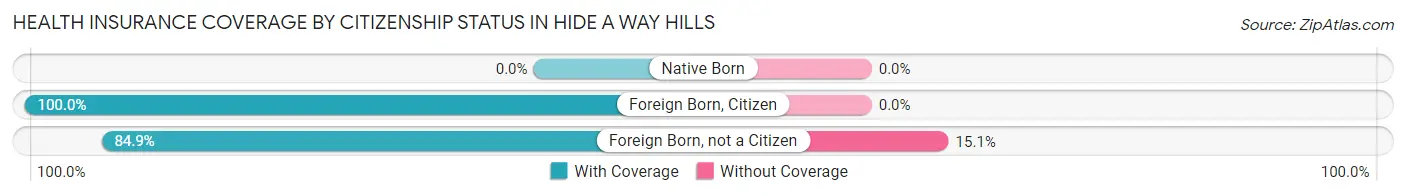
| Citizenship Status | With Coverage | Without Coverage |
| Native Born | 0 (0.0%) | 0 (0.0%) |
| Foreign Born, Citizen | 146 (100.0%) | 0 (0.0%) |
| Foreign Born, not a Citizen | 118 (84.9%) | 21 (15.1%) |
Health Insurance Coverage by Household Income in Hide A Way Hills
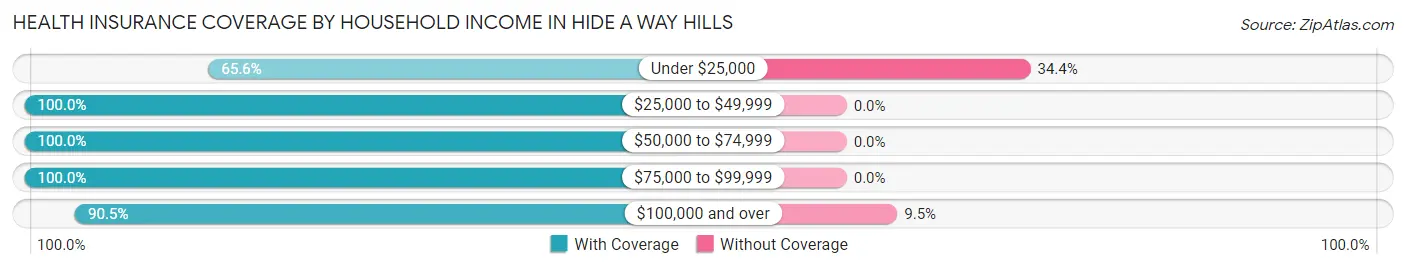
| Household Income | With Coverage | Without Coverage |
| Under $25,000 | 40 (65.6%) | 21 (34.4%) |
| $25,000 to $49,999 | 26 (100.0%) | 0 (0.0%) |
| $50,000 to $74,999 | 97 (100.0%) | 0 (0.0%) |
| $75,000 to $99,999 | 245 (100.0%) | 0 (0.0%) |
| $100,000 and over | 497 (90.5%) | 52 (9.5%) |
Public vs Private Health Insurance Coverage by Age in Hide A Way Hills
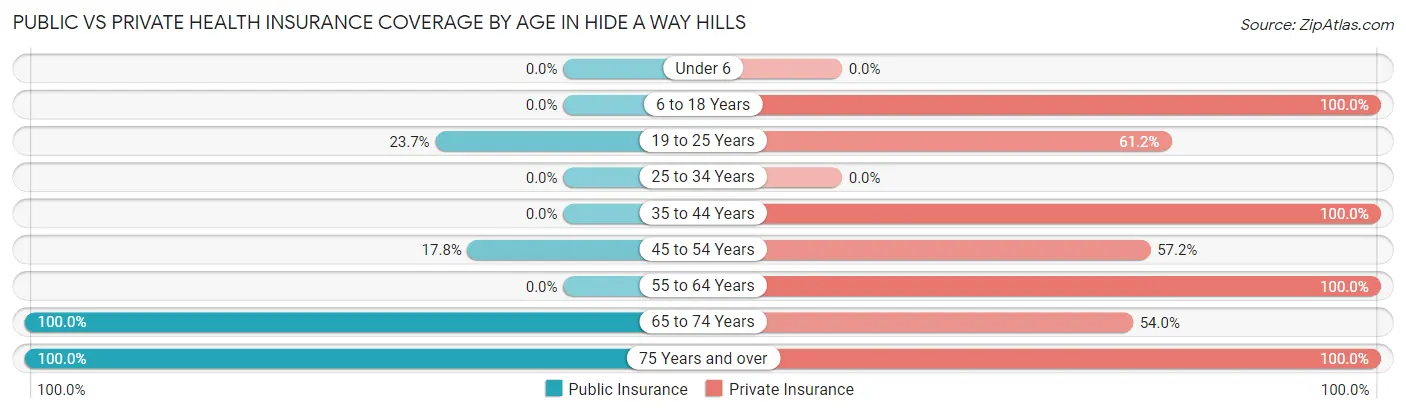
| Age Bracket | Public Insurance | Private Insurance |
| Under 6 | 0 (0.0%) | 0 (0.0%) |
| 6 to 18 Years | 0 (0.0%) | 146 (100.0%) |
| 19 to 25 Years | 33 (23.7%) | 85 (61.2%) |
| 25 to 34 Years | 0 (0.0%) | 0 (0.0%) |
| 35 to 44 Years | 0 (0.0%) | 113 (100.0%) |
| 45 to 54 Years | 27 (17.8%) | 87 (57.2%) |
| 55 to 64 Years | 0 (0.0%) | 131 (100.0%) |
| 65 to 74 Years | 200 (100.0%) | 108 (54.0%) |
| 75 Years and over | 97 (100.0%) | 97 (100.0%) |
| Total | 357 (36.5%) | 767 (78.4%) |
Disability Status by Sex by Age in Hide A Way Hills
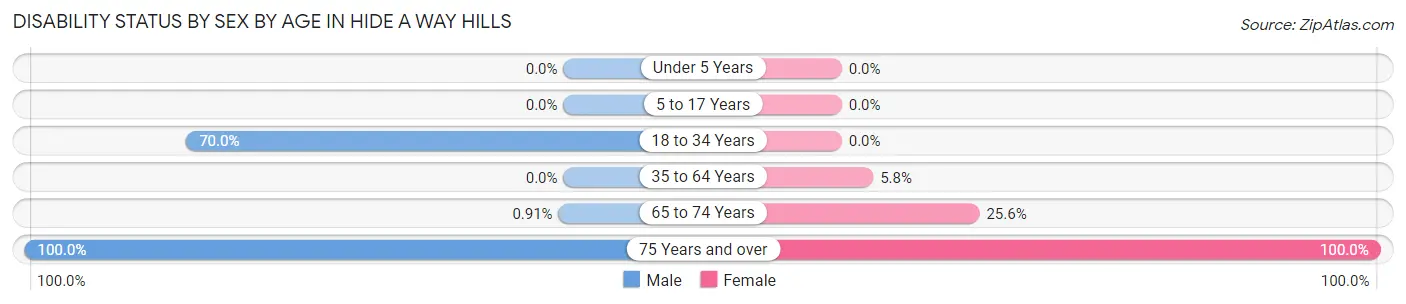
| Age Bracket | Male | Female |
| Under 5 Years | 0 (0.0%) | 0 (0.0%) |
| 5 to 17 Years | 0 (0.0%) | 0 (0.0%) |
| 18 to 34 Years | 49 (70.0%) | 0 (0.0%) |
| 35 to 64 Years | 0 (0.0%) | 13 (5.8%) |
| 65 to 74 Years | 1 (0.9%) | 23 (25.6%) |
| 75 Years and over | 48 (100.0%) | 49 (100.0%) |
Disability Class by Sex by Age in Hide A Way Hills
Disability Class: Hearing Difficulty
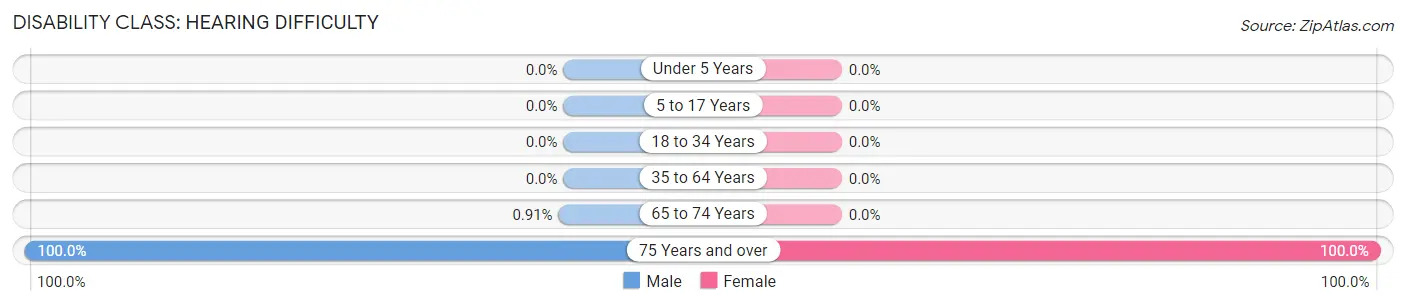
| Age Bracket | Male | Female |
| Under 5 Years | 0 (0.0%) | 0 (0.0%) |
| 5 to 17 Years | 0 (0.0%) | 0 (0.0%) |
| 18 to 34 Years | 0 (0.0%) | 0 (0.0%) |
| 35 to 64 Years | 0 (0.0%) | 0 (0.0%) |
| 65 to 74 Years | 1 (0.9%) | 0 (0.0%) |
| 75 Years and over | 48 (100.0%) | 49 (100.0%) |
Disability Class: Vision Difficulty
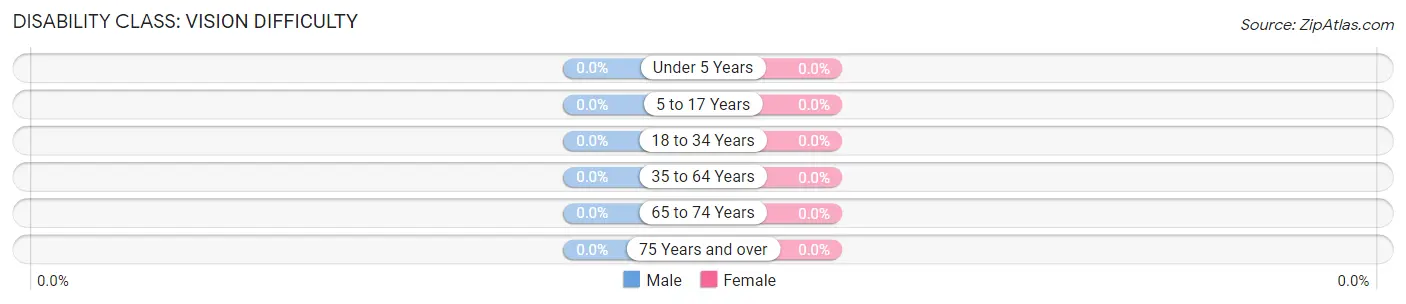
| Age Bracket | Male | Female |
| Under 5 Years | 0 (0.0%) | 0 (0.0%) |
| 5 to 17 Years | 0 (0.0%) | 0 (0.0%) |
| 18 to 34 Years | 0 (0.0%) | 0 (0.0%) |
| 35 to 64 Years | 0 (0.0%) | 0 (0.0%) |
| 65 to 74 Years | 0 (0.0%) | 0 (0.0%) |
| 75 Years and over | 0 (0.0%) | 0 (0.0%) |
Disability Class: Cognitive Difficulty
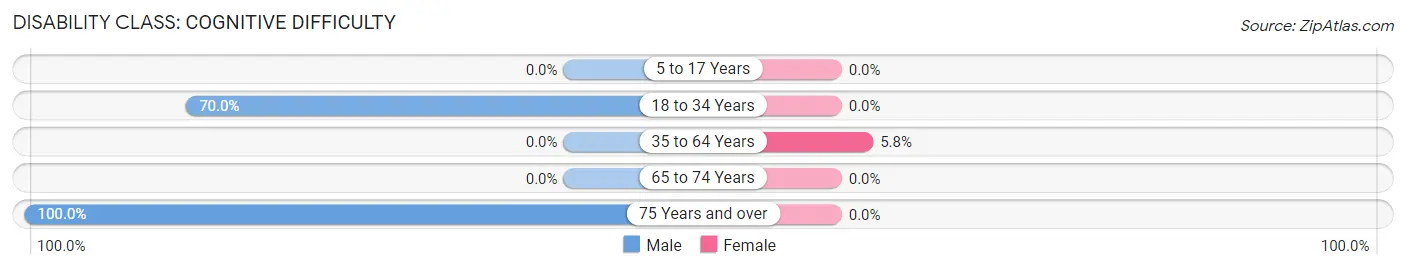
| Age Bracket | Male | Female |
| 5 to 17 Years | 0 (0.0%) | 0 (0.0%) |
| 18 to 34 Years | 49 (70.0%) | 0 (0.0%) |
| 35 to 64 Years | 0 (0.0%) | 13 (5.8%) |
| 65 to 74 Years | 0 (0.0%) | 0 (0.0%) |
| 75 Years and over | 48 (100.0%) | 0 (0.0%) |
Disability Class: Ambulatory Difficulty
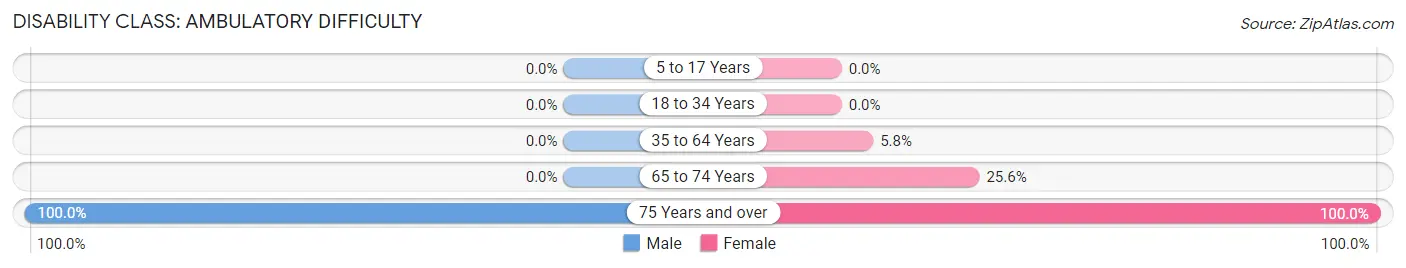
| Age Bracket | Male | Female |
| 5 to 17 Years | 0 (0.0%) | 0 (0.0%) |
| 18 to 34 Years | 0 (0.0%) | 0 (0.0%) |
| 35 to 64 Years | 0 (0.0%) | 13 (5.8%) |
| 65 to 74 Years | 0 (0.0%) | 23 (25.6%) |
| 75 Years and over | 48 (100.0%) | 49 (100.0%) |
Disability Class: Self-Care Difficulty
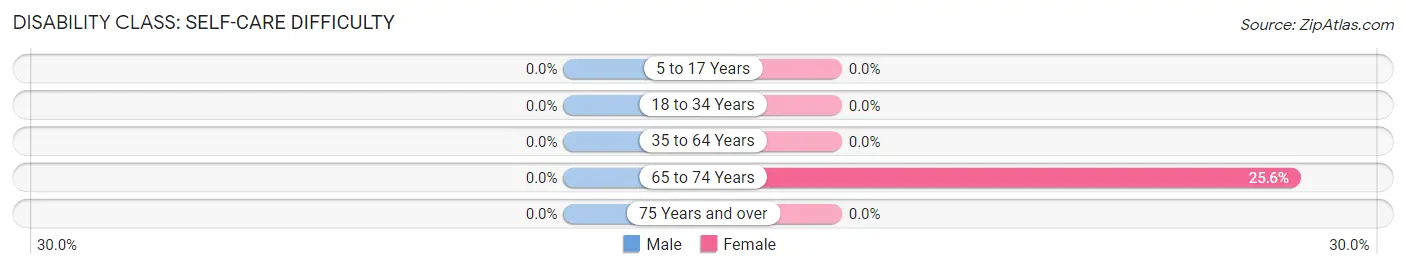
| Age Bracket | Male | Female |
| 5 to 17 Years | 0 (0.0%) | 0 (0.0%) |
| 18 to 34 Years | 0 (0.0%) | 0 (0.0%) |
| 35 to 64 Years | 0 (0.0%) | 0 (0.0%) |
| 65 to 74 Years | 0 (0.0%) | 23 (25.6%) |
| 75 Years and over | 0 (0.0%) | 0 (0.0%) |
Technology Access in Hide A Way Hills
Computing Device Access in Hide A Way Hills
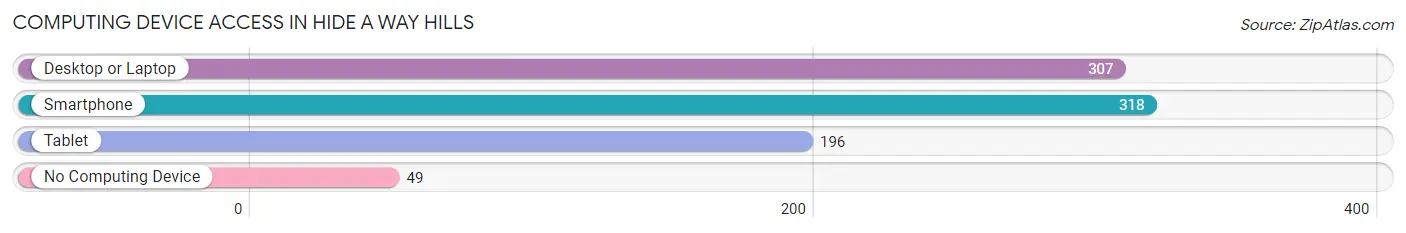
| Device Type | # Households | % Households |
| Desktop or Laptop | 307 | 83.7% |
| Smartphone | 318 | 86.7% |
| Tablet | 196 | 53.4% |
| No Computing Device | 49 | 13.4% |
| Total | 367 | 100.0% |
Internet Access in Hide A Way Hills
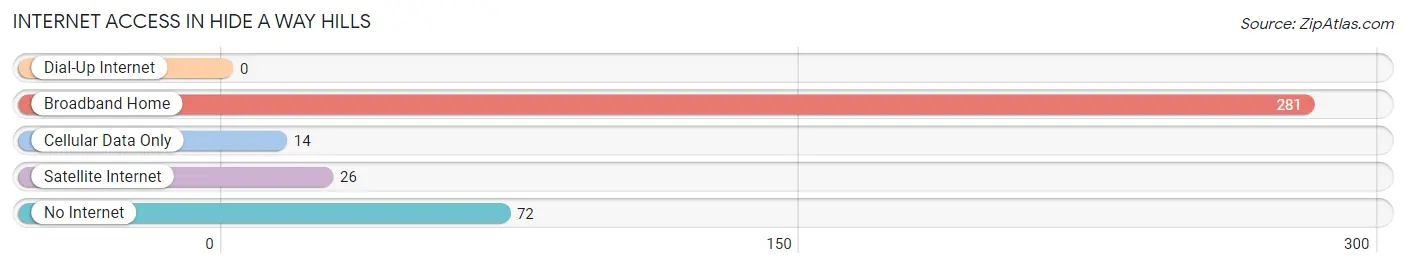
| Internet Type | # Households | % Households |
| Dial-Up Internet | 0 | 0.0% |
| Broadband Home | 281 | 76.6% |
| Cellular Data Only | 14 | 3.8% |
| Satellite Internet | 26 | 7.1% |
| No Internet | 72 | 19.6% |
| Total | 367 | 100.0% |
Hide A Way Hills Summary
History
Hide-A-Way Hills is a private residential community located in Fairfield County, Ohio. It was founded in 1959 by a group of businessmen who wanted to create a place where people could escape the hustle and bustle of city life. The community was designed to be a place of relaxation and recreation, with a focus on nature and outdoor activities. The founders wanted to create a place where people could enjoy the beauty of nature and the peace and quiet of the countryside.
The community was originally developed as a private, gated community, with a focus on providing a safe and secure environment for its residents. The founders also wanted to create a place where people could enjoy the outdoors and the natural beauty of the area. The community was designed to be a place of relaxation and recreation, with a focus on nature and outdoor activities.
The community was designed to be a place of relaxation and recreation, with a focus on nature and outdoor activities. The founders wanted to create a place where people could enjoy the beauty of nature and the peace and quiet of the countryside. The community was designed to be a place of relaxation and recreation, with a focus on nature and outdoor activities.
The founders also wanted to create a place where people could enjoy the outdoors and the natural beauty of the area. The community was designed to be a place of relaxation and recreation, with a focus on nature and outdoor activities. The founders also wanted to create a place where people could enjoy the outdoors and the natural beauty of the area.
The founders also wanted to create a place where people could enjoy the outdoors and the natural beauty of the area. The community was designed to be a place of relaxation and recreation, with a focus on nature and outdoor activities. The founders also wanted to create a place where people could enjoy the outdoors and the natural beauty of the area.
The founders also wanted to create a place where people could enjoy the outdoors and the natural beauty of the area. The community was designed to be a place of relaxation and recreation, with a focus on nature and outdoor activities. The founders also wanted to create a place where people could enjoy the outdoors and the natural beauty of the area.
Geography
Hide-A-Way Hills is located in Fairfield County, Ohio, approximately 40 miles southeast of Columbus. The community is situated on a hilltop, surrounded by rolling hills and wooded areas. The area is known for its scenic beauty and is home to a variety of wildlife, including deer, wild turkeys, and other animals. The community is also home to a variety of plants and trees, including oak, maple, and hickory.
The community is located near several major highways, including Interstate 70, US Route 33, and State Route 37. The community is also close to several major cities, including Columbus, Lancaster, and Zanesville.
Economy
Hide-A-Way Hills is a private residential community, and as such, does not have a traditional economy. The community is home to a variety of businesses, including restaurants, retail stores, and professional services. The community also has a variety of recreational activities, including golf, tennis, and swimming.
The community is also home to a variety of cultural and educational institutions, including the Hide-A-Way Hills Library, the Hide-A-Way Hills Historical Society, and the Hide-A-Way Hills Arts Council.
Demographics
As of the 2010 census, the population of Hide-A-Way Hills was 1,845. The population is predominantly white (97.3%), with a small percentage of African Americans (1.2%) and other races (1.5%). The median age of the population is 48.7 years, and the median household income is $68,958.
Hide-A-Way Hills is a close-knit community, and the residents are very involved in the community. The community is home to a variety of organizations, including the Hide-A-Way Hills Civic Association, the Hide-A-Way Hills Homeowners Association, and the Hide-A-Way Hills Business Association. The community also has a variety of recreational activities, including golf, tennis, and swimming.
Conclusion
Hide-A-Way Hills is a private residential community located in Fairfield County, Ohio. It was founded in 1959 by a group of businessmen who wanted to create a place where people could escape the hustle and bustle of city life. The community was designed to be a place of relaxation and recreation, with a focus on nature and outdoor activities. The founders wanted to create a place where people could enjoy the beauty of nature and the peace and quiet of the countryside.
The community is home to a variety of businesses, including restaurants, retail stores, and professional services. The community also has a variety of recreational activities, including golf, tennis, and swimming. The population of Hide-A-Way Hills is predominantly white (97.3%), with a small percentage of African Americans (1.2%) and other races (1.5%). The median age of the population is 48.7 years, and the median household income is $68,958.
Hide-A-Way Hills is a close-knit community, and the residents are very involved in the community. The community is home to a variety of organizations, including the Hide-A-Way Hills Civic Association, the Hide-A-Way Hills Homeowners Association, and the Hide-A-Way Hills Business Association. The community also has a variety of recreational activities, including golf, tennis, and swimming. Hide-A-Way Hills is a unique and special place, and it is a great place to live and visit.
Common Questions
What is Per Capita Income in Hide A Way Hills?
Per Capita income in Hide A Way Hills is $35,561.
What is the Median Family Income in Hide A Way Hills?
Median Family Income in Hide A Way Hills is $109,525.
What is the Median Household income in Hide A Way Hills?
Median Household Income in Hide A Way Hills is $108,875.
What is Inequality or Gini Index in Hide A Way Hills?
Inequality or Gini Index in Hide A Way Hills is 0.22.
What is the Total Population of Hide A Way Hills?
Total Population of Hide A Way Hills is 978.
What is the Total Male Population of Hide A Way Hills?
Total Male Population of Hide A Way Hills is 473.
What is the Total Female Population of Hide A Way Hills?
Total Female Population of Hide A Way Hills is 505.
What is the Ratio of Males per 100 Females in Hide A Way Hills?
There are 93.66 Males per 100 Females in Hide A Way Hills.
What is the Ratio of Females per 100 Males in Hide A Way Hills?
There are 106.77 Females per 100 Males in Hide A Way Hills.
What is the Median Population Age in Hide A Way Hills?
Median Population Age in Hide A Way Hills is 53.4 Years.
What is the Average Family Size in Hide A Way Hills
Average Family Size in Hide A Way Hills is 2.8 People.
What is the Average Household Size in Hide A Way Hills
Average Household Size in Hide A Way Hills is 2.7 People.
How Large is the Labor Force in Hide A Way Hills?
There are 409 People in the Labor Forcein in Hide A Way Hills.
What is the Percentage of People in the Labor Force in Hide A Way Hills?
49.2% of People are in the Labor Force in Hide A Way Hills.
What is the Unemployment Rate in Hide A Way Hills?
Unemployment Rate in Hide A Way Hills is 8.1%.