Mount Healthy, OH Map & Demographics
Mount Healthy Map
Mount Healthy Overview
$28,033
PER CAPITA INCOME
$60,188
AVG FAMILY INCOME
$44,471
AVG HOUSEHOLD INCOME
8.2%
WAGE / INCOME GAP [ % ]
91.8¢/ $1
WAGE / INCOME GAP [ $ ]
0.46
INEQUALITY / GINI INDEX
6,949
TOTAL POPULATION
3,375
MALE POPULATION
3,574
FEMALE POPULATION
94.43
MALES / 100 FEMALES
105.90
FEMALES / 100 MALES
40.0
MEDIAN AGE
2.9
AVG FAMILY SIZE
2.2
AVG HOUSEHOLD SIZE
3,352
LABOR FORCE [ PEOPLE ]
60.1%
PERCENT IN LABOR FORCE
6.0%
UNEMPLOYMENT RATE
Mount Healthy Area Codes
Income in Mount Healthy
Income Overview in Mount Healthy
Per Capita Income in Mount Healthy is $28,033, while median incomes of families and households are $60,188 and $44,471 respectively.
| Characteristic | Number | Measure |
| Per Capita Income | 6,949 | $28,033 |
| Median Family Income | 1,776 | $60,188 |
| Mean Family Income | 1,776 | $74,155 |
| Median Household Income | 2,985 | $44,471 |
| Mean Household Income | 2,985 | $62,852 |
| Income Deficit | 1,776 | $0 |
| Wage / Income Gap (%) | 6,949 | 8.24% |
| Wage / Income Gap ($) | 6,949 | 91.76¢ per $1 |
| Gini / Inequality Index | 6,949 | 0.46 |
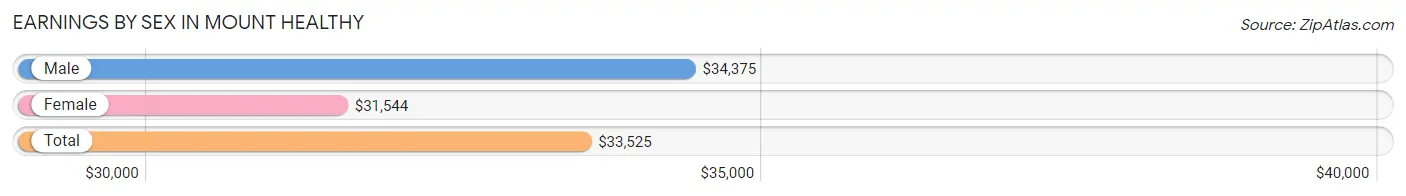
Earnings by Sex in Mount Healthy
Average Earnings in Mount Healthy are $33,525, $34,375 for men and $31,544 for women, a difference of 8.2%.
| Sex | Number | Average Earnings |
| Male | 1,507 (42.0%) | $34,375 |
| Female | 2,078 (58.0%) | $31,544 |
| Total | 3,585 (100.0%) | $33,525 |
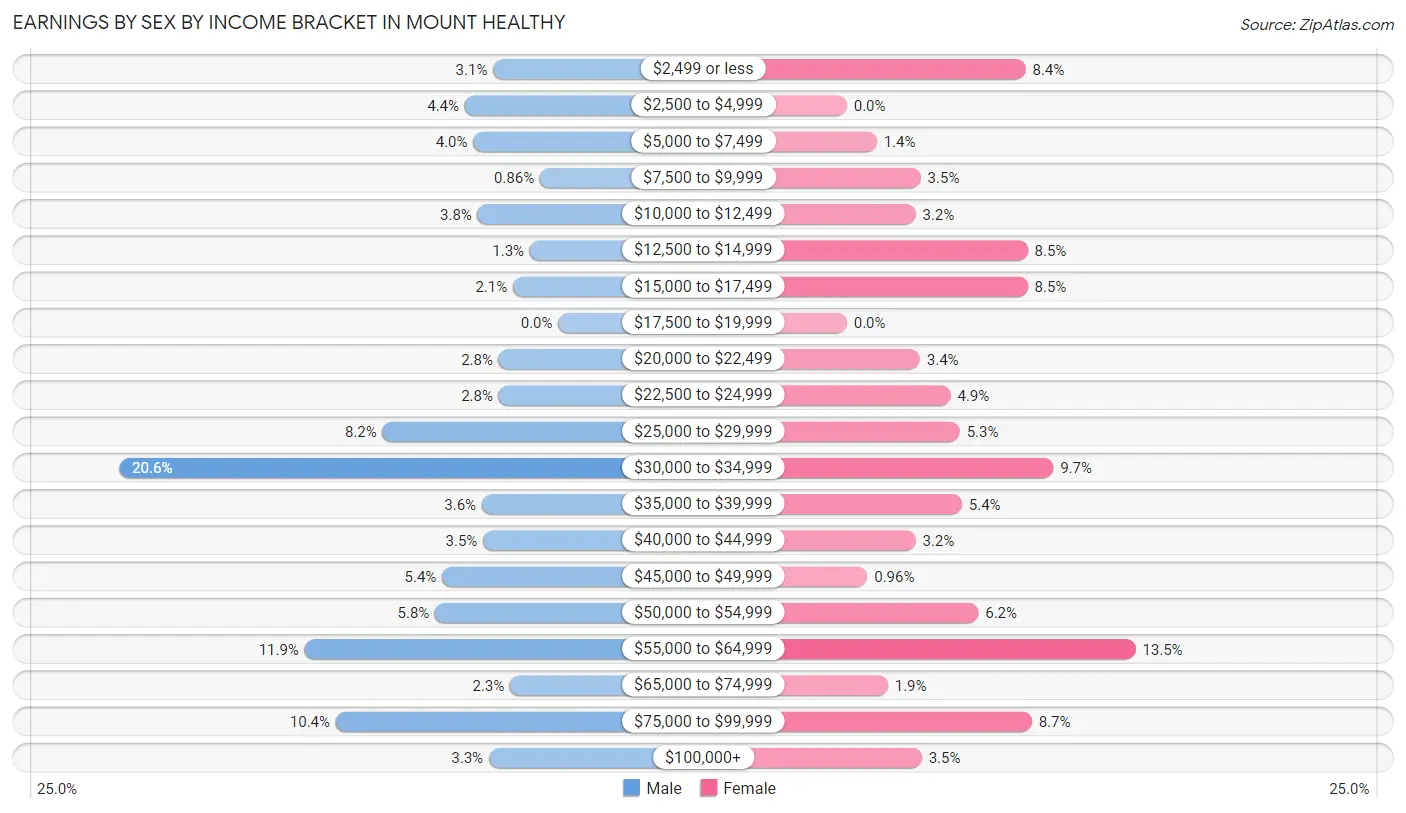
Earnings by Sex by Income Bracket in Mount Healthy
The most common earnings brackets in Mount Healthy are $30,000 to $34,999 for men (310 | 20.6%) and $55,000 to $64,999 for women (281 | 13.5%).
| Income | Male | Female |
| $2,499 or less | 46 (3.0%) | 174 (8.4%) |
| $2,500 to $4,999 | 66 (4.4%) | 0 (0.0%) |
| $5,000 to $7,499 | 60 (4.0%) | 29 (1.4%) |
| $7,500 to $9,999 | 13 (0.9%) | 72 (3.5%) |
| $10,000 to $12,499 | 57 (3.8%) | 67 (3.2%) |
| $12,500 to $14,999 | 20 (1.3%) | 176 (8.5%) |
| $15,000 to $17,499 | 32 (2.1%) | 176 (8.5%) |
| $17,500 to $19,999 | 0 (0.0%) | 0 (0.0%) |
| $20,000 to $22,499 | 42 (2.8%) | 71 (3.4%) |
| $22,500 to $24,999 | 42 (2.8%) | 101 (4.9%) |
| $25,000 to $29,999 | 124 (8.2%) | 110 (5.3%) |
| $30,000 to $34,999 | 310 (20.6%) | 201 (9.7%) |
| $35,000 to $39,999 | 54 (3.6%) | 112 (5.4%) |
| $40,000 to $44,999 | 53 (3.5%) | 67 (3.2%) |
| $45,000 to $49,999 | 82 (5.4%) | 20 (1.0%) |
| $50,000 to $54,999 | 87 (5.8%) | 128 (6.2%) |
| $55,000 to $64,999 | 179 (11.9%) | 281 (13.5%) |
| $65,000 to $74,999 | 34 (2.3%) | 40 (1.9%) |
| $75,000 to $99,999 | 157 (10.4%) | 180 (8.7%) |
| $100,000+ | 49 (3.3%) | 73 (3.5%) |
| Total | 1,507 (100.0%) | 2,078 (100.0%) |
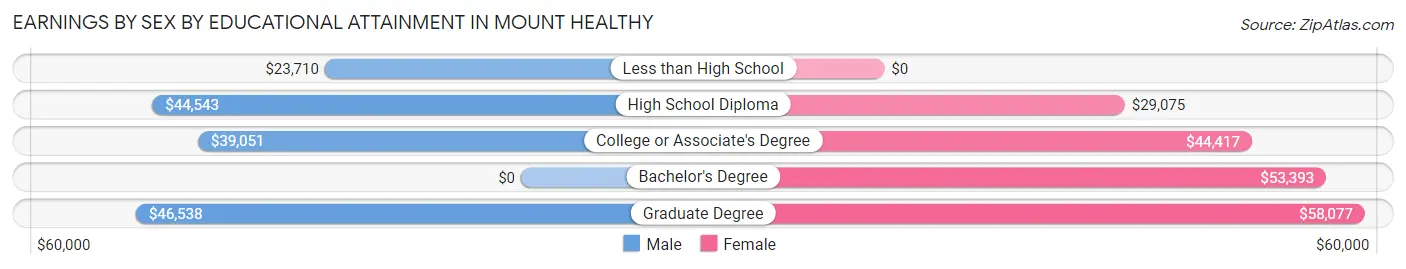
Earnings by Sex by Educational Attainment in Mount Healthy
Average earnings in Mount Healthy are $40,521 for men and $34,596 for women, a difference of 14.6%. Men with an educational attainment of graduate degree enjoy the highest average annual earnings of $46,538, while those with less than high school education earn the least with $23,710. Women with an educational attainment of graduate degree earn the most with the average annual earnings of $58,077, while those with high school diploma education have the smallest earnings of $29,075.
| Educational Attainment | Male Income | Female Income |
| Less than High School | $23,710 | $0 |
| High School Diploma | $44,543 | $29,075 |
| College or Associate's Degree | $39,051 | $44,417 |
| Bachelor's Degree | - | - |
| Graduate Degree | $46,538 | $58,077 |
| Total | $40,521 | $34,596 |
Family Income in Mount Healthy
Family Income Brackets in Mount Healthy
According to the Mount Healthy family income data, there are 345 families falling into the $25,000 to $34,999 income range, which is the most common income bracket and makes up 19.4% of all families.
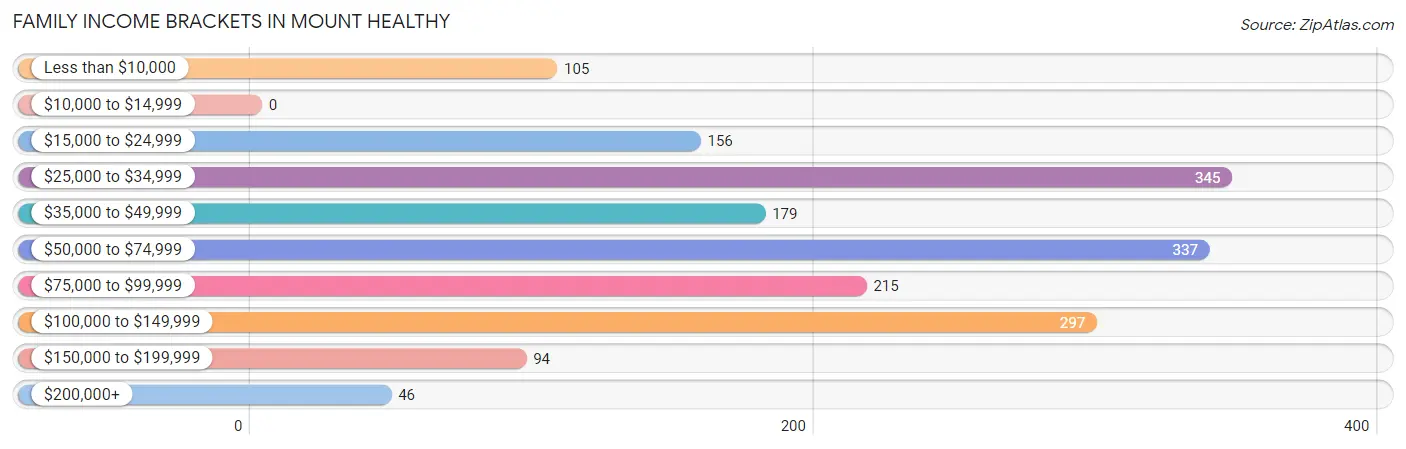
| Income Bracket | # Families | % Families |
| Less than $10,000 | 105 | 5.9% |
| $10,000 to $14,999 | 0 | 0.0% |
| $15,000 to $24,999 | 156 | 8.8% |
| $25,000 to $34,999 | 345 | 19.4% |
| $35,000 to $49,999 | 179 | 10.1% |
| $50,000 to $74,999 | 337 | 19.0% |
| $75,000 to $99,999 | 215 | 12.1% |
| $100,000 to $149,999 | 297 | 16.7% |
| $150,000 to $199,999 | 94 | 5.3% |
| $200,000+ | 46 | 2.6% |
Family Income by Famaliy Size in Mount Healthy
6-person families (43 | 2.4%) account for the highest median family income in Mount Healthy with $123,622 per family, while 4-person families (208 | 11.7%) have the highest median income of $28,221 per family member.
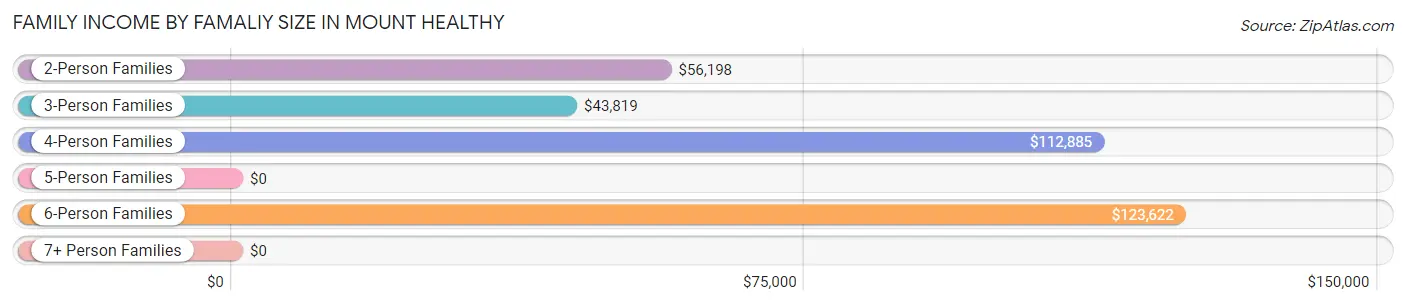
| Income Bracket | # Families | Median Income |
| 2-Person Families | 842 (47.4%) | $56,198 |
| 3-Person Families | 627 (35.3%) | $43,819 |
| 4-Person Families | 208 (11.7%) | $112,885 |
| 5-Person Families | 56 (3.2%) | $0 |
| 6-Person Families | 43 (2.4%) | $123,622 |
| 7+ Person Families | 0 (0.0%) | $0 |
| Total | 1,776 (100.0%) | $60,188 |
Family Income by Number of Earners in Mount Healthy
The median family income in Mount Healthy is $60,188, with families comprising 3+ earners (269) having the highest median family income of $124,647, while families with 1 earner (662) have the lowest median family income of $34,433, accounting for 15.1% and 37.3% of families, respectively.
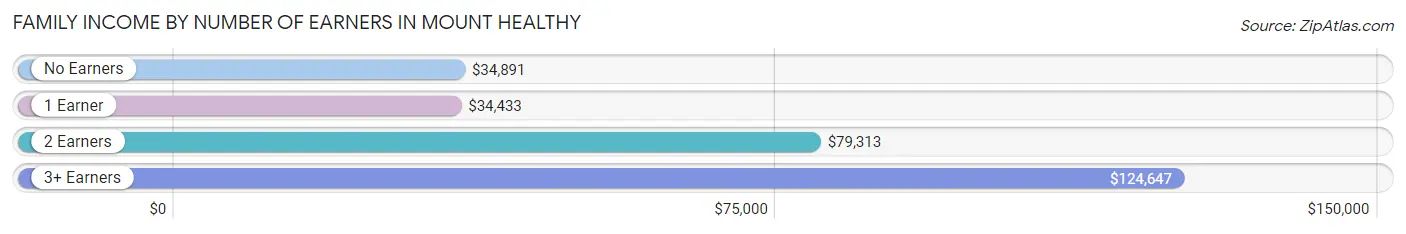
| Number of Earners | # Families | Median Income |
| No Earners | 276 (15.5%) | $34,891 |
| 1 Earner | 662 (37.3%) | $34,433 |
| 2 Earners | 569 (32.0%) | $79,313 |
| 3+ Earners | 269 (15.1%) | $124,647 |
| Total | 1,776 (100.0%) | $60,188 |
Household Income in Mount Healthy
Household Income Brackets in Mount Healthy
With 510 households falling in the category, the $25,000 to $34,999 income range is the most frequent in Mount Healthy, accounting for 17.1% of all households. In contrast, only 48 households (1.6%) fall into the $200,000+ income bracket, making it the least populous group.
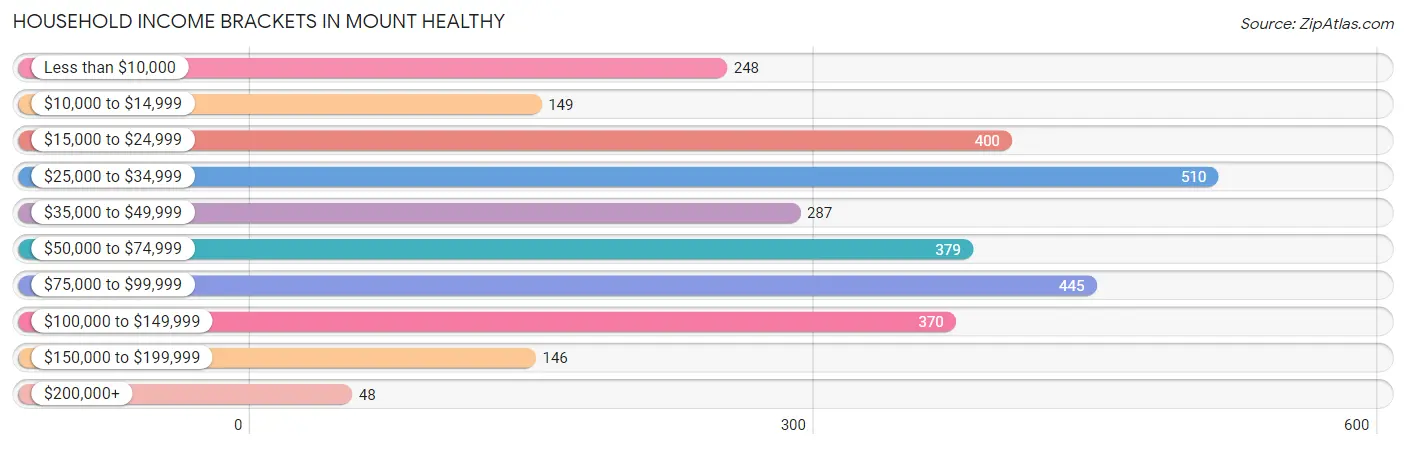
| Income Bracket | # Households | % Households |
| Less than $10,000 | 248 | 8.3% |
| $10,000 to $14,999 | 149 | 5.0% |
| $15,000 to $24,999 | 400 | 13.4% |
| $25,000 to $34,999 | 510 | 17.1% |
| $35,000 to $49,999 | 287 | 9.6% |
| $50,000 to $74,999 | 379 | 12.7% |
| $75,000 to $99,999 | 445 | 14.9% |
| $100,000 to $149,999 | 370 | 12.4% |
| $150,000 to $199,999 | 146 | 4.9% |
| $200,000+ | 48 | 1.6% |
Household Income by Householder Age in Mount Healthy
The median household income in Mount Healthy is $44,471, with the highest median household income of $60,764 found in the 45 to 64 years age bracket for the primary householder. A total of 1,164 households (39.0%) fall into this category. Meanwhile, the 15 to 24 years age bracket for the primary householder has the lowest median household income of $0, with 111 households (3.7%) in this group.
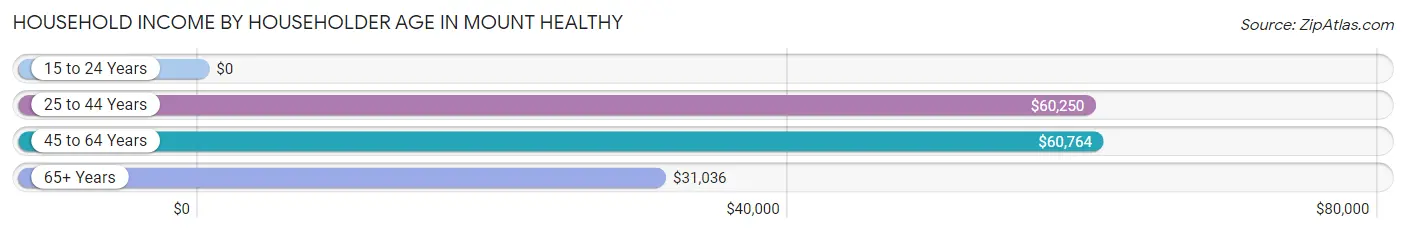
| Income Bracket | # Households | Median Income |
| 15 to 24 Years | 111 (3.7%) | $0 |
| 25 to 44 Years | 750 (25.1%) | $60,250 |
| 45 to 64 Years | 1,164 (39.0%) | $60,764 |
| 65+ Years | 960 (32.2%) | $31,036 |
| Total | 2,985 (100.0%) | $44,471 |
Poverty in Mount Healthy
Income Below Poverty by Sex and Age in Mount Healthy
With 16.3% poverty level for males and 18.1% for females among the residents of Mount Healthy, 12 to 14 year old males and under 5 year old females are the most vulnerable to poverty, with 260 males (86.1%) and 70 females (64.8%) in their respective age groups living below the poverty level.
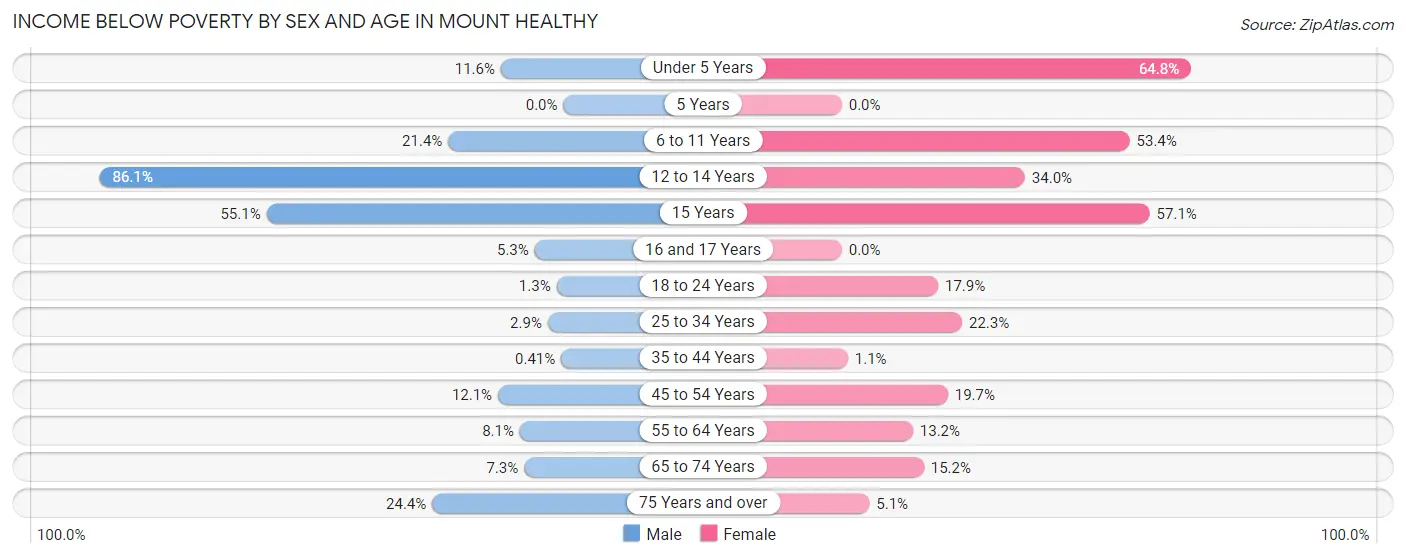
| Age Bracket | Male | Female |
| Under 5 Years | 39 (11.6%) | 70 (64.8%) |
| 5 Years | 0 (0.0%) | 0 (0.0%) |
| 6 to 11 Years | 65 (21.4%) | 39 (53.4%) |
| 12 to 14 Years | 260 (86.1%) | 52 (34.0%) |
| 15 Years | 27 (55.1%) | 12 (57.1%) |
| 16 and 17 Years | 4 (5.3%) | 0 (0.0%) |
| 18 to 24 Years | 4 (1.3%) | 45 (17.9%) |
| 25 to 34 Years | 12 (2.9%) | 158 (22.3%) |
| 35 to 44 Years | 1 (0.4%) | 3 (1.1%) |
| 45 to 54 Years | 51 (12.1%) | 98 (19.7%) |
| 55 to 64 Years | 34 (8.1%) | 60 (13.2%) |
| 65 to 74 Years | 27 (7.3%) | 58 (15.2%) |
| 75 Years and over | 19 (24.4%) | 21 (5.1%) |
| Total | 543 (16.3%) | 616 (18.1%) |
Income Above Poverty by Sex and Age in Mount Healthy
According to the poverty statistics in Mount Healthy, males aged 5 years and females aged 5 years are the age groups that are most secure financially, with 100.0% of males and 100.0% of females in these age groups living above the poverty line.
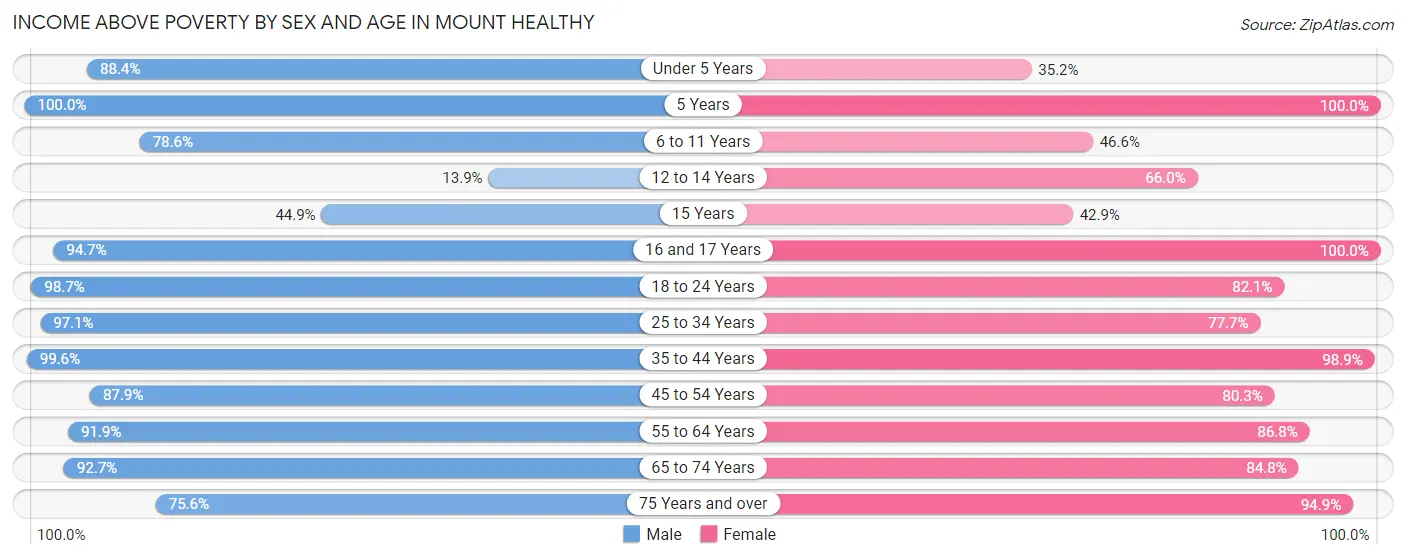
| Age Bracket | Male | Female |
| Under 5 Years | 297 (88.4%) | 38 (35.2%) |
| 5 Years | 13 (100.0%) | 13 (100.0%) |
| 6 to 11 Years | 239 (78.6%) | 34 (46.6%) |
| 12 to 14 Years | 42 (13.9%) | 101 (66.0%) |
| 15 Years | 22 (44.9%) | 9 (42.9%) |
| 16 and 17 Years | 71 (94.7%) | 68 (100.0%) |
| 18 to 24 Years | 311 (98.7%) | 207 (82.1%) |
| 25 to 34 Years | 402 (97.1%) | 550 (77.7%) |
| 35 to 44 Years | 240 (99.6%) | 262 (98.9%) |
| 45 to 54 Years | 369 (87.9%) | 400 (80.3%) |
| 55 to 64 Years | 387 (91.9%) | 395 (86.8%) |
| 65 to 74 Years | 343 (92.7%) | 323 (84.8%) |
| 75 Years and over | 59 (75.6%) | 389 (94.9%) |
| Total | 2,795 (83.7%) | 2,789 (81.9%) |
Income Below Poverty Among Married-Couple Families in Mount Healthy
The poverty statistics for married-couple families in Mount Healthy show that 3.6% or 24 of the total 669 families live below the poverty line. Families with 1 or 2 children have the highest poverty rate of 6.7%, comprising of 12 families. On the other hand, families with 3 or 4 children have the lowest poverty rate of 0.0%, which includes 0 families.
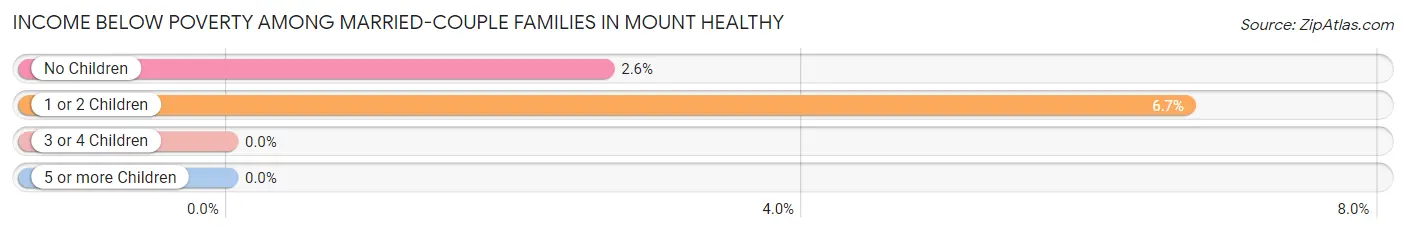
| Children | Above Poverty | Below Poverty |
| No Children | 446 (97.4%) | 12 (2.6%) |
| 1 or 2 Children | 168 (93.3%) | 12 (6.7%) |
| 3 or 4 Children | 31 (100.0%) | 0 (0.0%) |
| 5 or more Children | 0 (0.0%) | 0 (0.0%) |
| Total | 645 (96.4%) | 24 (3.6%) |
Income Below Poverty Among Single-Parent Households in Mount Healthy
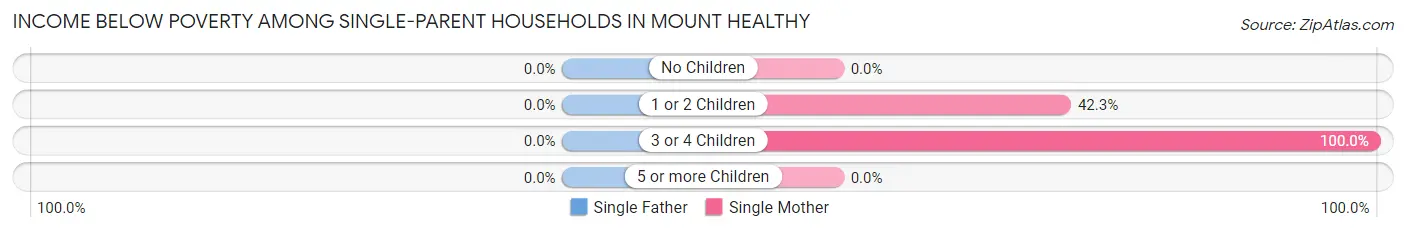
| Children | Single Father | Single Mother |
| No Children | 0 (0.0%) | 0 (0.0%) |
| 1 or 2 Children | 0 (0.0%) | 199 (42.3%) |
| 3 or 4 Children | 0 (0.0%) | 29 (100.0%) |
| 5 or more Children | 0 (0.0%) | 0 (0.0%) |
| Total | 0 (0.0%) | 228 (27.3%) |
Income Below Poverty Among Married-Couple vs Single-Parent Households in Mount Healthy
The poverty data for Mount Healthy shows that 24 of the married-couple family households (3.6%) and 228 of the single-parent households (20.6%) are living below the poverty level. Within the married-couple family households, those with 1 or 2 children have the highest poverty rate, with 12 households (6.7%) falling below the poverty line. Among the single-parent households, those with 3 or 4 children have the highest poverty rate, with 29 household (100.0%) living below poverty.
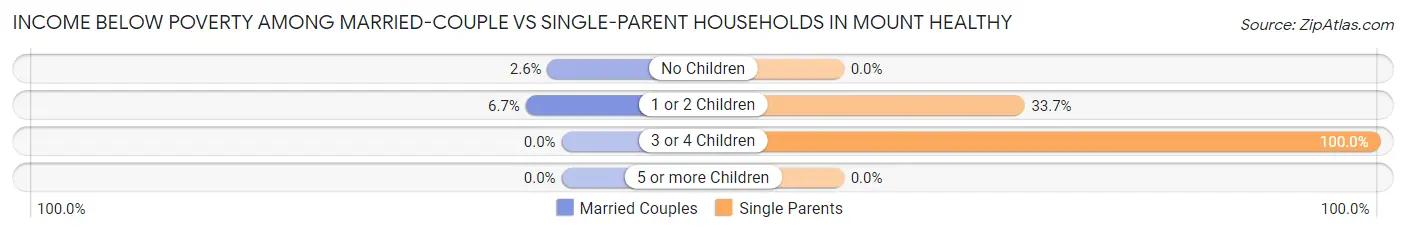
| Children | Married-Couple Families | Single-Parent Households |
| No Children | 12 (2.6%) | 0 (0.0%) |
| 1 or 2 Children | 12 (6.7%) | 199 (33.7%) |
| 3 or 4 Children | 0 (0.0%) | 29 (100.0%) |
| 5 or more Children | 0 (0.0%) | 0 (0.0%) |
| Total | 24 (3.6%) | 228 (20.6%) |
Race in Mount Healthy
The most populous races in Mount Healthy are White / Caucasian (3,465 | 49.9%), Black / African American (3,288 | 47.3%), and Hispanic or Latino (138 | 2.0%).
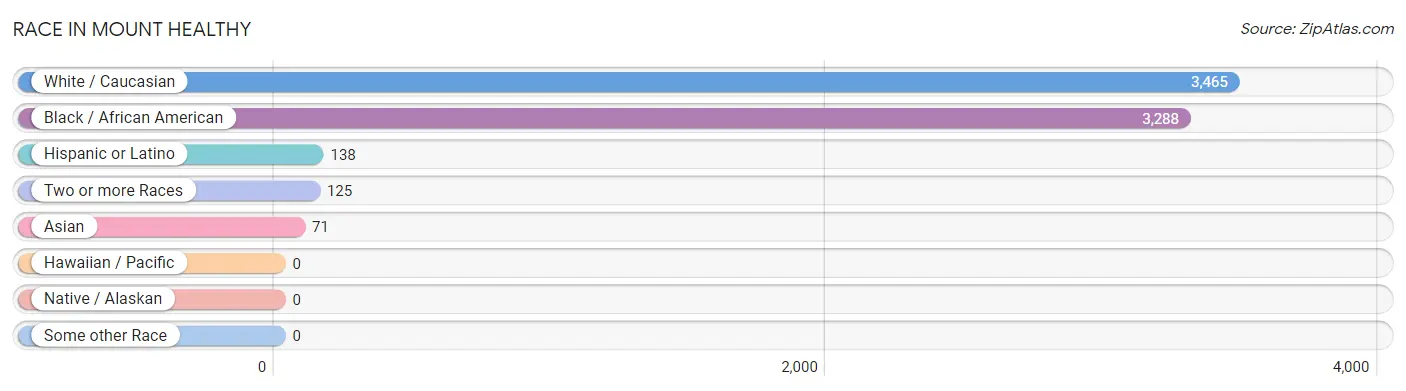
| Race | # Population | % Population |
| Asian | 71 | 1.0% |
| Black / African American | 3,288 | 47.3% |
| Hawaiian / Pacific | 0 | 0.0% |
| Hispanic or Latino | 138 | 2.0% |
| Native / Alaskan | 0 | 0.0% |
| White / Caucasian | 3,465 | 49.9% |
| Two or more Races | 125 | 1.8% |
| Some other Race | 0 | 0.0% |
| Total | 6,949 | 100.0% |
Ancestry in Mount Healthy
The most populous ancestries reported in Mount Healthy are German (920 | 13.2%), Irish (574 | 8.3%), English (302 | 4.3%), American (257 | 3.7%), and Dutch (112 | 1.6%), together accounting for 31.2% of all Mount Healthy residents.
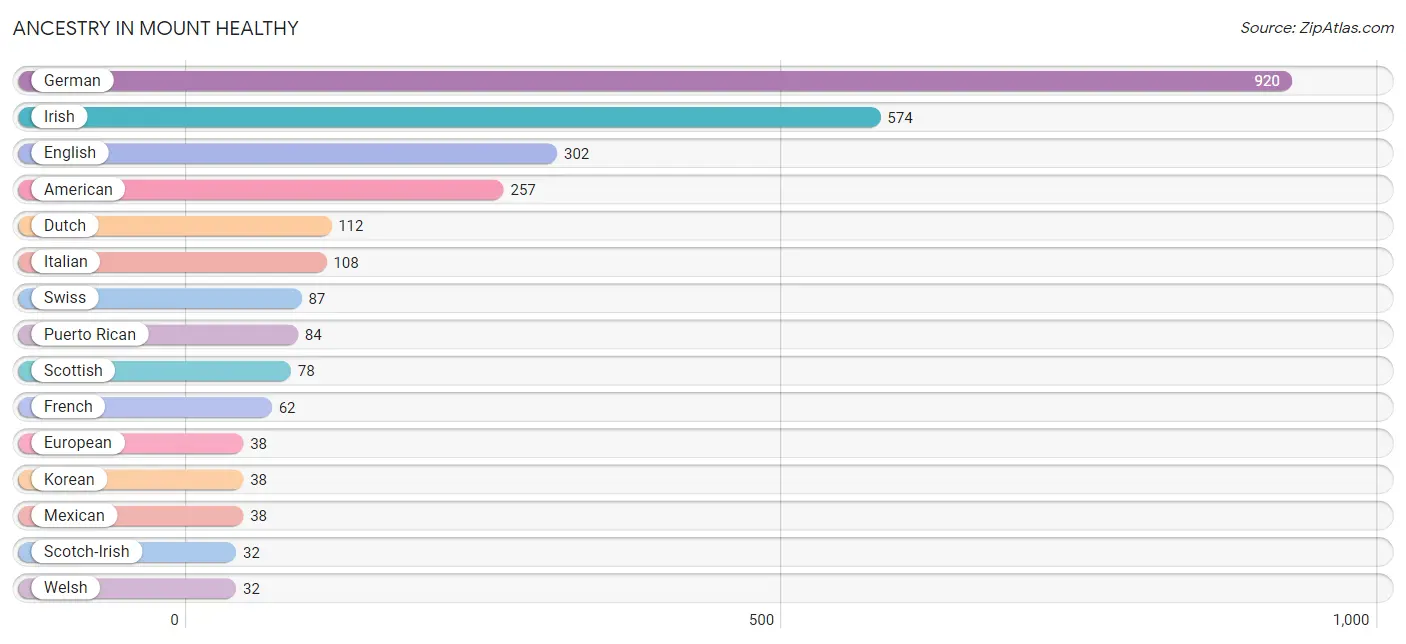
| Ancestry | # Population | % Population |
| American | 257 | 3.7% |
| British | 28 | 0.4% |
| British West Indian | 20 | 0.3% |
| Cherokee | 12 | 0.2% |
| Chippewa | 1 | 0.0% |
| Colombian | 9 | 0.1% |
| Dutch | 112 | 1.6% |
| Eastern European | 13 | 0.2% |
| English | 302 | 4.3% |
| European | 38 | 0.5% |
| French | 62 | 0.9% |
| German | 920 | 13.2% |
| Indian (Asian) | 7 | 0.1% |
| Irish | 574 | 8.3% |
| Italian | 108 | 1.5% |
| Korean | 38 | 0.5% |
| Mexican | 38 | 0.5% |
| Mexican American Indian | 23 | 0.3% |
| Peruvian | 7 | 0.1% |
| Polish | 13 | 0.2% |
| Puerto Rican | 84 | 1.2% |
| Romanian | 28 | 0.4% |
| Scandinavian | 7 | 0.1% |
| Scotch-Irish | 32 | 0.5% |
| Scottish | 78 | 1.1% |
| South American | 16 | 0.2% |
| South American Indian | 20 | 0.3% |
| Swedish | 16 | 0.2% |
| Swiss | 87 | 1.3% |
| Thai | 26 | 0.4% |
| Welsh | 32 | 0.5% |
| Yugoslavian | 1 | 0.0% | View All 32 Rows |
Immigrants in Mount Healthy
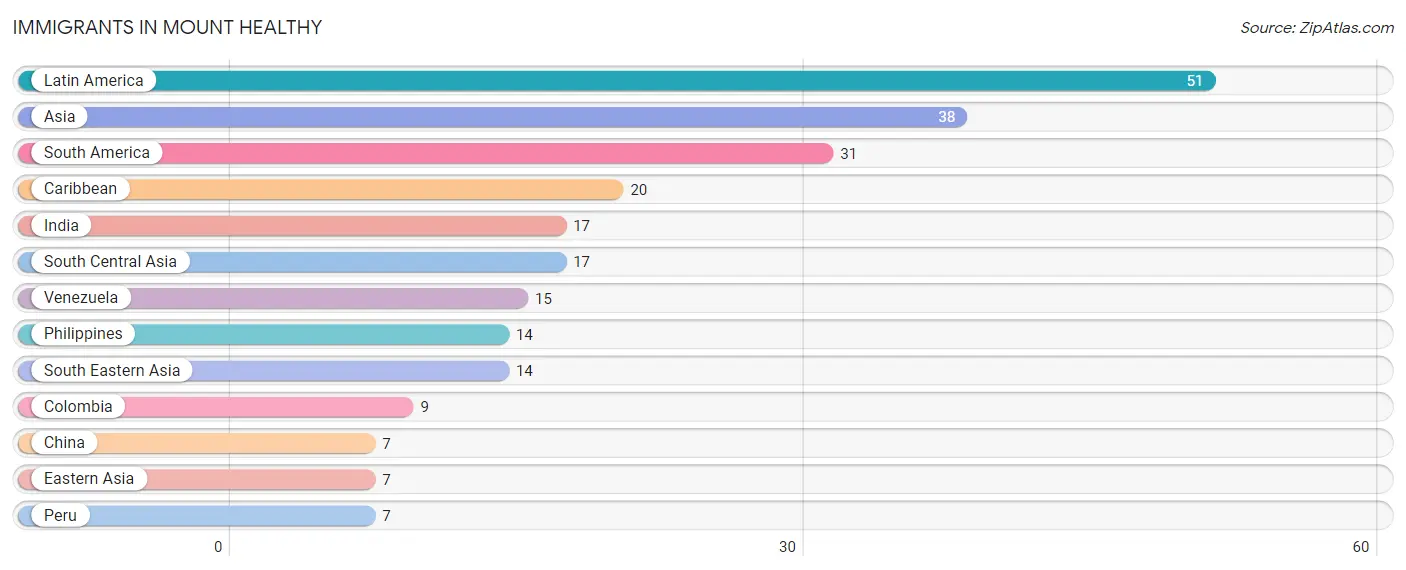
The most numerous immigrant groups reported in Mount Healthy came from Latin America (51 | 0.7%), Asia (38 | 0.5%), South America (31 | 0.4%), Caribbean (20 | 0.3%), and India (17 | 0.2%), together accounting for 2.3% of all Mount Healthy residents.
| Immigration Origin | # Population | % Population |
| Asia | 38 | 0.5% |
| Caribbean | 20 | 0.3% |
| China | 7 | 0.1% |
| Colombia | 9 | 0.1% |
| Eastern Asia | 7 | 0.1% |
| India | 17 | 0.2% |
| Latin America | 51 | 0.7% |
| Peru | 7 | 0.1% |
| Philippines | 14 | 0.2% |
| South America | 31 | 0.4% |
| South Central Asia | 17 | 0.2% |
| South Eastern Asia | 14 | 0.2% |
| Venezuela | 15 | 0.2% | View All 13 Rows |
Sex and Age in Mount Healthy
Sex and Age in Mount Healthy
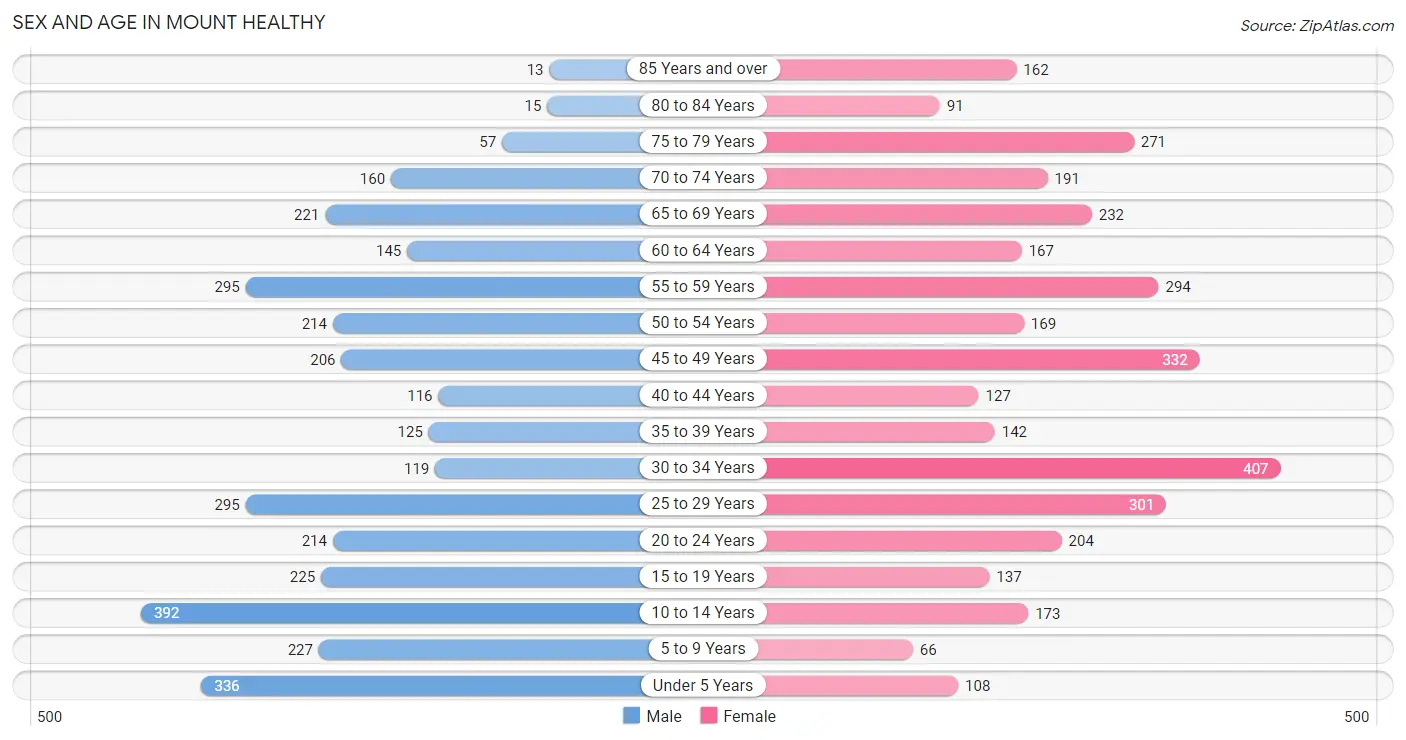
The most populous age groups in Mount Healthy are 10 to 14 Years (392 | 11.6%) for men and 30 to 34 Years (407 | 11.4%) for women.
| Age Bracket | Male | Female |
| Under 5 Years | 336 (10.0%) | 108 (3.0%) |
| 5 to 9 Years | 227 (6.7%) | 66 (1.8%) |
| 10 to 14 Years | 392 (11.6%) | 173 (4.8%) |
| 15 to 19 Years | 225 (6.7%) | 137 (3.8%) |
| 20 to 24 Years | 214 (6.3%) | 204 (5.7%) |
| 25 to 29 Years | 295 (8.7%) | 301 (8.4%) |
| 30 to 34 Years | 119 (3.5%) | 407 (11.4%) |
| 35 to 39 Years | 125 (3.7%) | 142 (4.0%) |
| 40 to 44 Years | 116 (3.4%) | 127 (3.5%) |
| 45 to 49 Years | 206 (6.1%) | 332 (9.3%) |
| 50 to 54 Years | 214 (6.3%) | 169 (4.7%) |
| 55 to 59 Years | 295 (8.7%) | 294 (8.2%) |
| 60 to 64 Years | 145 (4.3%) | 167 (4.7%) |
| 65 to 69 Years | 221 (6.6%) | 232 (6.5%) |
| 70 to 74 Years | 160 (4.7%) | 191 (5.3%) |
| 75 to 79 Years | 57 (1.7%) | 271 (7.6%) |
| 80 to 84 Years | 15 (0.4%) | 91 (2.5%) |
| 85 Years and over | 13 (0.4%) | 162 (4.5%) |
| Total | 3,375 (100.0%) | 3,574 (100.0%) |
Families and Households in Mount Healthy
Median Family Size in Mount Healthy
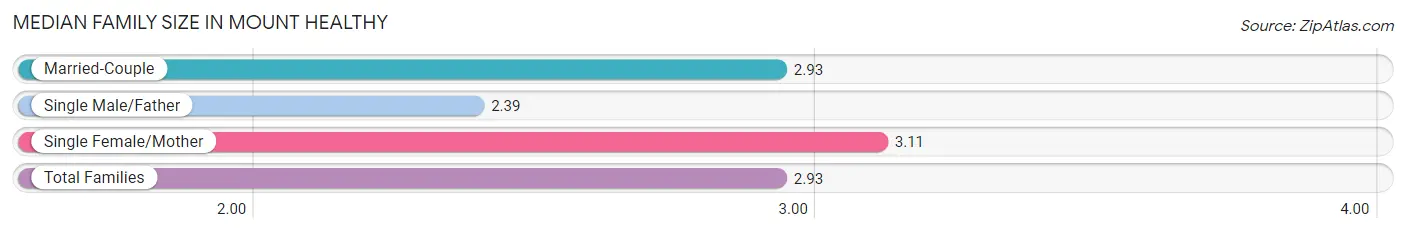
The median family size in Mount Healthy is 2.93 persons per family, with single female/mother families (836 | 47.1%) accounting for the largest median family size of 3.11 persons per family. On the other hand, single male/father families (271 | 15.3%) represent the smallest median family size with 2.39 persons per family.
| Family Type | # Families | Family Size |
| Married-Couple | 669 (37.7%) | 2.93 |
| Single Male/Father | 271 (15.3%) | 2.39 |
| Single Female/Mother | 836 (47.1%) | 3.11 |
| Total Families | 1,776 (100.0%) | 2.93 |
Median Household Size in Mount Healthy
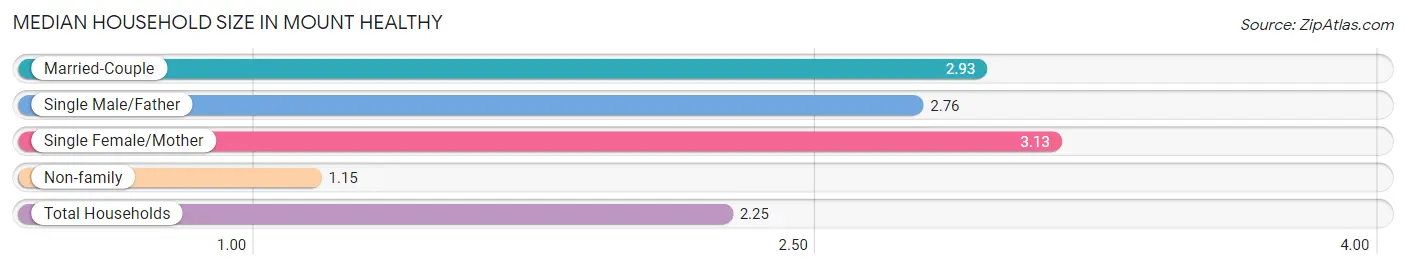
The median household size in Mount Healthy is 2.25 persons per household, with single female/mother households (836 | 28.0%) accounting for the largest median household size of 3.13 persons per household. non-family households (1,209 | 40.5%) represent the smallest median household size with 1.15 persons per household.
| Household Type | # Households | Household Size |
| Married-Couple | 669 (22.4%) | 2.93 |
| Single Male/Father | 271 (9.1%) | 2.76 |
| Single Female/Mother | 836 (28.0%) | 3.13 |
| Non-family | 1,209 (40.5%) | 1.15 |
| Total Households | 2,985 (100.0%) | 2.25 |
Household Size by Marriage Status in Mount Healthy
Out of a total of 2,985 households in Mount Healthy, 1,776 (59.5%) are family households, while 1,209 (40.5%) are nonfamily households. The most numerous type of family households are 2-person households, comprising 798, and the most common type of nonfamily households are 1-person households, comprising 1,053.
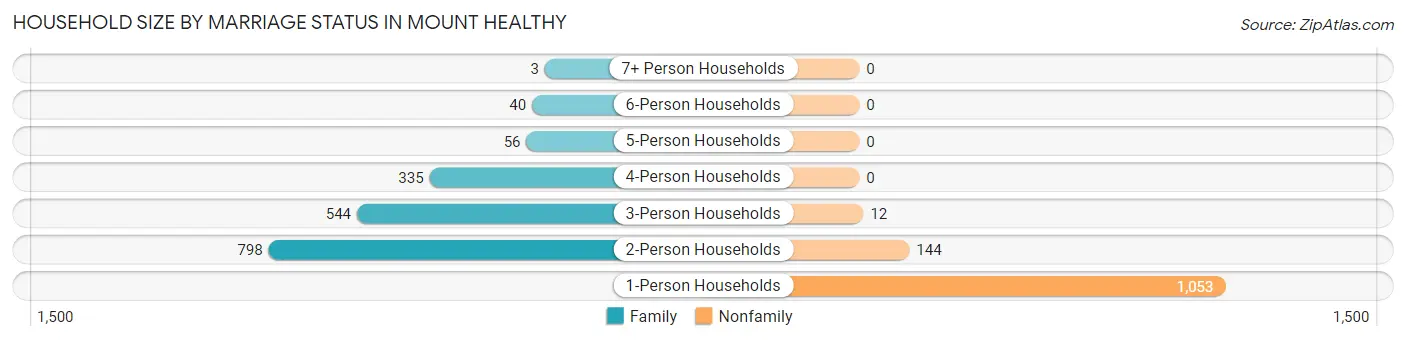
| Household Size | Family Households | Nonfamily Households |
| 1-Person Households | - | 1,053 (35.3%) |
| 2-Person Households | 798 (26.7%) | 144 (4.8%) |
| 3-Person Households | 544 (18.2%) | 12 (0.4%) |
| 4-Person Households | 335 (11.2%) | 0 (0.0%) |
| 5-Person Households | 56 (1.9%) | 0 (0.0%) |
| 6-Person Households | 40 (1.3%) | 0 (0.0%) |
| 7+ Person Households | 3 (0.1%) | 0 (0.0%) |
| Total | 1,776 (59.5%) | 1,209 (40.5%) |
Female Fertility in Mount Healthy
Fertility by Age in Mount Healthy
Average fertility rate in Mount Healthy is 27.0 births per 1,000 women. Women in the age bracket of 20 to 34 years have the highest fertility rate with 49.0 births per 1,000 women. Women in the age bracket of 20 to 34 years acount for 100.0% of all women with births.
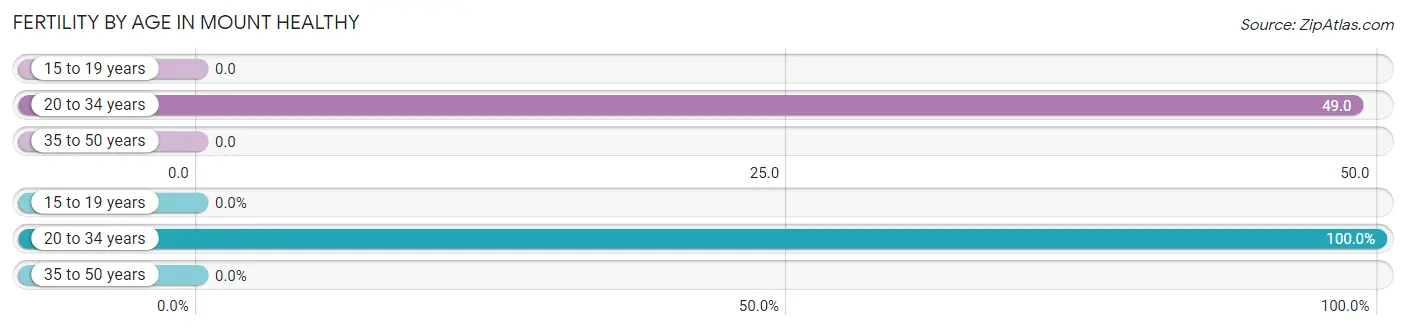
| Age Bracket | Women with Births | Births / 1,000 Women |
| 15 to 19 years | 0 (0.0%) | 0.0 |
| 20 to 34 years | 45 (100.0%) | 49.0 |
| 35 to 50 years | 0 (0.0%) | 0.0 |
| Total | 45 (100.0%) | 27.0 |
Fertility by Age by Marriage Status in Mount Healthy
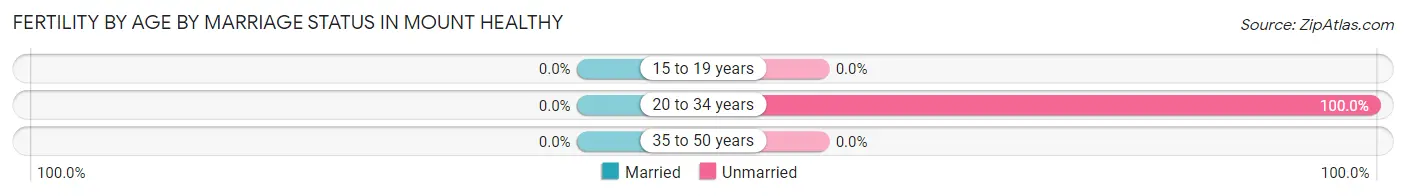
| Age Bracket | Married | Unmarried |
| 15 to 19 years | 0 (0.0%) | 0 (0.0%) |
| 20 to 34 years | 0 (0.0%) | 45 (100.0%) |
| 35 to 50 years | 0 (0.0%) | 0 (0.0%) |
| Total | 0 (0.0%) | 45 (100.0%) |
Fertility by Education in Mount Healthy
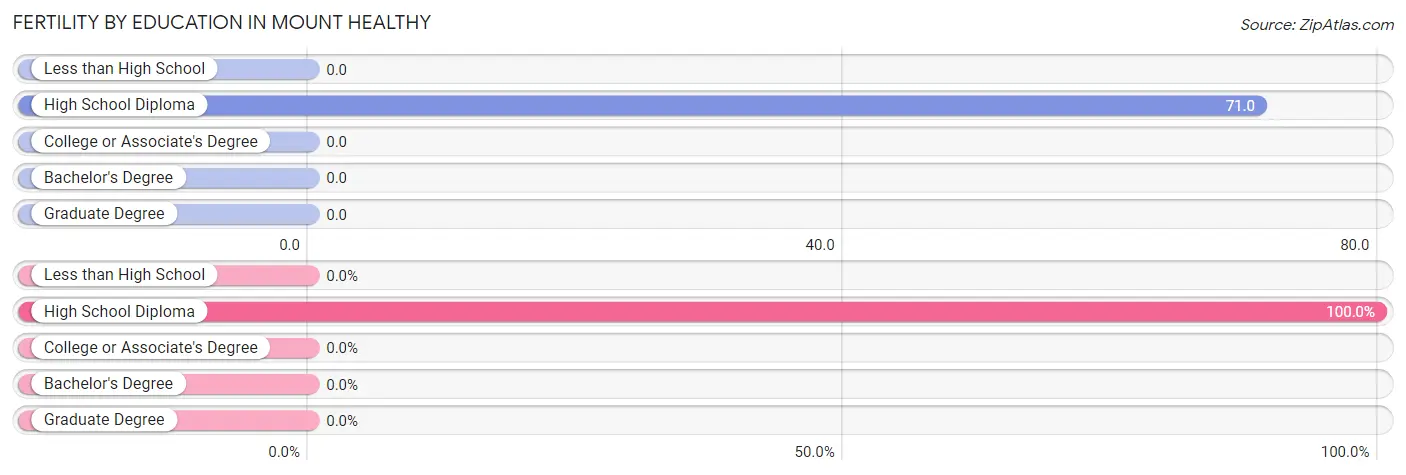
| Educational Attainment | Women with Births | Births / 1,000 Women |
| Less than High School | 0 (0.0%) | 0.0 |
| High School Diploma | 45 (100.0%) | 71.0 |
| College or Associate's Degree | 0 (0.0%) | 0.0 |
| Bachelor's Degree | 0 (0.0%) | 0.0 |
| Graduate Degree | 0 (0.0%) | 0.0 |
| Total | 45 (100.0%) | 27.0 |
Fertility by Education by Marriage Status in Mount Healthy
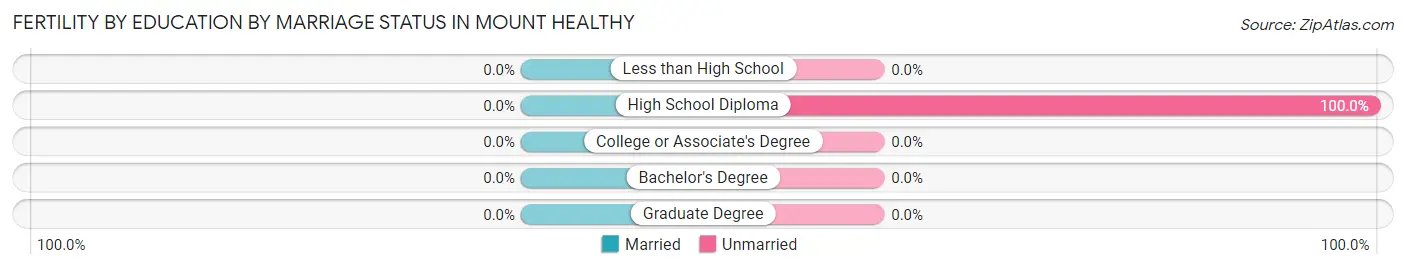
| Educational Attainment | Married | Unmarried |
| Less than High School | 0 (0.0%) | 0 (0.0%) |
| High School Diploma | 0 (0.0%) | 45 (100.0%) |
| College or Associate's Degree | 0 (0.0%) | 0 (0.0%) |
| Bachelor's Degree | 0 (0.0%) | 0 (0.0%) |
| Graduate Degree | 0 (0.0%) | 0 (0.0%) |
| Total | 0 (0.0%) | 45 (100.0%) |
Employment Characteristics in Mount Healthy
Employment by Class of Employer in Mount Healthy
Among the 2,996 employed individuals in Mount Healthy, private company employees (2,368 | 79.0%), not-for-profit organizations (270 | 9.0%), and local government employees (159 | 5.3%) make up the most common classes of employment.
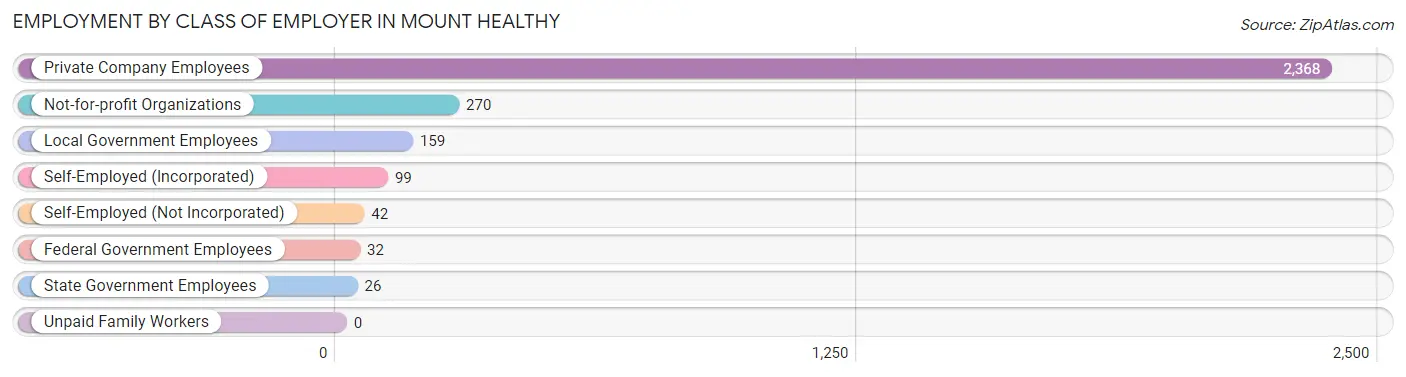
| Employer Class | # Employees | % Employees |
| Private Company Employees | 2,368 | 79.0% |
| Self-Employed (Incorporated) | 99 | 3.3% |
| Self-Employed (Not Incorporated) | 42 | 1.4% |
| Not-for-profit Organizations | 270 | 9.0% |
| Local Government Employees | 159 | 5.3% |
| State Government Employees | 26 | 0.9% |
| Federal Government Employees | 32 | 1.1% |
| Unpaid Family Workers | 0 | 0.0% |
| Total | 2,996 | 100.0% |
Employment Status by Age in Mount Healthy
According to the labor force statistics for Mount Healthy, out of the total population over 16 years of age (5,577), 60.1% or 3,352 individuals are in the labor force, with 6.0% or 201 of them unemployed. The age group with the highest labor force participation rate is 35 to 44 years, with 91.4% or 466 individuals in the labor force. Within the labor force, the 16 to 19 years age range has the highest percentage of unemployed individuals, with 38.5% or 47 of them being unemployed.
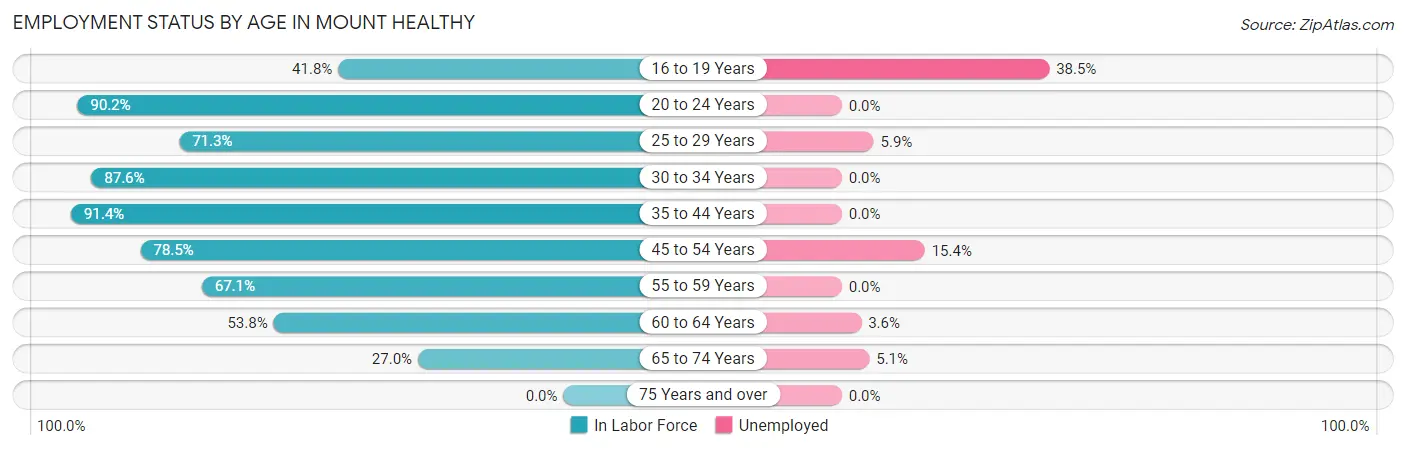
| Age Bracket | In Labor Force | Unemployed |
| 16 to 19 Years | 122 (41.8%) | 47 (38.5%) |
| 20 to 24 Years | 377 (90.2%) | 0 (0.0%) |
| 25 to 29 Years | 425 (71.3%) | 25 (5.9%) |
| 30 to 34 Years | 461 (87.6%) | 0 (0.0%) |
| 35 to 44 Years | 466 (91.4%) | 0 (0.0%) |
| 45 to 54 Years | 723 (78.5%) | 111 (15.4%) |
| 55 to 59 Years | 395 (67.1%) | 0 (0.0%) |
| 60 to 64 Years | 168 (53.8%) | 6 (3.6%) |
| 65 to 74 Years | 217 (27.0%) | 11 (5.1%) |
| 75 Years and over | 0 (0.0%) | 0 (0.0%) |
| Total | 3,352 (60.1%) | 201 (6.0%) |
Employment Status by Educational Attainment in Mount Healthy
According to labor force statistics for Mount Healthy, 76.4% of individuals (2,639) out of the total population between 25 and 64 years of age (3,454) are in the labor force, with 5.4% or 143 of them being unemployed. The group with the highest labor force participation rate are those with the educational attainment of bachelor's degree or higher, with 85.2% or 525 individuals in the labor force. Within the labor force, individuals with college / associate degree education have the highest percentage of unemployment, with 10.6% or 115 of them being unemployed.
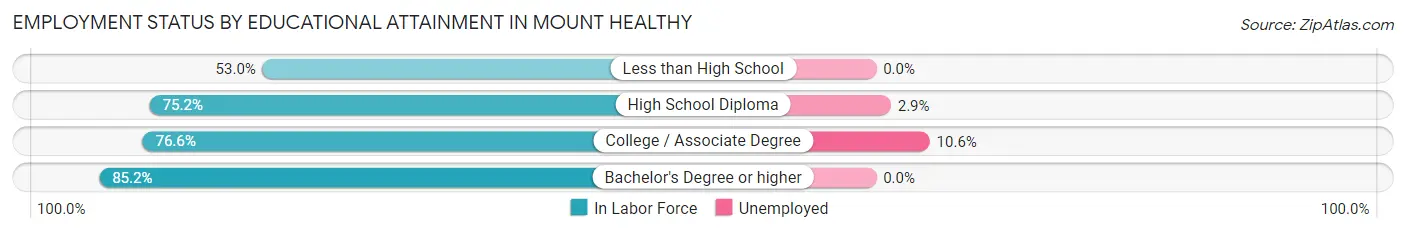
| Educational Attainment | In Labor Force | Unemployed |
| Less than High School | 96 (53.0%) | 0 (0.0%) |
| High School Diploma | 935 (75.2%) | 36 (2.9%) |
| College / Associate Degree | 1,082 (76.6%) | 150 (10.6%) |
| Bachelor's Degree or higher | 525 (85.2%) | 0 (0.0%) |
| Total | 2,639 (76.4%) | 187 (5.4%) |
Employment Occupations by Sex in Mount Healthy
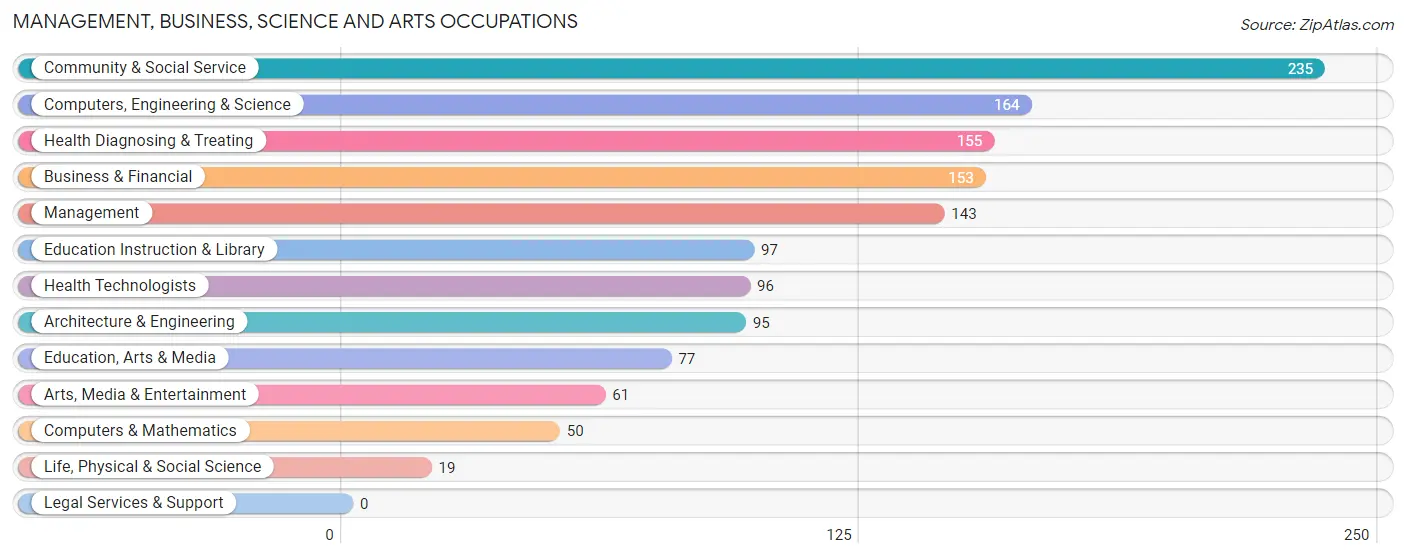
Management, Business, Science and Arts Occupations
The most common Management, Business, Science and Arts occupations in Mount Healthy are Community & Social Service (235 | 7.4%), Computers, Engineering & Science (164 | 5.2%), Health Diagnosing & Treating (155 | 4.9%), Business & Financial (153 | 4.9%), and Management (143 | 4.5%).
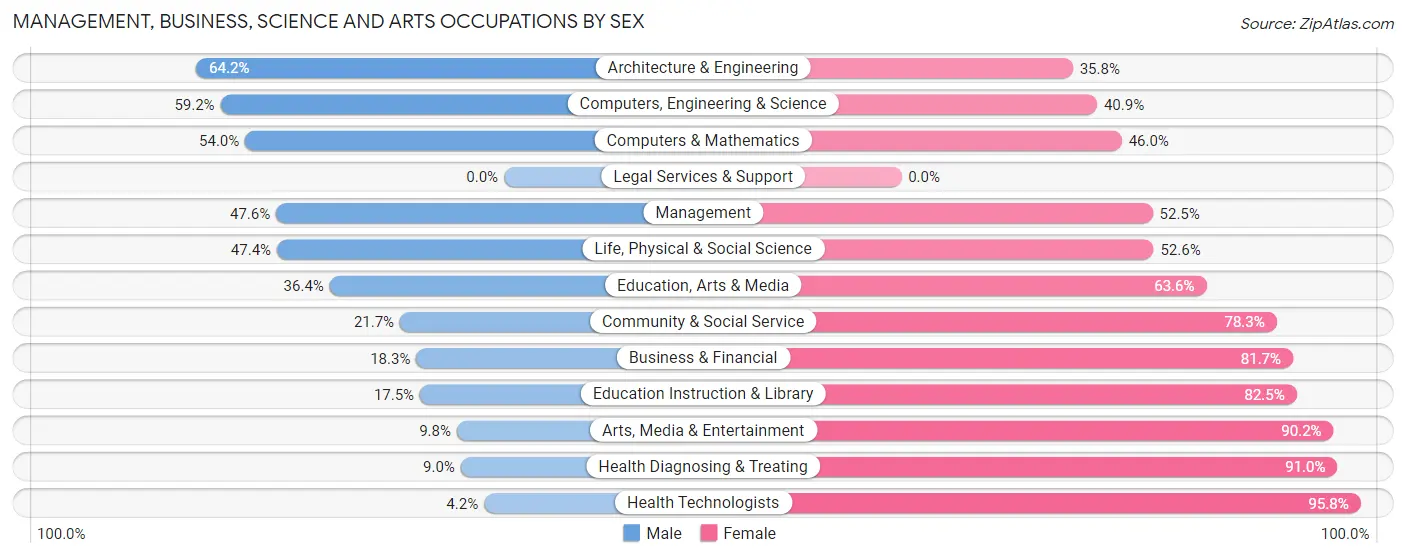
Management, Business, Science and Arts Occupations by Sex
Within the Management, Business, Science and Arts occupations in Mount Healthy, the most male-oriented occupations are Architecture & Engineering (64.2%), Computers, Engineering & Science (59.2%), and Computers & Mathematics (54.0%), while the most female-oriented occupations are Health Technologists (95.8%), Health Diagnosing & Treating (91.0%), and Arts, Media & Entertainment (90.2%).
| Occupation | Male | Female |
| Management | 68 (47.5%) | 75 (52.4%) |
| Business & Financial | 28 (18.3%) | 125 (81.7%) |
| Computers, Engineering & Science | 97 (59.2%) | 67 (40.8%) |
| Computers & Mathematics | 27 (54.0%) | 23 (46.0%) |
| Architecture & Engineering | 61 (64.2%) | 34 (35.8%) |
| Life, Physical & Social Science | 9 (47.4%) | 10 (52.6%) |
| Community & Social Service | 51 (21.7%) | 184 (78.3%) |
| Education, Arts & Media | 28 (36.4%) | 49 (63.6%) |
| Legal Services & Support | 0 (0.0%) | 0 (0.0%) |
| Education Instruction & Library | 17 (17.5%) | 80 (82.5%) |
| Arts, Media & Entertainment | 6 (9.8%) | 55 (90.2%) |
| Health Diagnosing & Treating | 14 (9.0%) | 141 (91.0%) |
| Health Technologists | 4 (4.2%) | 92 (95.8%) |
| Total (Category) | 258 (30.3%) | 592 (69.7%) |
| Total (Overall) | 1,215 (38.5%) | 1,939 (61.5%) |
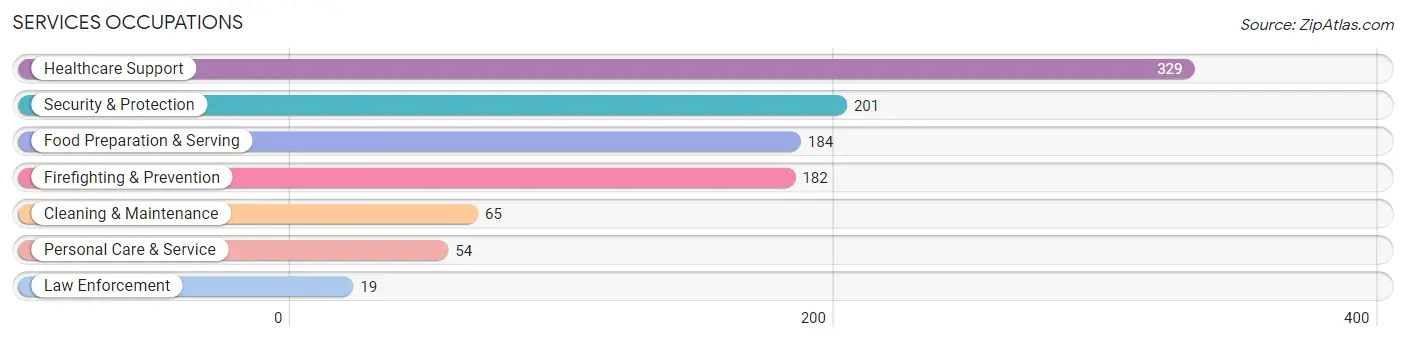
Services Occupations
The most common Services occupations in Mount Healthy are Healthcare Support (329 | 10.4%), Security & Protection (201 | 6.4%), Food Preparation & Serving (184 | 5.8%), Firefighting & Prevention (182 | 5.8%), and Cleaning & Maintenance (65 | 2.1%).
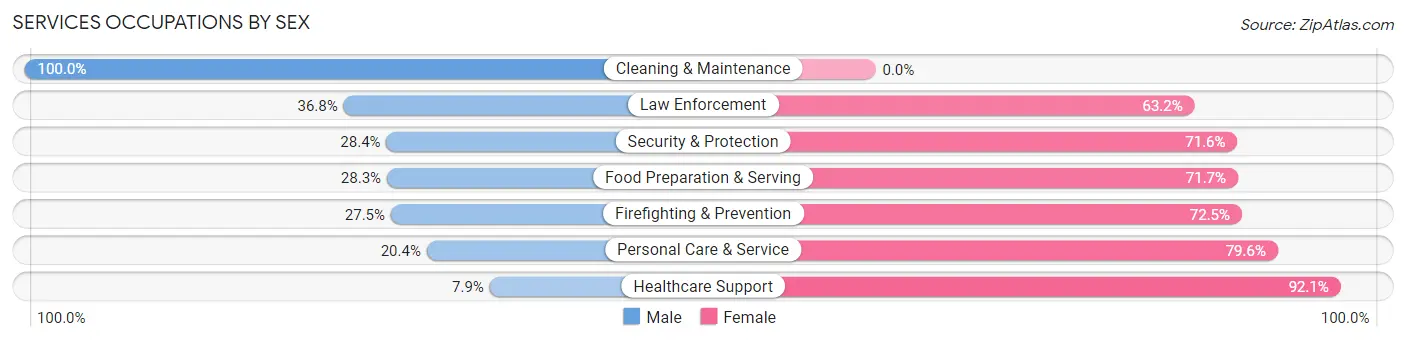
Services Occupations by Sex
Within the Services occupations in Mount Healthy, the most male-oriented occupations are Cleaning & Maintenance (100.0%), Law Enforcement (36.8%), and Security & Protection (28.4%), while the most female-oriented occupations are Healthcare Support (92.1%), Personal Care & Service (79.6%), and Firefighting & Prevention (72.5%).
| Occupation | Male | Female |
| Healthcare Support | 26 (7.9%) | 303 (92.1%) |
| Security & Protection | 57 (28.4%) | 144 (71.6%) |
| Firefighting & Prevention | 50 (27.5%) | 132 (72.5%) |
| Law Enforcement | 7 (36.8%) | 12 (63.2%) |
| Food Preparation & Serving | 52 (28.3%) | 132 (71.7%) |
| Cleaning & Maintenance | 65 (100.0%) | 0 (0.0%) |
| Personal Care & Service | 11 (20.4%) | 43 (79.6%) |
| Total (Category) | 211 (25.3%) | 622 (74.7%) |
| Total (Overall) | 1,215 (38.5%) | 1,939 (61.5%) |
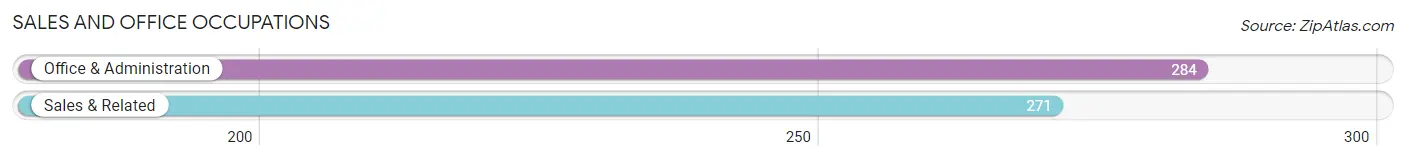
Sales and Office Occupations
The most common Sales and Office occupations in Mount Healthy are Office & Administration (284 | 9.0%), and Sales & Related (271 | 8.6%).
Sales and Office Occupations by Sex
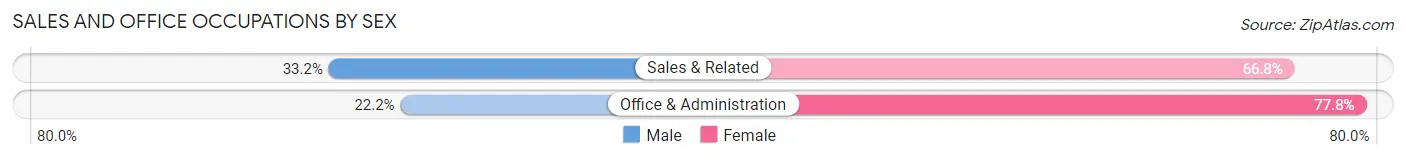
| Occupation | Male | Female |
| Sales & Related | 90 (33.2%) | 181 (66.8%) |
| Office & Administration | 63 (22.2%) | 221 (77.8%) |
| Total (Category) | 153 (27.6%) | 402 (72.4%) |
| Total (Overall) | 1,215 (38.5%) | 1,939 (61.5%) |
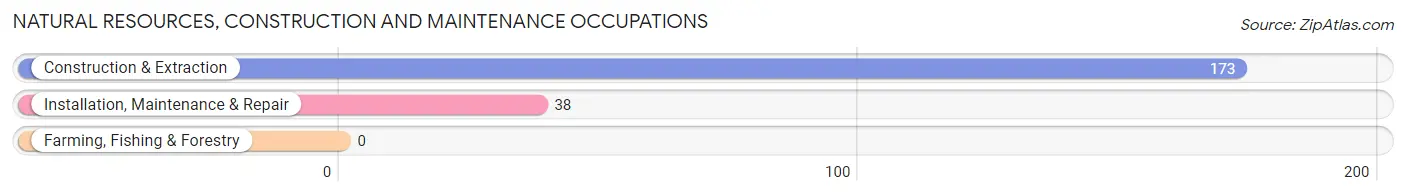
Natural Resources, Construction and Maintenance Occupations
The most common Natural Resources, Construction and Maintenance occupations in Mount Healthy are Construction & Extraction (173 | 5.5%), and Installation, Maintenance & Repair (38 | 1.2%).
Natural Resources, Construction and Maintenance Occupations by Sex
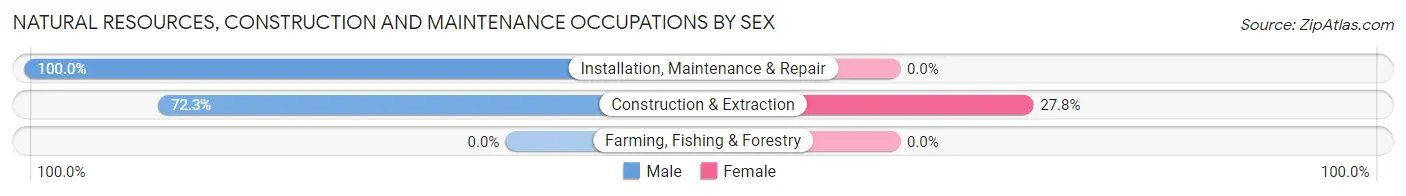
| Occupation | Male | Female |
| Farming, Fishing & Forestry | 0 (0.0%) | 0 (0.0%) |
| Construction & Extraction | 125 (72.3%) | 48 (27.8%) |
| Installation, Maintenance & Repair | 38 (100.0%) | 0 (0.0%) |
| Total (Category) | 163 (77.2%) | 48 (22.8%) |
| Total (Overall) | 1,215 (38.5%) | 1,939 (61.5%) |
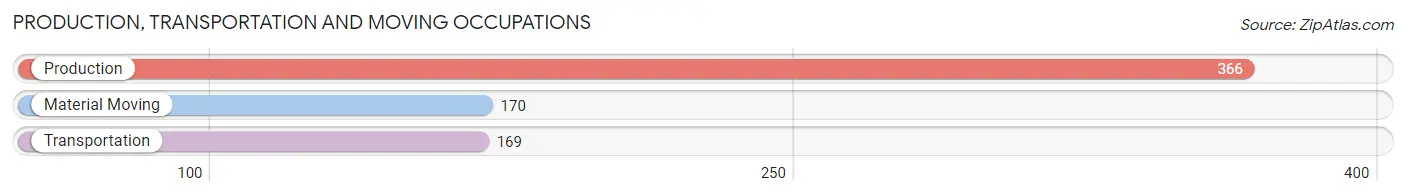
Production, Transportation and Moving Occupations
The most common Production, Transportation and Moving occupations in Mount Healthy are Production (366 | 11.6%), Material Moving (170 | 5.4%), and Transportation (169 | 5.4%).
Production, Transportation and Moving Occupations by Sex
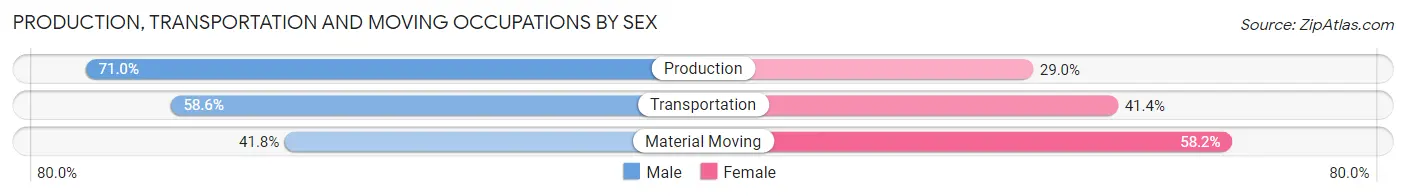
| Occupation | Male | Female |
| Production | 260 (71.0%) | 106 (29.0%) |
| Transportation | 99 (58.6%) | 70 (41.4%) |
| Material Moving | 71 (41.8%) | 99 (58.2%) |
| Total (Category) | 430 (61.0%) | 275 (39.0%) |
| Total (Overall) | 1,215 (38.5%) | 1,939 (61.5%) |
Employment Industries by Sex in Mount Healthy
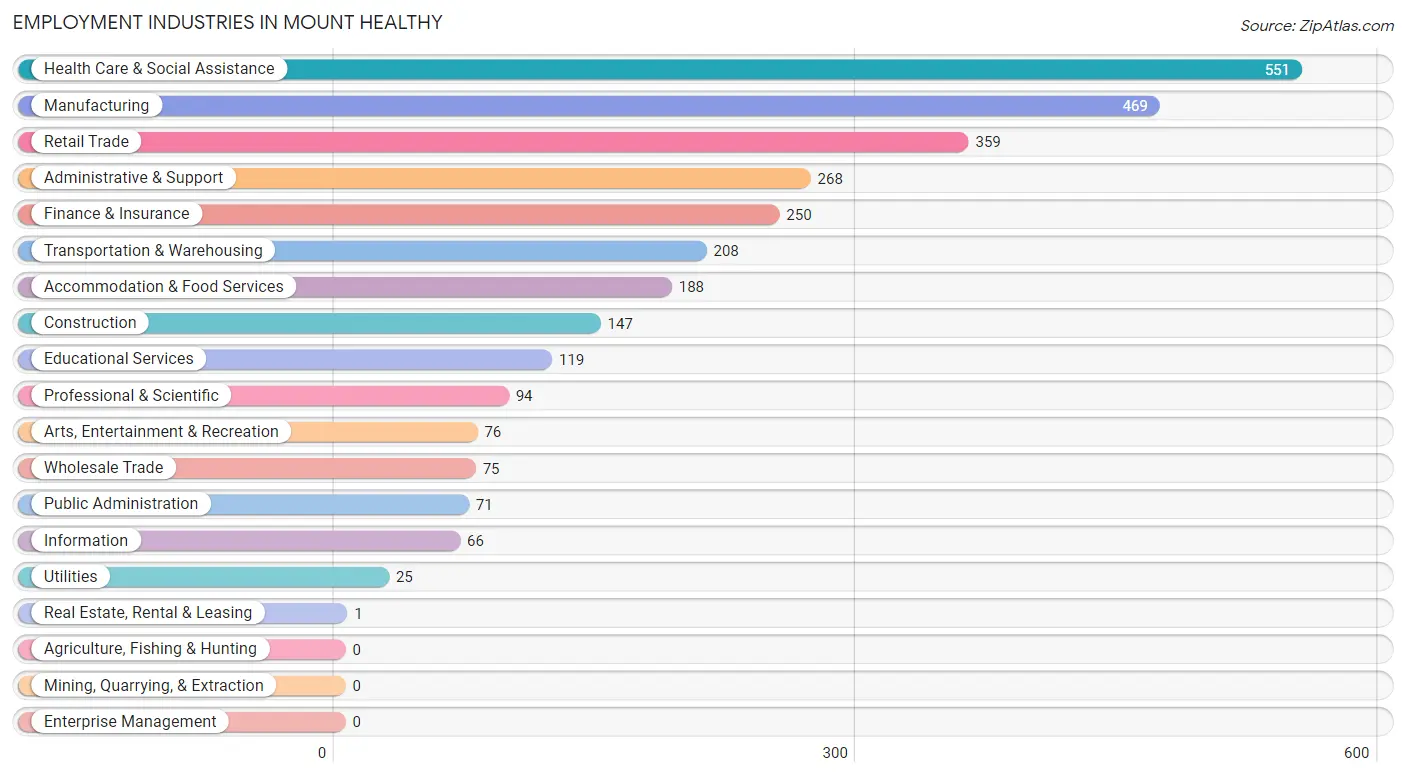
Employment Industries in Mount Healthy
The major employment industries in Mount Healthy include Health Care & Social Assistance (551 | 17.5%), Manufacturing (469 | 14.9%), Retail Trade (359 | 11.4%), Administrative & Support (268 | 8.5%), and Finance & Insurance (250 | 7.9%).
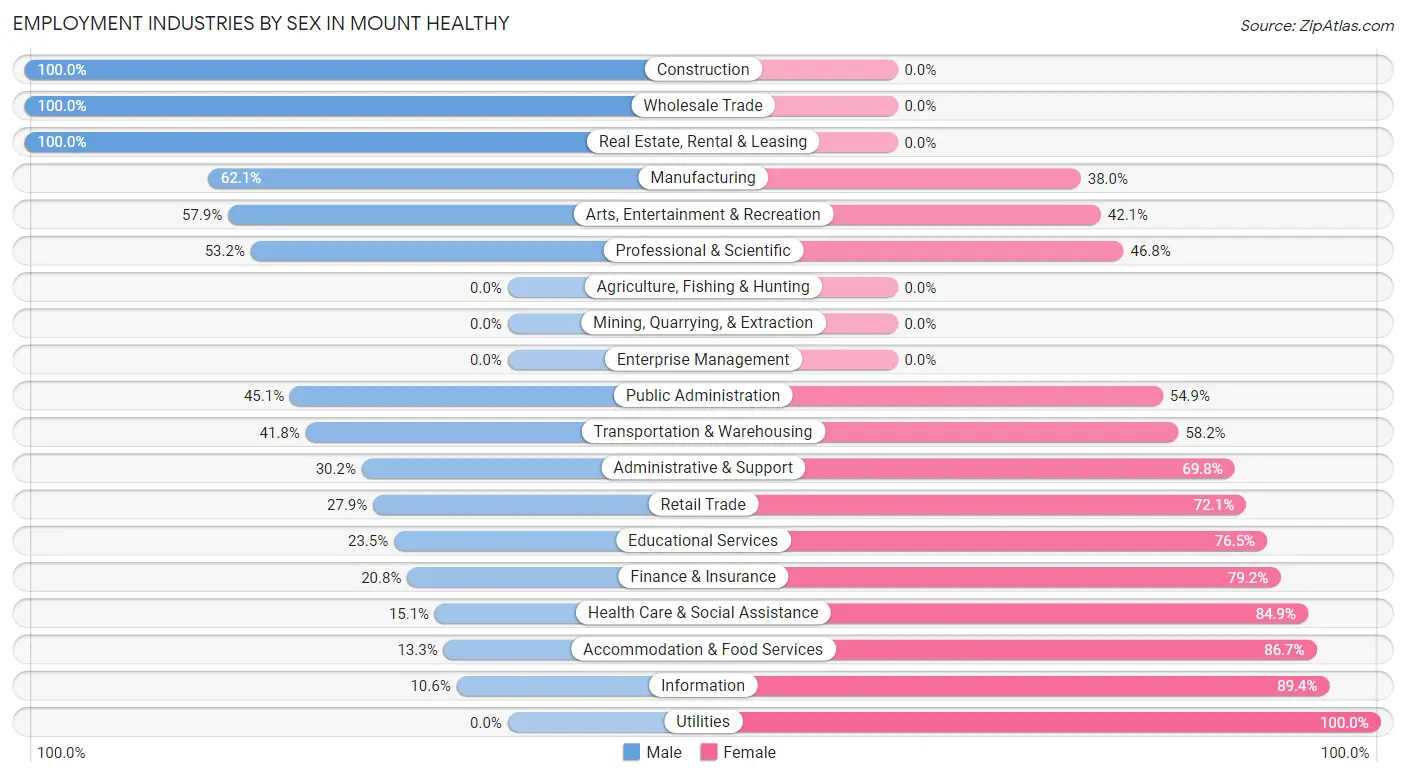
Employment Industries by Sex in Mount Healthy
The Mount Healthy industries that see more men than women are Construction (100.0%), Wholesale Trade (100.0%), and Real Estate, Rental & Leasing (100.0%), whereas the industries that tend to have a higher number of women are Utilities (100.0%), Information (89.4%), and Accommodation & Food Services (86.7%).
| Industry | Male | Female |
| Agriculture, Fishing & Hunting | 0 (0.0%) | 0 (0.0%) |
| Mining, Quarrying, & Extraction | 0 (0.0%) | 0 (0.0%) |
| Construction | 147 (100.0%) | 0 (0.0%) |
| Manufacturing | 291 (62.1%) | 178 (38.0%) |
| Wholesale Trade | 75 (100.0%) | 0 (0.0%) |
| Retail Trade | 100 (27.9%) | 259 (72.1%) |
| Transportation & Warehousing | 87 (41.8%) | 121 (58.2%) |
| Utilities | 0 (0.0%) | 25 (100.0%) |
| Information | 7 (10.6%) | 59 (89.4%) |
| Finance & Insurance | 52 (20.8%) | 198 (79.2%) |
| Real Estate, Rental & Leasing | 1 (100.0%) | 0 (0.0%) |
| Professional & Scientific | 50 (53.2%) | 44 (46.8%) |
| Enterprise Management | 0 (0.0%) | 0 (0.0%) |
| Administrative & Support | 81 (30.2%) | 187 (69.8%) |
| Educational Services | 28 (23.5%) | 91 (76.5%) |
| Health Care & Social Assistance | 83 (15.1%) | 468 (84.9%) |
| Arts, Entertainment & Recreation | 44 (57.9%) | 32 (42.1%) |
| Accommodation & Food Services | 25 (13.3%) | 163 (86.7%) |
| Public Administration | 32 (45.1%) | 39 (54.9%) |
| Total | 1,215 (38.5%) | 1,939 (61.5%) |
Education in Mount Healthy
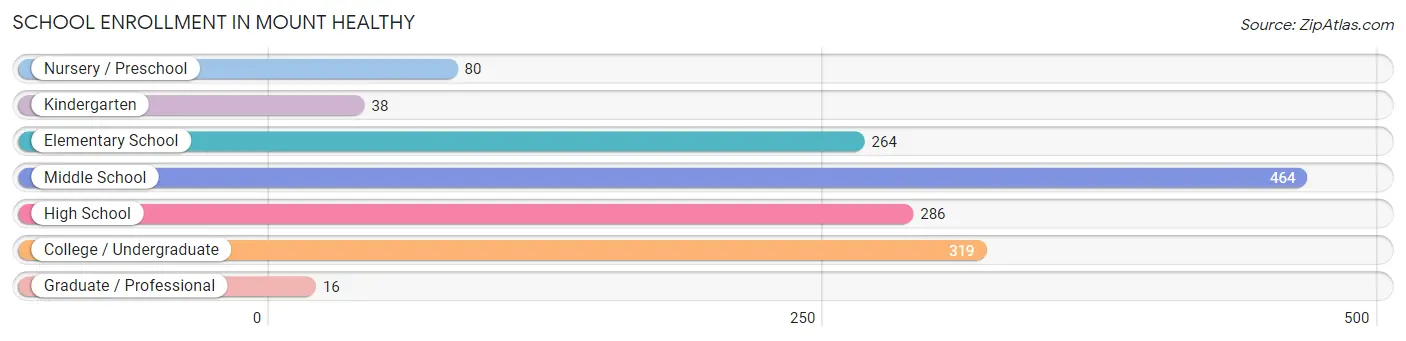
School Enrollment in Mount Healthy
The most common levels of schooling among the 1,467 students in Mount Healthy are middle school (464 | 31.6%), college / undergraduate (319 | 21.7%), and high school (286 | 19.5%).
| School Level | # Students | % Students |
| Nursery / Preschool | 80 | 5.4% |
| Kindergarten | 38 | 2.6% |
| Elementary School | 264 | 18.0% |
| Middle School | 464 | 31.6% |
| High School | 286 | 19.5% |
| College / Undergraduate | 319 | 21.7% |
| Graduate / Professional | 16 | 1.1% |
| Total | 1,467 | 100.0% |
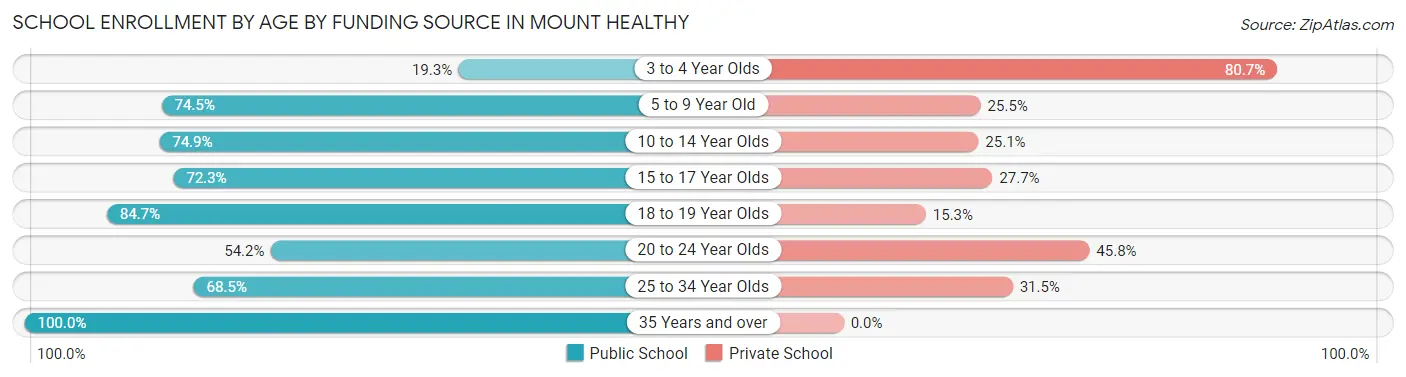
School Enrollment by Age by Funding Source in Mount Healthy
Out of a total of 1,467 students who are enrolled in schools in Mount Healthy, 422 (28.8%) attend a private institution, while the remaining 1,045 (71.2%) are enrolled in public schools. The age group of 3 to 4 year olds has the highest likelihood of being enrolled in private schools, with 67 (80.7% in the age bracket) enrolled. Conversely, the age group of 35 years and over has the lowest likelihood of being enrolled in a private school, with 85 (100.0% in the age bracket) attending a public institution.
| Age Bracket | Public School | Private School |
| 3 to 4 Year Olds | 16 (19.3%) | 67 (80.7%) |
| 5 to 9 Year Old | 213 (74.5%) | 73 (25.5%) |
| 10 to 14 Year Olds | 379 (74.9%) | 127 (25.1%) |
| 15 to 17 Year Olds | 154 (72.3%) | 59 (27.7%) |
| 18 to 19 Year Olds | 83 (84.7%) | 15 (15.3%) |
| 20 to 24 Year Olds | 77 (54.2%) | 65 (45.8%) |
| 25 to 34 Year Olds | 37 (68.5%) | 17 (31.5%) |
| 35 Years and over | 85 (100.0%) | 0 (0.0%) |
| Total | 1,045 (71.2%) | 422 (28.8%) |
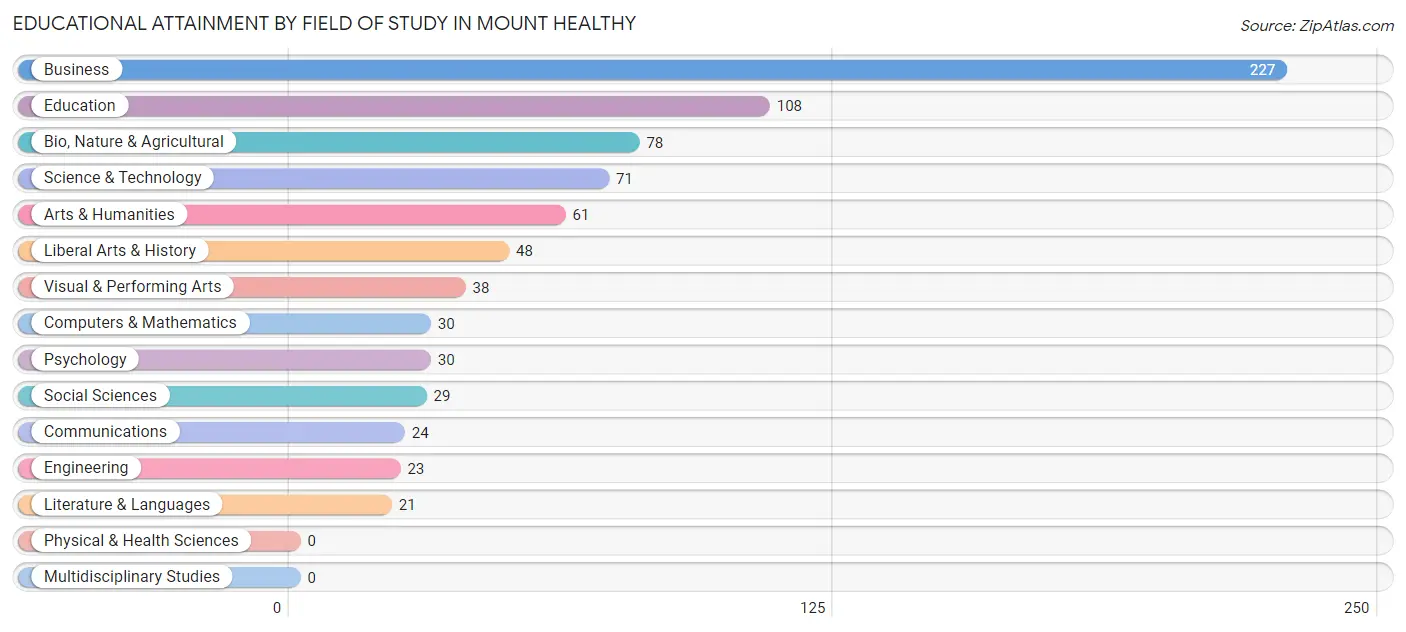
Educational Attainment by Field of Study in Mount Healthy
Business (227 | 28.8%), education (108 | 13.7%), bio, nature & agricultural (78 | 9.9%), science & technology (71 | 9.0%), and arts & humanities (61 | 7.7%) are the most common fields of study among 788 individuals in Mount Healthy who have obtained a bachelor's degree or higher.
| Field of Study | # Graduates | % Graduates |
| Computers & Mathematics | 30 | 3.8% |
| Bio, Nature & Agricultural | 78 | 9.9% |
| Physical & Health Sciences | 0 | 0.0% |
| Psychology | 30 | 3.8% |
| Social Sciences | 29 | 3.7% |
| Engineering | 23 | 2.9% |
| Multidisciplinary Studies | 0 | 0.0% |
| Science & Technology | 71 | 9.0% |
| Business | 227 | 28.8% |
| Education | 108 | 13.7% |
| Literature & Languages | 21 | 2.7% |
| Liberal Arts & History | 48 | 6.1% |
| Visual & Performing Arts | 38 | 4.8% |
| Communications | 24 | 3.0% |
| Arts & Humanities | 61 | 7.7% |
| Total | 788 | 100.0% |
Transportation & Commute in Mount Healthy
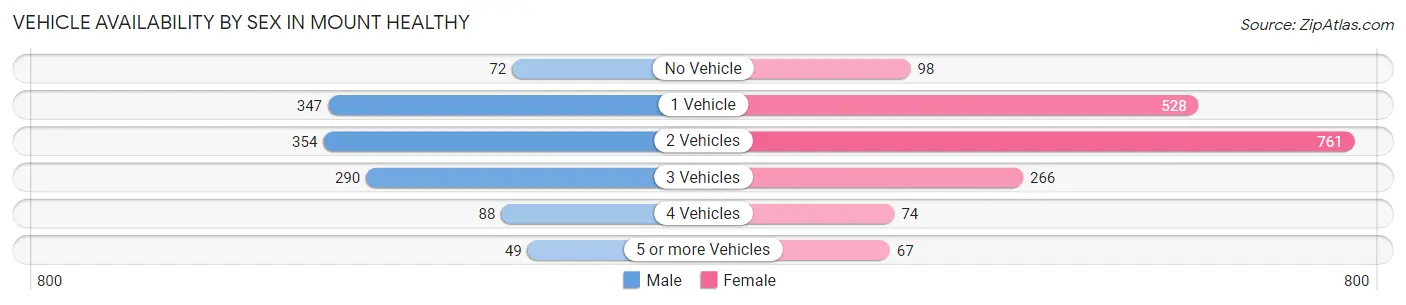
Vehicle Availability by Sex in Mount Healthy
The most prevalent vehicle ownership categories in Mount Healthy are males with 2 vehicles (354, accounting for 29.5%) and females with 2 vehicles (761, making up 19.7%).
| Vehicles Available | Male | Female |
| No Vehicle | 72 (6.0%) | 98 (5.5%) |
| 1 Vehicle | 347 (28.9%) | 528 (29.4%) |
| 2 Vehicles | 354 (29.5%) | 761 (42.4%) |
| 3 Vehicles | 290 (24.2%) | 266 (14.8%) |
| 4 Vehicles | 88 (7.3%) | 74 (4.1%) |
| 5 or more Vehicles | 49 (4.1%) | 67 (3.7%) |
| Total | 1,200 (100.0%) | 1,794 (100.0%) |
Commute Time in Mount Healthy
The most frequently occuring commute durations in Mount Healthy are 20 to 24 minutes (744 commuters, 26.5%), 30 to 34 minutes (702 commuters, 25.0%), and 15 to 19 minutes (258 commuters, 9.2%).
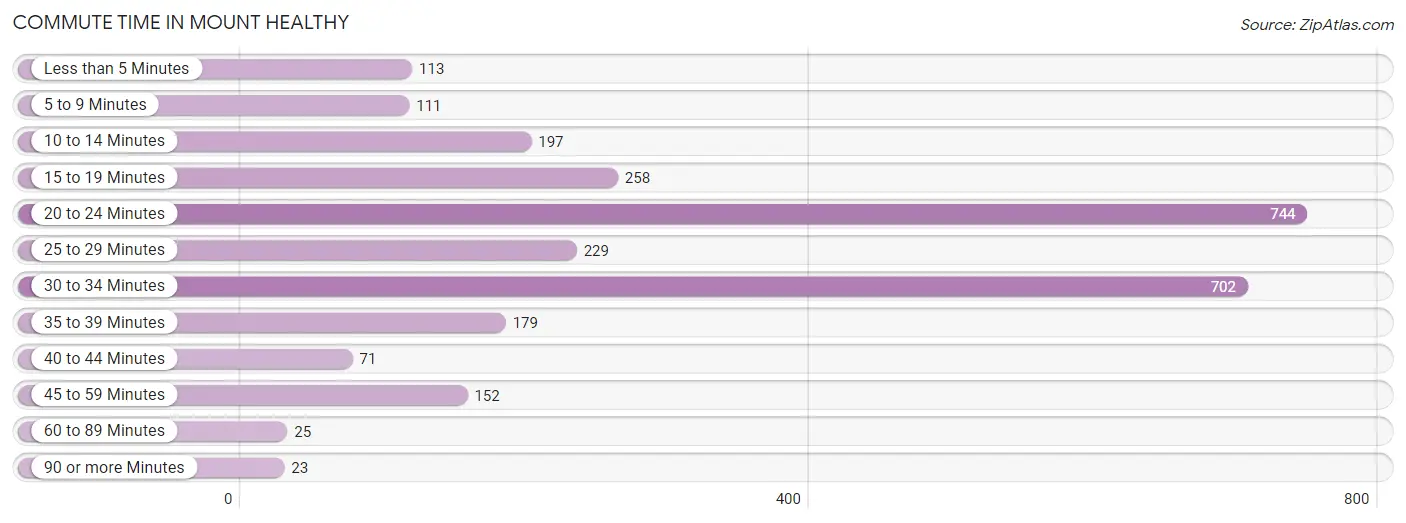
| Commute Time | # Commuters | % Commuters |
| Less than 5 Minutes | 113 | 4.0% |
| 5 to 9 Minutes | 111 | 4.0% |
| 10 to 14 Minutes | 197 | 7.0% |
| 15 to 19 Minutes | 258 | 9.2% |
| 20 to 24 Minutes | 744 | 26.5% |
| 25 to 29 Minutes | 229 | 8.2% |
| 30 to 34 Minutes | 702 | 25.0% |
| 35 to 39 Minutes | 179 | 6.4% |
| 40 to 44 Minutes | 71 | 2.5% |
| 45 to 59 Minutes | 152 | 5.4% |
| 60 to 89 Minutes | 25 | 0.9% |
| 90 or more Minutes | 23 | 0.8% |
Commute Time by Sex in Mount Healthy
The most common commute times in Mount Healthy are 30 to 34 minutes (370 commuters, 32.0%) for males and 20 to 24 minutes (424 commuters, 25.7%) for females.
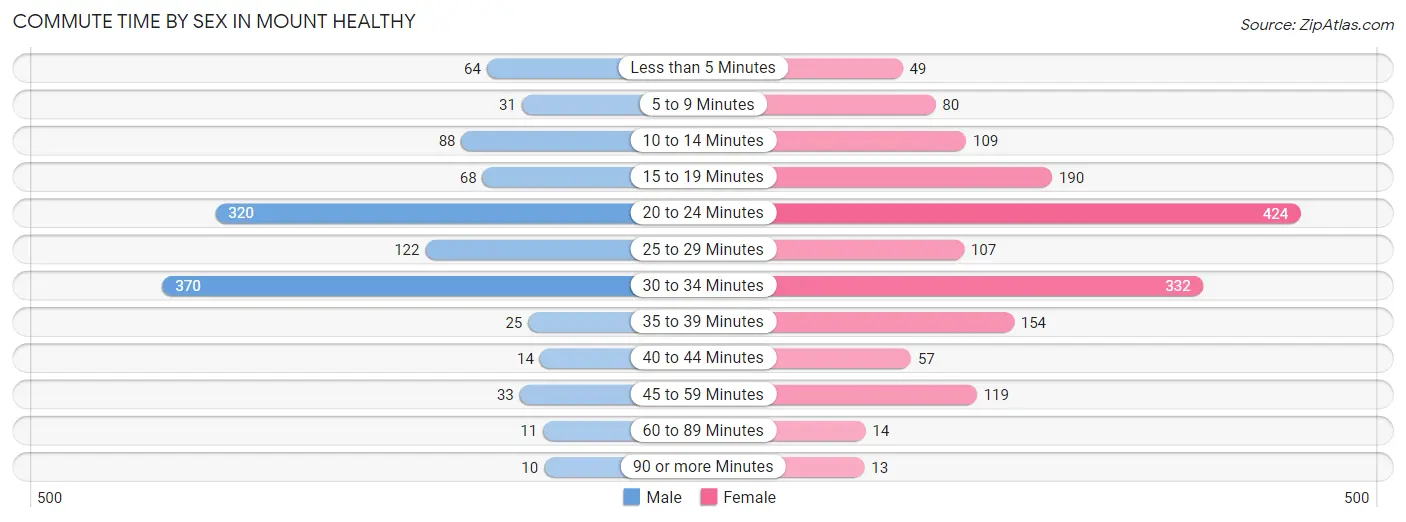
| Commute Time | Male | Female |
| Less than 5 Minutes | 64 (5.5%) | 49 (3.0%) |
| 5 to 9 Minutes | 31 (2.7%) | 80 (4.9%) |
| 10 to 14 Minutes | 88 (7.6%) | 109 (6.6%) |
| 15 to 19 Minutes | 68 (5.9%) | 190 (11.5%) |
| 20 to 24 Minutes | 320 (27.7%) | 424 (25.7%) |
| 25 to 29 Minutes | 122 (10.5%) | 107 (6.5%) |
| 30 to 34 Minutes | 370 (32.0%) | 332 (20.2%) |
| 35 to 39 Minutes | 25 (2.2%) | 154 (9.3%) |
| 40 to 44 Minutes | 14 (1.2%) | 57 (3.5%) |
| 45 to 59 Minutes | 33 (2.9%) | 119 (7.2%) |
| 60 to 89 Minutes | 11 (0.9%) | 14 (0.9%) |
| 90 or more Minutes | 10 (0.9%) | 13 (0.8%) |
Time of Departure to Work by Sex in Mount Healthy
The most frequent times of departure to work in Mount Healthy are 12:00 PM to 3:59 PM (170, 14.7%) for males and 7:00 AM to 7:29 AM (456, 27.7%) for females.
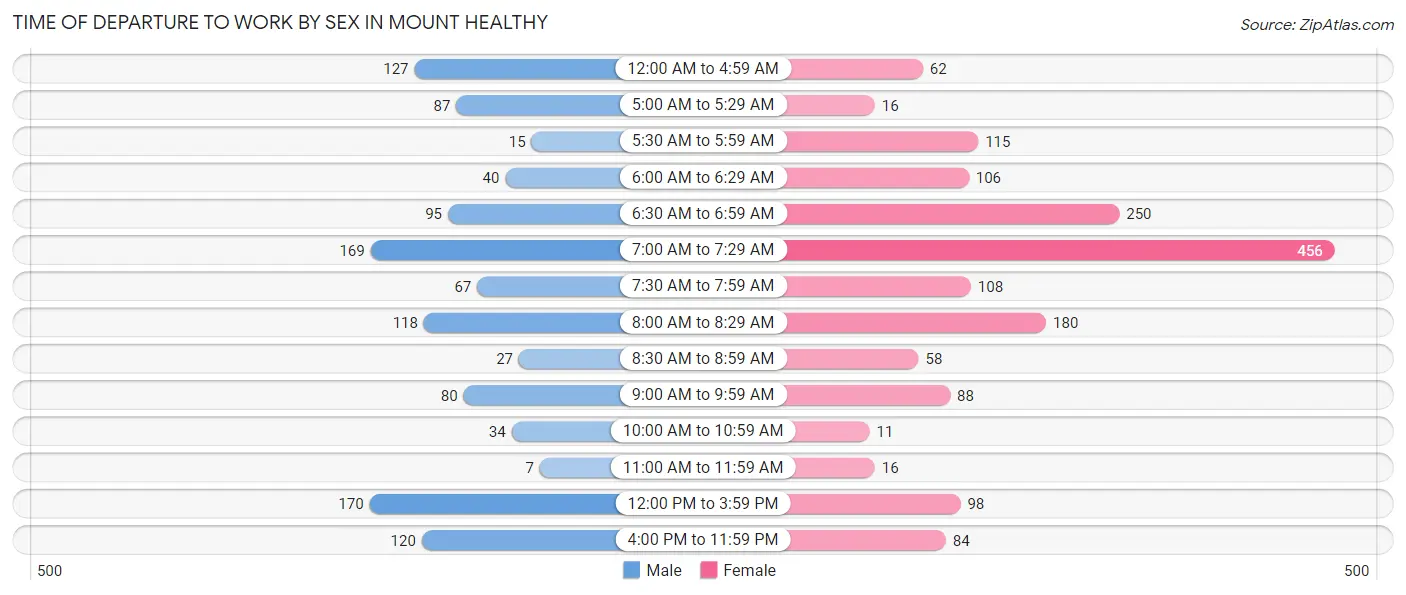
| Time of Departure | Male | Female |
| 12:00 AM to 4:59 AM | 127 (11.0%) | 62 (3.8%) |
| 5:00 AM to 5:29 AM | 87 (7.5%) | 16 (1.0%) |
| 5:30 AM to 5:59 AM | 15 (1.3%) | 115 (7.0%) |
| 6:00 AM to 6:29 AM | 40 (3.5%) | 106 (6.4%) |
| 6:30 AM to 6:59 AM | 95 (8.2%) | 250 (15.2%) |
| 7:00 AM to 7:29 AM | 169 (14.6%) | 456 (27.7%) |
| 7:30 AM to 7:59 AM | 67 (5.8%) | 108 (6.6%) |
| 8:00 AM to 8:29 AM | 118 (10.2%) | 180 (10.9%) |
| 8:30 AM to 8:59 AM | 27 (2.3%) | 58 (3.5%) |
| 9:00 AM to 9:59 AM | 80 (6.9%) | 88 (5.3%) |
| 10:00 AM to 10:59 AM | 34 (2.9%) | 11 (0.7%) |
| 11:00 AM to 11:59 AM | 7 (0.6%) | 16 (1.0%) |
| 12:00 PM to 3:59 PM | 170 (14.7%) | 98 (5.9%) |
| 4:00 PM to 11:59 PM | 120 (10.4%) | 84 (5.1%) |
| Total | 1,156 (100.0%) | 1,648 (100.0%) |
Housing Occupancy in Mount Healthy
Occupancy by Ownership in Mount Healthy
Of the total 2,985 dwellings in Mount Healthy, owner-occupied units account for 1,345 (45.1%), while renter-occupied units make up 1,640 (54.9%).
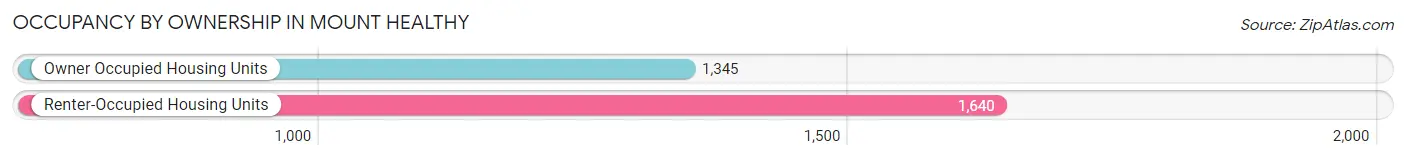
| Occupancy | # Housing Units | % Housing Units |
| Owner Occupied Housing Units | 1,345 | 45.1% |
| Renter-Occupied Housing Units | 1,640 | 54.9% |
| Total Occupied Housing Units | 2,985 | 100.0% |
Occupancy by Household Size in Mount Healthy
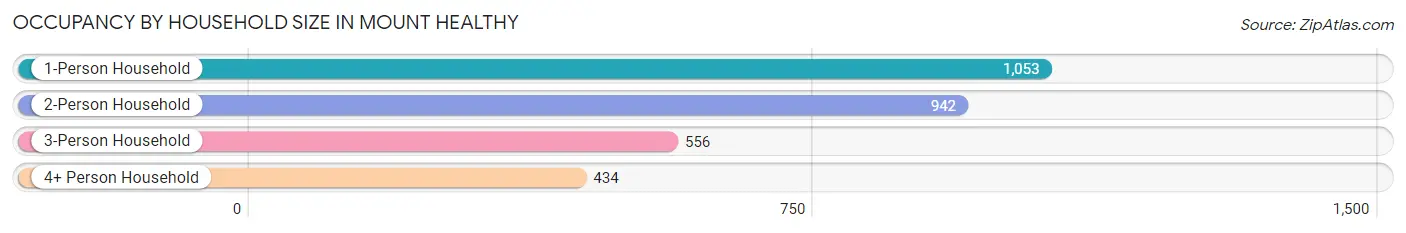
| Household Size | # Housing Units | % Housing Units |
| 1-Person Household | 1,053 | 35.3% |
| 2-Person Household | 942 | 31.6% |
| 3-Person Household | 556 | 18.6% |
| 4+ Person Household | 434 | 14.5% |
| Total Housing Units | 2,985 | 100.0% |
Occupancy by Ownership by Household Size in Mount Healthy
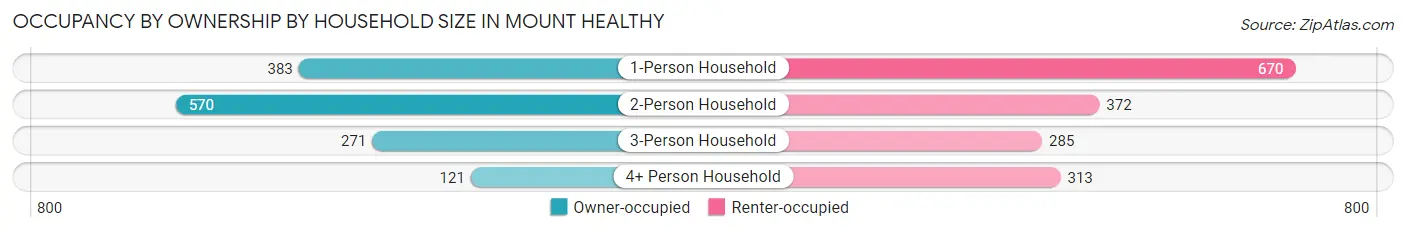
| Household Size | Owner-occupied | Renter-occupied |
| 1-Person Household | 383 (36.4%) | 670 (63.6%) |
| 2-Person Household | 570 (60.5%) | 372 (39.5%) |
| 3-Person Household | 271 (48.7%) | 285 (51.3%) |
| 4+ Person Household | 121 (27.9%) | 313 (72.1%) |
| Total Housing Units | 1,345 (45.1%) | 1,640 (54.9%) |
Occupancy by Educational Attainment in Mount Healthy
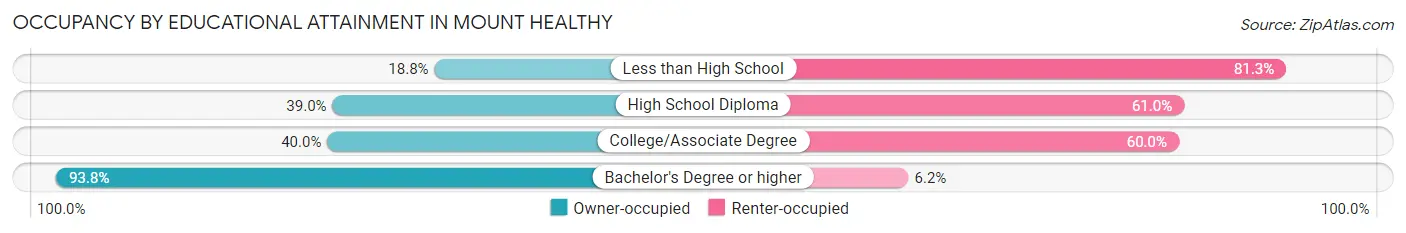
| Household Size | Owner-occupied | Renter-occupied |
| Less than High School | 30 (18.8%) | 130 (81.2%) |
| High School Diploma | 505 (39.0%) | 791 (61.0%) |
| College/Associate Degree | 464 (40.0%) | 696 (60.0%) |
| Bachelor's Degree or higher | 346 (93.8%) | 23 (6.2%) |
Occupancy by Age of Householder in Mount Healthy
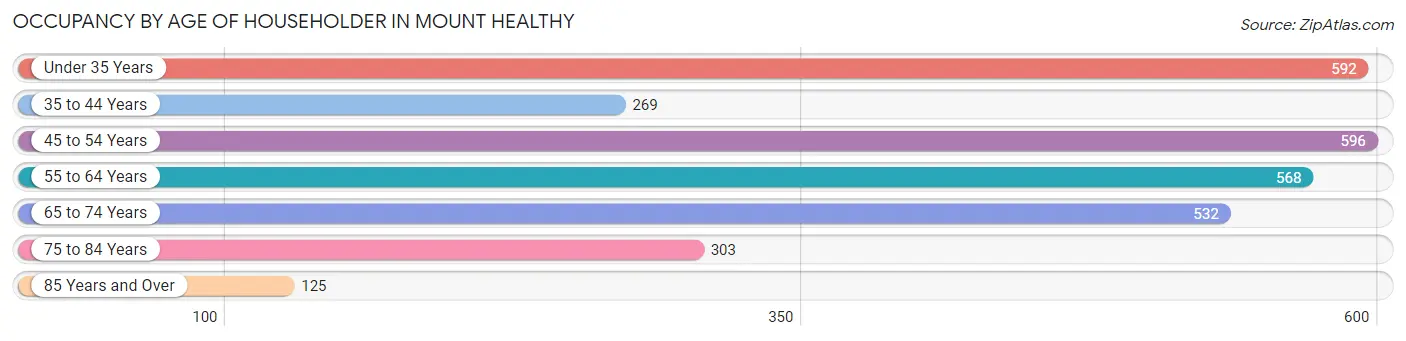
| Age Bracket | # Households | % Households |
| Under 35 Years | 592 | 19.8% |
| 35 to 44 Years | 269 | 9.0% |
| 45 to 54 Years | 596 | 20.0% |
| 55 to 64 Years | 568 | 19.0% |
| 65 to 74 Years | 532 | 17.8% |
| 75 to 84 Years | 303 | 10.2% |
| 85 Years and Over | 125 | 4.2% |
| Total | 2,985 | 100.0% |
Housing Finances in Mount Healthy
Median Income by Occupancy in Mount Healthy
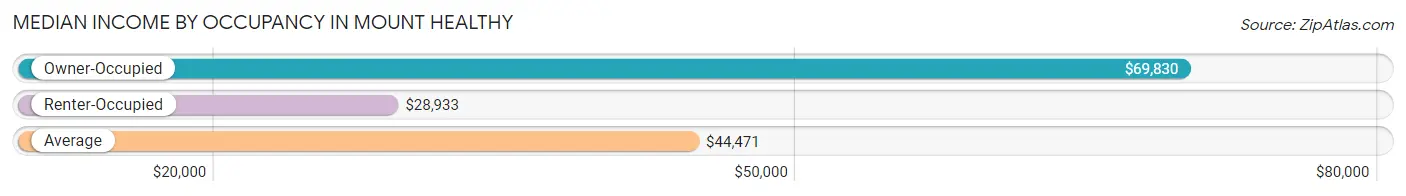
| Occupancy Type | # Households | Median Income |
| Owner-Occupied | 1,345 (45.1%) | $69,830 |
| Renter-Occupied | 1,640 (54.9%) | $28,933 |
| Average | 2,985 (100.0%) | $44,471 |
Occupancy by Householder Income Bracket in Mount Healthy
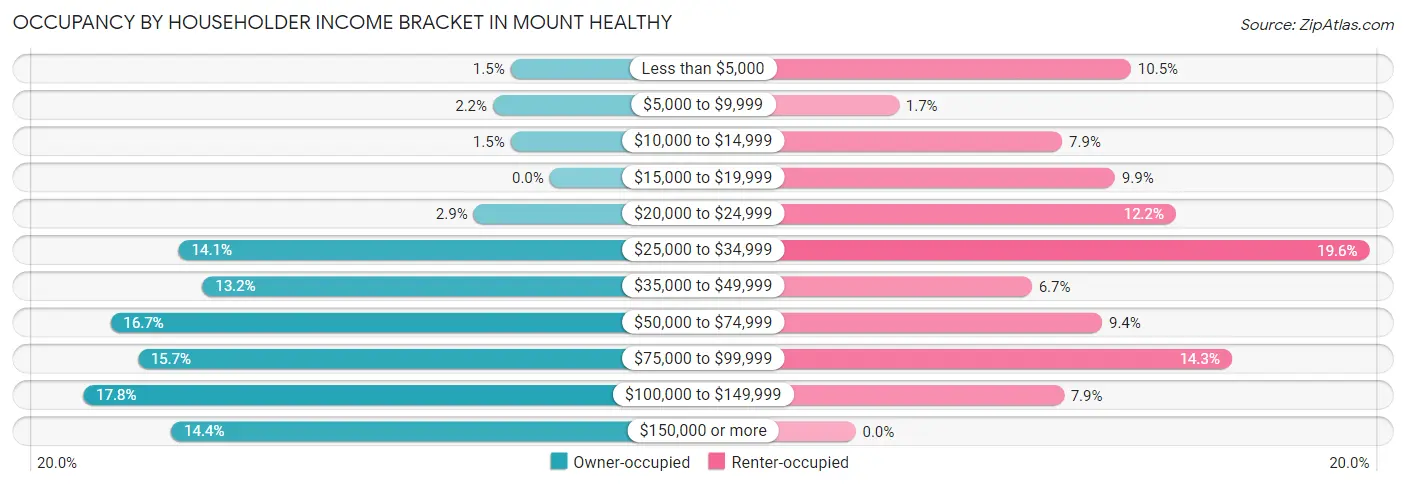
| Income Bracket | Owner-occupied | Renter-occupied |
| Less than $5,000 | 20 (1.5%) | 172 (10.5%) |
| $5,000 to $9,999 | 29 (2.2%) | 27 (1.7%) |
| $10,000 to $14,999 | 20 (1.5%) | 129 (7.9%) |
| $15,000 to $19,999 | 0 (0.0%) | 162 (9.9%) |
| $20,000 to $24,999 | 39 (2.9%) | 200 (12.2%) |
| $25,000 to $34,999 | 190 (14.1%) | 321 (19.6%) |
| $35,000 to $49,999 | 178 (13.2%) | 110 (6.7%) |
| $50,000 to $74,999 | 225 (16.7%) | 154 (9.4%) |
| $75,000 to $99,999 | 211 (15.7%) | 235 (14.3%) |
| $100,000 to $149,999 | 239 (17.8%) | 130 (7.9%) |
| $150,000 or more | 194 (14.4%) | 0 (0.0%) |
| Total | 1,345 (100.0%) | 1,640 (100.0%) |
Monthly Housing Cost Tiers in Mount Healthy
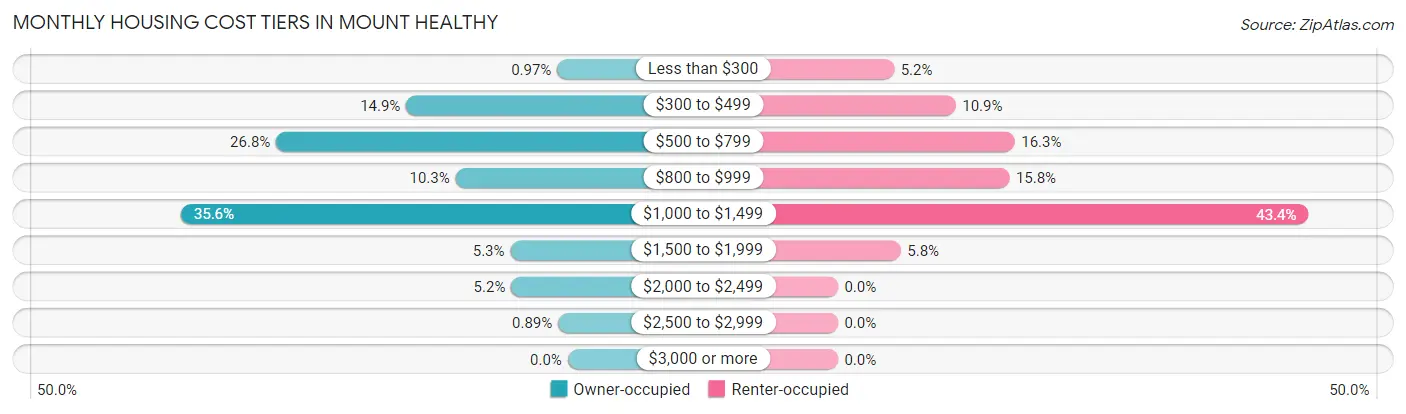
| Monthly Cost | Owner-occupied | Renter-occupied |
| Less than $300 | 13 (1.0%) | 85 (5.2%) |
| $300 to $499 | 200 (14.9%) | 178 (10.8%) |
| $500 to $799 | 361 (26.8%) | 267 (16.3%) |
| $800 to $999 | 139 (10.3%) | 259 (15.8%) |
| $1,000 to $1,499 | 479 (35.6%) | 711 (43.3%) |
| $1,500 to $1,999 | 71 (5.3%) | 95 (5.8%) |
| $2,000 to $2,499 | 70 (5.2%) | 0 (0.0%) |
| $2,500 to $2,999 | 12 (0.9%) | 0 (0.0%) |
| $3,000 or more | 0 (0.0%) | 0 (0.0%) |
| Total | 1,345 (100.0%) | 1,640 (100.0%) |
Physical Housing Characteristics in Mount Healthy
Housing Structures in Mount Healthy
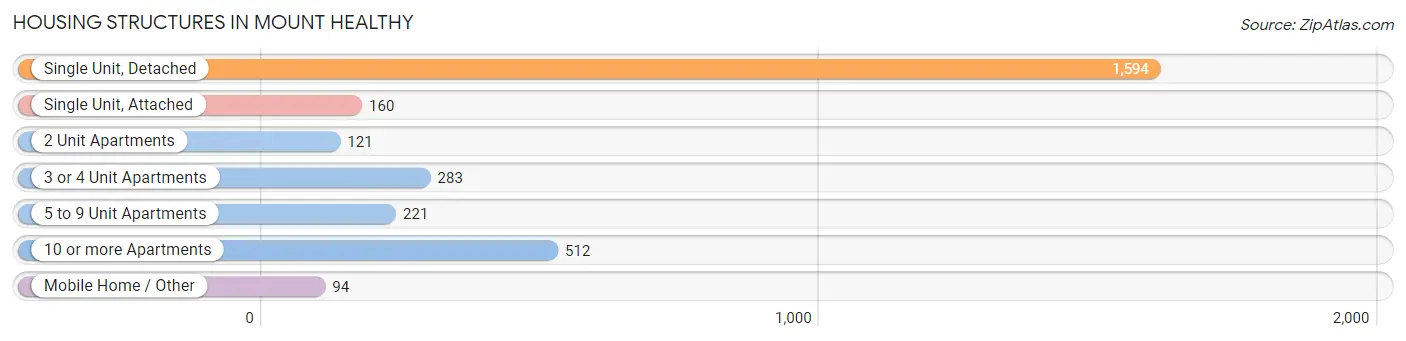
| Structure Type | # Housing Units | % Housing Units |
| Single Unit, Detached | 1,594 | 53.4% |
| Single Unit, Attached | 160 | 5.4% |
| 2 Unit Apartments | 121 | 4.1% |
| 3 or 4 Unit Apartments | 283 | 9.5% |
| 5 to 9 Unit Apartments | 221 | 7.4% |
| 10 or more Apartments | 512 | 17.2% |
| Mobile Home / Other | 94 | 3.2% |
| Total | 2,985 | 100.0% |
Housing Structures by Occupancy in Mount Healthy
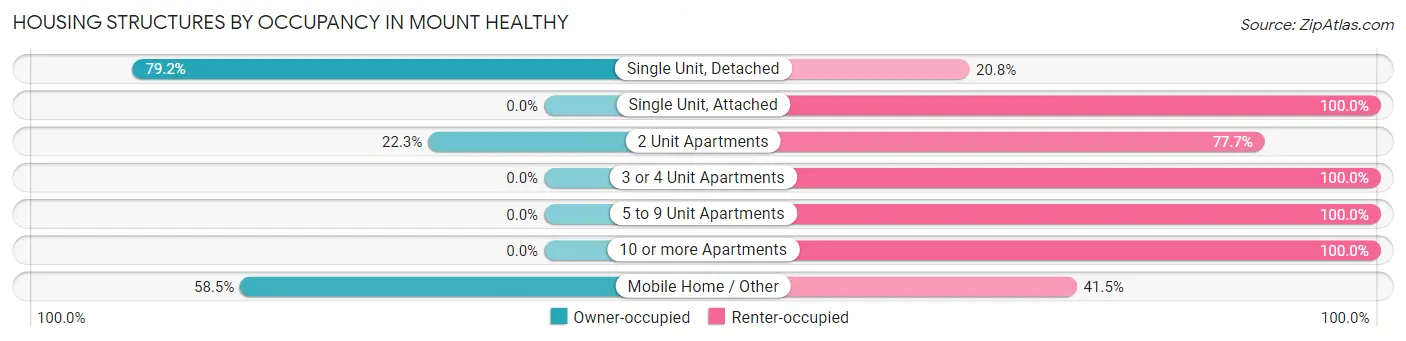
| Structure Type | Owner-occupied | Renter-occupied |
| Single Unit, Detached | 1,263 (79.2%) | 331 (20.8%) |
| Single Unit, Attached | 0 (0.0%) | 160 (100.0%) |
| 2 Unit Apartments | 27 (22.3%) | 94 (77.7%) |
| 3 or 4 Unit Apartments | 0 (0.0%) | 283 (100.0%) |
| 5 to 9 Unit Apartments | 0 (0.0%) | 221 (100.0%) |
| 10 or more Apartments | 0 (0.0%) | 512 (100.0%) |
| Mobile Home / Other | 55 (58.5%) | 39 (41.5%) |
| Total | 1,345 (45.1%) | 1,640 (54.9%) |
Housing Structures by Number of Rooms in Mount Healthy
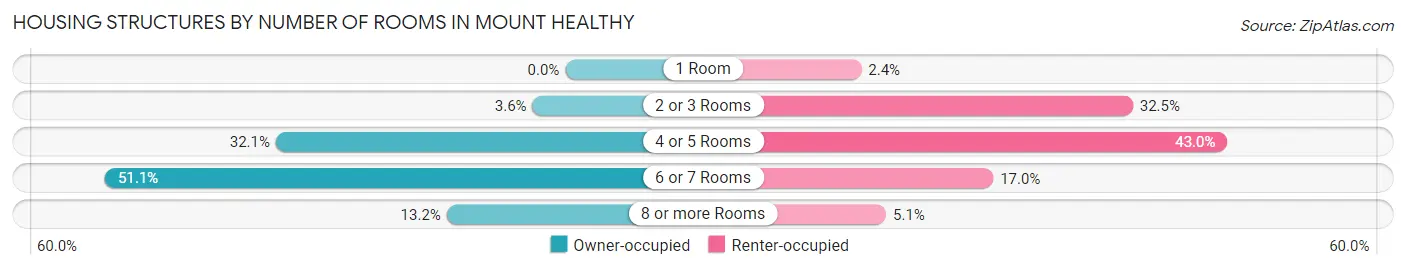
| Number of Rooms | Owner-occupied | Renter-occupied |
| 1 Room | 0 (0.0%) | 39 (2.4%) |
| 2 or 3 Rooms | 49 (3.6%) | 533 (32.5%) |
| 4 or 5 Rooms | 432 (32.1%) | 705 (43.0%) |
| 6 or 7 Rooms | 687 (51.1%) | 279 (17.0%) |
| 8 or more Rooms | 177 (13.2%) | 84 (5.1%) |
| Total | 1,345 (100.0%) | 1,640 (100.0%) |
Housing Structure by Heating Type in Mount Healthy
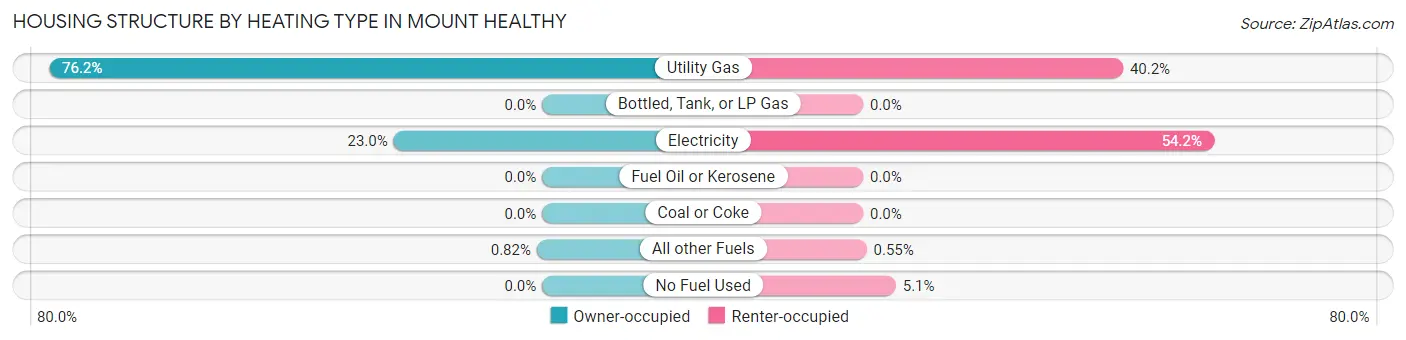
| Heating Type | Owner-occupied | Renter-occupied |
| Utility Gas | 1,025 (76.2%) | 659 (40.2%) |
| Bottled, Tank, or LP Gas | 0 (0.0%) | 0 (0.0%) |
| Electricity | 309 (23.0%) | 889 (54.2%) |
| Fuel Oil or Kerosene | 0 (0.0%) | 0 (0.0%) |
| Coal or Coke | 0 (0.0%) | 0 (0.0%) |
| All other Fuels | 11 (0.8%) | 9 (0.5%) |
| No Fuel Used | 0 (0.0%) | 83 (5.1%) |
| Total | 1,345 (100.0%) | 1,640 (100.0%) |
Household Vehicle Usage in Mount Healthy
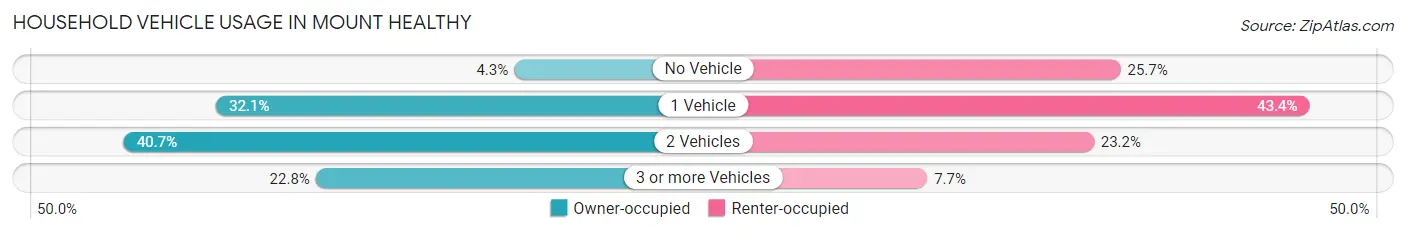
| Vehicles per Household | Owner-occupied | Renter-occupied |
| No Vehicle | 58 (4.3%) | 422 (25.7%) |
| 1 Vehicle | 432 (32.1%) | 711 (43.3%) |
| 2 Vehicles | 548 (40.7%) | 381 (23.2%) |
| 3 or more Vehicles | 307 (22.8%) | 126 (7.7%) |
| Total | 1,345 (100.0%) | 1,640 (100.0%) |
Real Estate & Mortgages in Mount Healthy
Real Estate and Mortgage Overview in Mount Healthy
| Characteristic | Without Mortgage | With Mortgage |
| Housing Units | 542 | 803 |
| Median Property Value | $96,300 | $125,900 |
| Median Household Income | $66,990 | $111 |
| Monthly Housing Costs | $557 | $0 |
| Real Estate Taxes | $2,120 | $30 |
Property Value by Mortgage Status in Mount Healthy
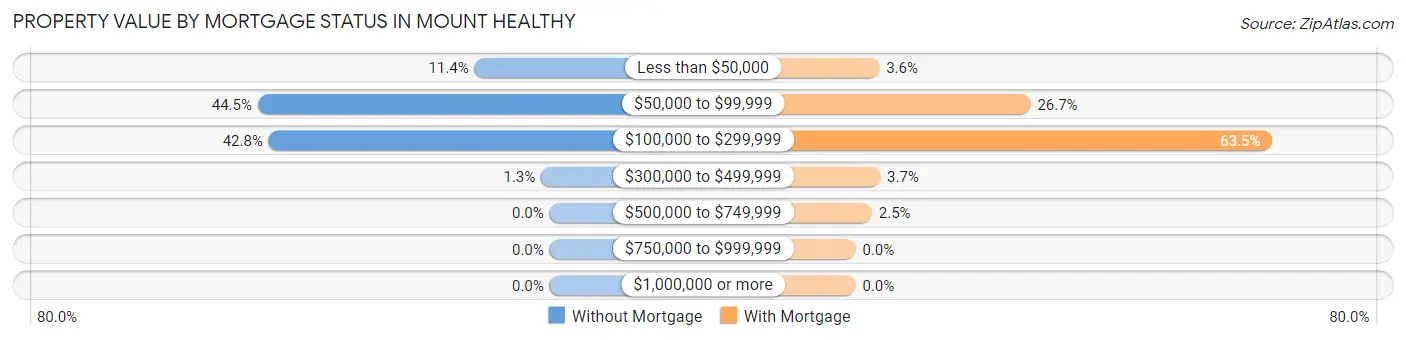
| Property Value | Without Mortgage | With Mortgage |
| Less than $50,000 | 62 (11.4%) | 29 (3.6%) |
| $50,000 to $99,999 | 241 (44.5%) | 214 (26.7%) |
| $100,000 to $299,999 | 232 (42.8%) | 510 (63.5%) |
| $300,000 to $499,999 | 7 (1.3%) | 30 (3.7%) |
| $500,000 to $749,999 | 0 (0.0%) | 20 (2.5%) |
| $750,000 to $999,999 | 0 (0.0%) | 0 (0.0%) |
| $1,000,000 or more | 0 (0.0%) | 0 (0.0%) |
| Total | 542 (100.0%) | 803 (100.0%) |
Household Income by Mortgage Status in Mount Healthy
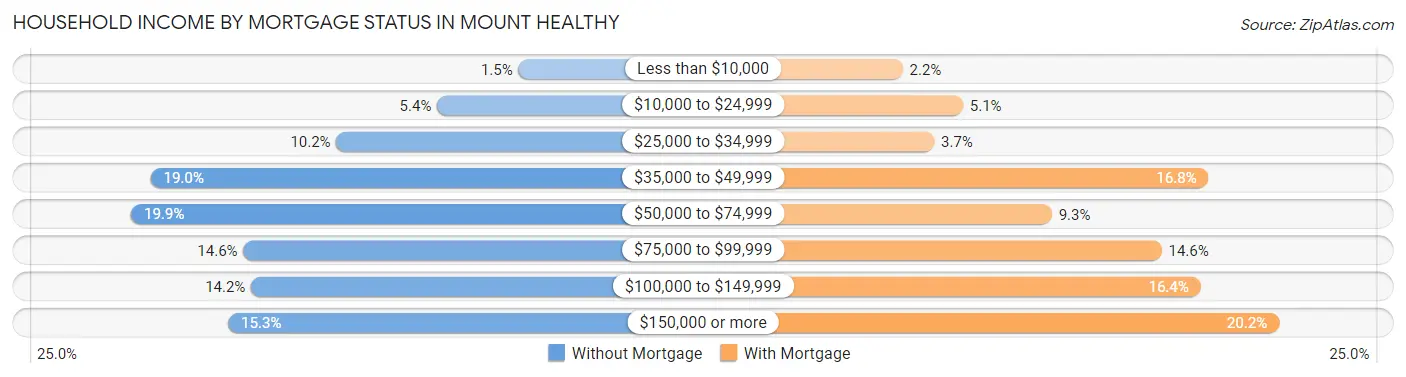
| Household Income | Without Mortgage | With Mortgage |
| Less than $10,000 | 8 (1.5%) | 18 (2.2%) |
| $10,000 to $24,999 | 29 (5.3%) | 41 (5.1%) |
| $25,000 to $34,999 | 55 (10.2%) | 30 (3.7%) |
| $35,000 to $49,999 | 103 (19.0%) | 135 (16.8%) |
| $50,000 to $74,999 | 108 (19.9%) | 75 (9.3%) |
| $75,000 to $99,999 | 79 (14.6%) | 117 (14.6%) |
| $100,000 to $149,999 | 77 (14.2%) | 132 (16.4%) |
| $150,000 or more | 83 (15.3%) | 162 (20.2%) |
| Total | 542 (100.0%) | 803 (100.0%) |
Property Value to Household Income Ratio in Mount Healthy
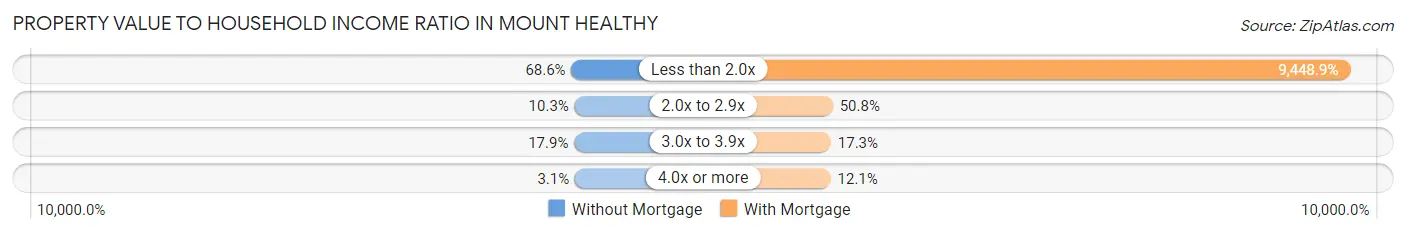
| Value-to-Income Ratio | Without Mortgage | With Mortgage |
| Less than 2.0x | 372 (68.6%) | 75,875 (9,448.9%) |
| 2.0x to 2.9x | 56 (10.3%) | 408 (50.8%) |
| 3.0x to 3.9x | 97 (17.9%) | 139 (17.3%) |
| 4.0x or more | 17 (3.1%) | 97 (12.1%) |
| Total | 542 (100.0%) | 803 (100.0%) |
Real Estate Taxes by Mortgage Status in Mount Healthy
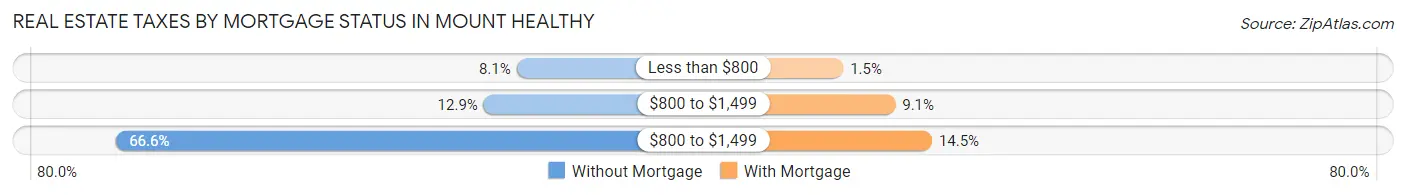
| Property Taxes | Without Mortgage | With Mortgage |
| Less than $800 | 44 (8.1%) | 12 (1.5%) |
| $800 to $1,499 | 70 (12.9%) | 73 (9.1%) |
| $800 to $1,499 | 361 (66.6%) | 116 (14.4%) |
| Total | 542 (100.0%) | 803 (100.0%) |
Health & Disability in Mount Healthy
Health Insurance Coverage by Age in Mount Healthy
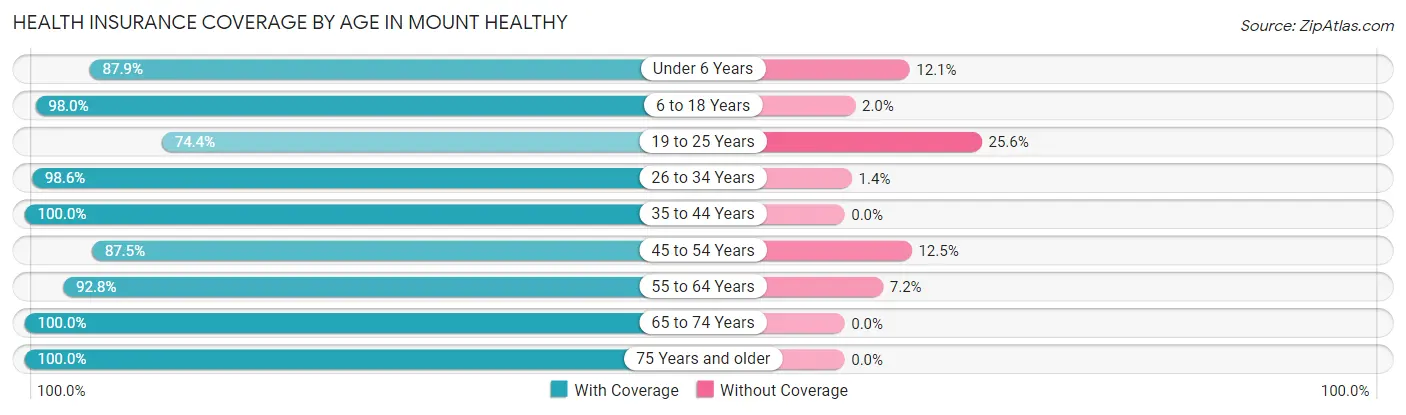
| Age Bracket | With Coverage | Without Coverage |
| Under 6 Years | 413 (87.9%) | 57 (12.1%) |
| 6 to 18 Years | 1,077 (98.0%) | 22 (2.0%) |
| 19 to 25 Years | 567 (74.4%) | 195 (25.6%) |
| 26 to 34 Years | 861 (98.6%) | 12 (1.4%) |
| 35 to 44 Years | 506 (100.0%) | 0 (0.0%) |
| 45 to 54 Years | 803 (87.5%) | 115 (12.5%) |
| 55 to 64 Years | 813 (92.8%) | 63 (7.2%) |
| 65 to 74 Years | 751 (100.0%) | 0 (0.0%) |
| 75 Years and older | 488 (100.0%) | 0 (0.0%) |
| Total | 6,279 (93.1%) | 464 (6.9%) |
Health Insurance Coverage by Citizenship Status in Mount Healthy
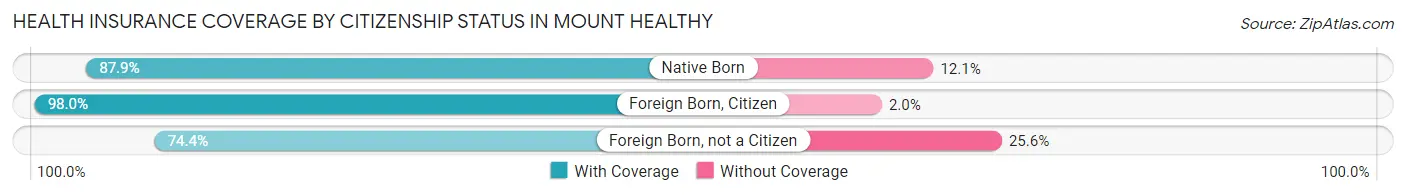
| Citizenship Status | With Coverage | Without Coverage |
| Native Born | 413 (87.9%) | 57 (12.1%) |
| Foreign Born, Citizen | 1,077 (98.0%) | 22 (2.0%) |
| Foreign Born, not a Citizen | 567 (74.4%) | 195 (25.6%) |
Health Insurance Coverage by Household Income in Mount Healthy
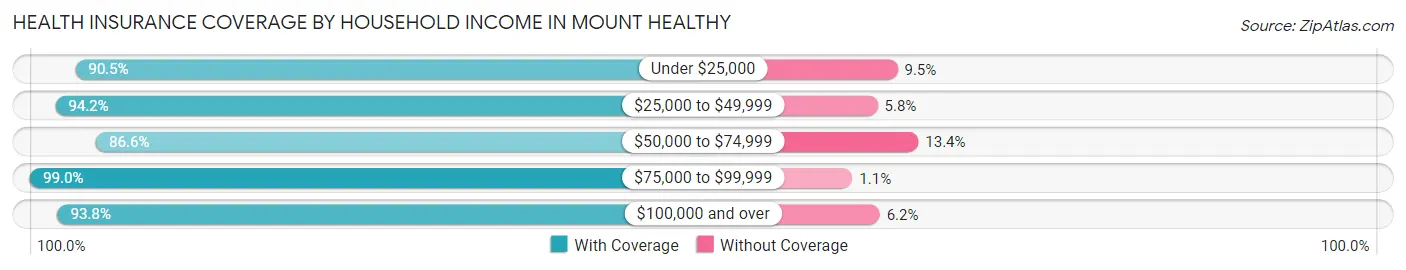
| Household Income | With Coverage | Without Coverage |
| Under $25,000 | 1,286 (90.5%) | 135 (9.5%) |
| $25,000 to $49,999 | 1,372 (94.2%) | 84 (5.8%) |
| $50,000 to $74,999 | 781 (86.6%) | 121 (13.4%) |
| $75,000 to $99,999 | 1,129 (99.0%) | 12 (1.1%) |
| $100,000 and over | 1,689 (93.8%) | 111 (6.2%) |
Public vs Private Health Insurance Coverage by Age in Mount Healthy
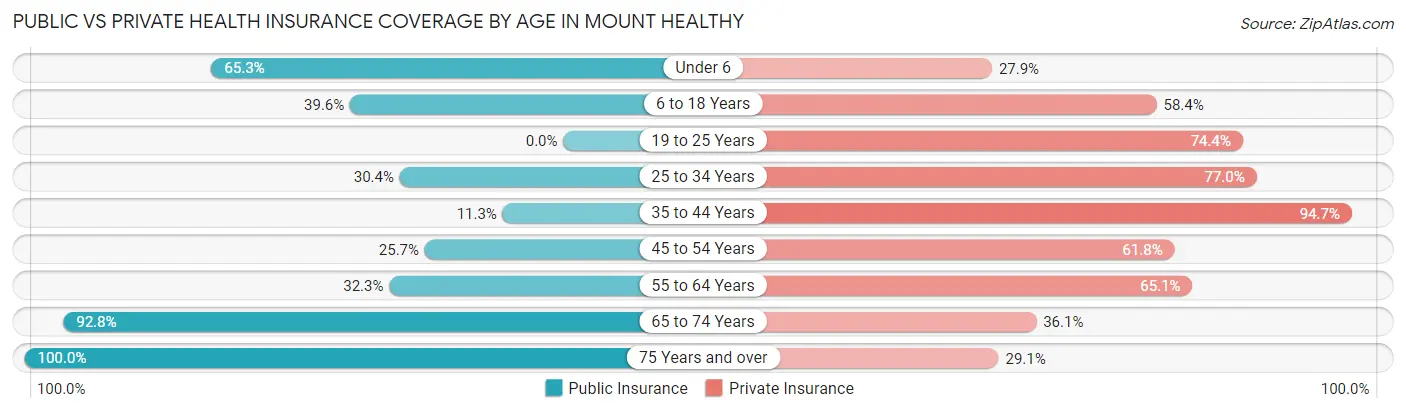
| Age Bracket | Public Insurance | Private Insurance |
| Under 6 | 307 (65.3%) | 131 (27.9%) |
| 6 to 18 Years | 435 (39.6%) | 642 (58.4%) |
| 19 to 25 Years | 0 (0.0%) | 567 (74.4%) |
| 25 to 34 Years | 265 (30.4%) | 672 (77.0%) |
| 35 to 44 Years | 57 (11.3%) | 479 (94.7%) |
| 45 to 54 Years | 236 (25.7%) | 567 (61.8%) |
| 55 to 64 Years | 283 (32.3%) | 570 (65.1%) |
| 65 to 74 Years | 697 (92.8%) | 271 (36.1%) |
| 75 Years and over | 488 (100.0%) | 142 (29.1%) |
| Total | 2,768 (41.0%) | 4,041 (59.9%) |
Disability Status by Sex by Age in Mount Healthy
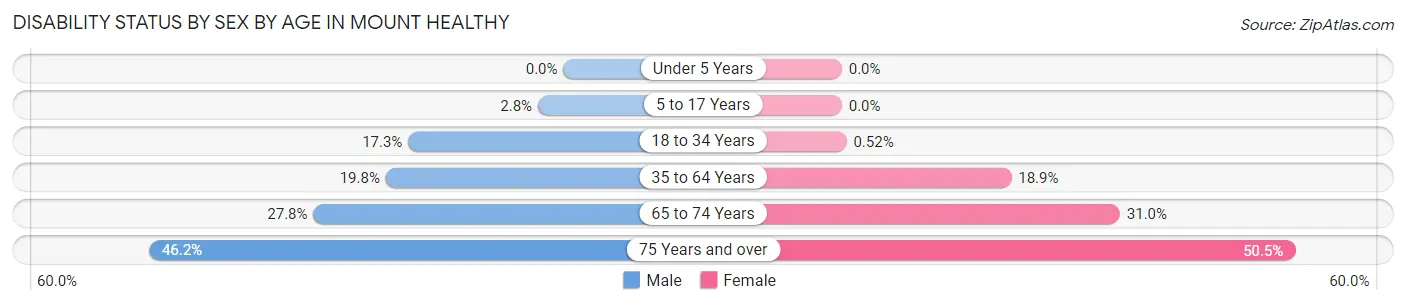
| Age Bracket | Male | Female |
| Under 5 Years | 0 (0.0%) | 0 (0.0%) |
| 5 to 17 Years | 21 (2.8%) | 0 (0.0%) |
| 18 to 34 Years | 126 (17.3%) | 5 (0.5%) |
| 35 to 64 Years | 214 (19.8%) | 230 (18.9%) |
| 65 to 74 Years | 103 (27.8%) | 118 (31.0%) |
| 75 Years and over | 36 (46.2%) | 207 (50.5%) |
Disability Class by Sex by Age in Mount Healthy
Disability Class: Hearing Difficulty
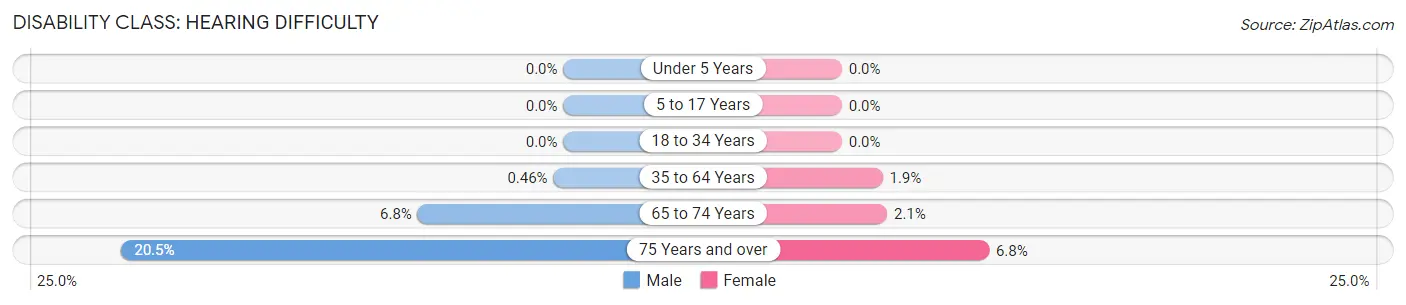
| Age Bracket | Male | Female |
| Under 5 Years | 0 (0.0%) | 0 (0.0%) |
| 5 to 17 Years | 0 (0.0%) | 0 (0.0%) |
| 18 to 34 Years | 0 (0.0%) | 0 (0.0%) |
| 35 to 64 Years | 5 (0.5%) | 23 (1.9%) |
| 65 to 74 Years | 25 (6.8%) | 8 (2.1%) |
| 75 Years and over | 16 (20.5%) | 28 (6.8%) |
Disability Class: Vision Difficulty
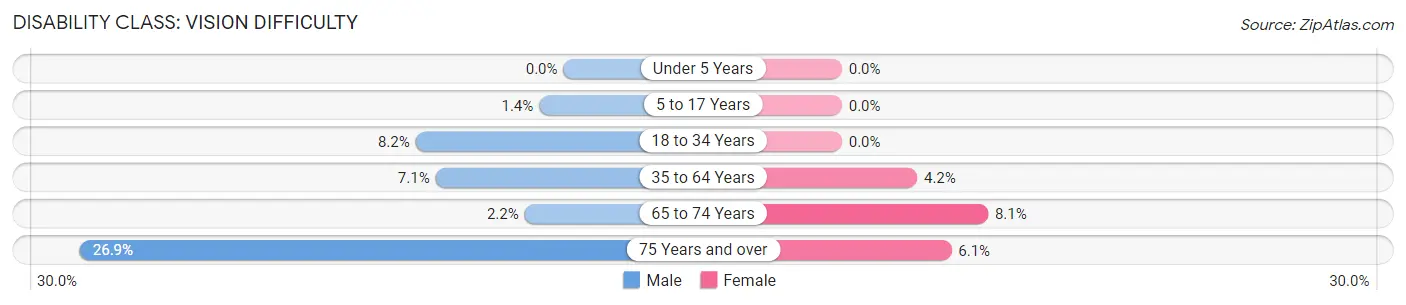
| Age Bracket | Male | Female |
| Under 5 Years | 0 (0.0%) | 0 (0.0%) |
| 5 to 17 Years | 10 (1.3%) | 0 (0.0%) |
| 18 to 34 Years | 60 (8.2%) | 0 (0.0%) |
| 35 to 64 Years | 77 (7.1%) | 51 (4.2%) |
| 65 to 74 Years | 8 (2.2%) | 31 (8.1%) |
| 75 Years and over | 21 (26.9%) | 25 (6.1%) |
Disability Class: Cognitive Difficulty
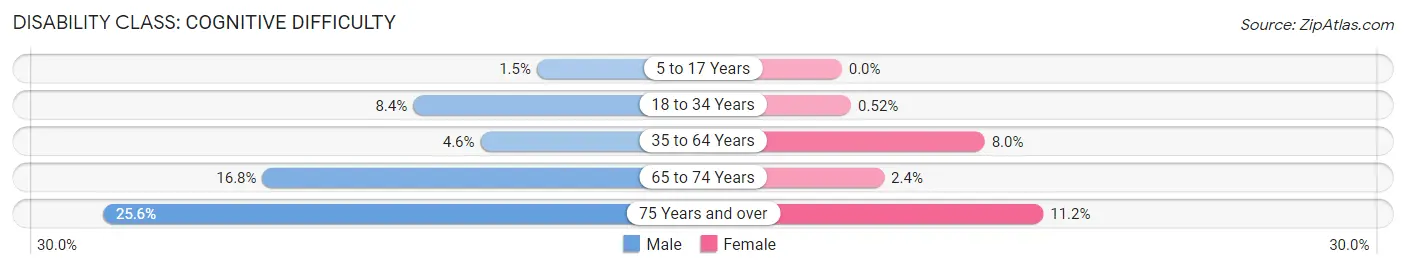
| Age Bracket | Male | Female |
| 5 to 17 Years | 11 (1.5%) | 0 (0.0%) |
| 18 to 34 Years | 61 (8.4%) | 5 (0.5%) |
| 35 to 64 Years | 50 (4.6%) | 97 (8.0%) |
| 65 to 74 Years | 62 (16.8%) | 9 (2.4%) |
| 75 Years and over | 20 (25.6%) | 46 (11.2%) |
Disability Class: Ambulatory Difficulty
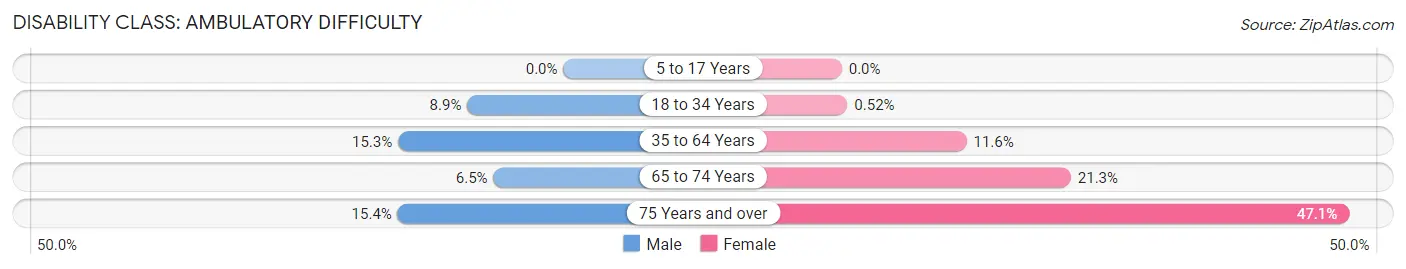
| Age Bracket | Male | Female |
| 5 to 17 Years | 0 (0.0%) | 0 (0.0%) |
| 18 to 34 Years | 65 (8.9%) | 5 (0.5%) |
| 35 to 64 Years | 166 (15.3%) | 141 (11.6%) |
| 65 to 74 Years | 24 (6.5%) | 81 (21.3%) |
| 75 Years and over | 12 (15.4%) | 193 (47.1%) |
Disability Class: Self-Care Difficulty
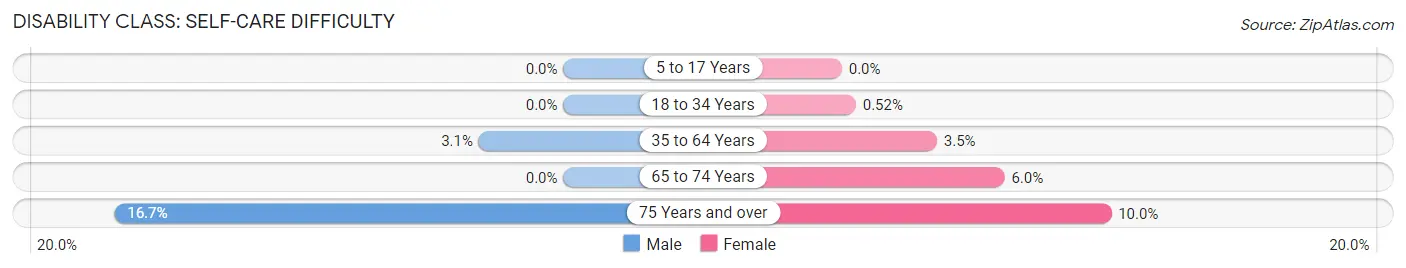
| Age Bracket | Male | Female |
| 5 to 17 Years | 0 (0.0%) | 0 (0.0%) |
| 18 to 34 Years | 0 (0.0%) | 5 (0.5%) |
| 35 to 64 Years | 34 (3.1%) | 43 (3.5%) |
| 65 to 74 Years | 0 (0.0%) | 23 (6.0%) |
| 75 Years and over | 13 (16.7%) | 41 (10.0%) |
Technology Access in Mount Healthy
Computing Device Access in Mount Healthy
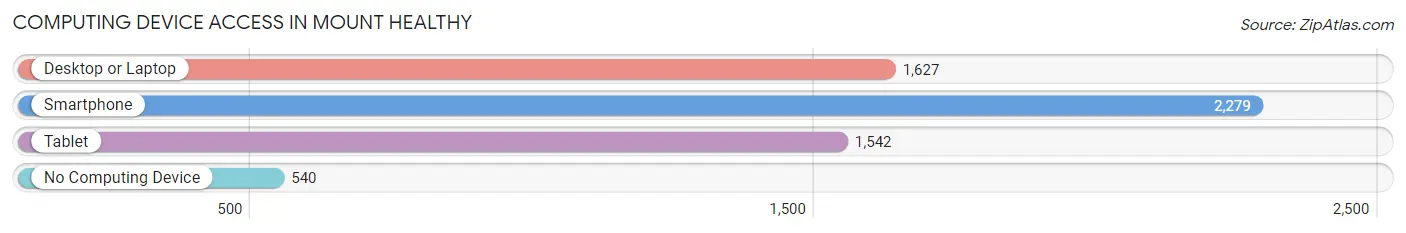
| Device Type | # Households | % Households |
| Desktop or Laptop | 1,627 | 54.5% |
| Smartphone | 2,279 | 76.3% |
| Tablet | 1,542 | 51.7% |
| No Computing Device | 540 | 18.1% |
| Total | 2,985 | 100.0% |
Internet Access in Mount Healthy
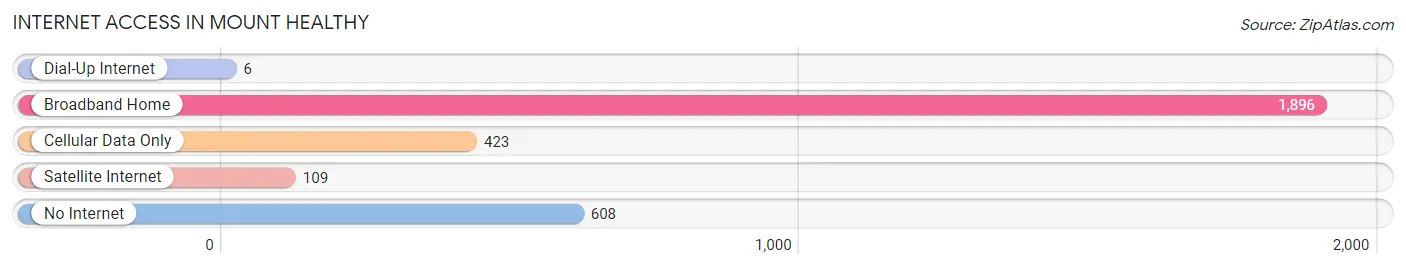
| Internet Type | # Households | % Households |
| Dial-Up Internet | 6 | 0.2% |
| Broadband Home | 1,896 | 63.5% |
| Cellular Data Only | 423 | 14.2% |
| Satellite Internet | 109 | 3.6% |
| No Internet | 608 | 20.4% |
| Total | 2,985 | 100.0% |
Mount Healthy Summary
History
Mount Healthy is a city located in Hamilton County, Ohio, United States. It is a suburb of Cincinnati and is part of the Cincinnati Metropolitan Statistical Area. The city was founded in 1817 and incorporated in 1873. The city was named after the nearby Mount Healthy United Presbyterian Church, which was built in 1817.
The city of Mount Healthy has a rich history that dates back to the early 1800s. The area was originally inhabited by Native Americans, and the first settlers arrived in the area in the late 1700s. The first settler was a man named John Smith, who built a log cabin in the area in 1799.
In 1817, the Mount Healthy United Presbyterian Church was built, and the area began to grow. The church was the center of the community, and it served as a place of worship, education, and social gathering.
In 1873, the city of Mount Healthy was officially incorporated. The city was named after the church, and it quickly grew in population. By 1900, the population had grown to over 1,000 people.
The city continued to grow throughout the 20th century, and by 2000, the population had grown to over 8,000 people. The city has continued to grow since then, and as of 2019, the population was estimated to be over 9,000 people.
Geography
Mount Healthy is located in Hamilton County, Ohio, United States. It is a suburb of Cincinnati and is part of the Cincinnati Metropolitan Statistical Area. The city is situated on the banks of the Great Miami River, and it is located about 10 miles north of downtown Cincinnati.
The city covers an area of 4.2 square miles, and it has a population density of 2,093 people per square mile. The city is located in a hilly area, and it is surrounded by forests and farmland.
Economy
The economy of Mount Healthy is largely based on the service industry. The city is home to a variety of businesses, including restaurants, retail stores, and professional services. The city is also home to a number of manufacturing companies, including a paper mill and a plastics factory.
The city is also home to a number of educational institutions, including Mount Healthy High School and Mount Healthy Middle School. The city is also home to a number of parks and recreational facilities, including a public pool, a skate park, and a community center.
Demographics
As of the 2010 census, the population of Mount Healthy was 8,945 people. The racial makeup of the city was 79.3% White, 15.2% African American, 0.3% Native American, 1.2% Asian, 0.1% Pacific Islander, 1.2% from other races, and 2.9% from two or more races. Hispanic or Latino of any race were 3.3% of the population.
The median household income in Mount Healthy was $45,945, and the median family income was $54,945. The per capita income was $21,945. About 8.3% of the population was below the poverty line.
Conclusion
Mount Healthy is a city located in Hamilton County, Ohio, United States. It is a suburb of Cincinnati and is part of the Cincinnati Metropolitan Statistical Area. The city was founded in 1817 and incorporated in 1873. The city has a rich history that dates back to the early 1800s, and it has continued to grow since then. The economy of Mount Healthy is largely based on the service industry, and the city is home to a variety of businesses, educational institutions, and recreational facilities. As of the 2010 census, the population of Mount Healthy was 8,945 people, and the median household income was $45,945.
Common Questions
What is Per Capita Income in Mount Healthy?
Per Capita income in Mount Healthy is $28,033.
What is the Median Family Income in Mount Healthy?
Median Family Income in Mount Healthy is $60,188.
What is the Median Household income in Mount Healthy?
Median Household Income in Mount Healthy is $44,471.
What is Income or Wage Gap in Mount Healthy?
Income or Wage Gap in Mount Healthy is 8.2%.
Women in Mount Healthy earn 91.8 cents for every dollar earned by a man.
What is Inequality or Gini Index in Mount Healthy?
Inequality or Gini Index in Mount Healthy is 0.46.
What is the Total Population of Mount Healthy?
Total Population of Mount Healthy is 6,949.
What is the Total Male Population of Mount Healthy?
Total Male Population of Mount Healthy is 3,375.
What is the Total Female Population of Mount Healthy?
Total Female Population of Mount Healthy is 3,574.
What is the Ratio of Males per 100 Females in Mount Healthy?
There are 94.43 Males per 100 Females in Mount Healthy.
What is the Ratio of Females per 100 Males in Mount Healthy?
There are 105.90 Females per 100 Males in Mount Healthy.
What is the Median Population Age in Mount Healthy?
Median Population Age in Mount Healthy is 40.0 Years.
What is the Average Family Size in Mount Healthy
Average Family Size in Mount Healthy is 2.9 People.
What is the Average Household Size in Mount Healthy
Average Household Size in Mount Healthy is 2.2 People.
How Large is the Labor Force in Mount Healthy?
There are 3,352 People in the Labor Forcein in Mount Healthy.
What is the Percentage of People in the Labor Force in Mount Healthy?
60.1% of People are in the Labor Force in Mount Healthy.
What is the Unemployment Rate in Mount Healthy?
Unemployment Rate in Mount Healthy is 6.0%.