Plain City, OH Map & Demographics
Plain City Map
Plain City Overview
$41,289
PER CAPITA INCOME
$105,066
AVG FAMILY INCOME
$86,512
AVG HOUSEHOLD INCOME
26.2%
WAGE / INCOME GAP [ % ]
73.8¢/ $1
WAGE / INCOME GAP [ $ ]
0.34
INEQUALITY / GINI INDEX
3,644
TOTAL POPULATION
1,955
MALE POPULATION
1,689
FEMALE POPULATION
115.75
MALES / 100 FEMALES
86.39
FEMALES / 100 MALES
38.5
MEDIAN AGE
2.9
AVG FAMILY SIZE
2.4
AVG HOUSEHOLD SIZE
1,850
LABOR FORCE [ PEOPLE ]
65.8%
PERCENT IN LABOR FORCE
1.2%
UNEMPLOYMENT RATE
Plain City Zip Codes
Plain City Area Codes
Income in Plain City
Income Overview in Plain City
Per Capita Income in Plain City is $41,289, while median incomes of families and households are $105,066 and $86,512 respectively.
| Characteristic | Number | Measure |
| Per Capita Income | 3,644 | $41,289 |
| Median Family Income | 1,100 | $105,066 |
| Mean Family Income | 1,100 | $112,379 |
| Median Household Income | 1,544 | $86,512 |
| Mean Household Income | 1,544 | $94,669 |
| Income Deficit | 1,100 | $0 |
| Wage / Income Gap (%) | 3,644 | 26.16% |
| Wage / Income Gap ($) | 3,644 | 73.84¢ per $1 |
| Gini / Inequality Index | 3,644 | 0.34 |
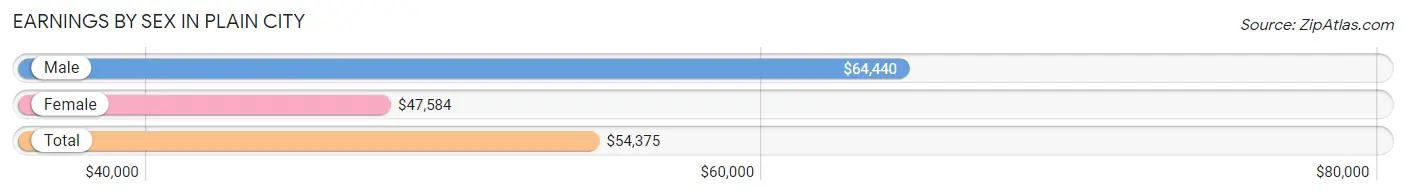
Earnings by Sex in Plain City
Average Earnings in Plain City are $54,375, $64,440 for men and $47,584 for women, a difference of 26.2%.
| Sex | Number | Average Earnings |
| Male | 1,135 (58.0%) | $64,440 |
| Female | 823 (42.0%) | $47,584 |
| Total | 1,958 (100.0%) | $54,375 |
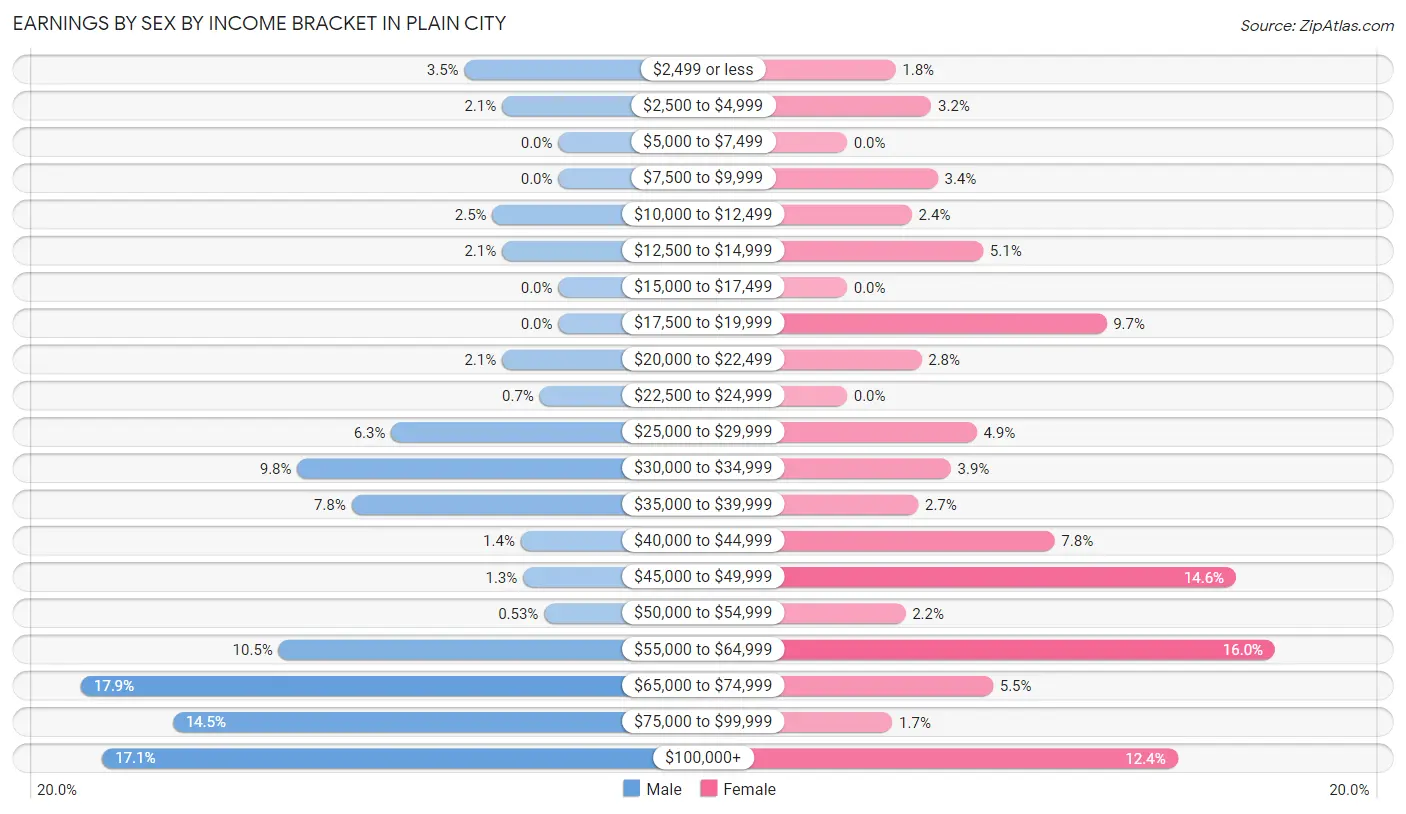
Earnings by Sex by Income Bracket in Plain City
The most common earnings brackets in Plain City are $65,000 to $74,999 for men (203 | 17.9%) and $55,000 to $64,999 for women (132 | 16.0%).
| Income | Male | Female |
| $2,499 or less | 40 (3.5%) | 15 (1.8%) |
| $2,500 to $4,999 | 24 (2.1%) | 26 (3.2%) |
| $5,000 to $7,499 | 0 (0.0%) | 0 (0.0%) |
| $7,500 to $9,999 | 0 (0.0%) | 28 (3.4%) |
| $10,000 to $12,499 | 28 (2.5%) | 20 (2.4%) |
| $12,500 to $14,999 | 24 (2.1%) | 42 (5.1%) |
| $15,000 to $17,499 | 0 (0.0%) | 0 (0.0%) |
| $17,500 to $19,999 | 0 (0.0%) | 80 (9.7%) |
| $20,000 to $22,499 | 24 (2.1%) | 23 (2.8%) |
| $22,500 to $24,999 | 8 (0.7%) | 0 (0.0%) |
| $25,000 to $29,999 | 71 (6.3%) | 40 (4.9%) |
| $30,000 to $34,999 | 111 (9.8%) | 32 (3.9%) |
| $35,000 to $39,999 | 88 (7.7%) | 22 (2.7%) |
| $40,000 to $44,999 | 16 (1.4%) | 64 (7.8%) |
| $45,000 to $49,999 | 15 (1.3%) | 120 (14.6%) |
| $50,000 to $54,999 | 6 (0.5%) | 18 (2.2%) |
| $55,000 to $64,999 | 119 (10.5%) | 132 (16.0%) |
| $65,000 to $74,999 | 203 (17.9%) | 45 (5.5%) |
| $75,000 to $99,999 | 164 (14.4%) | 14 (1.7%) |
| $100,000+ | 194 (17.1%) | 102 (12.4%) |
| Total | 1,135 (100.0%) | 823 (100.0%) |
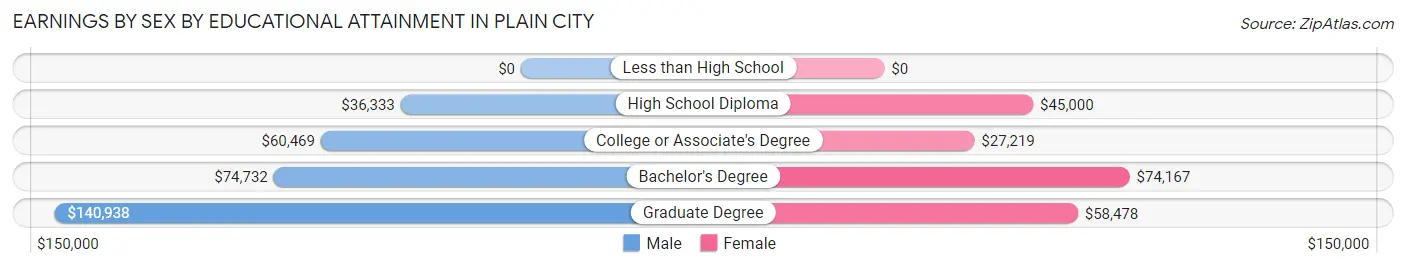
Earnings by Sex by Educational Attainment in Plain City
Average earnings in Plain City are $68,393 for men and $48,244 for women, a difference of 29.5%. Men with an educational attainment of graduate degree enjoy the highest average annual earnings of $140,938, while those with high school diploma education earn the least with $36,333. Women with an educational attainment of bachelor's degree earn the most with the average annual earnings of $74,167, while those with college or associate's degree education have the smallest earnings of $27,219.
| Educational Attainment | Male Income | Female Income |
| Less than High School | - | - |
| High School Diploma | $36,333 | $45,000 |
| College or Associate's Degree | $60,469 | $27,219 |
| Bachelor's Degree | $74,732 | $74,167 |
| Graduate Degree | $140,938 | $58,478 |
| Total | $68,393 | $48,244 |
Family Income in Plain City
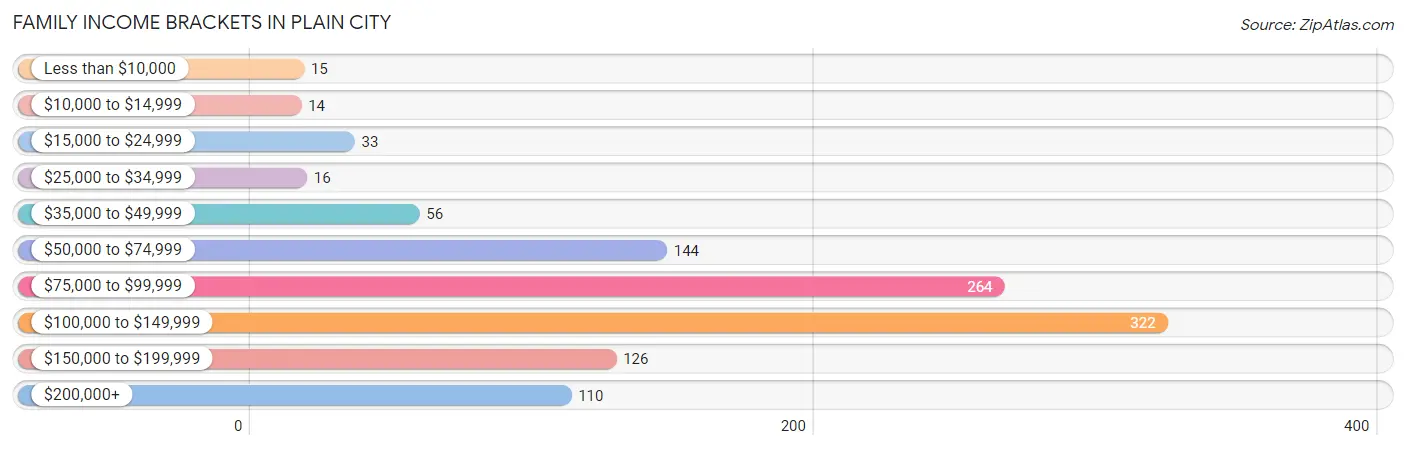
Family Income Brackets in Plain City
According to the Plain City family income data, there are 322 families falling into the $100,000 to $149,999 income range, which is the most common income bracket and makes up 29.3% of all families. Conversely, the $10,000 to $14,999 income bracket is the least frequent group with only 14 families (1.3%) belonging to this category.
| Income Bracket | # Families | % Families |
| Less than $10,000 | 15 | 1.4% |
| $10,000 to $14,999 | 14 | 1.3% |
| $15,000 to $24,999 | 33 | 3.0% |
| $25,000 to $34,999 | 16 | 1.5% |
| $35,000 to $49,999 | 56 | 5.1% |
| $50,000 to $74,999 | 144 | 13.1% |
| $75,000 to $99,999 | 264 | 24.0% |
| $100,000 to $149,999 | 322 | 29.3% |
| $150,000 to $199,999 | 126 | 11.5% |
| $200,000+ | 110 | 10.0% |
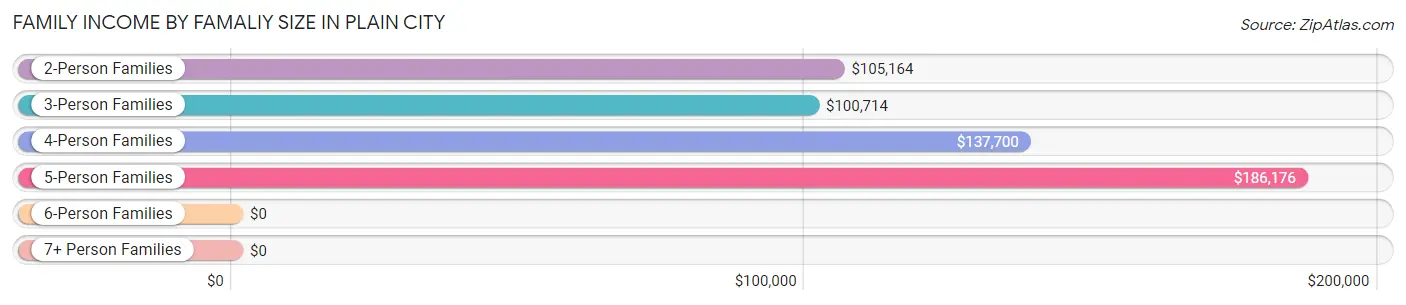
Family Income by Famaliy Size in Plain City
5-person families (34 | 3.1%) account for the highest median family income in Plain City with $186,176 per family, while 2-person families (549 | 49.9%) have the highest median income of $52,582 per family member.
| Income Bracket | # Families | Median Income |
| 2-Person Families | 549 (49.9%) | $105,164 |
| 3-Person Families | 230 (20.9%) | $100,714 |
| 4-Person Families | 252 (22.9%) | $137,700 |
| 5-Person Families | 34 (3.1%) | $186,176 |
| 6-Person Families | 35 (3.2%) | $0 |
| 7+ Person Families | 0 (0.0%) | $0 |
| Total | 1,100 (100.0%) | $105,066 |
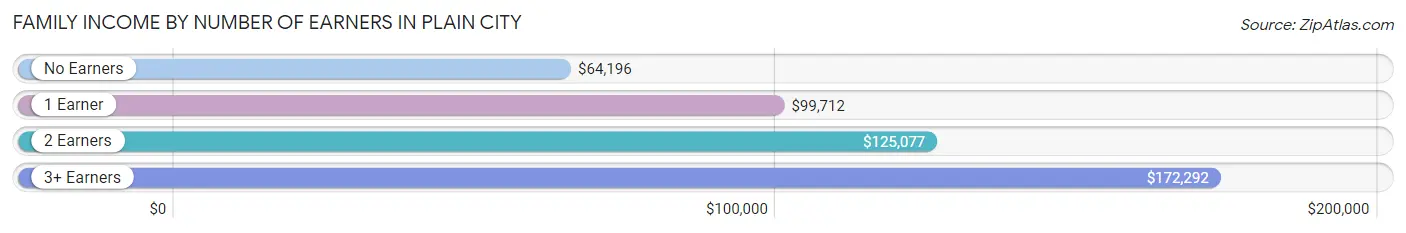
Family Income by Number of Earners in Plain City
The median family income in Plain City is $105,066, with families comprising 3+ earners (37) having the highest median family income of $172,292, while families with no earners (211) have the lowest median family income of $64,196, accounting for 3.4% and 19.2% of families, respectively.
| Number of Earners | # Families | Median Income |
| No Earners | 211 (19.2%) | $64,196 |
| 1 Earner | 243 (22.1%) | $99,712 |
| 2 Earners | 609 (55.4%) | $125,077 |
| 3+ Earners | 37 (3.4%) | $172,292 |
| Total | 1,100 (100.0%) | $105,066 |
Household Income in Plain City
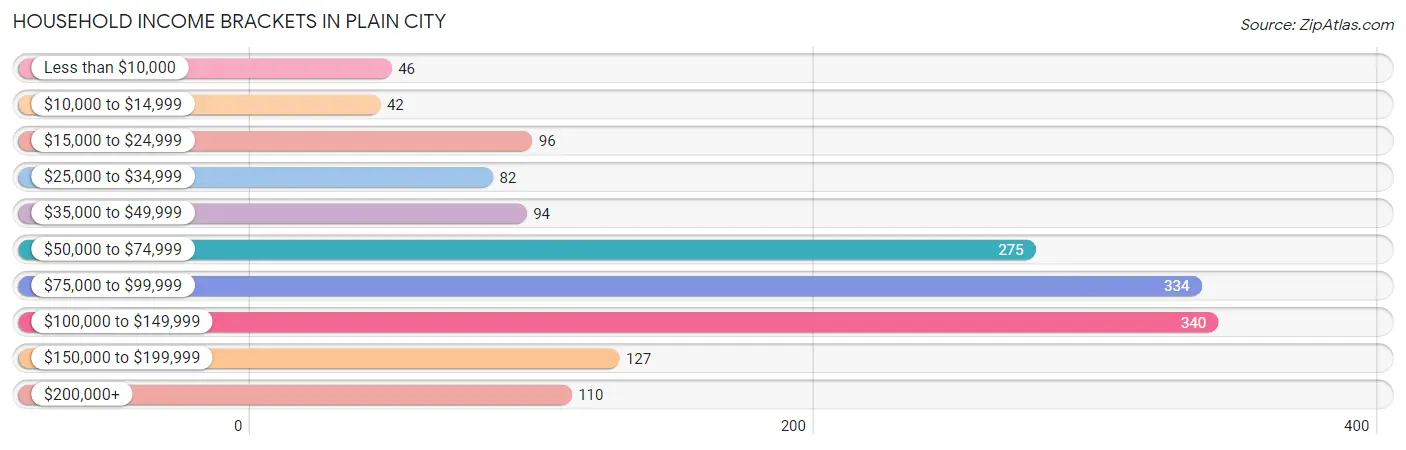
Household Income Brackets in Plain City
With 340 households falling in the category, the $100,000 to $149,999 income range is the most frequent in Plain City, accounting for 22.0% of all households. In contrast, only 42 households (2.7%) fall into the $10,000 to $14,999 income bracket, making it the least populous group.
| Income Bracket | # Households | % Households |
| Less than $10,000 | 46 | 3.0% |
| $10,000 to $14,999 | 42 | 2.7% |
| $15,000 to $24,999 | 96 | 6.2% |
| $25,000 to $34,999 | 82 | 5.3% |
| $35,000 to $49,999 | 94 | 6.1% |
| $50,000 to $74,999 | 275 | 17.8% |
| $75,000 to $99,999 | 334 | 21.6% |
| $100,000 to $149,999 | 340 | 22.0% |
| $150,000 to $199,999 | 127 | 8.2% |
| $200,000+ | 110 | 7.1% |
Household Income by Householder Age in Plain City
The median household income in Plain City is $86,512, with the highest median household income of $98,833 found in the 15 to 24 years age bracket for the primary householder. A total of 84 households (5.4%) fall into this category. Meanwhile, the 65+ years age bracket for the primary householder has the lowest median household income of $60,057, with 431 households (27.9%) in this group.
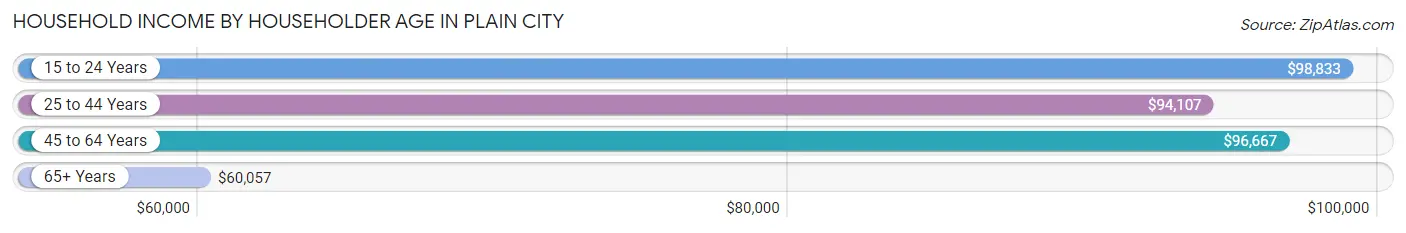
| Income Bracket | # Households | Median Income |
| 15 to 24 Years | 84 (5.4%) | $98,833 |
| 25 to 44 Years | 579 (37.5%) | $94,107 |
| 45 to 64 Years | 450 (29.1%) | $96,667 |
| 65+ Years | 431 (27.9%) | $60,057 |
| Total | 1,544 (100.0%) | $86,512 |
Poverty in Plain City
Income Below Poverty by Sex and Age in Plain City
With 3.0% poverty level for males and 9.7% for females among the residents of Plain City, 12 to 14 year old males and 12 to 14 year old females are the most vulnerable to poverty, with 17 males (58.6%) and 23 females (45.1%) in their respective age groups living below the poverty level.
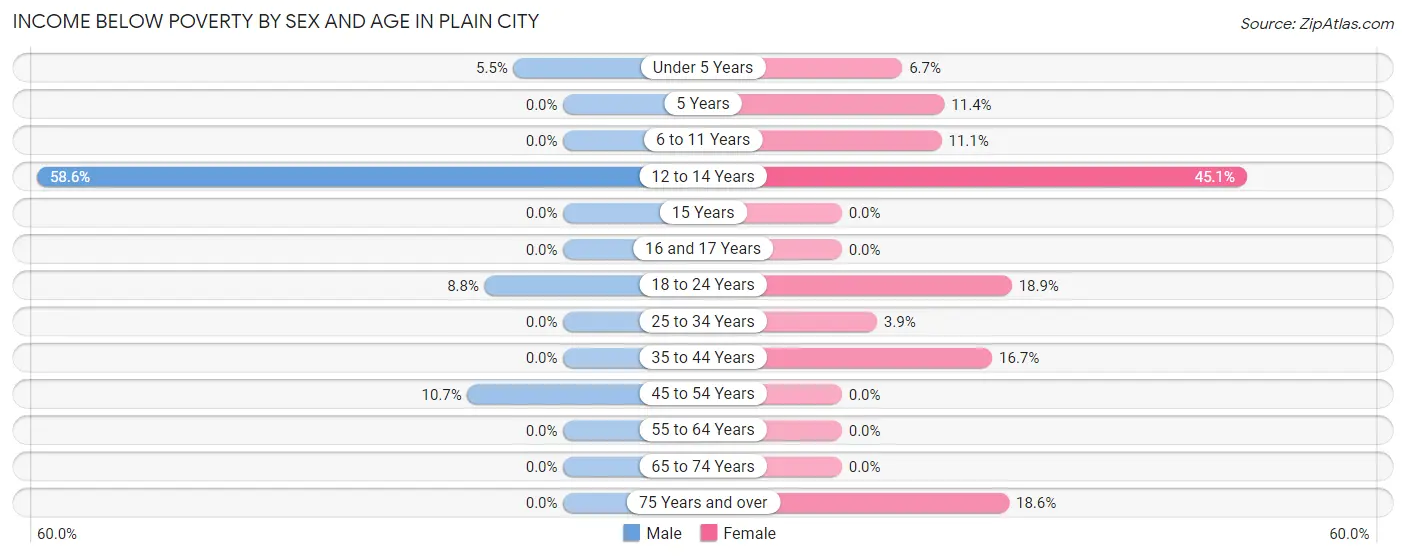
| Age Bracket | Male | Female |
| Under 5 Years | 11 (5.5%) | 7 (6.7%) |
| 5 Years | 0 (0.0%) | 8 (11.4%) |
| 6 to 11 Years | 0 (0.0%) | 14 (11.1%) |
| 12 to 14 Years | 17 (58.6%) | 23 (45.1%) |
| 15 Years | 0 (0.0%) | 0 (0.0%) |
| 16 and 17 Years | 0 (0.0%) | 0 (0.0%) |
| 18 to 24 Years | 14 (8.7%) | 14 (18.9%) |
| 25 to 34 Years | 0 (0.0%) | 9 (3.9%) |
| 35 to 44 Years | 0 (0.0%) | 39 (16.7%) |
| 45 to 54 Years | 16 (10.7%) | 0 (0.0%) |
| 55 to 64 Years | 0 (0.0%) | 0 (0.0%) |
| 65 to 74 Years | 0 (0.0%) | 0 (0.0%) |
| 75 Years and over | 0 (0.0%) | 49 (18.6%) |
| Total | 58 (3.0%) | 163 (9.7%) |
Income Above Poverty by Sex and Age in Plain City
According to the poverty statistics in Plain City, males aged 5 years and females aged 16 and 17 years are the age groups that are most secure financially, with 100.0% of males and 100.0% of females in these age groups living above the poverty line.
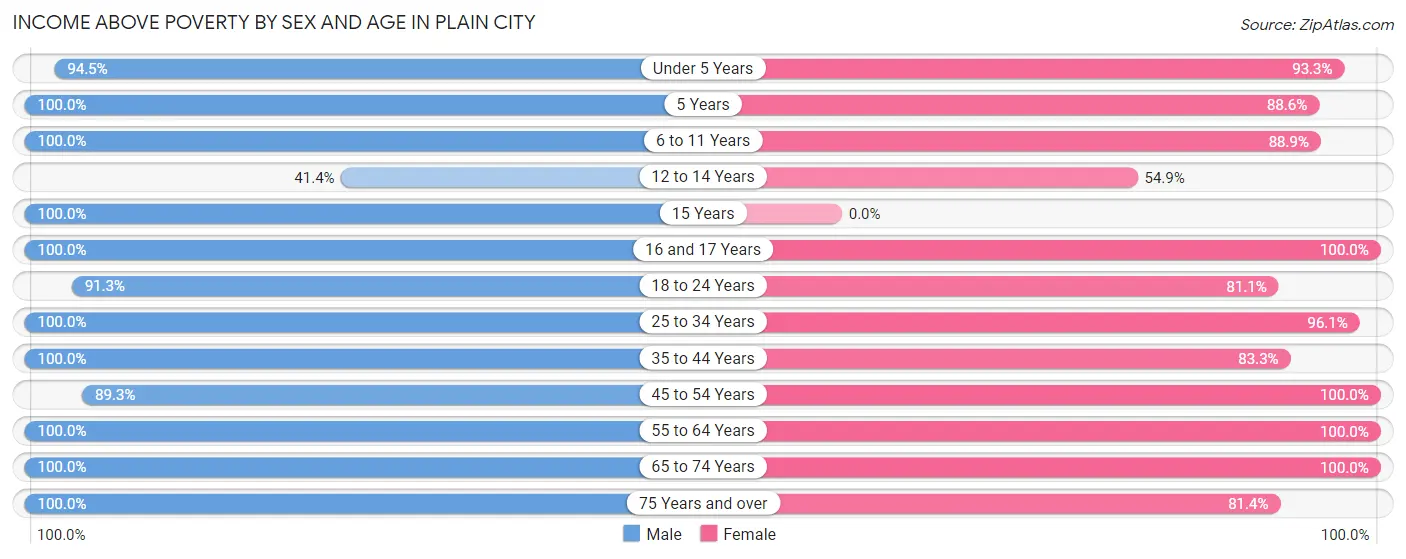
| Age Bracket | Male | Female |
| Under 5 Years | 188 (94.5%) | 97 (93.3%) |
| 5 Years | 25 (100.0%) | 62 (88.6%) |
| 6 to 11 Years | 199 (100.0%) | 112 (88.9%) |
| 12 to 14 Years | 12 (41.4%) | 28 (54.9%) |
| 15 Years | 30 (100.0%) | 0 (0.0%) |
| 16 and 17 Years | 66 (100.0%) | 26 (100.0%) |
| 18 to 24 Years | 146 (91.2%) | 60 (81.1%) |
| 25 to 34 Years | 310 (100.0%) | 221 (96.1%) |
| 35 to 44 Years | 217 (100.0%) | 194 (83.3%) |
| 45 to 54 Years | 134 (89.3%) | 171 (100.0%) |
| 55 to 64 Years | 230 (100.0%) | 226 (100.0%) |
| 65 to 74 Years | 152 (100.0%) | 115 (100.0%) |
| 75 Years and over | 188 (100.0%) | 214 (81.4%) |
| Total | 1,897 (97.0%) | 1,526 (90.3%) |
Income Below Poverty Among Married-Couple Families in Plain City
The poverty statistics for married-couple families in Plain City show that 3.4% or 29 of the total 847 families live below the poverty line. Families with 1 or 2 children have the highest poverty rate of 4.3%, comprising of 15 families. On the other hand, families with 3 or 4 children have the lowest poverty rate of 0.0%, which includes 0 families.
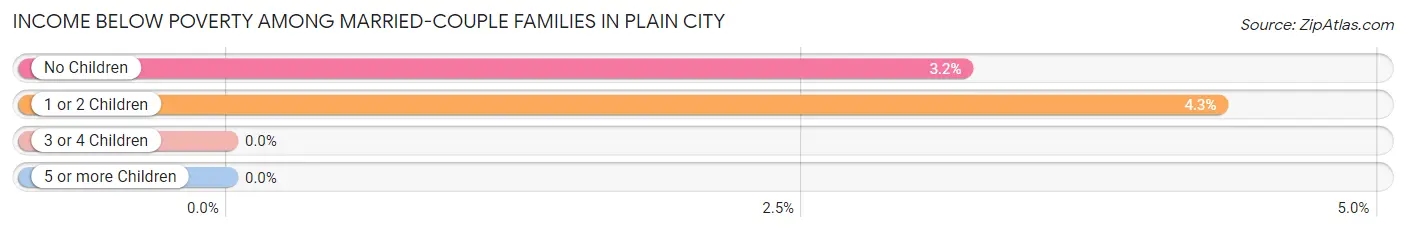
| Children | Above Poverty | Below Poverty |
| No Children | 424 (96.8%) | 14 (3.2%) |
| 1 or 2 Children | 333 (95.7%) | 15 (4.3%) |
| 3 or 4 Children | 61 (100.0%) | 0 (0.0%) |
| 5 or more Children | 0 (0.0%) | 0 (0.0%) |
| Total | 818 (96.6%) | 29 (3.4%) |
Income Below Poverty Among Single-Parent Households in Plain City
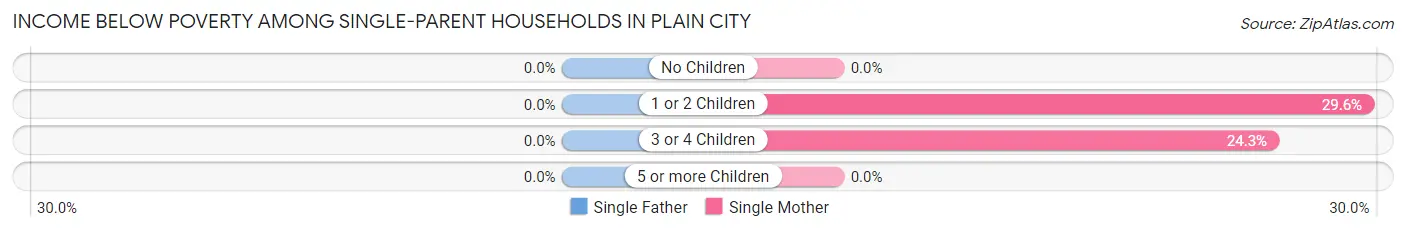
| Children | Single Father | Single Mother |
| No Children | 0 (0.0%) | 0 (0.0%) |
| 1 or 2 Children | 0 (0.0%) | 24 (29.6%) |
| 3 or 4 Children | 0 (0.0%) | 9 (24.3%) |
| 5 or more Children | 0 (0.0%) | 0 (0.0%) |
| Total | 0 (0.0%) | 33 (17.5%) |
Income Below Poverty Among Married-Couple vs Single-Parent Households in Plain City
The poverty data for Plain City shows that 29 of the married-couple family households (3.4%) and 33 of the single-parent households (13.0%) are living below the poverty level. Within the married-couple family households, those with 1 or 2 children have the highest poverty rate, with 15 households (4.3%) falling below the poverty line. Among the single-parent households, those with 1 or 2 children have the highest poverty rate, with 24 household (24.5%) living below poverty.
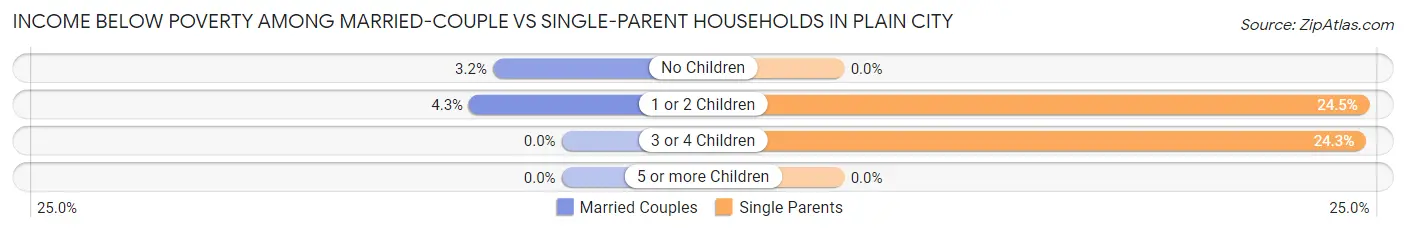
| Children | Married-Couple Families | Single-Parent Households |
| No Children | 14 (3.2%) | 0 (0.0%) |
| 1 or 2 Children | 15 (4.3%) | 24 (24.5%) |
| 3 or 4 Children | 0 (0.0%) | 9 (24.3%) |
| 5 or more Children | 0 (0.0%) | 0 (0.0%) |
| Total | 29 (3.4%) | 33 (13.0%) |
Race in Plain City
The most populous races in Plain City are White / Caucasian (3,424 | 94.0%), Two or more Races (170 | 4.7%), and Asian (50 | 1.4%).
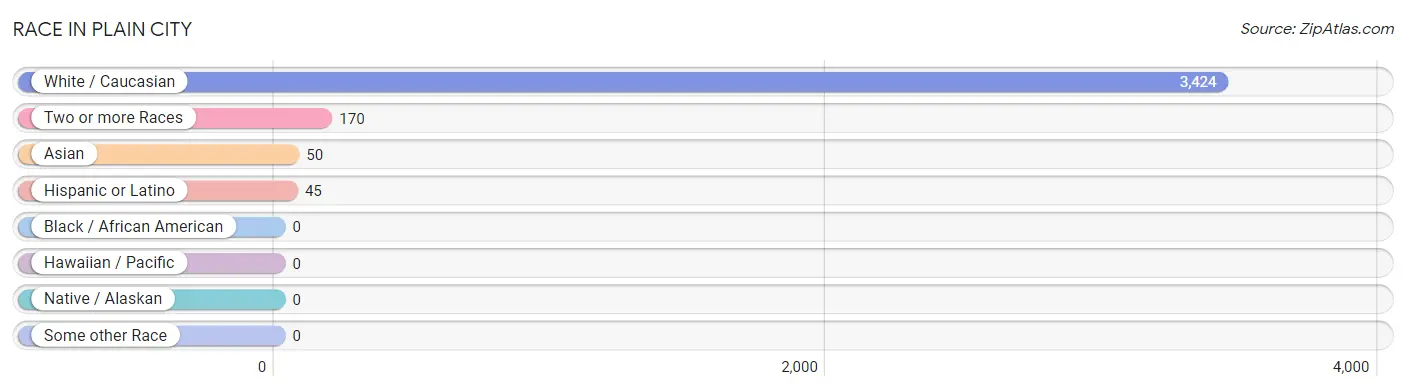
| Race | # Population | % Population |
| Asian | 50 | 1.4% |
| Black / African American | 0 | 0.0% |
| Hawaiian / Pacific | 0 | 0.0% |
| Hispanic or Latino | 45 | 1.2% |
| Native / Alaskan | 0 | 0.0% |
| White / Caucasian | 3,424 | 94.0% |
| Two or more Races | 170 | 4.7% |
| Some other Race | 0 | 0.0% |
| Total | 3,644 | 100.0% |
Ancestry in Plain City
The most populous ancestries reported in Plain City are German (1,026 | 28.2%), English (642 | 17.6%), Irish (606 | 16.6%), American (458 | 12.6%), and Korean (113 | 3.1%), together accounting for 78.1% of all Plain City residents.
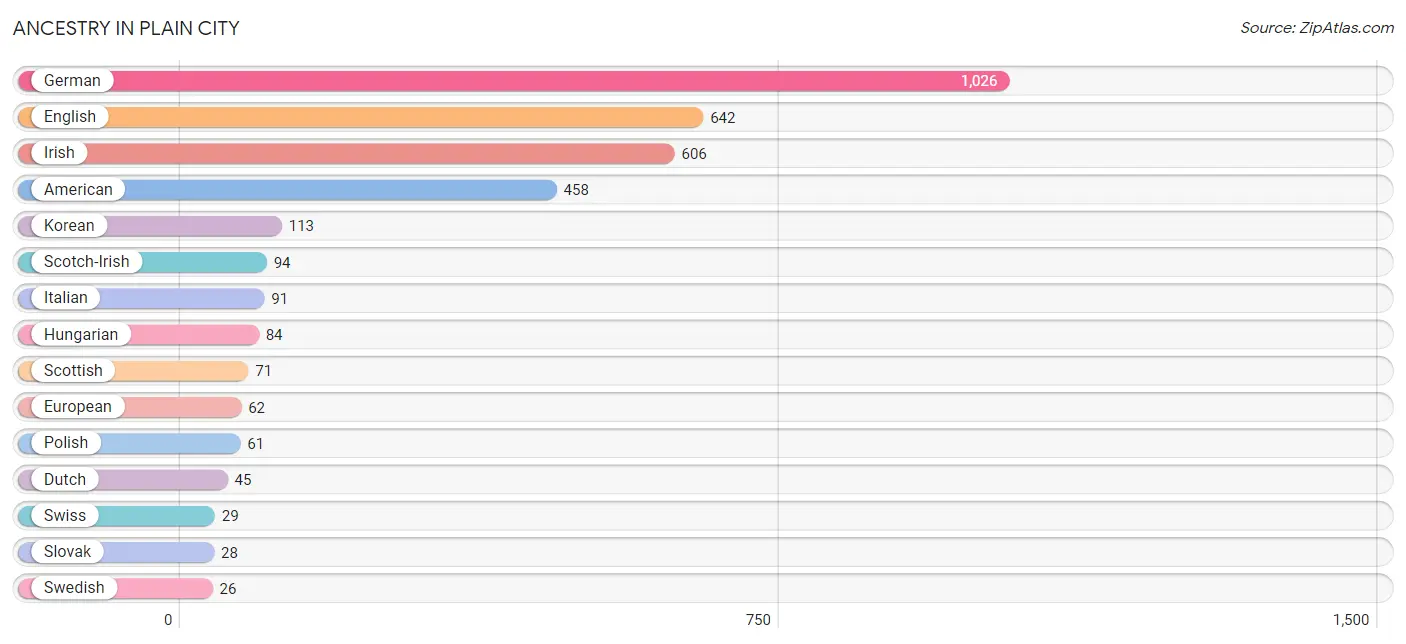
| Ancestry | # Population | % Population |
| American | 458 | 12.6% |
| Arab | 6 | 0.2% |
| British | 9 | 0.3% |
| Chickasaw | 5 | 0.1% |
| Cuban | 25 | 0.7% |
| Czechoslovakian | 15 | 0.4% |
| Dutch | 45 | 1.2% |
| English | 642 | 17.6% |
| European | 62 | 1.7% |
| Finnish | 5 | 0.1% |
| French | 17 | 0.5% |
| German | 1,026 | 28.2% |
| Hungarian | 84 | 2.3% |
| Irish | 606 | 16.6% |
| Italian | 91 | 2.5% |
| Korean | 113 | 3.1% |
| Mexican | 20 | 0.5% |
| Native Hawaiian | 8 | 0.2% |
| Polish | 61 | 1.7% |
| Scandinavian | 18 | 0.5% |
| Scotch-Irish | 94 | 2.6% |
| Scottish | 71 | 1.9% |
| Slovak | 28 | 0.8% |
| Swedish | 26 | 0.7% |
| Swiss | 29 | 0.8% |
| Thai | 13 | 0.4% |
| Welsh | 5 | 0.1% | View All 27 Rows |
Immigrants in Plain City
The most numerous immigrant groups reported in Plain City came from Central America (12 | 0.3%), Latin America (12 | 0.3%), and Mexico (12 | 0.3%), together accounting for 1.0% of all Plain City residents.
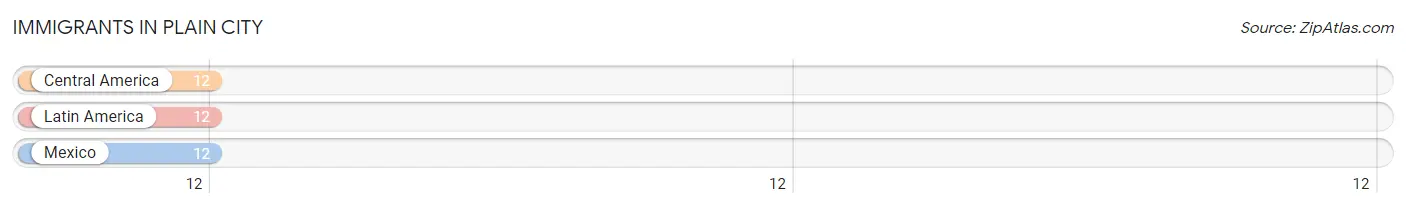
| Immigration Origin | # Population | % Population |
| Central America | 12 | 0.3% |
| Latin America | 12 | 0.3% |
| Mexico | 12 | 0.3% | View All 3 Rows |
Sex and Age in Plain City
Sex and Age in Plain City
The most populous age groups in Plain City are 30 to 34 Years (228 | 11.7%) for men and 30 to 34 Years (214 | 12.7%) for women.
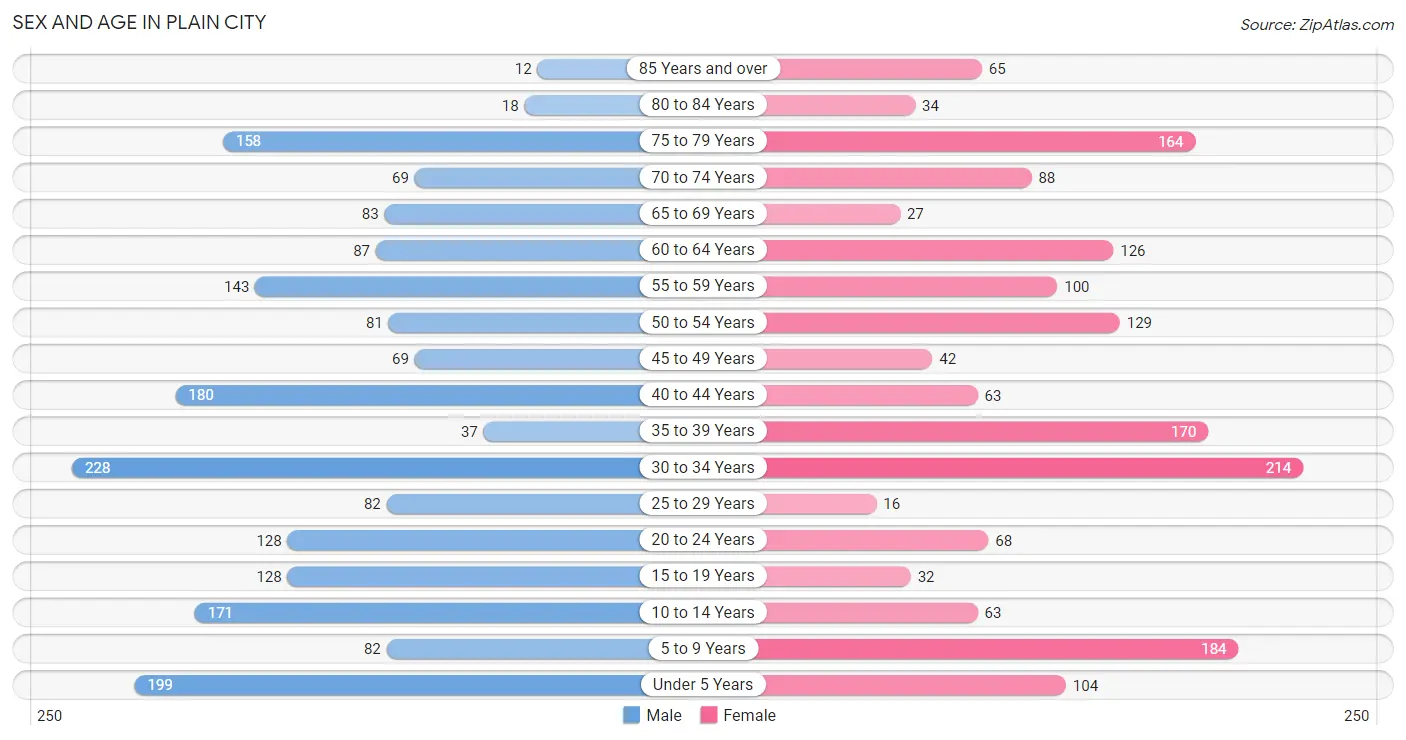
| Age Bracket | Male | Female |
| Under 5 Years | 199 (10.2%) | 104 (6.2%) |
| 5 to 9 Years | 82 (4.2%) | 184 (10.9%) |
| 10 to 14 Years | 171 (8.7%) | 63 (3.7%) |
| 15 to 19 Years | 128 (6.6%) | 32 (1.9%) |
| 20 to 24 Years | 128 (6.6%) | 68 (4.0%) |
| 25 to 29 Years | 82 (4.2%) | 16 (0.9%) |
| 30 to 34 Years | 228 (11.7%) | 214 (12.7%) |
| 35 to 39 Years | 37 (1.9%) | 170 (10.1%) |
| 40 to 44 Years | 180 (9.2%) | 63 (3.7%) |
| 45 to 49 Years | 69 (3.5%) | 42 (2.5%) |
| 50 to 54 Years | 81 (4.1%) | 129 (7.6%) |
| 55 to 59 Years | 143 (7.3%) | 100 (5.9%) |
| 60 to 64 Years | 87 (4.4%) | 126 (7.5%) |
| 65 to 69 Years | 83 (4.3%) | 27 (1.6%) |
| 70 to 74 Years | 69 (3.5%) | 88 (5.2%) |
| 75 to 79 Years | 158 (8.1%) | 164 (9.7%) |
| 80 to 84 Years | 18 (0.9%) | 34 (2.0%) |
| 85 Years and over | 12 (0.6%) | 65 (3.8%) |
| Total | 1,955 (100.0%) | 1,689 (100.0%) |
Families and Households in Plain City
Median Family Size in Plain City
The median family size in Plain City is 2.85 persons per family, with married-couple families (847 | 77.0%) accounting for the largest median family size of 2.89 persons per family. On the other hand, single male/father families (65 | 5.9%) represent the smallest median family size with 2.31 persons per family.
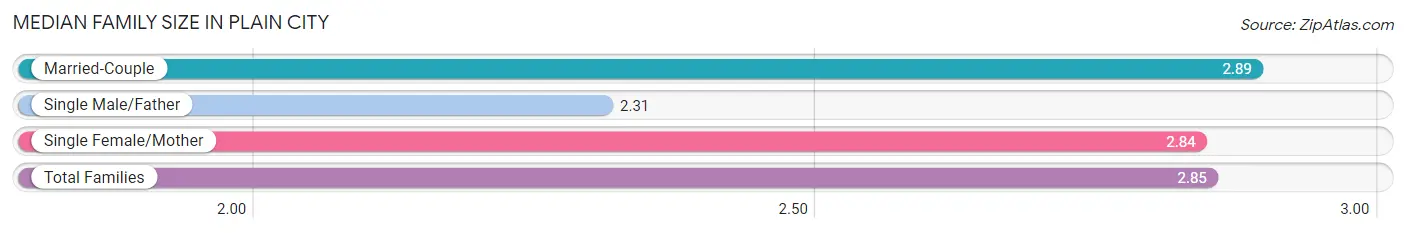
| Family Type | # Families | Family Size |
| Married-Couple | 847 (77.0%) | 2.89 |
| Single Male/Father | 65 (5.9%) | 2.31 |
| Single Female/Mother | 188 (17.1%) | 2.84 |
| Total Families | 1,100 (100.0%) | 2.85 |
Median Household Size in Plain City
The median household size in Plain City is 2.36 persons per household, with single female/mother households (188 | 12.2%) accounting for the largest median household size of 3.01 persons per household. non-family households (444 | 28.8%) represent the smallest median household size with 1.08 persons per household.
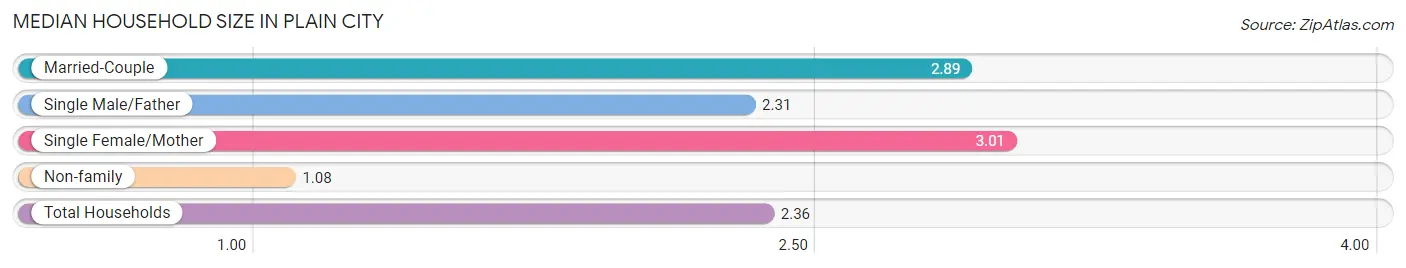
| Household Type | # Households | Household Size |
| Married-Couple | 847 (54.9%) | 2.89 |
| Single Male/Father | 65 (4.2%) | 2.31 |
| Single Female/Mother | 188 (12.2%) | 3.01 |
| Non-family | 444 (28.8%) | 1.08 |
| Total Households | 1,544 (100.0%) | 2.36 |
Household Size by Marriage Status in Plain City
Out of a total of 1,544 households in Plain City, 1,100 (71.2%) are family households, while 444 (28.8%) are nonfamily households. The most numerous type of family households are 2-person households, comprising 534, and the most common type of nonfamily households are 1-person households, comprising 407.
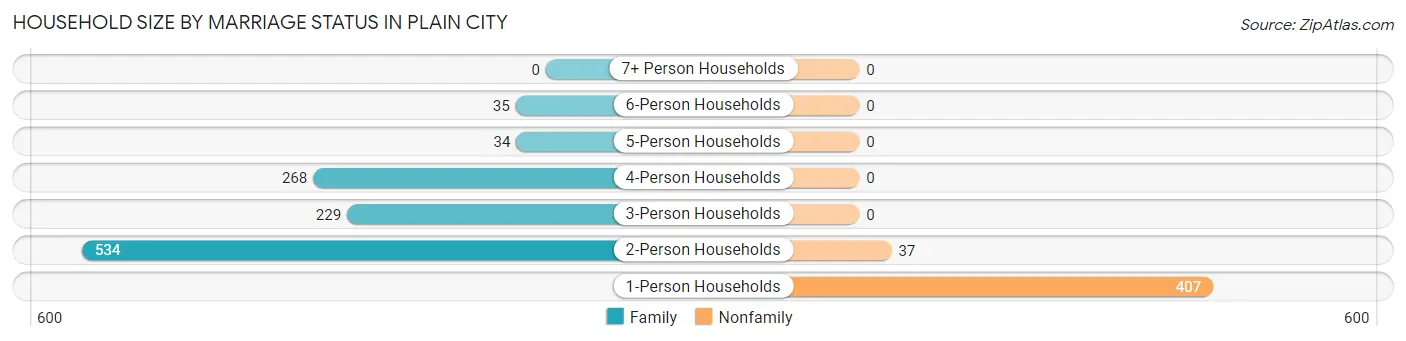
| Household Size | Family Households | Nonfamily Households |
| 1-Person Households | - | 407 (26.4%) |
| 2-Person Households | 534 (34.6%) | 37 (2.4%) |
| 3-Person Households | 229 (14.8%) | 0 (0.0%) |
| 4-Person Households | 268 (17.4%) | 0 (0.0%) |
| 5-Person Households | 34 (2.2%) | 0 (0.0%) |
| 6-Person Households | 35 (2.3%) | 0 (0.0%) |
| 7+ Person Households | 0 (0.0%) | 0 (0.0%) |
| Total | 1,100 (71.2%) | 444 (28.8%) |
Female Fertility in Plain City
Fertility by Age in Plain City
Average fertility rate in Plain City is 91.0 births per 1,000 women. Women in the age bracket of 20 to 34 years have the highest fertility rate with 198.0 births per 1,000 women. Women in the age bracket of 20 to 34 years acount for 100.0% of all women with births.
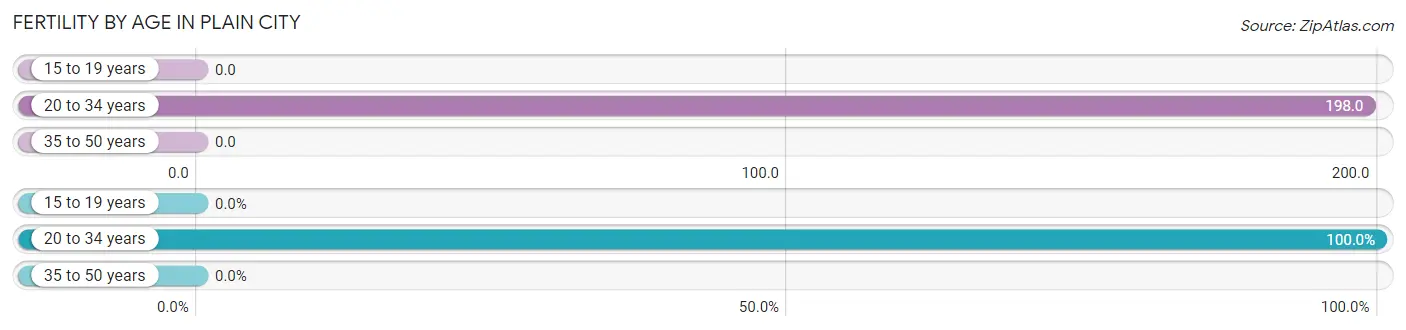
| Age Bracket | Women with Births | Births / 1,000 Women |
| 15 to 19 years | 0 (0.0%) | 0.0 |
| 20 to 34 years | 59 (100.0%) | 198.0 |
| 35 to 50 years | 0 (0.0%) | 0.0 |
| Total | 59 (100.0%) | 91.0 |
Fertility by Age by Marriage Status in Plain City
74.6% of women with births (59) in Plain City are married. The highest percentage of unmarried women with births falls into 20 to 34 years age bracket with 25.4% of them unmarried at the time of birth, while the lowest percentage of unmarried women with births belong to 20 to 34 years age bracket with 25.4% of them unmarried.
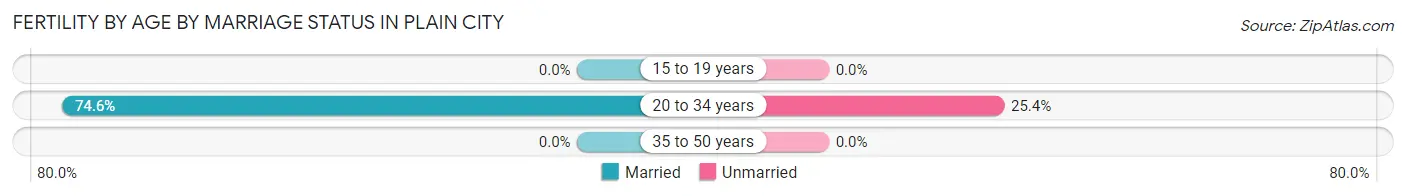
| Age Bracket | Married | Unmarried |
| 15 to 19 years | 0 (0.0%) | 0 (0.0%) |
| 20 to 34 years | 44 (74.6%) | 15 (25.4%) |
| 35 to 50 years | 0 (0.0%) | 0 (0.0%) |
| Total | 44 (74.6%) | 15 (25.4%) |
Fertility by Education in Plain City
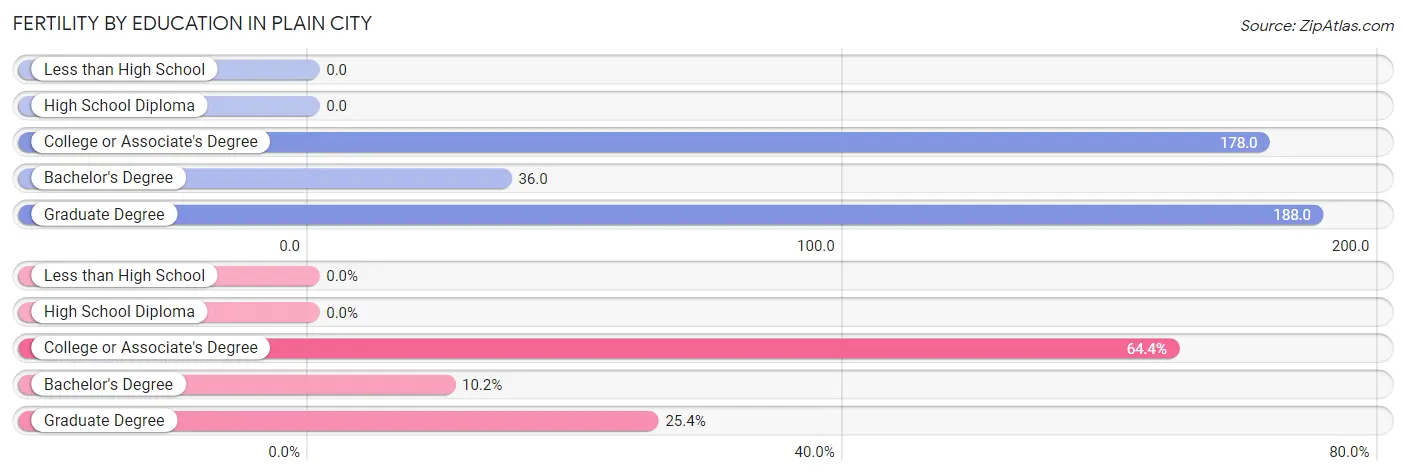
| Educational Attainment | Women with Births | Births / 1,000 Women |
| Less than High School | 0 (0.0%) | 0.0 |
| High School Diploma | 0 (0.0%) | 0.0 |
| College or Associate's Degree | 38 (64.4%) | 178.0 |
| Bachelor's Degree | 6 (10.2%) | 36.0 |
| Graduate Degree | 15 (25.4%) | 188.0 |
| Total | 59 (100.0%) | 91.0 |
Fertility by Education by Marriage Status in Plain City
25.4% of women with births in Plain City are unmarried. Women with the educational attainment of bachelor's degree are most likely to be married with 100.0% of them married at childbirth, while women with the educational attainment of college or associate's degree are least likely to be married with 39.5% of them unmarried at childbirth.
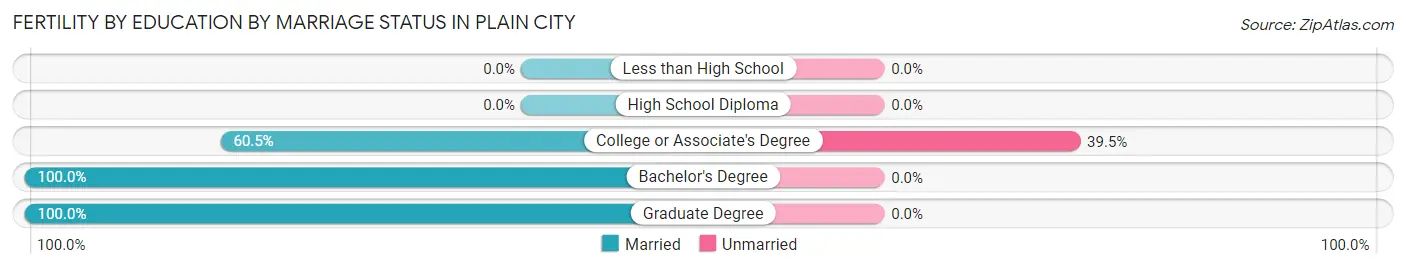
| Educational Attainment | Married | Unmarried |
| Less than High School | 0 (0.0%) | 0 (0.0%) |
| High School Diploma | 0 (0.0%) | 0 (0.0%) |
| College or Associate's Degree | 23 (60.5%) | 15 (39.5%) |
| Bachelor's Degree | 6 (100.0%) | 0 (0.0%) |
| Graduate Degree | 15 (100.0%) | 0 (0.0%) |
| Total | 44 (74.6%) | 15 (25.4%) |
Employment Characteristics in Plain City
Employment by Class of Employer in Plain City
Among the 1,829 employed individuals in Plain City, private company employees (1,134 | 62.0%), self-employed (not incorporated) (304 | 16.6%), and local government employees (194 | 10.6%) make up the most common classes of employment.
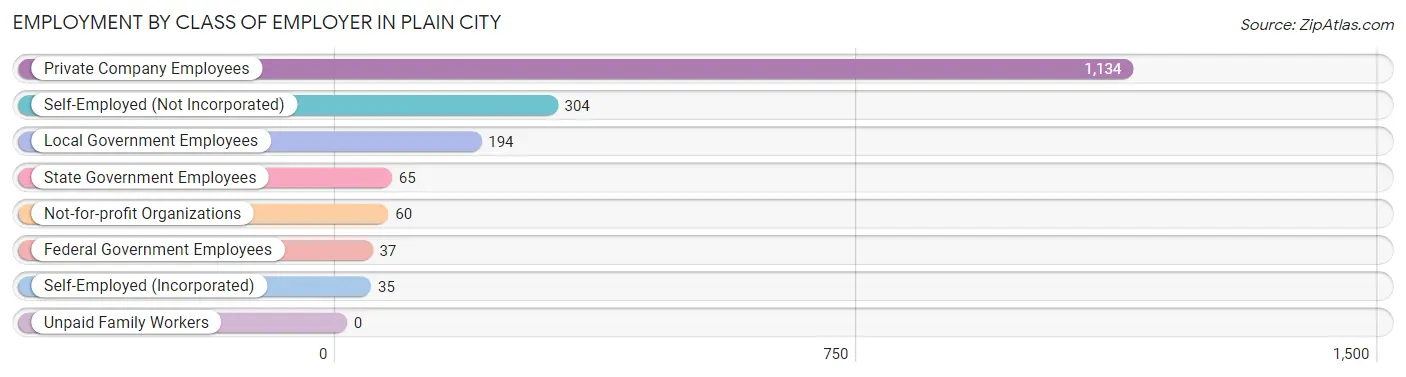
| Employer Class | # Employees | % Employees |
| Private Company Employees | 1,134 | 62.0% |
| Self-Employed (Incorporated) | 35 | 1.9% |
| Self-Employed (Not Incorporated) | 304 | 16.6% |
| Not-for-profit Organizations | 60 | 3.3% |
| Local Government Employees | 194 | 10.6% |
| State Government Employees | 65 | 3.5% |
| Federal Government Employees | 37 | 2.0% |
| Unpaid Family Workers | 0 | 0.0% |
| Total | 1,829 | 100.0% |
Employment Status by Age in Plain City
According to the labor force statistics for Plain City, out of the total population over 16 years of age (2,811), 65.8% or 1,850 individuals are in the labor force, with 1.2% or 22 of them unemployed. The age group with the highest labor force participation rate is 20 to 24 years, with 100.0% or 196 individuals in the labor force. Within the labor force, the 20 to 24 years age range has the highest percentage of unemployed individuals, with 11.2% or 22 of them being unemployed.
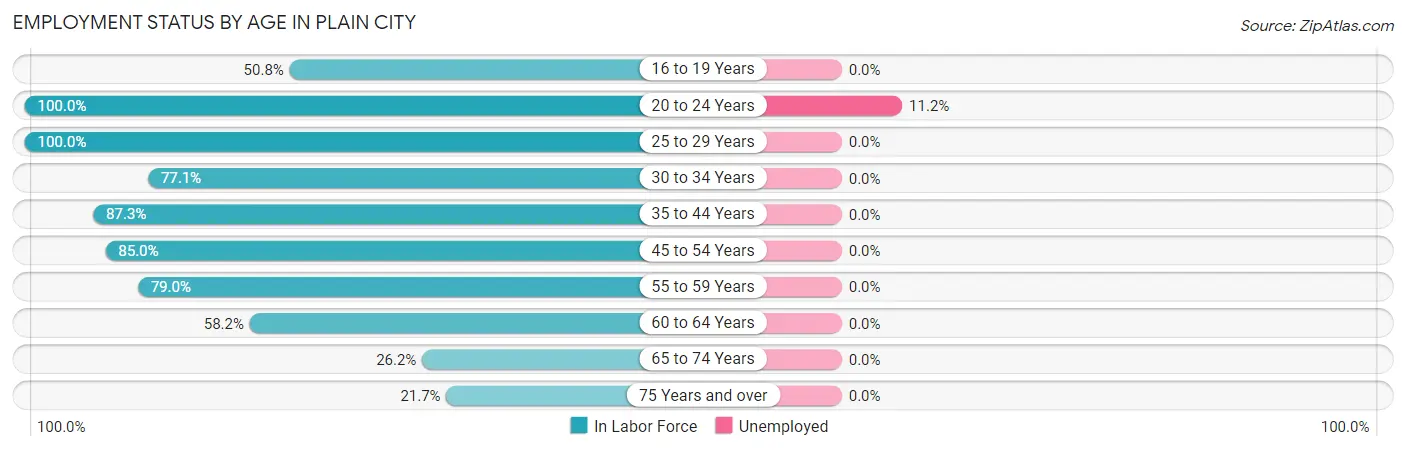
| Age Bracket | In Labor Force | Unemployed |
| 16 to 19 Years | 66 (50.8%) | 0 (0.0%) |
| 20 to 24 Years | 196 (100.0%) | 22 (11.2%) |
| 25 to 29 Years | 98 (100.0%) | 0 (0.0%) |
| 30 to 34 Years | 341 (77.1%) | 0 (0.0%) |
| 35 to 44 Years | 393 (87.3%) | 0 (0.0%) |
| 45 to 54 Years | 273 (85.0%) | 0 (0.0%) |
| 55 to 59 Years | 192 (79.0%) | 0 (0.0%) |
| 60 to 64 Years | 124 (58.2%) | 0 (0.0%) |
| 65 to 74 Years | 70 (26.2%) | 0 (0.0%) |
| 75 Years and over | 98 (21.7%) | 0 (0.0%) |
| Total | 1,850 (65.8%) | 22 (1.2%) |
Employment Status by Educational Attainment in Plain City
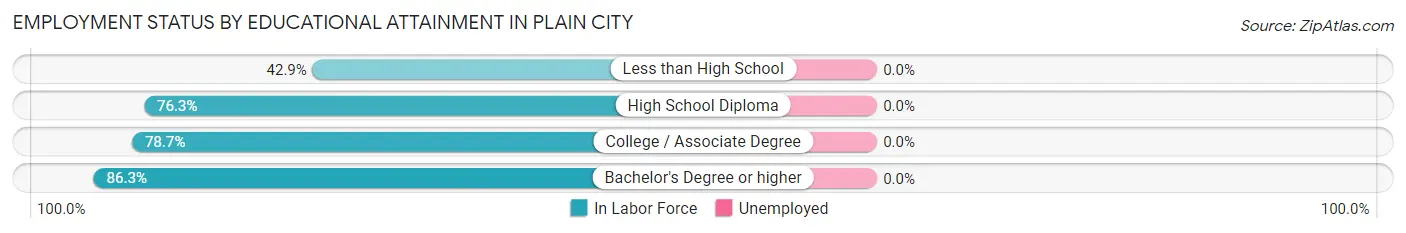
| Educational Attainment | In Labor Force | Unemployed |
| Less than High School | 12 (42.9%) | 0 (0.0%) |
| High School Diploma | 303 (76.3%) | 0 (0.0%) |
| College / Associate Degree | 540 (78.7%) | 0 (0.0%) |
| Bachelor's Degree or higher | 566 (86.3%) | 0 (0.0%) |
| Total | 1,421 (80.4%) | 0 (0.0%) |
Employment Occupations by Sex in Plain City
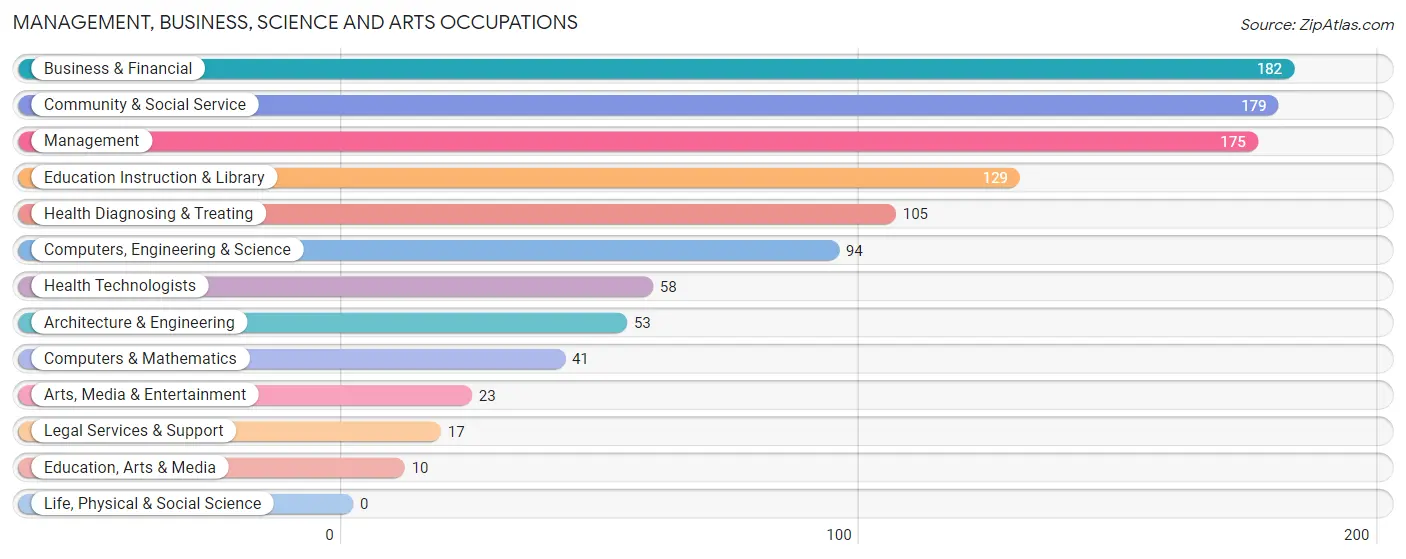
Management, Business, Science and Arts Occupations
The most common Management, Business, Science and Arts occupations in Plain City are Business & Financial (182 | 10.0%), Community & Social Service (179 | 9.8%), Management (175 | 9.6%), Education Instruction & Library (129 | 7.0%), and Health Diagnosing & Treating (105 | 5.7%).
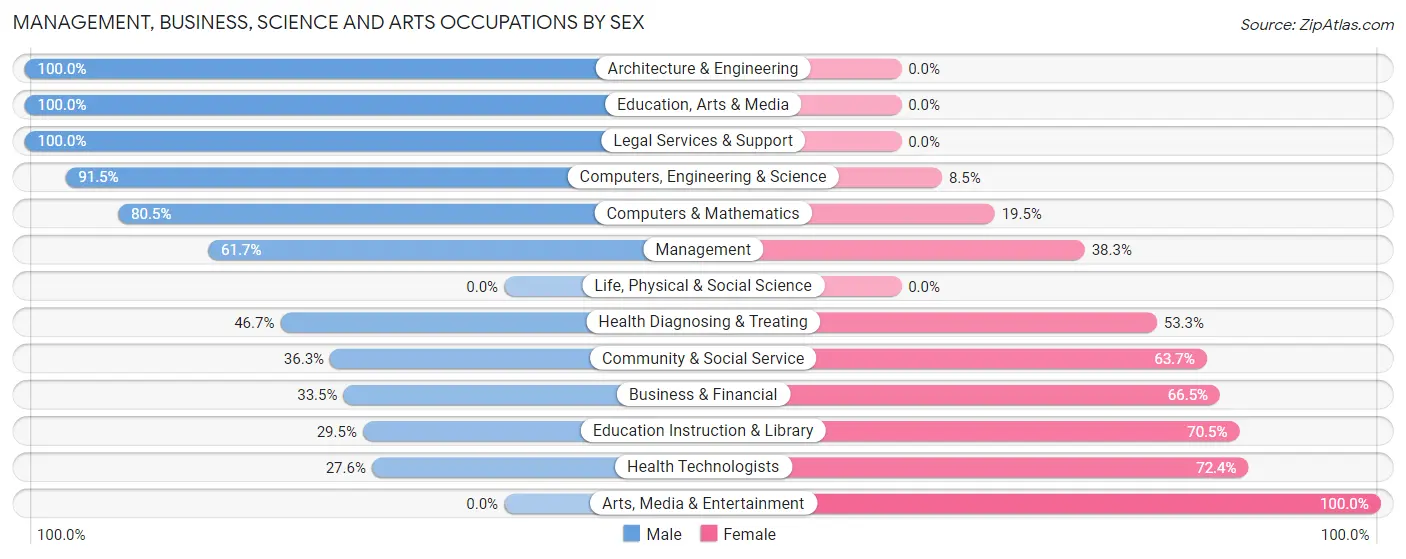
Management, Business, Science and Arts Occupations by Sex
Within the Management, Business, Science and Arts occupations in Plain City, the most male-oriented occupations are Architecture & Engineering (100.0%), Education, Arts & Media (100.0%), and Legal Services & Support (100.0%), while the most female-oriented occupations are Arts, Media & Entertainment (100.0%), Health Technologists (72.4%), and Education Instruction & Library (70.5%).
| Occupation | Male | Female |
| Management | 108 (61.7%) | 67 (38.3%) |
| Business & Financial | 61 (33.5%) | 121 (66.5%) |
| Computers, Engineering & Science | 86 (91.5%) | 8 (8.5%) |
| Computers & Mathematics | 33 (80.5%) | 8 (19.5%) |
| Architecture & Engineering | 53 (100.0%) | 0 (0.0%) |
| Life, Physical & Social Science | 0 (0.0%) | 0 (0.0%) |
| Community & Social Service | 65 (36.3%) | 114 (63.7%) |
| Education, Arts & Media | 10 (100.0%) | 0 (0.0%) |
| Legal Services & Support | 17 (100.0%) | 0 (0.0%) |
| Education Instruction & Library | 38 (29.5%) | 91 (70.5%) |
| Arts, Media & Entertainment | 0 (0.0%) | 23 (100.0%) |
| Health Diagnosing & Treating | 49 (46.7%) | 56 (53.3%) |
| Health Technologists | 16 (27.6%) | 42 (72.4%) |
| Total (Category) | 369 (50.2%) | 366 (49.8%) |
| Total (Overall) | 1,089 (59.5%) | 740 (40.5%) |
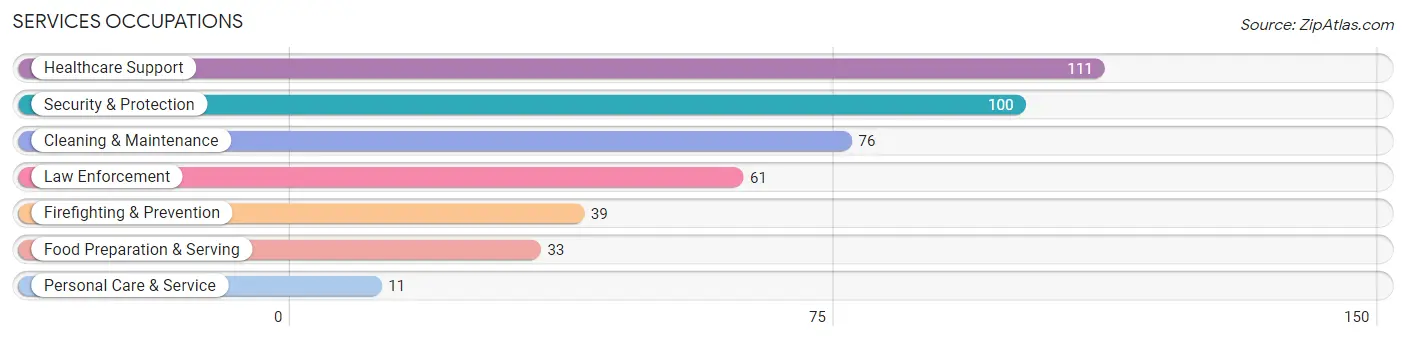
Services Occupations
The most common Services occupations in Plain City are Healthcare Support (111 | 6.1%), Security & Protection (100 | 5.5%), Cleaning & Maintenance (76 | 4.2%), Law Enforcement (61 | 3.3%), and Firefighting & Prevention (39 | 2.1%).
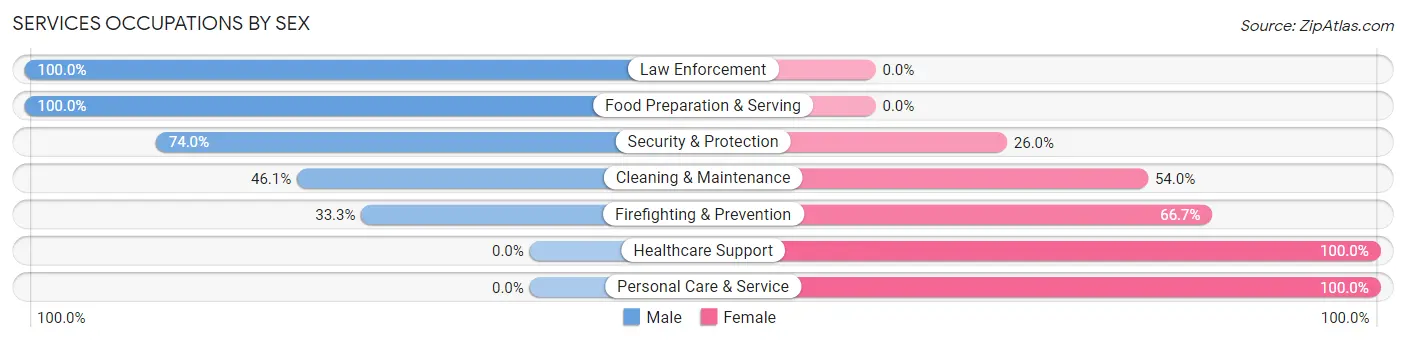
Services Occupations by Sex
Within the Services occupations in Plain City, the most male-oriented occupations are Law Enforcement (100.0%), Food Preparation & Serving (100.0%), and Security & Protection (74.0%), while the most female-oriented occupations are Healthcare Support (100.0%), Personal Care & Service (100.0%), and Firefighting & Prevention (66.7%).
| Occupation | Male | Female |
| Healthcare Support | 0 (0.0%) | 111 (100.0%) |
| Security & Protection | 74 (74.0%) | 26 (26.0%) |
| Firefighting & Prevention | 13 (33.3%) | 26 (66.7%) |
| Law Enforcement | 61 (100.0%) | 0 (0.0%) |
| Food Preparation & Serving | 33 (100.0%) | 0 (0.0%) |
| Cleaning & Maintenance | 35 (46.1%) | 41 (53.9%) |
| Personal Care & Service | 0 (0.0%) | 11 (100.0%) |
| Total (Category) | 142 (42.9%) | 189 (57.1%) |
| Total (Overall) | 1,089 (59.5%) | 740 (40.5%) |
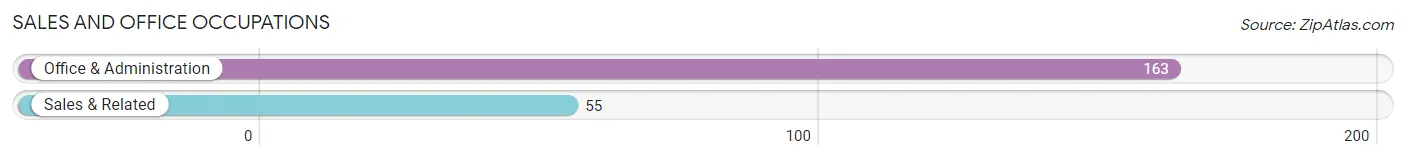
Sales and Office Occupations
The most common Sales and Office occupations in Plain City are Office & Administration (163 | 8.9%), and Sales & Related (55 | 3.0%).
Sales and Office Occupations by Sex
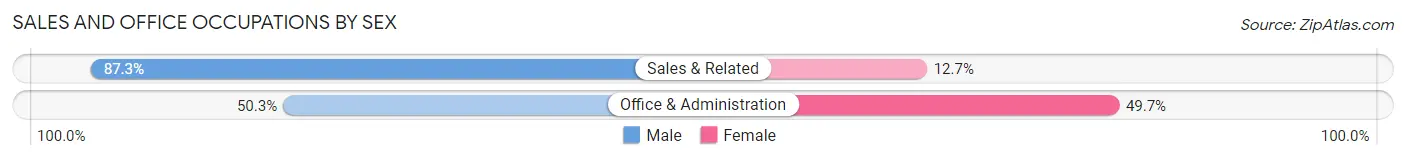
| Occupation | Male | Female |
| Sales & Related | 48 (87.3%) | 7 (12.7%) |
| Office & Administration | 82 (50.3%) | 81 (49.7%) |
| Total (Category) | 130 (59.6%) | 88 (40.4%) |
| Total (Overall) | 1,089 (59.5%) | 740 (40.5%) |
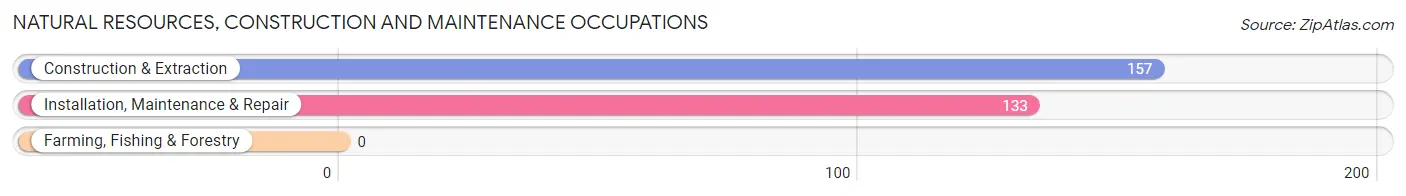
Natural Resources, Construction and Maintenance Occupations
The most common Natural Resources, Construction and Maintenance occupations in Plain City are Construction & Extraction (157 | 8.6%), and Installation, Maintenance & Repair (133 | 7.3%).
Natural Resources, Construction and Maintenance Occupations by Sex
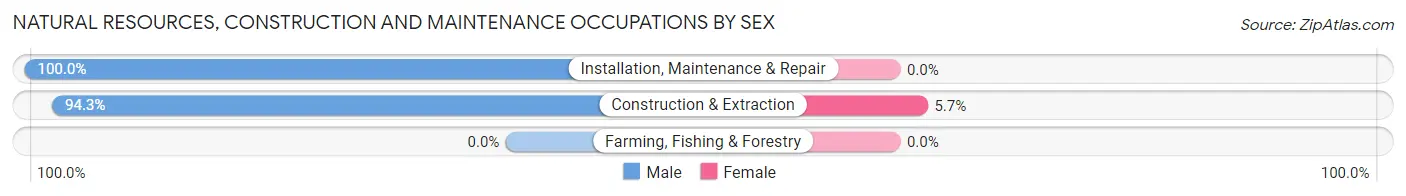
| Occupation | Male | Female |
| Farming, Fishing & Forestry | 0 (0.0%) | 0 (0.0%) |
| Construction & Extraction | 148 (94.3%) | 9 (5.7%) |
| Installation, Maintenance & Repair | 133 (100.0%) | 0 (0.0%) |
| Total (Category) | 281 (96.9%) | 9 (3.1%) |
| Total (Overall) | 1,089 (59.5%) | 740 (40.5%) |
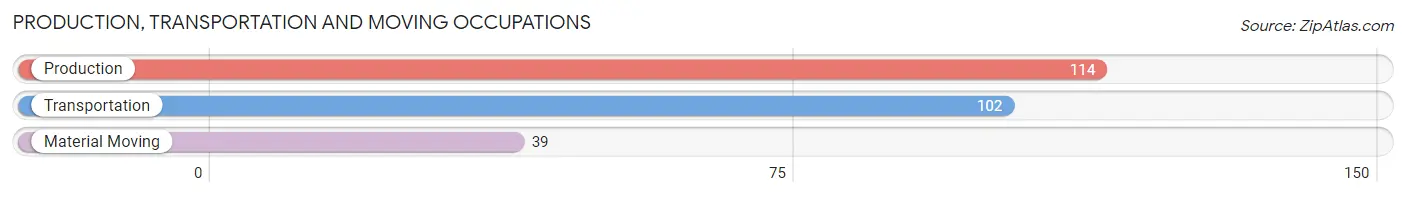
Production, Transportation and Moving Occupations
The most common Production, Transportation and Moving occupations in Plain City are Production (114 | 6.2%), Transportation (102 | 5.6%), and Material Moving (39 | 2.1%).
Production, Transportation and Moving Occupations by Sex
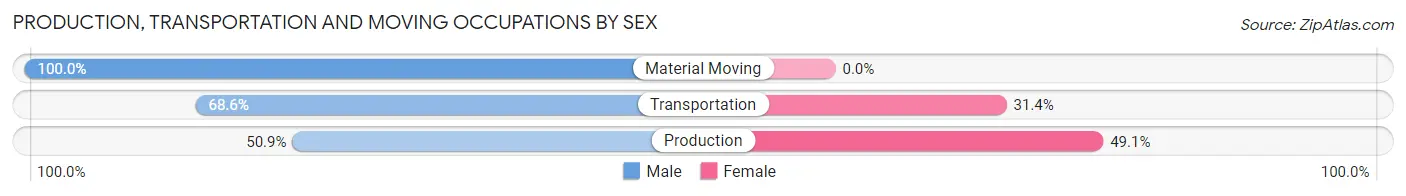
| Occupation | Male | Female |
| Production | 58 (50.9%) | 56 (49.1%) |
| Transportation | 70 (68.6%) | 32 (31.4%) |
| Material Moving | 39 (100.0%) | 0 (0.0%) |
| Total (Category) | 167 (65.5%) | 88 (34.5%) |
| Total (Overall) | 1,089 (59.5%) | 740 (40.5%) |
Employment Industries by Sex in Plain City
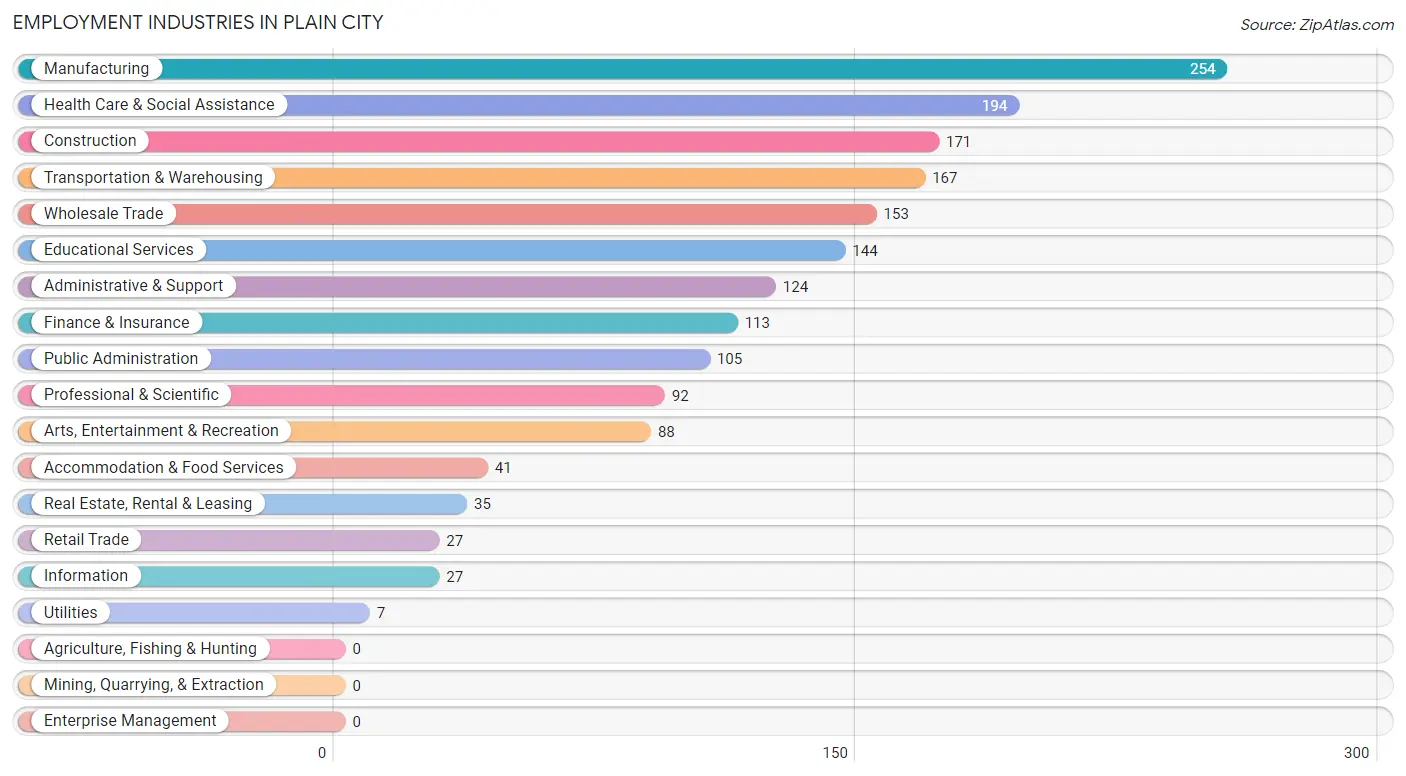
Employment Industries in Plain City
The major employment industries in Plain City include Manufacturing (254 | 13.9%), Health Care & Social Assistance (194 | 10.6%), Construction (171 | 9.3%), Transportation & Warehousing (167 | 9.1%), and Wholesale Trade (153 | 8.4%).
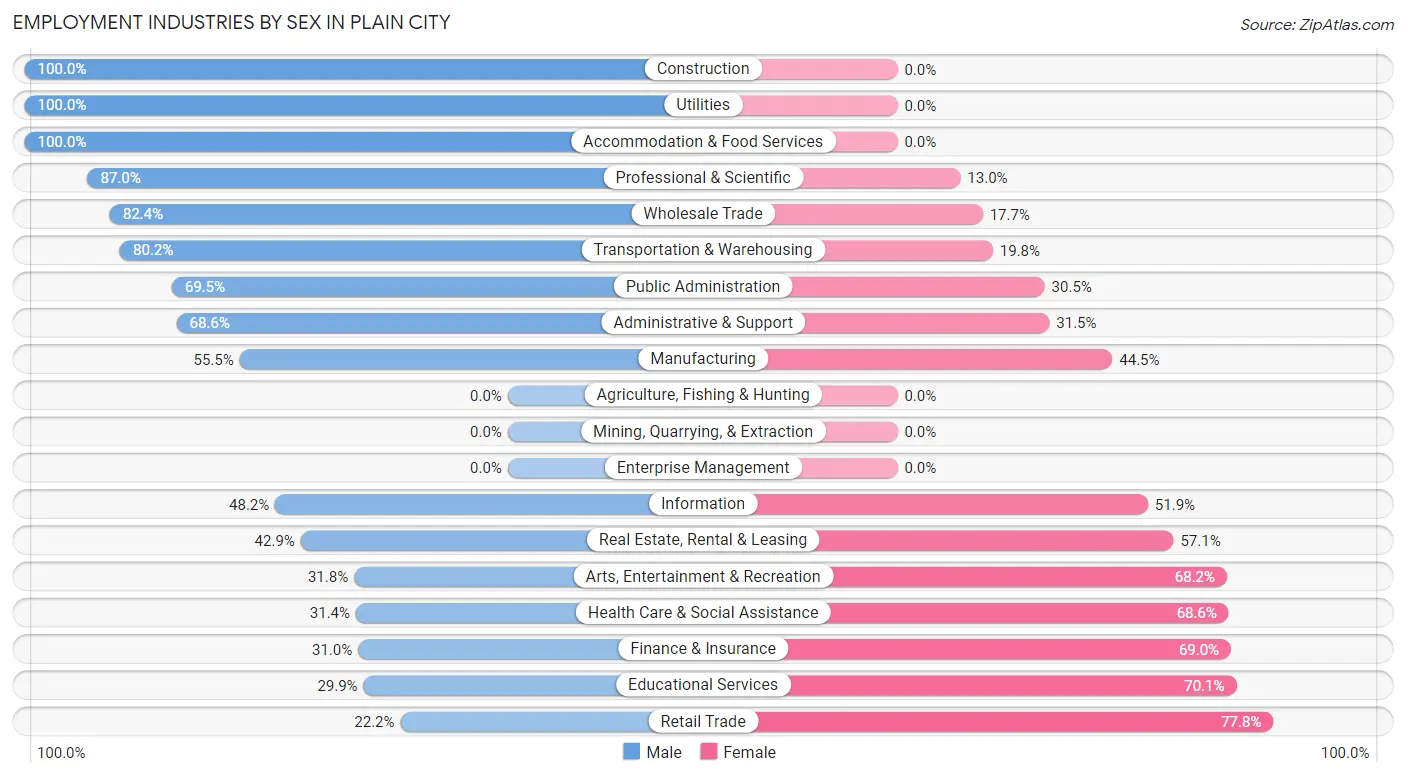
Employment Industries by Sex in Plain City
The Plain City industries that see more men than women are Construction (100.0%), Utilities (100.0%), and Accommodation & Food Services (100.0%), whereas the industries that tend to have a higher number of women are Retail Trade (77.8%), Educational Services (70.1%), and Finance & Insurance (69.0%).
| Industry | Male | Female |
| Agriculture, Fishing & Hunting | 0 (0.0%) | 0 (0.0%) |
| Mining, Quarrying, & Extraction | 0 (0.0%) | 0 (0.0%) |
| Construction | 171 (100.0%) | 0 (0.0%) |
| Manufacturing | 141 (55.5%) | 113 (44.5%) |
| Wholesale Trade | 126 (82.4%) | 27 (17.6%) |
| Retail Trade | 6 (22.2%) | 21 (77.8%) |
| Transportation & Warehousing | 134 (80.2%) | 33 (19.8%) |
| Utilities | 7 (100.0%) | 0 (0.0%) |
| Information | 13 (48.1%) | 14 (51.8%) |
| Finance & Insurance | 35 (31.0%) | 78 (69.0%) |
| Real Estate, Rental & Leasing | 15 (42.9%) | 20 (57.1%) |
| Professional & Scientific | 80 (87.0%) | 12 (13.0%) |
| Enterprise Management | 0 (0.0%) | 0 (0.0%) |
| Administrative & Support | 85 (68.5%) | 39 (31.5%) |
| Educational Services | 43 (29.9%) | 101 (70.1%) |
| Health Care & Social Assistance | 61 (31.4%) | 133 (68.6%) |
| Arts, Entertainment & Recreation | 28 (31.8%) | 60 (68.2%) |
| Accommodation & Food Services | 41 (100.0%) | 0 (0.0%) |
| Public Administration | 73 (69.5%) | 32 (30.5%) |
| Total | 1,089 (59.5%) | 740 (40.5%) |
Education in Plain City
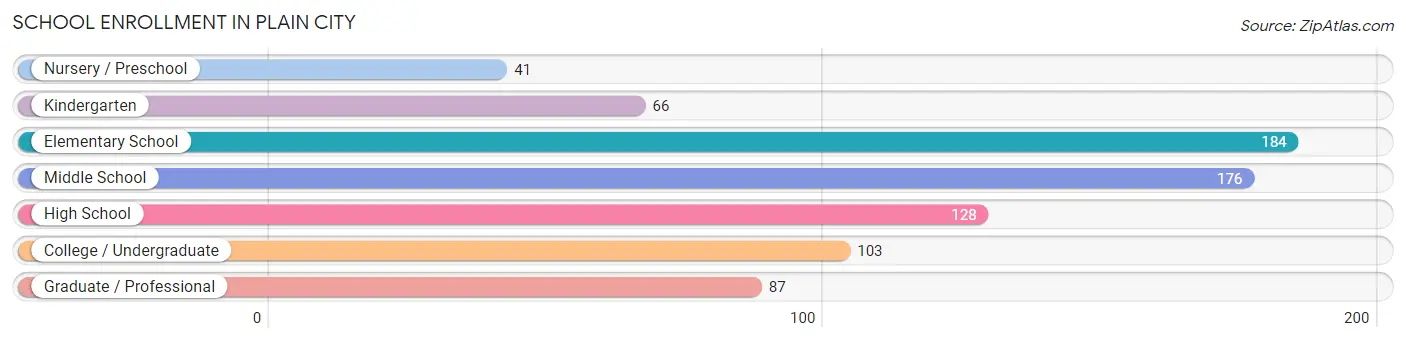
School Enrollment in Plain City
The most common levels of schooling among the 785 students in Plain City are elementary school (184 | 23.4%), middle school (176 | 22.4%), and high school (128 | 16.3%).
| School Level | # Students | % Students |
| Nursery / Preschool | 41 | 5.2% |
| Kindergarten | 66 | 8.4% |
| Elementary School | 184 | 23.4% |
| Middle School | 176 | 22.4% |
| High School | 128 | 16.3% |
| College / Undergraduate | 103 | 13.1% |
| Graduate / Professional | 87 | 11.1% |
| Total | 785 | 100.0% |
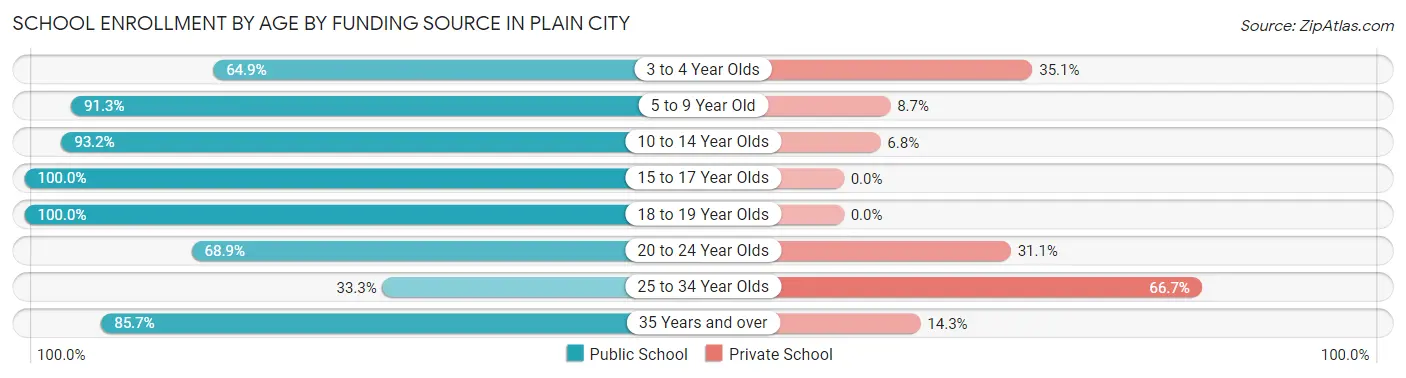
School Enrollment by Age by Funding Source in Plain City
Out of a total of 785 students who are enrolled in schools in Plain City, 99 (12.6%) attend a private institution, while the remaining 686 (87.4%) are enrolled in public schools. The age group of 25 to 34 year olds has the highest likelihood of being enrolled in private schools, with 18 (66.7% in the age bracket) enrolled. Conversely, the age group of 15 to 17 year olds has the lowest likelihood of being enrolled in a private school, with 122 (100.0% in the age bracket) attending a public institution.
| Age Bracket | Public School | Private School |
| 3 to 4 Year Olds | 24 (64.9%) | 13 (35.1%) |
| 5 to 9 Year Old | 179 (91.3%) | 17 (8.7%) |
| 10 to 14 Year Olds | 218 (93.2%) | 16 (6.8%) |
| 15 to 17 Year Olds | 122 (100.0%) | 0 (0.0%) |
| 18 to 19 Year Olds | 30 (100.0%) | 0 (0.0%) |
| 20 to 24 Year Olds | 62 (68.9%) | 28 (31.1%) |
| 25 to 34 Year Olds | 9 (33.3%) | 18 (66.7%) |
| 35 Years and over | 42 (85.7%) | 7 (14.3%) |
| Total | 686 (87.4%) | 99 (12.6%) |
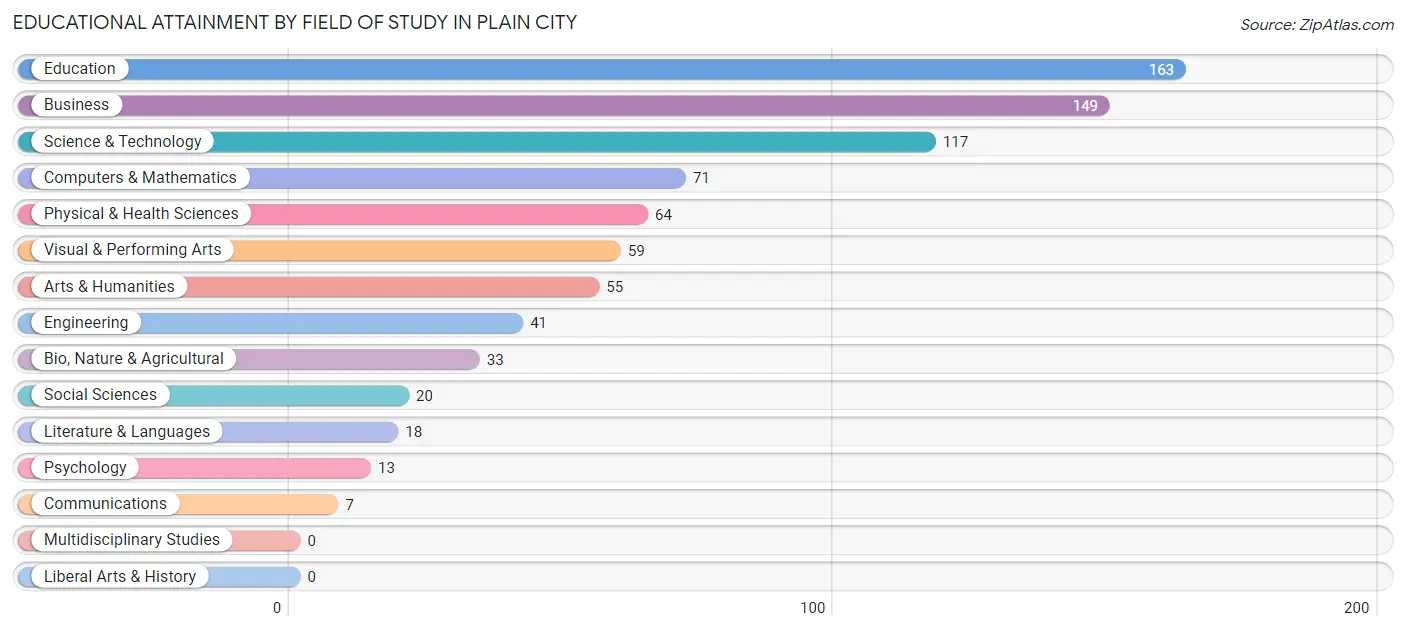
Educational Attainment by Field of Study in Plain City
Education (163 | 20.1%), business (149 | 18.4%), science & technology (117 | 14.4%), computers & mathematics (71 | 8.8%), and physical & health sciences (64 | 7.9%) are the most common fields of study among 810 individuals in Plain City who have obtained a bachelor's degree or higher.
| Field of Study | # Graduates | % Graduates |
| Computers & Mathematics | 71 | 8.8% |
| Bio, Nature & Agricultural | 33 | 4.1% |
| Physical & Health Sciences | 64 | 7.9% |
| Psychology | 13 | 1.6% |
| Social Sciences | 20 | 2.5% |
| Engineering | 41 | 5.1% |
| Multidisciplinary Studies | 0 | 0.0% |
| Science & Technology | 117 | 14.4% |
| Business | 149 | 18.4% |
| Education | 163 | 20.1% |
| Literature & Languages | 18 | 2.2% |
| Liberal Arts & History | 0 | 0.0% |
| Visual & Performing Arts | 59 | 7.3% |
| Communications | 7 | 0.9% |
| Arts & Humanities | 55 | 6.8% |
| Total | 810 | 100.0% |
Transportation & Commute in Plain City
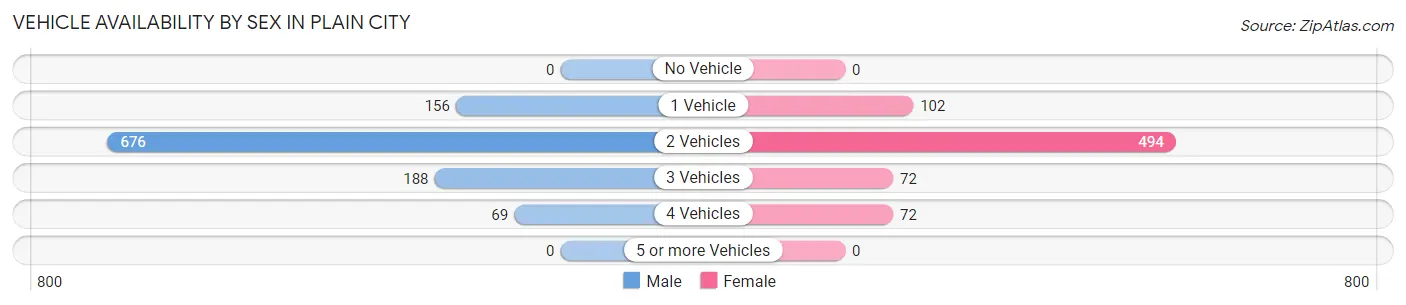
Vehicle Availability by Sex in Plain City
The most prevalent vehicle ownership categories in Plain City are males with 2 vehicles (676, accounting for 62.1%) and females with 2 vehicles (494, making up 91.3%).
| Vehicles Available | Male | Female |
| No Vehicle | 0 (0.0%) | 0 (0.0%) |
| 1 Vehicle | 156 (14.3%) | 102 (13.8%) |
| 2 Vehicles | 676 (62.1%) | 494 (66.8%) |
| 3 Vehicles | 188 (17.3%) | 72 (9.7%) |
| 4 Vehicles | 69 (6.3%) | 72 (9.7%) |
| 5 or more Vehicles | 0 (0.0%) | 0 (0.0%) |
| Total | 1,089 (100.0%) | 740 (100.0%) |
Commute Time in Plain City
The most frequently occuring commute durations in Plain City are 20 to 24 minutes (323 commuters, 20.2%), 10 to 14 minutes (288 commuters, 18.0%), and 30 to 34 minutes (274 commuters, 17.2%).
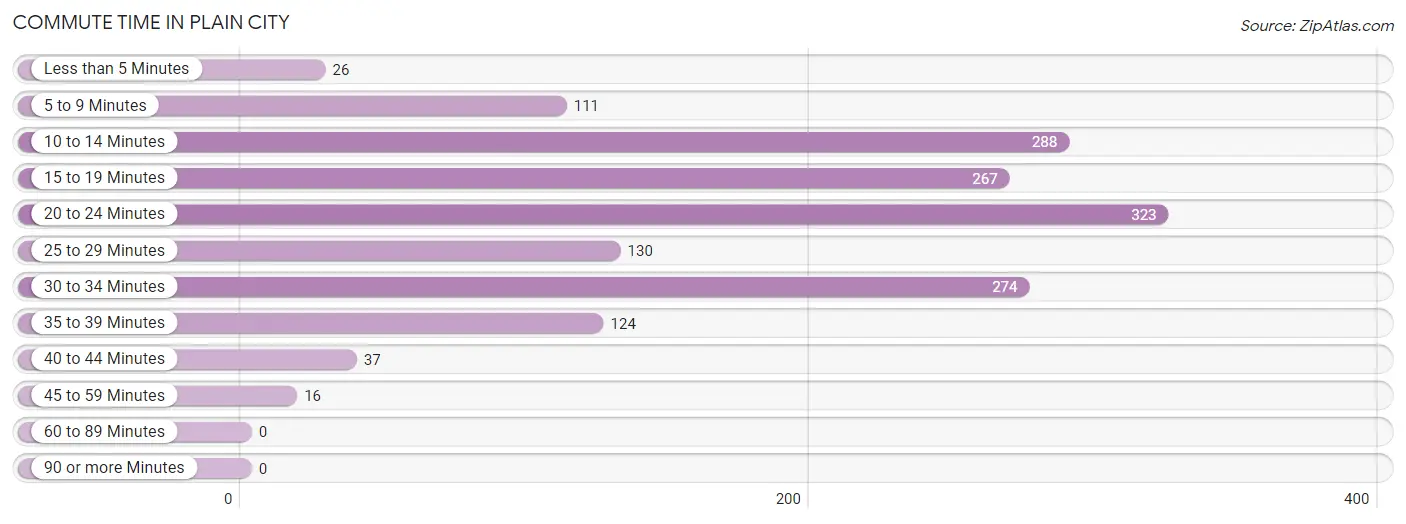
| Commute Time | # Commuters | % Commuters |
| Less than 5 Minutes | 26 | 1.6% |
| 5 to 9 Minutes | 111 | 7.0% |
| 10 to 14 Minutes | 288 | 18.0% |
| 15 to 19 Minutes | 267 | 16.7% |
| 20 to 24 Minutes | 323 | 20.2% |
| 25 to 29 Minutes | 130 | 8.2% |
| 30 to 34 Minutes | 274 | 17.2% |
| 35 to 39 Minutes | 124 | 7.8% |
| 40 to 44 Minutes | 37 | 2.3% |
| 45 to 59 Minutes | 16 | 1.0% |
| 60 to 89 Minutes | 0 | 0.0% |
| 90 or more Minutes | 0 | 0.0% |
Commute Time by Sex in Plain City
The most common commute times in Plain City are 15 to 19 minutes (223 commuters, 22.9%) for males and 30 to 34 minutes (160 commuters, 25.6%) for females.
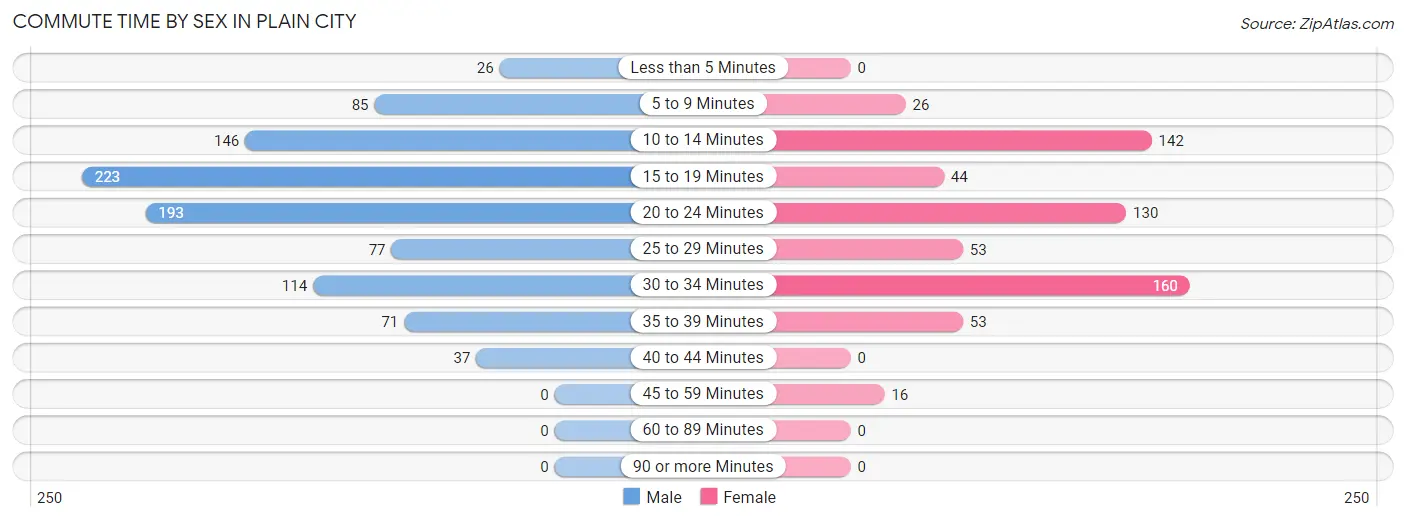
| Commute Time | Male | Female |
| Less than 5 Minutes | 26 (2.7%) | 0 (0.0%) |
| 5 to 9 Minutes | 85 (8.7%) | 26 (4.2%) |
| 10 to 14 Minutes | 146 (15.0%) | 142 (22.8%) |
| 15 to 19 Minutes | 223 (22.9%) | 44 (7.0%) |
| 20 to 24 Minutes | 193 (19.9%) | 130 (20.8%) |
| 25 to 29 Minutes | 77 (7.9%) | 53 (8.5%) |
| 30 to 34 Minutes | 114 (11.7%) | 160 (25.6%) |
| 35 to 39 Minutes | 71 (7.3%) | 53 (8.5%) |
| 40 to 44 Minutes | 37 (3.8%) | 0 (0.0%) |
| 45 to 59 Minutes | 0 (0.0%) | 16 (2.6%) |
| 60 to 89 Minutes | 0 (0.0%) | 0 (0.0%) |
| 90 or more Minutes | 0 (0.0%) | 0 (0.0%) |
Time of Departure to Work by Sex in Plain City
The most frequent times of departure to work in Plain City are 6:30 AM to 6:59 AM (156, 16.1%) for males and 7:00 AM to 7:29 AM (178, 28.5%) for females.
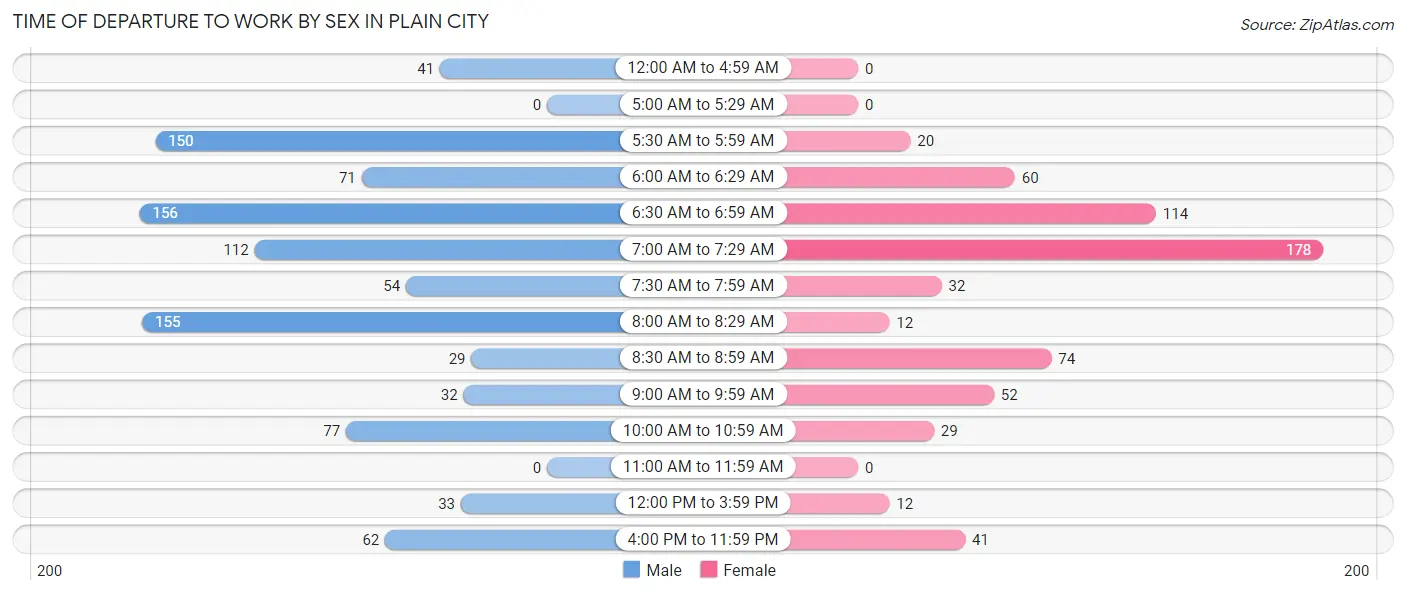
| Time of Departure | Male | Female |
| 12:00 AM to 4:59 AM | 41 (4.2%) | 0 (0.0%) |
| 5:00 AM to 5:29 AM | 0 (0.0%) | 0 (0.0%) |
| 5:30 AM to 5:59 AM | 150 (15.4%) | 20 (3.2%) |
| 6:00 AM to 6:29 AM | 71 (7.3%) | 60 (9.6%) |
| 6:30 AM to 6:59 AM | 156 (16.1%) | 114 (18.3%) |
| 7:00 AM to 7:29 AM | 112 (11.5%) | 178 (28.5%) |
| 7:30 AM to 7:59 AM | 54 (5.6%) | 32 (5.1%) |
| 8:00 AM to 8:29 AM | 155 (16.0%) | 12 (1.9%) |
| 8:30 AM to 8:59 AM | 29 (3.0%) | 74 (11.9%) |
| 9:00 AM to 9:59 AM | 32 (3.3%) | 52 (8.3%) |
| 10:00 AM to 10:59 AM | 77 (7.9%) | 29 (4.6%) |
| 11:00 AM to 11:59 AM | 0 (0.0%) | 0 (0.0%) |
| 12:00 PM to 3:59 PM | 33 (3.4%) | 12 (1.9%) |
| 4:00 PM to 11:59 PM | 62 (6.4%) | 41 (6.6%) |
| Total | 972 (100.0%) | 624 (100.0%) |
Housing Occupancy in Plain City
Occupancy by Ownership in Plain City
Of the total 1,544 dwellings in Plain City, owner-occupied units account for 1,054 (68.3%), while renter-occupied units make up 490 (31.7%).
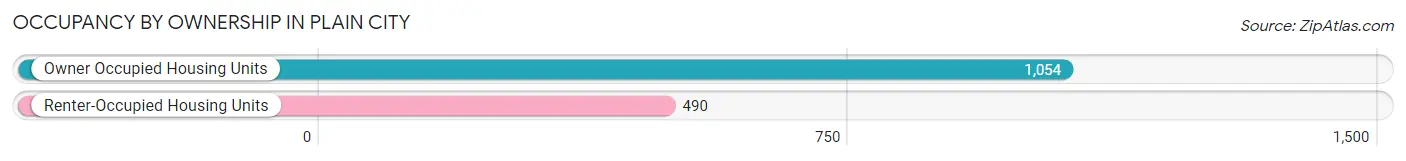
| Occupancy | # Housing Units | % Housing Units |
| Owner Occupied Housing Units | 1,054 | 68.3% |
| Renter-Occupied Housing Units | 490 | 31.7% |
| Total Occupied Housing Units | 1,544 | 100.0% |
Occupancy by Household Size in Plain City
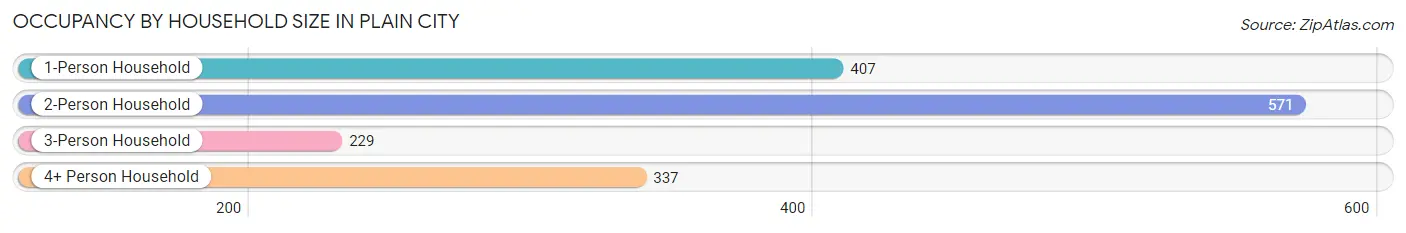
| Household Size | # Housing Units | % Housing Units |
| 1-Person Household | 407 | 26.4% |
| 2-Person Household | 571 | 37.0% |
| 3-Person Household | 229 | 14.8% |
| 4+ Person Household | 337 | 21.8% |
| Total Housing Units | 1,544 | 100.0% |
Occupancy by Ownership by Household Size in Plain City
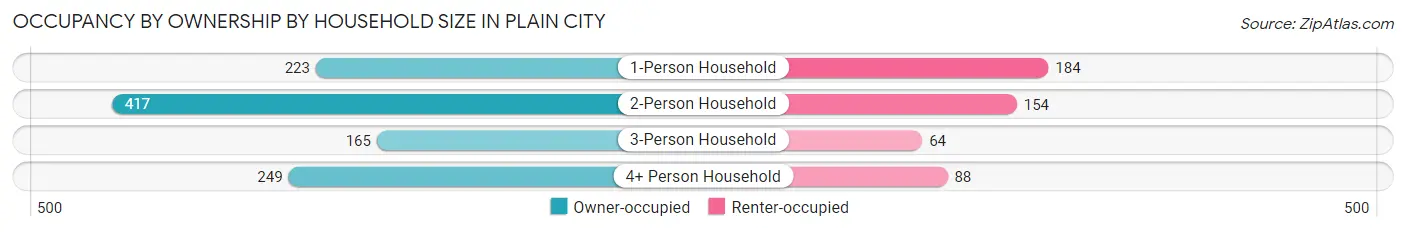
| Household Size | Owner-occupied | Renter-occupied |
| 1-Person Household | 223 (54.8%) | 184 (45.2%) |
| 2-Person Household | 417 (73.0%) | 154 (27.0%) |
| 3-Person Household | 165 (72.1%) | 64 (28.0%) |
| 4+ Person Household | 249 (73.9%) | 88 (26.1%) |
| Total Housing Units | 1,054 (68.3%) | 490 (31.7%) |
Occupancy by Educational Attainment in Plain City
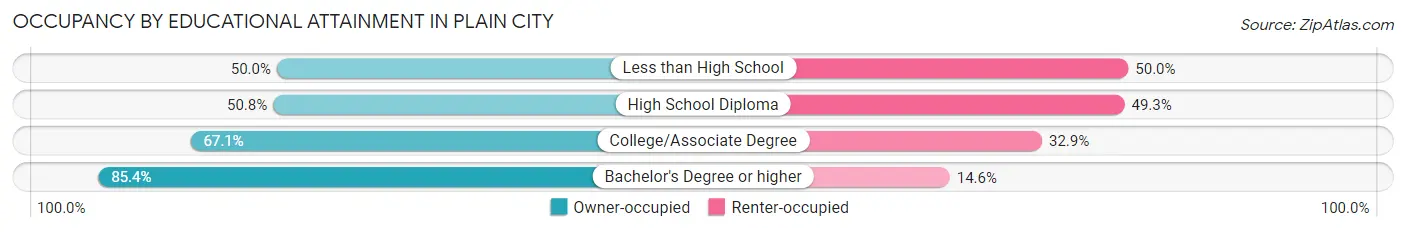
| Household Size | Owner-occupied | Renter-occupied |
| Less than High School | 23 (50.0%) | 23 (50.0%) |
| High School Diploma | 204 (50.7%) | 198 (49.2%) |
| College/Associate Degree | 400 (67.1%) | 196 (32.9%) |
| Bachelor's Degree or higher | 427 (85.4%) | 73 (14.6%) |
Occupancy by Age of Householder in Plain City
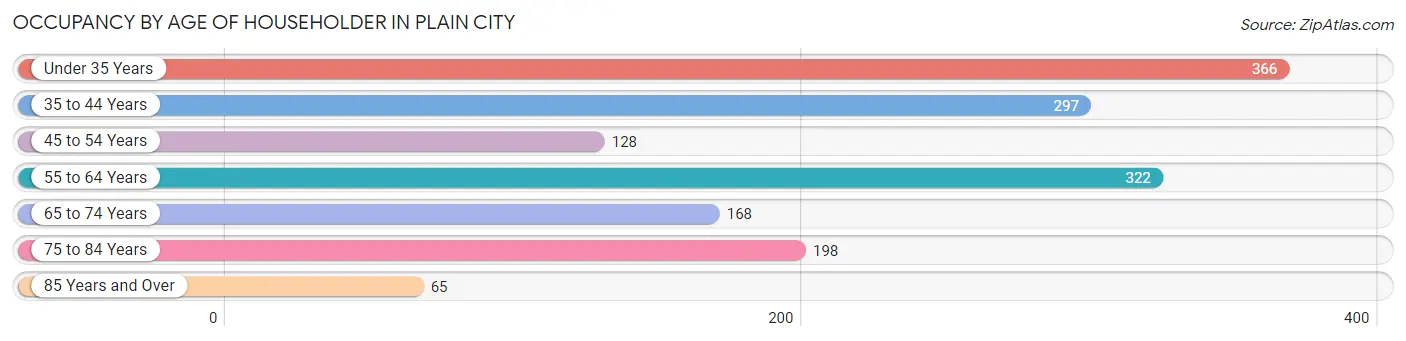
| Age Bracket | # Households | % Households |
| Under 35 Years | 366 | 23.7% |
| 35 to 44 Years | 297 | 19.2% |
| 45 to 54 Years | 128 | 8.3% |
| 55 to 64 Years | 322 | 20.8% |
| 65 to 74 Years | 168 | 10.9% |
| 75 to 84 Years | 198 | 12.8% |
| 85 Years and Over | 65 | 4.2% |
| Total | 1,544 | 100.0% |
Housing Finances in Plain City
Median Income by Occupancy in Plain City
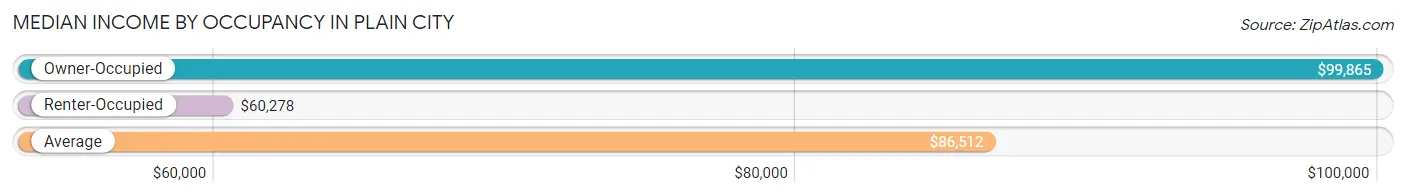
| Occupancy Type | # Households | Median Income |
| Owner-Occupied | 1,054 (68.3%) | $99,865 |
| Renter-Occupied | 490 (31.7%) | $60,278 |
| Average | 1,544 (100.0%) | $86,512 |
Occupancy by Householder Income Bracket in Plain City
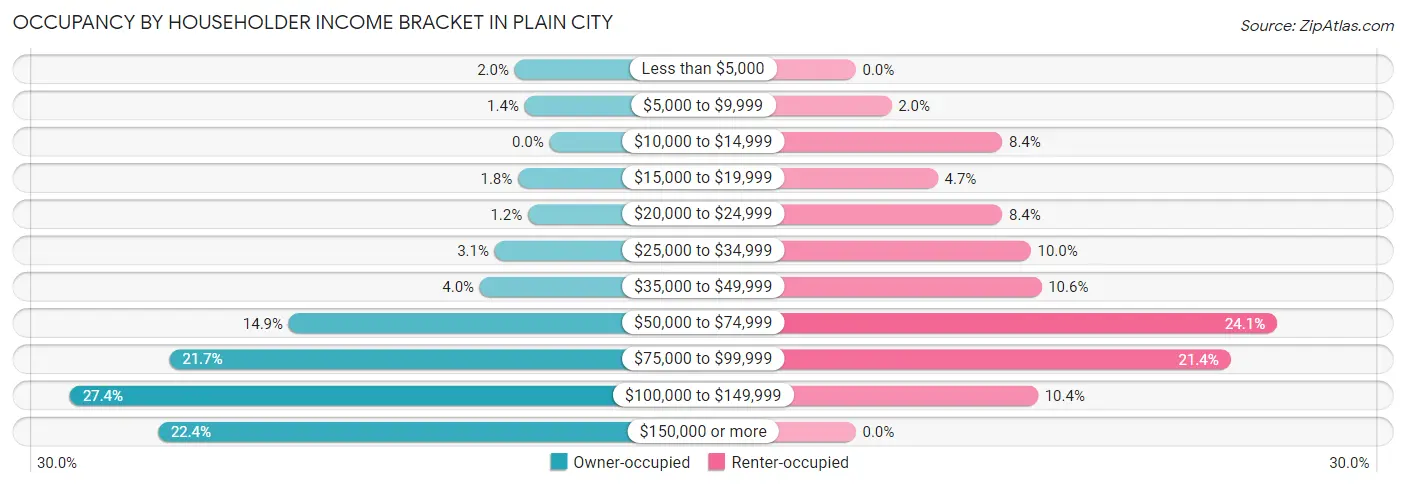
| Income Bracket | Owner-occupied | Renter-occupied |
| Less than $5,000 | 21 (2.0%) | 0 (0.0%) |
| $5,000 to $9,999 | 15 (1.4%) | 10 (2.0%) |
| $10,000 to $14,999 | 0 (0.0%) | 41 (8.4%) |
| $15,000 to $19,999 | 19 (1.8%) | 23 (4.7%) |
| $20,000 to $24,999 | 13 (1.2%) | 41 (8.4%) |
| $25,000 to $34,999 | 33 (3.1%) | 49 (10.0%) |
| $35,000 to $49,999 | 42 (4.0%) | 52 (10.6%) |
| $50,000 to $74,999 | 157 (14.9%) | 118 (24.1%) |
| $75,000 to $99,999 | 229 (21.7%) | 105 (21.4%) |
| $100,000 to $149,999 | 289 (27.4%) | 51 (10.4%) |
| $150,000 or more | 236 (22.4%) | 0 (0.0%) |
| Total | 1,054 (100.0%) | 490 (100.0%) |
Monthly Housing Cost Tiers in Plain City
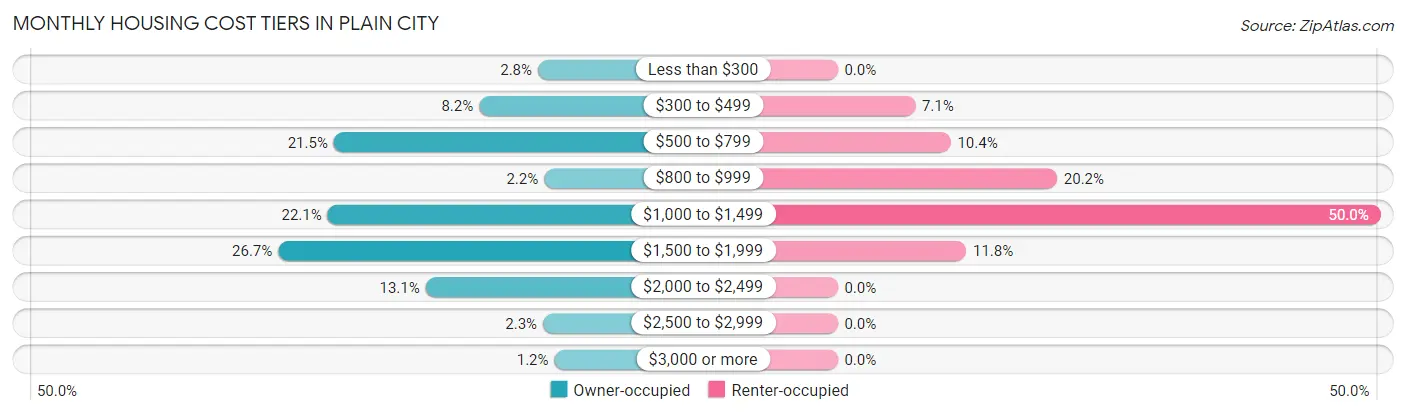
| Monthly Cost | Owner-occupied | Renter-occupied |
| Less than $300 | 29 (2.8%) | 0 (0.0%) |
| $300 to $499 | 86 (8.2%) | 35 (7.1%) |
| $500 to $799 | 227 (21.5%) | 51 (10.4%) |
| $800 to $999 | 23 (2.2%) | 99 (20.2%) |
| $1,000 to $1,499 | 233 (22.1%) | 245 (50.0%) |
| $1,500 to $1,999 | 281 (26.7%) | 58 (11.8%) |
| $2,000 to $2,499 | 138 (13.1%) | 0 (0.0%) |
| $2,500 to $2,999 | 24 (2.3%) | 0 (0.0%) |
| $3,000 or more | 13 (1.2%) | 0 (0.0%) |
| Total | 1,054 (100.0%) | 490 (100.0%) |
Physical Housing Characteristics in Plain City
Housing Structures in Plain City
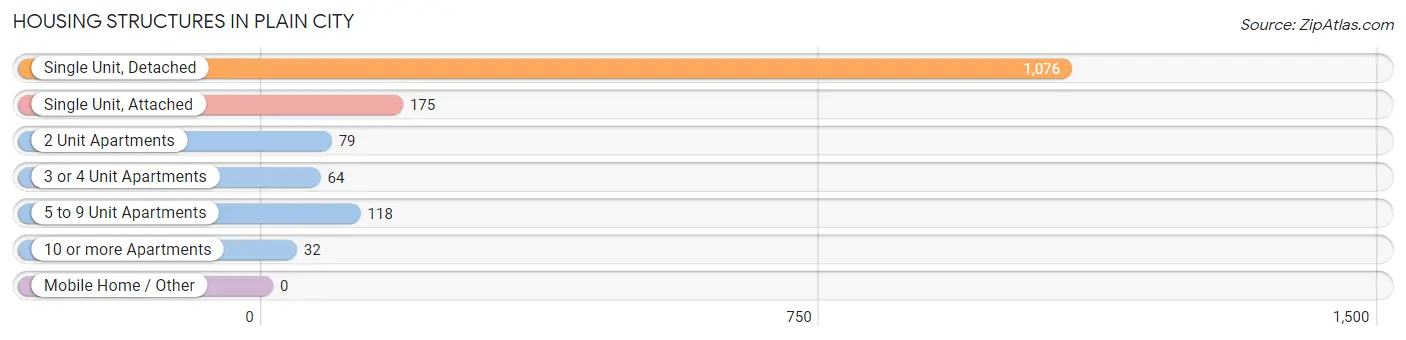
| Structure Type | # Housing Units | % Housing Units |
| Single Unit, Detached | 1,076 | 69.7% |
| Single Unit, Attached | 175 | 11.3% |
| 2 Unit Apartments | 79 | 5.1% |
| 3 or 4 Unit Apartments | 64 | 4.2% |
| 5 to 9 Unit Apartments | 118 | 7.6% |
| 10 or more Apartments | 32 | 2.1% |
| Mobile Home / Other | 0 | 0.0% |
| Total | 1,544 | 100.0% |
Housing Structures by Occupancy in Plain City
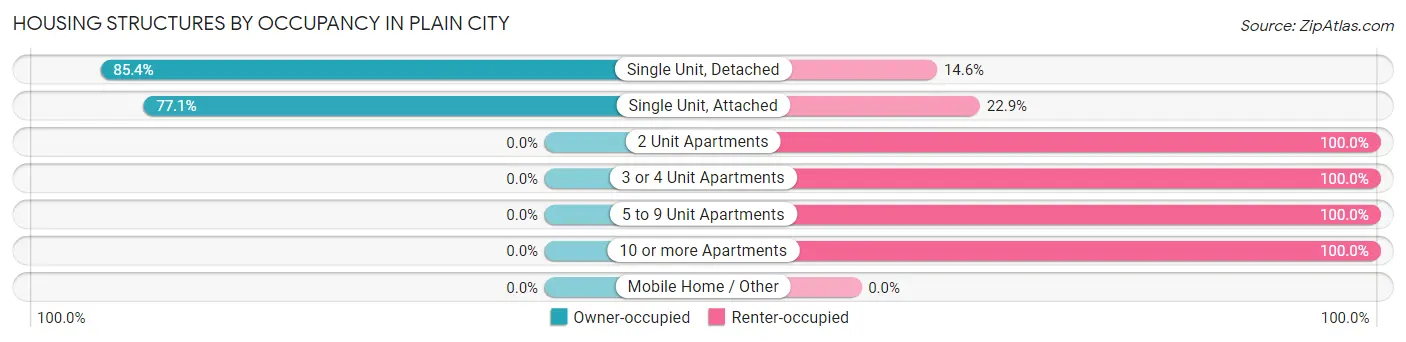
| Structure Type | Owner-occupied | Renter-occupied |
| Single Unit, Detached | 919 (85.4%) | 157 (14.6%) |
| Single Unit, Attached | 135 (77.1%) | 40 (22.9%) |
| 2 Unit Apartments | 0 (0.0%) | 79 (100.0%) |
| 3 or 4 Unit Apartments | 0 (0.0%) | 64 (100.0%) |
| 5 to 9 Unit Apartments | 0 (0.0%) | 118 (100.0%) |
| 10 or more Apartments | 0 (0.0%) | 32 (100.0%) |
| Mobile Home / Other | 0 (0.0%) | 0 (0.0%) |
| Total | 1,054 (68.3%) | 490 (31.7%) |
Housing Structures by Number of Rooms in Plain City
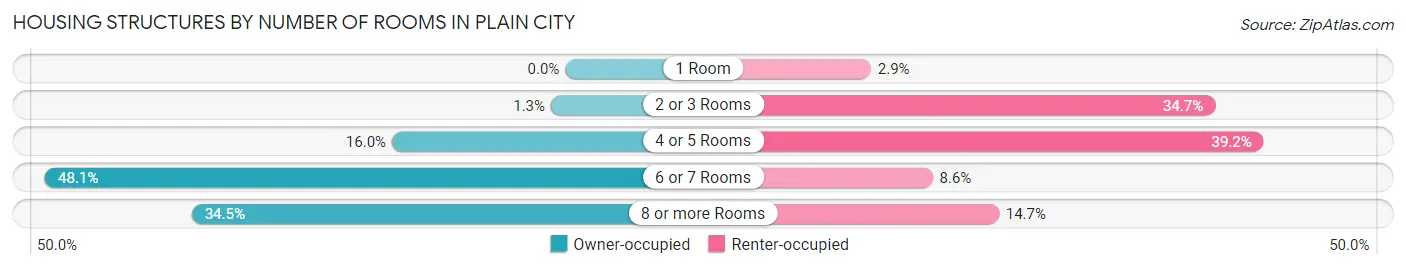
| Number of Rooms | Owner-occupied | Renter-occupied |
| 1 Room | 0 (0.0%) | 14 (2.9%) |
| 2 or 3 Rooms | 14 (1.3%) | 170 (34.7%) |
| 4 or 5 Rooms | 169 (16.0%) | 192 (39.2%) |
| 6 or 7 Rooms | 507 (48.1%) | 42 (8.6%) |
| 8 or more Rooms | 364 (34.5%) | 72 (14.7%) |
| Total | 1,054 (100.0%) | 490 (100.0%) |
Housing Structure by Heating Type in Plain City
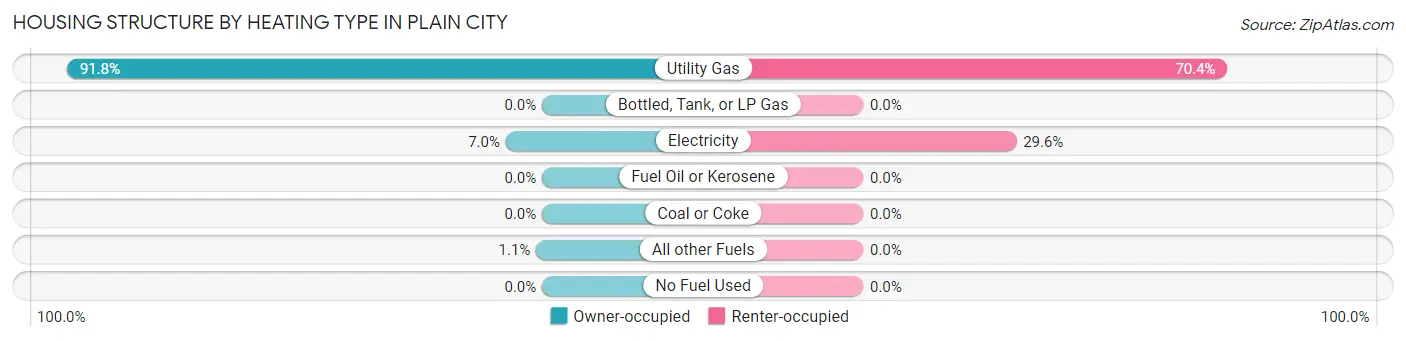
| Heating Type | Owner-occupied | Renter-occupied |
| Utility Gas | 968 (91.8%) | 345 (70.4%) |
| Bottled, Tank, or LP Gas | 0 (0.0%) | 0 (0.0%) |
| Electricity | 74 (7.0%) | 145 (29.6%) |
| Fuel Oil or Kerosene | 0 (0.0%) | 0 (0.0%) |
| Coal or Coke | 0 (0.0%) | 0 (0.0%) |
| All other Fuels | 12 (1.1%) | 0 (0.0%) |
| No Fuel Used | 0 (0.0%) | 0 (0.0%) |
| Total | 1,054 (100.0%) | 490 (100.0%) |
Household Vehicle Usage in Plain City
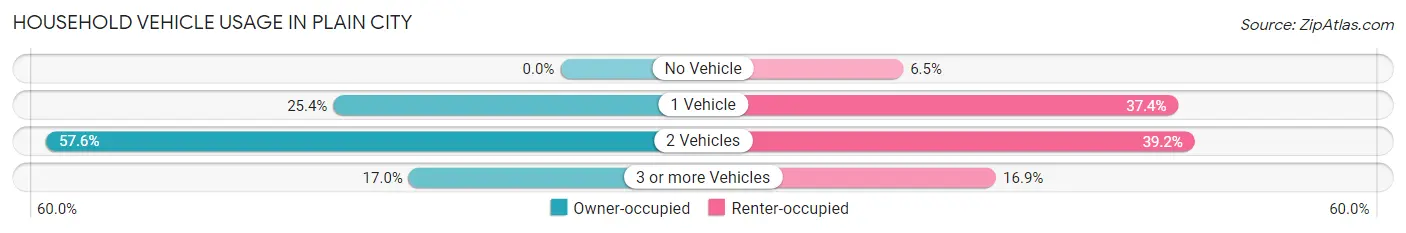
| Vehicles per Household | Owner-occupied | Renter-occupied |
| No Vehicle | 0 (0.0%) | 32 (6.5%) |
| 1 Vehicle | 268 (25.4%) | 183 (37.3%) |
| 2 Vehicles | 607 (57.6%) | 192 (39.2%) |
| 3 or more Vehicles | 179 (17.0%) | 83 (16.9%) |
| Total | 1,054 (100.0%) | 490 (100.0%) |
Real Estate & Mortgages in Plain City
Real Estate and Mortgage Overview in Plain City
| Characteristic | Without Mortgage | With Mortgage |
| Housing Units | 351 | 703 |
| Median Property Value | $186,900 | $315,000 |
| Median Household Income | $64,875 | $209 |
| Monthly Housing Costs | $557 | $13 |
| Real Estate Taxes | $2,538 | $0 |
Property Value by Mortgage Status in Plain City
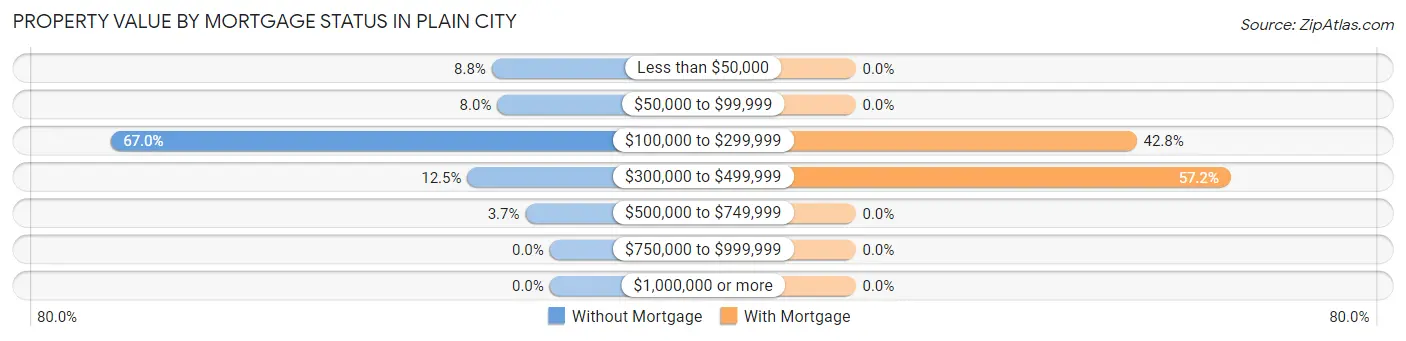
| Property Value | Without Mortgage | With Mortgage |
| Less than $50,000 | 31 (8.8%) | 0 (0.0%) |
| $50,000 to $99,999 | 28 (8.0%) | 0 (0.0%) |
| $100,000 to $299,999 | 235 (66.9%) | 301 (42.8%) |
| $300,000 to $499,999 | 44 (12.5%) | 402 (57.2%) |
| $500,000 to $749,999 | 13 (3.7%) | 0 (0.0%) |
| $750,000 to $999,999 | 0 (0.0%) | 0 (0.0%) |
| $1,000,000 or more | 0 (0.0%) | 0 (0.0%) |
| Total | 351 (100.0%) | 703 (100.0%) |
Household Income by Mortgage Status in Plain City
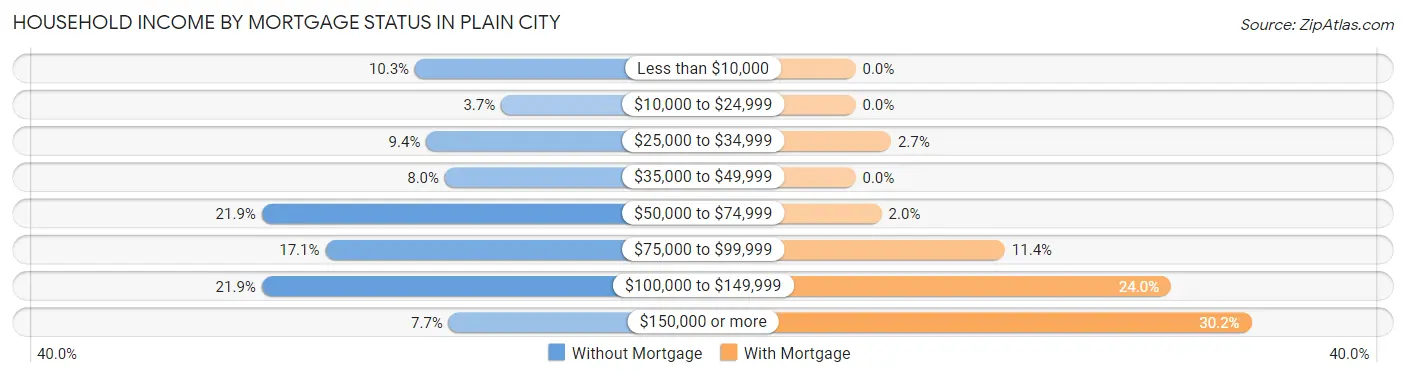
| Household Income | Without Mortgage | With Mortgage |
| Less than $10,000 | 36 (10.3%) | 0 (0.0%) |
| $10,000 to $24,999 | 13 (3.7%) | 0 (0.0%) |
| $25,000 to $34,999 | 33 (9.4%) | 19 (2.7%) |
| $35,000 to $49,999 | 28 (8.0%) | 0 (0.0%) |
| $50,000 to $74,999 | 77 (21.9%) | 14 (2.0%) |
| $75,000 to $99,999 | 60 (17.1%) | 80 (11.4%) |
| $100,000 to $149,999 | 77 (21.9%) | 169 (24.0%) |
| $150,000 or more | 27 (7.7%) | 212 (30.2%) |
| Total | 351 (100.0%) | 703 (100.0%) |
Property Value to Household Income Ratio in Plain City
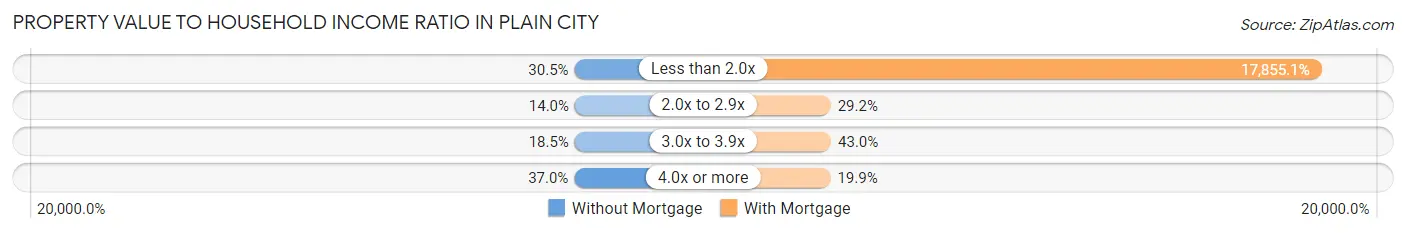
| Value-to-Income Ratio | Without Mortgage | With Mortgage |
| Less than 2.0x | 107 (30.5%) | 125,521 (17,855.0%) |
| 2.0x to 2.9x | 49 (14.0%) | 205 (29.2%) |
| 3.0x to 3.9x | 65 (18.5%) | 302 (43.0%) |
| 4.0x or more | 130 (37.0%) | 140 (19.9%) |
| Total | 351 (100.0%) | 703 (100.0%) |
Real Estate Taxes by Mortgage Status in Plain City
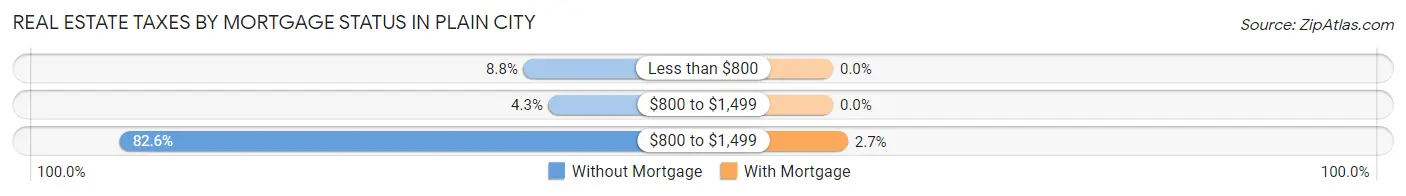
| Property Taxes | Without Mortgage | With Mortgage |
| Less than $800 | 31 (8.8%) | 0 (0.0%) |
| $800 to $1,499 | 15 (4.3%) | 0 (0.0%) |
| $800 to $1,499 | 290 (82.6%) | 19 (2.7%) |
| Total | 351 (100.0%) | 703 (100.0%) |
Health & Disability in Plain City
Health Insurance Coverage by Age in Plain City
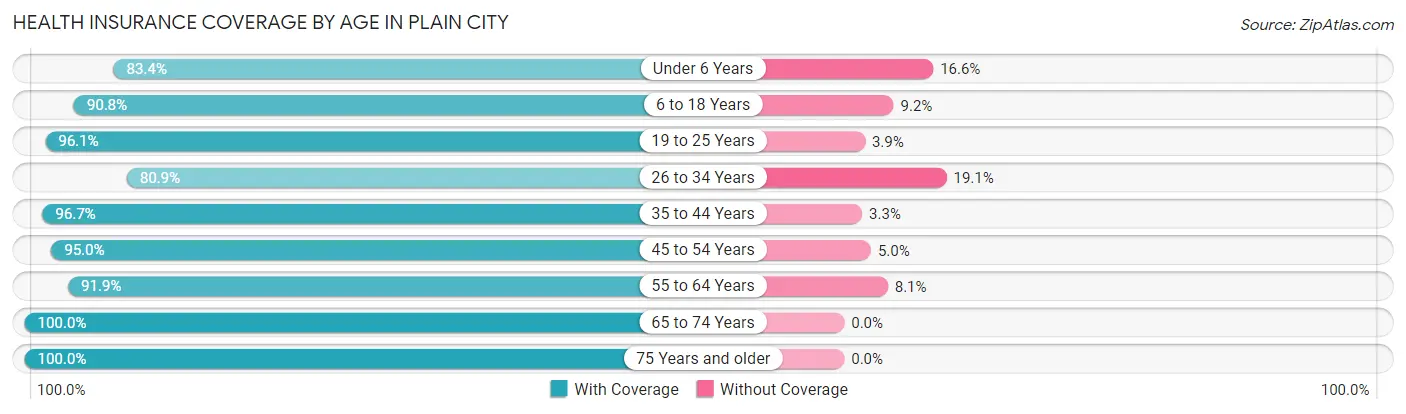
| Age Bracket | With Coverage | Without Coverage |
| Under 6 Years | 332 (83.4%) | 66 (16.6%) |
| 6 to 18 Years | 484 (90.8%) | 49 (9.2%) |
| 19 to 25 Years | 249 (96.1%) | 10 (3.9%) |
| 26 to 34 Years | 412 (80.9%) | 97 (19.1%) |
| 35 to 44 Years | 435 (96.7%) | 15 (3.3%) |
| 45 to 54 Years | 305 (95.0%) | 16 (5.0%) |
| 55 to 64 Years | 419 (91.9%) | 37 (8.1%) |
| 65 to 74 Years | 267 (100.0%) | 0 (0.0%) |
| 75 Years and older | 451 (100.0%) | 0 (0.0%) |
| Total | 3,354 (92.0%) | 290 (8.0%) |
Health Insurance Coverage by Citizenship Status in Plain City
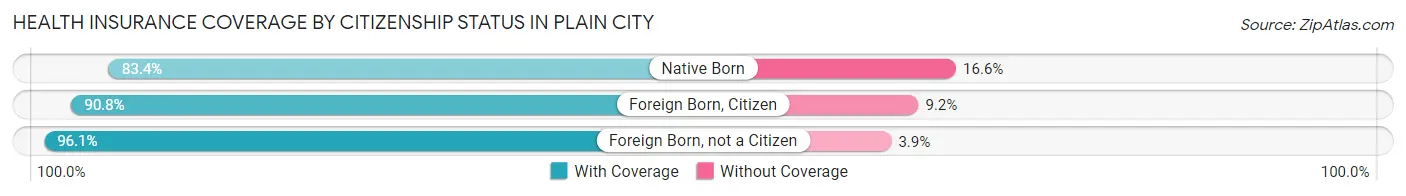
| Citizenship Status | With Coverage | Without Coverage |
| Native Born | 332 (83.4%) | 66 (16.6%) |
| Foreign Born, Citizen | 484 (90.8%) | 49 (9.2%) |
| Foreign Born, not a Citizen | 249 (96.1%) | 10 (3.9%) |
Health Insurance Coverage by Household Income in Plain City
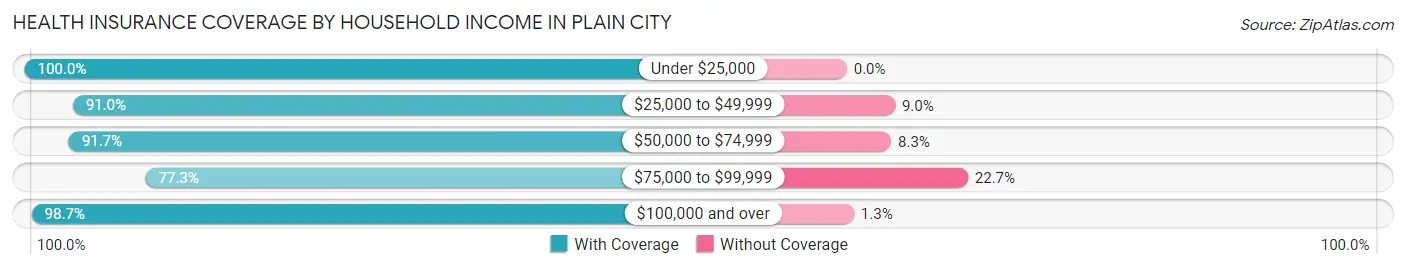
| Household Income | With Coverage | Without Coverage |
| Under $25,000 | 293 (100.0%) | 0 (0.0%) |
| $25,000 to $49,999 | 262 (91.0%) | 26 (9.0%) |
| $50,000 to $74,999 | 486 (91.7%) | 44 (8.3%) |
| $75,000 to $99,999 | 675 (77.3%) | 198 (22.7%) |
| $100,000 and over | 1,638 (98.7%) | 22 (1.3%) |
Public vs Private Health Insurance Coverage by Age in Plain City
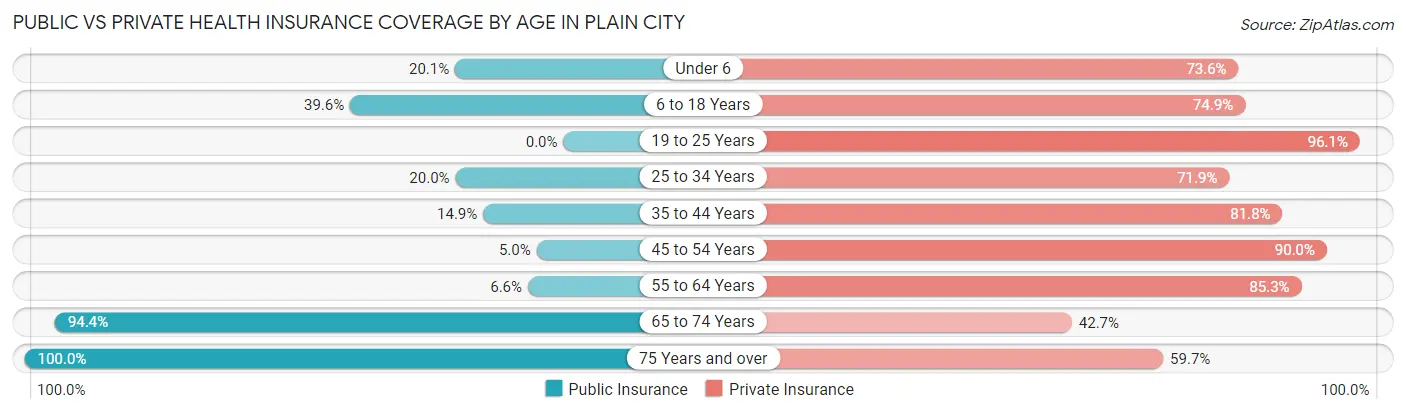
| Age Bracket | Public Insurance | Private Insurance |
| Under 6 | 80 (20.1%) | 293 (73.6%) |
| 6 to 18 Years | 211 (39.6%) | 399 (74.9%) |
| 19 to 25 Years | 0 (0.0%) | 249 (96.1%) |
| 25 to 34 Years | 102 (20.0%) | 366 (71.9%) |
| 35 to 44 Years | 67 (14.9%) | 368 (81.8%) |
| 45 to 54 Years | 16 (5.0%) | 289 (90.0%) |
| 55 to 64 Years | 30 (6.6%) | 389 (85.3%) |
| 65 to 74 Years | 252 (94.4%) | 114 (42.7%) |
| 75 Years and over | 451 (100.0%) | 269 (59.7%) |
| Total | 1,209 (33.2%) | 2,736 (75.1%) |
Disability Status by Sex by Age in Plain City
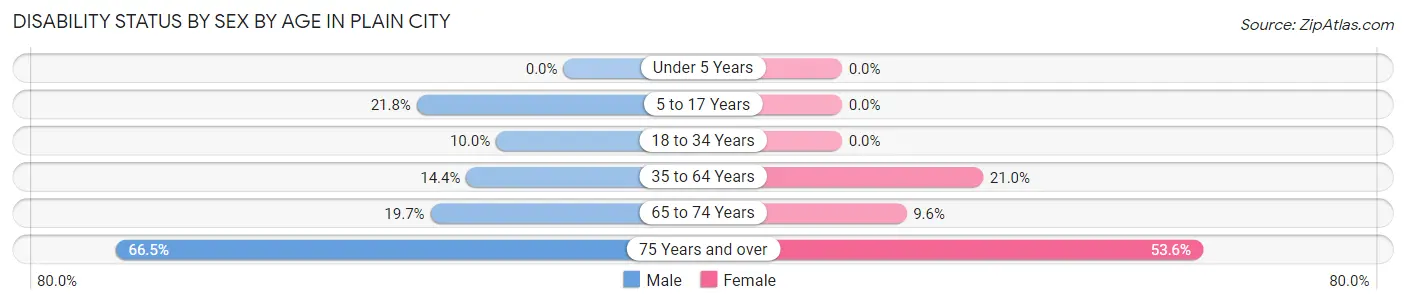
| Age Bracket | Male | Female |
| Under 5 Years | 0 (0.0%) | 0 (0.0%) |
| 5 to 17 Years | 76 (21.8%) | 0 (0.0%) |
| 18 to 34 Years | 47 (10.0%) | 0 (0.0%) |
| 35 to 64 Years | 86 (14.4%) | 132 (20.9%) |
| 65 to 74 Years | 30 (19.7%) | 11 (9.6%) |
| 75 Years and over | 125 (66.5%) | 141 (53.6%) |
Disability Class by Sex by Age in Plain City
Disability Class: Hearing Difficulty
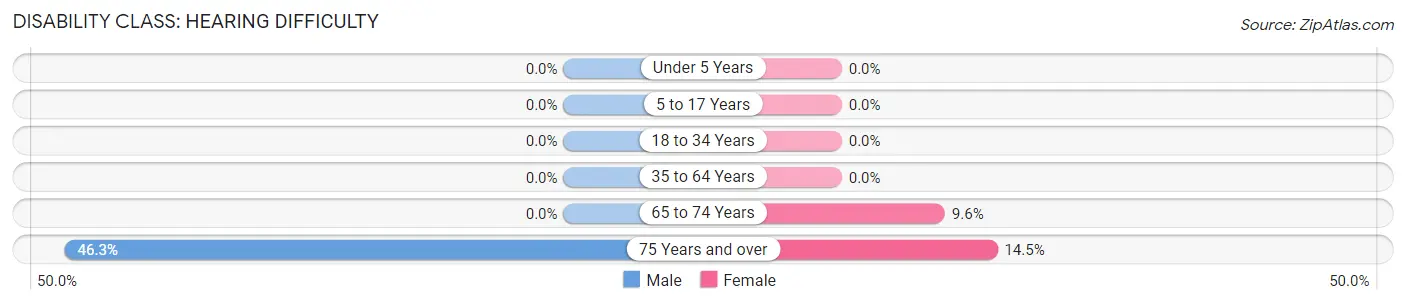
| Age Bracket | Male | Female |
| Under 5 Years | 0 (0.0%) | 0 (0.0%) |
| 5 to 17 Years | 0 (0.0%) | 0 (0.0%) |
| 18 to 34 Years | 0 (0.0%) | 0 (0.0%) |
| 35 to 64 Years | 0 (0.0%) | 0 (0.0%) |
| 65 to 74 Years | 0 (0.0%) | 11 (9.6%) |
| 75 Years and over | 87 (46.3%) | 38 (14.4%) |
Disability Class: Vision Difficulty
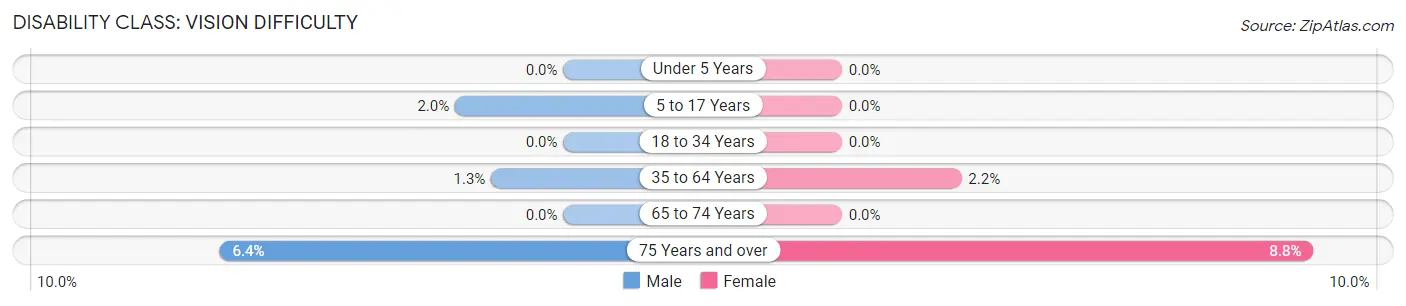
| Age Bracket | Male | Female |
| Under 5 Years | 0 (0.0%) | 0 (0.0%) |
| 5 to 17 Years | 7 (2.0%) | 0 (0.0%) |
| 18 to 34 Years | 0 (0.0%) | 0 (0.0%) |
| 35 to 64 Years | 8 (1.3%) | 14 (2.2%) |
| 65 to 74 Years | 0 (0.0%) | 0 (0.0%) |
| 75 Years and over | 12 (6.4%) | 23 (8.7%) |
Disability Class: Cognitive Difficulty
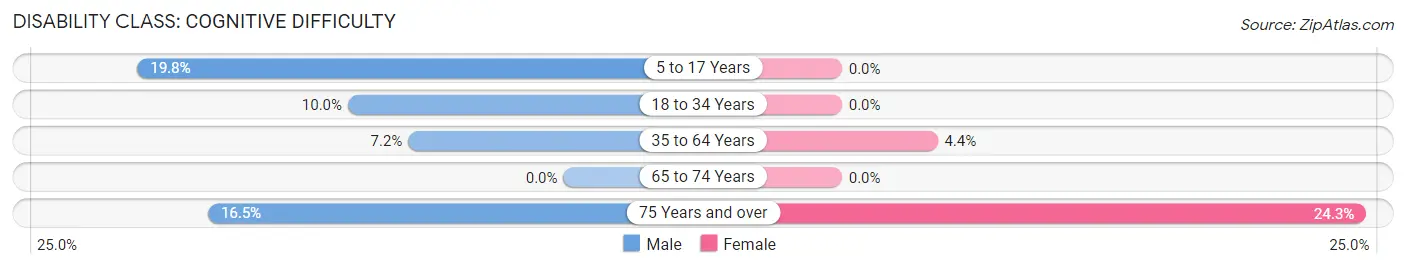
| Age Bracket | Male | Female |
| 5 to 17 Years | 69 (19.8%) | 0 (0.0%) |
| 18 to 34 Years | 47 (10.0%) | 0 (0.0%) |
| 35 to 64 Years | 43 (7.2%) | 28 (4.4%) |
| 65 to 74 Years | 0 (0.0%) | 0 (0.0%) |
| 75 Years and over | 31 (16.5%) | 64 (24.3%) |
Disability Class: Ambulatory Difficulty
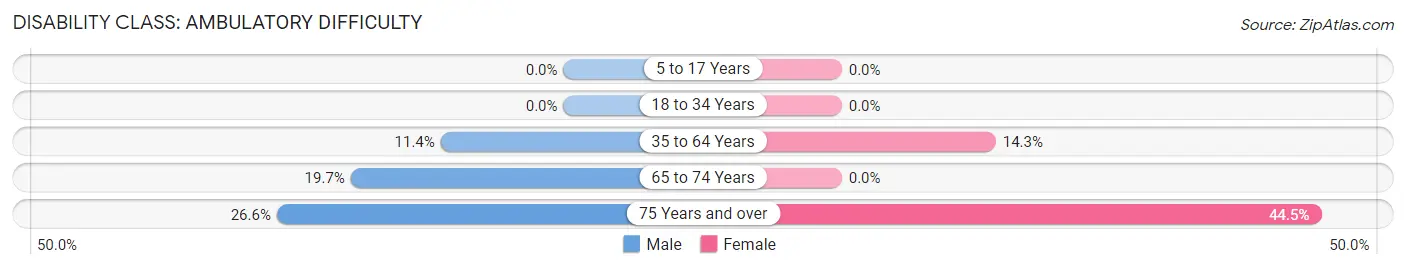
| Age Bracket | Male | Female |
| 5 to 17 Years | 0 (0.0%) | 0 (0.0%) |
| 18 to 34 Years | 0 (0.0%) | 0 (0.0%) |
| 35 to 64 Years | 68 (11.4%) | 90 (14.3%) |
| 65 to 74 Years | 30 (19.7%) | 0 (0.0%) |
| 75 Years and over | 50 (26.6%) | 117 (44.5%) |
Disability Class: Self-Care Difficulty
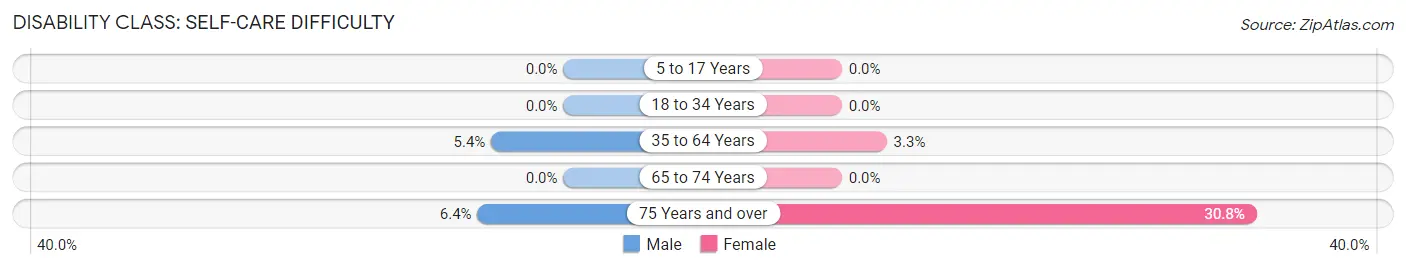
| Age Bracket | Male | Female |
| 5 to 17 Years | 0 (0.0%) | 0 (0.0%) |
| 18 to 34 Years | 0 (0.0%) | 0 (0.0%) |
| 35 to 64 Years | 32 (5.4%) | 21 (3.3%) |
| 65 to 74 Years | 0 (0.0%) | 0 (0.0%) |
| 75 Years and over | 12 (6.4%) | 81 (30.8%) |
Technology Access in Plain City
Computing Device Access in Plain City
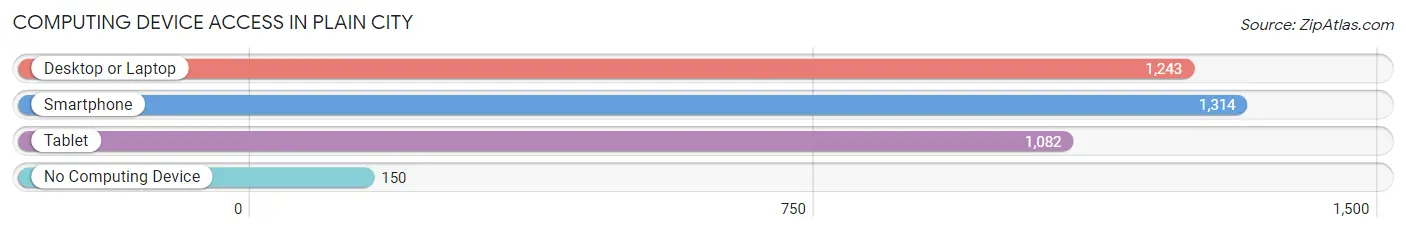
| Device Type | # Households | % Households |
| Desktop or Laptop | 1,243 | 80.5% |
| Smartphone | 1,314 | 85.1% |
| Tablet | 1,082 | 70.1% |
| No Computing Device | 150 | 9.7% |
| Total | 1,544 | 100.0% |
Internet Access in Plain City
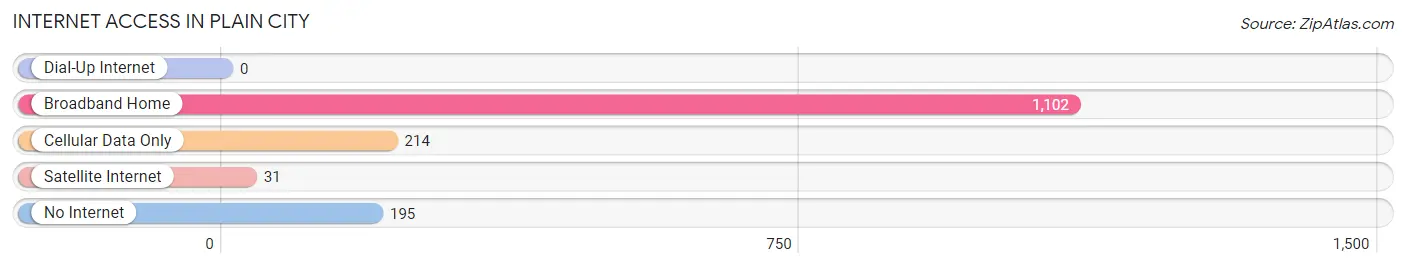
| Internet Type | # Households | % Households |
| Dial-Up Internet | 0 | 0.0% |
| Broadband Home | 1,102 | 71.4% |
| Cellular Data Only | 214 | 13.9% |
| Satellite Internet | 31 | 2.0% |
| No Internet | 195 | 12.6% |
| Total | 1,544 | 100.0% |
Plain City Summary
Plain City is a small village located in Madison County, Ohio, United States. The village is situated in the southwestern part of the county, approximately 20 miles west of Columbus. The population of Plain City was 3,735 at the 2010 census.
History
Plain City was founded in 1815 by a group of settlers from Pennsylvania. The village was originally known as "Plainfield," but the name was changed to Plain City in 1837. The village was incorporated in 1841.
The village was named for its flat terrain, which was ideal for farming. The area was also known for its abundance of wild game, which attracted hunters from all over the region.
In the late 19th century, Plain City was a thriving agricultural community. The village was home to several grain mills, a sawmill, a brickyard, and a number of other businesses.
Geography
Plain City is located at 40°14'25" North, 83°25'17" West (40.240278, -83.421389). The village is situated in the southwestern part of Madison County, approximately 20 miles west of Columbus.
The village is situated on the banks of the Big Darby Creek, which flows through the village. The creek is a tributary of the Scioto River, which flows to the south of the village.
The village is located in the Central Lowland physiographic region of the United States. The terrain is generally flat, with some rolling hills in the surrounding area.
Economy
The economy of Plain City is largely based on agriculture. The village is home to several farms, which produce a variety of crops, including corn, soybeans, wheat, and hay.
The village is also home to several small businesses, including restaurants, retail stores, and service providers. The village is also home to a number of manufacturing companies, which produce a variety of products, including furniture, automotive parts, and medical supplies.
Demographics
As of the 2010 census, the population of Plain City was 3,735. The racial makeup of the village was 97.3% White, 0.7% African American, 0.2% Native American, 0.3% Asian, 0.1% Pacific Islander, 0.4% from other races, and 1.0% from two or more races. Hispanic or Latino of any race were 1.3% of the population.
The median household income in Plain City was $50,945, and the median family income was $60,917. The per capita income for the village was $24,945. About 5.3% of families and 6.7% of the population were below the poverty line, including 8.2% of those under age 18 and 4.2% of those age 65 or over.
Common Questions
What is Per Capita Income in Plain City?
Per Capita income in Plain City is $41,289.
What is the Median Family Income in Plain City?
Median Family Income in Plain City is $105,066.
What is the Median Household income in Plain City?
Median Household Income in Plain City is $86,512.
What is Income or Wage Gap in Plain City?
Income or Wage Gap in Plain City is 26.2%.
Women in Plain City earn 73.8 cents for every dollar earned by a man.
What is Inequality or Gini Index in Plain City?
Inequality or Gini Index in Plain City is 0.34.
What is the Total Population of Plain City?
Total Population of Plain City is 3,644.
What is the Total Male Population of Plain City?
Total Male Population of Plain City is 1,955.
What is the Total Female Population of Plain City?
Total Female Population of Plain City is 1,689.
What is the Ratio of Males per 100 Females in Plain City?
There are 115.75 Males per 100 Females in Plain City.
What is the Ratio of Females per 100 Males in Plain City?
There are 86.39 Females per 100 Males in Plain City.
What is the Median Population Age in Plain City?
Median Population Age in Plain City is 38.5 Years.
What is the Average Family Size in Plain City
Average Family Size in Plain City is 2.9 People.
What is the Average Household Size in Plain City
Average Household Size in Plain City is 2.4 People.
How Large is the Labor Force in Plain City?
There are 1,850 People in the Labor Forcein in Plain City.
What is the Percentage of People in the Labor Force in Plain City?
65.8% of People are in the Labor Force in Plain City.
What is the Unemployment Rate in Plain City?
Unemployment Rate in Plain City is 1.2%.