North Randall, OH Map & Demographics
North Randall Map
North Randall Overview
$31,729
PER CAPITA INCOME
$49,375
AVG FAMILY INCOME
$40,976
AVG HOUSEHOLD INCOME
32.5%
WAGE / INCOME GAP [ % ]
67.5¢/ $1
WAGE / INCOME GAP [ $ ]
0.46
INEQUALITY / GINI INDEX
1,113
TOTAL POPULATION
500
MALE POPULATION
613
FEMALE POPULATION
81.57
MALES / 100 FEMALES
122.60
FEMALES / 100 MALES
59.7
MEDIAN AGE
2.8
AVG FAMILY SIZE
1.7
AVG HOUSEHOLD SIZE
542
LABOR FORCE [ PEOPLE ]
52.7%
PERCENT IN LABOR FORCE
20.8%
UNEMPLOYMENT RATE
Income in North Randall
Income Overview in North Randall
Per Capita Income in North Randall is $31,729, while median incomes of families and households are $49,375 and $40,976 respectively.
| Characteristic | Number | Measure |
| Per Capita Income | 1,113 | $31,729 |
| Median Family Income | 205 | $49,375 |
| Mean Family Income | 205 | $68,728 |
| Median Household Income | 570 | $40,976 |
| Mean Household Income | 570 | $58,102 |
| Income Deficit | 205 | $0 |
| Wage / Income Gap (%) | 1,113 | 32.45% |
| Wage / Income Gap ($) | 1,113 | 67.55¢ per $1 |
| Gini / Inequality Index | 1,113 | 0.46 |
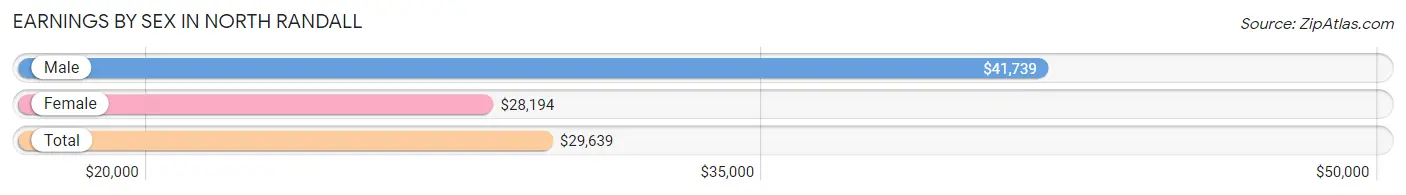
Earnings by Sex in North Randall
Average Earnings in North Randall are $29,639, $41,739 for men and $28,194 for women, a difference of 32.5%.
| Sex | Number | Average Earnings |
| Male | 246 (46.2%) | $41,739 |
| Female | 287 (53.8%) | $28,194 |
| Total | 533 (100.0%) | $29,639 |
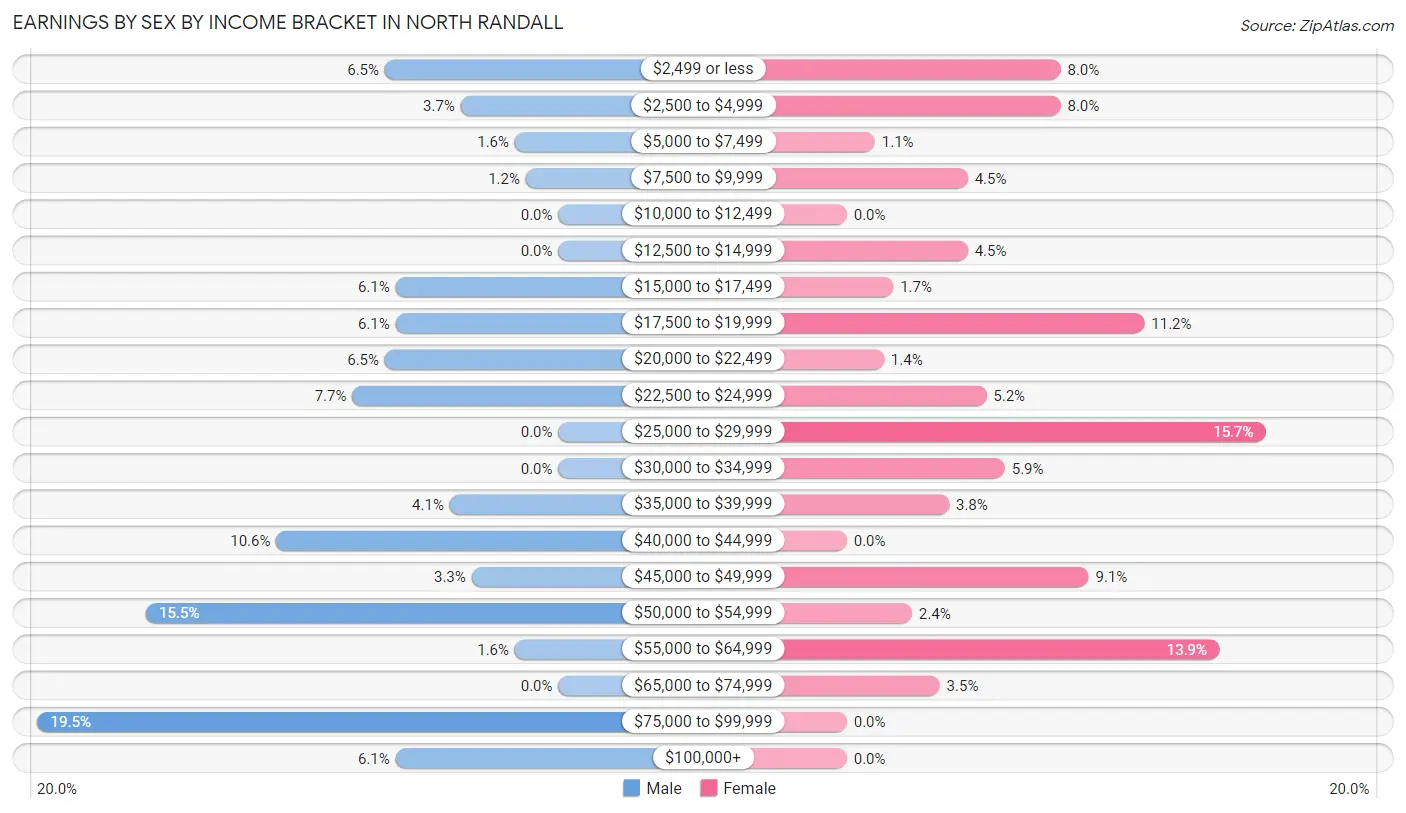
Earnings by Sex by Income Bracket in North Randall
The most common earnings brackets in North Randall are $75,000 to $99,999 for men (48 | 19.5%) and $25,000 to $29,999 for women (45 | 15.7%).
| Income | Male | Female |
| $2,499 or less | 16 (6.5%) | 23 (8.0%) |
| $2,500 to $4,999 | 9 (3.7%) | 23 (8.0%) |
| $5,000 to $7,499 | 4 (1.6%) | 3 (1.1%) |
| $7,500 to $9,999 | 3 (1.2%) | 13 (4.5%) |
| $10,000 to $12,499 | 0 (0.0%) | 0 (0.0%) |
| $12,500 to $14,999 | 0 (0.0%) | 13 (4.5%) |
| $15,000 to $17,499 | 15 (6.1%) | 5 (1.7%) |
| $17,500 to $19,999 | 15 (6.1%) | 32 (11.2%) |
| $20,000 to $22,499 | 16 (6.5%) | 4 (1.4%) |
| $22,500 to $24,999 | 19 (7.7%) | 15 (5.2%) |
| $25,000 to $29,999 | 0 (0.0%) | 45 (15.7%) |
| $30,000 to $34,999 | 0 (0.0%) | 17 (5.9%) |
| $35,000 to $39,999 | 10 (4.1%) | 11 (3.8%) |
| $40,000 to $44,999 | 26 (10.6%) | 0 (0.0%) |
| $45,000 to $49,999 | 8 (3.3%) | 26 (9.1%) |
| $50,000 to $54,999 | 38 (15.4%) | 7 (2.4%) |
| $55,000 to $64,999 | 4 (1.6%) | 40 (13.9%) |
| $65,000 to $74,999 | 0 (0.0%) | 10 (3.5%) |
| $75,000 to $99,999 | 48 (19.5%) | 0 (0.0%) |
| $100,000+ | 15 (6.1%) | 0 (0.0%) |
| Total | 246 (100.0%) | 287 (100.0%) |
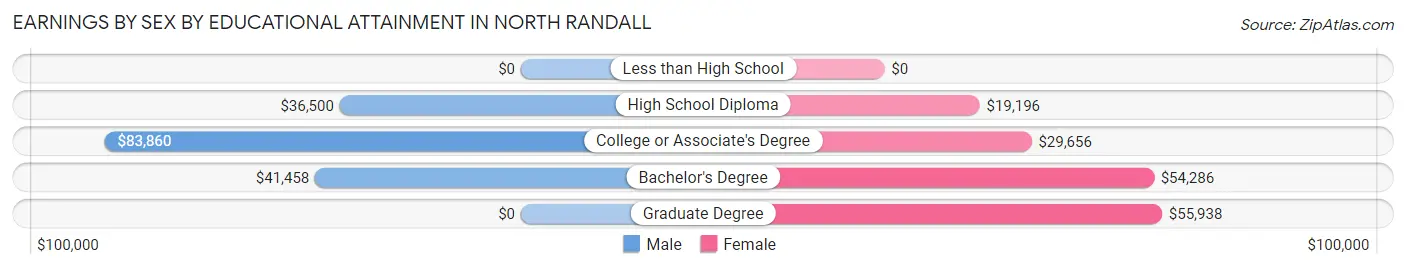
Earnings by Sex by Educational Attainment in North Randall
Average earnings in North Randall are $42,120 for men and $29,278 for women, a difference of 30.5%. Men with an educational attainment of college or associate's degree enjoy the highest average annual earnings of $83,860, while those with high school diploma education earn the least with $36,500. Women with an educational attainment of graduate degree earn the most with the average annual earnings of $55,938, while those with high school diploma education have the smallest earnings of $19,196.
| Educational Attainment | Male Income | Female Income |
| Less than High School | - | - |
| High School Diploma | $36,500 | $19,196 |
| College or Associate's Degree | $83,860 | $29,656 |
| Bachelor's Degree | $41,458 | $54,286 |
| Graduate Degree | - | - |
| Total | $42,120 | $29,278 |
Family Income in North Randall
Family Income Brackets in North Randall
According to the North Randall family income data, there are 52 families falling into the $50,000 to $74,999 income range, which is the most common income bracket and makes up 25.4% of all families. Conversely, the $10,000 to $14,999 income bracket is the least frequent group with only 8 families (3.9%) belonging to this category.
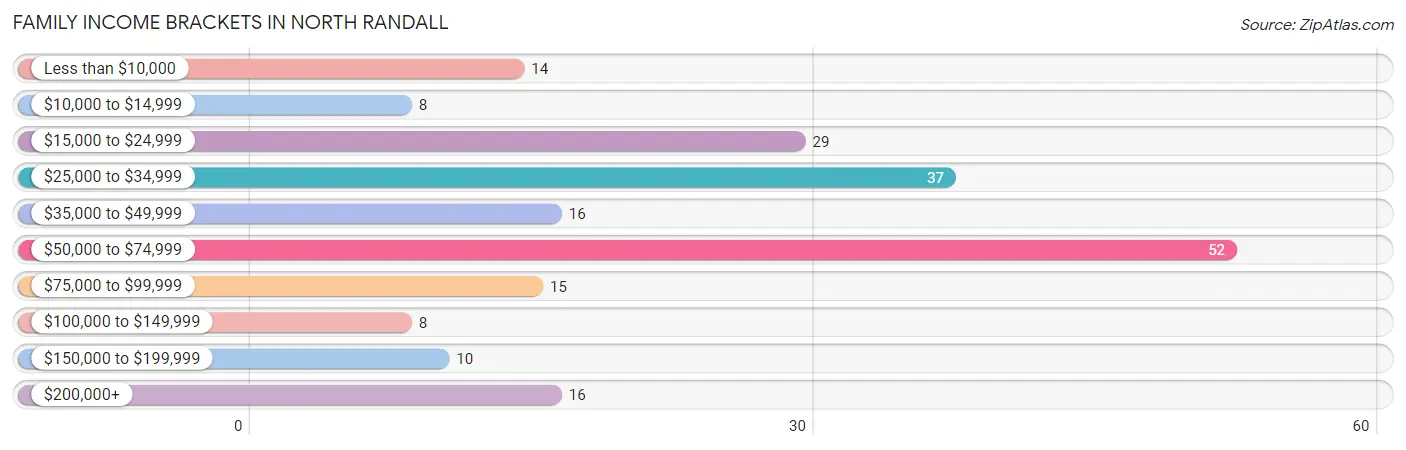
| Income Bracket | # Families | % Families |
| Less than $10,000 | 14 | 6.8% |
| $10,000 to $14,999 | 8 | 3.9% |
| $15,000 to $24,999 | 29 | 14.1% |
| $25,000 to $34,999 | 37 | 18.0% |
| $35,000 to $49,999 | 16 | 7.8% |
| $50,000 to $74,999 | 52 | 25.4% |
| $75,000 to $99,999 | 15 | 7.3% |
| $100,000 to $149,999 | 8 | 3.9% |
| $150,000 to $199,999 | 10 | 4.9% |
| $200,000+ | 16 | 7.8% |
Family Income by Famaliy Size in North Randall
2-person families (121 | 59.0%) account for the highest median family income in North Randall with $34,125 per family, while 2-person families (121 | 59.0%) have the highest median income of $17,062 per family member.
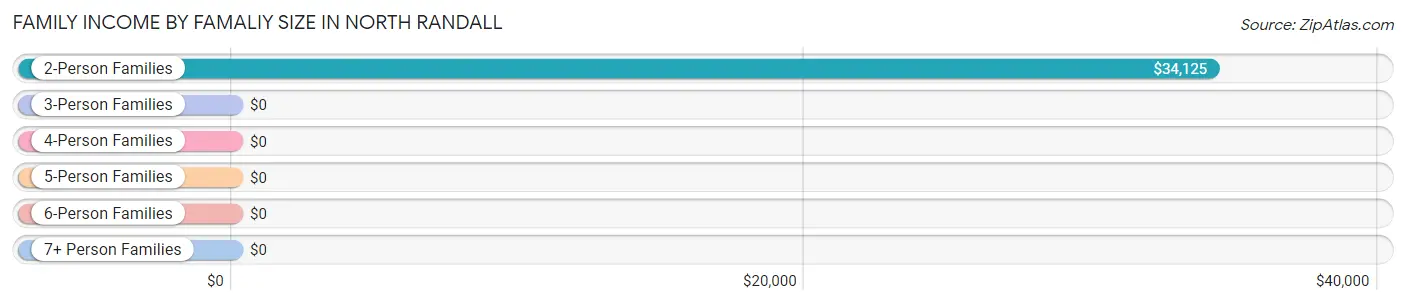
| Income Bracket | # Families | Median Income |
| 2-Person Families | 121 (59.0%) | $34,125 |
| 3-Person Families | 80 (39.0%) | $0 |
| 4-Person Families | 4 (1.9%) | $0 |
| 5-Person Families | 0 (0.0%) | $0 |
| 6-Person Families | 0 (0.0%) | $0 |
| 7+ Person Families | 0 (0.0%) | $0 |
| Total | 205 (100.0%) | $49,375 |
Family Income by Number of Earners in North Randall
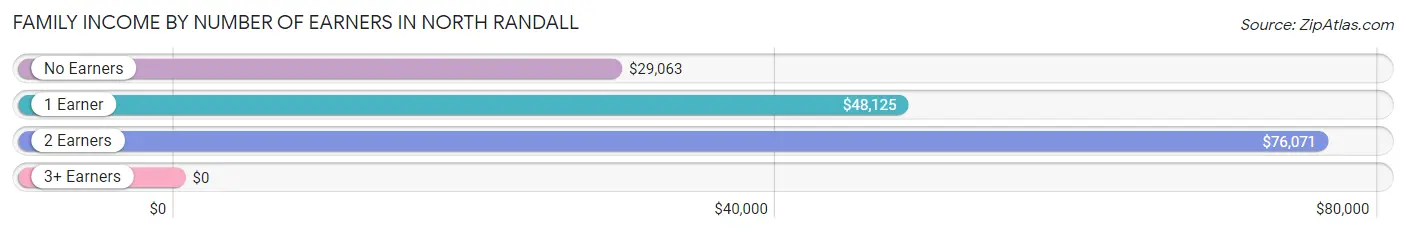
| Number of Earners | # Families | Median Income |
| No Earners | 24 (11.7%) | $29,063 |
| 1 Earner | 111 (54.1%) | $48,125 |
| 2 Earners | 56 (27.3%) | $76,071 |
| 3+ Earners | 14 (6.8%) | $0 |
| Total | 205 (100.0%) | $49,375 |
Household Income in North Randall
Household Income Brackets in North Randall
With 112 households falling in the category, the $15,000 to $24,999 income range is the most frequent in North Randall, accounting for 19.7% of all households. In contrast, only 10 households (1.8%) fall into the $150,000 to $199,999 income bracket, making it the least populous group.
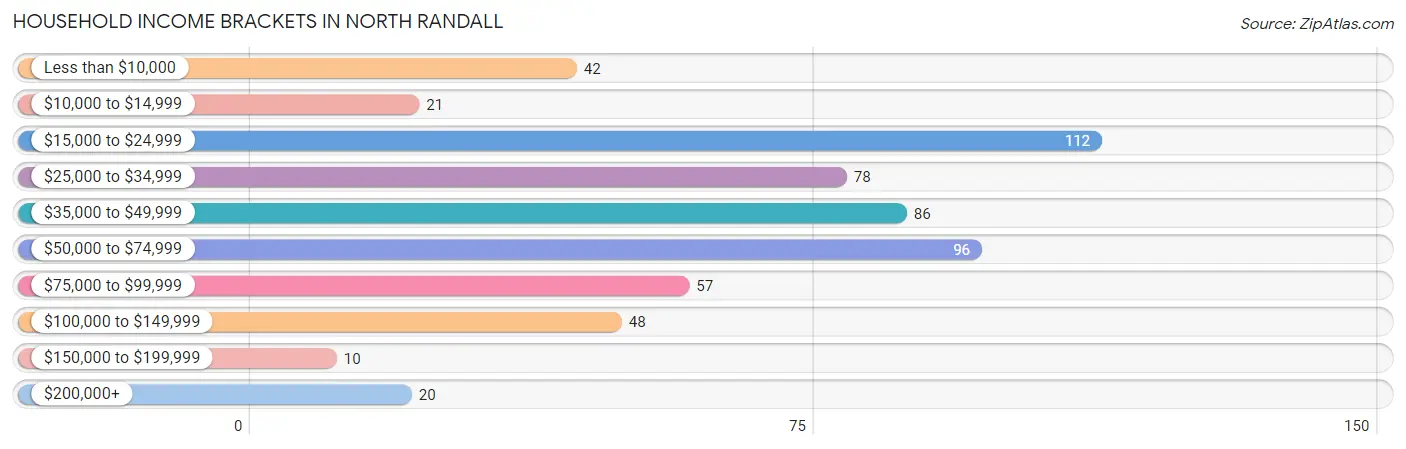
| Income Bracket | # Households | % Households |
| Less than $10,000 | 42 | 7.4% |
| $10,000 to $14,999 | 21 | 3.7% |
| $15,000 to $24,999 | 112 | 19.6% |
| $25,000 to $34,999 | 78 | 13.7% |
| $35,000 to $49,999 | 86 | 15.1% |
| $50,000 to $74,999 | 96 | 16.8% |
| $75,000 to $99,999 | 57 | 10.0% |
| $100,000 to $149,999 | 48 | 8.4% |
| $150,000 to $199,999 | 10 | 1.8% |
| $200,000+ | 20 | 3.5% |
Household Income by Householder Age in North Randall
The median household income in North Randall is $40,976, with the highest median household income of $55,694 found in the 45 to 64 years age bracket for the primary householder. A total of 311 households (54.6%) fall into this category. Meanwhile, the 15 to 24 years age bracket for the primary householder has the lowest median household income of $0, with 10 households (1.8%) in this group.
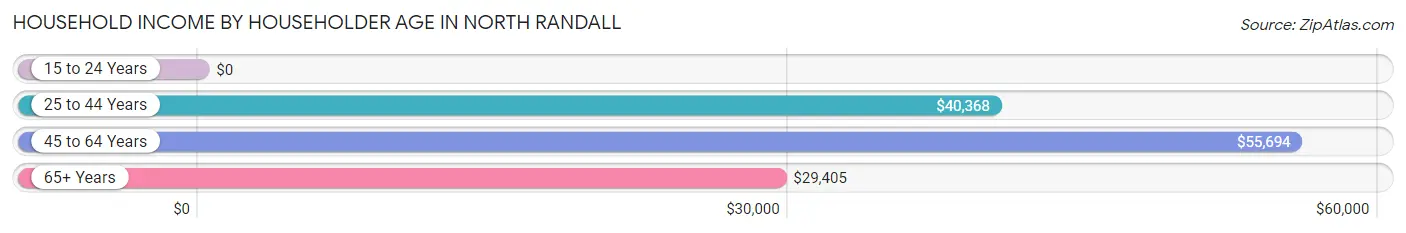
| Income Bracket | # Households | Median Income |
| 15 to 24 Years | 10 (1.8%) | $0 |
| 25 to 44 Years | 67 (11.7%) | $40,368 |
| 45 to 64 Years | 311 (54.6%) | $55,694 |
| 65+ Years | 182 (31.9%) | $29,405 |
| Total | 570 (100.0%) | $40,976 |
Poverty in North Randall
Income Below Poverty by Sex and Age in North Randall
With 20.8% poverty level for males and 14.3% for females among the residents of North Randall, under 5 year old males and 18 to 24 year old females are the most vulnerable to poverty, with 11 males (100.0%) and 15 females (45.5%) in their respective age groups living below the poverty level.
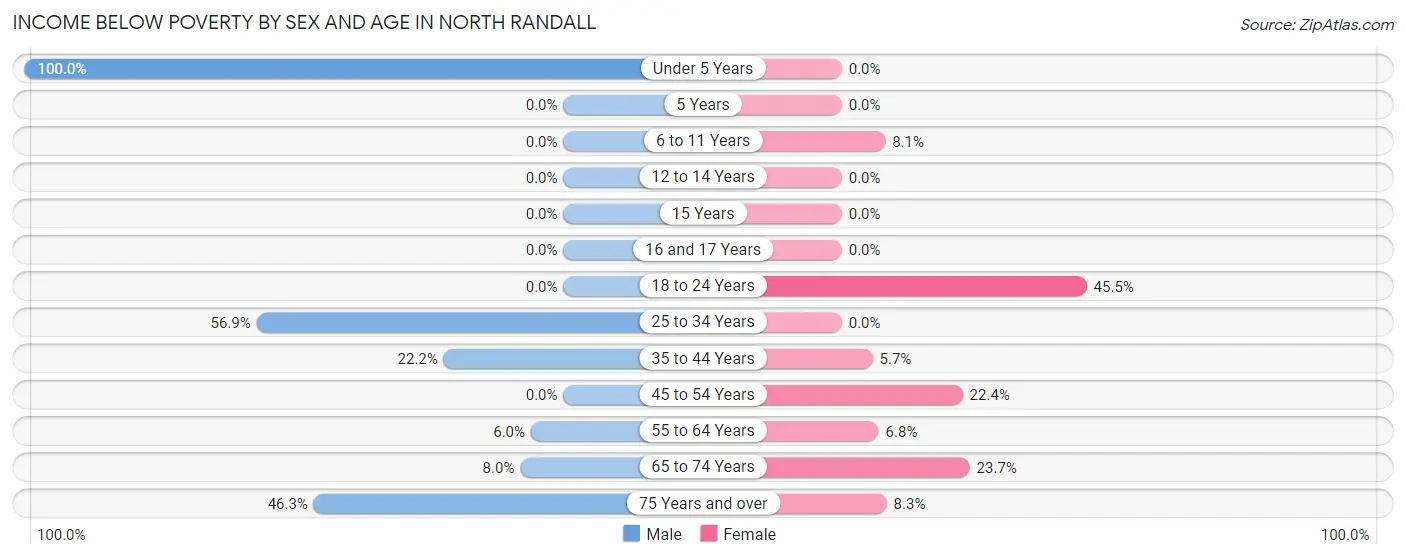
| Age Bracket | Male | Female |
| Under 5 Years | 11 (100.0%) | 0 (0.0%) |
| 5 Years | 0 (0.0%) | 0 (0.0%) |
| 6 to 11 Years | 0 (0.0%) | 5 (8.1%) |
| 12 to 14 Years | 0 (0.0%) | 0 (0.0%) |
| 15 Years | 0 (0.0%) | 0 (0.0%) |
| 16 and 17 Years | 0 (0.0%) | 0 (0.0%) |
| 18 to 24 Years | 0 (0.0%) | 15 (45.5%) |
| 25 to 34 Years | 41 (56.9%) | 0 (0.0%) |
| 35 to 44 Years | 8 (22.2%) | 4 (5.7%) |
| 45 to 54 Years | 0 (0.0%) | 24 (22.4%) |
| 55 to 64 Years | 7 (6.0%) | 8 (6.8%) |
| 65 to 74 Years | 8 (8.0%) | 14 (23.7%) |
| 75 Years and over | 19 (46.3%) | 4 (8.3%) |
| Total | 94 (20.8%) | 74 (14.3%) |
Income Above Poverty by Sex and Age in North Randall
According to the poverty statistics in North Randall, males aged 6 to 11 years and females aged 16 and 17 years are the age groups that are most secure financially, with 100.0% of males and 100.0% of females in these age groups living above the poverty line.
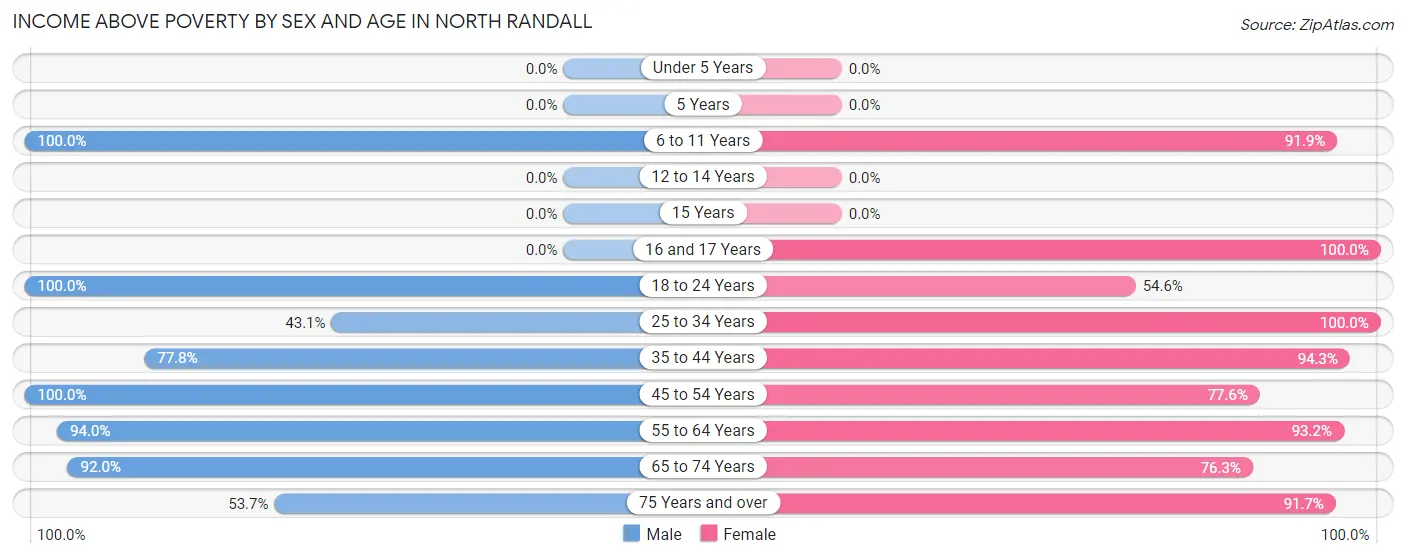
| Age Bracket | Male | Female |
| Under 5 Years | 0 (0.0%) | 0 (0.0%) |
| 5 Years | 0 (0.0%) | 0 (0.0%) |
| 6 to 11 Years | 12 (100.0%) | 57 (91.9%) |
| 12 to 14 Years | 0 (0.0%) | 0 (0.0%) |
| 15 Years | 0 (0.0%) | 0 (0.0%) |
| 16 and 17 Years | 0 (0.0%) | 12 (100.0%) |
| 18 to 24 Years | 13 (100.0%) | 18 (54.5%) |
| 25 to 34 Years | 31 (43.1%) | 8 (100.0%) |
| 35 to 44 Years | 28 (77.8%) | 66 (94.3%) |
| 45 to 54 Years | 50 (100.0%) | 83 (77.6%) |
| 55 to 64 Years | 109 (94.0%) | 109 (93.2%) |
| 65 to 74 Years | 92 (92.0%) | 45 (76.3%) |
| 75 Years and over | 22 (53.7%) | 44 (91.7%) |
| Total | 357 (79.2%) | 442 (85.7%) |
Income Below Poverty Among Married-Couple Families in North Randall
The poverty statistics for married-couple families in North Randall show that 8.1% or 8 of the total 99 families live below the poverty line. Families with 1 or 2 children have the highest poverty rate of 25.0%, comprising of 4 families. On the other hand, families with no children have the lowest poverty rate of 4.8%, which includes 4 families.
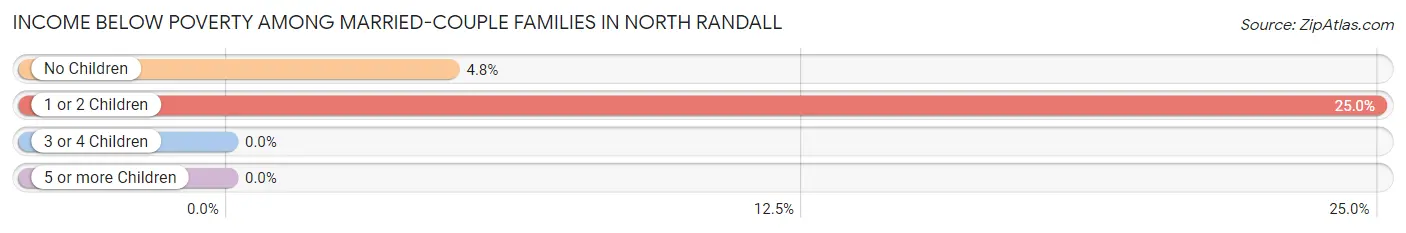
| Children | Above Poverty | Below Poverty |
| No Children | 79 (95.2%) | 4 (4.8%) |
| 1 or 2 Children | 12 (75.0%) | 4 (25.0%) |
| 3 or 4 Children | 0 (0.0%) | 0 (0.0%) |
| 5 or more Children | 0 (0.0%) | 0 (0.0%) |
| Total | 91 (91.9%) | 8 (8.1%) |
Income Below Poverty Among Single-Parent Households in North Randall
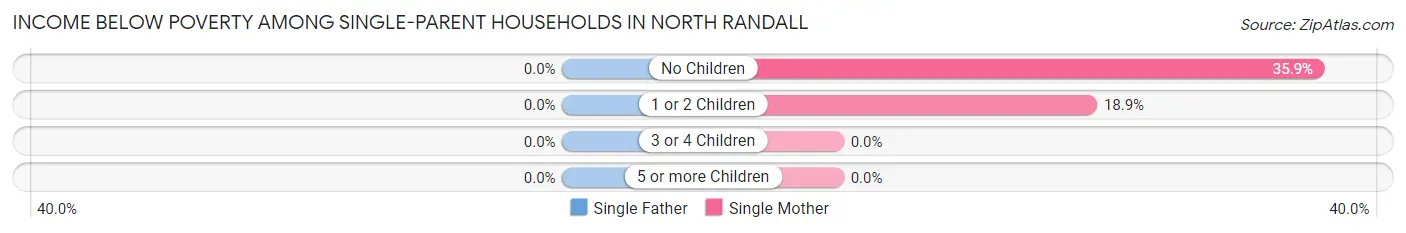
| Children | Single Father | Single Mother |
| No Children | 0 (0.0%) | 19 (35.8%) |
| 1 or 2 Children | 0 (0.0%) | 10 (18.9%) |
| 3 or 4 Children | 0 (0.0%) | 0 (0.0%) |
| 5 or more Children | 0 (0.0%) | 0 (0.0%) |
| Total | 0 (0.0%) | 29 (27.4%) |
Income Below Poverty Among Married-Couple vs Single-Parent Households in North Randall
The poverty data for North Randall shows that 8 of the married-couple family households (8.1%) and 29 of the single-parent households (27.4%) are living below the poverty level. Within the married-couple family households, those with 1 or 2 children have the highest poverty rate, with 4 households (25.0%) falling below the poverty line. Among the single-parent households, those with no children have the highest poverty rate, with 19 household (35.8%) living below poverty.
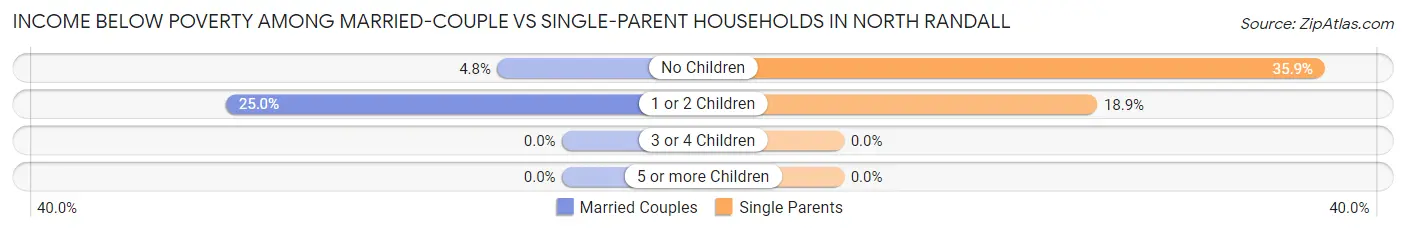
| Children | Married-Couple Families | Single-Parent Households |
| No Children | 4 (4.8%) | 19 (35.8%) |
| 1 or 2 Children | 4 (25.0%) | 10 (18.9%) |
| 3 or 4 Children | 0 (0.0%) | 0 (0.0%) |
| 5 or more Children | 0 (0.0%) | 0 (0.0%) |
| Total | 8 (8.1%) | 29 (27.4%) |
Race in North Randall
The most populous races in North Randall are Black / African American (803 | 72.2%), White / Caucasian (257 | 23.1%), and Two or more Races (52 | 4.7%).
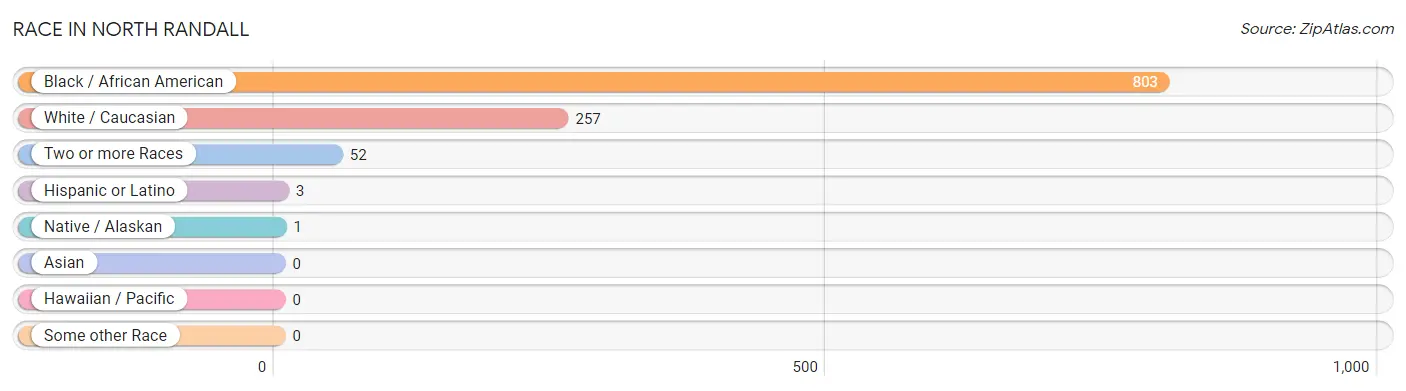
| Race | # Population | % Population |
| Asian | 0 | 0.0% |
| Black / African American | 803 | 72.2% |
| Hawaiian / Pacific | 0 | 0.0% |
| Hispanic or Latino | 3 | 0.3% |
| Native / Alaskan | 1 | 0.1% |
| White / Caucasian | 257 | 23.1% |
| Two or more Races | 52 | 4.7% |
| Some other Race | 0 | 0.0% |
| Total | 1,113 | 100.0% |
Ancestry in North Randall
The most populous ancestries reported in North Randall are Polish (64 | 5.8%), Subsaharan African (48 | 4.3%), African (41 | 3.7%), Irish (35 | 3.1%), and Hungarian (34 | 3.0%), together accounting for 19.9% of all North Randall residents.
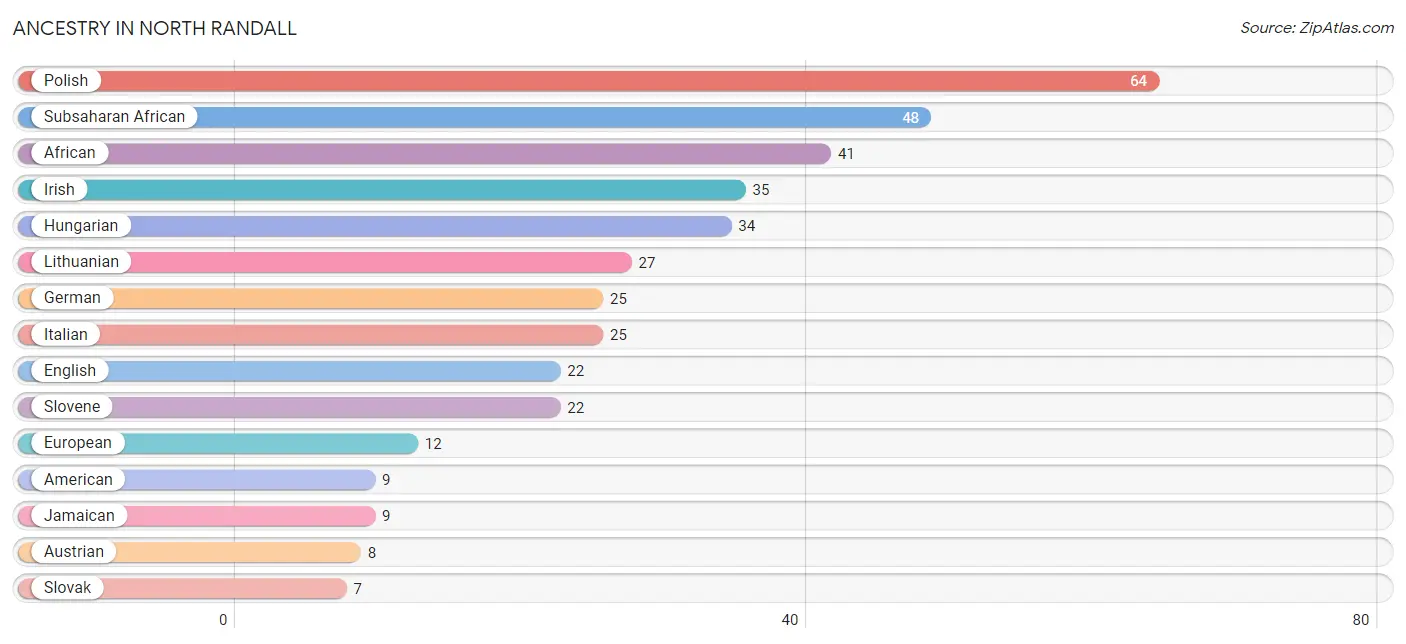
| Ancestry | # Population | % Population |
| African | 41 | 3.7% |
| American | 9 | 0.8% |
| Austrian | 8 | 0.7% |
| Czechoslovakian | 3 | 0.3% |
| English | 22 | 2.0% |
| European | 12 | 1.1% |
| German | 25 | 2.2% |
| Hungarian | 34 | 3.0% |
| Irish | 35 | 3.1% |
| Italian | 25 | 2.2% |
| Jamaican | 9 | 0.8% |
| Lithuanian | 27 | 2.4% |
| Polish | 64 | 5.8% |
| Puerto Rican | 3 | 0.3% |
| Slovak | 7 | 0.6% |
| Slovene | 22 | 2.0% |
| Subsaharan African | 48 | 4.3% | View All 17 Rows |
Immigrants in North Randall
The most numerous immigrant groups reported in North Randall came from Africa (25 | 2.2%), and Western Africa (25 | 2.2%), together accounting for 4.5% of all North Randall residents.
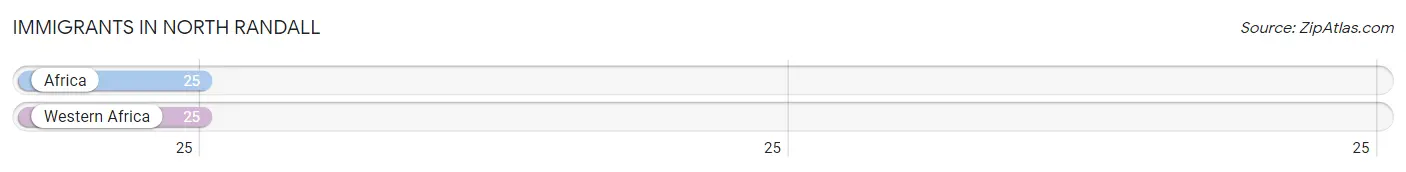
| Immigration Origin | # Population | % Population |
| Africa | 25 | 2.2% |
| Western Africa | 25 | 2.2% | View All 2 Rows |
Sex and Age in North Randall
Sex and Age in North Randall
The most populous age groups in North Randall are 60 to 64 Years (91 | 18.2%) for men and 60 to 64 Years (97 | 15.8%) for women.
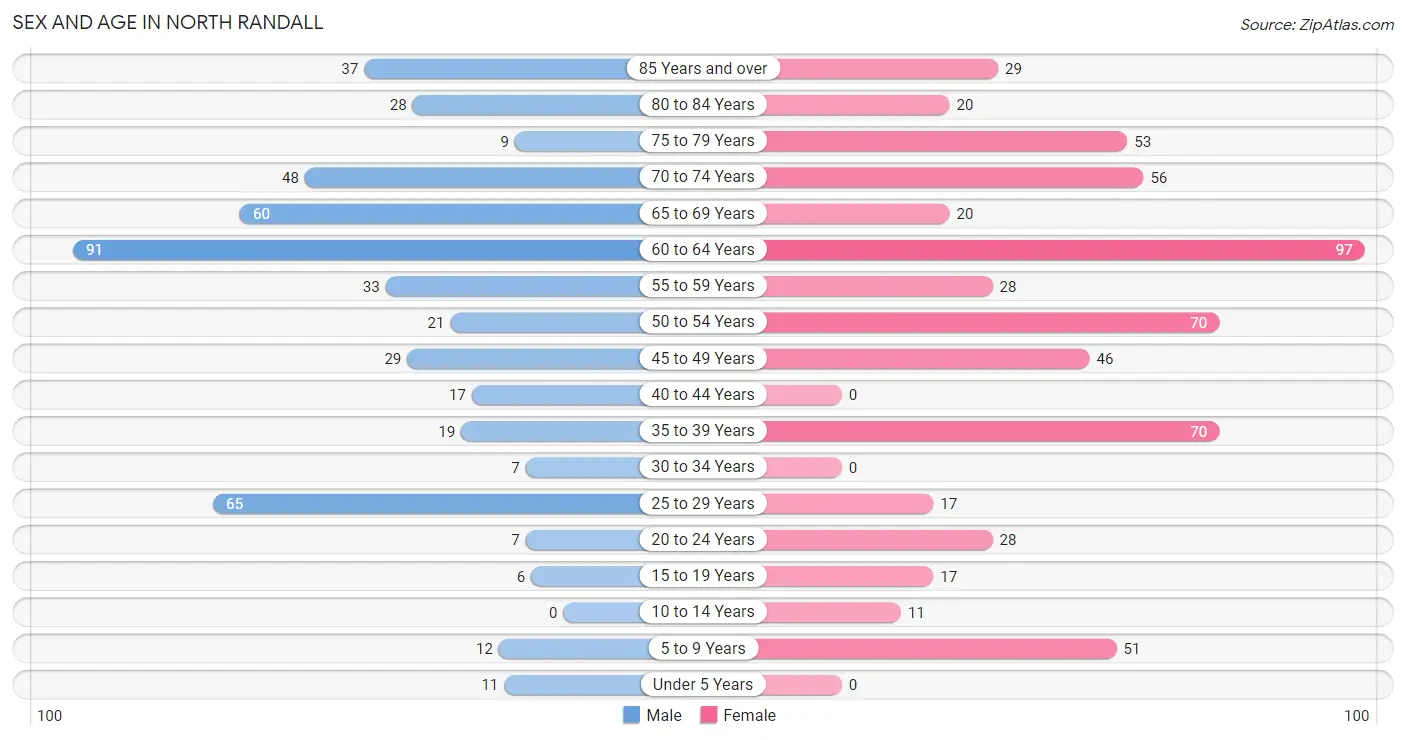
| Age Bracket | Male | Female |
| Under 5 Years | 11 (2.2%) | 0 (0.0%) |
| 5 to 9 Years | 12 (2.4%) | 51 (8.3%) |
| 10 to 14 Years | 0 (0.0%) | 11 (1.8%) |
| 15 to 19 Years | 6 (1.2%) | 17 (2.8%) |
| 20 to 24 Years | 7 (1.4%) | 28 (4.6%) |
| 25 to 29 Years | 65 (13.0%) | 17 (2.8%) |
| 30 to 34 Years | 7 (1.4%) | 0 (0.0%) |
| 35 to 39 Years | 19 (3.8%) | 70 (11.4%) |
| 40 to 44 Years | 17 (3.4%) | 0 (0.0%) |
| 45 to 49 Years | 29 (5.8%) | 46 (7.5%) |
| 50 to 54 Years | 21 (4.2%) | 70 (11.4%) |
| 55 to 59 Years | 33 (6.6%) | 28 (4.6%) |
| 60 to 64 Years | 91 (18.2%) | 97 (15.8%) |
| 65 to 69 Years | 60 (12.0%) | 20 (3.3%) |
| 70 to 74 Years | 48 (9.6%) | 56 (9.1%) |
| 75 to 79 Years | 9 (1.8%) | 53 (8.6%) |
| 80 to 84 Years | 28 (5.6%) | 20 (3.3%) |
| 85 Years and over | 37 (7.4%) | 29 (4.7%) |
| Total | 500 (100.0%) | 613 (100.0%) |
Families and Households in North Randall
Median Family Size in North Randall
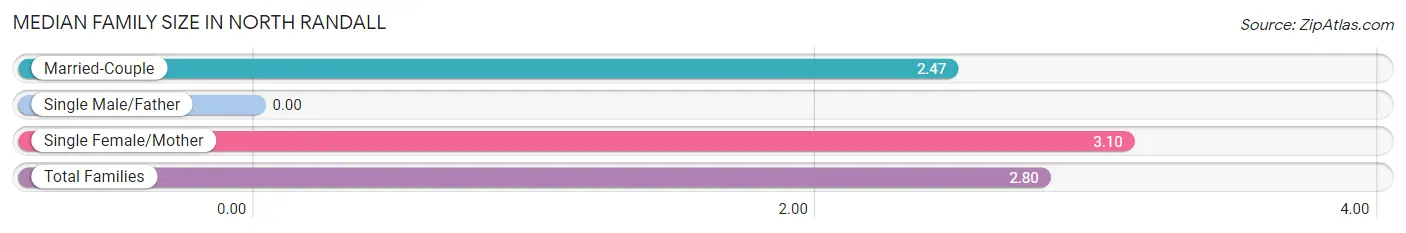
| Family Type | # Families | Family Size |
| Married-Couple | 99 (48.3%) | 2.47 |
| Single Male/Father | 0 (0.0%) | - |
| Single Female/Mother | 106 (51.7%) | 3.10 |
| Total Families | 205 (100.0%) | 2.80 |
Median Household Size in North Randall
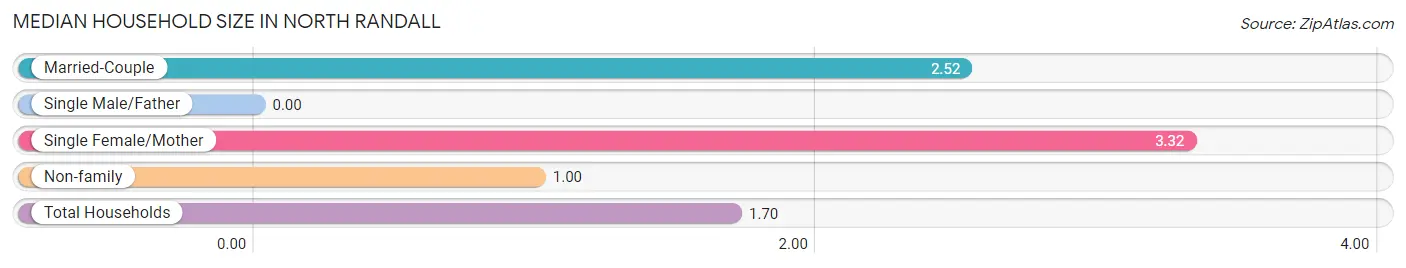
| Household Type | # Households | Household Size |
| Married-Couple | 99 (17.4%) | 2.52 |
| Single Male/Father | 0 (0.0%) | - |
| Single Female/Mother | 106 (18.6%) | 3.32 |
| Non-family | 365 (64.0%) | 1.00 |
| Total Households | 570 (100.0%) | 1.70 |
Household Size by Marriage Status in North Randall
Out of a total of 570 households in North Randall, 205 (36.0%) are family households, while 365 (64.0%) are nonfamily households. The most numerous type of family households are 2-person households, comprising 108, and the most common type of nonfamily households are 1-person households, comprising 364.
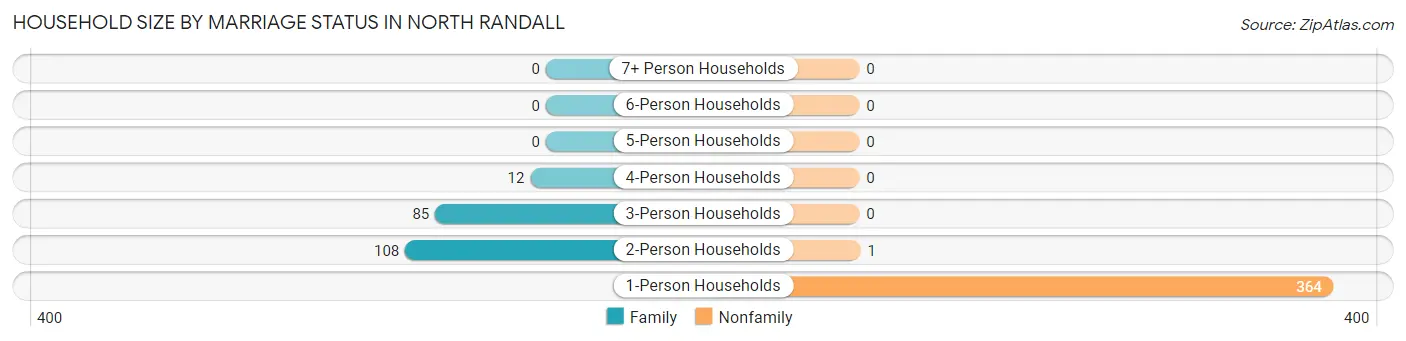
| Household Size | Family Households | Nonfamily Households |
| 1-Person Households | - | 364 (63.9%) |
| 2-Person Households | 108 (19.0%) | 1 (0.2%) |
| 3-Person Households | 85 (14.9%) | 0 (0.0%) |
| 4-Person Households | 12 (2.1%) | 0 (0.0%) |
| 5-Person Households | 0 (0.0%) | 0 (0.0%) |
| 6-Person Households | 0 (0.0%) | 0 (0.0%) |
| 7+ Person Households | 0 (0.0%) | 0 (0.0%) |
| Total | 205 (36.0%) | 365 (64.0%) |
Female Fertility in North Randall
Fertility by Age in North Randall
| Age Bracket | Women with Births | Births / 1,000 Women |
| 15 to 19 years | 0 (0.0%) | 0.0 |
| 20 to 34 years | 0 (0.0%) | 0.0 |
| 35 to 50 years | 0 (0.0%) | 0.0 |
| Total | 0 (0.0%) | 0.0 |
Fertility by Age by Marriage Status in North Randall
| Age Bracket | Married | Unmarried |
| 15 to 19 years | 0 (0.0%) | 0 (0.0%) |
| 20 to 34 years | 0 (0.0%) | 0 (0.0%) |
| 35 to 50 years | 0 (0.0%) | 0 (0.0%) |
| Total | 0 (0.0%) | 0 (0.0%) |
Fertility by Education in North Randall
| Educational Attainment | Women with Births | Births / 1,000 Women |
| Less than High School | 0 (0.0%) | 0.0 |
| High School Diploma | 0 (0.0%) | 0.0 |
| College or Associate's Degree | 0 (0.0%) | 0.0 |
| Bachelor's Degree | 0 (0.0%) | 0.0 |
| Graduate Degree | 0 (0.0%) | 0.0 |
| Total | 0 (0.0%) | 0.0 |
Fertility by Education by Marriage Status in North Randall
| Educational Attainment | Married | Unmarried |
| Less than High School | 0 (0.0%) | 0 (0.0%) |
| High School Diploma | 0 (0.0%) | 0 (0.0%) |
| College or Associate's Degree | 0 (0.0%) | 0 (0.0%) |
| Bachelor's Degree | 0 (0.0%) | 0 (0.0%) |
| Graduate Degree | 0 (0.0%) | 0 (0.0%) |
| Total | 0 (0.0%) | 0 (0.0%) |
Employment Characteristics in North Randall
Employment by Class of Employer in North Randall
Among the 425 employed individuals in North Randall, private company employees (169 | 39.8%), local government employees (147 | 34.6%), and federal government employees (37 | 8.7%) make up the most common classes of employment.
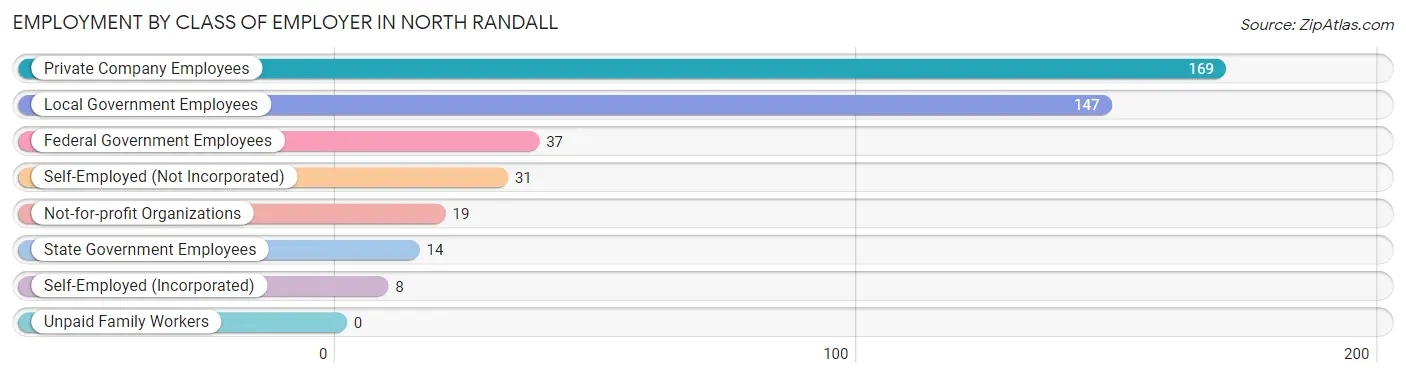
| Employer Class | # Employees | % Employees |
| Private Company Employees | 169 | 39.8% |
| Self-Employed (Incorporated) | 8 | 1.9% |
| Self-Employed (Not Incorporated) | 31 | 7.3% |
| Not-for-profit Organizations | 19 | 4.5% |
| Local Government Employees | 147 | 34.6% |
| State Government Employees | 14 | 3.3% |
| Federal Government Employees | 37 | 8.7% |
| Unpaid Family Workers | 0 | 0.0% |
| Total | 425 | 100.0% |
Employment Status by Age in North Randall
According to the labor force statistics for North Randall, out of the total population over 16 years of age (1,028), 52.7% or 542 individuals are in the labor force, with 20.8% or 113 of them unemployed. The age group with the highest labor force participation rate is 20 to 24 years, with 100.0% or 35 individuals in the labor force. Within the labor force, the 20 to 24 years age range has the highest percentage of unemployed individuals, with 80.0% or 28 of them being unemployed.
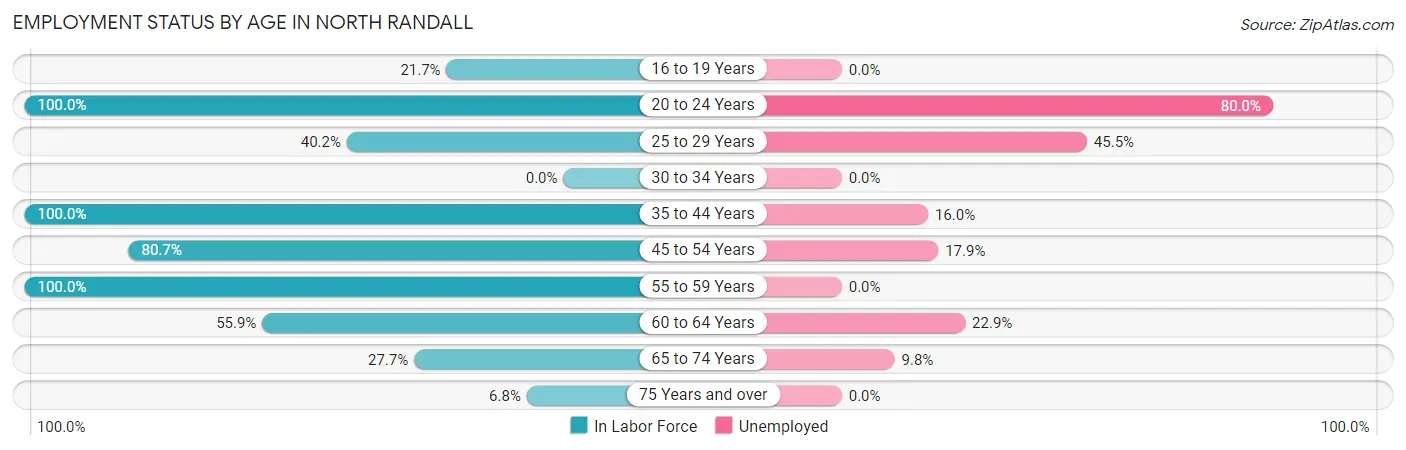
| Age Bracket | In Labor Force | Unemployed |
| 16 to 19 Years | 5 (21.7%) | 0 (0.0%) |
| 20 to 24 Years | 35 (100.0%) | 28 (80.0%) |
| 25 to 29 Years | 33 (40.2%) | 15 (45.5%) |
| 30 to 34 Years | 0 (0.0%) | 0 (0.0%) |
| 35 to 44 Years | 106 (100.0%) | 17 (16.0%) |
| 45 to 54 Years | 134 (80.7%) | 24 (17.9%) |
| 55 to 59 Years | 61 (100.0%) | 0 (0.0%) |
| 60 to 64 Years | 105 (55.9%) | 24 (22.9%) |
| 65 to 74 Years | 51 (27.7%) | 5 (9.8%) |
| 75 Years and over | 12 (6.8%) | 0 (0.0%) |
| Total | 542 (52.7%) | 113 (20.8%) |
Employment Status by Educational Attainment in North Randall
According to labor force statistics for North Randall, 72.0% of individuals (439) out of the total population between 25 and 64 years of age (610) are in the labor force, with 18.2% or 80 of them being unemployed. The group with the highest labor force participation rate are those with the educational attainment of bachelor's degree or higher, with 100.0% or 57 individuals in the labor force. Within the labor force, individuals with college / associate degree education have the highest percentage of unemployment, with 29.1% or 51 of them being unemployed.
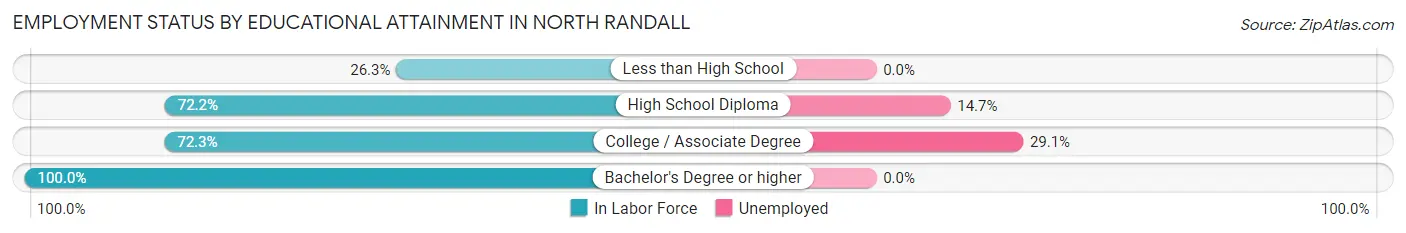
| Educational Attainment | In Labor Force | Unemployed |
| Less than High School | 10 (26.3%) | 0 (0.0%) |
| High School Diploma | 197 (72.2%) | 40 (14.7%) |
| College / Associate Degree | 175 (72.3%) | 70 (29.1%) |
| Bachelor's Degree or higher | 57 (100.0%) | 0 (0.0%) |
| Total | 439 (72.0%) | 111 (18.2%) |
Employment Occupations by Sex in North Randall
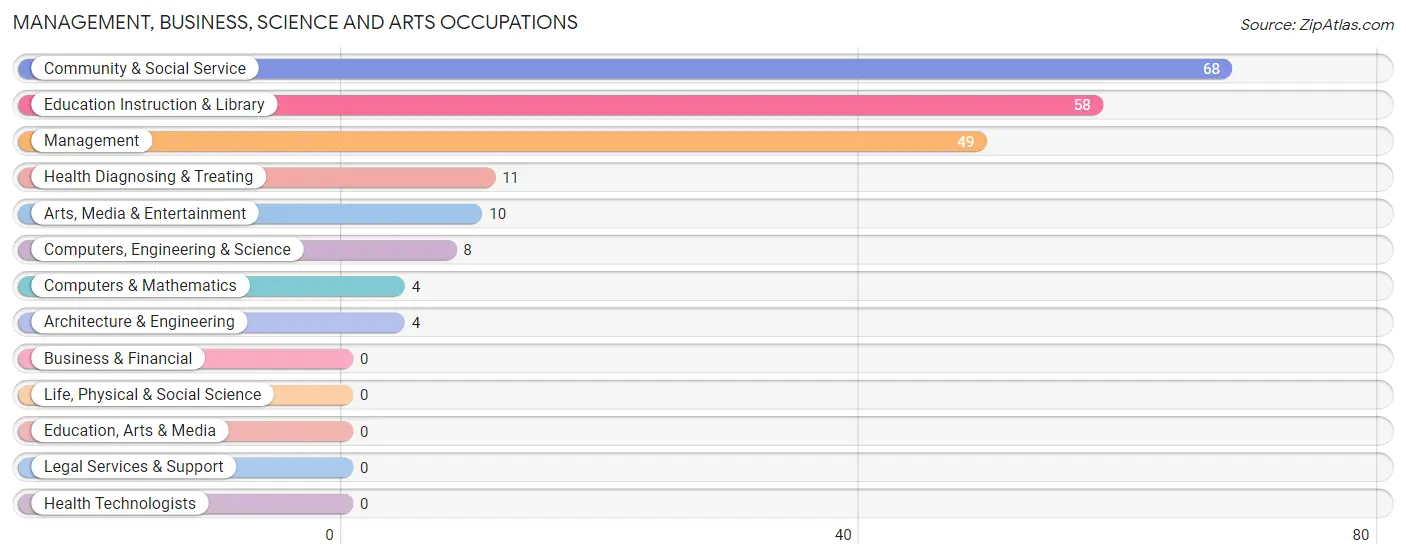
Management, Business, Science and Arts Occupations
The most common Management, Business, Science and Arts occupations in North Randall are Community & Social Service (68 | 15.9%), Education Instruction & Library (58 | 13.5%), Management (49 | 11.4%), Health Diagnosing & Treating (11 | 2.6%), and Arts, Media & Entertainment (10 | 2.3%).
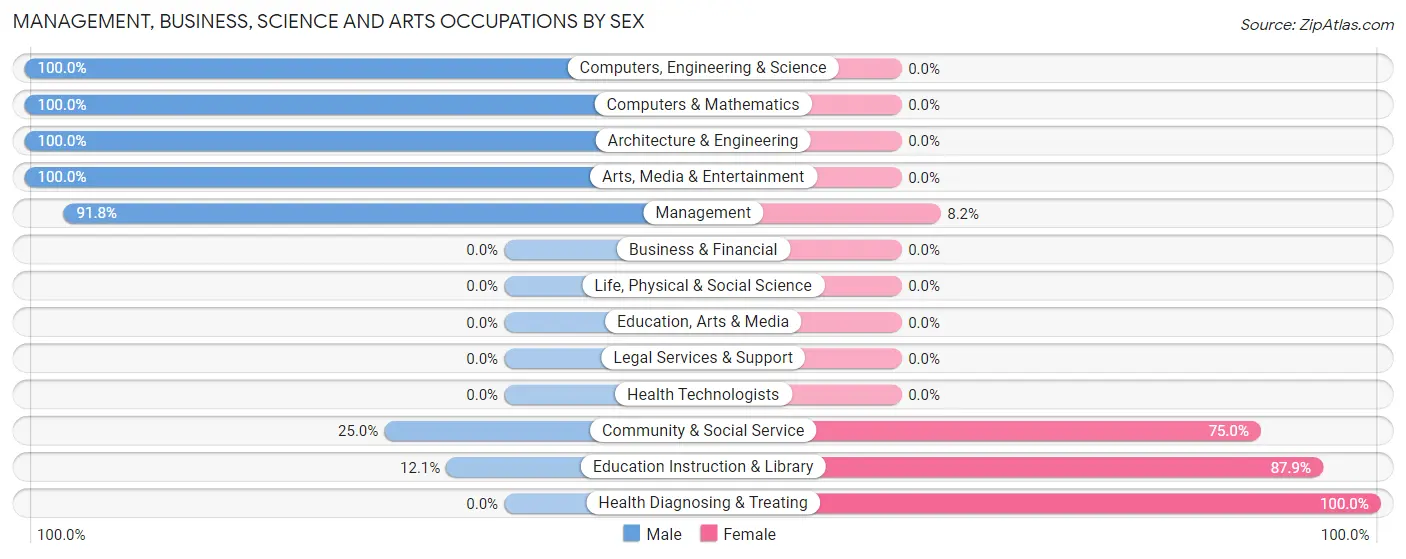
Management, Business, Science and Arts Occupations by Sex
Within the Management, Business, Science and Arts occupations in North Randall, the most male-oriented occupations are Computers, Engineering & Science (100.0%), Computers & Mathematics (100.0%), and Architecture & Engineering (100.0%), while the most female-oriented occupations are Health Diagnosing & Treating (100.0%), Education Instruction & Library (87.9%), and Community & Social Service (75.0%).
| Occupation | Male | Female |
| Management | 45 (91.8%) | 4 (8.2%) |
| Business & Financial | 0 (0.0%) | 0 (0.0%) |
| Computers, Engineering & Science | 8 (100.0%) | 0 (0.0%) |
| Computers & Mathematics | 4 (100.0%) | 0 (0.0%) |
| Architecture & Engineering | 4 (100.0%) | 0 (0.0%) |
| Life, Physical & Social Science | 0 (0.0%) | 0 (0.0%) |
| Community & Social Service | 17 (25.0%) | 51 (75.0%) |
| Education, Arts & Media | 0 (0.0%) | 0 (0.0%) |
| Legal Services & Support | 0 (0.0%) | 0 (0.0%) |
| Education Instruction & Library | 7 (12.1%) | 51 (87.9%) |
| Arts, Media & Entertainment | 10 (100.0%) | 0 (0.0%) |
| Health Diagnosing & Treating | 0 (0.0%) | 11 (100.0%) |
| Health Technologists | 0 (0.0%) | 0 (0.0%) |
| Total (Category) | 70 (51.5%) | 66 (48.5%) |
| Total (Overall) | 224 (52.2%) | 205 (47.8%) |
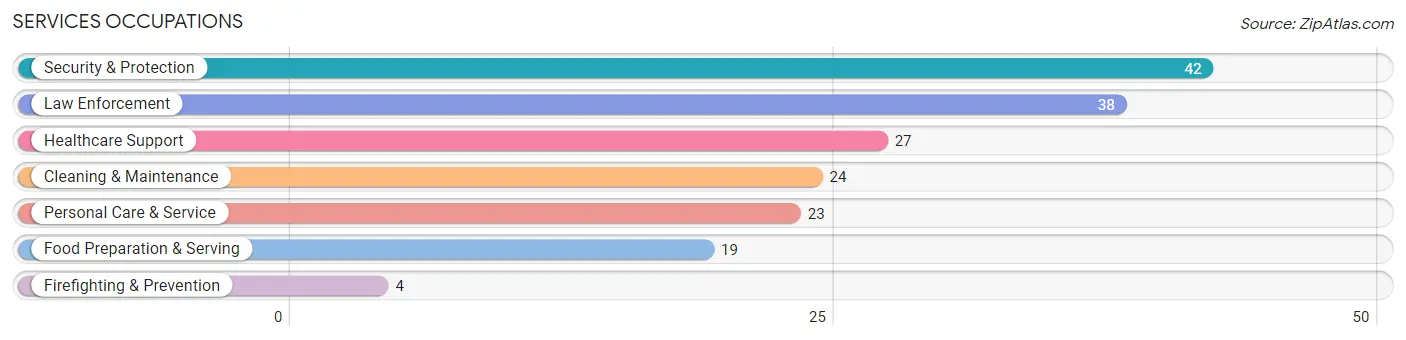
Services Occupations
The most common Services occupations in North Randall are Security & Protection (42 | 9.8%), Law Enforcement (38 | 8.9%), Healthcare Support (27 | 6.3%), Cleaning & Maintenance (24 | 5.6%), and Personal Care & Service (23 | 5.4%).
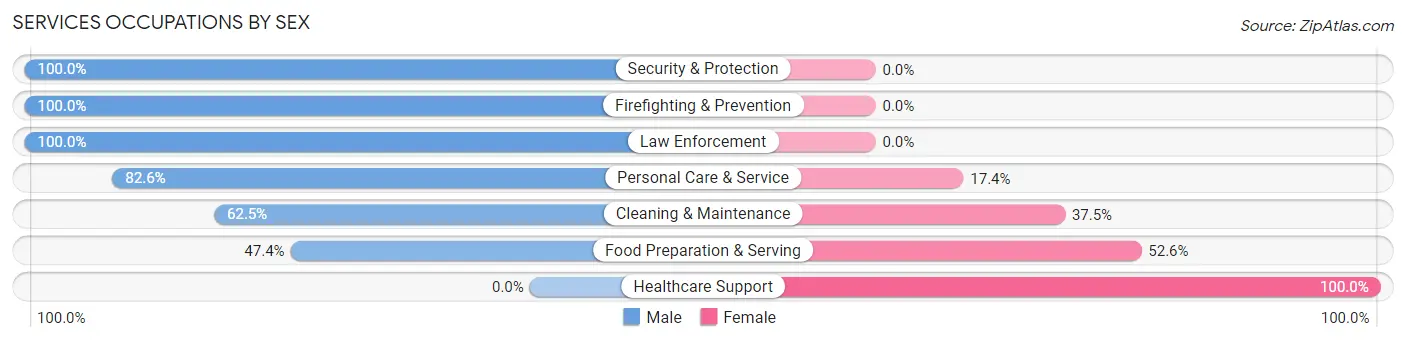
Services Occupations by Sex
Within the Services occupations in North Randall, the most male-oriented occupations are Security & Protection (100.0%), Firefighting & Prevention (100.0%), and Law Enforcement (100.0%), while the most female-oriented occupations are Healthcare Support (100.0%), Food Preparation & Serving (52.6%), and Cleaning & Maintenance (37.5%).
| Occupation | Male | Female |
| Healthcare Support | 0 (0.0%) | 27 (100.0%) |
| Security & Protection | 42 (100.0%) | 0 (0.0%) |
| Firefighting & Prevention | 4 (100.0%) | 0 (0.0%) |
| Law Enforcement | 38 (100.0%) | 0 (0.0%) |
| Food Preparation & Serving | 9 (47.4%) | 10 (52.6%) |
| Cleaning & Maintenance | 15 (62.5%) | 9 (37.5%) |
| Personal Care & Service | 19 (82.6%) | 4 (17.4%) |
| Total (Category) | 85 (63.0%) | 50 (37.0%) |
| Total (Overall) | 224 (52.2%) | 205 (47.8%) |
Sales and Office Occupations
The most common Sales and Office occupations in North Randall are Office & Administration (47 | 11.0%), and Sales & Related (22 | 5.1%).
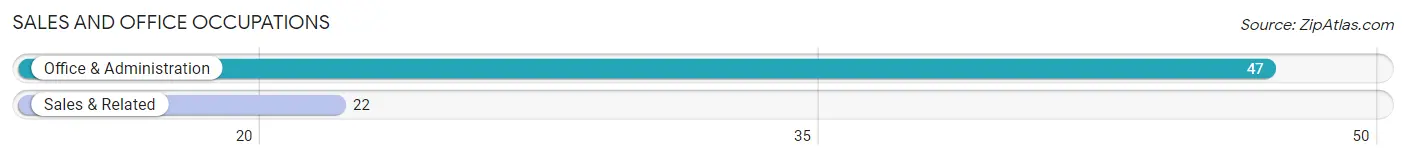
Sales and Office Occupations by Sex
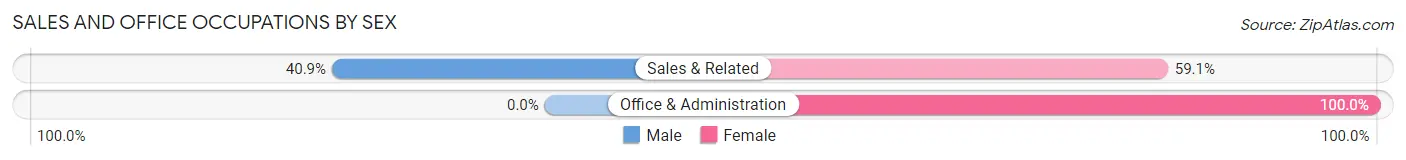
| Occupation | Male | Female |
| Sales & Related | 9 (40.9%) | 13 (59.1%) |
| Office & Administration | 0 (0.0%) | 47 (100.0%) |
| Total (Category) | 9 (13.0%) | 60 (87.0%) |
| Total (Overall) | 224 (52.2%) | 205 (47.8%) |
Natural Resources, Construction and Maintenance Occupations
The most common Natural Resources, Construction and Maintenance occupations in North Randall are , and Installation, Maintenance & Repair (11 | 2.6%).
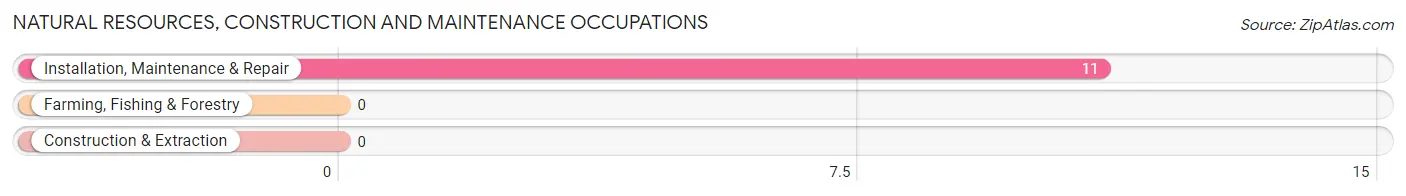
Natural Resources, Construction and Maintenance Occupations by Sex
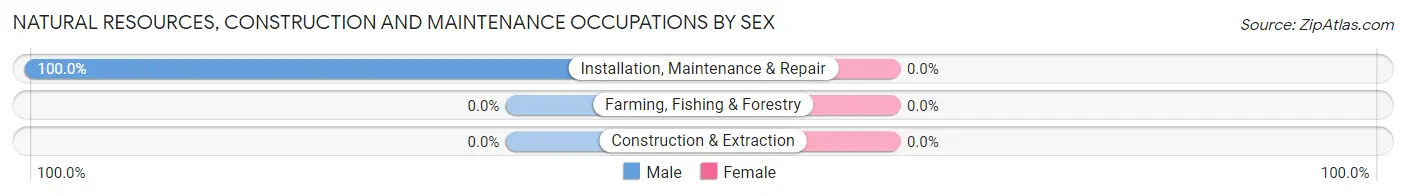
| Occupation | Male | Female |
| Farming, Fishing & Forestry | 0 (0.0%) | 0 (0.0%) |
| Construction & Extraction | 0 (0.0%) | 0 (0.0%) |
| Installation, Maintenance & Repair | 11 (100.0%) | 0 (0.0%) |
| Total (Category) | 11 (100.0%) | 0 (0.0%) |
| Total (Overall) | 224 (52.2%) | 205 (47.8%) |
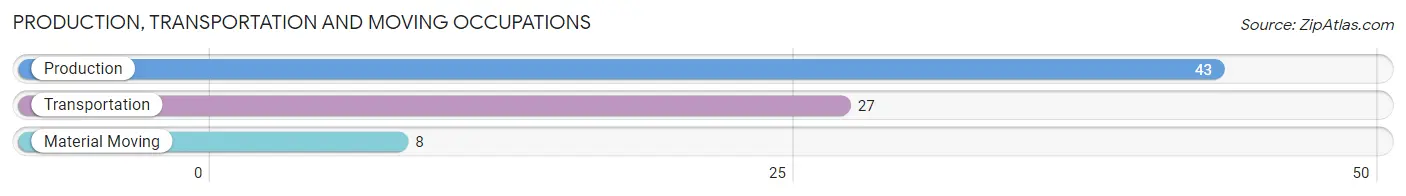
Production, Transportation and Moving Occupations
The most common Production, Transportation and Moving occupations in North Randall are Production (43 | 10.0%), Transportation (27 | 6.3%), and Material Moving (8 | 1.9%).
Production, Transportation and Moving Occupations by Sex
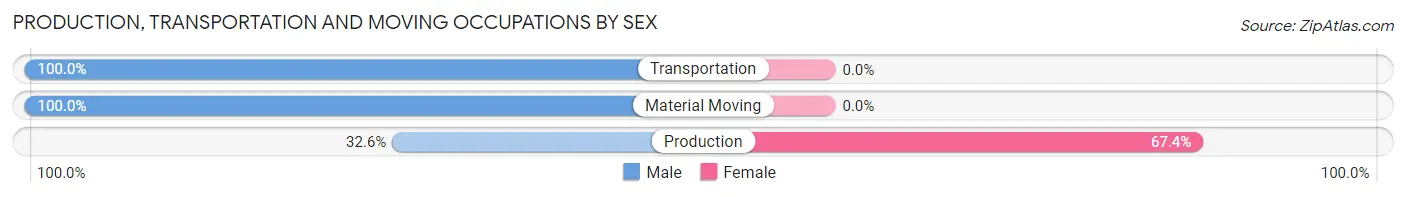
| Occupation | Male | Female |
| Production | 14 (32.6%) | 29 (67.4%) |
| Transportation | 27 (100.0%) | 0 (0.0%) |
| Material Moving | 8 (100.0%) | 0 (0.0%) |
| Total (Category) | 49 (62.8%) | 29 (37.2%) |
| Total (Overall) | 224 (52.2%) | 205 (47.8%) |
Employment Industries by Sex in North Randall
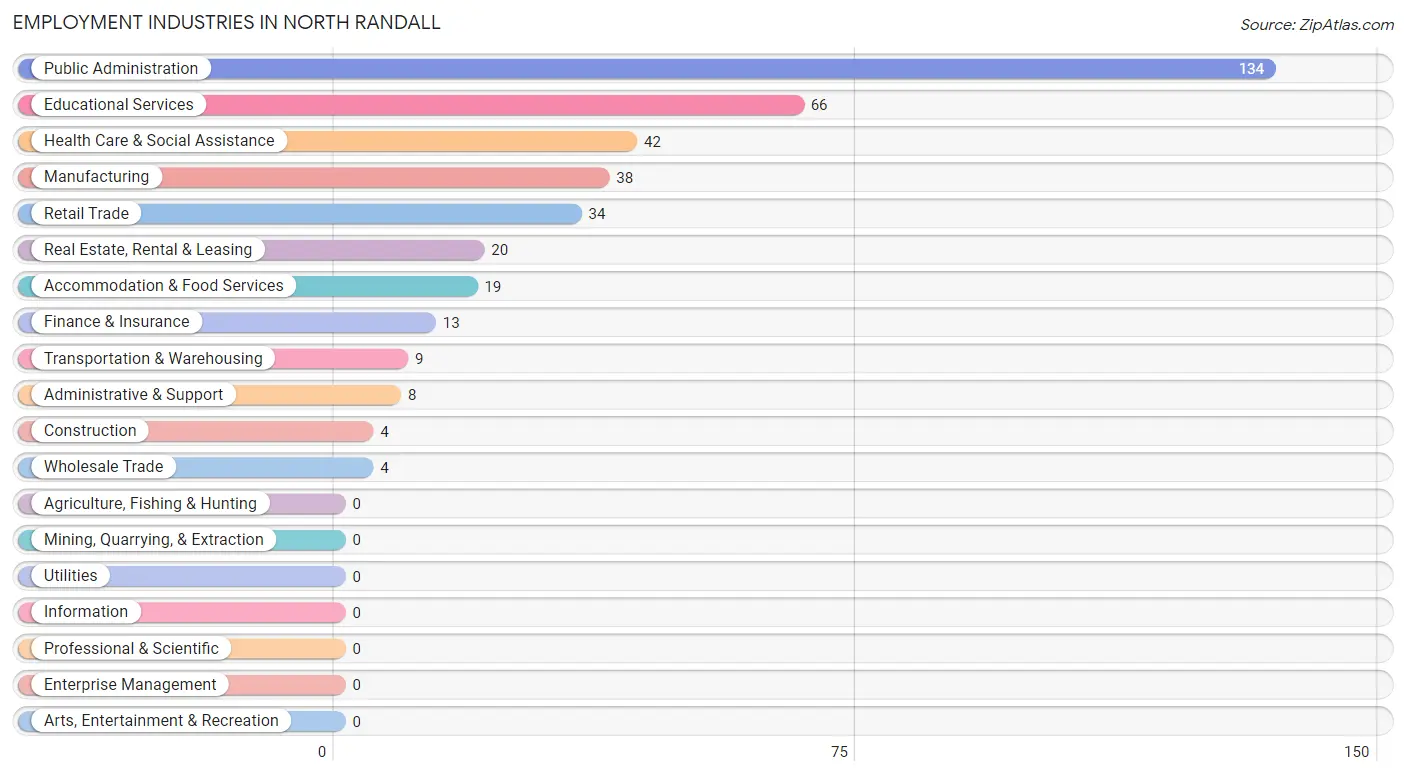
Employment Industries in North Randall
The major employment industries in North Randall include Public Administration (134 | 31.2%), Educational Services (66 | 15.4%), Health Care & Social Assistance (42 | 9.8%), Manufacturing (38 | 8.9%), and Retail Trade (34 | 7.9%).
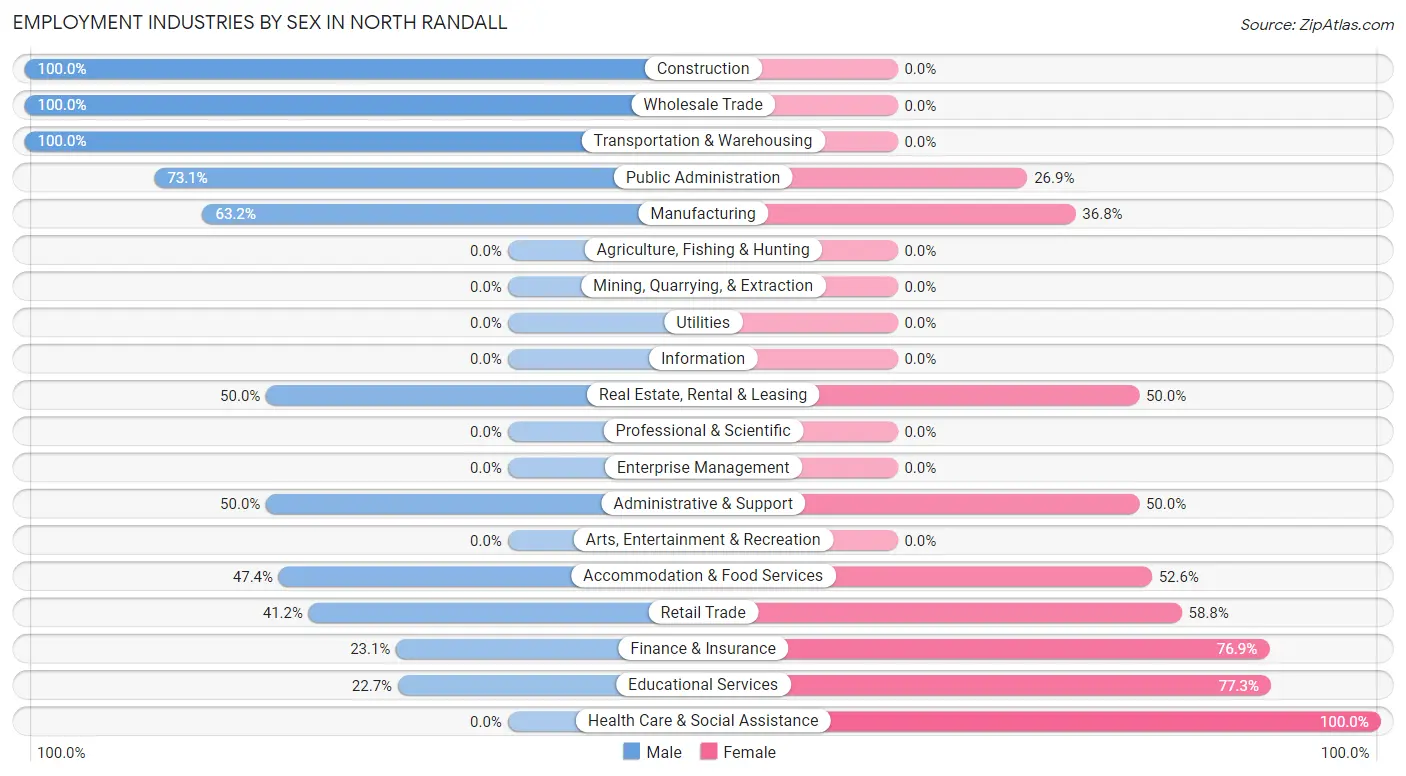
Employment Industries by Sex in North Randall
The North Randall industries that see more men than women are Construction (100.0%), Wholesale Trade (100.0%), and Transportation & Warehousing (100.0%), whereas the industries that tend to have a higher number of women are Health Care & Social Assistance (100.0%), Educational Services (77.3%), and Finance & Insurance (76.9%).
| Industry | Male | Female |
| Agriculture, Fishing & Hunting | 0 (0.0%) | 0 (0.0%) |
| Mining, Quarrying, & Extraction | 0 (0.0%) | 0 (0.0%) |
| Construction | 4 (100.0%) | 0 (0.0%) |
| Manufacturing | 24 (63.2%) | 14 (36.8%) |
| Wholesale Trade | 4 (100.0%) | 0 (0.0%) |
| Retail Trade | 14 (41.2%) | 20 (58.8%) |
| Transportation & Warehousing | 9 (100.0%) | 0 (0.0%) |
| Utilities | 0 (0.0%) | 0 (0.0%) |
| Information | 0 (0.0%) | 0 (0.0%) |
| Finance & Insurance | 3 (23.1%) | 10 (76.9%) |
| Real Estate, Rental & Leasing | 10 (50.0%) | 10 (50.0%) |
| Professional & Scientific | 0 (0.0%) | 0 (0.0%) |
| Enterprise Management | 0 (0.0%) | 0 (0.0%) |
| Administrative & Support | 4 (50.0%) | 4 (50.0%) |
| Educational Services | 15 (22.7%) | 51 (77.3%) |
| Health Care & Social Assistance | 0 (0.0%) | 42 (100.0%) |
| Arts, Entertainment & Recreation | 0 (0.0%) | 0 (0.0%) |
| Accommodation & Food Services | 9 (47.4%) | 10 (52.6%) |
| Public Administration | 98 (73.1%) | 36 (26.9%) |
| Total | 224 (52.2%) | 205 (47.8%) |
Education in North Randall
School Enrollment in North Randall
The most common levels of schooling among the 153 students in North Randall are elementary school (63 | 41.2%), college / undergraduate (56 | 36.6%), and high school (12 | 7.8%).
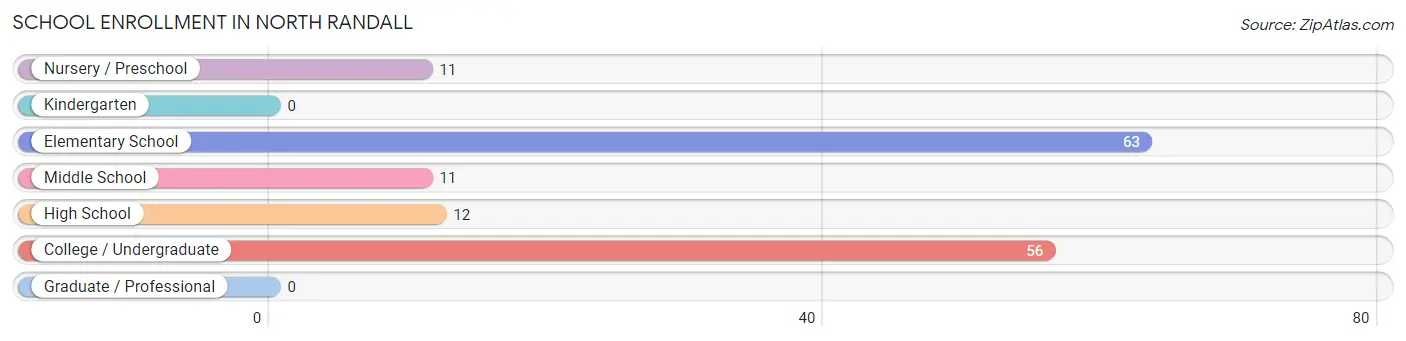
| School Level | # Students | % Students |
| Nursery / Preschool | 11 | 7.2% |
| Kindergarten | 0 | 0.0% |
| Elementary School | 63 | 41.2% |
| Middle School | 11 | 7.2% |
| High School | 12 | 7.8% |
| College / Undergraduate | 56 | 36.6% |
| Graduate / Professional | 0 | 0.0% |
| Total | 153 | 100.0% |
School Enrollment by Age by Funding Source in North Randall
Out of a total of 153 students who are enrolled in schools in North Randall, 51 (33.3%) attend a private institution, while the remaining 102 (66.7%) are enrolled in public schools. The age group of 18 to 19 year olds has the highest likelihood of being enrolled in private schools, with 6 (100.0% in the age bracket) enrolled. Conversely, the age group of 3 to 4 year olds has the lowest likelihood of being enrolled in a private school, with 11 (100.0% in the age bracket) attending a public institution.
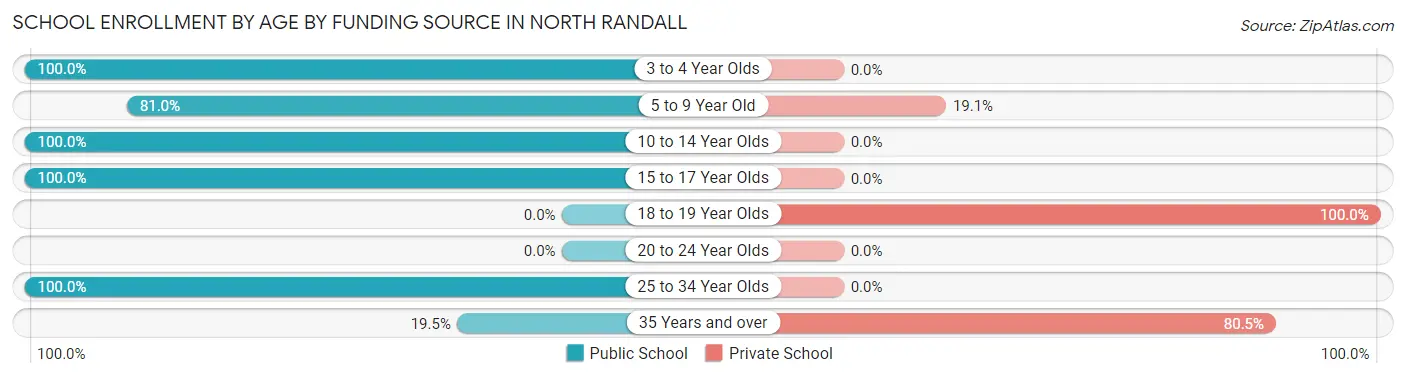
| Age Bracket | Public School | Private School |
| 3 to 4 Year Olds | 11 (100.0%) | 0 (0.0%) |
| 5 to 9 Year Old | 51 (80.9%) | 12 (19.1%) |
| 10 to 14 Year Olds | 11 (100.0%) | 0 (0.0%) |
| 15 to 17 Year Olds | 12 (100.0%) | 0 (0.0%) |
| 18 to 19 Year Olds | 0 (0.0%) | 6 (100.0%) |
| 20 to 24 Year Olds | 0 (0.0%) | 0 (0.0%) |
| 25 to 34 Year Olds | 9 (100.0%) | 0 (0.0%) |
| 35 Years and over | 8 (19.5%) | 33 (80.5%) |
| Total | 102 (66.7%) | 51 (33.3%) |
Educational Attainment by Field of Study in North Randall
Education (25 | 29.8%), arts & humanities (23 | 27.4%), business (19 | 22.6%), literature & languages (10 | 11.9%), and physical & health sciences (4 | 4.8%) are the most common fields of study among 84 individuals in North Randall who have obtained a bachelor's degree or higher.
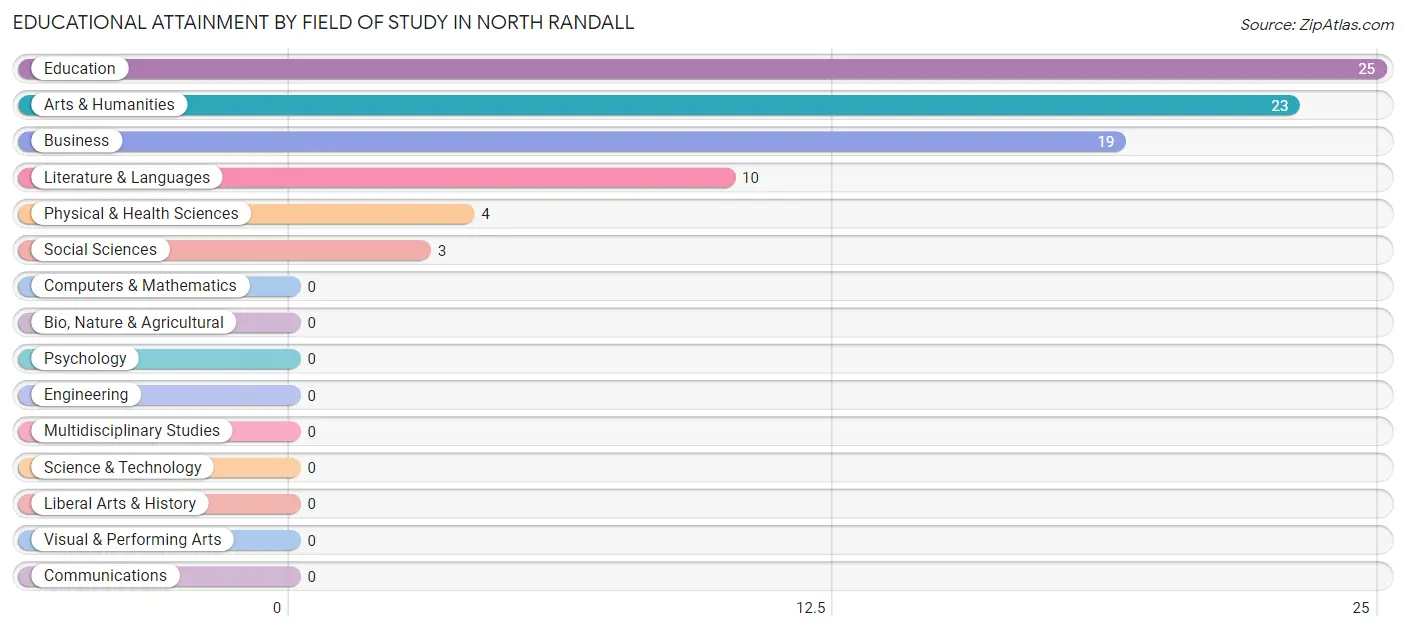
| Field of Study | # Graduates | % Graduates |
| Computers & Mathematics | 0 | 0.0% |
| Bio, Nature & Agricultural | 0 | 0.0% |
| Physical & Health Sciences | 4 | 4.8% |
| Psychology | 0 | 0.0% |
| Social Sciences | 3 | 3.6% |
| Engineering | 0 | 0.0% |
| Multidisciplinary Studies | 0 | 0.0% |
| Science & Technology | 0 | 0.0% |
| Business | 19 | 22.6% |
| Education | 25 | 29.8% |
| Literature & Languages | 10 | 11.9% |
| Liberal Arts & History | 0 | 0.0% |
| Visual & Performing Arts | 0 | 0.0% |
| Communications | 0 | 0.0% |
| Arts & Humanities | 23 | 27.4% |
| Total | 84 | 100.0% |
Transportation & Commute in North Randall
Vehicle Availability by Sex in North Randall
The most prevalent vehicle ownership categories in North Randall are males with 1 vehicle (158, accounting for 70.5%) and females with 1 vehicle (79, making up 78.6%).
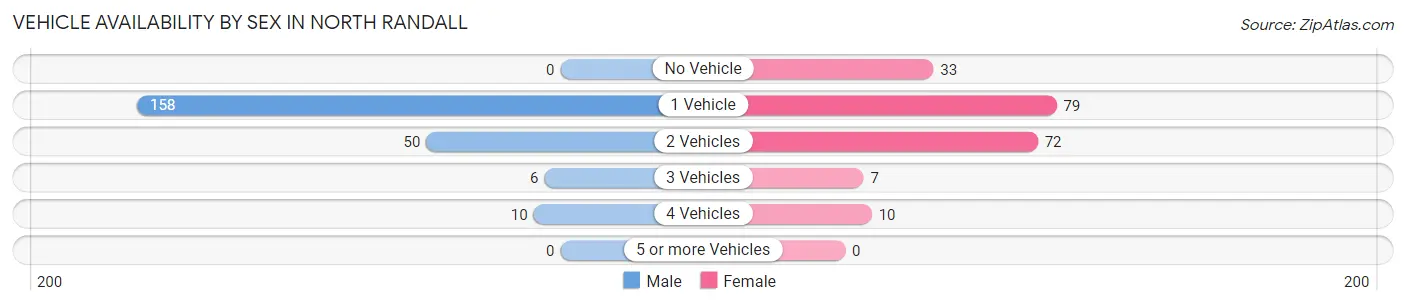
| Vehicles Available | Male | Female |
| No Vehicle | 0 (0.0%) | 33 (16.4%) |
| 1 Vehicle | 158 (70.5%) | 79 (39.3%) |
| 2 Vehicles | 50 (22.3%) | 72 (35.8%) |
| 3 Vehicles | 6 (2.7%) | 7 (3.5%) |
| 4 Vehicles | 10 (4.5%) | 10 (5.0%) |
| 5 or more Vehicles | 0 (0.0%) | 0 (0.0%) |
| Total | 224 (100.0%) | 201 (100.0%) |
Commute Time in North Randall
The most frequently occuring commute durations in North Randall are 30 to 34 minutes (97 commuters, 23.5%), 5 to 9 minutes (77 commuters, 18.7%), and 15 to 19 minutes (73 commuters, 17.7%).
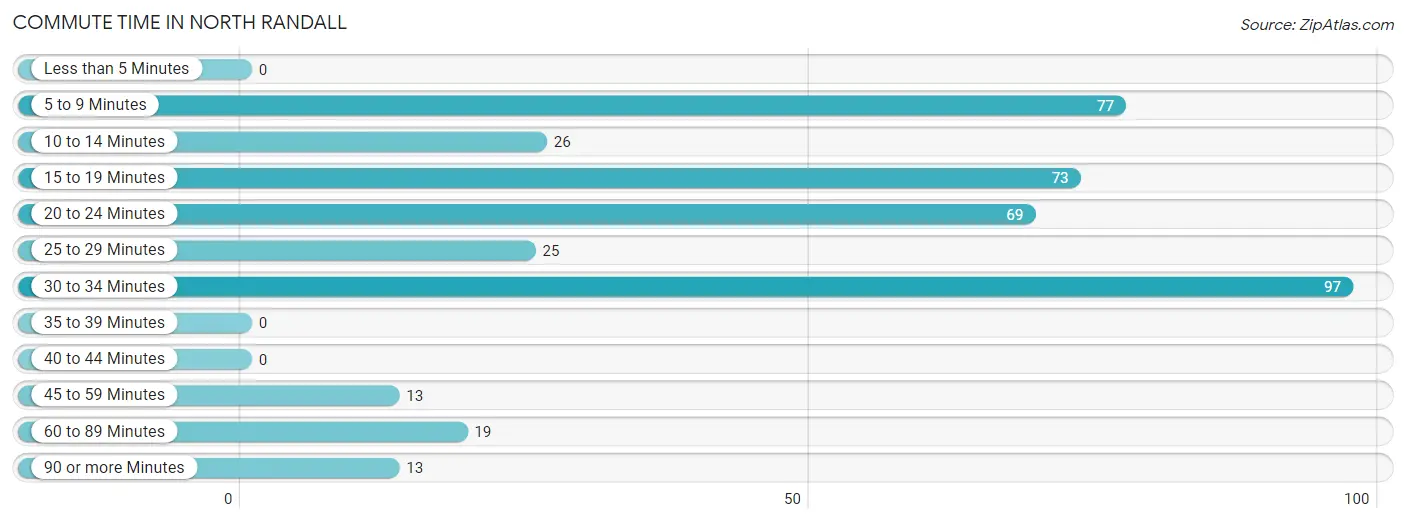
| Commute Time | # Commuters | % Commuters |
| Less than 5 Minutes | 0 | 0.0% |
| 5 to 9 Minutes | 77 | 18.7% |
| 10 to 14 Minutes | 26 | 6.3% |
| 15 to 19 Minutes | 73 | 17.7% |
| 20 to 24 Minutes | 69 | 16.8% |
| 25 to 29 Minutes | 25 | 6.1% |
| 30 to 34 Minutes | 97 | 23.5% |
| 35 to 39 Minutes | 0 | 0.0% |
| 40 to 44 Minutes | 0 | 0.0% |
| 45 to 59 Minutes | 13 | 3.2% |
| 60 to 89 Minutes | 19 | 4.6% |
| 90 or more Minutes | 13 | 3.2% |
Commute Time by Sex in North Randall
The most common commute times in North Randall are 5 to 9 minutes (73 commuters, 34.0%) for males and 30 to 34 minutes (75 commuters, 38.1%) for females.
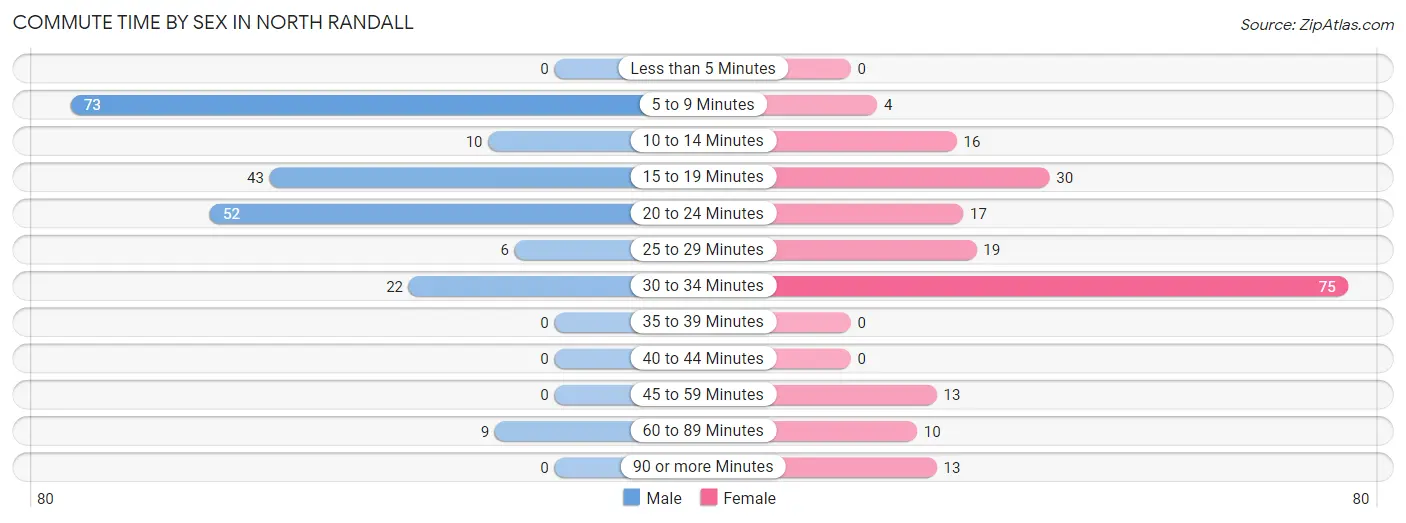
| Commute Time | Male | Female |
| Less than 5 Minutes | 0 (0.0%) | 0 (0.0%) |
| 5 to 9 Minutes | 73 (34.0%) | 4 (2.0%) |
| 10 to 14 Minutes | 10 (4.6%) | 16 (8.1%) |
| 15 to 19 Minutes | 43 (20.0%) | 30 (15.2%) |
| 20 to 24 Minutes | 52 (24.2%) | 17 (8.6%) |
| 25 to 29 Minutes | 6 (2.8%) | 19 (9.6%) |
| 30 to 34 Minutes | 22 (10.2%) | 75 (38.1%) |
| 35 to 39 Minutes | 0 (0.0%) | 0 (0.0%) |
| 40 to 44 Minutes | 0 (0.0%) | 0 (0.0%) |
| 45 to 59 Minutes | 0 (0.0%) | 13 (6.6%) |
| 60 to 89 Minutes | 9 (4.2%) | 10 (5.1%) |
| 90 or more Minutes | 0 (0.0%) | 13 (6.6%) |
Time of Departure to Work by Sex in North Randall
The most frequent times of departure to work in North Randall are 8:00 AM to 8:29 AM (61, 28.4%) for males and 6:30 AM to 6:59 AM (81, 41.1%) for females.
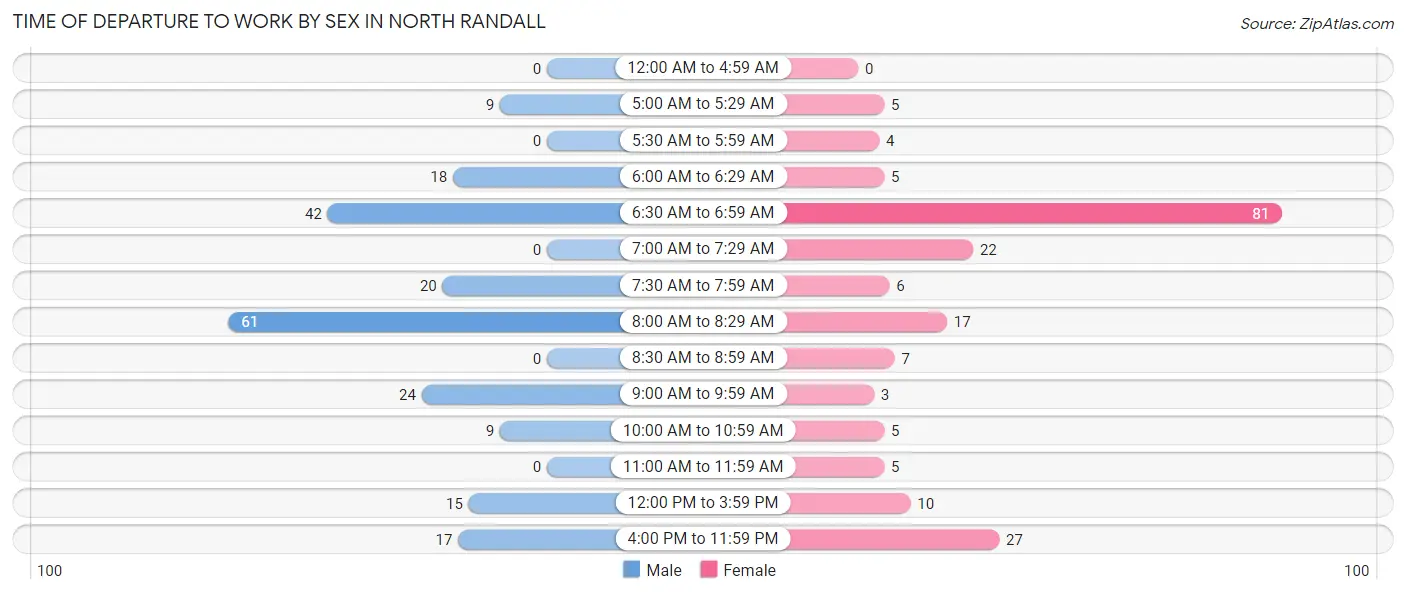
| Time of Departure | Male | Female |
| 12:00 AM to 4:59 AM | 0 (0.0%) | 0 (0.0%) |
| 5:00 AM to 5:29 AM | 9 (4.2%) | 5 (2.5%) |
| 5:30 AM to 5:59 AM | 0 (0.0%) | 4 (2.0%) |
| 6:00 AM to 6:29 AM | 18 (8.4%) | 5 (2.5%) |
| 6:30 AM to 6:59 AM | 42 (19.5%) | 81 (41.1%) |
| 7:00 AM to 7:29 AM | 0 (0.0%) | 22 (11.2%) |
| 7:30 AM to 7:59 AM | 20 (9.3%) | 6 (3.0%) |
| 8:00 AM to 8:29 AM | 61 (28.4%) | 17 (8.6%) |
| 8:30 AM to 8:59 AM | 0 (0.0%) | 7 (3.5%) |
| 9:00 AM to 9:59 AM | 24 (11.2%) | 3 (1.5%) |
| 10:00 AM to 10:59 AM | 9 (4.2%) | 5 (2.5%) |
| 11:00 AM to 11:59 AM | 0 (0.0%) | 5 (2.5%) |
| 12:00 PM to 3:59 PM | 15 (7.0%) | 10 (5.1%) |
| 4:00 PM to 11:59 PM | 17 (7.9%) | 27 (13.7%) |
| Total | 215 (100.0%) | 197 (100.0%) |
Housing Occupancy in North Randall
Occupancy by Ownership in North Randall
Of the total 570 dwellings in North Randall, owner-occupied units account for 144 (25.3%), while renter-occupied units make up 426 (74.7%).
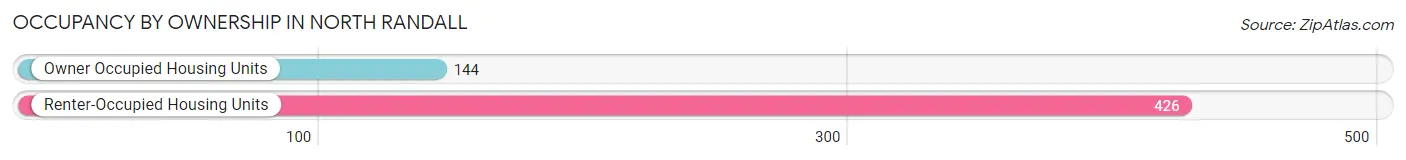
| Occupancy | # Housing Units | % Housing Units |
| Owner Occupied Housing Units | 144 | 25.3% |
| Renter-Occupied Housing Units | 426 | 74.7% |
| Total Occupied Housing Units | 570 | 100.0% |
Occupancy by Household Size in North Randall
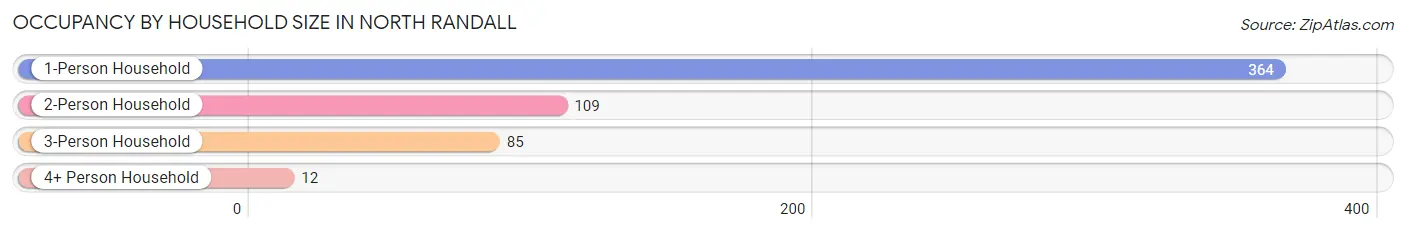
| Household Size | # Housing Units | % Housing Units |
| 1-Person Household | 364 | 63.9% |
| 2-Person Household | 109 | 19.1% |
| 3-Person Household | 85 | 14.9% |
| 4+ Person Household | 12 | 2.1% |
| Total Housing Units | 570 | 100.0% |
Occupancy by Ownership by Household Size in North Randall
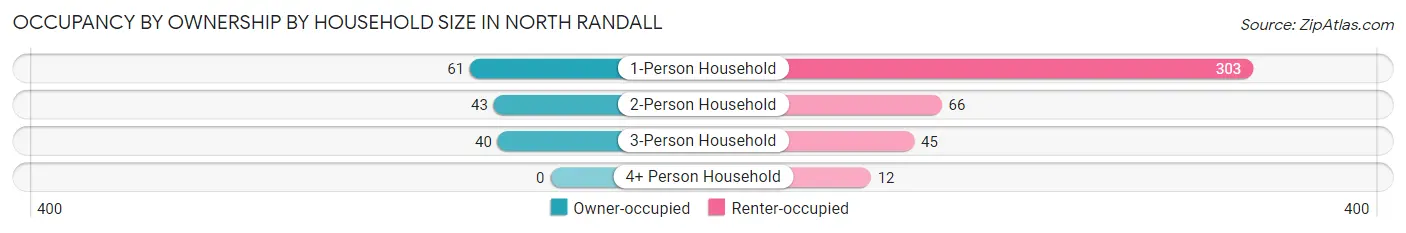
| Household Size | Owner-occupied | Renter-occupied |
| 1-Person Household | 61 (16.8%) | 303 (83.2%) |
| 2-Person Household | 43 (39.5%) | 66 (60.6%) |
| 3-Person Household | 40 (47.1%) | 45 (52.9%) |
| 4+ Person Household | 0 (0.0%) | 12 (100.0%) |
| Total Housing Units | 144 (25.3%) | 426 (74.7%) |
Occupancy by Educational Attainment in North Randall
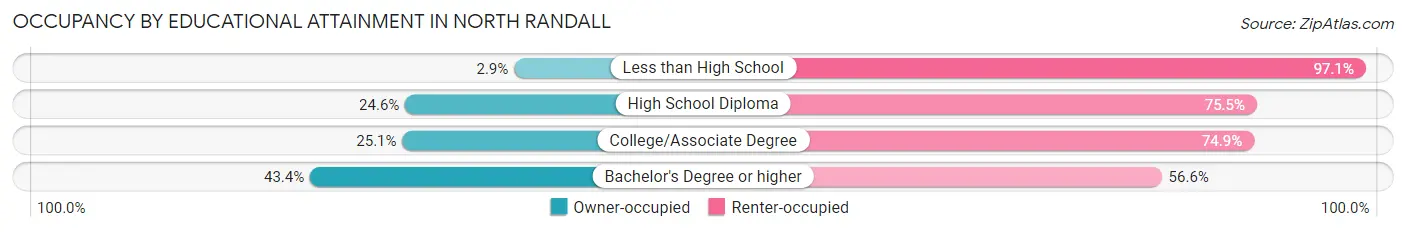
| Household Size | Owner-occupied | Renter-occupied |
| Less than High School | 1 (2.9%) | 33 (97.1%) |
| High School Diploma | 54 (24.5%) | 166 (75.4%) |
| College/Associate Degree | 66 (25.1%) | 197 (74.9%) |
| Bachelor's Degree or higher | 23 (43.4%) | 30 (56.6%) |
Occupancy by Age of Householder in North Randall
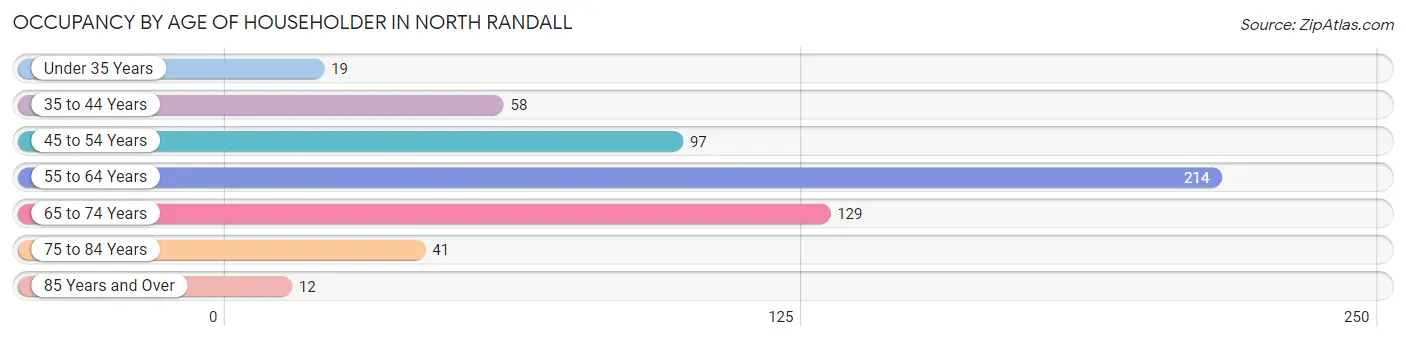
| Age Bracket | # Households | % Households |
| Under 35 Years | 19 | 3.3% |
| 35 to 44 Years | 58 | 10.2% |
| 45 to 54 Years | 97 | 17.0% |
| 55 to 64 Years | 214 | 37.5% |
| 65 to 74 Years | 129 | 22.6% |
| 75 to 84 Years | 41 | 7.2% |
| 85 Years and Over | 12 | 2.1% |
| Total | 570 | 100.0% |
Housing Finances in North Randall
Median Income by Occupancy in North Randall
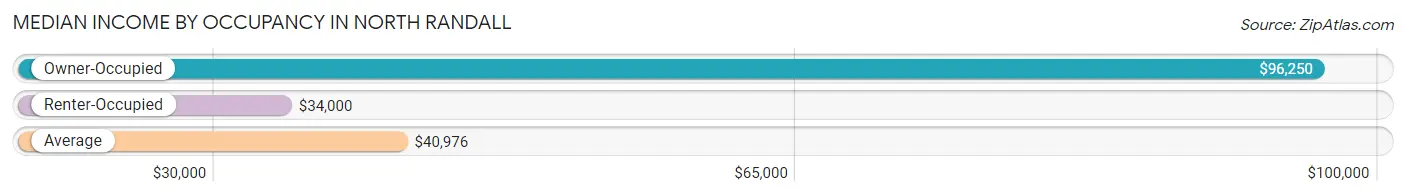
| Occupancy Type | # Households | Median Income |
| Owner-Occupied | 144 (25.3%) | $96,250 |
| Renter-Occupied | 426 (74.7%) | $34,000 |
| Average | 570 (100.0%) | $40,976 |
Occupancy by Householder Income Bracket in North Randall
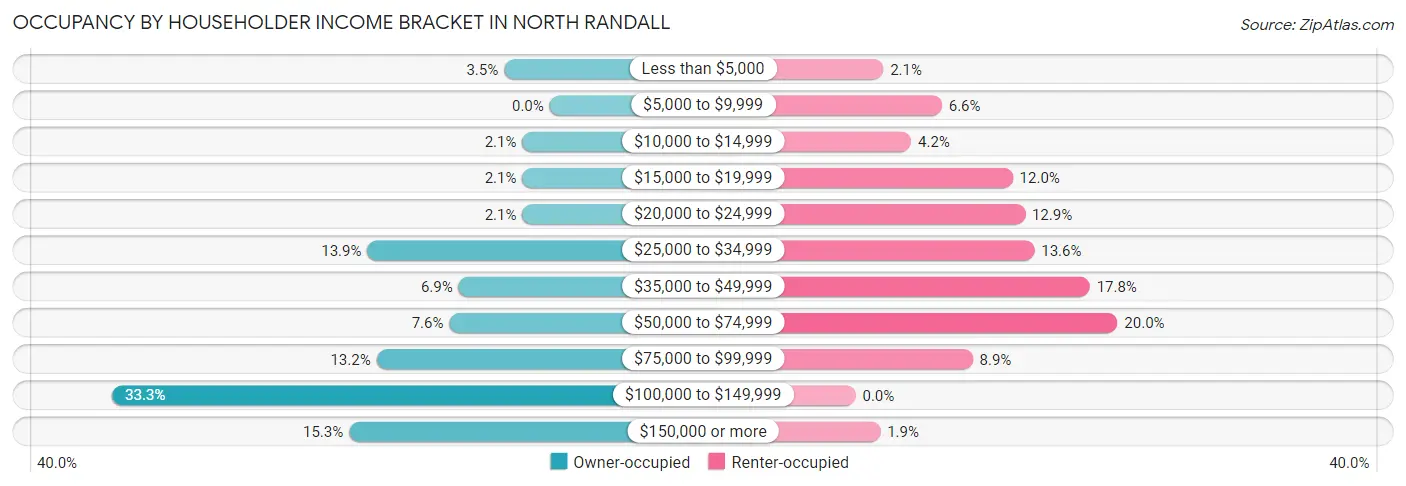
| Income Bracket | Owner-occupied | Renter-occupied |
| Less than $5,000 | 5 (3.5%) | 9 (2.1%) |
| $5,000 to $9,999 | 0 (0.0%) | 28 (6.6%) |
| $10,000 to $14,999 | 3 (2.1%) | 18 (4.2%) |
| $15,000 to $19,999 | 3 (2.1%) | 51 (12.0%) |
| $20,000 to $24,999 | 3 (2.1%) | 55 (12.9%) |
| $25,000 to $34,999 | 20 (13.9%) | 58 (13.6%) |
| $35,000 to $49,999 | 10 (6.9%) | 76 (17.8%) |
| $50,000 to $74,999 | 11 (7.6%) | 85 (20.0%) |
| $75,000 to $99,999 | 19 (13.2%) | 38 (8.9%) |
| $100,000 to $149,999 | 48 (33.3%) | 0 (0.0%) |
| $150,000 or more | 22 (15.3%) | 8 (1.9%) |
| Total | 144 (100.0%) | 426 (100.0%) |
Monthly Housing Cost Tiers in North Randall
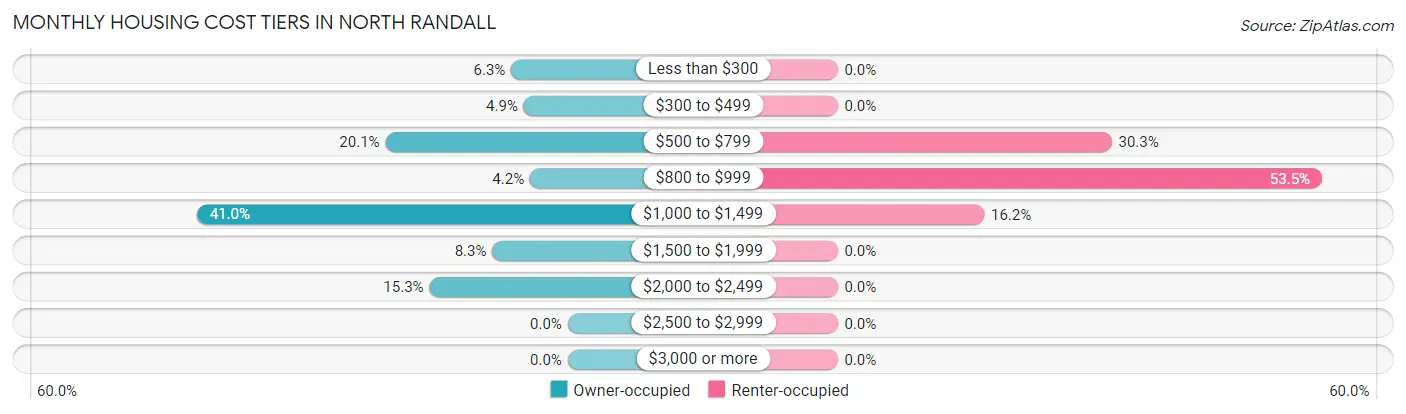
| Monthly Cost | Owner-occupied | Renter-occupied |
| Less than $300 | 9 (6.2%) | 0 (0.0%) |
| $300 to $499 | 7 (4.9%) | 0 (0.0%) |
| $500 to $799 | 29 (20.1%) | 129 (30.3%) |
| $800 to $999 | 6 (4.2%) | 228 (53.5%) |
| $1,000 to $1,499 | 59 (41.0%) | 69 (16.2%) |
| $1,500 to $1,999 | 12 (8.3%) | 0 (0.0%) |
| $2,000 to $2,499 | 22 (15.3%) | 0 (0.0%) |
| $2,500 to $2,999 | 0 (0.0%) | 0 (0.0%) |
| $3,000 or more | 0 (0.0%) | 0 (0.0%) |
| Total | 144 (100.0%) | 426 (100.0%) |
Physical Housing Characteristics in North Randall
Housing Structures in North Randall
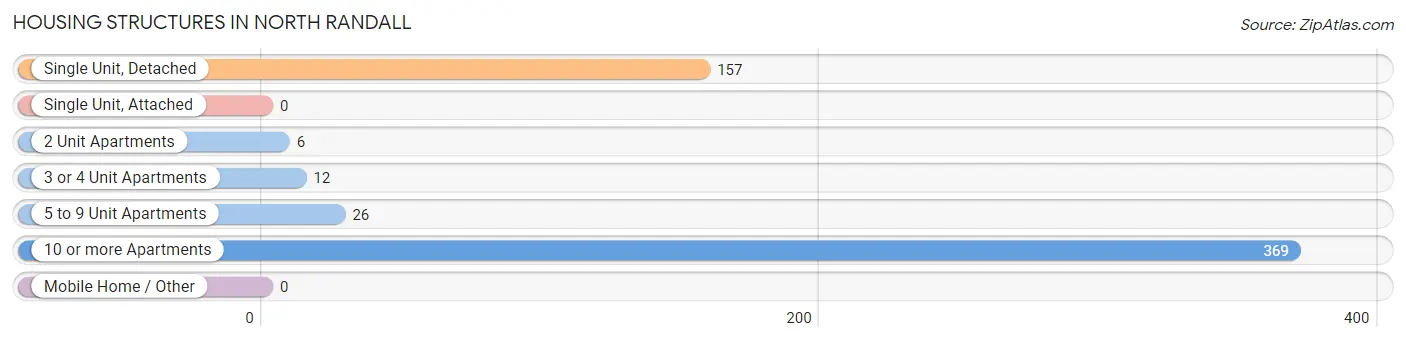
| Structure Type | # Housing Units | % Housing Units |
| Single Unit, Detached | 157 | 27.5% |
| Single Unit, Attached | 0 | 0.0% |
| 2 Unit Apartments | 6 | 1.1% |
| 3 or 4 Unit Apartments | 12 | 2.1% |
| 5 to 9 Unit Apartments | 26 | 4.6% |
| 10 or more Apartments | 369 | 64.7% |
| Mobile Home / Other | 0 | 0.0% |
| Total | 570 | 100.0% |
Housing Structures by Occupancy in North Randall
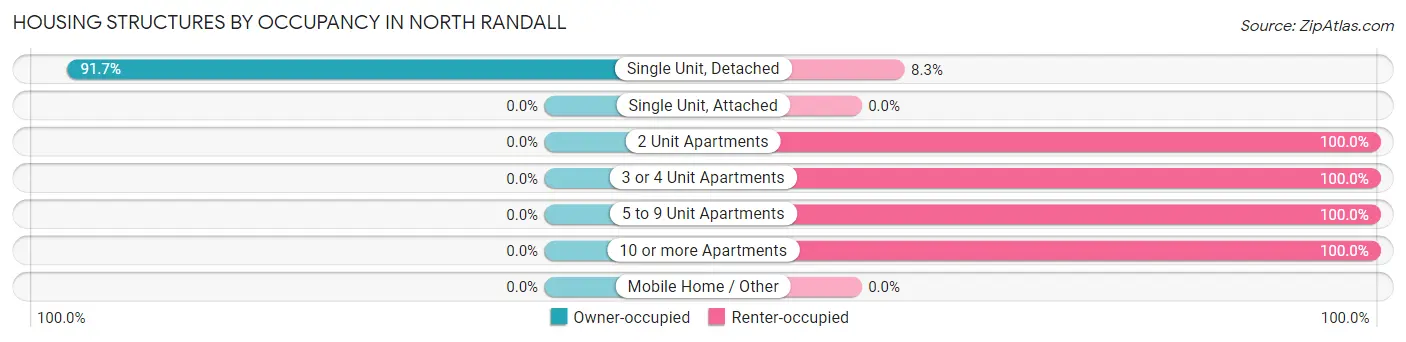
| Structure Type | Owner-occupied | Renter-occupied |
| Single Unit, Detached | 144 (91.7%) | 13 (8.3%) |
| Single Unit, Attached | 0 (0.0%) | 0 (0.0%) |
| 2 Unit Apartments | 0 (0.0%) | 6 (100.0%) |
| 3 or 4 Unit Apartments | 0 (0.0%) | 12 (100.0%) |
| 5 to 9 Unit Apartments | 0 (0.0%) | 26 (100.0%) |
| 10 or more Apartments | 0 (0.0%) | 369 (100.0%) |
| Mobile Home / Other | 0 (0.0%) | 0 (0.0%) |
| Total | 144 (25.3%) | 426 (74.7%) |
Housing Structures by Number of Rooms in North Randall
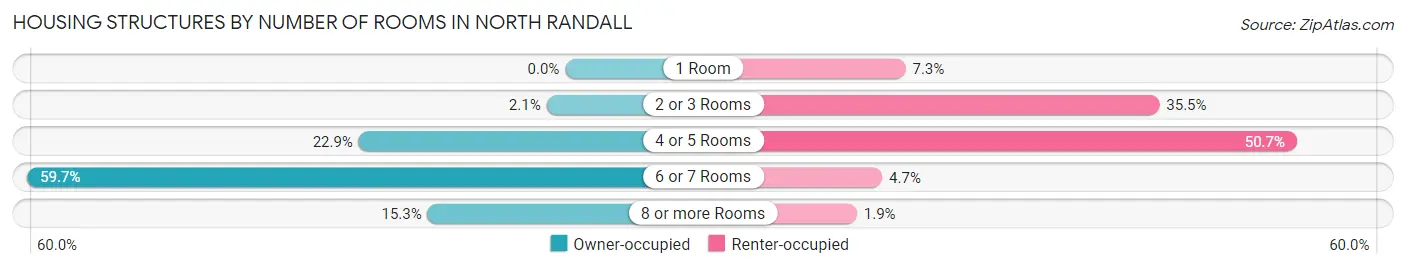
| Number of Rooms | Owner-occupied | Renter-occupied |
| 1 Room | 0 (0.0%) | 31 (7.3%) |
| 2 or 3 Rooms | 3 (2.1%) | 151 (35.4%) |
| 4 or 5 Rooms | 33 (22.9%) | 216 (50.7%) |
| 6 or 7 Rooms | 86 (59.7%) | 20 (4.7%) |
| 8 or more Rooms | 22 (15.3%) | 8 (1.9%) |
| Total | 144 (100.0%) | 426 (100.0%) |
Housing Structure by Heating Type in North Randall
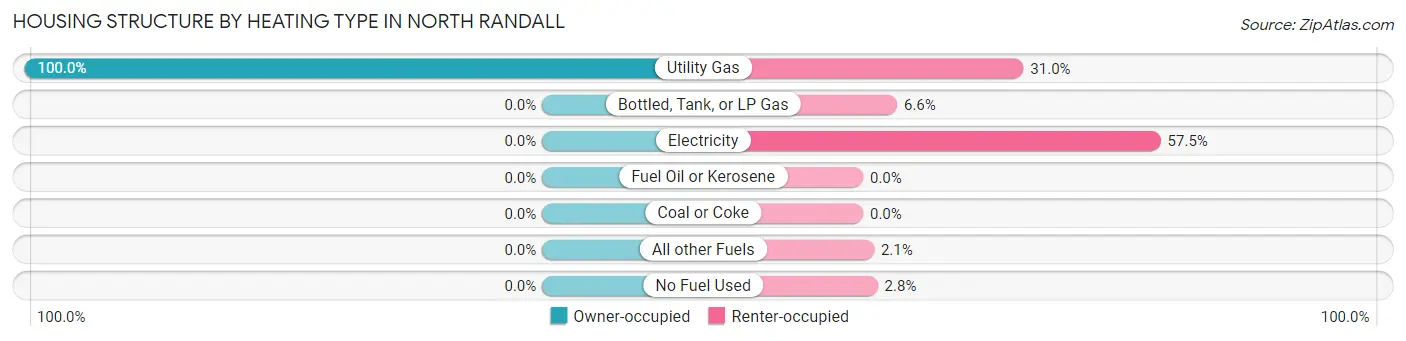
| Heating Type | Owner-occupied | Renter-occupied |
| Utility Gas | 144 (100.0%) | 132 (31.0%) |
| Bottled, Tank, or LP Gas | 0 (0.0%) | 28 (6.6%) |
| Electricity | 0 (0.0%) | 245 (57.5%) |
| Fuel Oil or Kerosene | 0 (0.0%) | 0 (0.0%) |
| Coal or Coke | 0 (0.0%) | 0 (0.0%) |
| All other Fuels | 0 (0.0%) | 9 (2.1%) |
| No Fuel Used | 0 (0.0%) | 12 (2.8%) |
| Total | 144 (100.0%) | 426 (100.0%) |
Household Vehicle Usage in North Randall
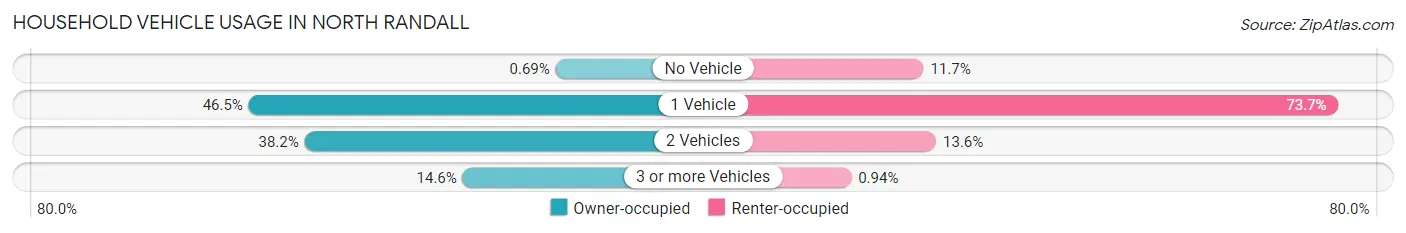
| Vehicles per Household | Owner-occupied | Renter-occupied |
| No Vehicle | 1 (0.7%) | 50 (11.7%) |
| 1 Vehicle | 67 (46.5%) | 314 (73.7%) |
| 2 Vehicles | 55 (38.2%) | 58 (13.6%) |
| 3 or more Vehicles | 21 (14.6%) | 4 (0.9%) |
| Total | 144 (100.0%) | 426 (100.0%) |
Real Estate & Mortgages in North Randall
Real Estate and Mortgage Overview in North Randall
| Characteristic | Without Mortgage | With Mortgage |
| Housing Units | 45 | 99 |
| Median Property Value | $106,800 | $121,900 |
| Median Household Income | $34,688 | $22 |
| Monthly Housing Costs | $541 | $0 |
| Real Estate Taxes | $2,457 | $0 |
Property Value by Mortgage Status in North Randall
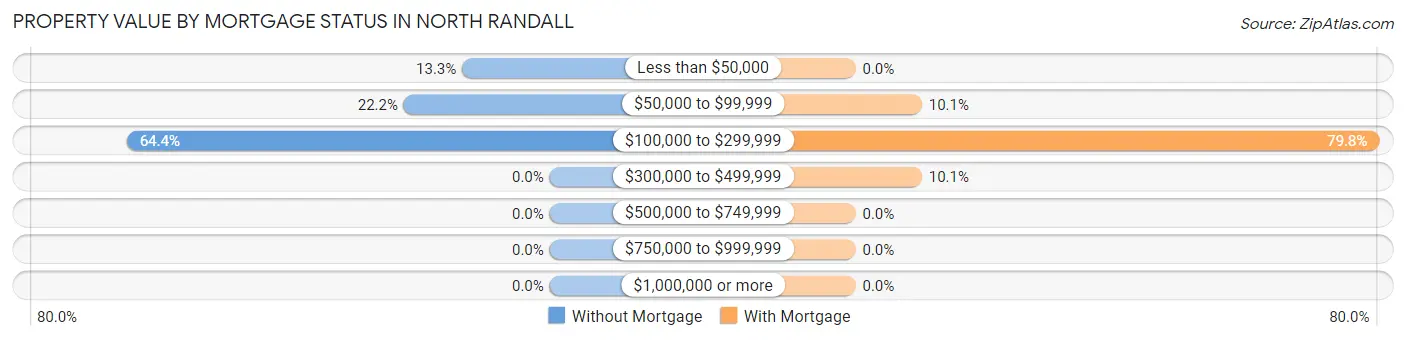
| Property Value | Without Mortgage | With Mortgage |
| Less than $50,000 | 6 (13.3%) | 0 (0.0%) |
| $50,000 to $99,999 | 10 (22.2%) | 10 (10.1%) |
| $100,000 to $299,999 | 29 (64.4%) | 79 (79.8%) |
| $300,000 to $499,999 | 0 (0.0%) | 10 (10.1%) |
| $500,000 to $749,999 | 0 (0.0%) | 0 (0.0%) |
| $750,000 to $999,999 | 0 (0.0%) | 0 (0.0%) |
| $1,000,000 or more | 0 (0.0%) | 0 (0.0%) |
| Total | 45 (100.0%) | 99 (100.0%) |
Household Income by Mortgage Status in North Randall
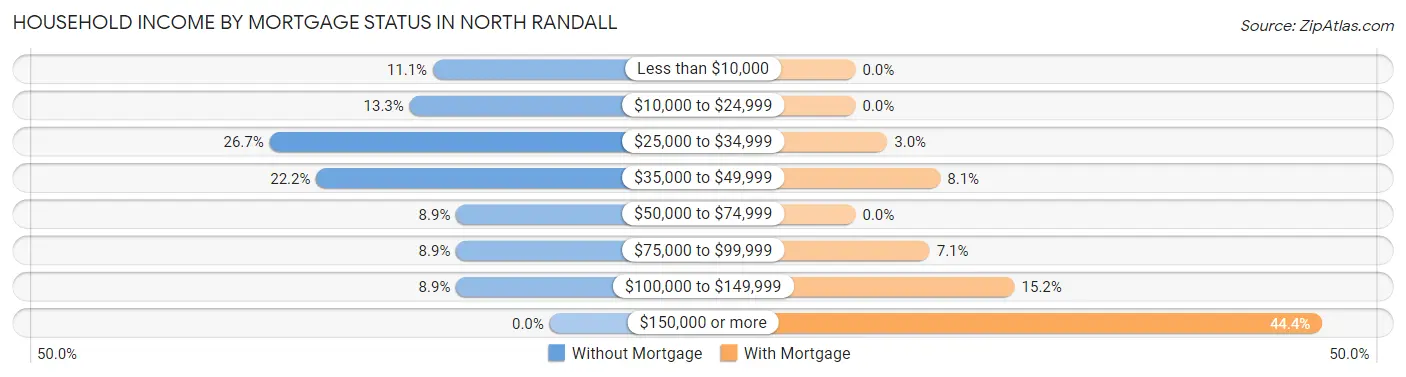
| Household Income | Without Mortgage | With Mortgage |
| Less than $10,000 | 5 (11.1%) | 0 (0.0%) |
| $10,000 to $24,999 | 6 (13.3%) | 0 (0.0%) |
| $25,000 to $34,999 | 12 (26.7%) | 3 (3.0%) |
| $35,000 to $49,999 | 10 (22.2%) | 8 (8.1%) |
| $50,000 to $74,999 | 4 (8.9%) | 0 (0.0%) |
| $75,000 to $99,999 | 4 (8.9%) | 7 (7.1%) |
| $100,000 to $149,999 | 4 (8.9%) | 15 (15.1%) |
| $150,000 or more | 0 (0.0%) | 44 (44.4%) |
| Total | 45 (100.0%) | 99 (100.0%) |
Property Value to Household Income Ratio in North Randall
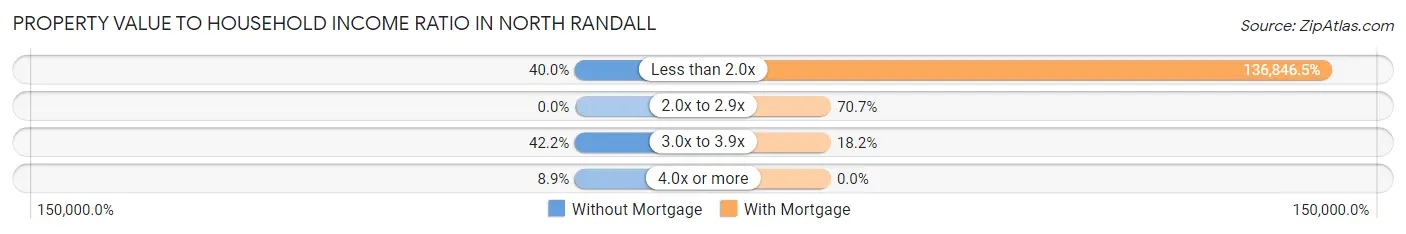
| Value-to-Income Ratio | Without Mortgage | With Mortgage |
| Less than 2.0x | 18 (40.0%) | 135,478 (136,846.5%) |
| 2.0x to 2.9x | 0 (0.0%) | 70 (70.7%) |
| 3.0x to 3.9x | 19 (42.2%) | 18 (18.2%) |
| 4.0x or more | 4 (8.9%) | 0 (0.0%) |
| Total | 45 (100.0%) | 99 (100.0%) |
Real Estate Taxes by Mortgage Status in North Randall
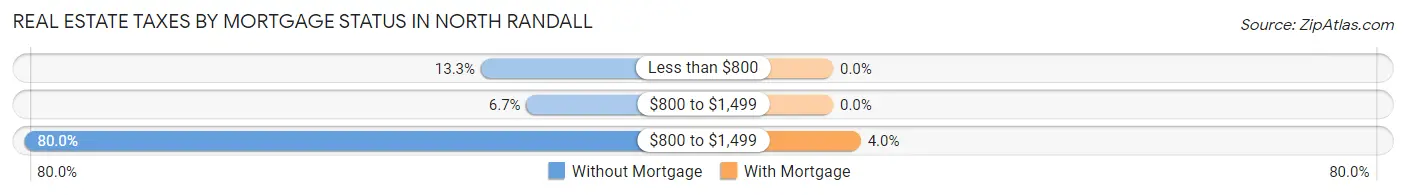
| Property Taxes | Without Mortgage | With Mortgage |
| Less than $800 | 6 (13.3%) | 0 (0.0%) |
| $800 to $1,499 | 3 (6.7%) | 0 (0.0%) |
| $800 to $1,499 | 36 (80.0%) | 4 (4.0%) |
| Total | 45 (100.0%) | 99 (100.0%) |
Health & Disability in North Randall
Health Insurance Coverage by Age in North Randall
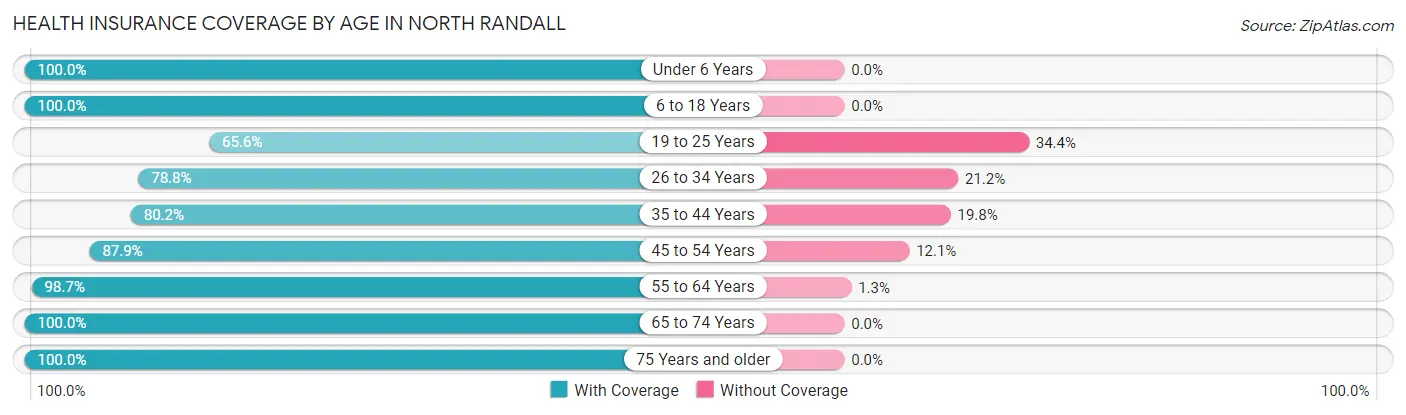
| Age Bracket | With Coverage | Without Coverage |
| Under 6 Years | 11 (100.0%) | 0 (0.0%) |
| 6 to 18 Years | 86 (100.0%) | 0 (0.0%) |
| 19 to 25 Years | 61 (65.6%) | 32 (34.4%) |
| 26 to 34 Years | 26 (78.8%) | 7 (21.2%) |
| 35 to 44 Years | 85 (80.2%) | 21 (19.8%) |
| 45 to 54 Years | 138 (87.9%) | 19 (12.1%) |
| 55 to 64 Years | 230 (98.7%) | 3 (1.3%) |
| 65 to 74 Years | 159 (100.0%) | 0 (0.0%) |
| 75 Years and older | 89 (100.0%) | 0 (0.0%) |
| Total | 885 (91.5%) | 82 (8.5%) |
Health Insurance Coverage by Citizenship Status in North Randall
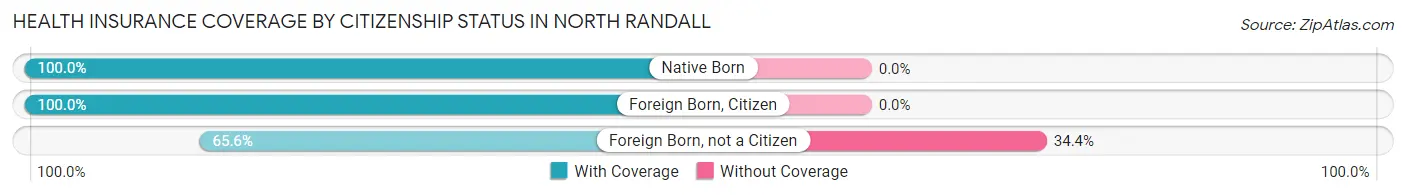
| Citizenship Status | With Coverage | Without Coverage |
| Native Born | 11 (100.0%) | 0 (0.0%) |
| Foreign Born, Citizen | 86 (100.0%) | 0 (0.0%) |
| Foreign Born, not a Citizen | 61 (65.6%) | 32 (34.4%) |
Health Insurance Coverage by Household Income in North Randall
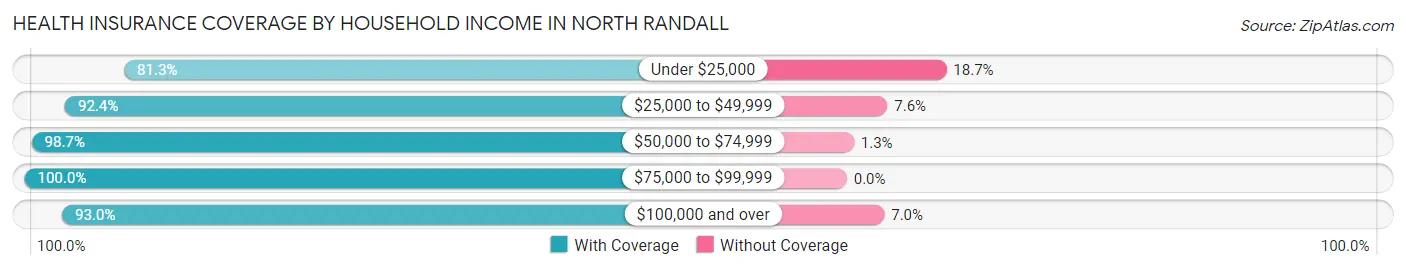
| Household Income | With Coverage | Without Coverage |
| Under $25,000 | 218 (81.3%) | 50 (18.7%) |
| $25,000 to $49,999 | 207 (92.4%) | 17 (7.6%) |
| $50,000 to $74,999 | 225 (98.7%) | 3 (1.3%) |
| $75,000 to $99,999 | 76 (100.0%) | 0 (0.0%) |
| $100,000 and over | 159 (93.0%) | 12 (7.0%) |
Public vs Private Health Insurance Coverage by Age in North Randall
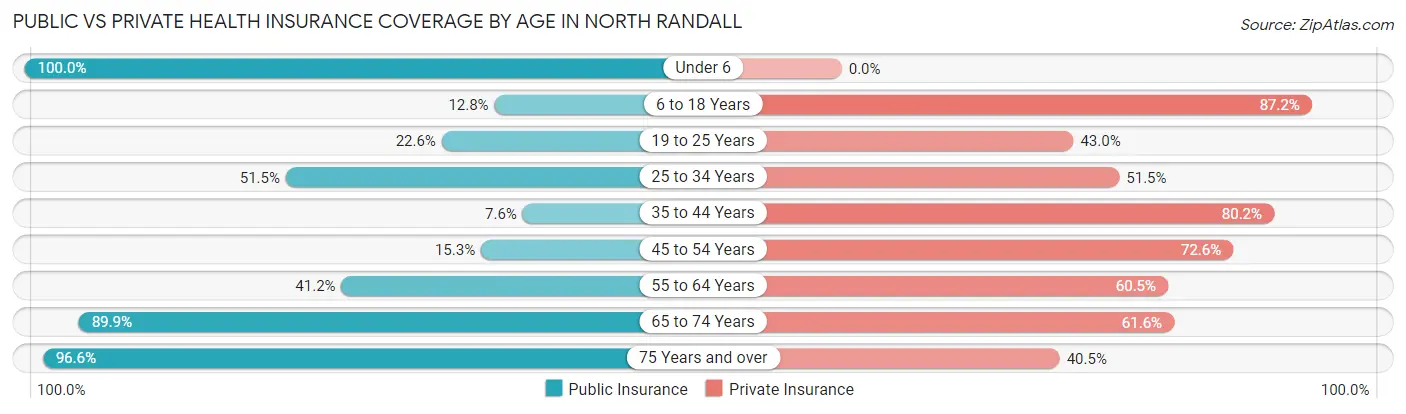
| Age Bracket | Public Insurance | Private Insurance |
| Under 6 | 11 (100.0%) | 0 (0.0%) |
| 6 to 18 Years | 11 (12.8%) | 75 (87.2%) |
| 19 to 25 Years | 21 (22.6%) | 40 (43.0%) |
| 25 to 34 Years | 17 (51.5%) | 17 (51.5%) |
| 35 to 44 Years | 8 (7.5%) | 85 (80.2%) |
| 45 to 54 Years | 24 (15.3%) | 114 (72.6%) |
| 55 to 64 Years | 96 (41.2%) | 141 (60.5%) |
| 65 to 74 Years | 143 (89.9%) | 98 (61.6%) |
| 75 Years and over | 86 (96.6%) | 36 (40.5%) |
| Total | 417 (43.1%) | 606 (62.7%) |
Disability Status by Sex by Age in North Randall
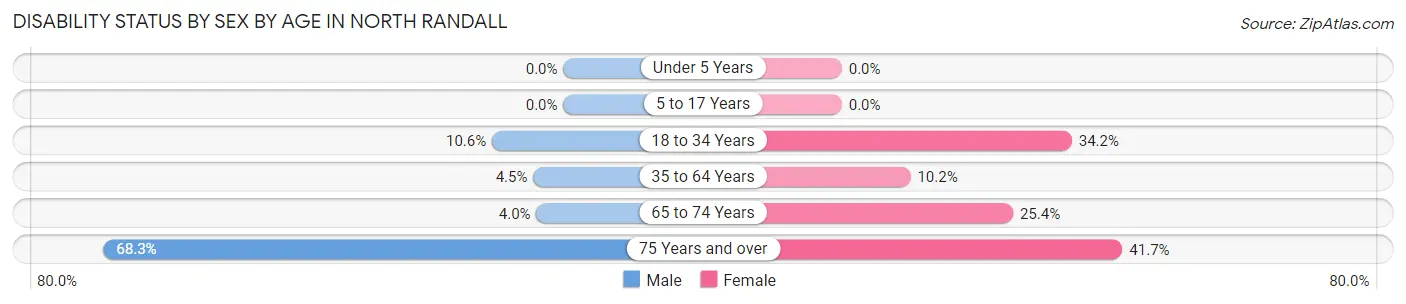
| Age Bracket | Male | Female |
| Under 5 Years | 0 (0.0%) | 0 (0.0%) |
| 5 to 17 Years | 0 (0.0%) | 0 (0.0%) |
| 18 to 34 Years | 9 (10.6%) | 14 (34.2%) |
| 35 to 64 Years | 9 (4.5%) | 30 (10.2%) |
| 65 to 74 Years | 4 (4.0%) | 15 (25.4%) |
| 75 Years and over | 28 (68.3%) | 20 (41.7%) |
Disability Class by Sex by Age in North Randall
Disability Class: Hearing Difficulty
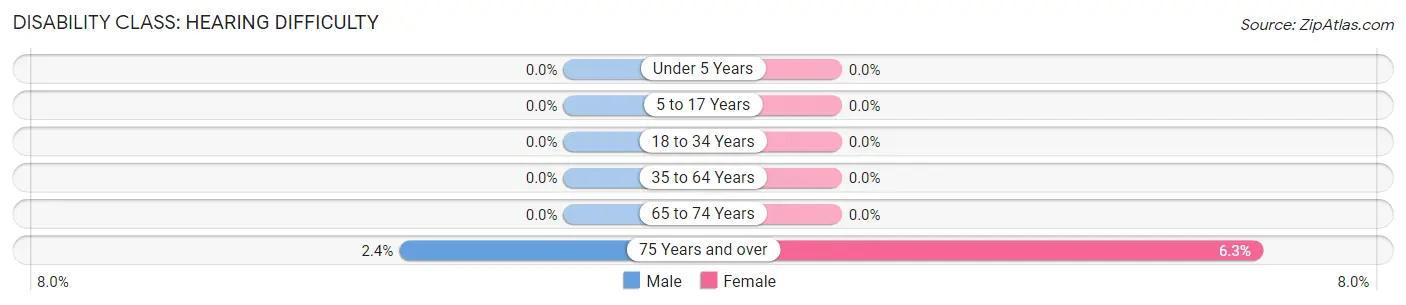
| Age Bracket | Male | Female |
| Under 5 Years | 0 (0.0%) | 0 (0.0%) |
| 5 to 17 Years | 0 (0.0%) | 0 (0.0%) |
| 18 to 34 Years | 0 (0.0%) | 0 (0.0%) |
| 35 to 64 Years | 0 (0.0%) | 0 (0.0%) |
| 65 to 74 Years | 0 (0.0%) | 0 (0.0%) |
| 75 Years and over | 1 (2.4%) | 3 (6.2%) |
Disability Class: Vision Difficulty
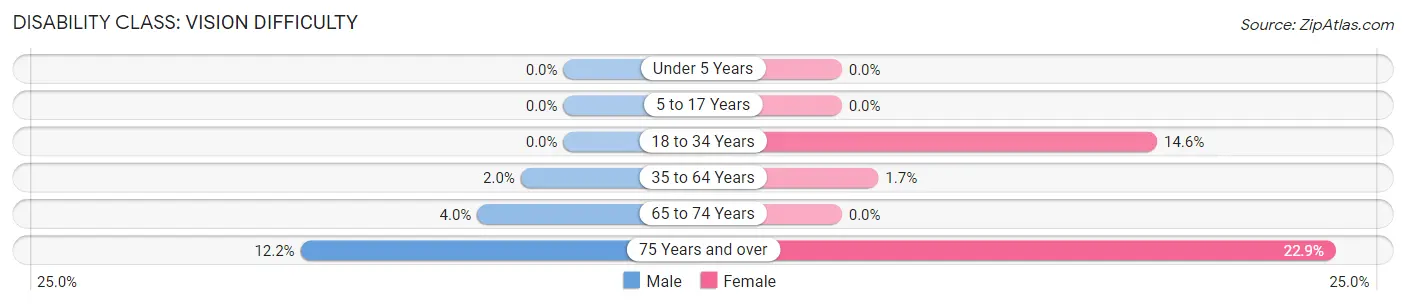
| Age Bracket | Male | Female |
| Under 5 Years | 0 (0.0%) | 0 (0.0%) |
| 5 to 17 Years | 0 (0.0%) | 0 (0.0%) |
| 18 to 34 Years | 0 (0.0%) | 6 (14.6%) |
| 35 to 64 Years | 4 (2.0%) | 5 (1.7%) |
| 65 to 74 Years | 4 (4.0%) | 0 (0.0%) |
| 75 Years and over | 5 (12.2%) | 11 (22.9%) |
Disability Class: Cognitive Difficulty
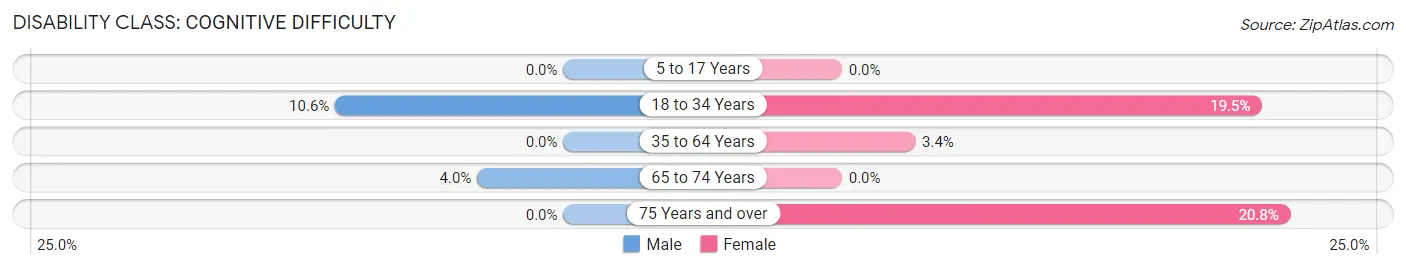
| Age Bracket | Male | Female |
| 5 to 17 Years | 0 (0.0%) | 0 (0.0%) |
| 18 to 34 Years | 9 (10.6%) | 8 (19.5%) |
| 35 to 64 Years | 0 (0.0%) | 10 (3.4%) |
| 65 to 74 Years | 4 (4.0%) | 0 (0.0%) |
| 75 Years and over | 0 (0.0%) | 10 (20.8%) |
Disability Class: Ambulatory Difficulty
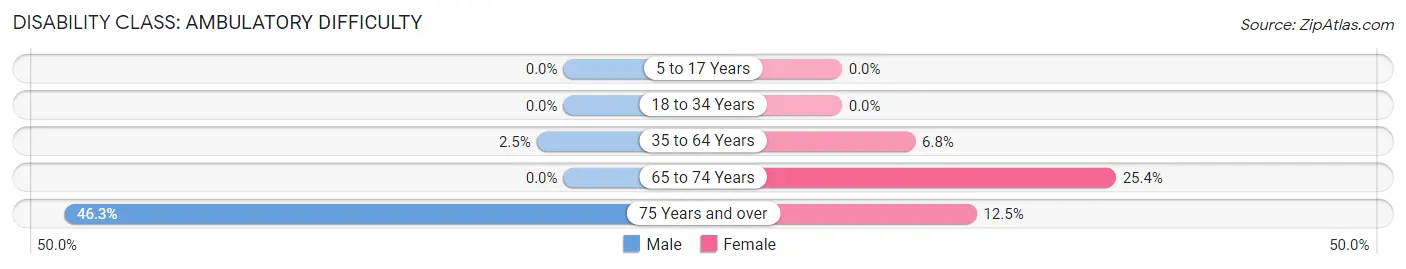
| Age Bracket | Male | Female |
| 5 to 17 Years | 0 (0.0%) | 0 (0.0%) |
| 18 to 34 Years | 0 (0.0%) | 0 (0.0%) |
| 35 to 64 Years | 5 (2.5%) | 20 (6.8%) |
| 65 to 74 Years | 0 (0.0%) | 15 (25.4%) |
| 75 Years and over | 19 (46.3%) | 6 (12.5%) |
Disability Class: Self-Care Difficulty
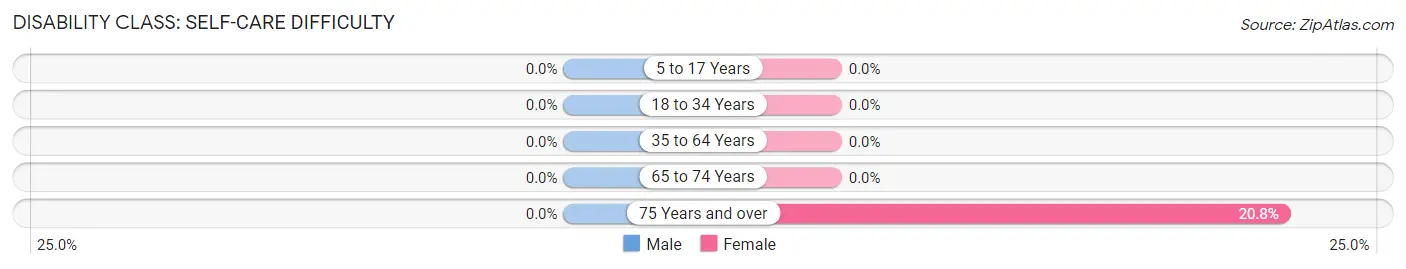
| Age Bracket | Male | Female |
| 5 to 17 Years | 0 (0.0%) | 0 (0.0%) |
| 18 to 34 Years | 0 (0.0%) | 0 (0.0%) |
| 35 to 64 Years | 0 (0.0%) | 0 (0.0%) |
| 65 to 74 Years | 0 (0.0%) | 0 (0.0%) |
| 75 Years and over | 0 (0.0%) | 10 (20.8%) |
Technology Access in North Randall
Computing Device Access in North Randall
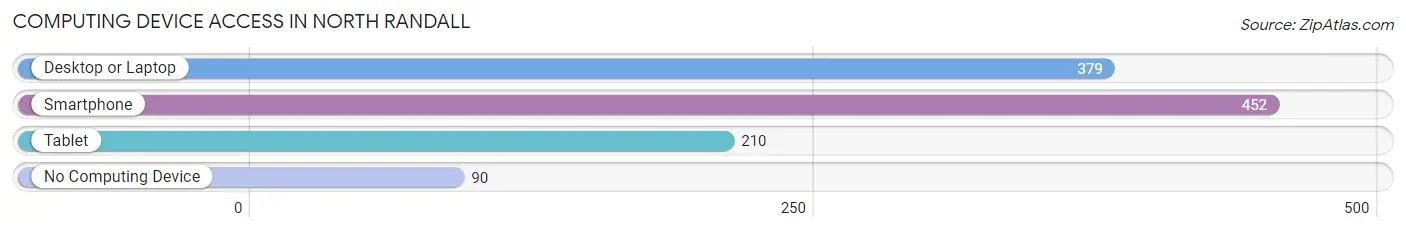
| Device Type | # Households | % Households |
| Desktop or Laptop | 379 | 66.5% |
| Smartphone | 452 | 79.3% |
| Tablet | 210 | 36.8% |
| No Computing Device | 90 | 15.8% |
| Total | 570 | 100.0% |
Internet Access in North Randall
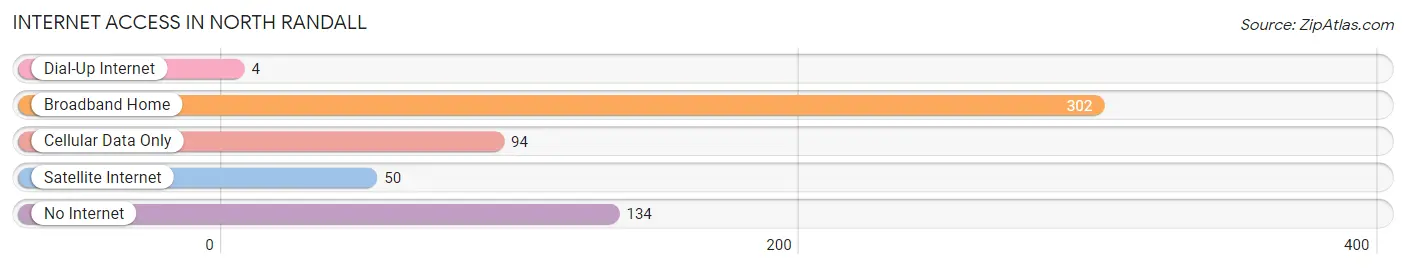
| Internet Type | # Households | % Households |
| Dial-Up Internet | 4 | 0.7% |
| Broadband Home | 302 | 53.0% |
| Cellular Data Only | 94 | 16.5% |
| Satellite Internet | 50 | 8.8% |
| No Internet | 134 | 23.5% |
| Total | 570 | 100.0% |
North Randall Summary
History
North Randall is a village located in Cuyahoga County, Ohio, United States. It is a suburb of Cleveland and is part of the Greater Cleveland Metropolitan Area. The village was founded in 1818 by William Randall, a Revolutionary War veteran, and was originally known as Randall’s Corners. The village was incorporated in 1908 and was named after Randall.
North Randall is located on the east side of Cuyahoga County, approximately 10 miles from downtown Cleveland. The village is bordered by Warrensville Heights to the north, Bedford Heights to the east, Maple Heights to the south, and Woodmere to the west.
Geography
North Randall is located at 41°26'45"N 81°33'45"W (41.4459, -81.5625). According to the United States Census Bureau, the village has a total area of 1.2 square miles (3.1 km2), all land.
The village is located in the Western Reserve region of Ohio, which was originally part of the Connecticut Western Reserve. The area is characterized by rolling hills and is part of the Cleveland Metropolitan Area.
Economy
North Randall is a small village with a population of 1,845 as of the 2010 census. The village is primarily residential, with a few small businesses located in the area. The village is home to the Randall Park Mall, which was once the largest shopping mall in the United States. The mall has since closed, but the village is still home to a few small businesses, including a grocery store, a gas station, and a few restaurants.
The village is also home to the North Randall Raceway, a horse racing track that opened in 1965. The track closed in 2013, but the village is still home to a few small businesses, including a grocery store, a gas station, and a few restaurants.
Demographics
As of the 2010 census, there were 1,845 people, 745 households, and 486 families residing in the village. The population density was 1,541.7 people per square mile (595.2/km2). There were 817 housing units at an average density of 676.7 per square mile (261.7/km2). The racial makeup of the village was 57.2% White, 37.2% African American, 0.2% Native American, 0.7% Asian, 0.1% Pacific Islander, 1.2% from other races, and 3.6% from two or more races. Hispanic or Latino of any race were 3.2% of the population.
There were 745 households, out of which 28.2% had children under the age of 18 living with them, 37.2% were married couples living together, 22.2% had a female householder with no husband present, and 35.2% were non-families. 30.2% of all households were made up of individuals, and 11.2% had someone living alone who was 65 years of age or older. The average household size was 2.47 and the average family size was 3.09.
In the village, the population was spread out, with 25.2% under the age of 18, 8.2% from 18 to 24, 28.2% from 25 to 44, 24.2% from 45 to 64, and 14.2% who were 65 years of age or older. The median age was 37 years. For every 100 females, there were 87.2 males. For every 100 females age 18 and over, there were 82.2 males.
The median income for a household in the village was $31,250, and the median income for a family was $37,500. Males had a median income of $30,000 versus $25,000 for females. The per capita income for the village was $15,945. About 11.2% of families and 14.2% of the population were below the poverty line, including 19.2% of those under age 18 and 8.2% of those age 65 or over.
Common Questions
What is Per Capita Income in North Randall?
Per Capita income in North Randall is $31,729.
What is the Median Family Income in North Randall?
Median Family Income in North Randall is $49,375.
What is the Median Household income in North Randall?
Median Household Income in North Randall is $40,976.
What is Income or Wage Gap in North Randall?
Income or Wage Gap in North Randall is 32.5%.
Women in North Randall earn 67.5 cents for every dollar earned by a man.
What is Inequality or Gini Index in North Randall?
Inequality or Gini Index in North Randall is 0.46.
What is the Total Population of North Randall?
Total Population of North Randall is 1,113.
What is the Total Male Population of North Randall?
Total Male Population of North Randall is 500.
What is the Total Female Population of North Randall?
Total Female Population of North Randall is 613.
What is the Ratio of Males per 100 Females in North Randall?
There are 81.57 Males per 100 Females in North Randall.
What is the Ratio of Females per 100 Males in North Randall?
There are 122.60 Females per 100 Males in North Randall.
What is the Median Population Age in North Randall?
Median Population Age in North Randall is 59.7 Years.
What is the Average Family Size in North Randall
Average Family Size in North Randall is 2.8 People.
What is the Average Household Size in North Randall
Average Household Size in North Randall is 1.7 People.
How Large is the Labor Force in North Randall?
There are 542 People in the Labor Forcein in North Randall.
What is the Percentage of People in the Labor Force in North Randall?
52.7% of People are in the Labor Force in North Randall.
What is the Unemployment Rate in North Randall?
Unemployment Rate in North Randall is 20.8%.