Zip Codes with the Highest Percentage of Population Employed in Security & Protection in Massillon, OH
RELATED REPORTS & OPTIONS
Security & Protection
Massillon
Compare Zip Codes
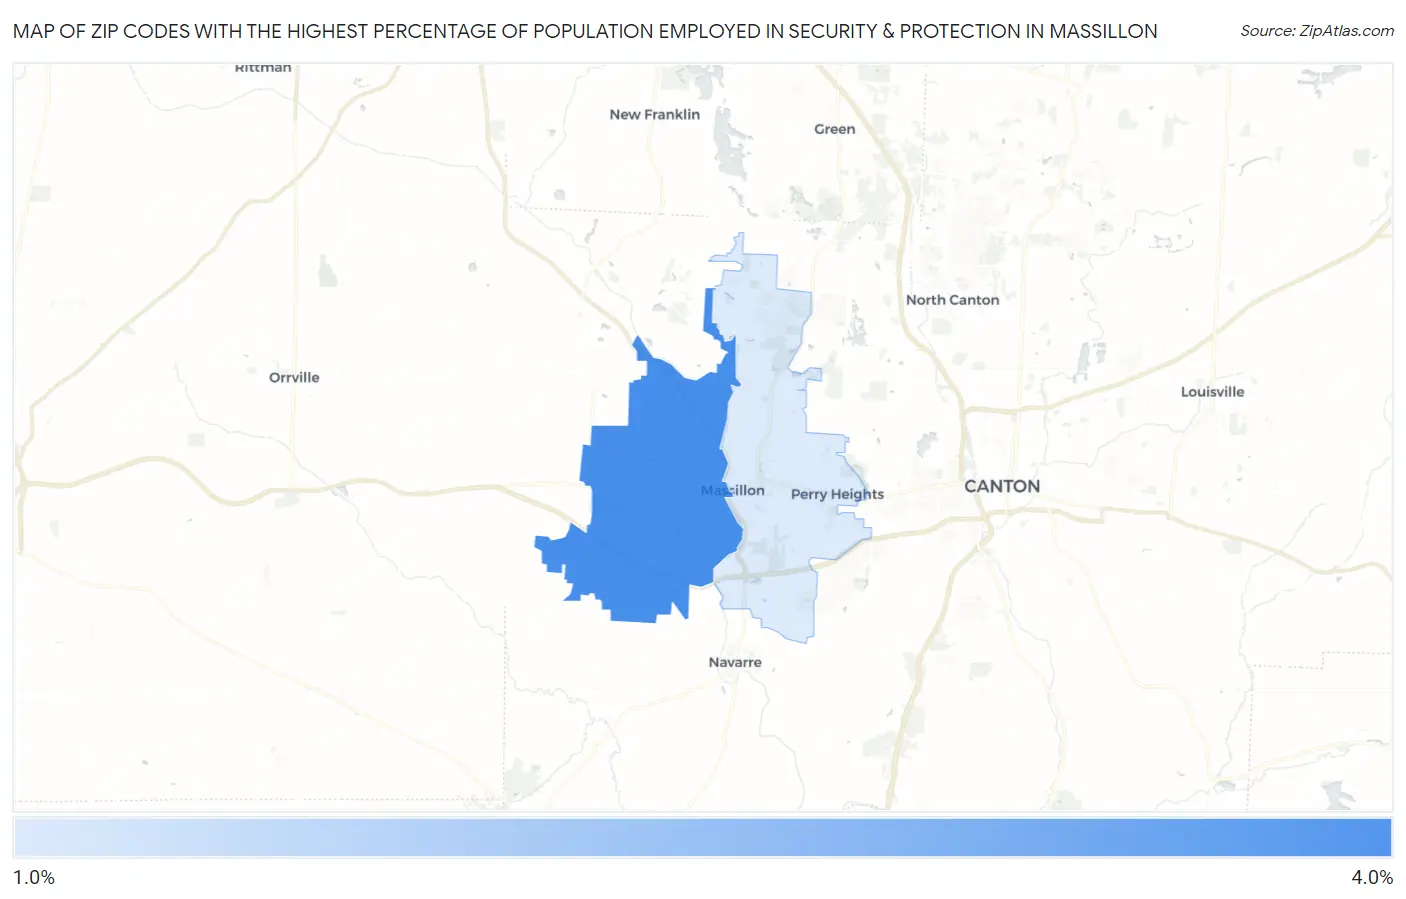
Map of Zip Codes with the Highest Percentage of Population Employed in Security & Protection in Massillon
1.4%
3.2%
Zip Codes with the Highest Percentage of Population Employed in Security & Protection in Massillon, OH
| Zip Code | % Employed | vs State | vs National | |
| 1. | 44647 | 3.2% | 1.9%(+1.25)#167 | 2.1%(+1.01)#6,657 |
| 2. | 44646 | 1.4% | 1.9%(-0.474)#577 | 2.1%(-0.712)#16,689 |
1
Common Questions
What are the Top Zip Codes with the Highest Percentage of Population Employed in Security & Protection in Massillon, OH?
Top Zip Codes with the Highest Percentage of Population Employed in Security & Protection in Massillon, OH are:
What zip code has the Highest Percentage of Population Employed in Security & Protection in Massillon, OH?
44647 has the Highest Percentage of Population Employed in Security & Protection in Massillon, OH with 3.2%.
What is the Percentage of Population Employed in Security & Protection in Massillon, OH?
Percentage of Population Employed in Security & Protection in Massillon is 1.9%.
What is the Percentage of Population Employed in Security & Protection in Ohio?
Percentage of Population Employed in Security & Protection in Ohio is 1.9%.
What is the Percentage of Population Employed in Security & Protection in the United States?
Percentage of Population Employed in Security & Protection in the United States is 2.1%.