Zip Codes with the Highest Percentage of Population Employed in Security & Protection in Westerville, OH
RELATED REPORTS & OPTIONS
Security & Protection
Westerville
Compare Zip Codes
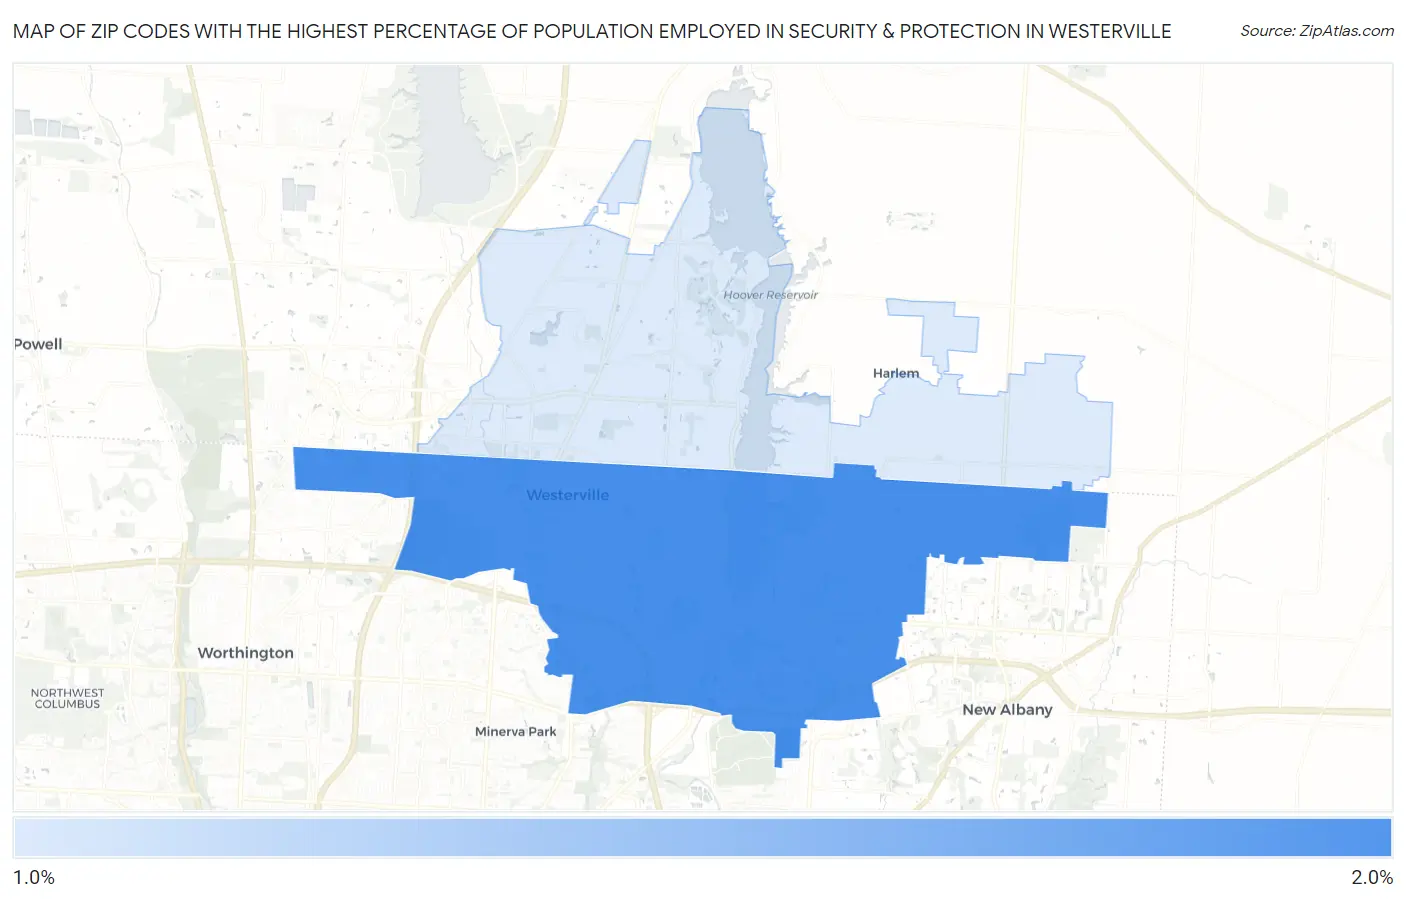
Map of Zip Codes with the Highest Percentage of Population Employed in Security & Protection in Westerville
1.6%
1.9%
Zip Codes with the Highest Percentage of Population Employed in Security & Protection in Westerville, OH
| Zip Code | % Employed | vs State | vs National | |
| 1. | 43081 | 1.9% | 1.9%(+0.037)#421 | 2.1%(-0.202)#12,902 |
| 2. | 43082 | 1.6% | 1.9%(-0.344)#527 | 2.1%(-0.582)#15,678 |
1
Common Questions
What are the Top Zip Codes with the Highest Percentage of Population Employed in Security & Protection in Westerville, OH?
Top Zip Codes with the Highest Percentage of Population Employed in Security & Protection in Westerville, OH are:
What zip code has the Highest Percentage of Population Employed in Security & Protection in Westerville, OH?
43081 has the Highest Percentage of Population Employed in Security & Protection in Westerville, OH with 1.9%.
What is the Percentage of Population Employed in Security & Protection in Westerville, OH?
Percentage of Population Employed in Security & Protection in Westerville is 2.6%.
What is the Percentage of Population Employed in Security & Protection in Ohio?
Percentage of Population Employed in Security & Protection in Ohio is 1.9%.
What is the Percentage of Population Employed in Security & Protection in the United States?
Percentage of Population Employed in Security & Protection in the United States is 2.1%.