Pleasant Hills, OH Map & Demographics
Pleasant Hills Map
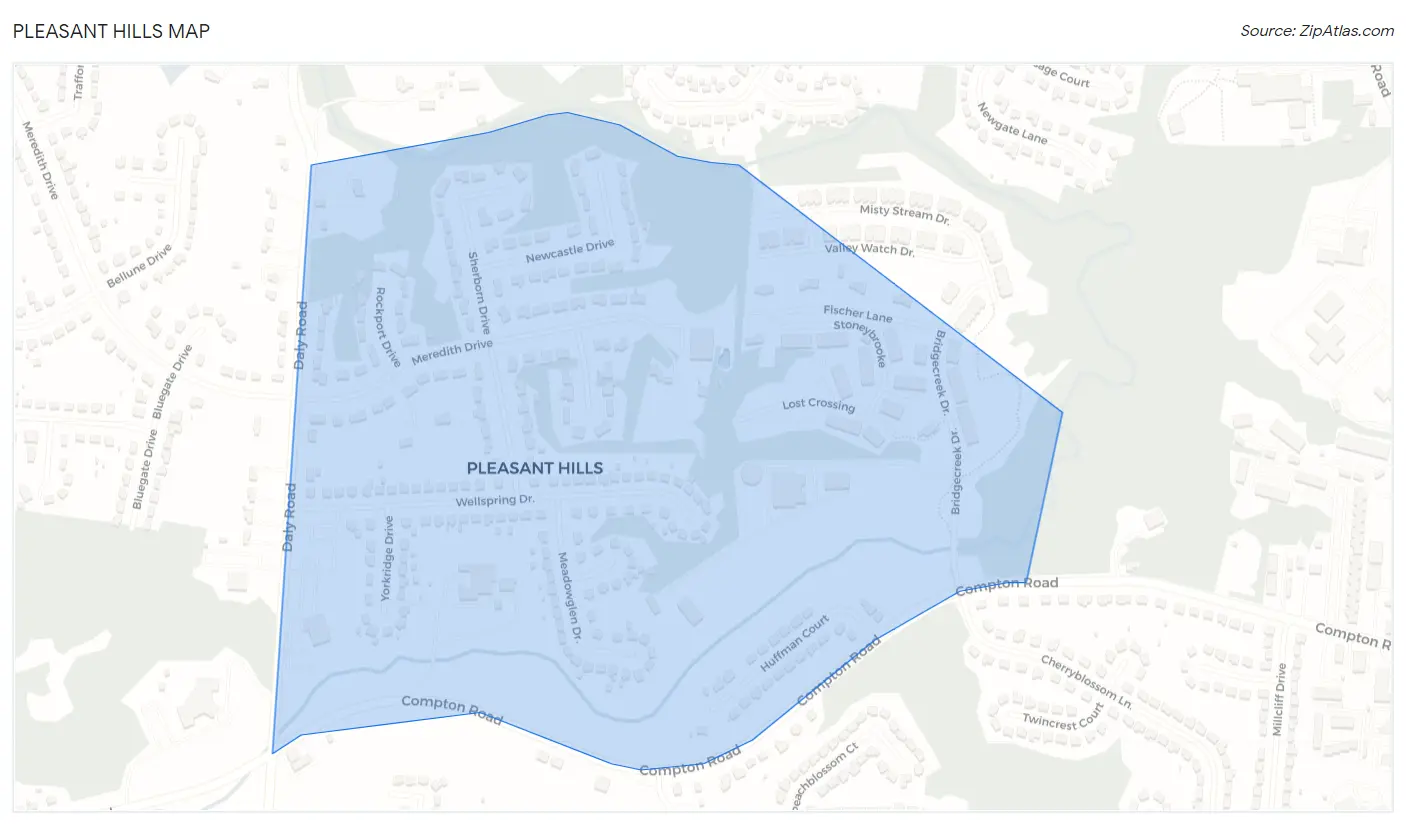
Pleasant Hills Overview
$30,148
PER CAPITA INCOME
$64,066
AVG FAMILY INCOME
$63,513
AVG HOUSEHOLD INCOME
39.4%
WAGE / INCOME GAP [ % ]
60.6¢/ $1
WAGE / INCOME GAP [ $ ]
0.34
INEQUALITY / GINI INDEX
1,210
TOTAL POPULATION
490
MALE POPULATION
720
FEMALE POPULATION
68.06
MALES / 100 FEMALES
146.94
FEMALES / 100 MALES
34.6
MEDIAN AGE
3.2
AVG FAMILY SIZE
2.6
AVG HOUSEHOLD SIZE
529
LABOR FORCE [ PEOPLE ]
61.7%
PERCENT IN LABOR FORCE
Income in Pleasant Hills
Income Overview in Pleasant Hills
Per Capita Income in Pleasant Hills is $30,148, while median incomes of families and households are $64,066 and $63,513 respectively.
| Characteristic | Number | Measure |
| Per Capita Income | 1,210 | $30,148 |
| Median Family Income | 313 | $64,066 |
| Mean Family Income | 313 | $72,337 |
| Median Household Income | 466 | $63,513 |
| Mean Household Income | 466 | $72,482 |
| Income Deficit | 313 | $0 |
| Wage / Income Gap (%) | 1,210 | 39.43% |
| Wage / Income Gap ($) | 1,210 | 60.57¢ per $1 |
| Gini / Inequality Index | 1,210 | 0.34 |
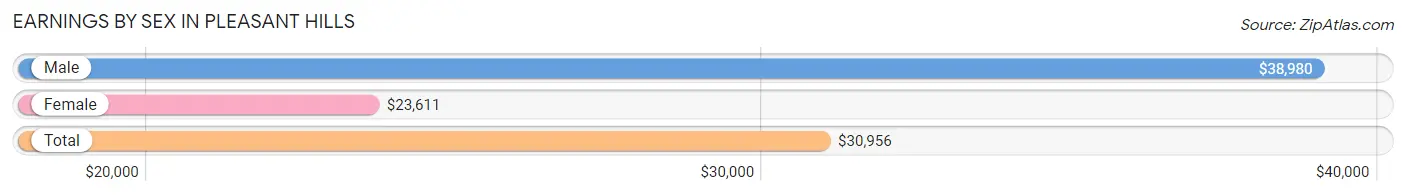
Earnings by Sex in Pleasant Hills
Average Earnings in Pleasant Hills are $30,956, $38,980 for men and $23,611 for women, a difference of 39.4%.
| Sex | Number | Average Earnings |
| Male | 269 (49.7%) | $38,980 |
| Female | 272 (50.3%) | $23,611 |
| Total | 541 (100.0%) | $30,956 |
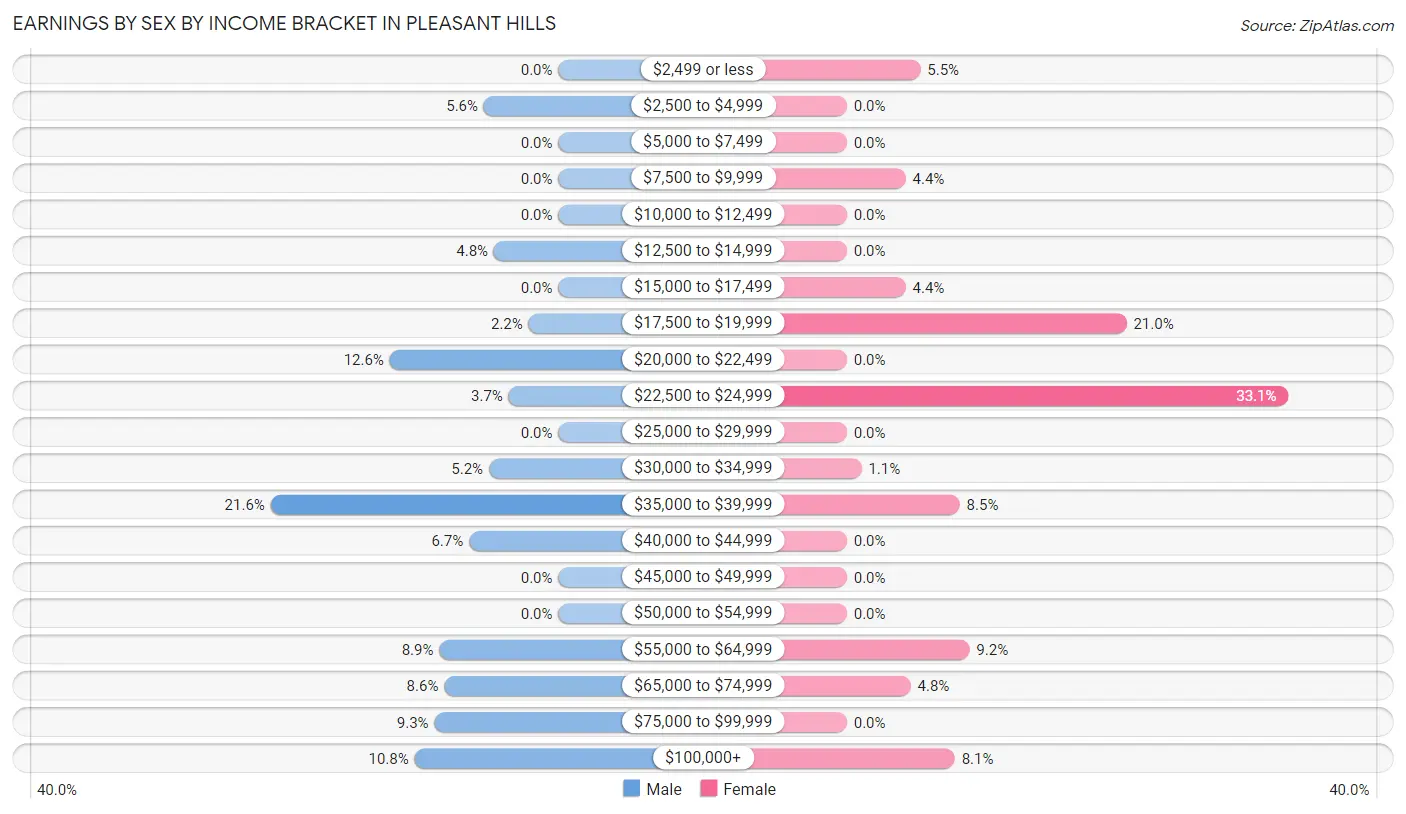
Earnings by Sex by Income Bracket in Pleasant Hills
The most common earnings brackets in Pleasant Hills are $35,000 to $39,999 for men (58 | 21.6%) and $22,500 to $24,999 for women (90 | 33.1%).
| Income | Male | Female |
| $2,499 or less | 0 (0.0%) | 15 (5.5%) |
| $2,500 to $4,999 | 15 (5.6%) | 0 (0.0%) |
| $5,000 to $7,499 | 0 (0.0%) | 0 (0.0%) |
| $7,500 to $9,999 | 0 (0.0%) | 12 (4.4%) |
| $10,000 to $12,499 | 0 (0.0%) | 0 (0.0%) |
| $12,500 to $14,999 | 13 (4.8%) | 0 (0.0%) |
| $15,000 to $17,499 | 0 (0.0%) | 12 (4.4%) |
| $17,500 to $19,999 | 6 (2.2%) | 57 (21.0%) |
| $20,000 to $22,499 | 34 (12.6%) | 0 (0.0%) |
| $22,500 to $24,999 | 10 (3.7%) | 90 (33.1%) |
| $25,000 to $29,999 | 0 (0.0%) | 0 (0.0%) |
| $30,000 to $34,999 | 14 (5.2%) | 3 (1.1%) |
| $35,000 to $39,999 | 58 (21.6%) | 23 (8.5%) |
| $40,000 to $44,999 | 18 (6.7%) | 0 (0.0%) |
| $45,000 to $49,999 | 0 (0.0%) | 0 (0.0%) |
| $50,000 to $54,999 | 0 (0.0%) | 0 (0.0%) |
| $55,000 to $64,999 | 24 (8.9%) | 25 (9.2%) |
| $65,000 to $74,999 | 23 (8.6%) | 13 (4.8%) |
| $75,000 to $99,999 | 25 (9.3%) | 0 (0.0%) |
| $100,000+ | 29 (10.8%) | 22 (8.1%) |
| Total | 269 (100.0%) | 272 (100.0%) |
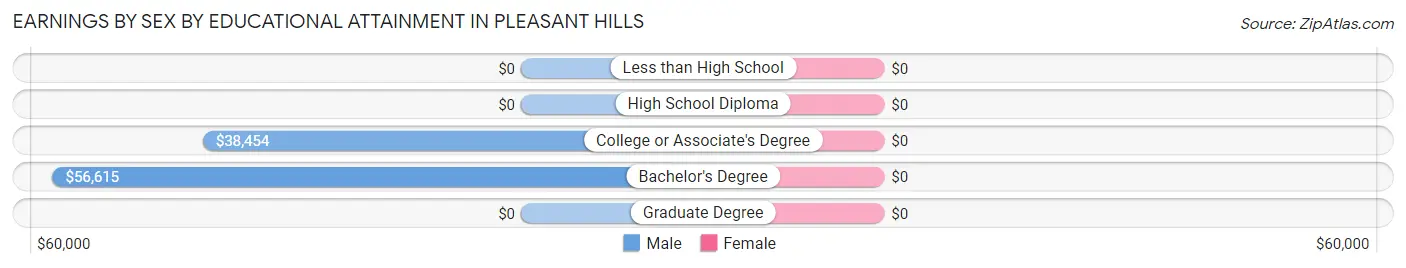
Earnings by Sex by Educational Attainment in Pleasant Hills
| Educational Attainment | Male Income | Female Income |
| Less than High School | - | - |
| High School Diploma | - | - |
| College or Associate's Degree | $38,454 | $0 |
| Bachelor's Degree | $56,615 | $0 |
| Graduate Degree | - | - |
| Total | $38,980 | $23,611 |
Family Income in Pleasant Hills
Family Income Brackets in Pleasant Hills
According to the Pleasant Hills family income data, there are 122 families falling into the $50,000 to $74,999 income range, which is the most common income bracket and makes up 39.0% of all families.
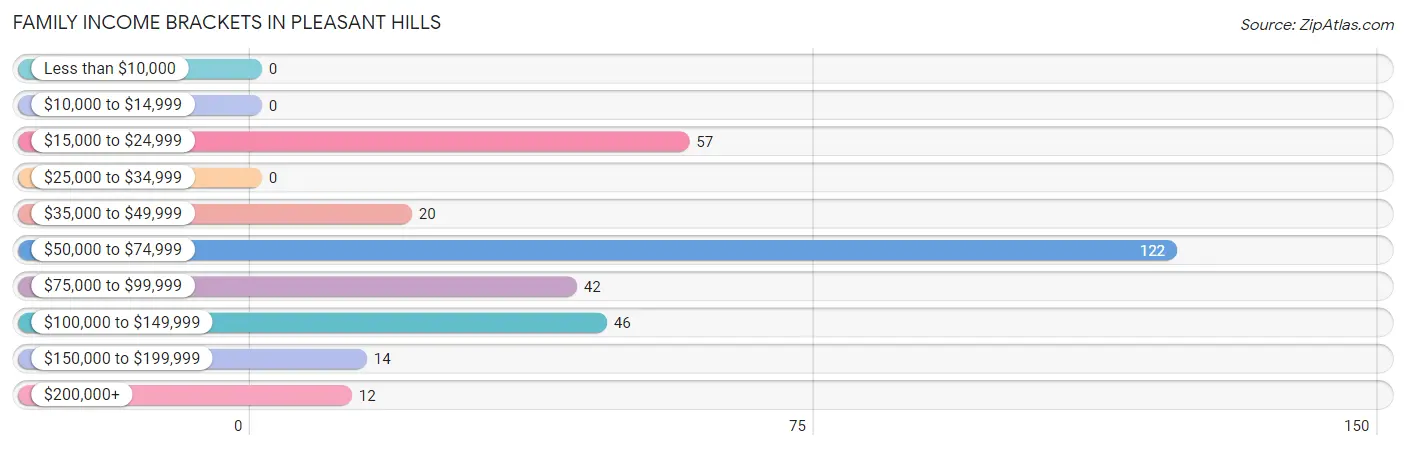
| Income Bracket | # Families | % Families |
| Less than $10,000 | 0 | 0.0% |
| $10,000 to $14,999 | 0 | 0.0% |
| $15,000 to $24,999 | 57 | 18.2% |
| $25,000 to $34,999 | 0 | 0.0% |
| $35,000 to $49,999 | 20 | 6.4% |
| $50,000 to $74,999 | 122 | 39.0% |
| $75,000 to $99,999 | 42 | 13.4% |
| $100,000 to $149,999 | 46 | 14.7% |
| $150,000 to $199,999 | 14 | 4.5% |
| $200,000+ | 12 | 3.8% |
Family Income by Famaliy Size in Pleasant Hills
2-person families (129 | 41.2%) account for the highest median family income in Pleasant Hills with $88,750 per family, while 2-person families (129 | 41.2%) have the highest median income of $44,375 per family member.
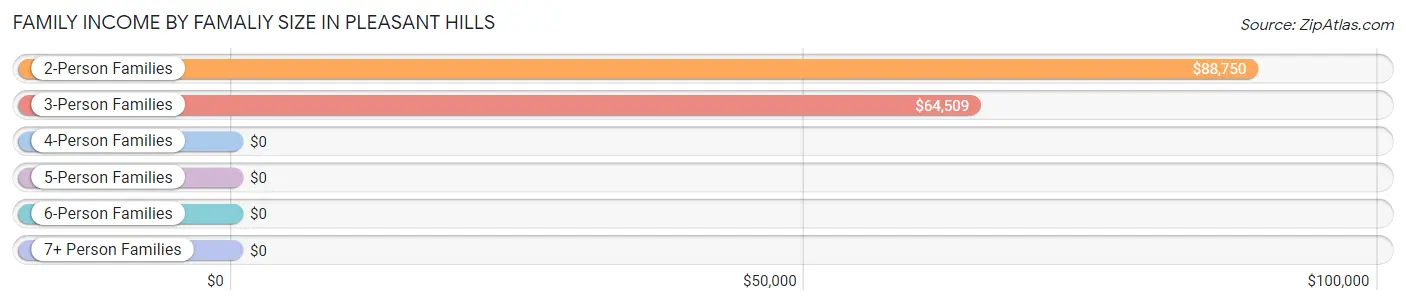
| Income Bracket | # Families | Median Income |
| 2-Person Families | 129 (41.2%) | $88,750 |
| 3-Person Families | 127 (40.6%) | $64,509 |
| 4-Person Families | 0 (0.0%) | $0 |
| 5-Person Families | 57 (18.2%) | $0 |
| 6-Person Families | 0 (0.0%) | $0 |
| 7+ Person Families | 0 (0.0%) | $0 |
| Total | 313 (100.0%) | $64,066 |
Family Income by Number of Earners in Pleasant Hills
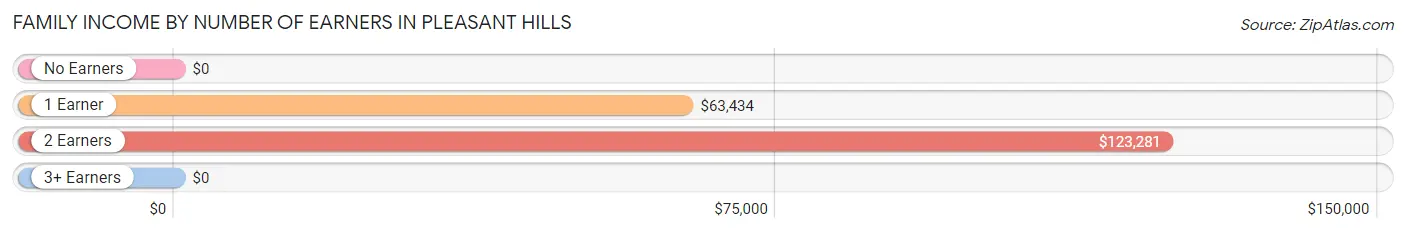
| Number of Earners | # Families | Median Income |
| No Earners | 17 (5.4%) | $0 |
| 1 Earner | 233 (74.4%) | $63,434 |
| 2 Earners | 63 (20.1%) | $123,281 |
| 3+ Earners | 0 (0.0%) | $0 |
| Total | 313 (100.0%) | $64,066 |
Household Income in Pleasant Hills
Household Income Brackets in Pleasant Hills
With 167 households falling in the category, the $50,000 to $74,999 income range is the most frequent in Pleasant Hills, accounting for 35.8% of all households.
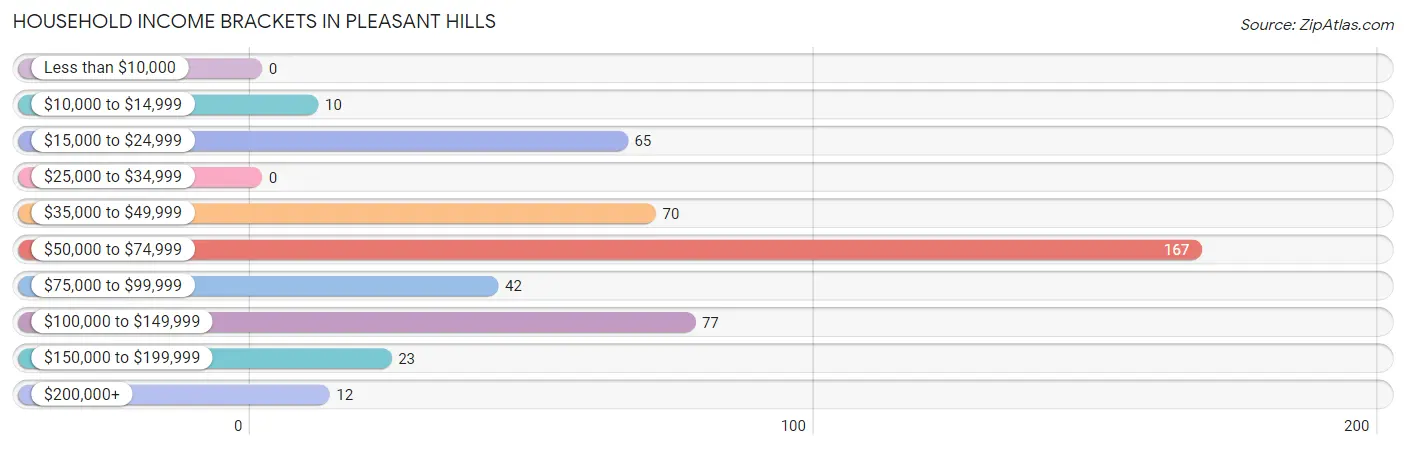
| Income Bracket | # Households | % Households |
| Less than $10,000 | 0 | 0.0% |
| $10,000 to $14,999 | 10 | 2.1% |
| $15,000 to $24,999 | 65 | 13.9% |
| $25,000 to $34,999 | 0 | 0.0% |
| $35,000 to $49,999 | 70 | 15.0% |
| $50,000 to $74,999 | 167 | 35.8% |
| $75,000 to $99,999 | 42 | 9.0% |
| $100,000 to $149,999 | 77 | 16.5% |
| $150,000 to $199,999 | 23 | 4.9% |
| $200,000+ | 12 | 2.6% |
Household Income by Householder Age in Pleasant Hills
The median household income in Pleasant Hills is $63,513, with the highest median household income of $67,273 found in the 65+ years age bracket for the primary householder. A total of 128 households (27.5%) fall into this category.
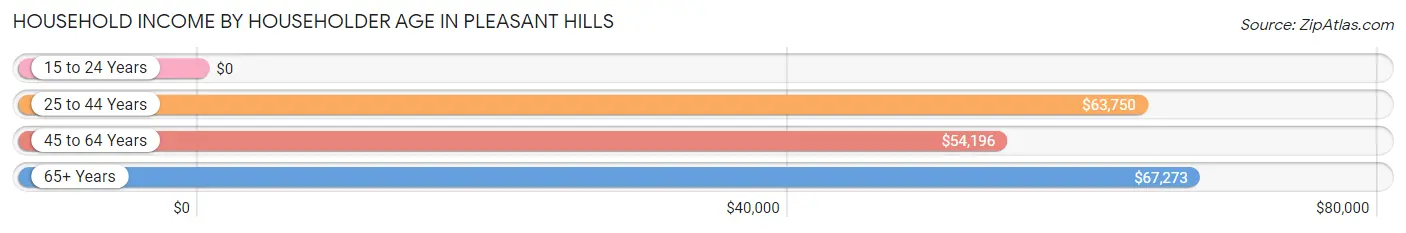
| Income Bracket | # Households | Median Income |
| 15 to 24 Years | 0 (0.0%) | $0 |
| 25 to 44 Years | 193 (41.4%) | $63,750 |
| 45 to 64 Years | 145 (31.1%) | $54,196 |
| 65+ Years | 128 (27.5%) | $67,273 |
| Total | 466 (100.0%) | $63,513 |
Poverty in Pleasant Hills
Income Below Poverty by Sex and Age in Pleasant Hills
With 28.4% poverty level for males and 22.4% for females among the residents of Pleasant Hills, 6 to 11 year old males and 6 to 11 year old females are the most vulnerable to poverty, with 60 males (100.0%) and 52 females (100.0%) in their respective age groups living below the poverty level.
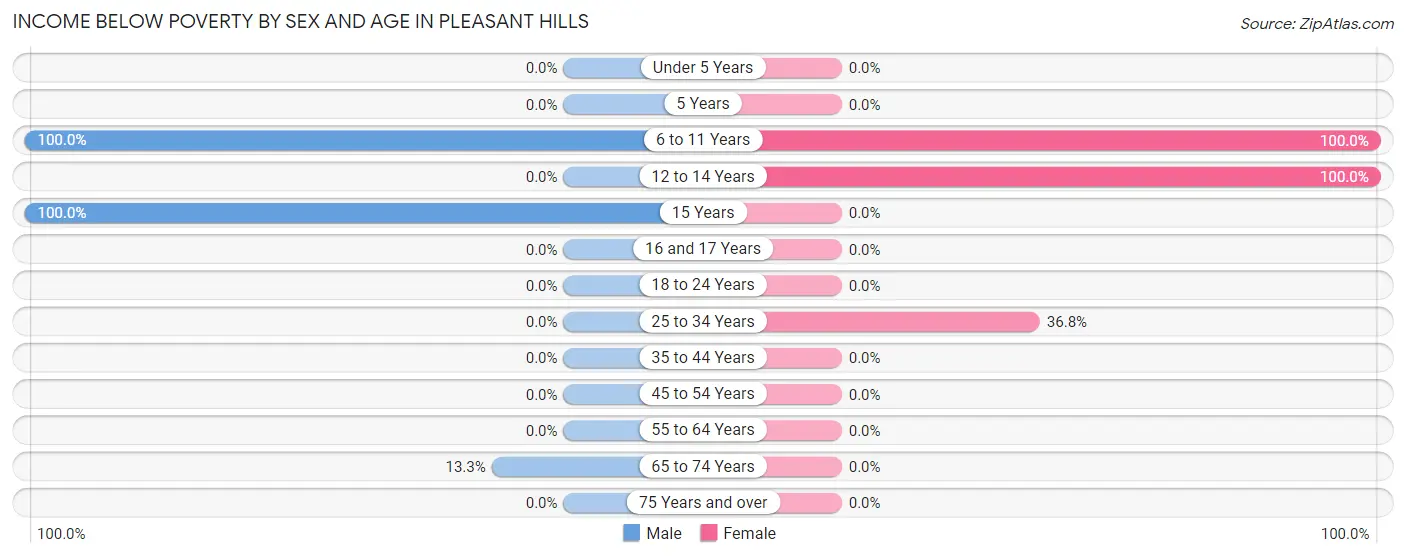
| Age Bracket | Male | Female |
| Under 5 Years | 0 (0.0%) | 0 (0.0%) |
| 5 Years | 0 (0.0%) | 0 (0.0%) |
| 6 to 11 Years | 60 (100.0%) | 52 (100.0%) |
| 12 to 14 Years | 0 (0.0%) | 52 (100.0%) |
| 15 Years | 69 (100.0%) | 0 (0.0%) |
| 16 and 17 Years | 0 (0.0%) | 0 (0.0%) |
| 18 to 24 Years | 0 (0.0%) | 0 (0.0%) |
| 25 to 34 Years | 0 (0.0%) | 57 (36.8%) |
| 35 to 44 Years | 0 (0.0%) | 0 (0.0%) |
| 45 to 54 Years | 0 (0.0%) | 0 (0.0%) |
| 55 to 64 Years | 0 (0.0%) | 0 (0.0%) |
| 65 to 74 Years | 10 (13.3%) | 0 (0.0%) |
| 75 Years and over | 0 (0.0%) | 0 (0.0%) |
| Total | 139 (28.4%) | 161 (22.4%) |
Income Above Poverty by Sex and Age in Pleasant Hills
According to the poverty statistics in Pleasant Hills, males aged 12 to 14 years and females aged under 5 years are the age groups that are most secure financially, with 100.0% of males and 100.0% of females in these age groups living above the poverty line.
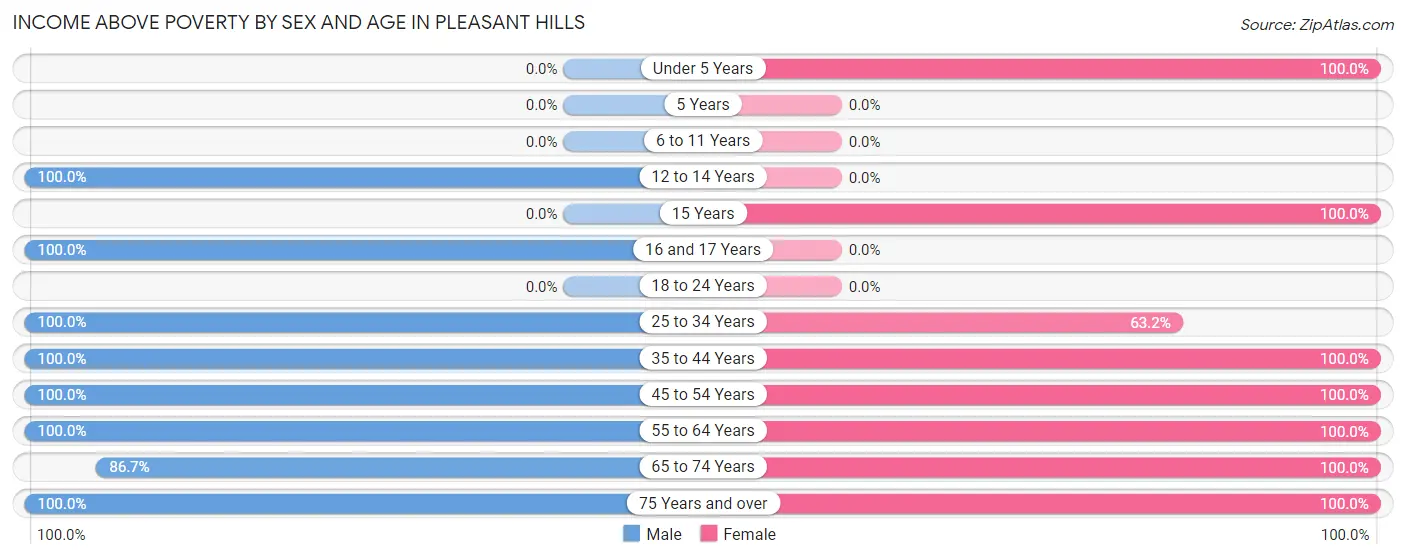
| Age Bracket | Male | Female |
| Under 5 Years | 0 (0.0%) | 11 (100.0%) |
| 5 Years | 0 (0.0%) | 0 (0.0%) |
| 6 to 11 Years | 0 (0.0%) | 0 (0.0%) |
| 12 to 14 Years | 27 (100.0%) | 0 (0.0%) |
| 15 Years | 0 (0.0%) | 82 (100.0%) |
| 16 and 17 Years | 10 (100.0%) | 0 (0.0%) |
| 18 to 24 Years | 0 (0.0%) | 0 (0.0%) |
| 25 to 34 Years | 94 (100.0%) | 98 (63.2%) |
| 35 to 44 Years | 13 (100.0%) | 40 (100.0%) |
| 45 to 54 Years | 57 (100.0%) | 11 (100.0%) |
| 55 to 64 Years | 70 (100.0%) | 85 (100.0%) |
| 65 to 74 Years | 65 (86.7%) | 208 (100.0%) |
| 75 Years and over | 15 (100.0%) | 24 (100.0%) |
| Total | 351 (71.6%) | 559 (77.6%) |
Income Below Poverty Among Married-Couple Families in Pleasant Hills
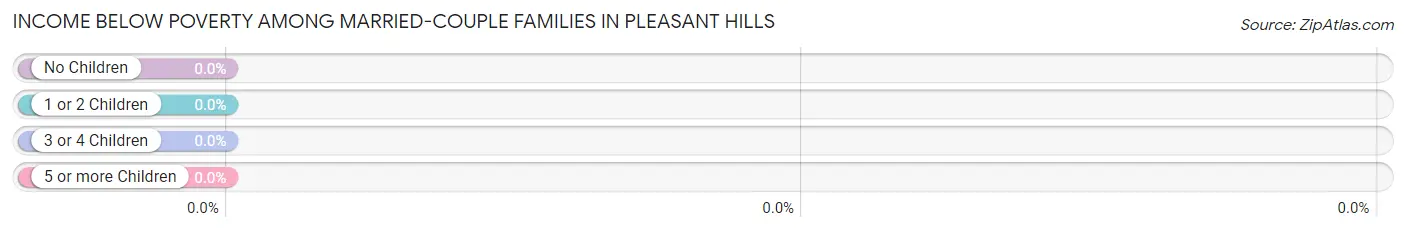
| Children | Above Poverty | Below Poverty |
| No Children | 109 (100.0%) | 0 (0.0%) |
| 1 or 2 Children | 0 (0.0%) | 0 (0.0%) |
| 3 or 4 Children | 0 (0.0%) | 0 (0.0%) |
| 5 or more Children | 0 (0.0%) | 0 (0.0%) |
| Total | 109 (100.0%) | 0 (0.0%) |
Income Below Poverty Among Single-Parent Households in Pleasant Hills
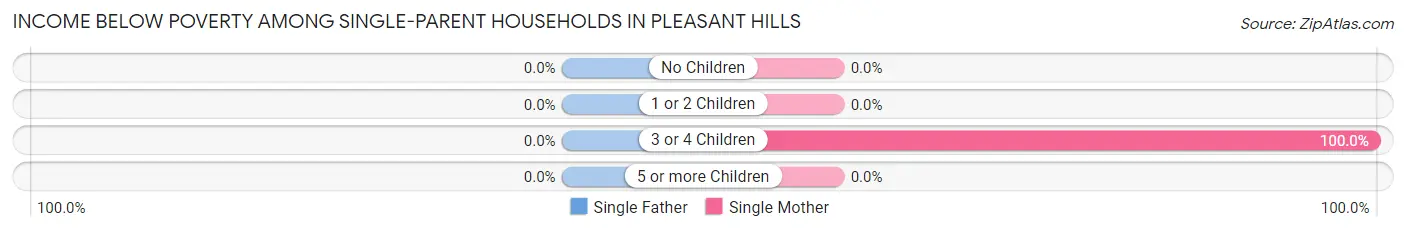
| Children | Single Father | Single Mother |
| No Children | 0 (0.0%) | 0 (0.0%) |
| 1 or 2 Children | 0 (0.0%) | 0 (0.0%) |
| 3 or 4 Children | 0 (0.0%) | 57 (100.0%) |
| 5 or more Children | 0 (0.0%) | 0 (0.0%) |
| Total | 0 (0.0%) | 57 (29.8%) |
Income Below Poverty Among Married-Couple vs Single-Parent Households in Pleasant Hills
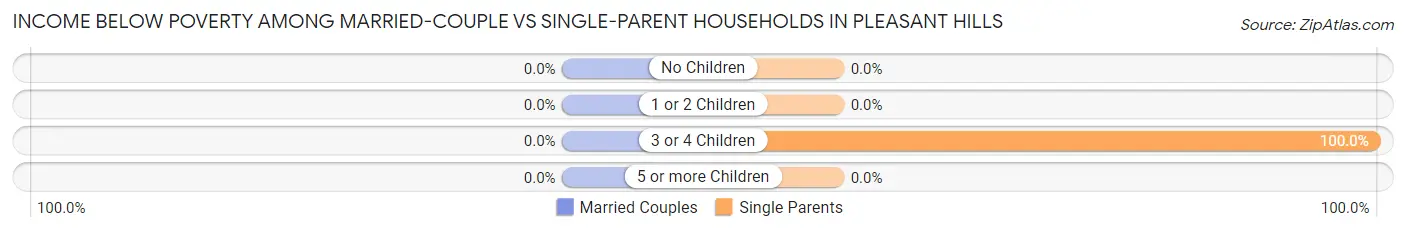
| Children | Married-Couple Families | Single-Parent Households |
| No Children | 0 (0.0%) | 0 (0.0%) |
| 1 or 2 Children | 0 (0.0%) | 0 (0.0%) |
| 3 or 4 Children | 0 (0.0%) | 57 (100.0%) |
| 5 or more Children | 0 (0.0%) | 0 (0.0%) |
| Total | 0 (0.0%) | 57 (27.9%) |
Race in Pleasant Hills
The most populous races in Pleasant Hills are Black / African American (904 | 74.7%), White / Caucasian (253 | 20.9%), and Hispanic or Latino (82 | 6.8%).
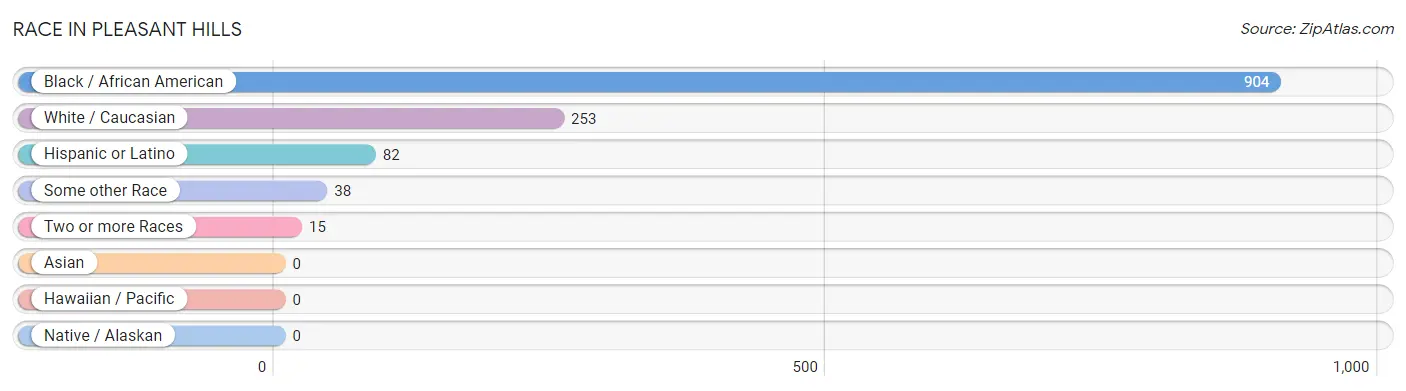
| Race | # Population | % Population |
| Asian | 0 | 0.0% |
| Black / African American | 904 | 74.7% |
| Hawaiian / Pacific | 0 | 0.0% |
| Hispanic or Latino | 82 | 6.8% |
| Native / Alaskan | 0 | 0.0% |
| White / Caucasian | 253 | 20.9% |
| Two or more Races | 15 | 1.2% |
| Some other Race | 38 | 3.1% |
| Total | 1,210 | 100.0% |
Ancestry in Pleasant Hills
The most populous ancestries reported in Pleasant Hills are German (103 | 8.5%), Puerto Rican (82 | 6.8%), Subsaharan African (61 | 5.0%), Ugandan (49 | 4.1%), and Irish (44 | 3.6%), together accounting for 28.0% of all Pleasant Hills residents.
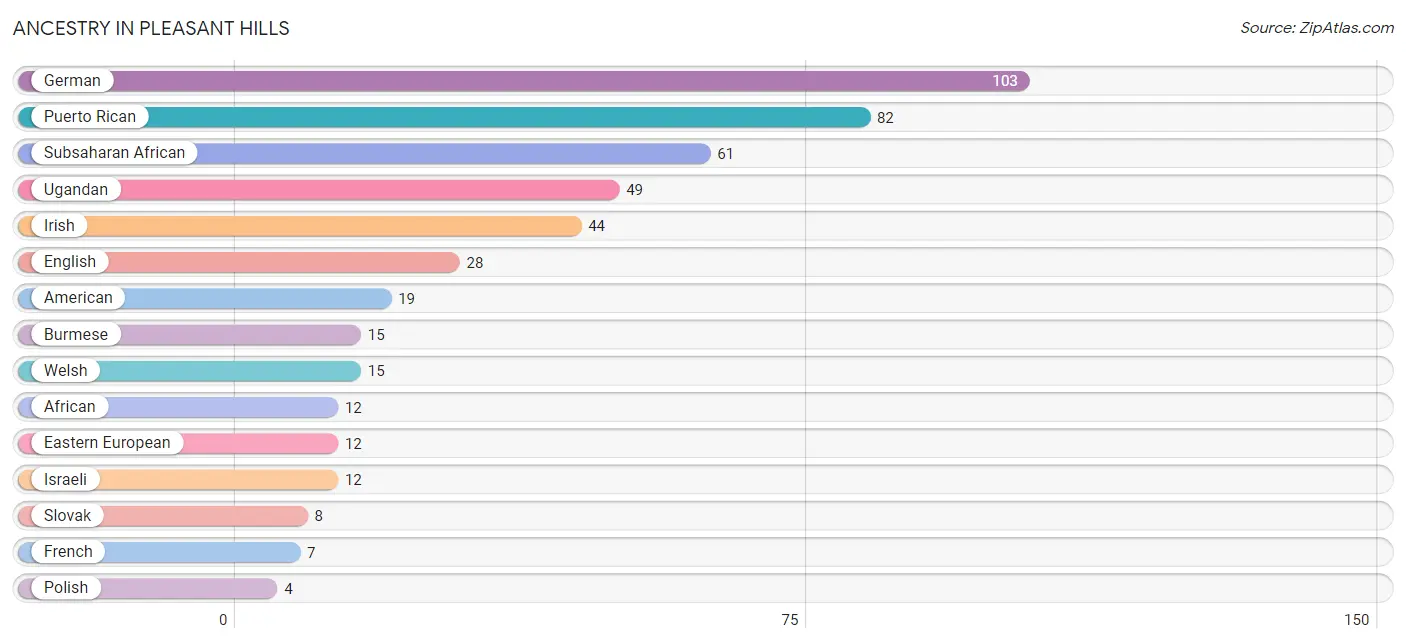
| Ancestry | # Population | % Population |
| African | 12 | 1.0% |
| American | 19 | 1.6% |
| Burmese | 15 | 1.2% |
| Eastern European | 12 | 1.0% |
| English | 28 | 2.3% |
| French | 7 | 0.6% |
| German | 103 | 8.5% |
| Irish | 44 | 3.6% |
| Israeli | 12 | 1.0% |
| Polish | 4 | 0.3% |
| Puerto Rican | 82 | 6.8% |
| Slovak | 8 | 0.7% |
| Subsaharan African | 61 | 5.0% |
| Ugandan | 49 | 4.1% |
| Welsh | 15 | 1.2% | View All 15 Rows |
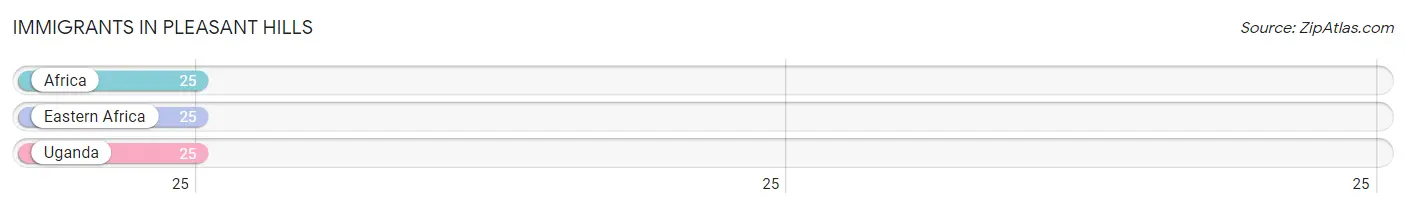
Immigrants in Pleasant Hills
The most numerous immigrant groups reported in Pleasant Hills came from Africa (25 | 2.1%), Eastern Africa (25 | 2.1%), and Uganda (25 | 2.1%), together accounting for 6.2% of all Pleasant Hills residents.
| Immigration Origin | # Population | % Population |
| Africa | 25 | 2.1% |
| Eastern Africa | 25 | 2.1% |
| Uganda | 25 | 2.1% | View All 3 Rows |
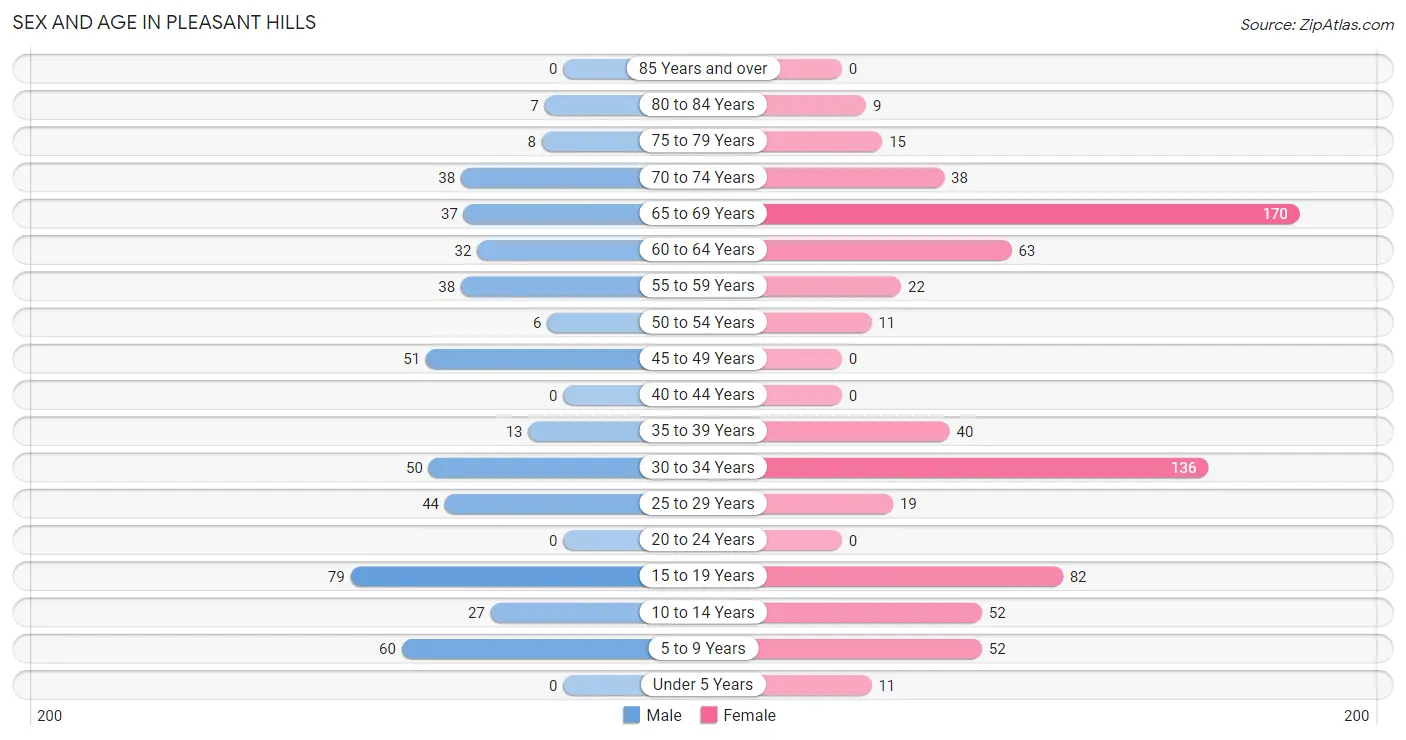
Sex and Age in Pleasant Hills
Sex and Age in Pleasant Hills
The most populous age groups in Pleasant Hills are 15 to 19 Years (79 | 16.1%) for men and 65 to 69 Years (170 | 23.6%) for women.
| Age Bracket | Male | Female |
| Under 5 Years | 0 (0.0%) | 11 (1.5%) |
| 5 to 9 Years | 60 (12.2%) | 52 (7.2%) |
| 10 to 14 Years | 27 (5.5%) | 52 (7.2%) |
| 15 to 19 Years | 79 (16.1%) | 82 (11.4%) |
| 20 to 24 Years | 0 (0.0%) | 0 (0.0%) |
| 25 to 29 Years | 44 (9.0%) | 19 (2.6%) |
| 30 to 34 Years | 50 (10.2%) | 136 (18.9%) |
| 35 to 39 Years | 13 (2.6%) | 40 (5.6%) |
| 40 to 44 Years | 0 (0.0%) | 0 (0.0%) |
| 45 to 49 Years | 51 (10.4%) | 0 (0.0%) |
| 50 to 54 Years | 6 (1.2%) | 11 (1.5%) |
| 55 to 59 Years | 38 (7.8%) | 22 (3.1%) |
| 60 to 64 Years | 32 (6.5%) | 63 (8.7%) |
| 65 to 69 Years | 37 (7.5%) | 170 (23.6%) |
| 70 to 74 Years | 38 (7.8%) | 38 (5.3%) |
| 75 to 79 Years | 8 (1.6%) | 15 (2.1%) |
| 80 to 84 Years | 7 (1.4%) | 9 (1.3%) |
| 85 Years and over | 0 (0.0%) | 0 (0.0%) |
| Total | 490 (100.0%) | 720 (100.0%) |
Families and Households in Pleasant Hills
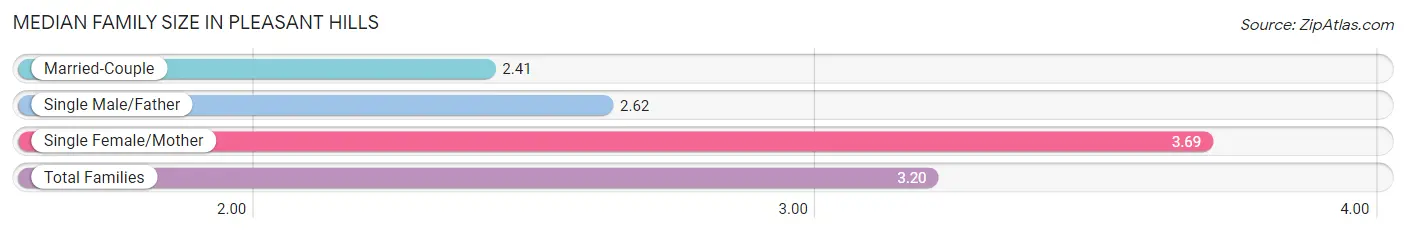
Median Family Size in Pleasant Hills
The median family size in Pleasant Hills is 3.20 persons per family, with single female/mother families (191 | 61.0%) accounting for the largest median family size of 3.69 persons per family. On the other hand, married-couple families (109 | 34.8%) represent the smallest median family size with 2.41 persons per family.
| Family Type | # Families | Family Size |
| Married-Couple | 109 (34.8%) | 2.41 |
| Single Male/Father | 13 (4.2%) | 2.62 |
| Single Female/Mother | 191 (61.0%) | 3.69 |
| Total Families | 313 (100.0%) | 3.20 |
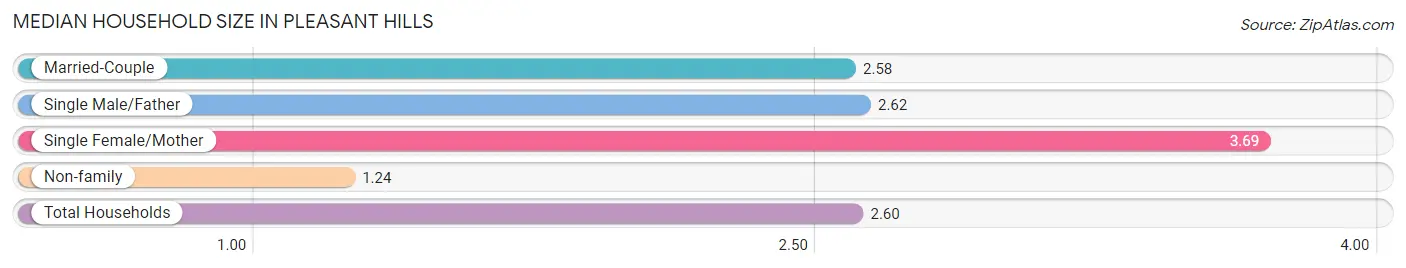
Median Household Size in Pleasant Hills
The median household size in Pleasant Hills is 2.60 persons per household, with single female/mother households (191 | 41.0%) accounting for the largest median household size of 3.69 persons per household. non-family households (153 | 32.8%) represent the smallest median household size with 1.24 persons per household.
| Household Type | # Households | Household Size |
| Married-Couple | 109 (23.4%) | 2.58 |
| Single Male/Father | 13 (2.8%) | 2.62 |
| Single Female/Mother | 191 (41.0%) | 3.69 |
| Non-family | 153 (32.8%) | 1.24 |
| Total Households | 466 (100.0%) | 2.60 |
Household Size by Marriage Status in Pleasant Hills
Out of a total of 466 households in Pleasant Hills, 313 (67.2%) are family households, while 153 (32.8%) are nonfamily households. The most numerous type of family households are 3-person households, comprising 144, and the most common type of nonfamily households are 1-person households, comprising 136.
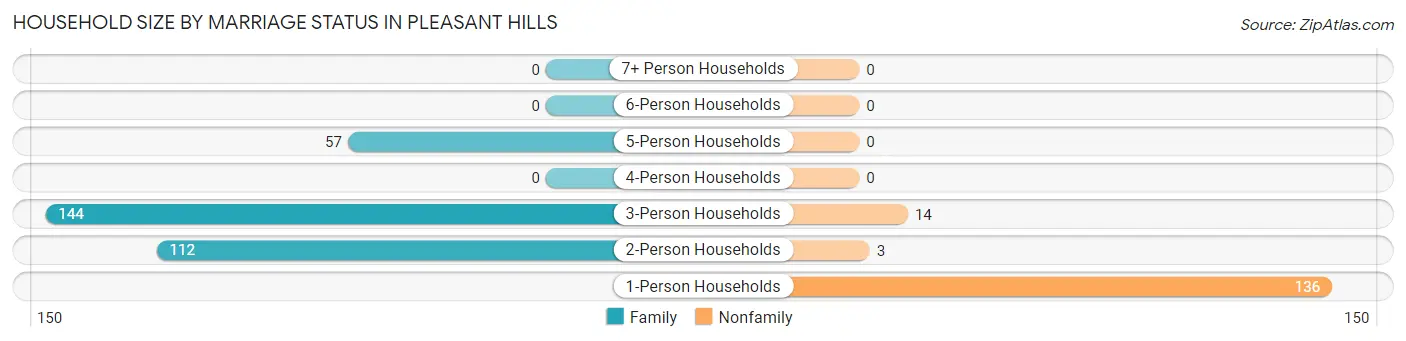
| Household Size | Family Households | Nonfamily Households |
| 1-Person Households | - | 136 (29.2%) |
| 2-Person Households | 112 (24.0%) | 3 (0.6%) |
| 3-Person Households | 144 (30.9%) | 14 (3.0%) |
| 4-Person Households | 0 (0.0%) | 0 (0.0%) |
| 5-Person Households | 57 (12.2%) | 0 (0.0%) |
| 6-Person Households | 0 (0.0%) | 0 (0.0%) |
| 7+ Person Households | 0 (0.0%) | 0 (0.0%) |
| Total | 313 (67.2%) | 153 (32.8%) |
Female Fertility in Pleasant Hills
Fertility by Age in Pleasant Hills
| Age Bracket | Women with Births | Births / 1,000 Women |
| 15 to 19 years | 0 (0.0%) | 0.0 |
| 20 to 34 years | 0 (0.0%) | 0.0 |
| 35 to 50 years | 0 (0.0%) | 0.0 |
| Total | 0 (0.0%) | 0.0 |
Fertility by Age by Marriage Status in Pleasant Hills
| Age Bracket | Married | Unmarried |
| 15 to 19 years | 0 (0.0%) | 0 (0.0%) |
| 20 to 34 years | 0 (0.0%) | 0 (0.0%) |
| 35 to 50 years | 0 (0.0%) | 0 (0.0%) |
| Total | 0 (0.0%) | 0 (0.0%) |
Fertility by Education in Pleasant Hills
| Educational Attainment | Women with Births | Births / 1,000 Women |
| Less than High School | 0 (0.0%) | 0.0 |
| High School Diploma | 0 (0.0%) | 0.0 |
| College or Associate's Degree | 0 (0.0%) | 0.0 |
| Bachelor's Degree | 0 (0.0%) | 0.0 |
| Graduate Degree | 0 (0.0%) | 0.0 |
| Total | 0 (0.0%) | 0.0 |
Fertility by Education by Marriage Status in Pleasant Hills
| Educational Attainment | Married | Unmarried |
| Less than High School | 0 (0.0%) | 0 (0.0%) |
| High School Diploma | 0 (0.0%) | 0 (0.0%) |
| College or Associate's Degree | 0 (0.0%) | 0 (0.0%) |
| Bachelor's Degree | 0 (0.0%) | 0 (0.0%) |
| Graduate Degree | 0 (0.0%) | 0 (0.0%) |
| Total | 0 (0.0%) | 0 (0.0%) |
Employment Characteristics in Pleasant Hills
Employment by Class of Employer in Pleasant Hills
Among the 498 employed individuals in Pleasant Hills, private company employees (376 | 75.5%), not-for-profit organizations (72 | 14.5%), and self-employed (not incorporated) (25 | 5.0%) make up the most common classes of employment.
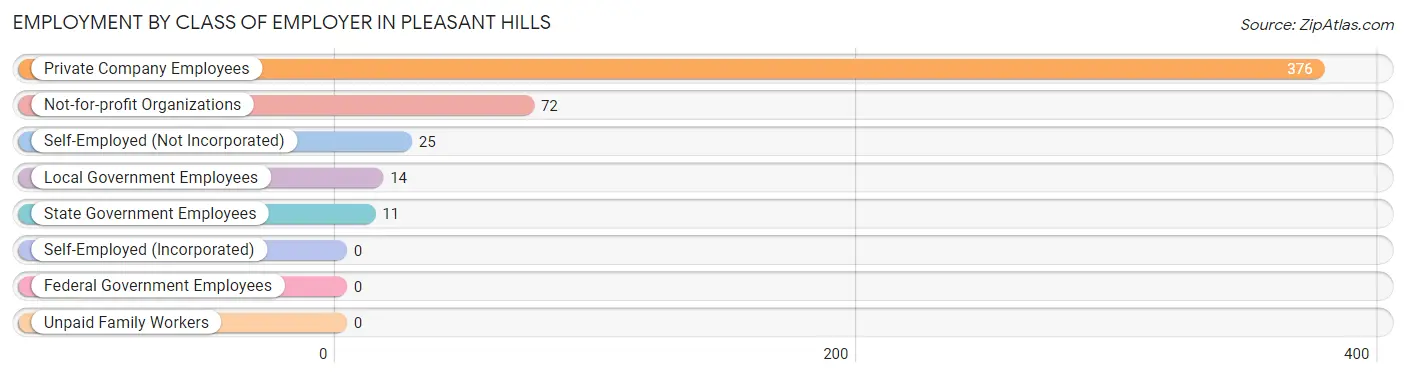
| Employer Class | # Employees | % Employees |
| Private Company Employees | 376 | 75.5% |
| Self-Employed (Incorporated) | 0 | 0.0% |
| Self-Employed (Not Incorporated) | 25 | 5.0% |
| Not-for-profit Organizations | 72 | 14.5% |
| Local Government Employees | 14 | 2.8% |
| State Government Employees | 11 | 2.2% |
| Federal Government Employees | 0 | 0.0% |
| Unpaid Family Workers | 0 | 0.0% |
| Total | 498 | 100.0% |
Employment Status by Age in Pleasant Hills
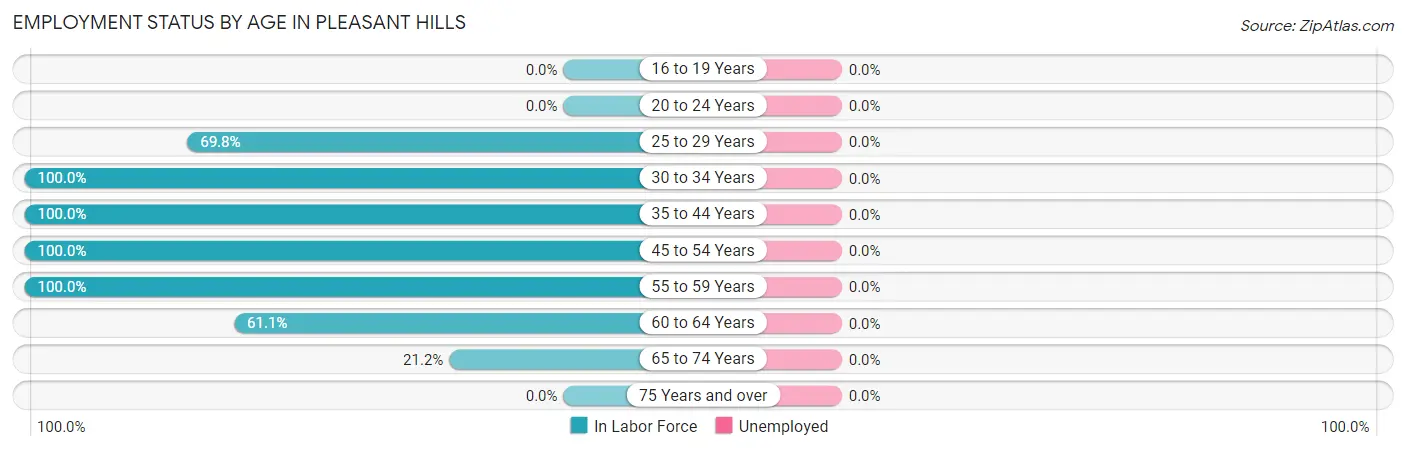
| Age Bracket | In Labor Force | Unemployed |
| 16 to 19 Years | 0 (0.0%) | 0 (0.0%) |
| 20 to 24 Years | 0 (0.0%) | 0 (0.0%) |
| 25 to 29 Years | 44 (69.8%) | 0 (0.0%) |
| 30 to 34 Years | 186 (100.0%) | 0 (0.0%) |
| 35 to 44 Years | 53 (100.0%) | 0 (0.0%) |
| 45 to 54 Years | 68 (100.0%) | 0 (0.0%) |
| 55 to 59 Years | 60 (100.0%) | 0 (0.0%) |
| 60 to 64 Years | 58 (61.1%) | 0 (0.0%) |
| 65 to 74 Years | 60 (21.2%) | 0 (0.0%) |
| 75 Years and over | 0 (0.0%) | 0 (0.0%) |
| Total | 529 (61.7%) | 0 (0.0%) |
Employment Status by Educational Attainment in Pleasant Hills
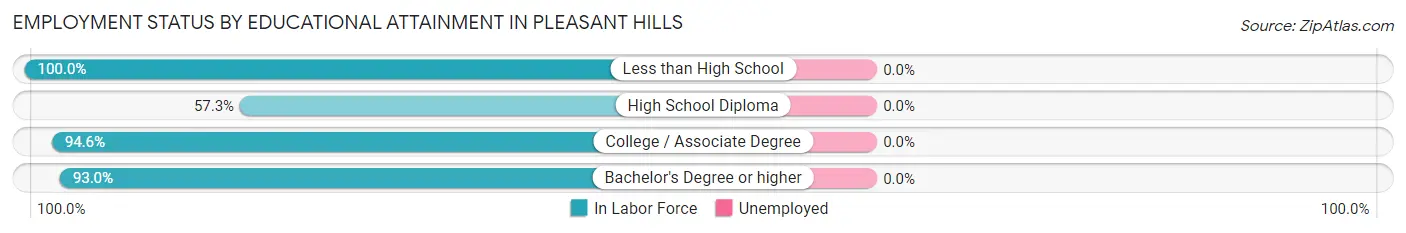
| Educational Attainment | In Labor Force | Unemployed |
| Less than High School | 57 (100.0%) | 0 (0.0%) |
| High School Diploma | 43 (57.3%) | 0 (0.0%) |
| College / Associate Degree | 209 (94.6%) | 0 (0.0%) |
| Bachelor's Degree or higher | 160 (93.0%) | 0 (0.0%) |
| Total | 469 (89.3%) | 0 (0.0%) |
Employment Occupations by Sex in Pleasant Hills
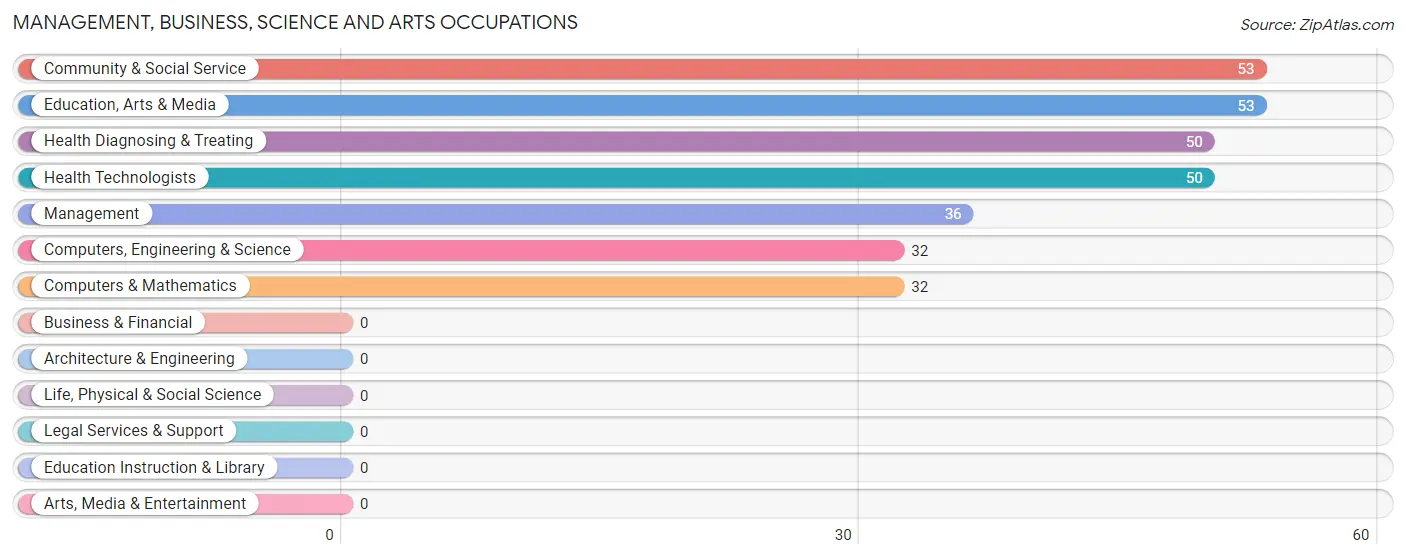
Management, Business, Science and Arts Occupations
The most common Management, Business, Science and Arts occupations in Pleasant Hills are Community & Social Service (53 | 10.0%), Education, Arts & Media (53 | 10.0%), Health Diagnosing & Treating (50 | 9.5%), Health Technologists (50 | 9.5%), and Management (36 | 6.8%).
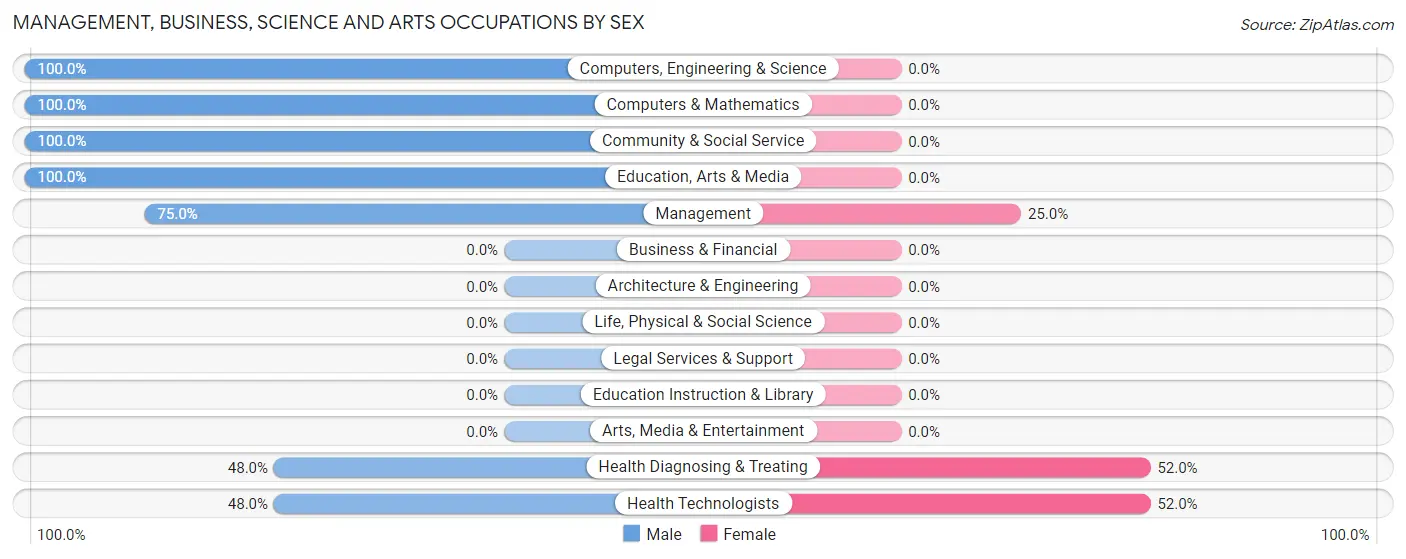
Management, Business, Science and Arts Occupations by Sex
Within the Management, Business, Science and Arts occupations in Pleasant Hills, the most male-oriented occupations are Computers, Engineering & Science (100.0%), Computers & Mathematics (100.0%), and Community & Social Service (100.0%), while the most female-oriented occupations are Health Diagnosing & Treating (52.0%), Health Technologists (52.0%), and Management (25.0%).
| Occupation | Male | Female |
| Management | 27 (75.0%) | 9 (25.0%) |
| Business & Financial | 0 (0.0%) | 0 (0.0%) |
| Computers, Engineering & Science | 32 (100.0%) | 0 (0.0%) |
| Computers & Mathematics | 32 (100.0%) | 0 (0.0%) |
| Architecture & Engineering | 0 (0.0%) | 0 (0.0%) |
| Life, Physical & Social Science | 0 (0.0%) | 0 (0.0%) |
| Community & Social Service | 53 (100.0%) | 0 (0.0%) |
| Education, Arts & Media | 53 (100.0%) | 0 (0.0%) |
| Legal Services & Support | 0 (0.0%) | 0 (0.0%) |
| Education Instruction & Library | 0 (0.0%) | 0 (0.0%) |
| Arts, Media & Entertainment | 0 (0.0%) | 0 (0.0%) |
| Health Diagnosing & Treating | 24 (48.0%) | 26 (52.0%) |
| Health Technologists | 24 (48.0%) | 26 (52.0%) |
| Total (Category) | 136 (79.5%) | 35 (20.5%) |
| Total (Overall) | 269 (50.8%) | 260 (49.1%) |
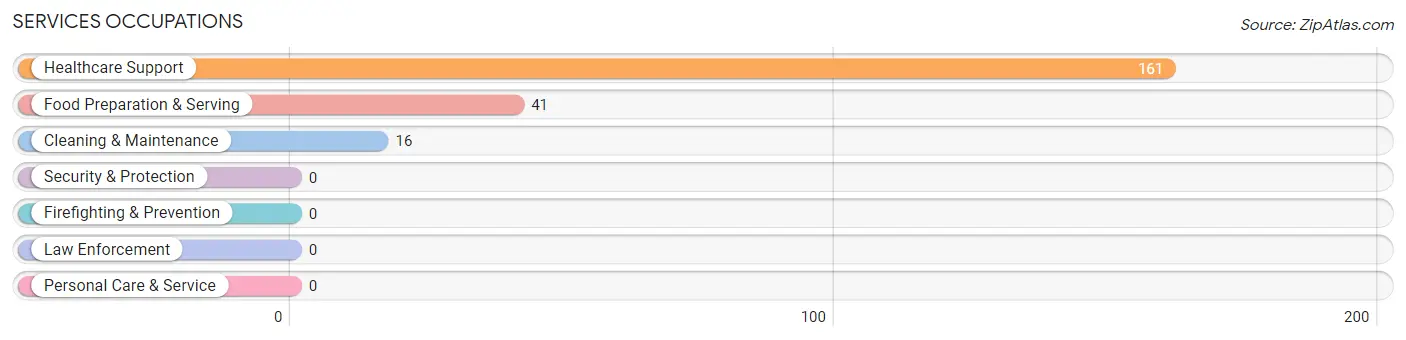
Services Occupations
The most common Services occupations in Pleasant Hills are Healthcare Support (161 | 30.4%), Food Preparation & Serving (41 | 7.7%), and Cleaning & Maintenance (16 | 3.0%).
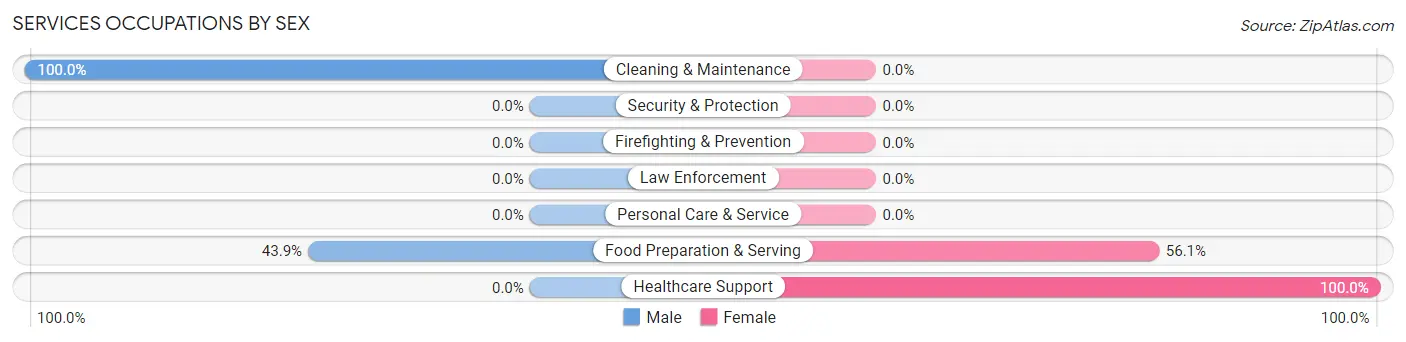
Services Occupations by Sex
Within the Services occupations in Pleasant Hills, the most male-oriented occupations are Cleaning & Maintenance (100.0%), and Food Preparation & Serving (43.9%), while the most female-oriented occupations are Healthcare Support (100.0%), and Food Preparation & Serving (56.1%).
| Occupation | Male | Female |
| Healthcare Support | 0 (0.0%) | 161 (100.0%) |
| Security & Protection | 0 (0.0%) | 0 (0.0%) |
| Firefighting & Prevention | 0 (0.0%) | 0 (0.0%) |
| Law Enforcement | 0 (0.0%) | 0 (0.0%) |
| Food Preparation & Serving | 18 (43.9%) | 23 (56.1%) |
| Cleaning & Maintenance | 16 (100.0%) | 0 (0.0%) |
| Personal Care & Service | 0 (0.0%) | 0 (0.0%) |
| Total (Category) | 34 (15.6%) | 184 (84.4%) |
| Total (Overall) | 269 (50.8%) | 260 (49.1%) |
Sales and Office Occupations
The most common Sales and Office occupations in Pleasant Hills are Sales & Related (33 | 6.2%), and Office & Administration (26 | 4.9%).
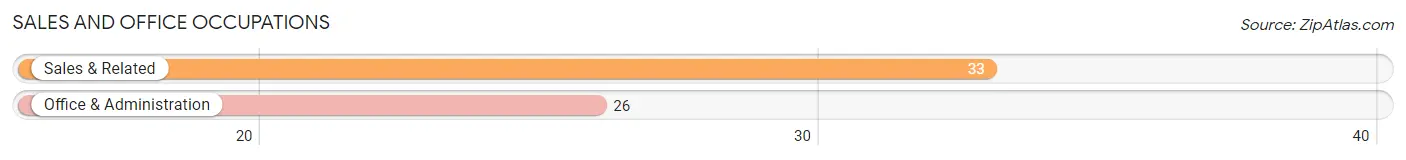
Sales and Office Occupations by Sex
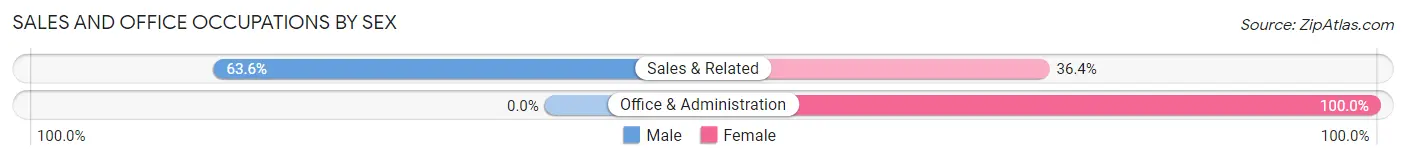
| Occupation | Male | Female |
| Sales & Related | 21 (63.6%) | 12 (36.4%) |
| Office & Administration | 0 (0.0%) | 26 (100.0%) |
| Total (Category) | 21 (35.6%) | 38 (64.4%) |
| Total (Overall) | 269 (50.8%) | 260 (49.1%) |
Natural Resources, Construction and Maintenance Occupations
The most common Natural Resources, Construction and Maintenance occupations in Pleasant Hills are , and Installation, Maintenance & Repair (4 | 0.8%).
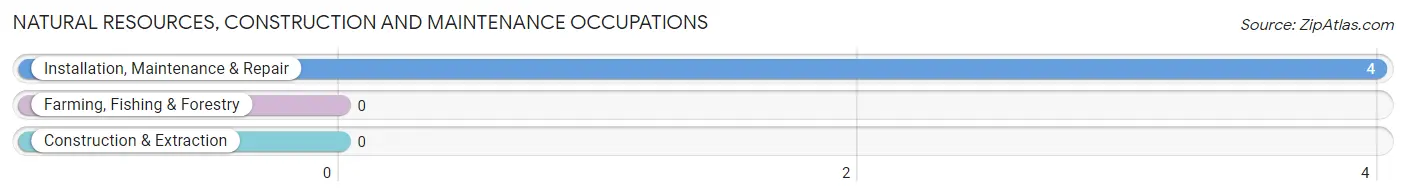
Natural Resources, Construction and Maintenance Occupations by Sex
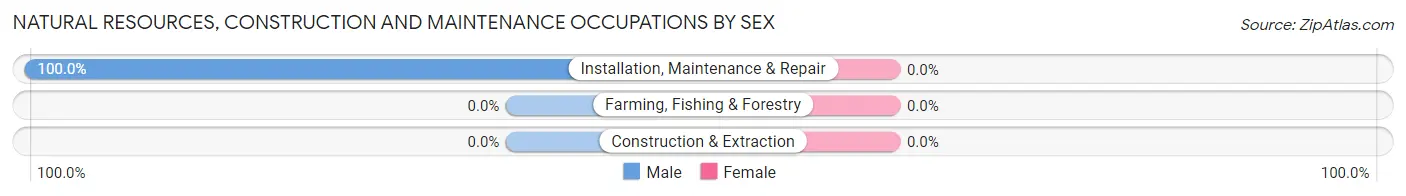
| Occupation | Male | Female |
| Farming, Fishing & Forestry | 0 (0.0%) | 0 (0.0%) |
| Construction & Extraction | 0 (0.0%) | 0 (0.0%) |
| Installation, Maintenance & Repair | 4 (100.0%) | 0 (0.0%) |
| Total (Category) | 4 (100.0%) | 0 (0.0%) |
| Total (Overall) | 269 (50.8%) | 260 (49.1%) |
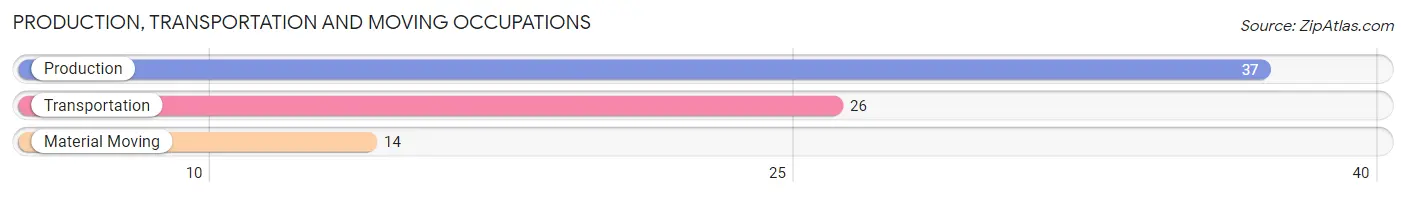
Production, Transportation and Moving Occupations
The most common Production, Transportation and Moving occupations in Pleasant Hills are Production (37 | 7.0%), Transportation (26 | 4.9%), and Material Moving (14 | 2.6%).
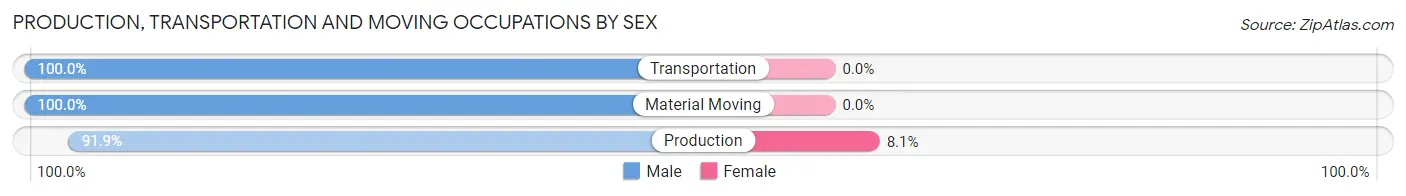
Production, Transportation and Moving Occupations by Sex
| Occupation | Male | Female |
| Production | 34 (91.9%) | 3 (8.1%) |
| Transportation | 26 (100.0%) | 0 (0.0%) |
| Material Moving | 14 (100.0%) | 0 (0.0%) |
| Total (Category) | 74 (96.1%) | 3 (3.9%) |
| Total (Overall) | 269 (50.8%) | 260 (49.1%) |
Employment Industries by Sex in Pleasant Hills
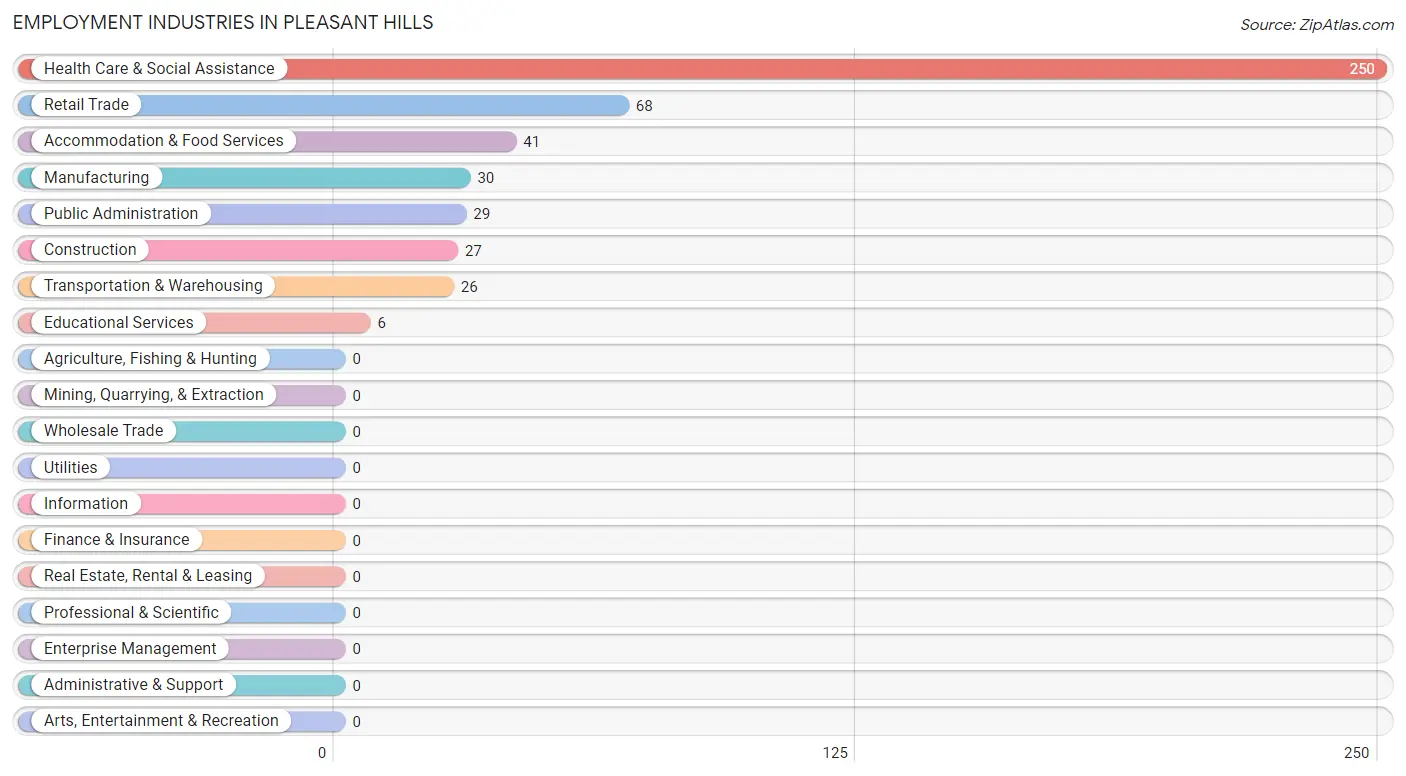
Employment Industries in Pleasant Hills
The major employment industries in Pleasant Hills include Health Care & Social Assistance (250 | 47.3%), Retail Trade (68 | 12.9%), Accommodation & Food Services (41 | 7.7%), Manufacturing (30 | 5.7%), and Public Administration (29 | 5.5%).
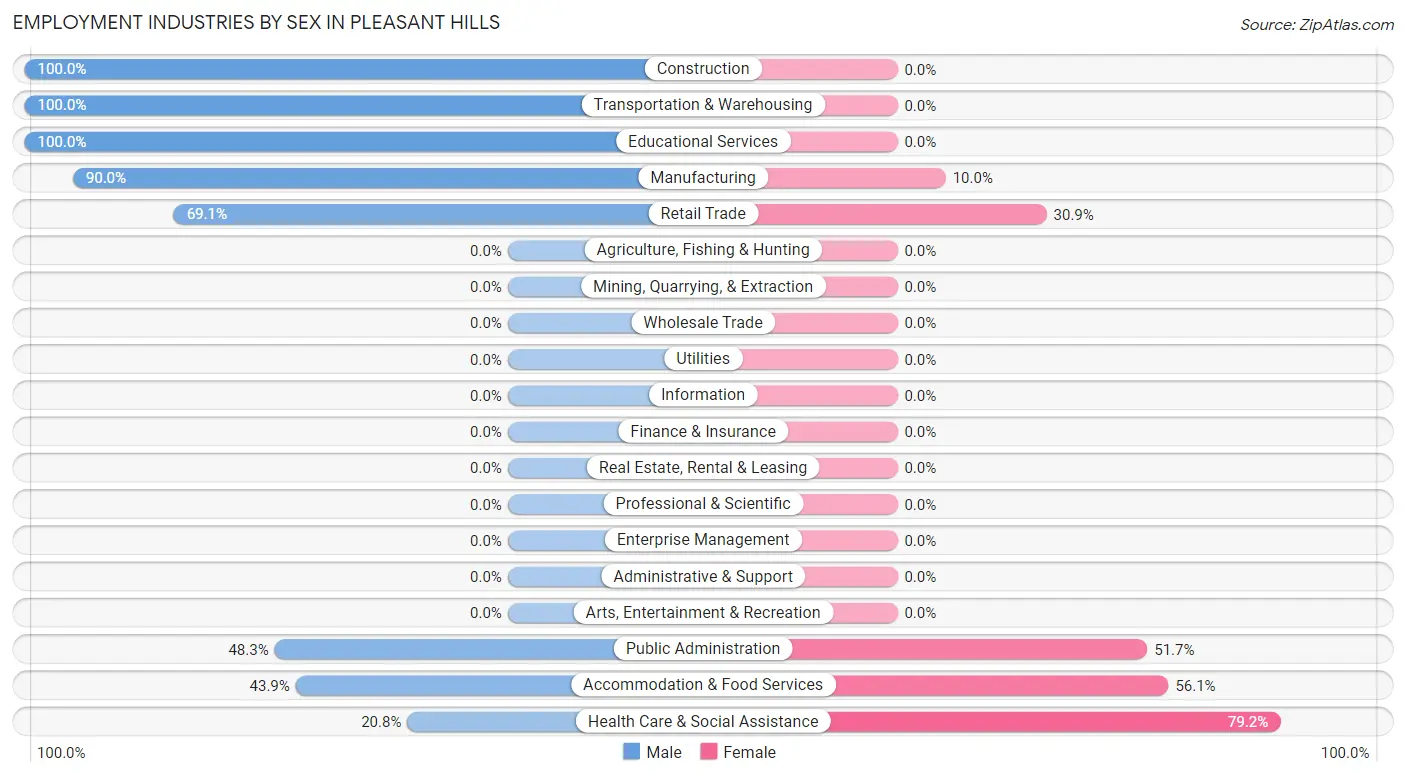
Employment Industries by Sex in Pleasant Hills
The Pleasant Hills industries that see more men than women are Construction (100.0%), Transportation & Warehousing (100.0%), and Educational Services (100.0%), whereas the industries that tend to have a higher number of women are Health Care & Social Assistance (79.2%), Accommodation & Food Services (56.1%), and Public Administration (51.7%).
| Industry | Male | Female |
| Agriculture, Fishing & Hunting | 0 (0.0%) | 0 (0.0%) |
| Mining, Quarrying, & Extraction | 0 (0.0%) | 0 (0.0%) |
| Construction | 27 (100.0%) | 0 (0.0%) |
| Manufacturing | 27 (90.0%) | 3 (10.0%) |
| Wholesale Trade | 0 (0.0%) | 0 (0.0%) |
| Retail Trade | 47 (69.1%) | 21 (30.9%) |
| Transportation & Warehousing | 26 (100.0%) | 0 (0.0%) |
| Utilities | 0 (0.0%) | 0 (0.0%) |
| Information | 0 (0.0%) | 0 (0.0%) |
| Finance & Insurance | 0 (0.0%) | 0 (0.0%) |
| Real Estate, Rental & Leasing | 0 (0.0%) | 0 (0.0%) |
| Professional & Scientific | 0 (0.0%) | 0 (0.0%) |
| Enterprise Management | 0 (0.0%) | 0 (0.0%) |
| Administrative & Support | 0 (0.0%) | 0 (0.0%) |
| Educational Services | 6 (100.0%) | 0 (0.0%) |
| Health Care & Social Assistance | 52 (20.8%) | 198 (79.2%) |
| Arts, Entertainment & Recreation | 0 (0.0%) | 0 (0.0%) |
| Accommodation & Food Services | 18 (43.9%) | 23 (56.1%) |
| Public Administration | 14 (48.3%) | 15 (51.7%) |
| Total | 269 (50.8%) | 260 (49.1%) |
Education in Pleasant Hills
School Enrollment in Pleasant Hills
The most common levels of schooling among the 455 students in Pleasant Hills are middle school (161 | 35.4%), high school (139 | 30.5%), and college / undergraduate (79 | 17.4%).
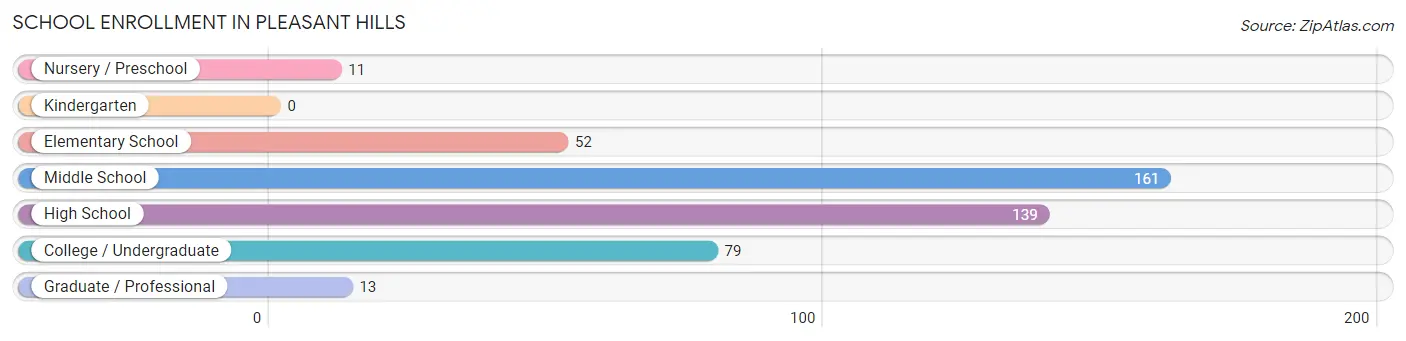
| School Level | # Students | % Students |
| Nursery / Preschool | 11 | 2.4% |
| Kindergarten | 0 | 0.0% |
| Elementary School | 52 | 11.4% |
| Middle School | 161 | 35.4% |
| High School | 139 | 30.5% |
| College / Undergraduate | 79 | 17.4% |
| Graduate / Professional | 13 | 2.9% |
| Total | 455 | 100.0% |
School Enrollment by Age by Funding Source in Pleasant Hills
Out of a total of 455 students who are enrolled in schools in Pleasant Hills, 90 (19.8%) attend a private institution, while the remaining 365 (80.2%) are enrolled in public schools. The age group of 3 to 4 year olds has the highest likelihood of being enrolled in private schools, with 11 (100.0% in the age bracket) enrolled. Conversely, the age group of 5 to 9 year old has the lowest likelihood of being enrolled in a private school, with 112 (100.0% in the age bracket) attending a public institution.
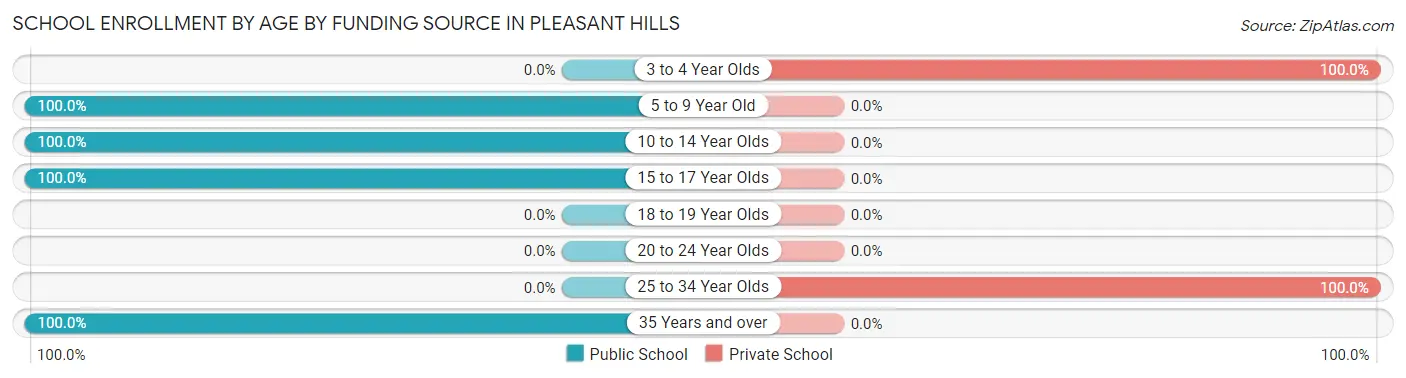
| Age Bracket | Public School | Private School |
| 3 to 4 Year Olds | 0 (0.0%) | 11 (100.0%) |
| 5 to 9 Year Old | 112 (100.0%) | 0 (0.0%) |
| 10 to 14 Year Olds | 79 (100.0%) | 0 (0.0%) |
| 15 to 17 Year Olds | 161 (100.0%) | 0 (0.0%) |
| 18 to 19 Year Olds | 0 (0.0%) | 0 (0.0%) |
| 20 to 24 Year Olds | 0 (0.0%) | 0 (0.0%) |
| 25 to 34 Year Olds | 0 (0.0%) | 79 (100.0%) |
| 35 Years and over | 13 (100.0%) | 0 (0.0%) |
| Total | 365 (80.2%) | 90 (19.8%) |
Educational Attainment by Field of Study in Pleasant Hills
Science & technology (129 | 54.7%), business (31 | 13.1%), liberal arts & history (28 | 11.9%), computers & mathematics (15 | 6.4%), and arts & humanities (14 | 5.9%) are the most common fields of study among 236 individuals in Pleasant Hills who have obtained a bachelor's degree or higher.
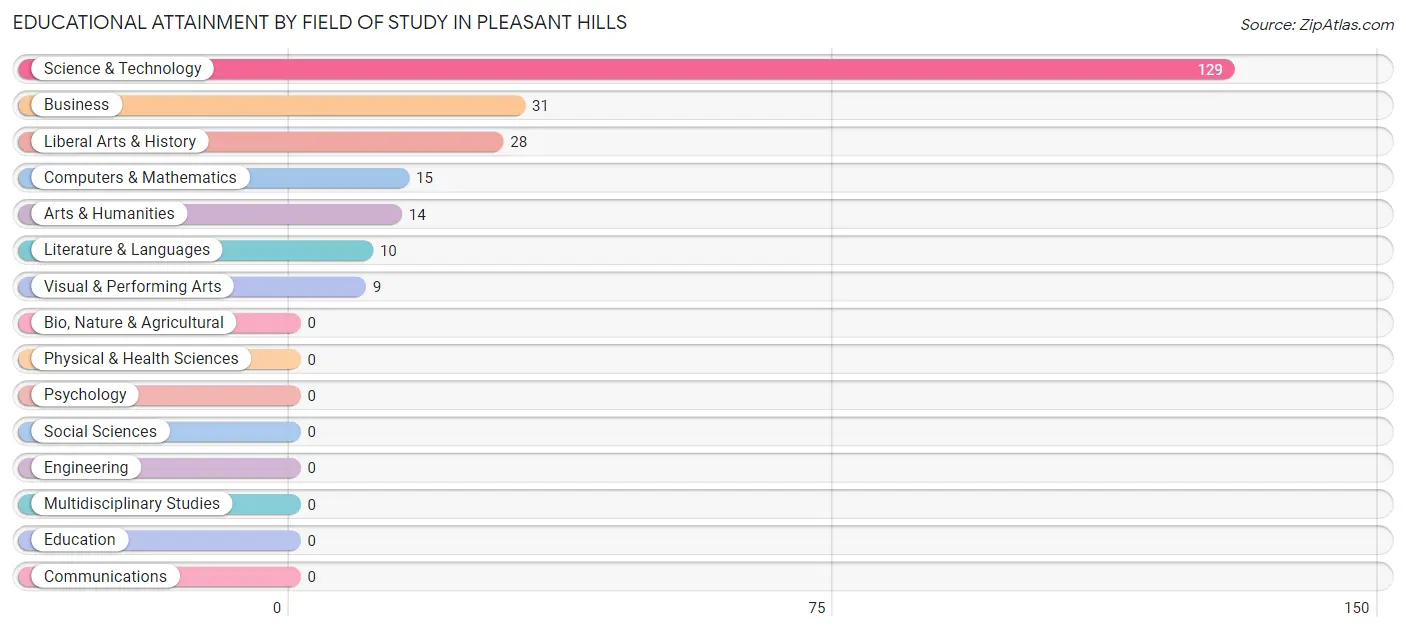
| Field of Study | # Graduates | % Graduates |
| Computers & Mathematics | 15 | 6.4% |
| Bio, Nature & Agricultural | 0 | 0.0% |
| Physical & Health Sciences | 0 | 0.0% |
| Psychology | 0 | 0.0% |
| Social Sciences | 0 | 0.0% |
| Engineering | 0 | 0.0% |
| Multidisciplinary Studies | 0 | 0.0% |
| Science & Technology | 129 | 54.7% |
| Business | 31 | 13.1% |
| Education | 0 | 0.0% |
| Literature & Languages | 10 | 4.2% |
| Liberal Arts & History | 28 | 11.9% |
| Visual & Performing Arts | 9 | 3.8% |
| Communications | 0 | 0.0% |
| Arts & Humanities | 14 | 5.9% |
| Total | 236 | 100.0% |
Transportation & Commute in Pleasant Hills
Vehicle Availability by Sex in Pleasant Hills
The most prevalent vehicle ownership categories in Pleasant Hills are males with 2 vehicles (124, accounting for 49.0%) and females with 2 vehicles (42, making up 50.6%).
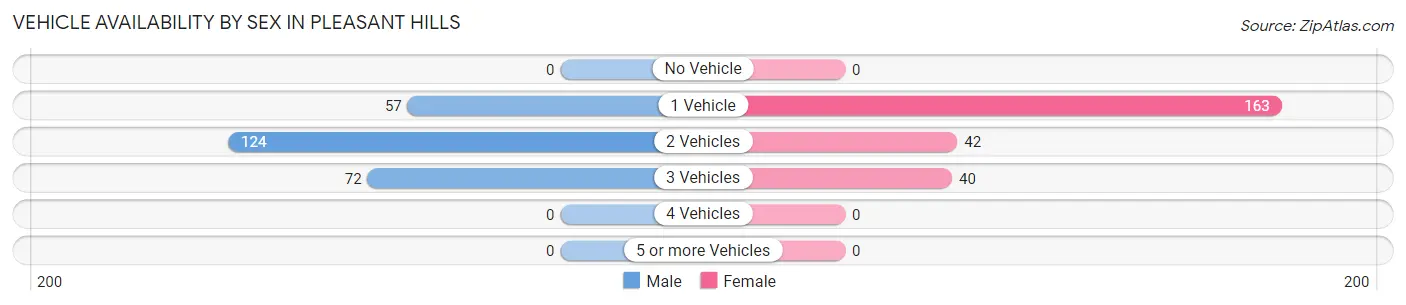
| Vehicles Available | Male | Female |
| No Vehicle | 0 (0.0%) | 0 (0.0%) |
| 1 Vehicle | 57 (22.5%) | 163 (66.5%) |
| 2 Vehicles | 124 (49.0%) | 42 (17.1%) |
| 3 Vehicles | 72 (28.5%) | 40 (16.3%) |
| 4 Vehicles | 0 (0.0%) | 0 (0.0%) |
| 5 or more Vehicles | 0 (0.0%) | 0 (0.0%) |
| Total | 253 (100.0%) | 245 (100.0%) |
Commute Time in Pleasant Hills
The most frequently occuring commute durations in Pleasant Hills are 30 to 34 minutes (159 commuters, 38.3%), 5 to 9 minutes (57 commuters, 13.7%), and 20 to 24 minutes (51 commuters, 12.3%).
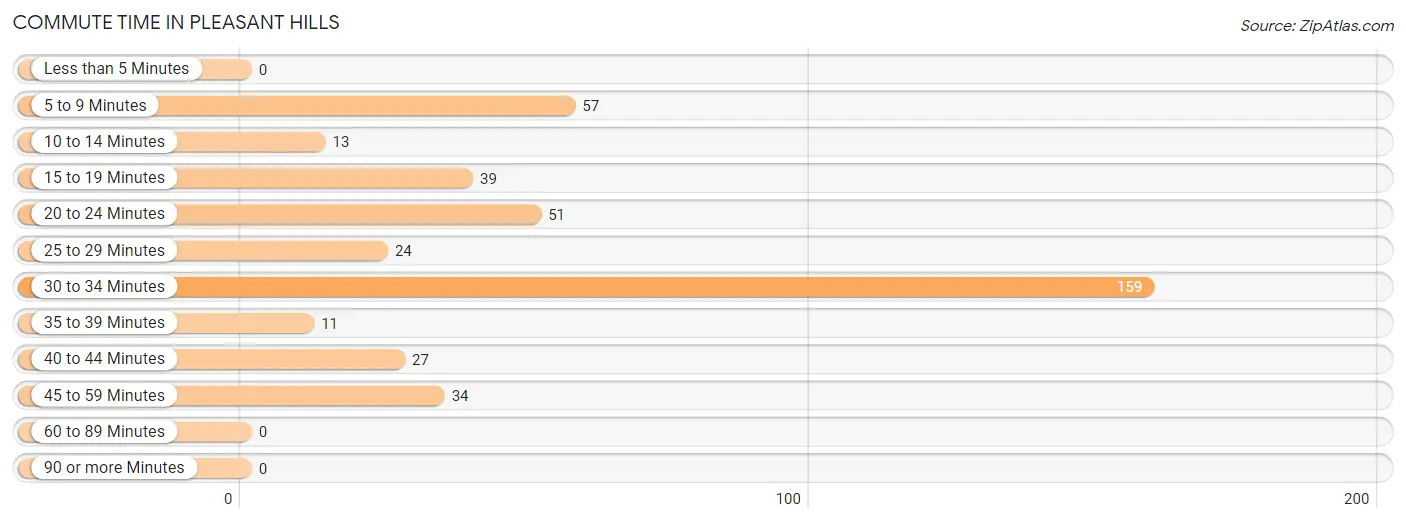
| Commute Time | # Commuters | % Commuters |
| Less than 5 Minutes | 0 | 0.0% |
| 5 to 9 Minutes | 57 | 13.7% |
| 10 to 14 Minutes | 13 | 3.1% |
| 15 to 19 Minutes | 39 | 9.4% |
| 20 to 24 Minutes | 51 | 12.3% |
| 25 to 29 Minutes | 24 | 5.8% |
| 30 to 34 Minutes | 159 | 38.3% |
| 35 to 39 Minutes | 11 | 2.6% |
| 40 to 44 Minutes | 27 | 6.5% |
| 45 to 59 Minutes | 34 | 8.2% |
| 60 to 89 Minutes | 0 | 0.0% |
| 90 or more Minutes | 0 | 0.0% |
Commute Time by Sex in Pleasant Hills
The most common commute times in Pleasant Hills are 20 to 24 minutes (42 commuters, 24.7%) for males and 30 to 34 minutes (126 commuters, 51.4%) for females.
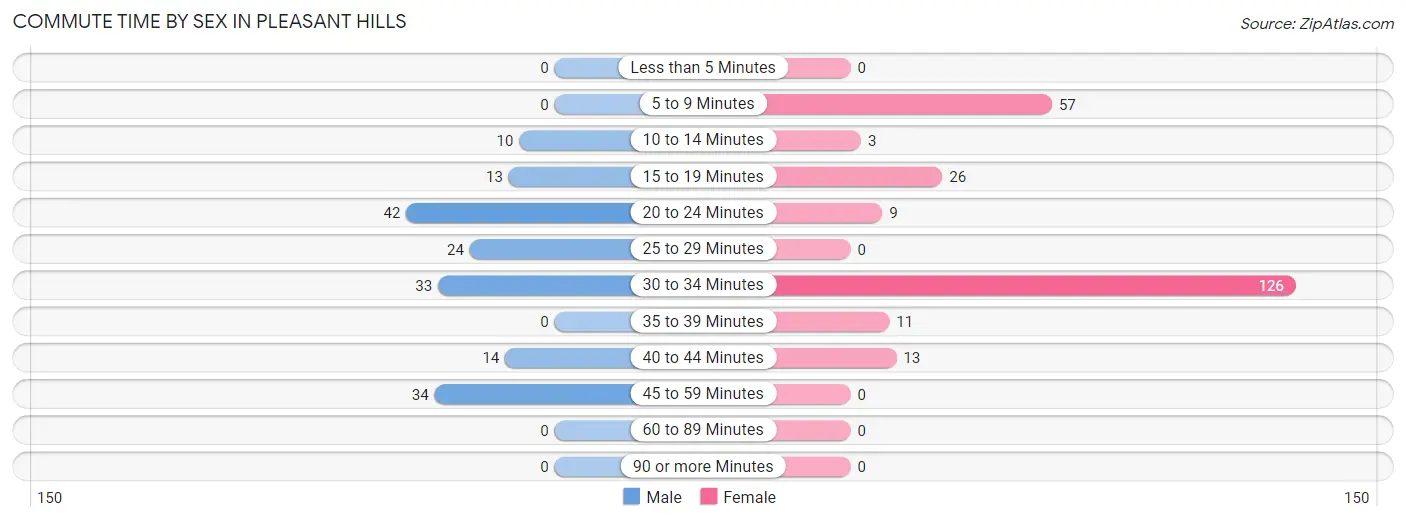
| Commute Time | Male | Female |
| Less than 5 Minutes | 0 (0.0%) | 0 (0.0%) |
| 5 to 9 Minutes | 0 (0.0%) | 57 (23.3%) |
| 10 to 14 Minutes | 10 (5.9%) | 3 (1.2%) |
| 15 to 19 Minutes | 13 (7.6%) | 26 (10.6%) |
| 20 to 24 Minutes | 42 (24.7%) | 9 (3.7%) |
| 25 to 29 Minutes | 24 (14.1%) | 0 (0.0%) |
| 30 to 34 Minutes | 33 (19.4%) | 126 (51.4%) |
| 35 to 39 Minutes | 0 (0.0%) | 11 (4.5%) |
| 40 to 44 Minutes | 14 (8.2%) | 13 (5.3%) |
| 45 to 59 Minutes | 34 (20.0%) | 0 (0.0%) |
| 60 to 89 Minutes | 0 (0.0%) | 0 (0.0%) |
| 90 or more Minutes | 0 (0.0%) | 0 (0.0%) |
Time of Departure to Work by Sex in Pleasant Hills
The most frequent times of departure to work in Pleasant Hills are 12:00 AM to 4:59 AM (61, 35.9%) for males and 7:00 AM to 7:29 AM (118, 48.2%) for females.
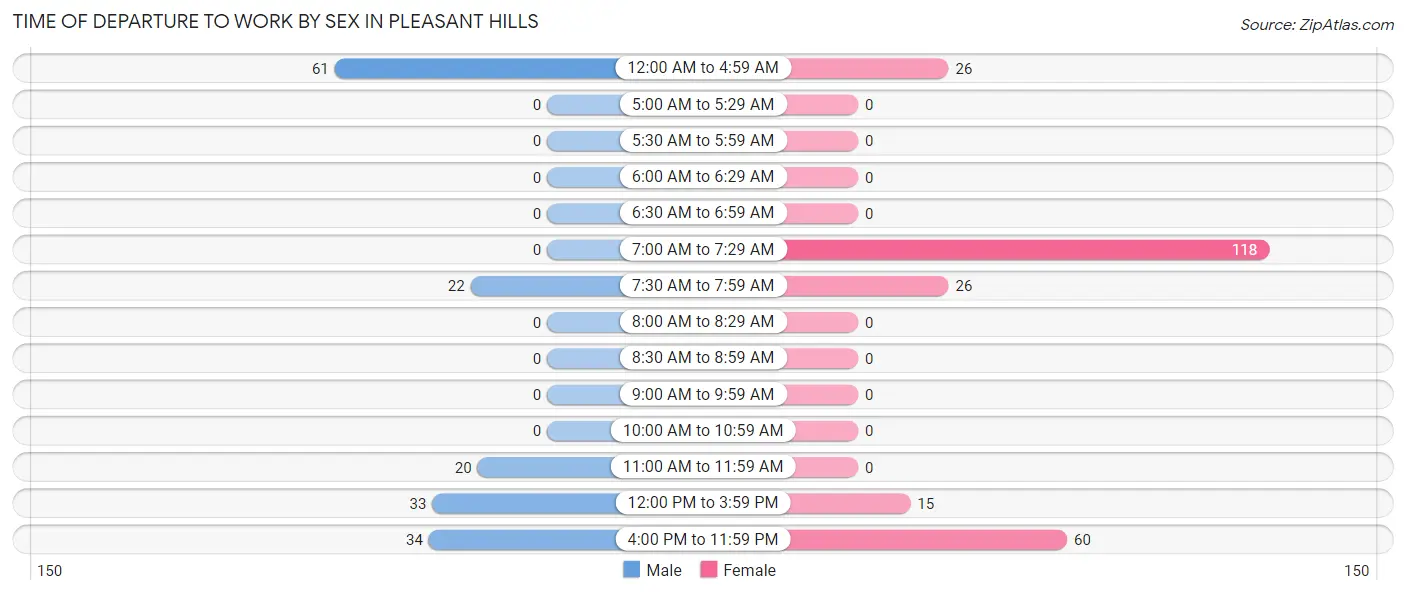
| Time of Departure | Male | Female |
| 12:00 AM to 4:59 AM | 61 (35.9%) | 26 (10.6%) |
| 5:00 AM to 5:29 AM | 0 (0.0%) | 0 (0.0%) |
| 5:30 AM to 5:59 AM | 0 (0.0%) | 0 (0.0%) |
| 6:00 AM to 6:29 AM | 0 (0.0%) | 0 (0.0%) |
| 6:30 AM to 6:59 AM | 0 (0.0%) | 0 (0.0%) |
| 7:00 AM to 7:29 AM | 0 (0.0%) | 118 (48.2%) |
| 7:30 AM to 7:59 AM | 22 (12.9%) | 26 (10.6%) |
| 8:00 AM to 8:29 AM | 0 (0.0%) | 0 (0.0%) |
| 8:30 AM to 8:59 AM | 0 (0.0%) | 0 (0.0%) |
| 9:00 AM to 9:59 AM | 0 (0.0%) | 0 (0.0%) |
| 10:00 AM to 10:59 AM | 0 (0.0%) | 0 (0.0%) |
| 11:00 AM to 11:59 AM | 20 (11.8%) | 0 (0.0%) |
| 12:00 PM to 3:59 PM | 33 (19.4%) | 15 (6.1%) |
| 4:00 PM to 11:59 PM | 34 (20.0%) | 60 (24.5%) |
| Total | 170 (100.0%) | 245 (100.0%) |
Housing Occupancy in Pleasant Hills
Occupancy by Ownership in Pleasant Hills
Of the total 466 dwellings in Pleasant Hills, owner-occupied units account for 368 (79.0%), while renter-occupied units make up 98 (21.0%).
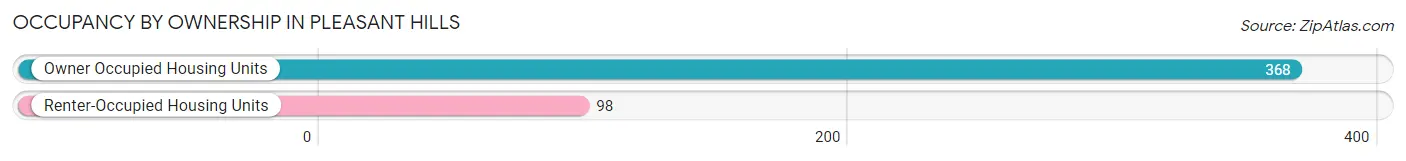
| Occupancy | # Housing Units | % Housing Units |
| Owner Occupied Housing Units | 368 | 79.0% |
| Renter-Occupied Housing Units | 98 | 21.0% |
| Total Occupied Housing Units | 466 | 100.0% |
Occupancy by Household Size in Pleasant Hills
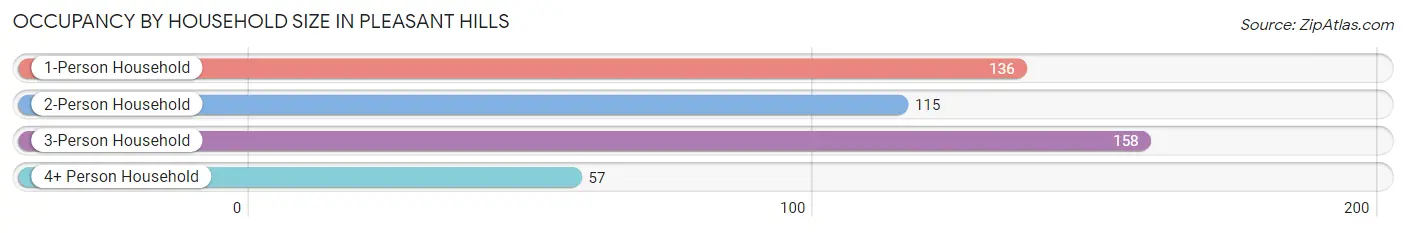
| Household Size | # Housing Units | % Housing Units |
| 1-Person Household | 136 | 29.2% |
| 2-Person Household | 115 | 24.7% |
| 3-Person Household | 158 | 33.9% |
| 4+ Person Household | 57 | 12.2% |
| Total Housing Units | 466 | 100.0% |
Occupancy by Ownership by Household Size in Pleasant Hills
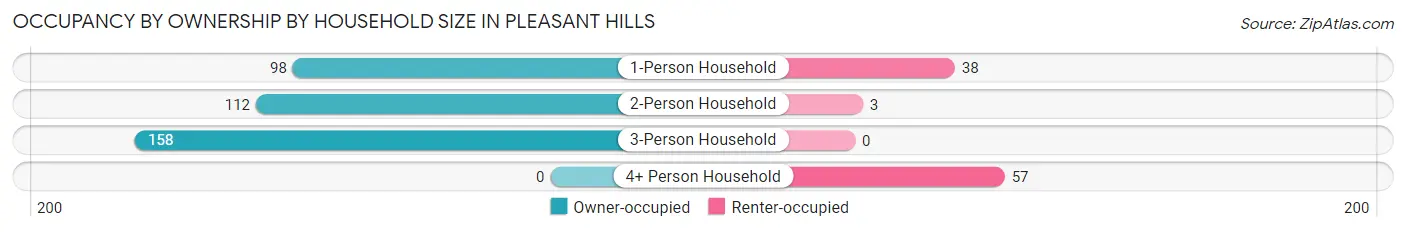
| Household Size | Owner-occupied | Renter-occupied |
| 1-Person Household | 98 (72.1%) | 38 (27.9%) |
| 2-Person Household | 112 (97.4%) | 3 (2.6%) |
| 3-Person Household | 158 (100.0%) | 0 (0.0%) |
| 4+ Person Household | 0 (0.0%) | 57 (100.0%) |
| Total Housing Units | 368 (79.0%) | 98 (21.0%) |
Occupancy by Educational Attainment in Pleasant Hills
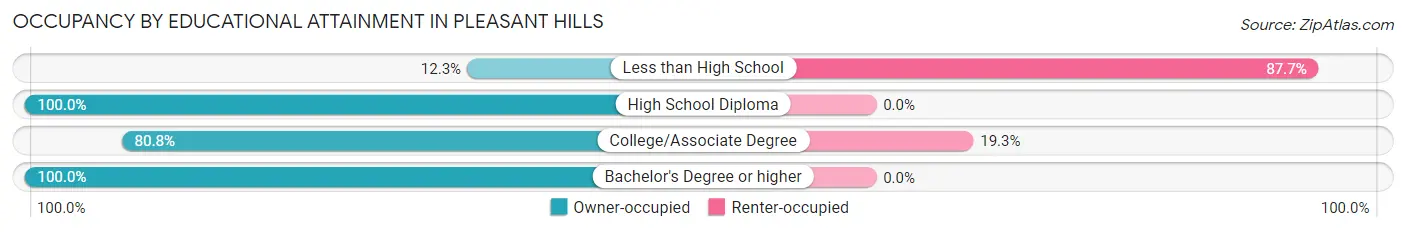
| Household Size | Owner-occupied | Renter-occupied |
| Less than High School | 8 (12.3%) | 57 (87.7%) |
| High School Diploma | 19 (100.0%) | 0 (0.0%) |
| College/Associate Degree | 172 (80.7%) | 41 (19.3%) |
| Bachelor's Degree or higher | 169 (100.0%) | 0 (0.0%) |
Occupancy by Age of Householder in Pleasant Hills
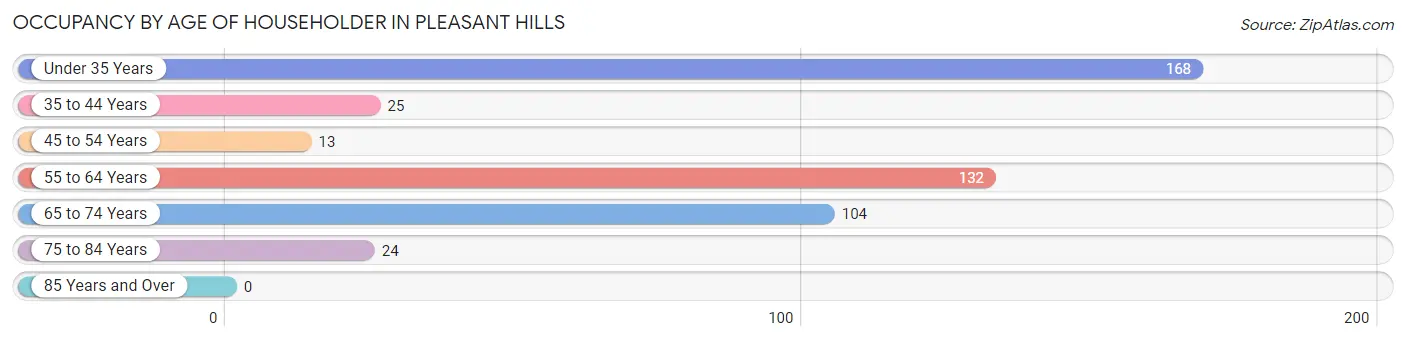
| Age Bracket | # Households | % Households |
| Under 35 Years | 168 | 36.0% |
| 35 to 44 Years | 25 | 5.4% |
| 45 to 54 Years | 13 | 2.8% |
| 55 to 64 Years | 132 | 28.3% |
| 65 to 74 Years | 104 | 22.3% |
| 75 to 84 Years | 24 | 5.1% |
| 85 Years and Over | 0 | 0.0% |
| Total | 466 | 100.0% |
Housing Finances in Pleasant Hills
Median Income by Occupancy in Pleasant Hills
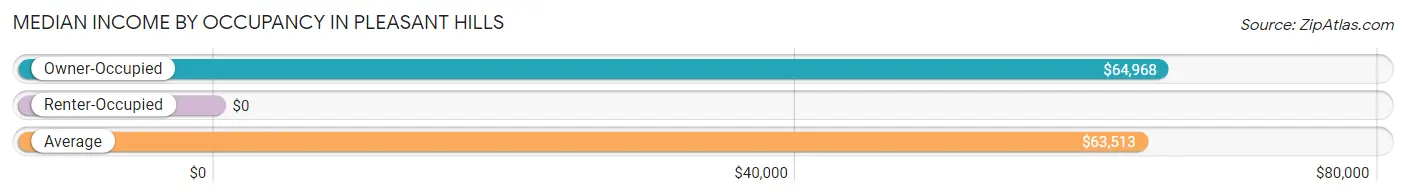
| Occupancy Type | # Households | Median Income |
| Owner-Occupied | 368 (79.0%) | $64,968 |
| Renter-Occupied | 98 (21.0%) | $0 |
| Average | 466 (100.0%) | $63,513 |
Occupancy by Householder Income Bracket in Pleasant Hills
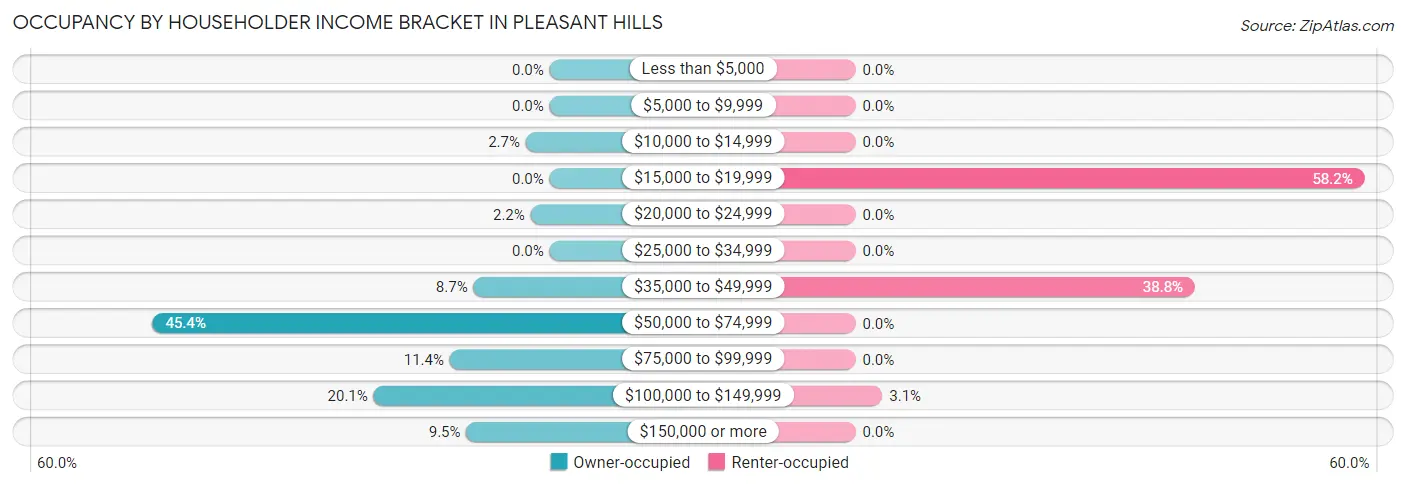
| Income Bracket | Owner-occupied | Renter-occupied |
| Less than $5,000 | 0 (0.0%) | 0 (0.0%) |
| $5,000 to $9,999 | 0 (0.0%) | 0 (0.0%) |
| $10,000 to $14,999 | 10 (2.7%) | 0 (0.0%) |
| $15,000 to $19,999 | 0 (0.0%) | 57 (58.2%) |
| $20,000 to $24,999 | 8 (2.2%) | 0 (0.0%) |
| $25,000 to $34,999 | 0 (0.0%) | 0 (0.0%) |
| $35,000 to $49,999 | 32 (8.7%) | 38 (38.8%) |
| $50,000 to $74,999 | 167 (45.4%) | 0 (0.0%) |
| $75,000 to $99,999 | 42 (11.4%) | 0 (0.0%) |
| $100,000 to $149,999 | 74 (20.1%) | 3 (3.1%) |
| $150,000 or more | 35 (9.5%) | 0 (0.0%) |
| Total | 368 (100.0%) | 98 (100.0%) |
Monthly Housing Cost Tiers in Pleasant Hills
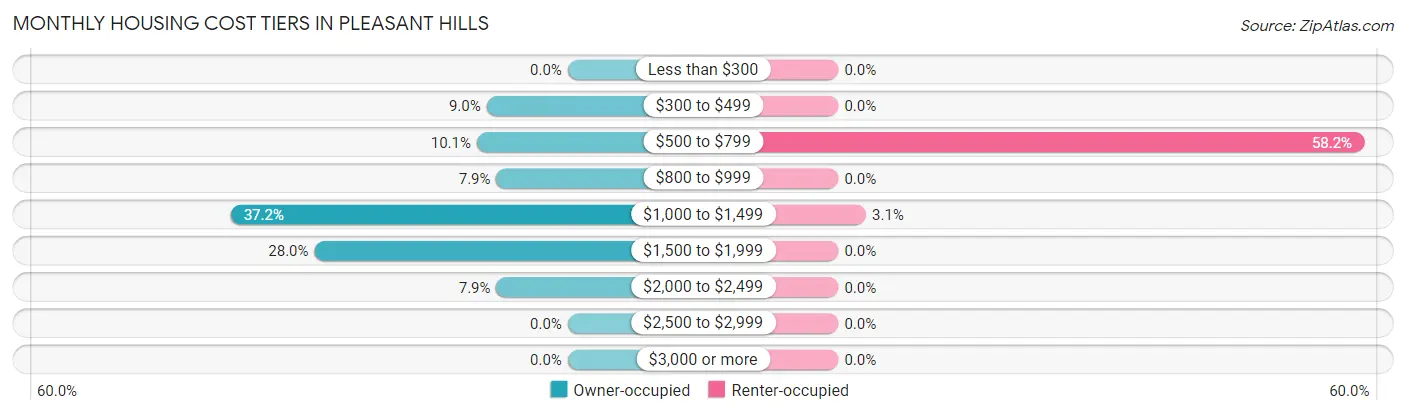
| Monthly Cost | Owner-occupied | Renter-occupied |
| Less than $300 | 0 (0.0%) | 0 (0.0%) |
| $300 to $499 | 33 (9.0%) | 0 (0.0%) |
| $500 to $799 | 37 (10.1%) | 57 (58.2%) |
| $800 to $999 | 29 (7.9%) | 0 (0.0%) |
| $1,000 to $1,499 | 137 (37.2%) | 3 (3.1%) |
| $1,500 to $1,999 | 103 (28.0%) | 0 (0.0%) |
| $2,000 to $2,499 | 29 (7.9%) | 0 (0.0%) |
| $2,500 to $2,999 | 0 (0.0%) | 0 (0.0%) |
| $3,000 or more | 0 (0.0%) | 0 (0.0%) |
| Total | 368 (100.0%) | 98 (100.0%) |
Physical Housing Characteristics in Pleasant Hills
Housing Structures in Pleasant Hills
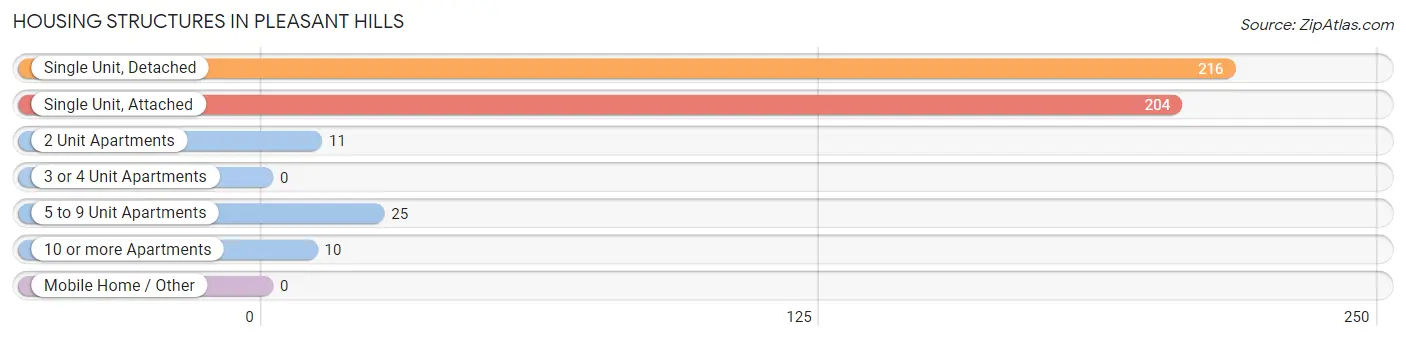
| Structure Type | # Housing Units | % Housing Units |
| Single Unit, Detached | 216 | 46.4% |
| Single Unit, Attached | 204 | 43.8% |
| 2 Unit Apartments | 11 | 2.4% |
| 3 or 4 Unit Apartments | 0 | 0.0% |
| 5 to 9 Unit Apartments | 25 | 5.4% |
| 10 or more Apartments | 10 | 2.1% |
| Mobile Home / Other | 0 | 0.0% |
| Total | 466 | 100.0% |
Housing Structures by Occupancy in Pleasant Hills
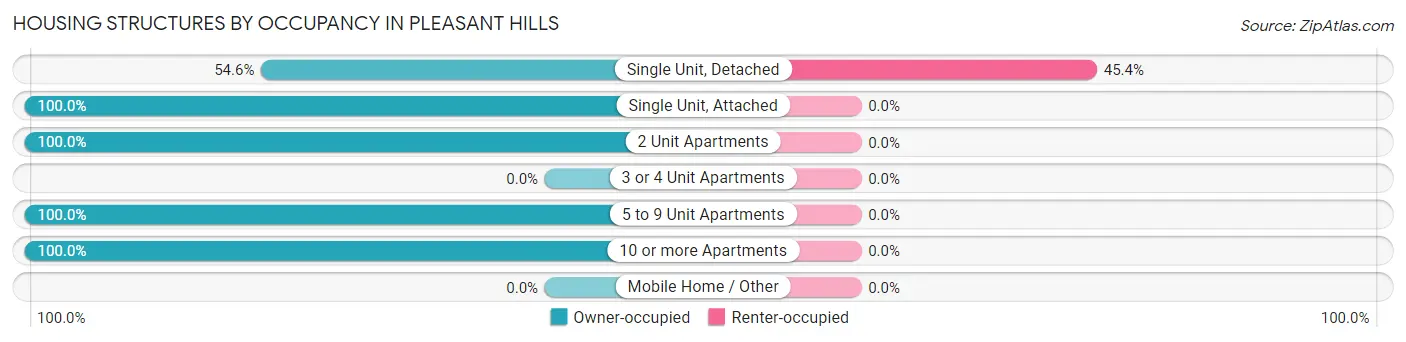
| Structure Type | Owner-occupied | Renter-occupied |
| Single Unit, Detached | 118 (54.6%) | 98 (45.4%) |
| Single Unit, Attached | 204 (100.0%) | 0 (0.0%) |
| 2 Unit Apartments | 11 (100.0%) | 0 (0.0%) |
| 3 or 4 Unit Apartments | 0 (0.0%) | 0 (0.0%) |
| 5 to 9 Unit Apartments | 25 (100.0%) | 0 (0.0%) |
| 10 or more Apartments | 10 (100.0%) | 0 (0.0%) |
| Mobile Home / Other | 0 (0.0%) | 0 (0.0%) |
| Total | 368 (79.0%) | 98 (21.0%) |
Housing Structures by Number of Rooms in Pleasant Hills
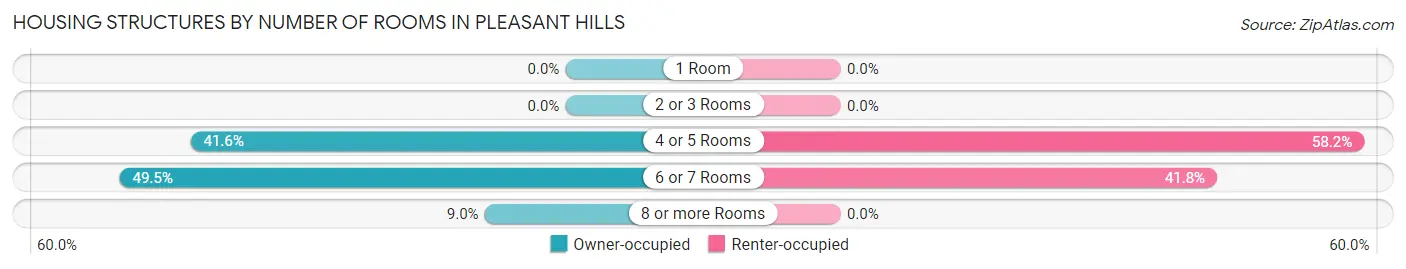
| Number of Rooms | Owner-occupied | Renter-occupied |
| 1 Room | 0 (0.0%) | 0 (0.0%) |
| 2 or 3 Rooms | 0 (0.0%) | 0 (0.0%) |
| 4 or 5 Rooms | 153 (41.6%) | 57 (58.2%) |
| 6 or 7 Rooms | 182 (49.5%) | 41 (41.8%) |
| 8 or more Rooms | 33 (9.0%) | 0 (0.0%) |
| Total | 368 (100.0%) | 98 (100.0%) |
Housing Structure by Heating Type in Pleasant Hills
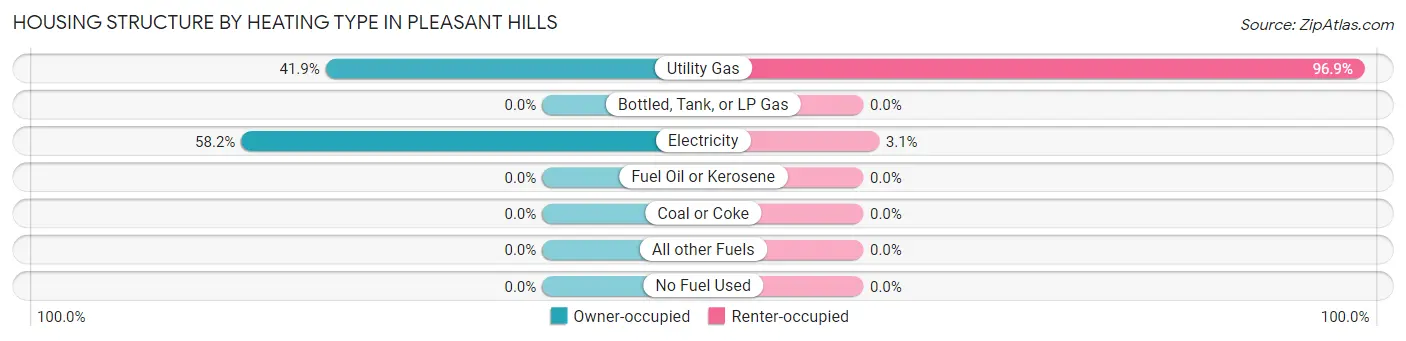
| Heating Type | Owner-occupied | Renter-occupied |
| Utility Gas | 154 (41.8%) | 95 (96.9%) |
| Bottled, Tank, or LP Gas | 0 (0.0%) | 0 (0.0%) |
| Electricity | 214 (58.2%) | 3 (3.1%) |
| Fuel Oil or Kerosene | 0 (0.0%) | 0 (0.0%) |
| Coal or Coke | 0 (0.0%) | 0 (0.0%) |
| All other Fuels | 0 (0.0%) | 0 (0.0%) |
| No Fuel Used | 0 (0.0%) | 0 (0.0%) |
| Total | 368 (100.0%) | 98 (100.0%) |
Household Vehicle Usage in Pleasant Hills
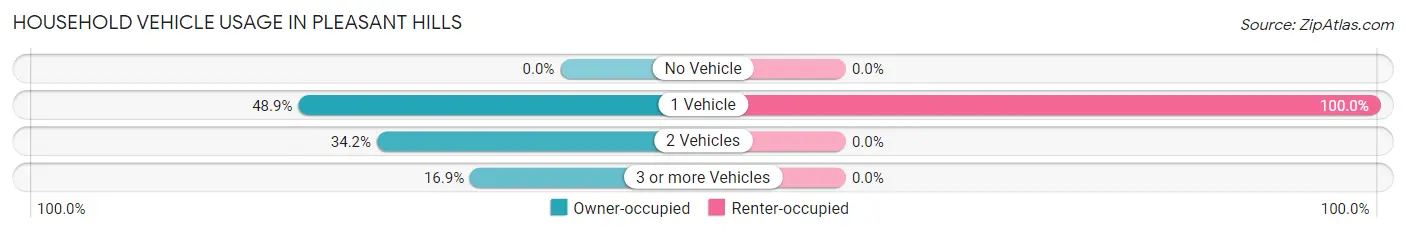
| Vehicles per Household | Owner-occupied | Renter-occupied |
| No Vehicle | 0 (0.0%) | 0 (0.0%) |
| 1 Vehicle | 180 (48.9%) | 98 (100.0%) |
| 2 Vehicles | 126 (34.2%) | 0 (0.0%) |
| 3 or more Vehicles | 62 (16.9%) | 0 (0.0%) |
| Total | 368 (100.0%) | 98 (100.0%) |
Real Estate & Mortgages in Pleasant Hills
Real Estate and Mortgage Overview in Pleasant Hills
| Characteristic | Without Mortgage | With Mortgage |
| Housing Units | 80 | 288 |
| Median Property Value | $189,400 | $167,500 |
| Median Household Income | $69,750 | $21 |
| Monthly Housing Costs | $611 | $0 |
| Real Estate Taxes | $3,111 | $0 |
Property Value by Mortgage Status in Pleasant Hills
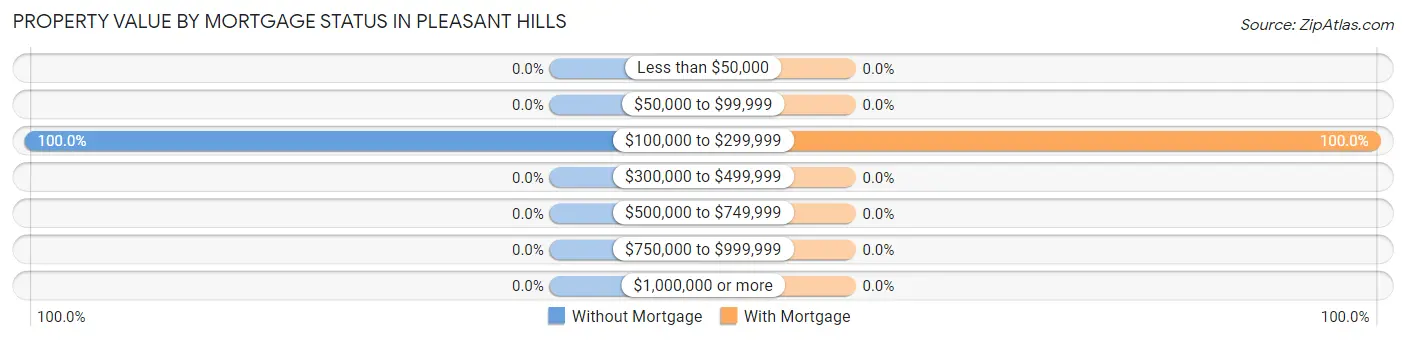
| Property Value | Without Mortgage | With Mortgage |
| Less than $50,000 | 0 (0.0%) | 0 (0.0%) |
| $50,000 to $99,999 | 0 (0.0%) | 0 (0.0%) |
| $100,000 to $299,999 | 80 (100.0%) | 288 (100.0%) |
| $300,000 to $499,999 | 0 (0.0%) | 0 (0.0%) |
| $500,000 to $749,999 | 0 (0.0%) | 0 (0.0%) |
| $750,000 to $999,999 | 0 (0.0%) | 0 (0.0%) |
| $1,000,000 or more | 0 (0.0%) | 0 (0.0%) |
| Total | 80 (100.0%) | 288 (100.0%) |
Household Income by Mortgage Status in Pleasant Hills
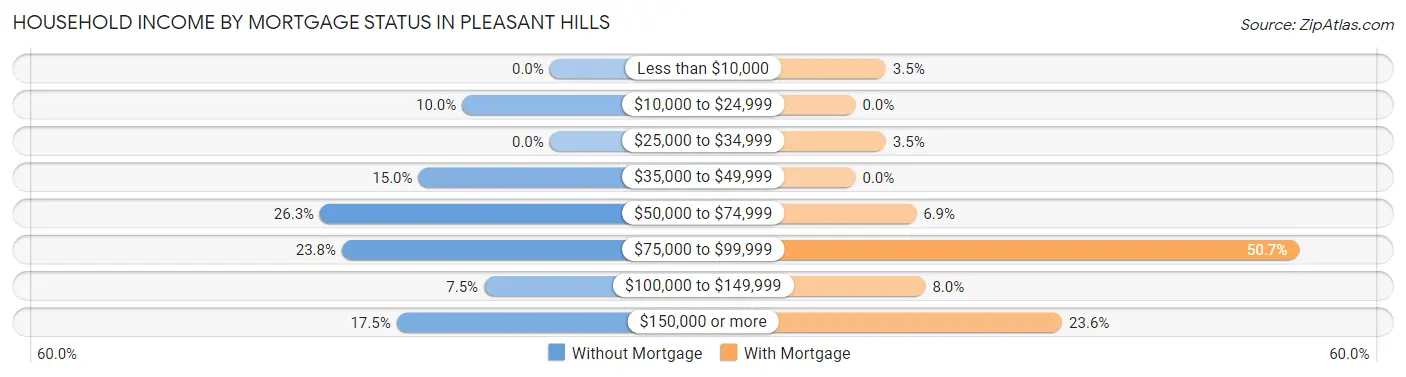
| Household Income | Without Mortgage | With Mortgage |
| Less than $10,000 | 0 (0.0%) | 10 (3.5%) |
| $10,000 to $24,999 | 8 (10.0%) | 0 (0.0%) |
| $25,000 to $34,999 | 0 (0.0%) | 10 (3.5%) |
| $35,000 to $49,999 | 12 (15.0%) | 0 (0.0%) |
| $50,000 to $74,999 | 21 (26.3%) | 20 (6.9%) |
| $75,000 to $99,999 | 19 (23.7%) | 146 (50.7%) |
| $100,000 to $149,999 | 6 (7.5%) | 23 (8.0%) |
| $150,000 or more | 14 (17.5%) | 68 (23.6%) |
| Total | 80 (100.0%) | 288 (100.0%) |
Property Value to Household Income Ratio in Pleasant Hills
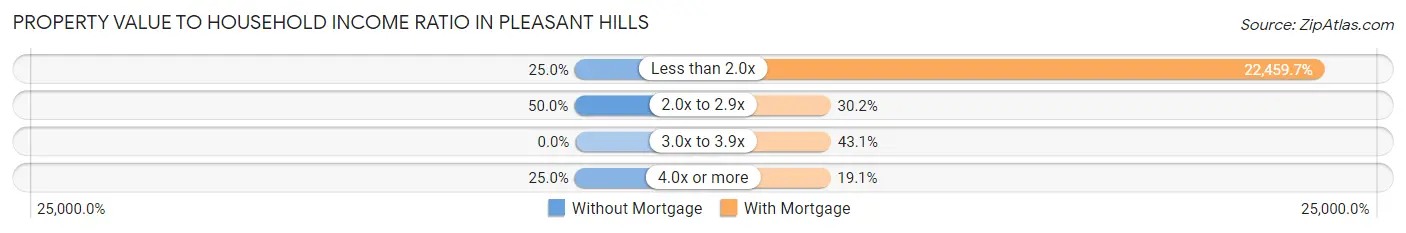
| Value-to-Income Ratio | Without Mortgage | With Mortgage |
| Less than 2.0x | 20 (25.0%) | 64,684 (22,459.7%) |
| 2.0x to 2.9x | 40 (50.0%) | 87 (30.2%) |
| 3.0x to 3.9x | 0 (0.0%) | 124 (43.1%) |
| 4.0x or more | 20 (25.0%) | 55 (19.1%) |
| Total | 80 (100.0%) | 288 (100.0%) |
Real Estate Taxes by Mortgage Status in Pleasant Hills
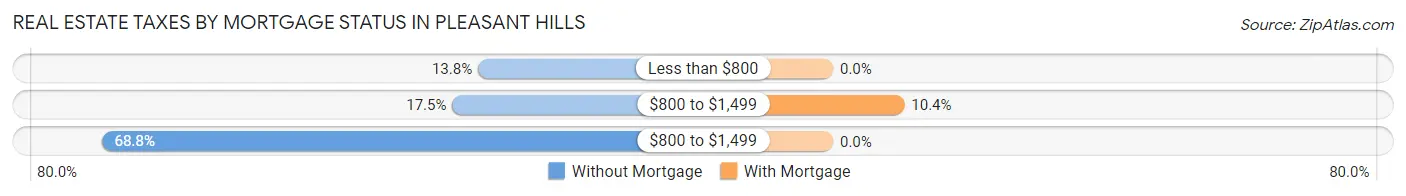
| Property Taxes | Without Mortgage | With Mortgage |
| Less than $800 | 11 (13.8%) | 0 (0.0%) |
| $800 to $1,499 | 14 (17.5%) | 30 (10.4%) |
| $800 to $1,499 | 55 (68.8%) | 0 (0.0%) |
| Total | 80 (100.0%) | 288 (100.0%) |
Health & Disability in Pleasant Hills
Health Insurance Coverage by Age in Pleasant Hills
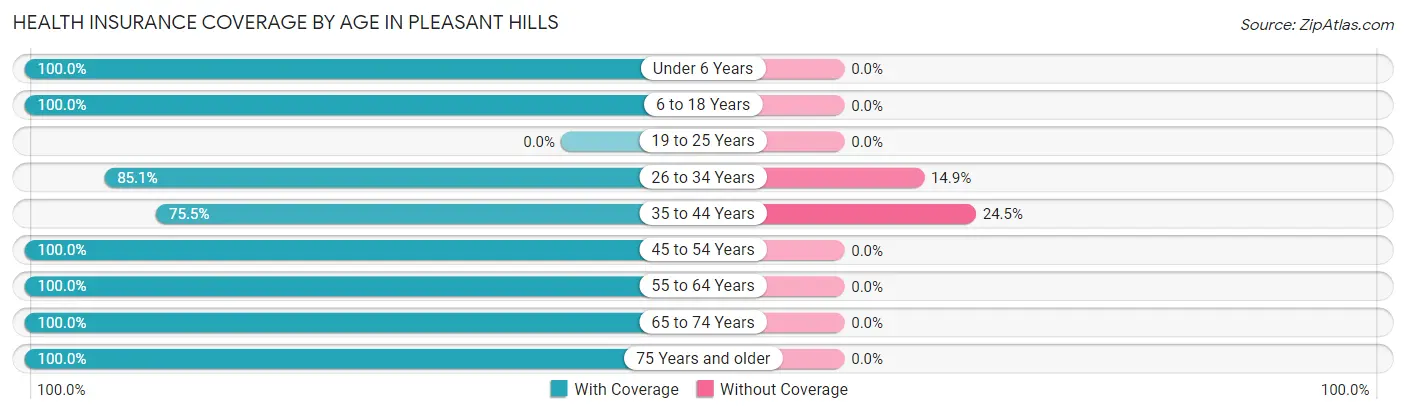
| Age Bracket | With Coverage | Without Coverage |
| Under 6 Years | 11 (100.0%) | 0 (0.0%) |
| 6 to 18 Years | 352 (100.0%) | 0 (0.0%) |
| 19 to 25 Years | 0 (0.0%) | 0 (0.0%) |
| 26 to 34 Years | 212 (85.1%) | 37 (14.9%) |
| 35 to 44 Years | 40 (75.5%) | 13 (24.5%) |
| 45 to 54 Years | 68 (100.0%) | 0 (0.0%) |
| 55 to 64 Years | 155 (100.0%) | 0 (0.0%) |
| 65 to 74 Years | 283 (100.0%) | 0 (0.0%) |
| 75 Years and older | 39 (100.0%) | 0 (0.0%) |
| Total | 1,160 (95.9%) | 50 (4.1%) |
Health Insurance Coverage by Citizenship Status in Pleasant Hills
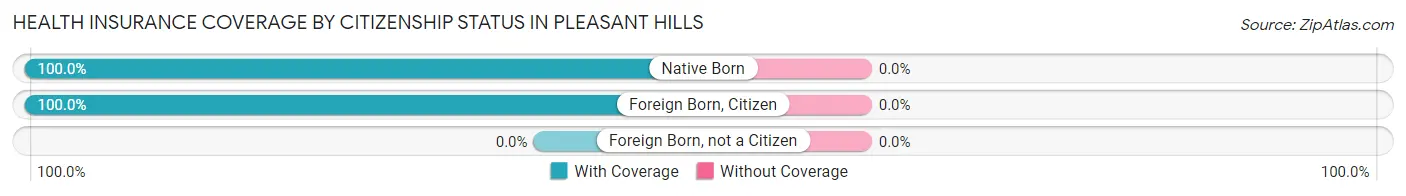
| Citizenship Status | With Coverage | Without Coverage |
| Native Born | 11 (100.0%) | 0 (0.0%) |
| Foreign Born, Citizen | 352 (100.0%) | 0 (0.0%) |
| Foreign Born, not a Citizen | 0 (0.0%) | 0 (0.0%) |
Health Insurance Coverage by Household Income in Pleasant Hills
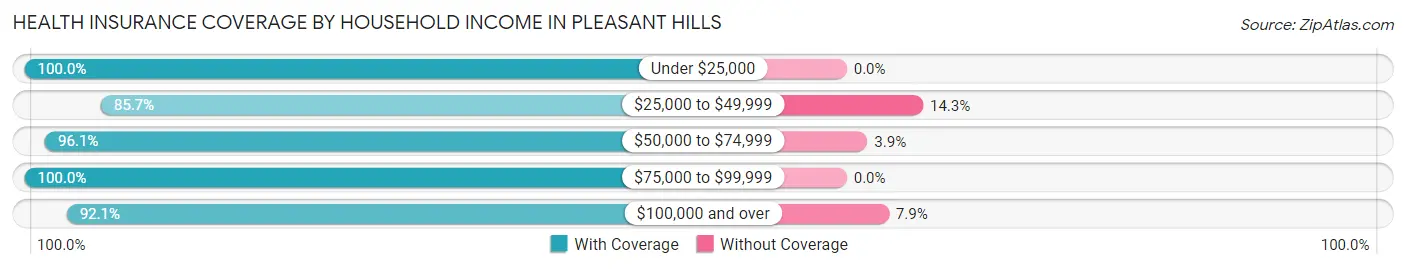
| Household Income | With Coverage | Without Coverage |
| Under $25,000 | 286 (100.0%) | 0 (0.0%) |
| $25,000 to $49,999 | 78 (85.7%) | 13 (14.3%) |
| $50,000 to $74,999 | 473 (96.1%) | 19 (3.9%) |
| $75,000 to $99,999 | 113 (100.0%) | 0 (0.0%) |
| $100,000 and over | 210 (92.1%) | 18 (7.9%) |
Public vs Private Health Insurance Coverage by Age in Pleasant Hills
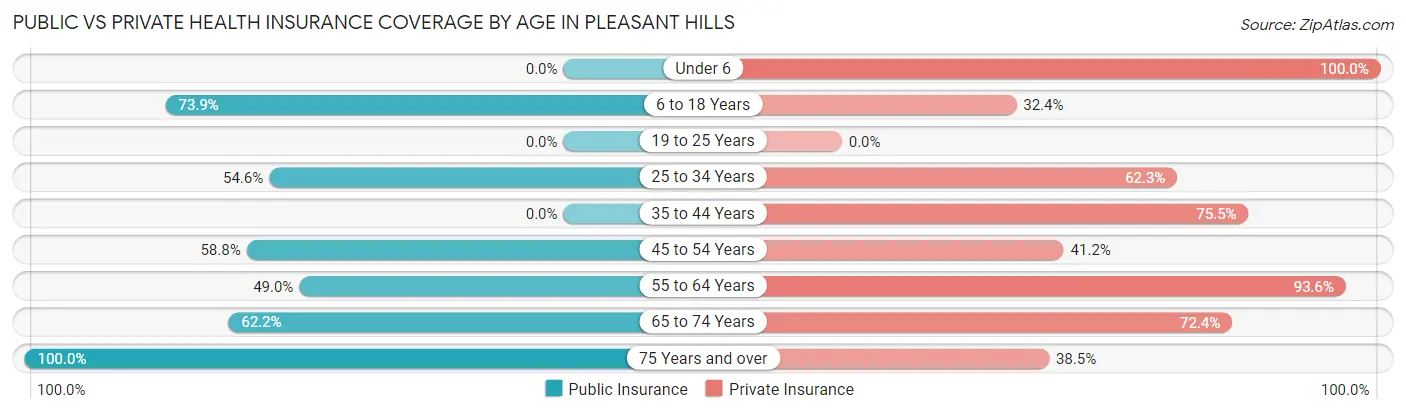
| Age Bracket | Public Insurance | Private Insurance |
| Under 6 | 0 (0.0%) | 11 (100.0%) |
| 6 to 18 Years | 260 (73.9%) | 114 (32.4%) |
| 19 to 25 Years | 0 (0.0%) | 0 (0.0%) |
| 25 to 34 Years | 136 (54.6%) | 155 (62.3%) |
| 35 to 44 Years | 0 (0.0%) | 40 (75.5%) |
| 45 to 54 Years | 40 (58.8%) | 28 (41.2%) |
| 55 to 64 Years | 76 (49.0%) | 145 (93.5%) |
| 65 to 74 Years | 176 (62.2%) | 205 (72.4%) |
| 75 Years and over | 39 (100.0%) | 15 (38.5%) |
| Total | 727 (60.1%) | 713 (58.9%) |
Disability Status by Sex by Age in Pleasant Hills
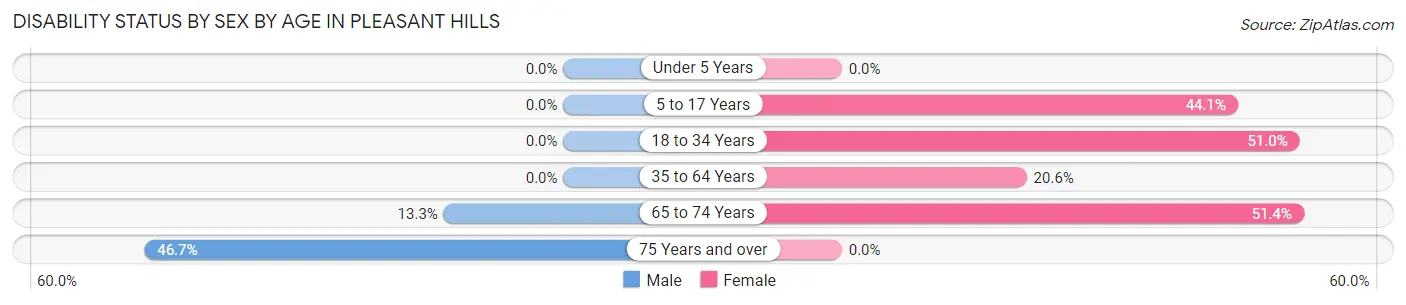
| Age Bracket | Male | Female |
| Under 5 Years | 0 (0.0%) | 0 (0.0%) |
| 5 to 17 Years | 0 (0.0%) | 82 (44.1%) |
| 18 to 34 Years | 0 (0.0%) | 79 (51.0%) |
| 35 to 64 Years | 0 (0.0%) | 28 (20.6%) |
| 65 to 74 Years | 10 (13.3%) | 107 (51.4%) |
| 75 Years and over | 7 (46.7%) | 0 (0.0%) |
Disability Class by Sex by Age in Pleasant Hills
Disability Class: Hearing Difficulty
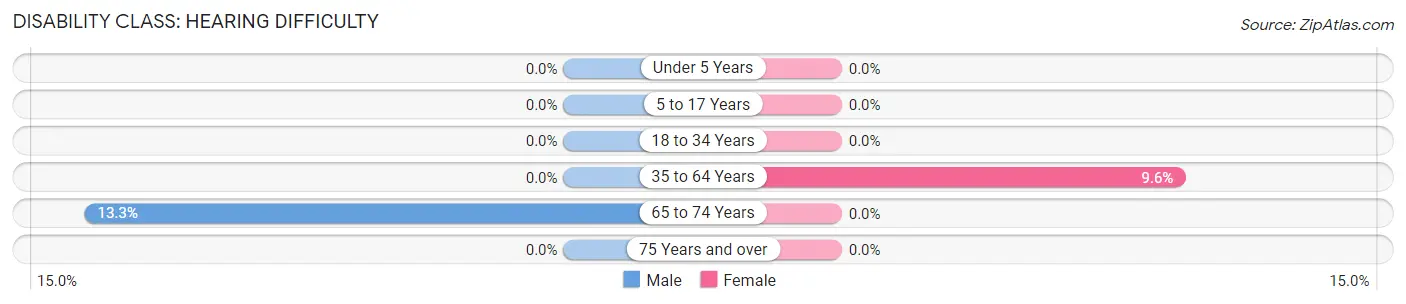
| Age Bracket | Male | Female |
| Under 5 Years | 0 (0.0%) | 0 (0.0%) |
| 5 to 17 Years | 0 (0.0%) | 0 (0.0%) |
| 18 to 34 Years | 0 (0.0%) | 0 (0.0%) |
| 35 to 64 Years | 0 (0.0%) | 13 (9.6%) |
| 65 to 74 Years | 10 (13.3%) | 0 (0.0%) |
| 75 Years and over | 0 (0.0%) | 0 (0.0%) |
Disability Class: Vision Difficulty
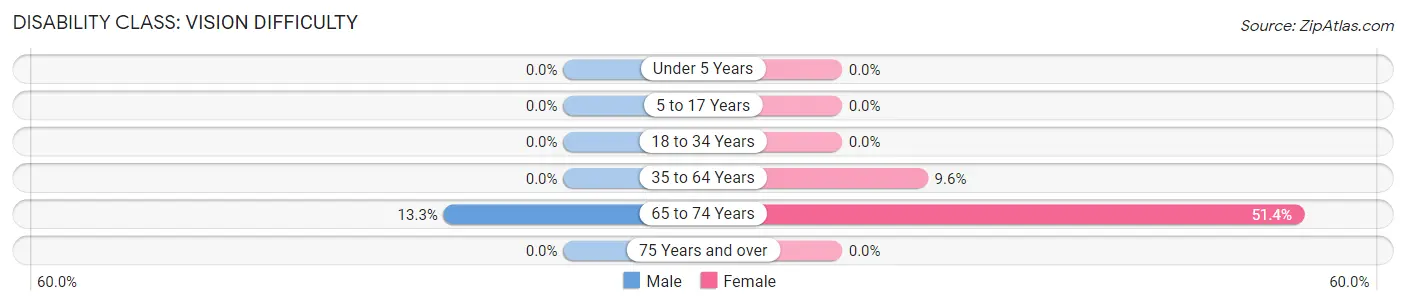
| Age Bracket | Male | Female |
| Under 5 Years | 0 (0.0%) | 0 (0.0%) |
| 5 to 17 Years | 0 (0.0%) | 0 (0.0%) |
| 18 to 34 Years | 0 (0.0%) | 0 (0.0%) |
| 35 to 64 Years | 0 (0.0%) | 13 (9.6%) |
| 65 to 74 Years | 10 (13.3%) | 107 (51.4%) |
| 75 Years and over | 0 (0.0%) | 0 (0.0%) |
Disability Class: Cognitive Difficulty
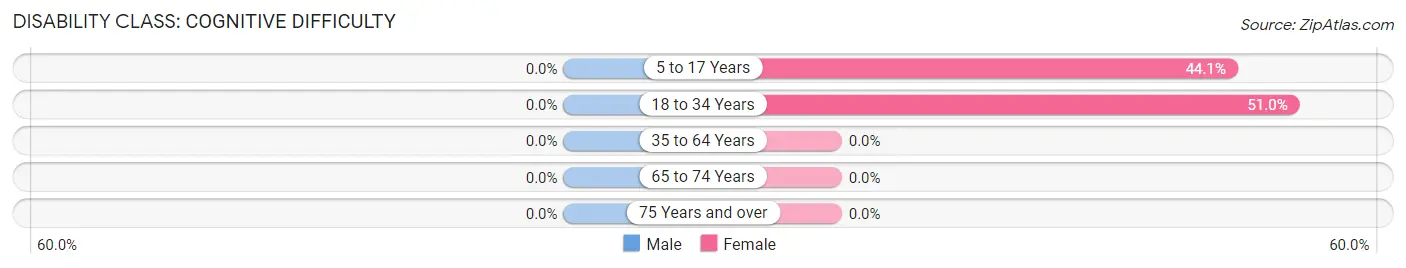
| Age Bracket | Male | Female |
| 5 to 17 Years | 0 (0.0%) | 82 (44.1%) |
| 18 to 34 Years | 0 (0.0%) | 79 (51.0%) |
| 35 to 64 Years | 0 (0.0%) | 0 (0.0%) |
| 65 to 74 Years | 0 (0.0%) | 0 (0.0%) |
| 75 Years and over | 0 (0.0%) | 0 (0.0%) |
Disability Class: Ambulatory Difficulty
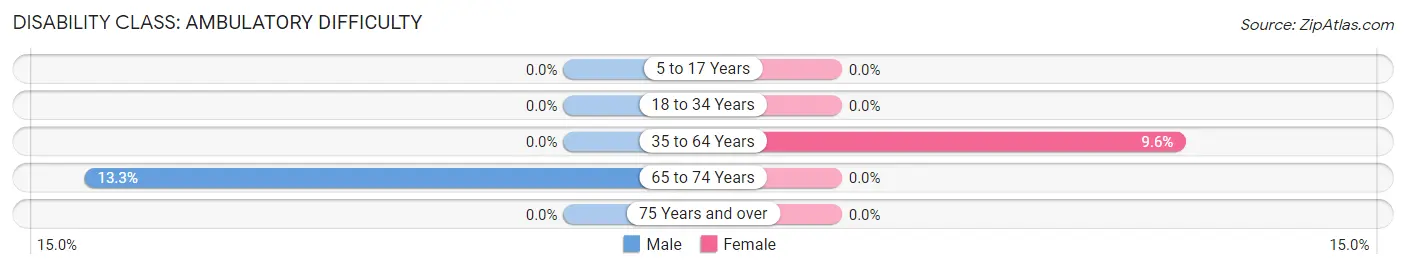
| Age Bracket | Male | Female |
| 5 to 17 Years | 0 (0.0%) | 0 (0.0%) |
| 18 to 34 Years | 0 (0.0%) | 0 (0.0%) |
| 35 to 64 Years | 0 (0.0%) | 13 (9.6%) |
| 65 to 74 Years | 10 (13.3%) | 0 (0.0%) |
| 75 Years and over | 0 (0.0%) | 0 (0.0%) |
Disability Class: Self-Care Difficulty
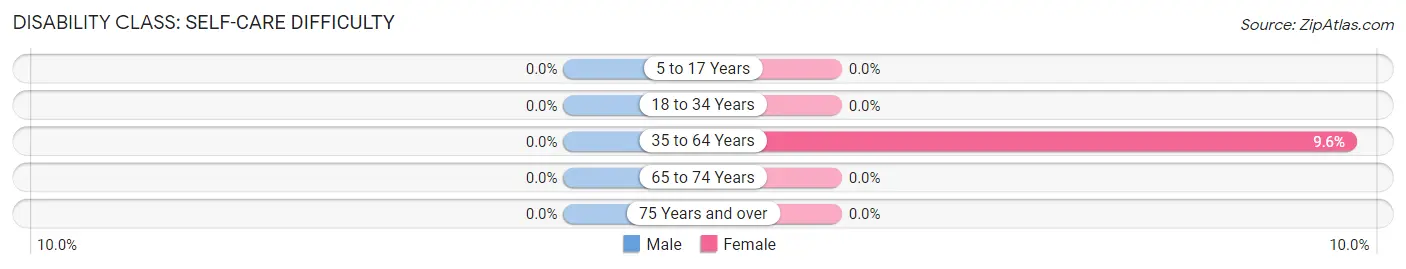
| Age Bracket | Male | Female |
| 5 to 17 Years | 0 (0.0%) | 0 (0.0%) |
| 18 to 34 Years | 0 (0.0%) | 0 (0.0%) |
| 35 to 64 Years | 0 (0.0%) | 13 (9.6%) |
| 65 to 74 Years | 0 (0.0%) | 0 (0.0%) |
| 75 Years and over | 0 (0.0%) | 0 (0.0%) |
Technology Access in Pleasant Hills
Computing Device Access in Pleasant Hills
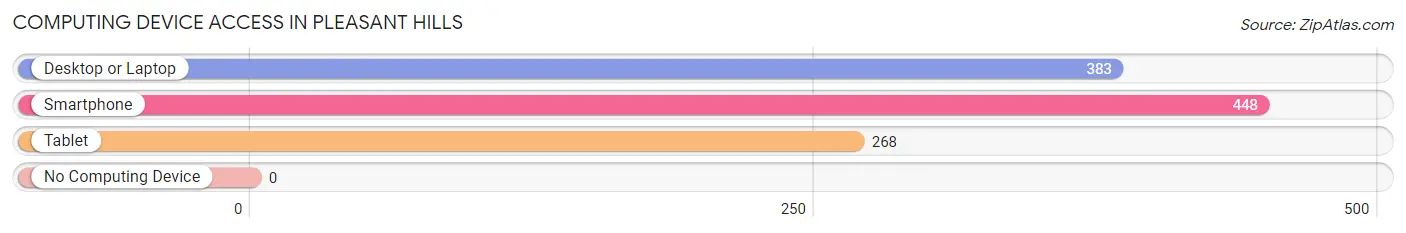
| Device Type | # Households | % Households |
| Desktop or Laptop | 383 | 82.2% |
| Smartphone | 448 | 96.1% |
| Tablet | 268 | 57.5% |
| No Computing Device | 0 | 0.0% |
| Total | 466 | 100.0% |
Internet Access in Pleasant Hills
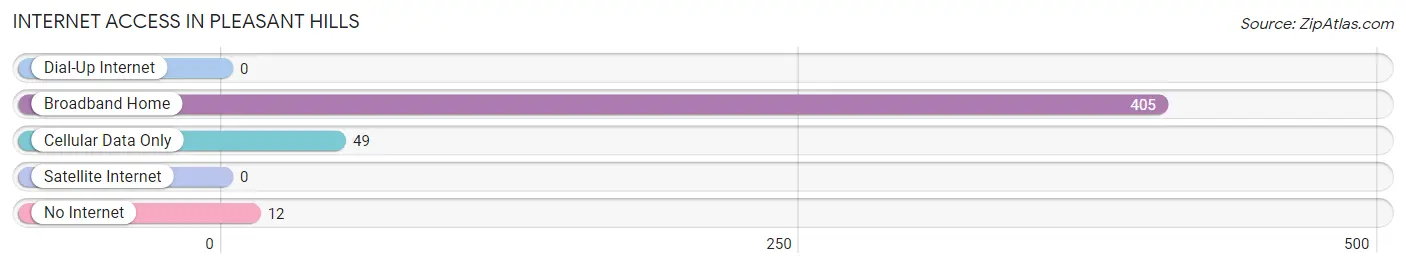
| Internet Type | # Households | % Households |
| Dial-Up Internet | 0 | 0.0% |
| Broadband Home | 405 | 86.9% |
| Cellular Data Only | 49 | 10.5% |
| Satellite Internet | 0 | 0.0% |
| No Internet | 12 | 2.6% |
| Total | 466 | 100.0% |
Pleasant Hills Summary
Pleasant Hills is a small village located in the state of Ohio, United States. It is situated in the southwestern part of the state, in the county of Hamilton. The village is located on the banks of the Great Miami River, and is part of the Cincinnati metropolitan area. As of the 2010 census, the population of Pleasant Hills was 1,845.
History
The area that is now Pleasant Hills was first settled in the early 1800s by a group of German immigrants. The village was originally known as “Pleasant Hill”, and was incorporated in 1845. The name was changed to Pleasant Hills in 1875.
The village was a small farming community for many years, but began to grow in the late 19th century with the arrival of the railroad. The railroad allowed for the transportation of goods and people, and the village began to develop into a small industrial center.
In the early 20th century, the village was home to several factories, including a paper mill, a brickyard, and a furniture factory. The village also had a number of stores and businesses, including a bank, a post office, and a hotel.
Geography
Pleasant Hills is located at 39°14'N 84°30'W (39.23, -84.50). The village is situated on the banks of the Great Miami River, and is part of the Cincinnati metropolitan area.
The village has a total area of 0.9 square miles (2.3 km2), all of which is land. The village is located in a hilly area, and is surrounded by wooded areas.
Economy
The economy of Pleasant Hills is largely based on agriculture and manufacturing. The village is home to several small businesses, including a grocery store, a hardware store, and a restaurant.
The village is also home to a number of industrial businesses, including a paper mill, a brickyard, and a furniture factory. The village is also home to a number of small manufacturing companies, including a plastics manufacturer and a metal fabrication company.
Demographics
As of the 2010 census, the population of Pleasant Hills was 1,845. The racial makeup of the village was 97.3% White, 0.7% African American, 0.2% Native American, 0.3% Asian, 0.1% Pacific Islander, 0.3% from other races, and 1.2% from two or more races. Hispanic or Latino of any race were 1.2% of the population.
The median income for a household in the village was $45,938, and the median income for a family was $51,250. The per capita income for the village was $20,945. About 6.2% of families and 8.2% of the population were below the poverty line, including 10.2% of those under age 18 and 5.2% of those age 65 or over.
Common Questions
What is Per Capita Income in Pleasant Hills?
Per Capita income in Pleasant Hills is $30,148.
What is the Median Family Income in Pleasant Hills?
Median Family Income in Pleasant Hills is $64,066.
What is the Median Household income in Pleasant Hills?
Median Household Income in Pleasant Hills is $63,513.
What is Income or Wage Gap in Pleasant Hills?
Income or Wage Gap in Pleasant Hills is 39.4%.
Women in Pleasant Hills earn 60.6 cents for every dollar earned by a man.
What is Inequality or Gini Index in Pleasant Hills?
Inequality or Gini Index in Pleasant Hills is 0.34.
What is the Total Population of Pleasant Hills?
Total Population of Pleasant Hills is 1,210.
What is the Total Male Population of Pleasant Hills?
Total Male Population of Pleasant Hills is 490.
What is the Total Female Population of Pleasant Hills?
Total Female Population of Pleasant Hills is 720.
What is the Ratio of Males per 100 Females in Pleasant Hills?
There are 68.06 Males per 100 Females in Pleasant Hills.
What is the Ratio of Females per 100 Males in Pleasant Hills?
There are 146.94 Females per 100 Males in Pleasant Hills.
What is the Median Population Age in Pleasant Hills?
Median Population Age in Pleasant Hills is 34.6 Years.
What is the Average Family Size in Pleasant Hills
Average Family Size in Pleasant Hills is 3.2 People.
What is the Average Household Size in Pleasant Hills
Average Household Size in Pleasant Hills is 2.6 People.
How Large is the Labor Force in Pleasant Hills?
There are 529 People in the Labor Forcein in Pleasant Hills.
What is the Percentage of People in the Labor Force in Pleasant Hills?
61.7% of People are in the Labor Force in Pleasant Hills.