Lake Waynoka, OH Map & Demographics
Lake Waynoka Map
Lake Waynoka Overview
$41,596
PER CAPITA INCOME
$84,707
AVG FAMILY INCOME
$84,063
AVG HOUSEHOLD INCOME
67.8%
WAGE / INCOME GAP [ % ]
32.2¢/ $1
WAGE / INCOME GAP [ $ ]
0.26
INEQUALITY / GINI INDEX
1,103
TOTAL POPULATION
558
MALE POPULATION
545
FEMALE POPULATION
102.39
MALES / 100 FEMALES
97.67
FEMALES / 100 MALES
55.9
MEDIAN AGE
2.4
AVG FAMILY SIZE
2.2
AVG HOUSEHOLD SIZE
501
LABOR FORCE [ PEOPLE ]
51.4%
PERCENT IN LABOR FORCE
2.6%
UNEMPLOYMENT RATE
Lake Waynoka Area Codes
Income in Lake Waynoka
Income Overview in Lake Waynoka
Per Capita Income in Lake Waynoka is $41,596, while median incomes of families and households are $84,707 and $84,063 respectively.
| Characteristic | Number | Measure |
| Per Capita Income | 1,103 | $41,596 |
| Median Family Income | 429 | $84,707 |
| Mean Family Income | 429 | $93,271 |
| Median Household Income | 508 | $84,063 |
| Mean Household Income | 508 | $91,592 |
| Income Deficit | 429 | $0 |
| Wage / Income Gap (%) | 1,103 | 67.77% |
| Wage / Income Gap ($) | 1,103 | 32.23¢ per $1 |
| Gini / Inequality Index | 1,103 | 0.26 |
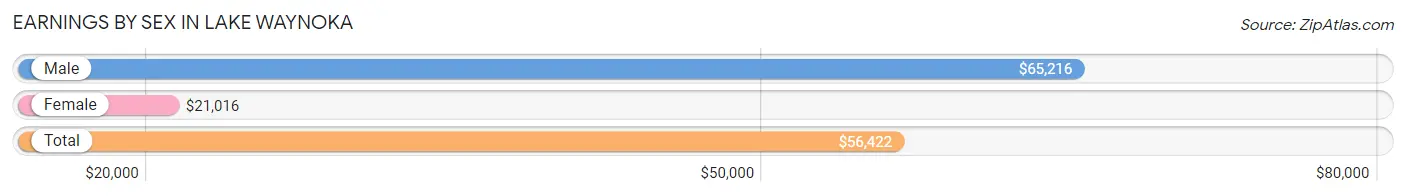
Earnings by Sex in Lake Waynoka
Average Earnings in Lake Waynoka are $56,422, $65,216 for men and $21,016 for women, a difference of 67.8%.
| Sex | Number | Average Earnings |
| Male | 331 (63.0%) | $65,216 |
| Female | 194 (36.9%) | $21,016 |
| Total | 525 (100.0%) | $56,422 |
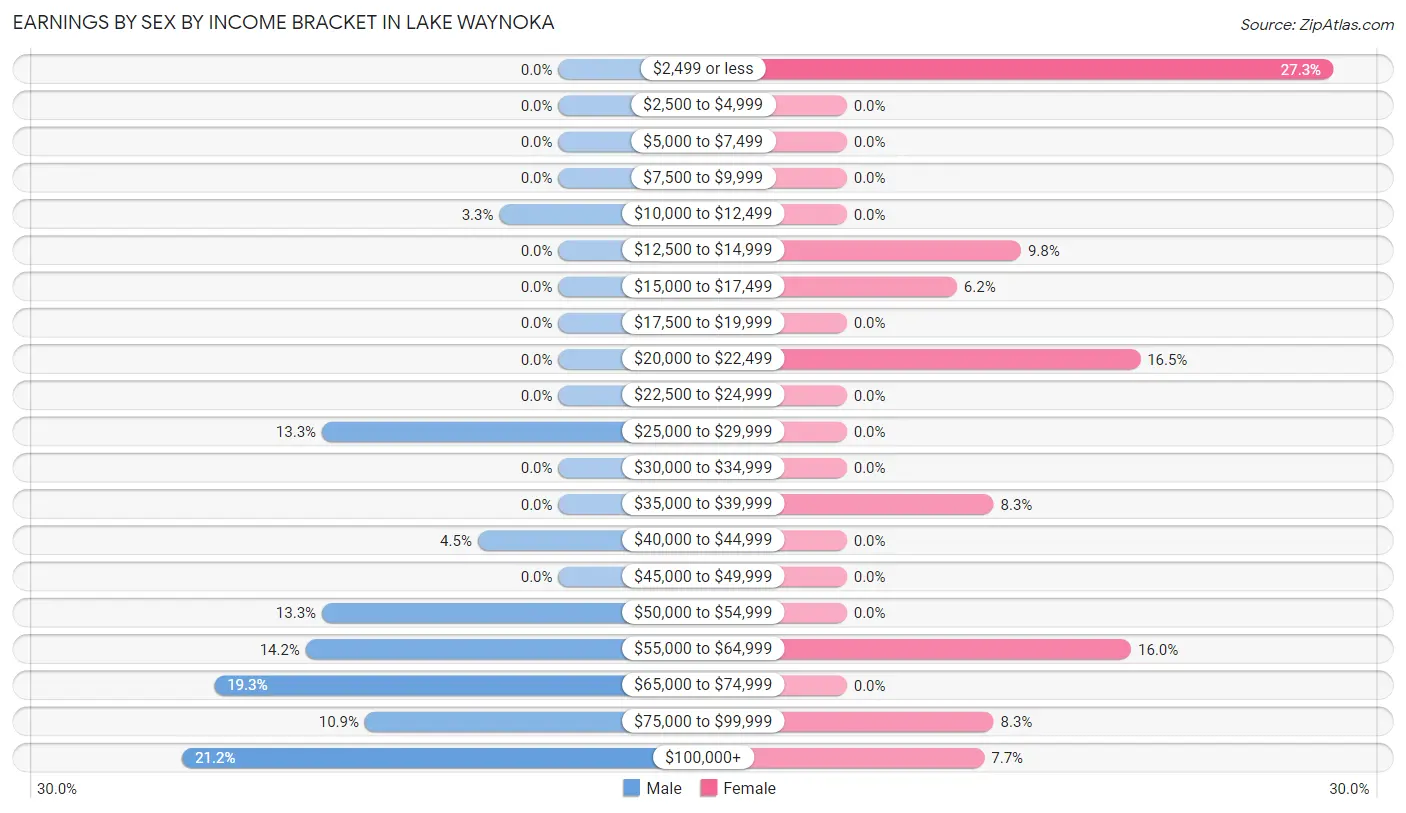
Earnings by Sex by Income Bracket in Lake Waynoka
The most common earnings brackets in Lake Waynoka are $100,000+ for men (70 | 21.1%) and $2,499 or less for women (53 | 27.3%).
| Income | Male | Female |
| $2,499 or less | 0 (0.0%) | 53 (27.3%) |
| $2,500 to $4,999 | 0 (0.0%) | 0 (0.0%) |
| $5,000 to $7,499 | 0 (0.0%) | 0 (0.0%) |
| $7,500 to $9,999 | 0 (0.0%) | 0 (0.0%) |
| $10,000 to $12,499 | 11 (3.3%) | 0 (0.0%) |
| $12,500 to $14,999 | 0 (0.0%) | 19 (9.8%) |
| $15,000 to $17,499 | 0 (0.0%) | 12 (6.2%) |
| $17,500 to $19,999 | 0 (0.0%) | 0 (0.0%) |
| $20,000 to $22,499 | 0 (0.0%) | 32 (16.5%) |
| $22,500 to $24,999 | 0 (0.0%) | 0 (0.0%) |
| $25,000 to $29,999 | 44 (13.3%) | 0 (0.0%) |
| $30,000 to $34,999 | 0 (0.0%) | 0 (0.0%) |
| $35,000 to $39,999 | 0 (0.0%) | 16 (8.3%) |
| $40,000 to $44,999 | 15 (4.5%) | 0 (0.0%) |
| $45,000 to $49,999 | 0 (0.0%) | 0 (0.0%) |
| $50,000 to $54,999 | 44 (13.3%) | 0 (0.0%) |
| $55,000 to $64,999 | 47 (14.2%) | 31 (16.0%) |
| $65,000 to $74,999 | 64 (19.3%) | 0 (0.0%) |
| $75,000 to $99,999 | 36 (10.9%) | 16 (8.3%) |
| $100,000+ | 70 (21.1%) | 15 (7.7%) |
| Total | 331 (100.0%) | 194 (100.0%) |
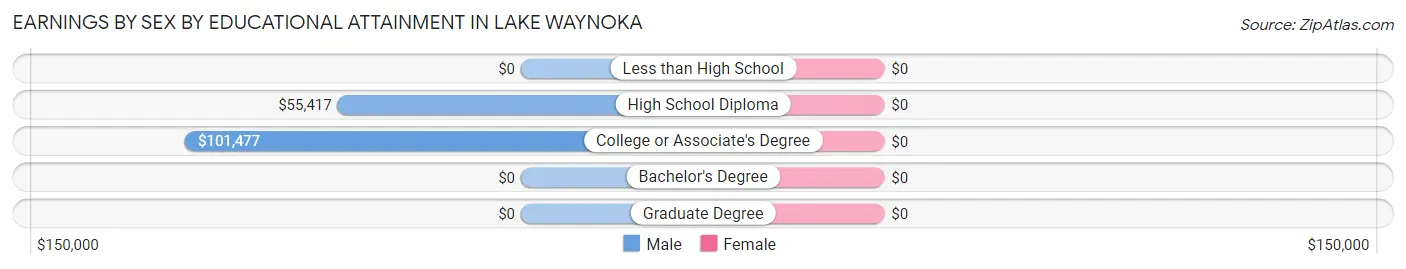
Earnings by Sex by Educational Attainment in Lake Waynoka
| Educational Attainment | Male Income | Female Income |
| Less than High School | - | - |
| High School Diploma | $55,417 | $0 |
| College or Associate's Degree | $101,477 | $0 |
| Bachelor's Degree | - | - |
| Graduate Degree | - | - |
| Total | $65,697 | $0 |
Family Income in Lake Waynoka
Family Income Brackets in Lake Waynoka
According to the Lake Waynoka family income data, there are 136 families falling into the $100,000 to $149,999 income range, which is the most common income bracket and makes up 31.7% of all families.
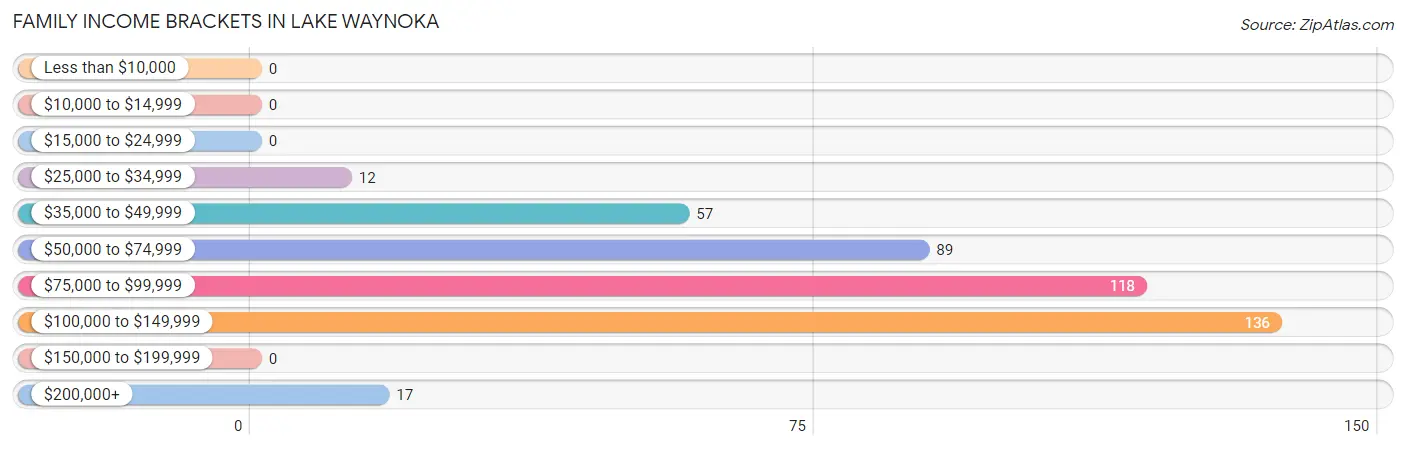
| Income Bracket | # Families | % Families |
| Less than $10,000 | 0 | 0.0% |
| $10,000 to $14,999 | 0 | 0.0% |
| $15,000 to $24,999 | 0 | 0.0% |
| $25,000 to $34,999 | 12 | 2.8% |
| $35,000 to $49,999 | 57 | 13.3% |
| $50,000 to $74,999 | 89 | 20.7% |
| $75,000 to $99,999 | 118 | 27.5% |
| $100,000 to $149,999 | 136 | 31.7% |
| $150,000 to $199,999 | 0 | 0.0% |
| $200,000+ | 17 | 4.0% |
Family Income by Famaliy Size in Lake Waynoka
2-person families (253 | 59.0%) account for the highest median family income in Lake Waynoka with $84,688 per family, while 2-person families (253 | 59.0%) have the highest median income of $42,344 per family member.
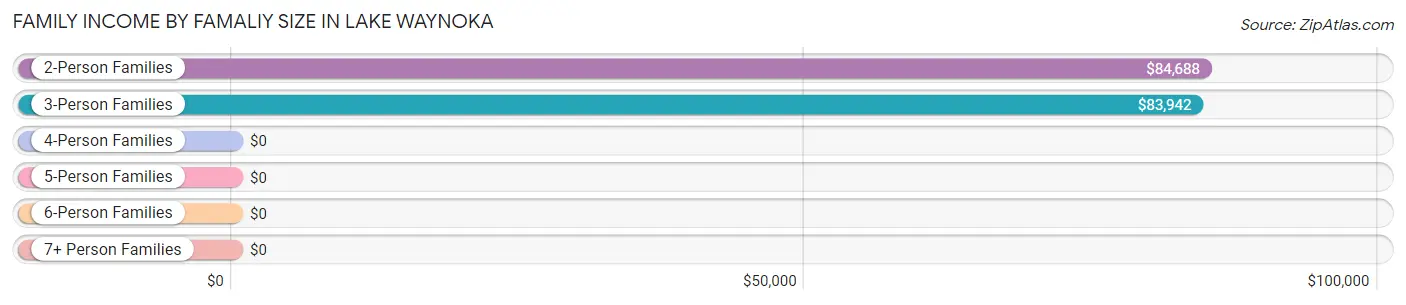
| Income Bracket | # Families | Median Income |
| 2-Person Families | 253 (59.0%) | $84,688 |
| 3-Person Families | 144 (33.6%) | $83,942 |
| 4-Person Families | 32 (7.5%) | $0 |
| 5-Person Families | 0 (0.0%) | $0 |
| 6-Person Families | 0 (0.0%) | $0 |
| 7+ Person Families | 0 (0.0%) | $0 |
| Total | 429 (100.0%) | $84,707 |
Family Income by Number of Earners in Lake Waynoka
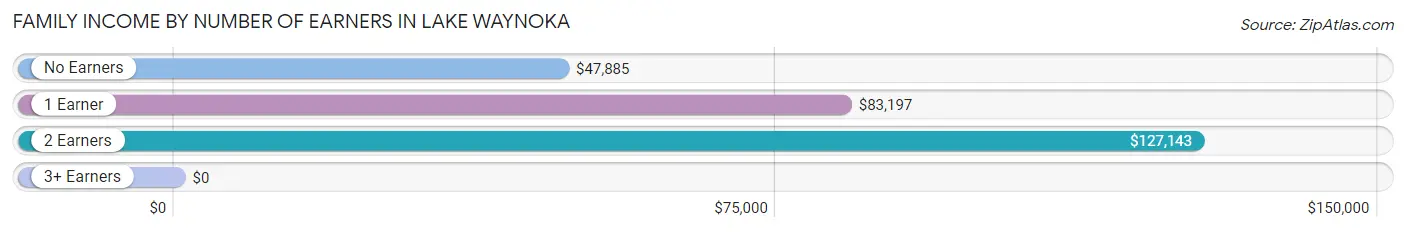
| Number of Earners | # Families | Median Income |
| No Earners | 86 (20.1%) | $47,885 |
| 1 Earner | 221 (51.5%) | $83,197 |
| 2 Earners | 104 (24.2%) | $127,143 |
| 3+ Earners | 18 (4.2%) | $0 |
| Total | 429 (100.0%) | $84,707 |
Household Income in Lake Waynoka
Household Income Brackets in Lake Waynoka
With 156 households falling in the category, the $100,000 to $149,999 income range is the most frequent in Lake Waynoka, accounting for 30.7% of all households.
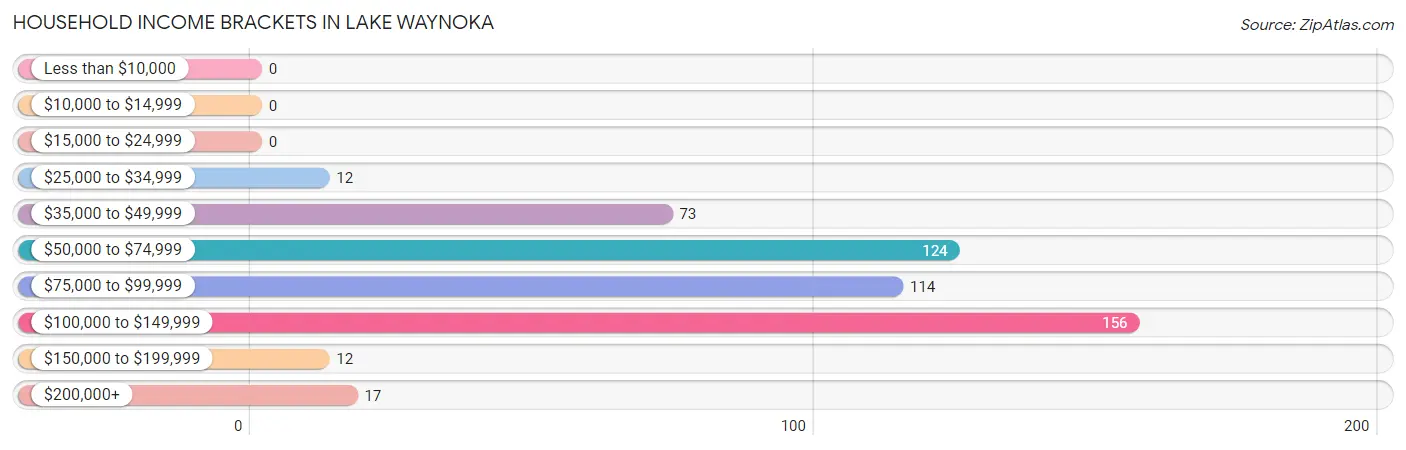
| Income Bracket | # Households | % Households |
| Less than $10,000 | 0 | 0.0% |
| $10,000 to $14,999 | 0 | 0.0% |
| $15,000 to $24,999 | 0 | 0.0% |
| $25,000 to $34,999 | 12 | 2.4% |
| $35,000 to $49,999 | 73 | 14.4% |
| $50,000 to $74,999 | 124 | 24.4% |
| $75,000 to $99,999 | 114 | 22.4% |
| $100,000 to $149,999 | 156 | 30.7% |
| $150,000 to $199,999 | 12 | 2.4% |
| $200,000+ | 17 | 3.3% |
Household Income by Householder Age in Lake Waynoka
The median household income in Lake Waynoka is $84,063, with the highest median household income of $118,750 found in the 45 to 64 years age bracket for the primary householder. A total of 256 households (50.4%) fall into this category.
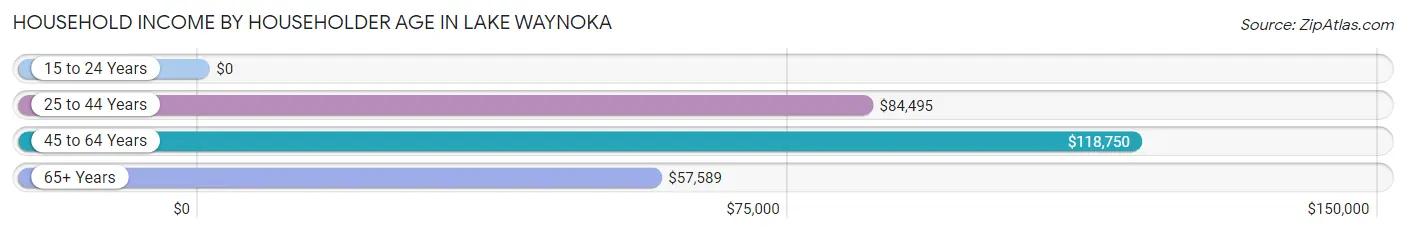
| Income Bracket | # Households | Median Income |
| 15 to 24 Years | 0 (0.0%) | $0 |
| 25 to 44 Years | 109 (21.5%) | $84,495 |
| 45 to 64 Years | 256 (50.4%) | $118,750 |
| 65+ Years | 143 (28.1%) | $57,589 |
| Total | 508 (100.0%) | $84,063 |
Poverty in Lake Waynoka
Income Below Poverty by Sex and Age in Lake Waynoka
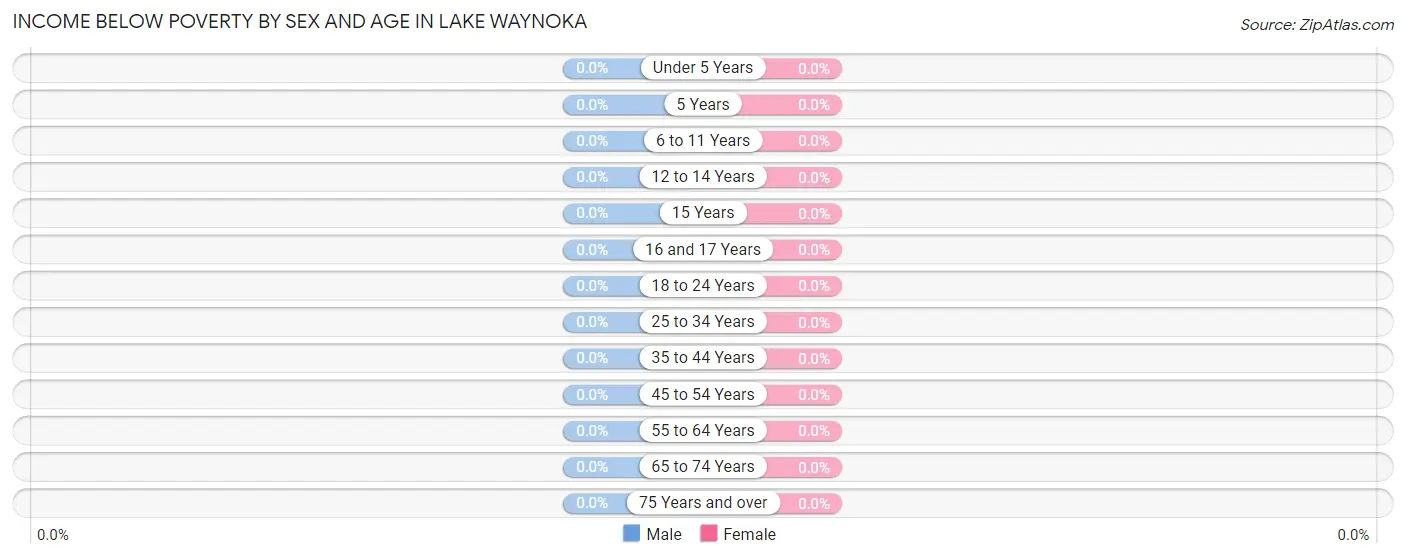
| Age Bracket | Male | Female |
| Under 5 Years | 0 (0.0%) | 0 (0.0%) |
| 5 Years | 0 (0.0%) | 0 (0.0%) |
| 6 to 11 Years | 0 (0.0%) | 0 (0.0%) |
| 12 to 14 Years | 0 (0.0%) | 0 (0.0%) |
| 15 Years | 0 (0.0%) | 0 (0.0%) |
| 16 and 17 Years | 0 (0.0%) | 0 (0.0%) |
| 18 to 24 Years | 0 (0.0%) | 0 (0.0%) |
| 25 to 34 Years | 0 (0.0%) | 0 (0.0%) |
| 35 to 44 Years | 0 (0.0%) | 0 (0.0%) |
| 45 to 54 Years | 0 (0.0%) | 0 (0.0%) |
| 55 to 64 Years | 0 (0.0%) | 0 (0.0%) |
| 65 to 74 Years | 0 (0.0%) | 0 (0.0%) |
| 75 Years and over | 0 (0.0%) | 0 (0.0%) |
| Total | 0 (0.0%) | 0 (0.0%) |
Income Above Poverty by Sex and Age in Lake Waynoka
According to the poverty statistics in Lake Waynoka, males aged under 5 years and females aged under 5 years are the age groups that are most secure financially, with 100.0% of males and 100.0% of females in these age groups living above the poverty line.
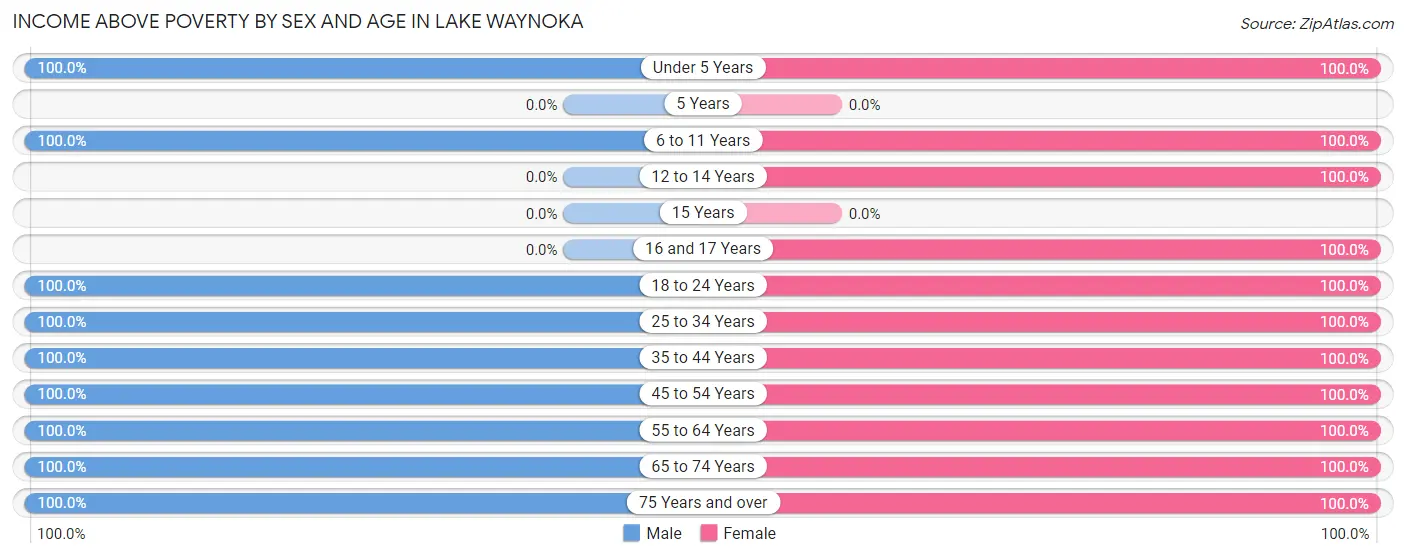
| Age Bracket | Male | Female |
| Under 5 Years | 13 (100.0%) | 17 (100.0%) |
| 5 Years | 0 (0.0%) | 0 (0.0%) |
| 6 to 11 Years | 45 (100.0%) | 5 (100.0%) |
| 12 to 14 Years | 0 (0.0%) | 49 (100.0%) |
| 15 Years | 0 (0.0%) | 0 (0.0%) |
| 16 and 17 Years | 0 (0.0%) | 15 (100.0%) |
| 18 to 24 Years | 20 (100.0%) | 31 (100.0%) |
| 25 to 34 Years | 32 (100.0%) | 26 (100.0%) |
| 35 to 44 Years | 97 (100.0%) | 69 (100.0%) |
| 45 to 54 Years | 47 (100.0%) | 56 (100.0%) |
| 55 to 64 Years | 167 (100.0%) | 135 (100.0%) |
| 65 to 74 Years | 93 (100.0%) | 95 (100.0%) |
| 75 Years and over | 44 (100.0%) | 47 (100.0%) |
| Total | 558 (100.0%) | 545 (100.0%) |
Income Below Poverty Among Married-Couple Families in Lake Waynoka
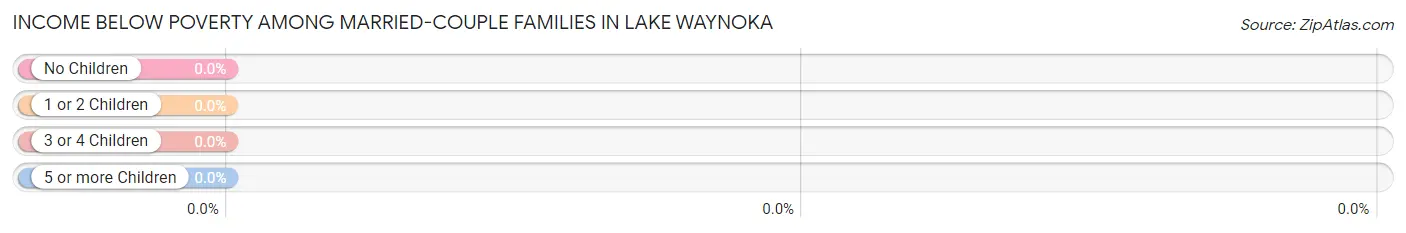
| Children | Above Poverty | Below Poverty |
| No Children | 275 (100.0%) | 0 (0.0%) |
| 1 or 2 Children | 67 (100.0%) | 0 (0.0%) |
| 3 or 4 Children | 0 (0.0%) | 0 (0.0%) |
| 5 or more Children | 0 (0.0%) | 0 (0.0%) |
| Total | 342 (100.0%) | 0 (0.0%) |
Income Below Poverty Among Single-Parent Households in Lake Waynoka
| Children | Single Father | Single Mother |
| No Children | 0 (0.0%) | 0 (0.0%) |
| 1 or 2 Children | 0 (0.0%) | 0 (0.0%) |
| 3 or 4 Children | 0 (0.0%) | 0 (0.0%) |
| 5 or more Children | 0 (0.0%) | 0 (0.0%) |
| Total | 0 (0.0%) | 0 (0.0%) |
Income Below Poverty Among Married-Couple vs Single-Parent Households in Lake Waynoka
| Children | Married-Couple Families | Single-Parent Households |
| No Children | 0 (0.0%) | 0 (0.0%) |
| 1 or 2 Children | 0 (0.0%) | 0 (0.0%) |
| 3 or 4 Children | 0 (0.0%) | 0 (0.0%) |
| 5 or more Children | 0 (0.0%) | 0 (0.0%) |
| Total | 0 (0.0%) | 0 (0.0%) |
Race in Lake Waynoka
The most populous races in Lake Waynoka are White / Caucasian (1,060 | 96.1%), Black / African American (26 | 2.4%), and Two or more Races (17 | 1.5%).
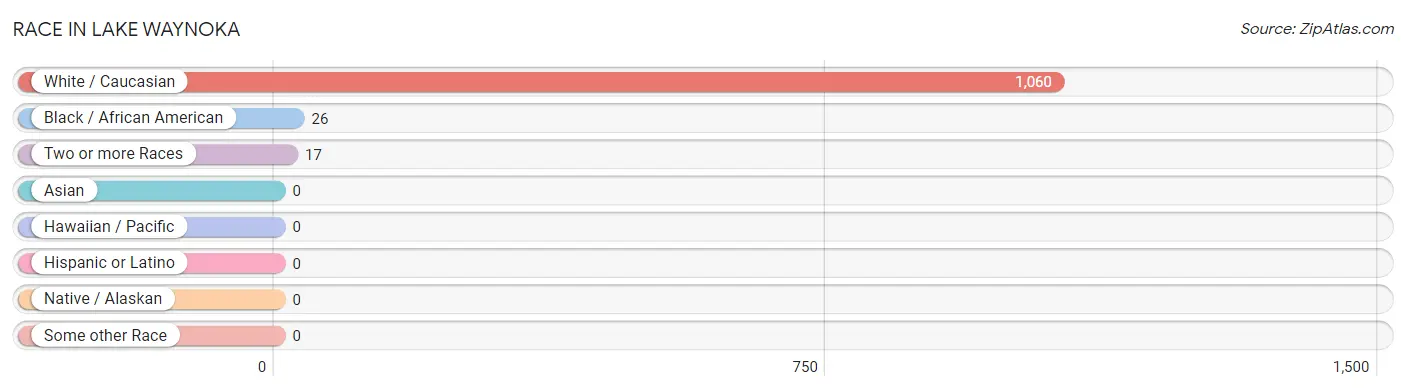
| Race | # Population | % Population |
| Asian | 0 | 0.0% |
| Black / African American | 26 | 2.4% |
| Hawaiian / Pacific | 0 | 0.0% |
| Hispanic or Latino | 0 | 0.0% |
| Native / Alaskan | 0 | 0.0% |
| White / Caucasian | 1,060 | 96.1% |
| Two or more Races | 17 | 1.5% |
| Some other Race | 0 | 0.0% |
| Total | 1,103 | 100.0% |
Ancestry in Lake Waynoka
The most populous ancestries reported in Lake Waynoka are German (473 | 42.9%), English (214 | 19.4%), Irish (214 | 19.4%), French (98 | 8.9%), and Scottish (68 | 6.2%), together accounting for 96.7% of all Lake Waynoka residents.
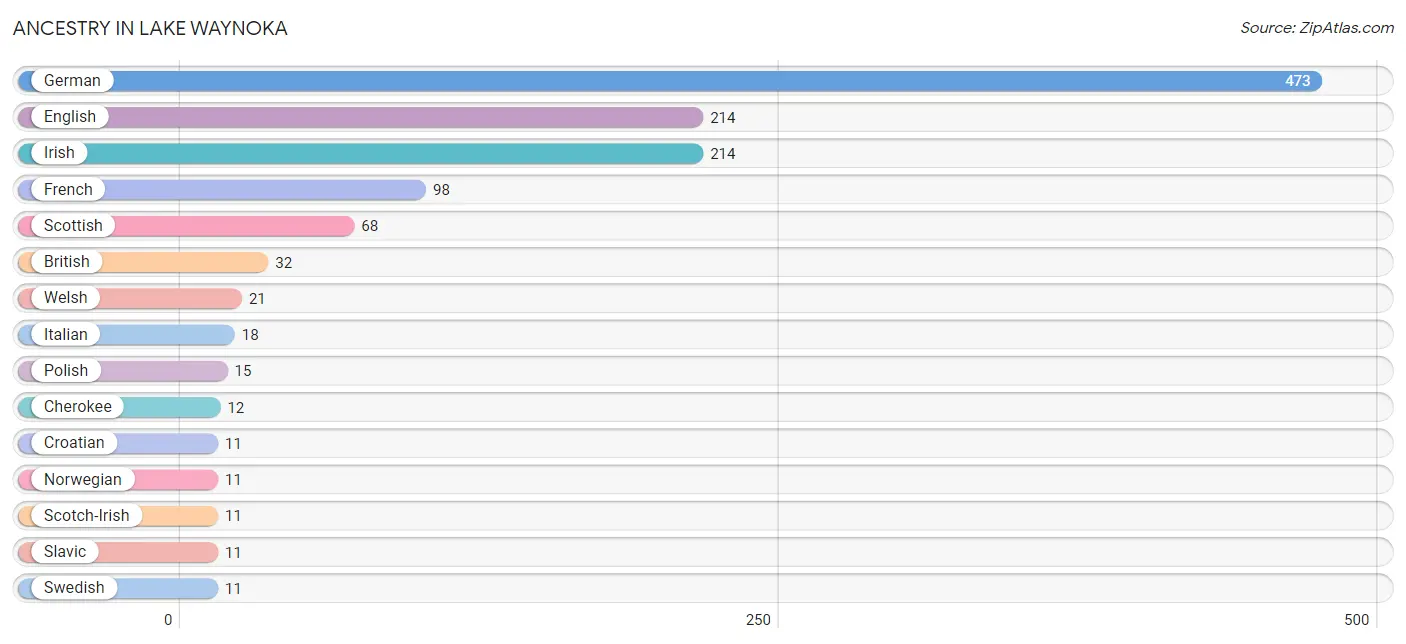
| Ancestry | # Population | % Population |
| American | 9 | 0.8% |
| British | 32 | 2.9% |
| Cherokee | 12 | 1.1% |
| Croatian | 11 | 1.0% |
| English | 214 | 19.4% |
| French | 98 | 8.9% |
| German | 473 | 42.9% |
| Irish | 214 | 19.4% |
| Italian | 18 | 1.6% |
| Norwegian | 11 | 1.0% |
| Polish | 15 | 1.4% |
| Scotch-Irish | 11 | 1.0% |
| Scottish | 68 | 6.2% |
| Slavic | 11 | 1.0% |
| Swedish | 11 | 1.0% |
| Welsh | 21 | 1.9% | View All 16 Rows |
Immigrants in Lake Waynoka

| Immigration Origin | # Population | % Population | View All 0 Rows |
Sex and Age in Lake Waynoka
Sex and Age in Lake Waynoka
The most populous age groups in Lake Waynoka are 55 to 59 Years (102 | 18.3%) for men and 60 to 64 Years (92 | 16.9%) for women.
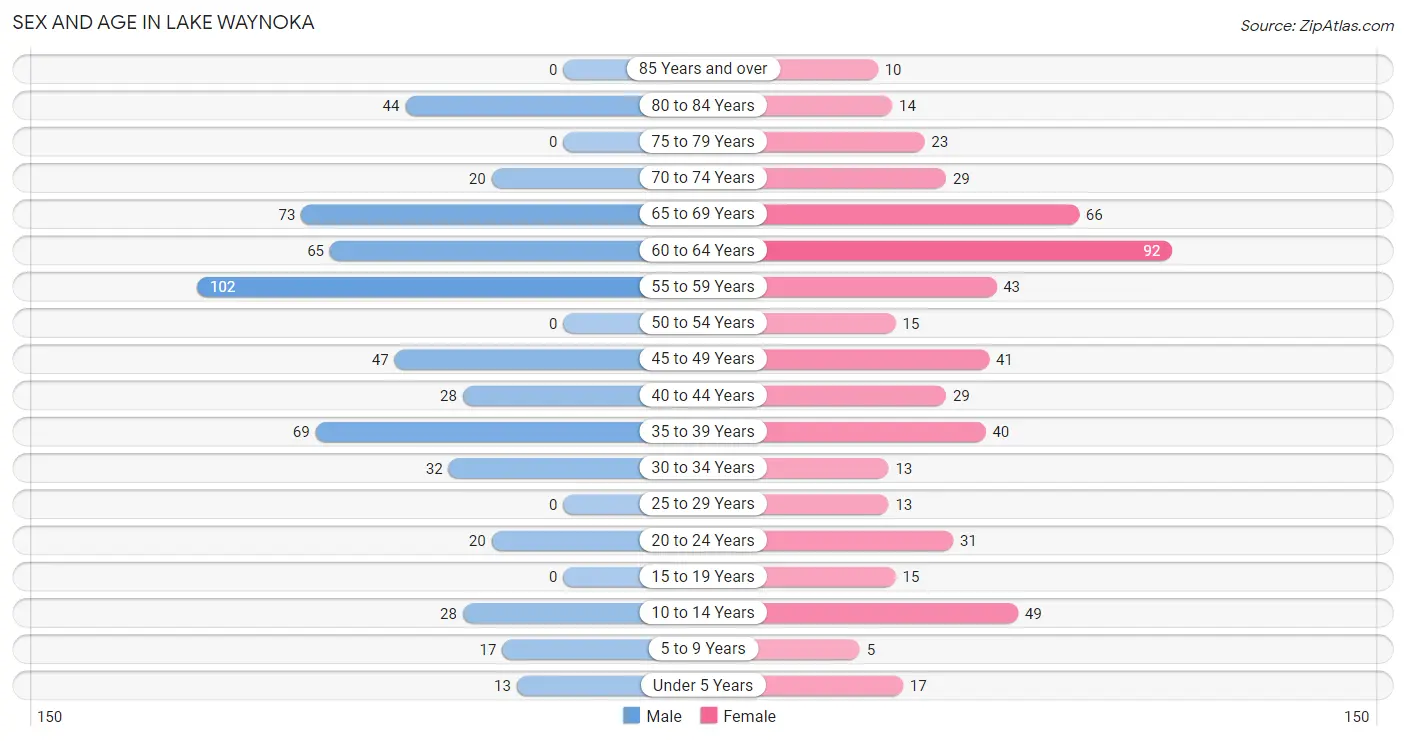
| Age Bracket | Male | Female |
| Under 5 Years | 13 (2.3%) | 17 (3.1%) |
| 5 to 9 Years | 17 (3.0%) | 5 (0.9%) |
| 10 to 14 Years | 28 (5.0%) | 49 (9.0%) |
| 15 to 19 Years | 0 (0.0%) | 15 (2.8%) |
| 20 to 24 Years | 20 (3.6%) | 31 (5.7%) |
| 25 to 29 Years | 0 (0.0%) | 13 (2.4%) |
| 30 to 34 Years | 32 (5.7%) | 13 (2.4%) |
| 35 to 39 Years | 69 (12.4%) | 40 (7.3%) |
| 40 to 44 Years | 28 (5.0%) | 29 (5.3%) |
| 45 to 49 Years | 47 (8.4%) | 41 (7.5%) |
| 50 to 54 Years | 0 (0.0%) | 15 (2.8%) |
| 55 to 59 Years | 102 (18.3%) | 43 (7.9%) |
| 60 to 64 Years | 65 (11.7%) | 92 (16.9%) |
| 65 to 69 Years | 73 (13.1%) | 66 (12.1%) |
| 70 to 74 Years | 20 (3.6%) | 29 (5.3%) |
| 75 to 79 Years | 0 (0.0%) | 23 (4.2%) |
| 80 to 84 Years | 44 (7.9%) | 14 (2.6%) |
| 85 Years and over | 0 (0.0%) | 10 (1.8%) |
| Total | 558 (100.0%) | 545 (100.0%) |
Families and Households in Lake Waynoka
Median Family Size in Lake Waynoka
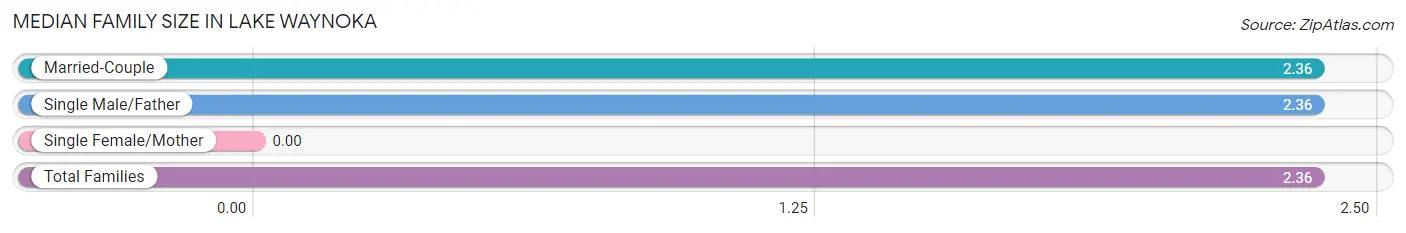
| Family Type | # Families | Family Size |
| Married-Couple | 342 (79.7%) | 2.36 |
| Single Male/Father | 87 (20.3%) | 2.36 |
| Single Female/Mother | 0 (0.0%) | - |
| Total Families | 429 (100.0%) | 2.36 |
Median Household Size in Lake Waynoka
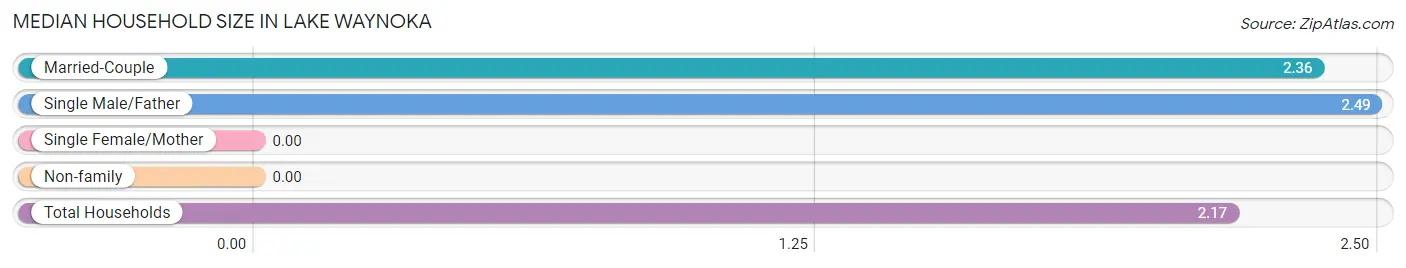
| Household Type | # Households | Household Size |
| Married-Couple | 342 (67.3%) | 2.36 |
| Single Male/Father | 87 (17.1%) | 2.49 |
| Single Female/Mother | 0 (0.0%) | - |
| Non-family | 79 (15.5%) | - |
| Total Households | 508 (100.0%) | 2.17 |
Household Size by Marriage Status in Lake Waynoka
Out of a total of 508 households in Lake Waynoka, 429 (84.5%) are family households, while 79 (15.5%) are nonfamily households. The most numerous type of family households are 2-person households, comprising 241, and the most common type of nonfamily households are 1-person households, comprising 79.
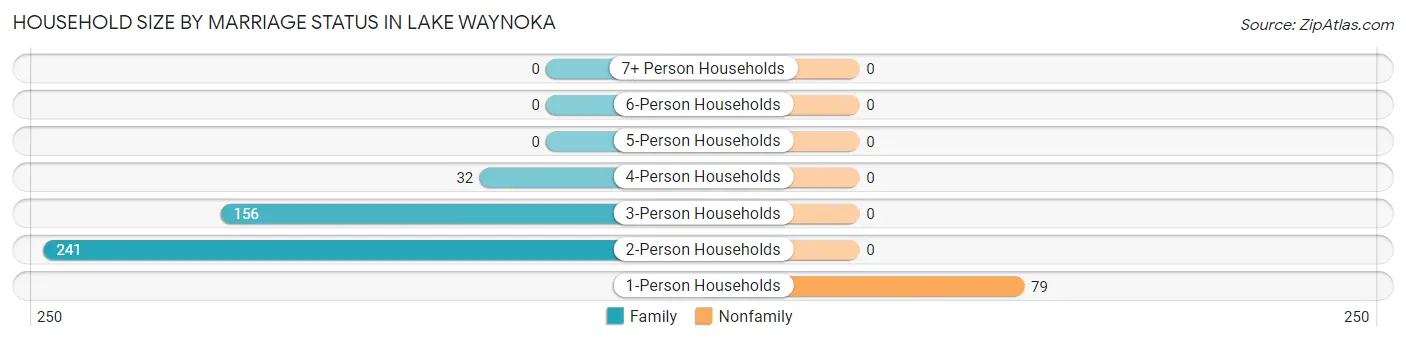
| Household Size | Family Households | Nonfamily Households |
| 1-Person Households | - | 79 (15.5%) |
| 2-Person Households | 241 (47.4%) | 0 (0.0%) |
| 3-Person Households | 156 (30.7%) | 0 (0.0%) |
| 4-Person Households | 32 (6.3%) | 0 (0.0%) |
| 5-Person Households | 0 (0.0%) | 0 (0.0%) |
| 6-Person Households | 0 (0.0%) | 0 (0.0%) |
| 7+ Person Households | 0 (0.0%) | 0 (0.0%) |
| Total | 429 (84.5%) | 79 (15.5%) |
Female Fertility in Lake Waynoka
Fertility by Age in Lake Waynoka
Average fertility rate in Lake Waynoka is 71.0 births per 1,000 women. Women in the age bracket of 20 to 34 years have the highest fertility rate with 228.0 births per 1,000 women. Women in the age bracket of 20 to 34 years acount for 100.0% of all women with births.
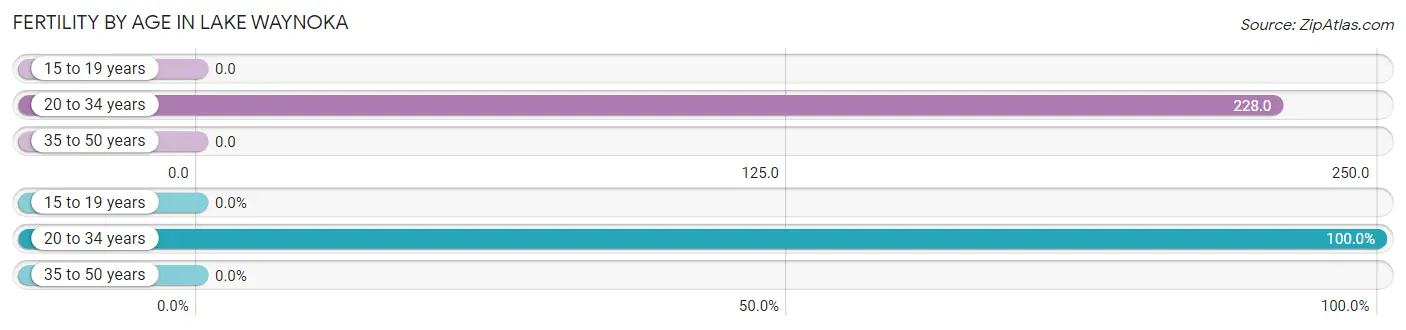
| Age Bracket | Women with Births | Births / 1,000 Women |
| 15 to 19 years | 0 (0.0%) | 0.0 |
| 20 to 34 years | 13 (100.0%) | 228.0 |
| 35 to 50 years | 0 (0.0%) | 0.0 |
| Total | 13 (100.0%) | 71.0 |
Fertility by Age by Marriage Status in Lake Waynoka
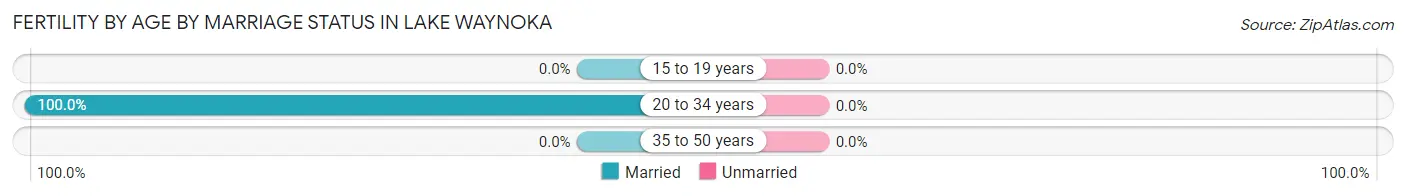
| Age Bracket | Married | Unmarried |
| 15 to 19 years | 0 (0.0%) | 0 (0.0%) |
| 20 to 34 years | 13 (100.0%) | 0 (0.0%) |
| 35 to 50 years | 0 (0.0%) | 0 (0.0%) |
| Total | 13 (100.0%) | 0 (0.0%) |
Fertility by Education in Lake Waynoka
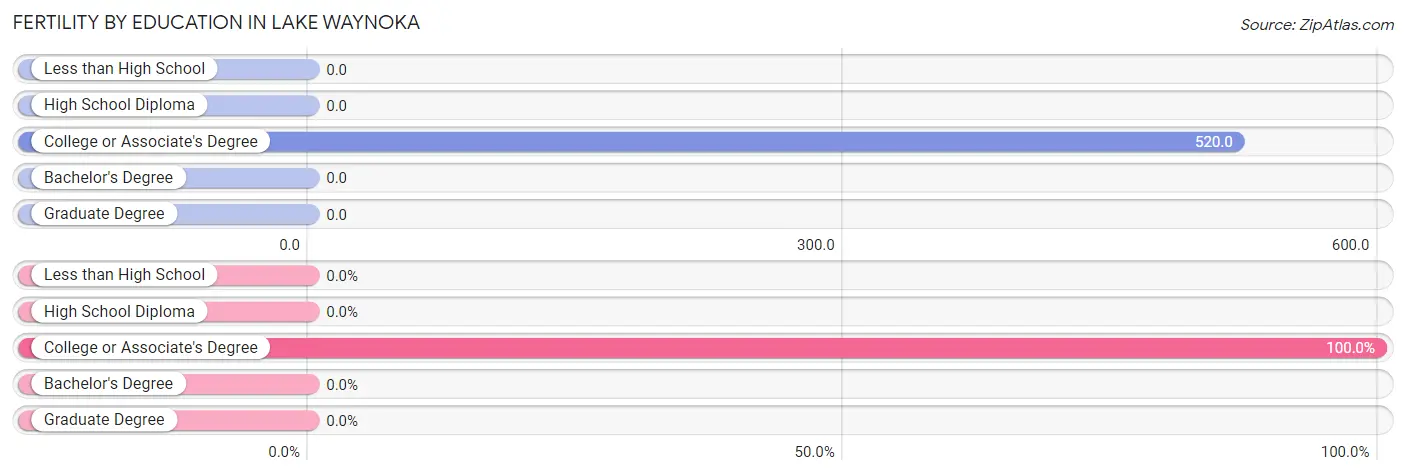
| Educational Attainment | Women with Births | Births / 1,000 Women |
| Less than High School | 0 (0.0%) | 0.0 |
| High School Diploma | 0 (0.0%) | 0.0 |
| College or Associate's Degree | 13 (100.0%) | 520.0 |
| Bachelor's Degree | 0 (0.0%) | 0.0 |
| Graduate Degree | 0 (0.0%) | 0.0 |
| Total | 13 (100.0%) | 71.0 |
Fertility by Education by Marriage Status in Lake Waynoka
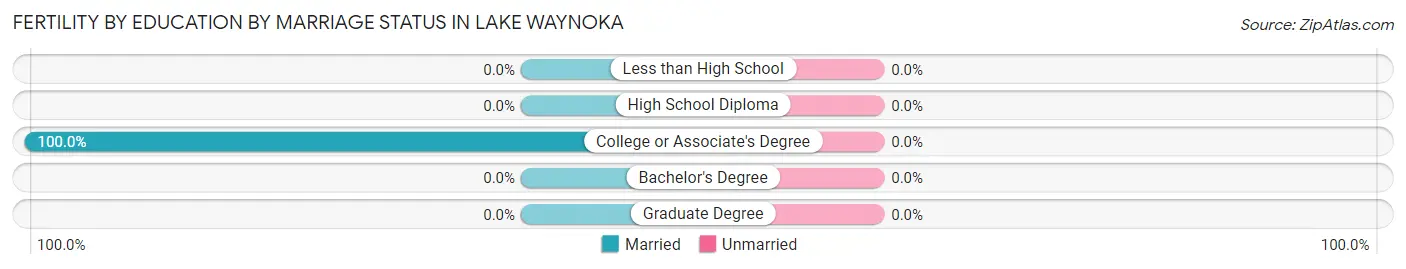
| Educational Attainment | Married | Unmarried |
| Less than High School | 0 (0.0%) | 0 (0.0%) |
| High School Diploma | 0 (0.0%) | 0 (0.0%) |
| College or Associate's Degree | 13 (100.0%) | 0 (0.0%) |
| Bachelor's Degree | 0 (0.0%) | 0 (0.0%) |
| Graduate Degree | 0 (0.0%) | 0 (0.0%) |
| Total | 13 (100.0%) | 0 (0.0%) |
Employment Characteristics in Lake Waynoka
Employment by Class of Employer in Lake Waynoka
Among the 436 employed individuals in Lake Waynoka, private company employees (280 | 64.2%), local government employees (70 | 16.1%), and self-employed (incorporated) (35 | 8.0%) make up the most common classes of employment.
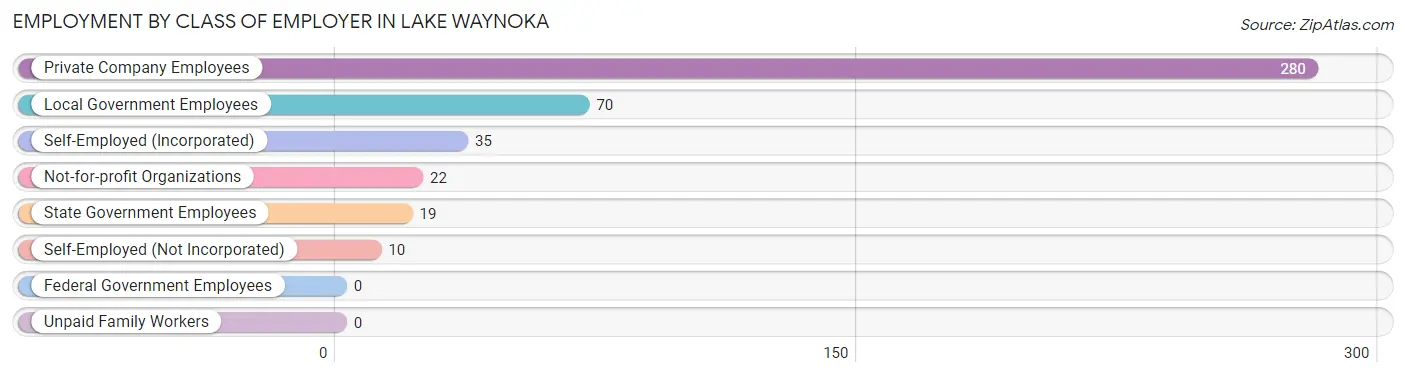
| Employer Class | # Employees | % Employees |
| Private Company Employees | 280 | 64.2% |
| Self-Employed (Incorporated) | 35 | 8.0% |
| Self-Employed (Not Incorporated) | 10 | 2.3% |
| Not-for-profit Organizations | 22 | 5.1% |
| Local Government Employees | 70 | 16.1% |
| State Government Employees | 19 | 4.4% |
| Federal Government Employees | 0 | 0.0% |
| Unpaid Family Workers | 0 | 0.0% |
| Total | 436 | 100.0% |
Employment Status by Age in Lake Waynoka
According to the labor force statistics for Lake Waynoka, out of the total population over 16 years of age (974), 51.4% or 501 individuals are in the labor force, with 2.6% or 13 of them unemployed. The age group with the highest labor force participation rate is 20 to 24 years, with 100.0% or 51 individuals in the labor force. Within the labor force, the 30 to 34 years age range has the highest percentage of unemployed individuals, with 28.9% or 13 of them being unemployed.
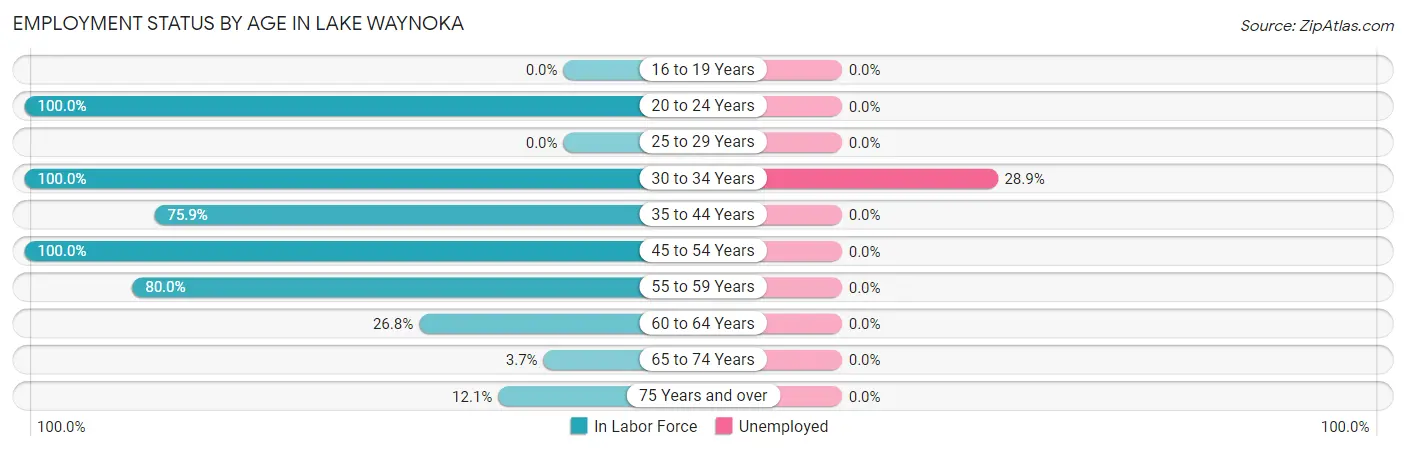
| Age Bracket | In Labor Force | Unemployed |
| 16 to 19 Years | 0 (0.0%) | 0 (0.0%) |
| 20 to 24 Years | 51 (100.0%) | 0 (0.0%) |
| 25 to 29 Years | 0 (0.0%) | 0 (0.0%) |
| 30 to 34 Years | 45 (100.0%) | 13 (28.9%) |
| 35 to 44 Years | 126 (75.9%) | 0 (0.0%) |
| 45 to 54 Years | 103 (100.0%) | 0 (0.0%) |
| 55 to 59 Years | 116 (80.0%) | 0 (0.0%) |
| 60 to 64 Years | 42 (26.8%) | 0 (0.0%) |
| 65 to 74 Years | 7 (3.7%) | 0 (0.0%) |
| 75 Years and over | 11 (12.1%) | 0 (0.0%) |
| Total | 501 (51.4%) | 13 (2.6%) |
Employment Status by Educational Attainment in Lake Waynoka
According to labor force statistics for Lake Waynoka, 68.7% of individuals (432) out of the total population between 25 and 64 years of age (629) are in the labor force, with 3.0% or 13 of them being unemployed. The group with the highest labor force participation rate are those with the educational attainment of bachelor's degree or higher, with 82.1% or 133 individuals in the labor force. Within the labor force, individuals with high school diploma education have the highest percentage of unemployment, with 6.5% or 13 of them being unemployed.
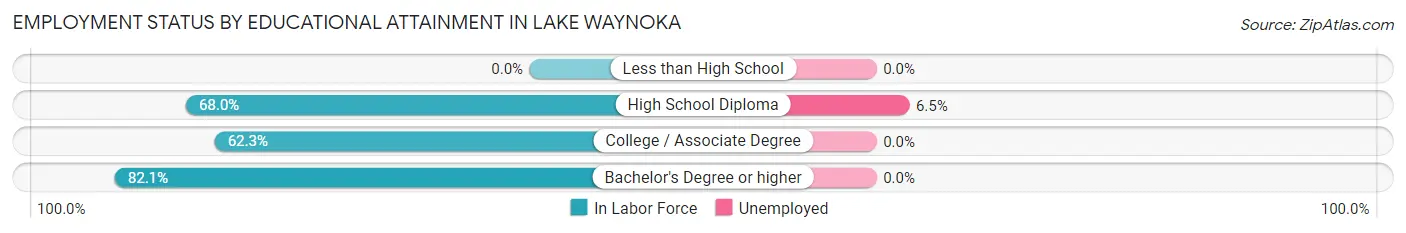
| Educational Attainment | In Labor Force | Unemployed |
| Less than High School | 0 (0.0%) | 0 (0.0%) |
| High School Diploma | 200 (68.0%) | 19 (6.5%) |
| College / Associate Degree | 99 (62.3%) | 0 (0.0%) |
| Bachelor's Degree or higher | 133 (82.1%) | 0 (0.0%) |
| Total | 432 (68.7%) | 19 (3.0%) |
Employment Occupations by Sex in Lake Waynoka
Management, Business, Science and Arts Occupations
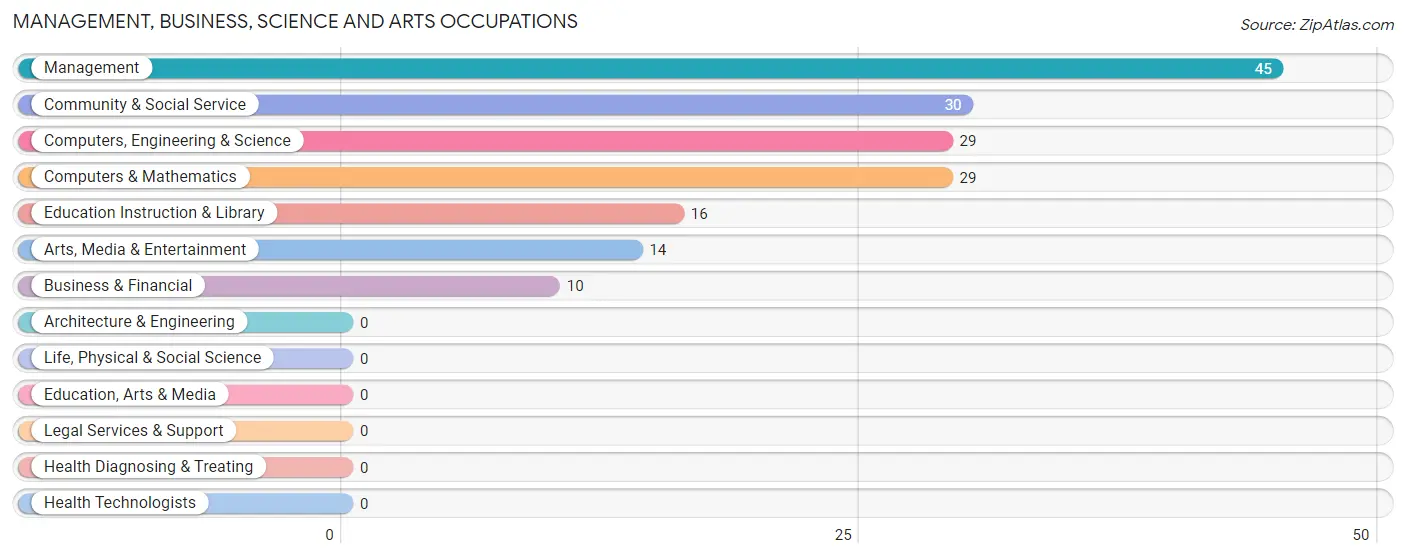
The most common Management, Business, Science and Arts occupations in Lake Waynoka are Management (45 | 9.2%), Community & Social Service (30 | 6.1%), Computers, Engineering & Science (29 | 5.9%), Computers & Mathematics (29 | 5.9%), and Education Instruction & Library (16 | 3.3%).
Management, Business, Science and Arts Occupations by Sex
Within the Management, Business, Science and Arts occupations in Lake Waynoka, the most male-oriented occupations are Management (100.0%), Computers, Engineering & Science (48.3%), and Computers & Mathematics (48.3%), while the most female-oriented occupations are Business & Financial (100.0%), Community & Social Service (100.0%), and Education Instruction & Library (100.0%).
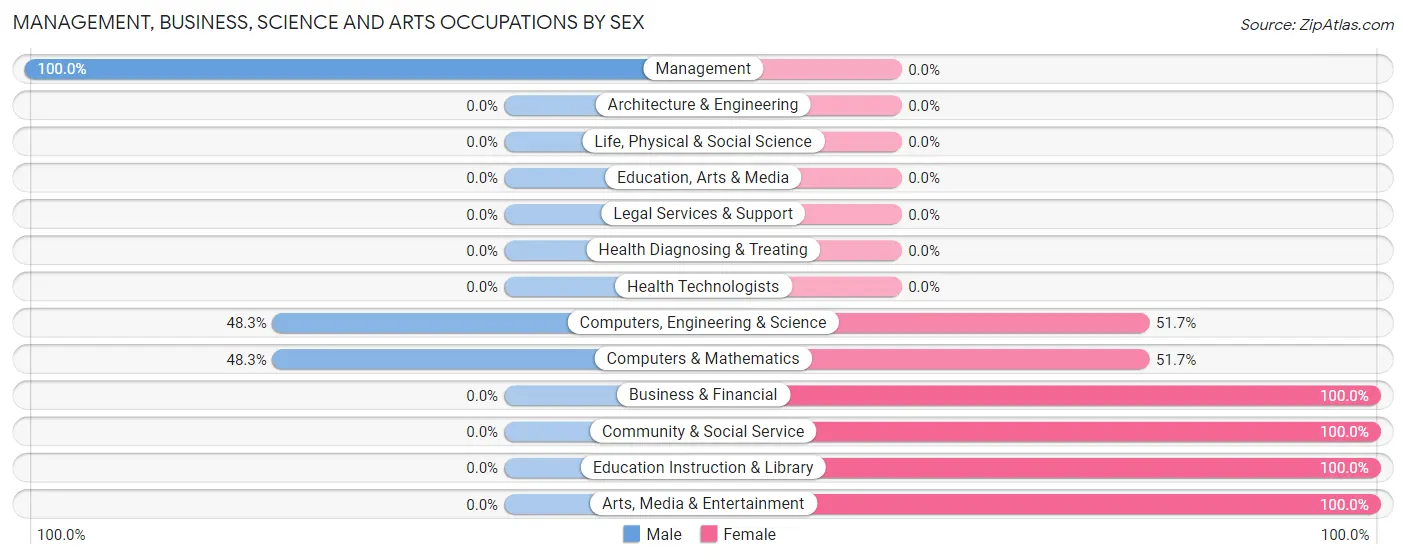
| Occupation | Male | Female |
| Management | 45 (100.0%) | 0 (0.0%) |
| Business & Financial | 0 (0.0%) | 10 (100.0%) |
| Computers, Engineering & Science | 14 (48.3%) | 15 (51.7%) |
| Computers & Mathematics | 14 (48.3%) | 15 (51.7%) |
| Architecture & Engineering | 0 (0.0%) | 0 (0.0%) |
| Life, Physical & Social Science | 0 (0.0%) | 0 (0.0%) |
| Community & Social Service | 0 (0.0%) | 30 (100.0%) |
| Education, Arts & Media | 0 (0.0%) | 0 (0.0%) |
| Legal Services & Support | 0 (0.0%) | 0 (0.0%) |
| Education Instruction & Library | 0 (0.0%) | 16 (100.0%) |
| Arts, Media & Entertainment | 0 (0.0%) | 14 (100.0%) |
| Health Diagnosing & Treating | 0 (0.0%) | 0 (0.0%) |
| Health Technologists | 0 (0.0%) | 0 (0.0%) |
| Total (Category) | 59 (51.7%) | 55 (48.2%) |
| Total (Overall) | 316 (64.7%) | 172 (35.2%) |
Services Occupations
The most common Services occupations in Lake Waynoka are Healthcare Support (43 | 8.8%), Security & Protection (17 | 3.5%), Firefighting & Prevention (17 | 3.5%), Food Preparation & Serving (17 | 3.5%), and Cleaning & Maintenance (15 | 3.1%).
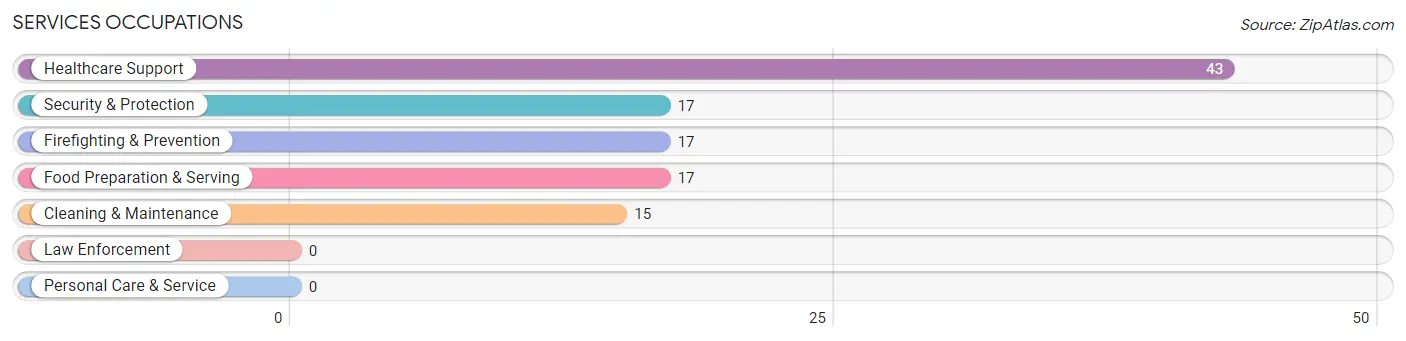
Services Occupations by Sex
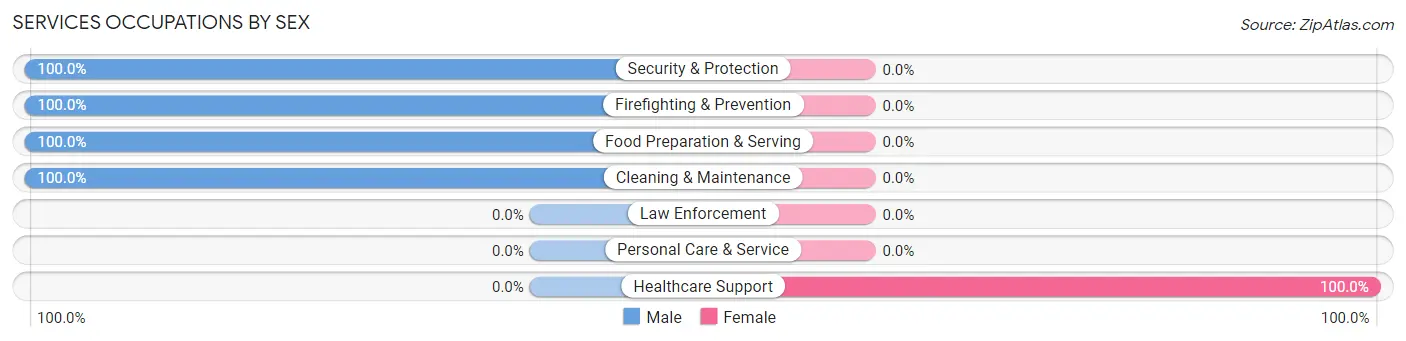
| Occupation | Male | Female |
| Healthcare Support | 0 (0.0%) | 43 (100.0%) |
| Security & Protection | 17 (100.0%) | 0 (0.0%) |
| Firefighting & Prevention | 17 (100.0%) | 0 (0.0%) |
| Law Enforcement | 0 (0.0%) | 0 (0.0%) |
| Food Preparation & Serving | 17 (100.0%) | 0 (0.0%) |
| Cleaning & Maintenance | 15 (100.0%) | 0 (0.0%) |
| Personal Care & Service | 0 (0.0%) | 0 (0.0%) |
| Total (Category) | 49 (53.3%) | 43 (46.7%) |
| Total (Overall) | 316 (64.7%) | 172 (35.2%) |
Sales and Office Occupations
The most common Sales and Office occupations in Lake Waynoka are Office & Administration (22 | 4.5%), and Sales & Related (17 | 3.5%).
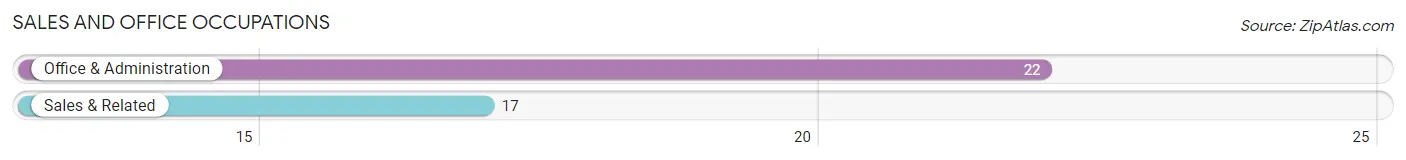
Sales and Office Occupations by Sex
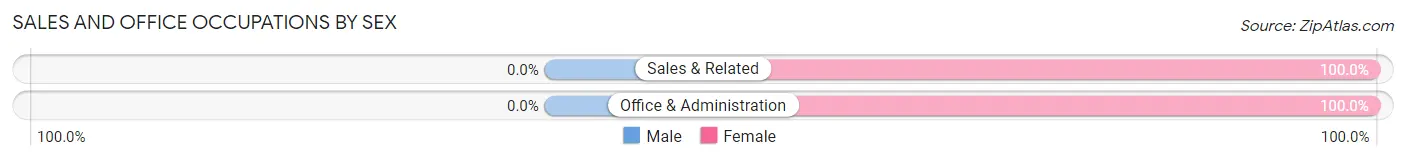
| Occupation | Male | Female |
| Sales & Related | 0 (0.0%) | 17 (100.0%) |
| Office & Administration | 0 (0.0%) | 22 (100.0%) |
| Total (Category) | 0 (0.0%) | 39 (100.0%) |
| Total (Overall) | 316 (64.7%) | 172 (35.2%) |
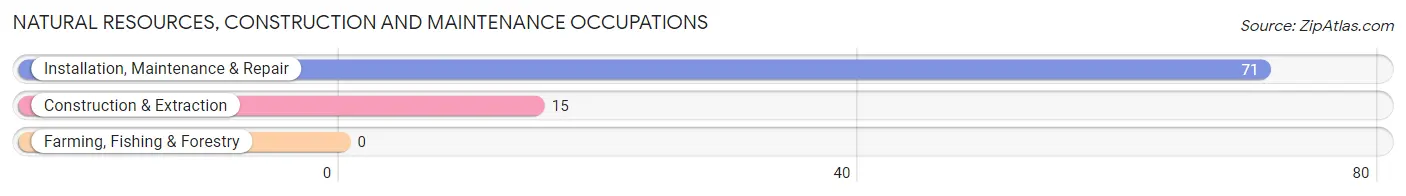
Natural Resources, Construction and Maintenance Occupations
The most common Natural Resources, Construction and Maintenance occupations in Lake Waynoka are Installation, Maintenance & Repair (71 | 14.5%), and Construction & Extraction (15 | 3.1%).
Natural Resources, Construction and Maintenance Occupations by Sex
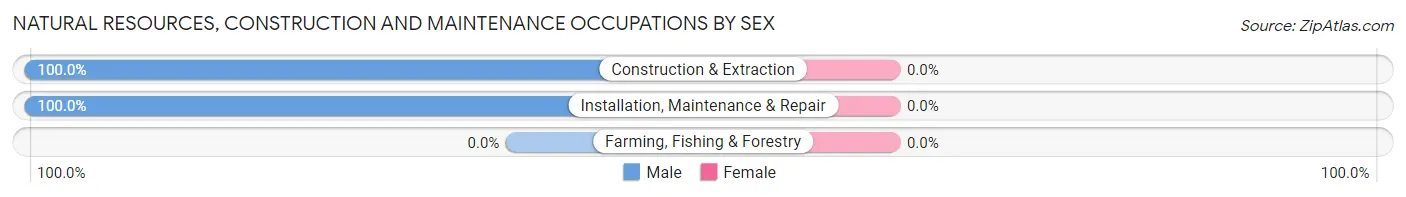
| Occupation | Male | Female |
| Farming, Fishing & Forestry | 0 (0.0%) | 0 (0.0%) |
| Construction & Extraction | 15 (100.0%) | 0 (0.0%) |
| Installation, Maintenance & Repair | 71 (100.0%) | 0 (0.0%) |
| Total (Category) | 86 (100.0%) | 0 (0.0%) |
| Total (Overall) | 316 (64.7%) | 172 (35.2%) |
Production, Transportation and Moving Occupations
The most common Production, Transportation and Moving occupations in Lake Waynoka are Production (129 | 26.4%), and Transportation (28 | 5.7%).
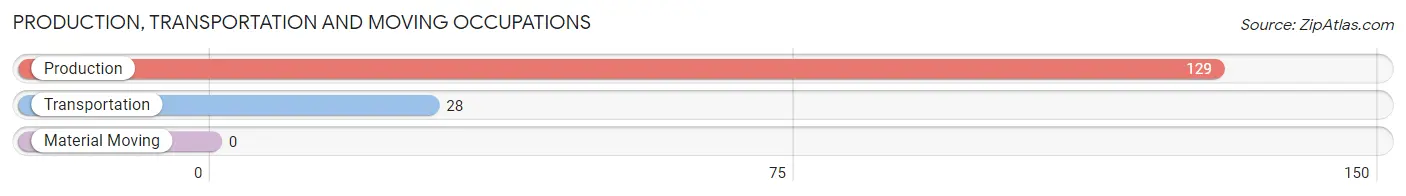
Production, Transportation and Moving Occupations by Sex
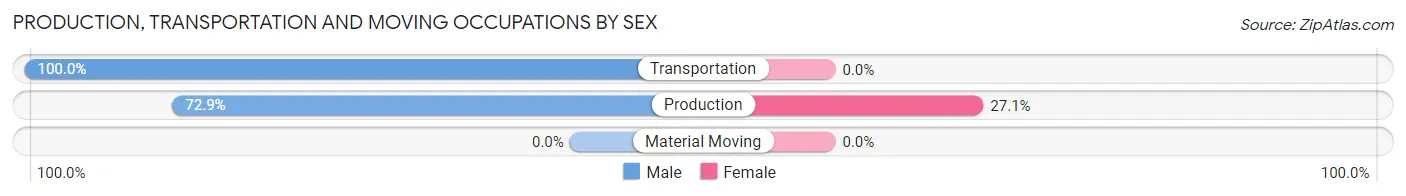
| Occupation | Male | Female |
| Production | 94 (72.9%) | 35 (27.1%) |
| Transportation | 28 (100.0%) | 0 (0.0%) |
| Material Moving | 0 (0.0%) | 0 (0.0%) |
| Total (Category) | 122 (77.7%) | 35 (22.3%) |
| Total (Overall) | 316 (64.7%) | 172 (35.2%) |
Employment Industries by Sex in Lake Waynoka
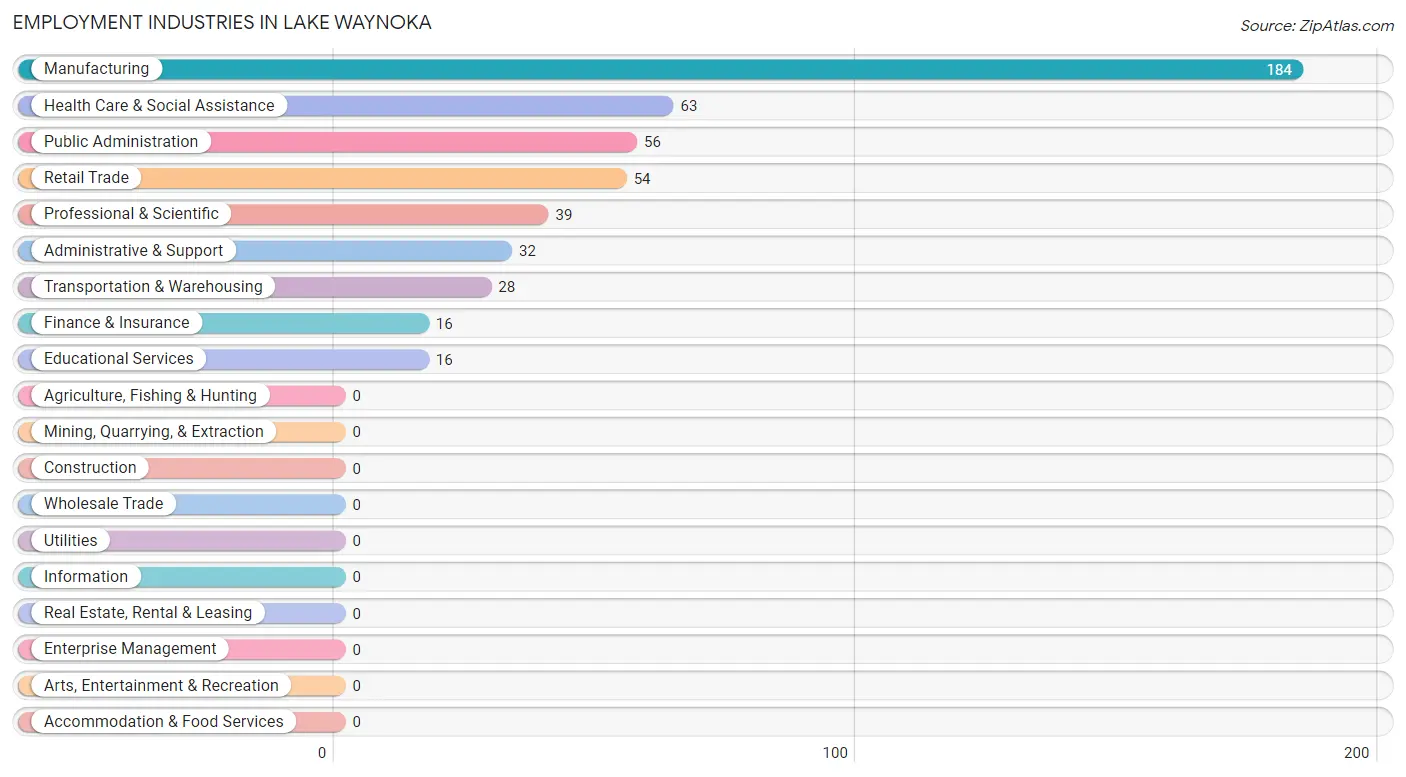
Employment Industries in Lake Waynoka
The major employment industries in Lake Waynoka include Manufacturing (184 | 37.7%), Health Care & Social Assistance (63 | 12.9%), Public Administration (56 | 11.5%), Retail Trade (54 | 11.1%), and Professional & Scientific (39 | 8.0%).
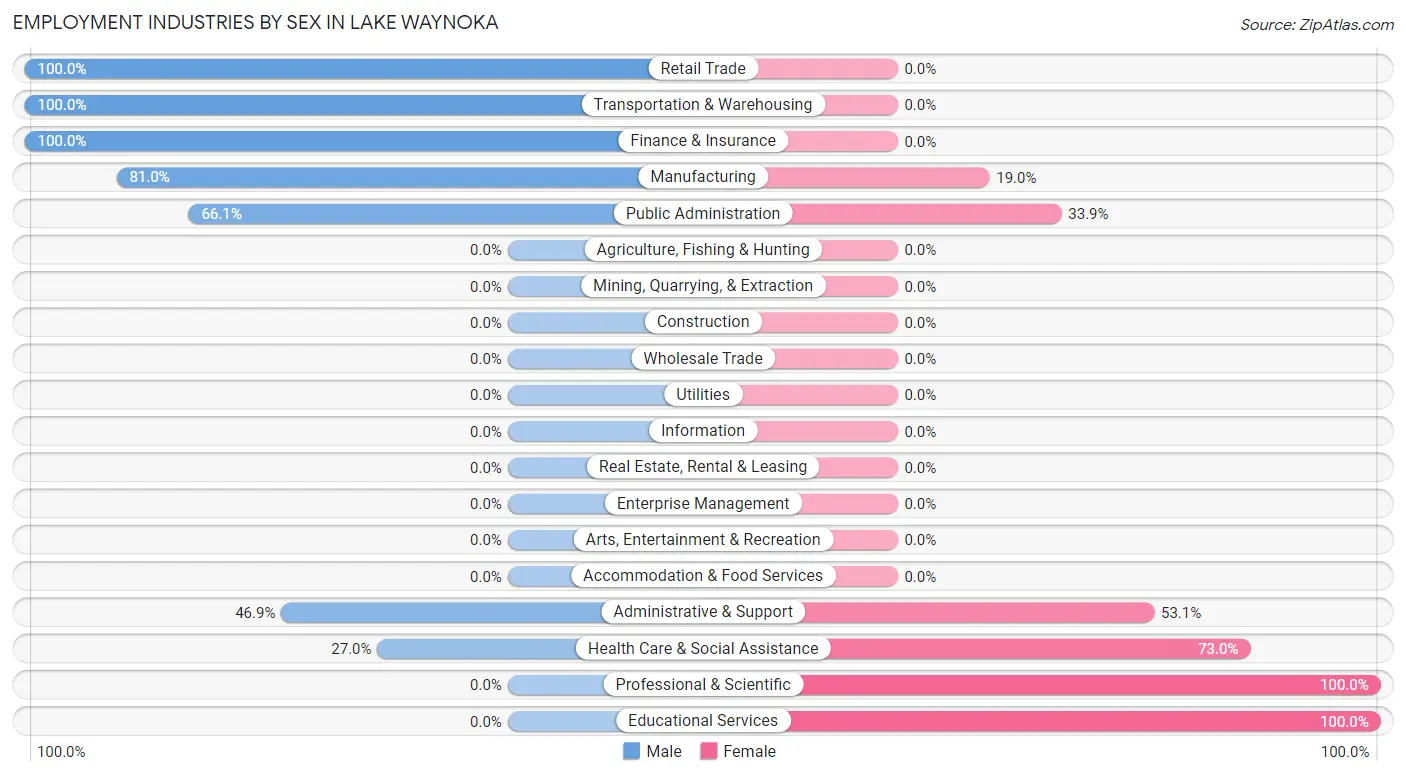
Employment Industries by Sex in Lake Waynoka
The Lake Waynoka industries that see more men than women are Retail Trade (100.0%), Transportation & Warehousing (100.0%), and Finance & Insurance (100.0%), whereas the industries that tend to have a higher number of women are Professional & Scientific (100.0%), Educational Services (100.0%), and Health Care & Social Assistance (73.0%).
| Industry | Male | Female |
| Agriculture, Fishing & Hunting | 0 (0.0%) | 0 (0.0%) |
| Mining, Quarrying, & Extraction | 0 (0.0%) | 0 (0.0%) |
| Construction | 0 (0.0%) | 0 (0.0%) |
| Manufacturing | 149 (81.0%) | 35 (19.0%) |
| Wholesale Trade | 0 (0.0%) | 0 (0.0%) |
| Retail Trade | 54 (100.0%) | 0 (0.0%) |
| Transportation & Warehousing | 28 (100.0%) | 0 (0.0%) |
| Utilities | 0 (0.0%) | 0 (0.0%) |
| Information | 0 (0.0%) | 0 (0.0%) |
| Finance & Insurance | 16 (100.0%) | 0 (0.0%) |
| Real Estate, Rental & Leasing | 0 (0.0%) | 0 (0.0%) |
| Professional & Scientific | 0 (0.0%) | 39 (100.0%) |
| Enterprise Management | 0 (0.0%) | 0 (0.0%) |
| Administrative & Support | 15 (46.9%) | 17 (53.1%) |
| Educational Services | 0 (0.0%) | 16 (100.0%) |
| Health Care & Social Assistance | 17 (27.0%) | 46 (73.0%) |
| Arts, Entertainment & Recreation | 0 (0.0%) | 0 (0.0%) |
| Accommodation & Food Services | 0 (0.0%) | 0 (0.0%) |
| Public Administration | 37 (66.1%) | 19 (33.9%) |
| Total | 316 (64.7%) | 172 (35.2%) |
Education in Lake Waynoka
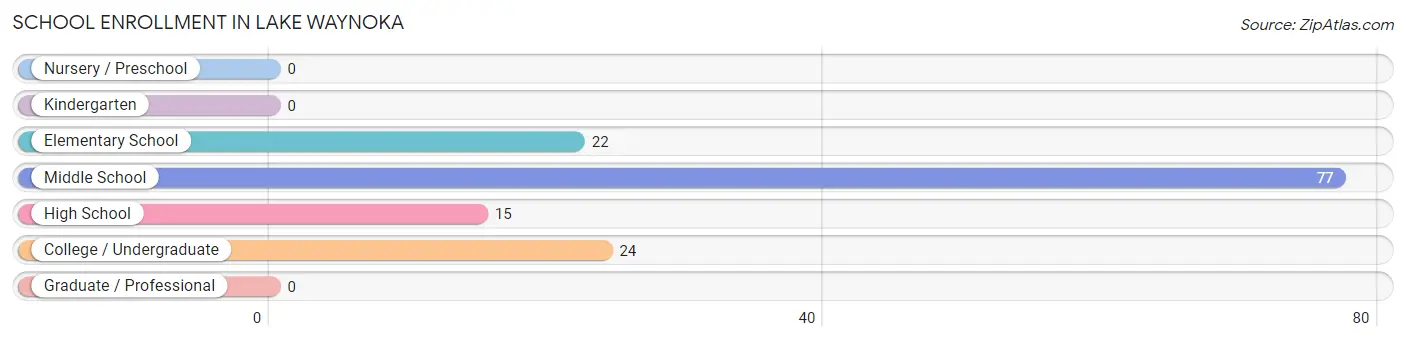
School Enrollment in Lake Waynoka
The most common levels of schooling among the 138 students in Lake Waynoka are middle school (77 | 55.8%), college / undergraduate (24 | 17.4%), and elementary school (22 | 15.9%).
| School Level | # Students | % Students |
| Nursery / Preschool | 0 | 0.0% |
| Kindergarten | 0 | 0.0% |
| Elementary School | 22 | 15.9% |
| Middle School | 77 | 55.8% |
| High School | 15 | 10.9% |
| College / Undergraduate | 24 | 17.4% |
| Graduate / Professional | 0 | 0.0% |
| Total | 138 | 100.0% |
School Enrollment by Age by Funding Source in Lake Waynoka
Out of a total of 138 students who are enrolled in schools in Lake Waynoka, 12 (8.7%) attend a private institution, while the remaining 126 (91.3%) are enrolled in public schools. The age group of 20 to 24 year olds has the highest likelihood of being enrolled in private schools, with 12 (100.0% in the age bracket) enrolled. Conversely, the age group of 5 to 9 year old has the lowest likelihood of being enrolled in a private school, with 22 (100.0% in the age bracket) attending a public institution.
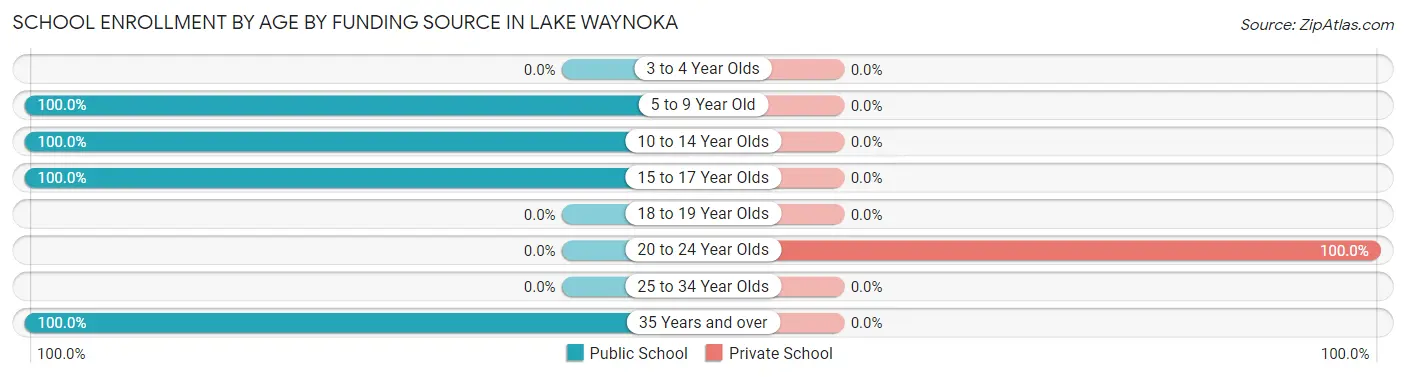
| Age Bracket | Public School | Private School |
| 3 to 4 Year Olds | 0 (0.0%) | 0 (0.0%) |
| 5 to 9 Year Old | 22 (100.0%) | 0 (0.0%) |
| 10 to 14 Year Olds | 77 (100.0%) | 0 (0.0%) |
| 15 to 17 Year Olds | 15 (100.0%) | 0 (0.0%) |
| 18 to 19 Year Olds | 0 (0.0%) | 0 (0.0%) |
| 20 to 24 Year Olds | 0 (0.0%) | 12 (100.0%) |
| 25 to 34 Year Olds | 0 (0.0%) | 0 (0.0%) |
| 35 Years and over | 12 (100.0%) | 0 (0.0%) |
| Total | 126 (91.3%) | 12 (8.7%) |
Educational Attainment by Field of Study in Lake Waynoka
Education (80 | 30.9%), arts & humanities (55 | 21.2%), visual & performing arts (32 | 12.4%), computers & mathematics (31 | 12.0%), and bio, nature & agricultural (21 | 8.1%) are the most common fields of study among 259 individuals in Lake Waynoka who have obtained a bachelor's degree or higher.
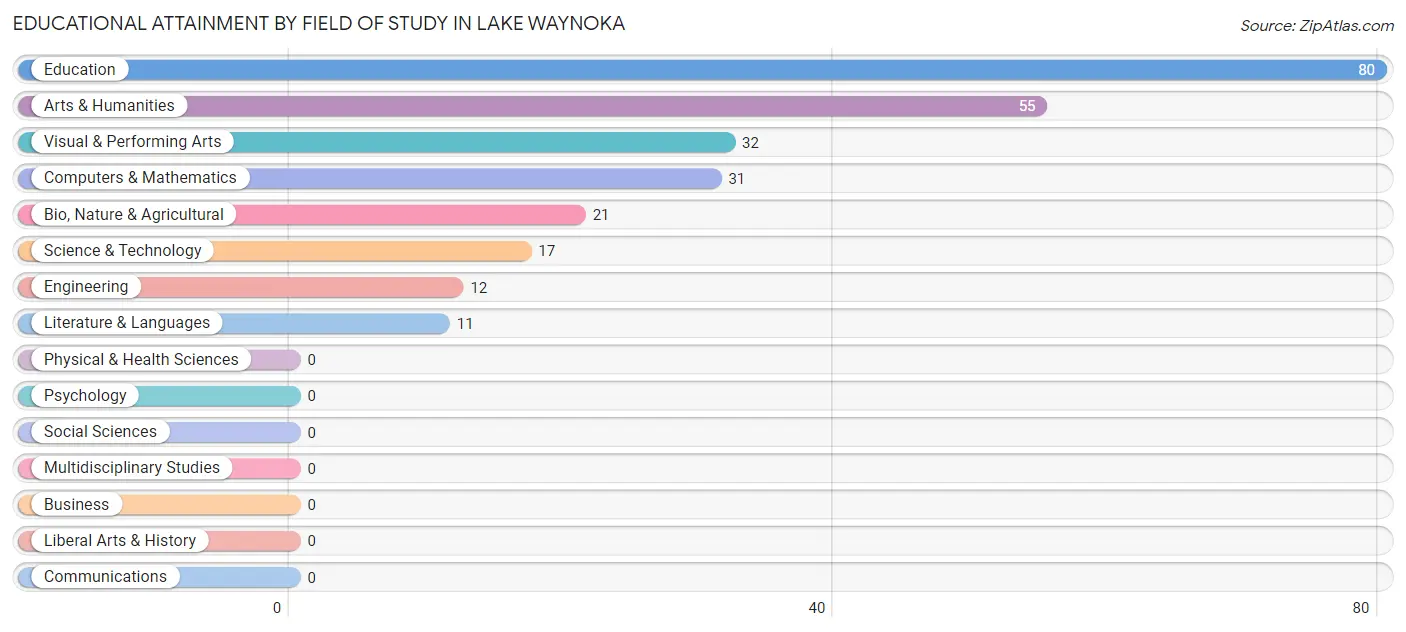
| Field of Study | # Graduates | % Graduates |
| Computers & Mathematics | 31 | 12.0% |
| Bio, Nature & Agricultural | 21 | 8.1% |
| Physical & Health Sciences | 0 | 0.0% |
| Psychology | 0 | 0.0% |
| Social Sciences | 0 | 0.0% |
| Engineering | 12 | 4.6% |
| Multidisciplinary Studies | 0 | 0.0% |
| Science & Technology | 17 | 6.6% |
| Business | 0 | 0.0% |
| Education | 80 | 30.9% |
| Literature & Languages | 11 | 4.3% |
| Liberal Arts & History | 0 | 0.0% |
| Visual & Performing Arts | 32 | 12.4% |
| Communications | 0 | 0.0% |
| Arts & Humanities | 55 | 21.2% |
| Total | 259 | 100.0% |
Transportation & Commute in Lake Waynoka
Vehicle Availability by Sex in Lake Waynoka
The most prevalent vehicle ownership categories in Lake Waynoka are males with 2 vehicles (127, accounting for 48.1%) and females with 2 vehicles (67, making up 73.8%).
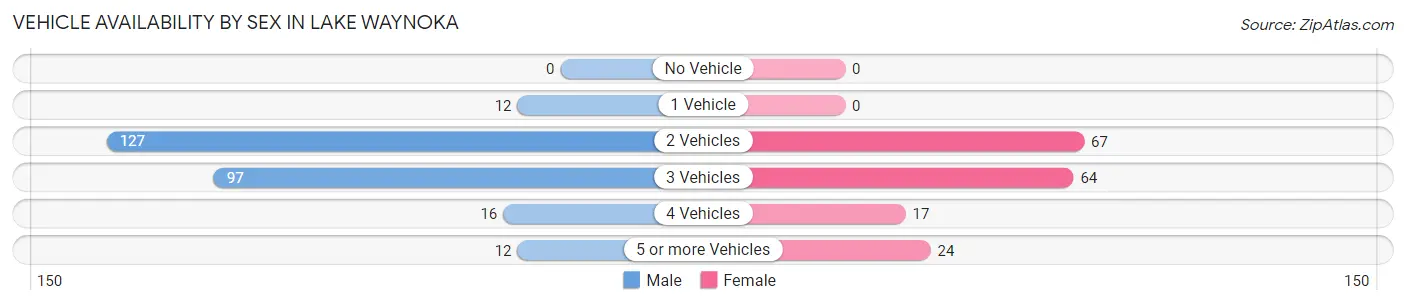
| Vehicles Available | Male | Female |
| No Vehicle | 0 (0.0%) | 0 (0.0%) |
| 1 Vehicle | 12 (4.5%) | 0 (0.0%) |
| 2 Vehicles | 127 (48.1%) | 67 (39.0%) |
| 3 Vehicles | 97 (36.7%) | 64 (37.2%) |
| 4 Vehicles | 16 (6.1%) | 17 (9.9%) |
| 5 or more Vehicles | 12 (4.5%) | 24 (14.0%) |
| Total | 264 (100.0%) | 172 (100.0%) |
Commute Time in Lake Waynoka
The most frequently occuring commute durations in Lake Waynoka are 45 to 59 minutes (174 commuters, 45.4%), 60 to 89 minutes (126 commuters, 32.9%), and 40 to 44 minutes (22 commuters, 5.7%).
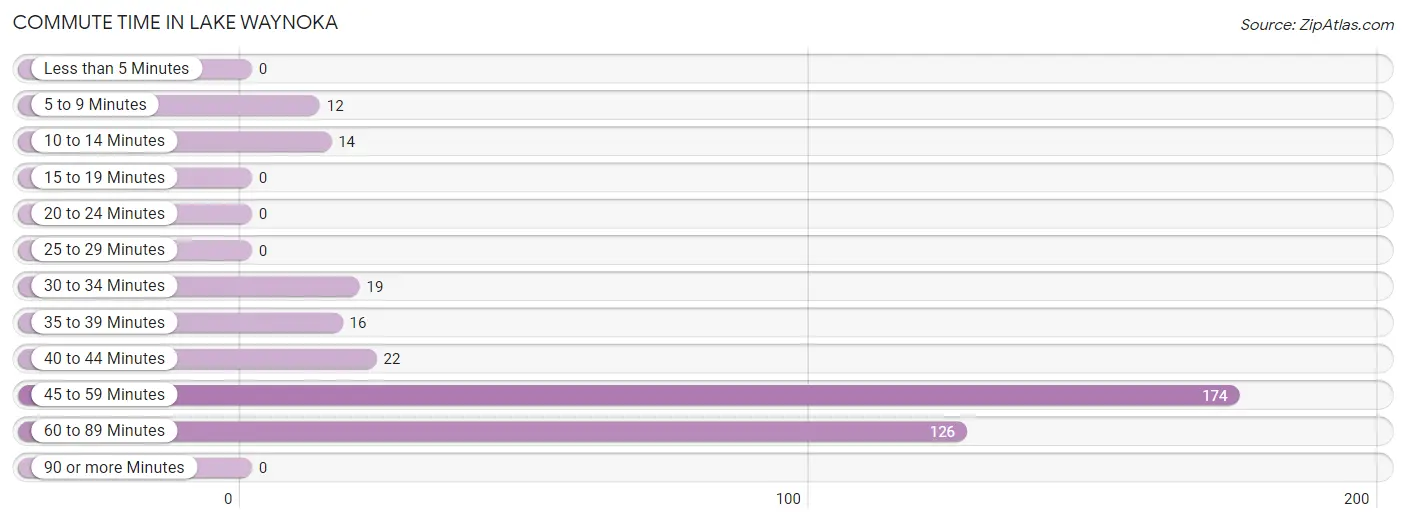
| Commute Time | # Commuters | % Commuters |
| Less than 5 Minutes | 0 | 0.0% |
| 5 to 9 Minutes | 12 | 3.1% |
| 10 to 14 Minutes | 14 | 3.7% |
| 15 to 19 Minutes | 0 | 0.0% |
| 20 to 24 Minutes | 0 | 0.0% |
| 25 to 29 Minutes | 0 | 0.0% |
| 30 to 34 Minutes | 19 | 5.0% |
| 35 to 39 Minutes | 16 | 4.2% |
| 40 to 44 Minutes | 22 | 5.7% |
| 45 to 59 Minutes | 174 | 45.4% |
| 60 to 89 Minutes | 126 | 32.9% |
| 90 or more Minutes | 0 | 0.0% |
Commute Time by Sex in Lake Waynoka
The most common commute times in Lake Waynoka are 45 to 59 minutes (139 commuters, 54.9%) for males and 60 to 89 minutes (38 commuters, 29.2%) for females.
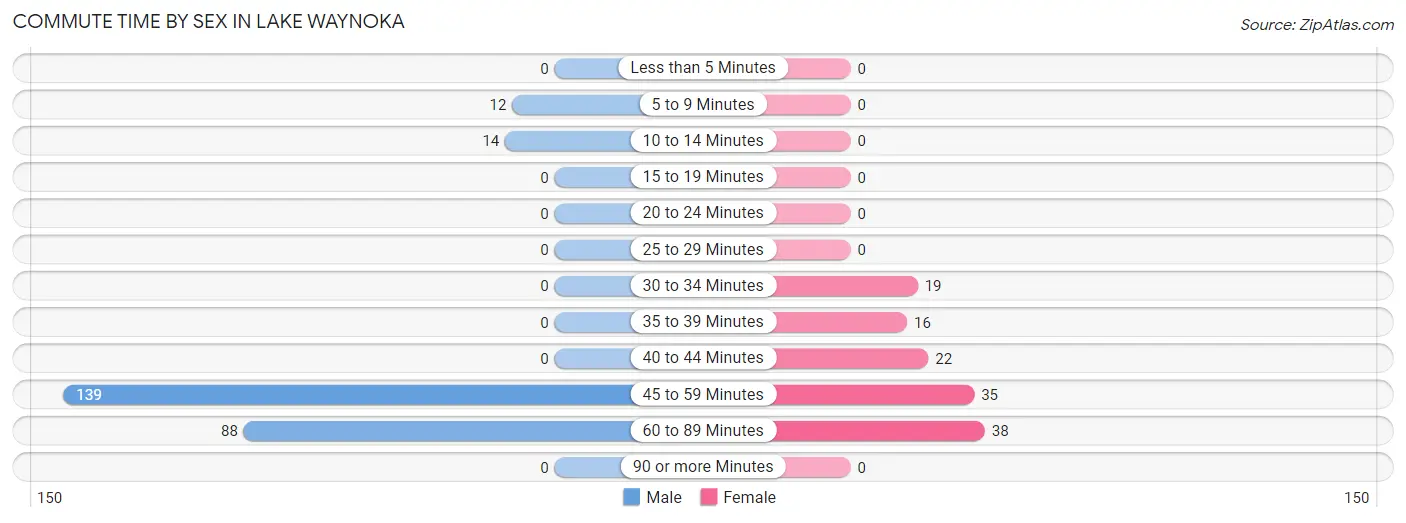
| Commute Time | Male | Female |
| Less than 5 Minutes | 0 (0.0%) | 0 (0.0%) |
| 5 to 9 Minutes | 12 (4.7%) | 0 (0.0%) |
| 10 to 14 Minutes | 14 (5.5%) | 0 (0.0%) |
| 15 to 19 Minutes | 0 (0.0%) | 0 (0.0%) |
| 20 to 24 Minutes | 0 (0.0%) | 0 (0.0%) |
| 25 to 29 Minutes | 0 (0.0%) | 0 (0.0%) |
| 30 to 34 Minutes | 0 (0.0%) | 19 (14.6%) |
| 35 to 39 Minutes | 0 (0.0%) | 16 (12.3%) |
| 40 to 44 Minutes | 0 (0.0%) | 22 (16.9%) |
| 45 to 59 Minutes | 139 (54.9%) | 35 (26.9%) |
| 60 to 89 Minutes | 88 (34.8%) | 38 (29.2%) |
| 90 or more Minutes | 0 (0.0%) | 0 (0.0%) |
Time of Departure to Work by Sex in Lake Waynoka
The most frequent times of departure to work in Lake Waynoka are 12:00 AM to 4:59 AM (70, 27.7%) for males and 6:30 AM to 6:59 AM (36, 27.7%) for females.
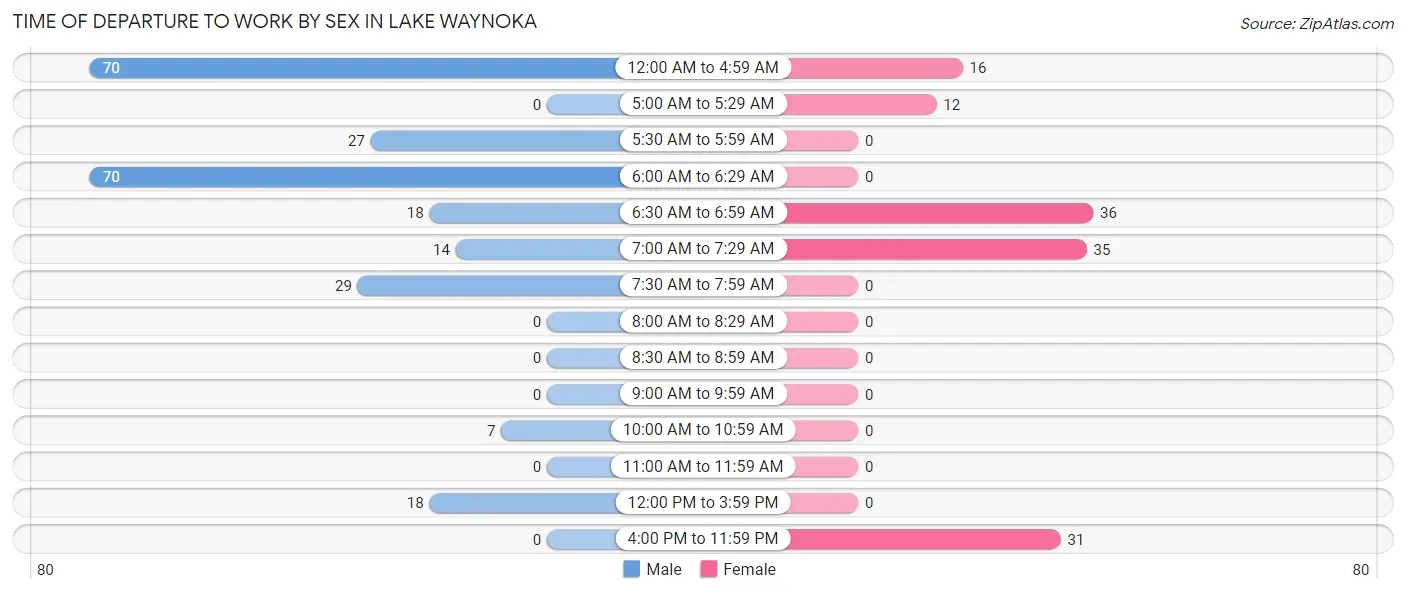
| Time of Departure | Male | Female |
| 12:00 AM to 4:59 AM | 70 (27.7%) | 16 (12.3%) |
| 5:00 AM to 5:29 AM | 0 (0.0%) | 12 (9.2%) |
| 5:30 AM to 5:59 AM | 27 (10.7%) | 0 (0.0%) |
| 6:00 AM to 6:29 AM | 70 (27.7%) | 0 (0.0%) |
| 6:30 AM to 6:59 AM | 18 (7.1%) | 36 (27.7%) |
| 7:00 AM to 7:29 AM | 14 (5.5%) | 35 (26.9%) |
| 7:30 AM to 7:59 AM | 29 (11.5%) | 0 (0.0%) |
| 8:00 AM to 8:29 AM | 0 (0.0%) | 0 (0.0%) |
| 8:30 AM to 8:59 AM | 0 (0.0%) | 0 (0.0%) |
| 9:00 AM to 9:59 AM | 0 (0.0%) | 0 (0.0%) |
| 10:00 AM to 10:59 AM | 7 (2.8%) | 0 (0.0%) |
| 11:00 AM to 11:59 AM | 0 (0.0%) | 0 (0.0%) |
| 12:00 PM to 3:59 PM | 18 (7.1%) | 0 (0.0%) |
| 4:00 PM to 11:59 PM | 0 (0.0%) | 31 (23.8%) |
| Total | 253 (100.0%) | 130 (100.0%) |
Housing Occupancy in Lake Waynoka
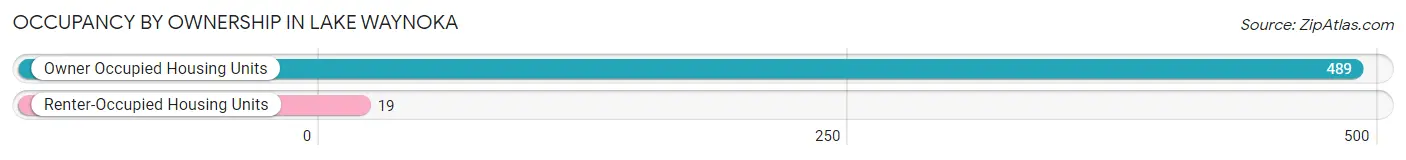
Occupancy by Ownership in Lake Waynoka
Of the total 508 dwellings in Lake Waynoka, owner-occupied units account for 489 (96.3%), while renter-occupied units make up 19 (3.7%).
| Occupancy | # Housing Units | % Housing Units |
| Owner Occupied Housing Units | 489 | 96.3% |
| Renter-Occupied Housing Units | 19 | 3.7% |
| Total Occupied Housing Units | 508 | 100.0% |
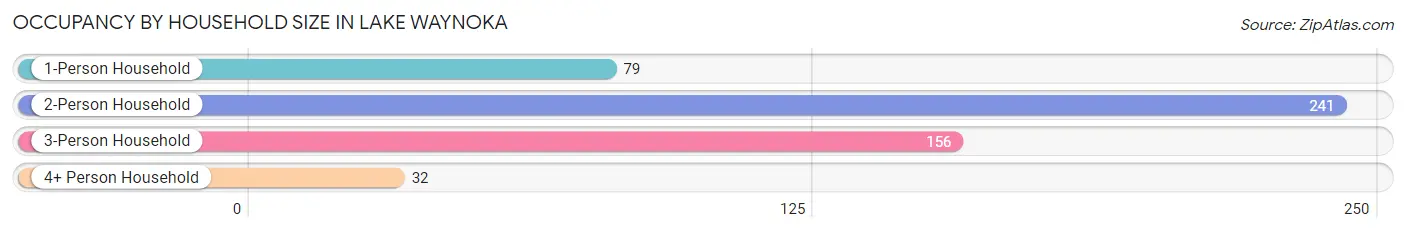
Occupancy by Household Size in Lake Waynoka
| Household Size | # Housing Units | % Housing Units |
| 1-Person Household | 79 | 15.5% |
| 2-Person Household | 241 | 47.4% |
| 3-Person Household | 156 | 30.7% |
| 4+ Person Household | 32 | 6.3% |
| Total Housing Units | 508 | 100.0% |
Occupancy by Ownership by Household Size in Lake Waynoka
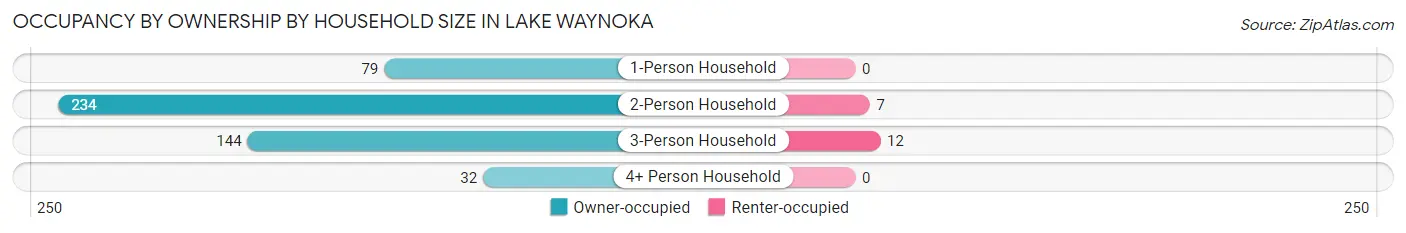
| Household Size | Owner-occupied | Renter-occupied |
| 1-Person Household | 79 (100.0%) | 0 (0.0%) |
| 2-Person Household | 234 (97.1%) | 7 (2.9%) |
| 3-Person Household | 144 (92.3%) | 12 (7.7%) |
| 4+ Person Household | 32 (100.0%) | 0 (0.0%) |
| Total Housing Units | 489 (96.3%) | 19 (3.7%) |
Occupancy by Educational Attainment in Lake Waynoka
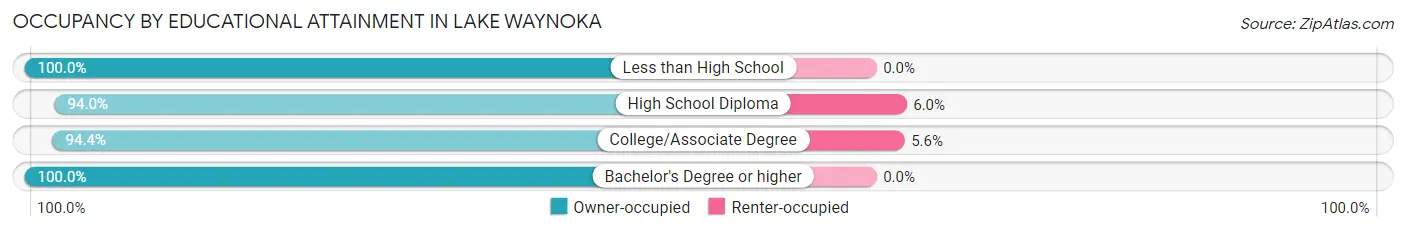
| Household Size | Owner-occupied | Renter-occupied |
| Less than High School | 13 (100.0%) | 0 (0.0%) |
| High School Diploma | 189 (94.0%) | 12 (6.0%) |
| College/Associate Degree | 119 (94.4%) | 7 (5.6%) |
| Bachelor's Degree or higher | 168 (100.0%) | 0 (0.0%) |
Occupancy by Age of Householder in Lake Waynoka
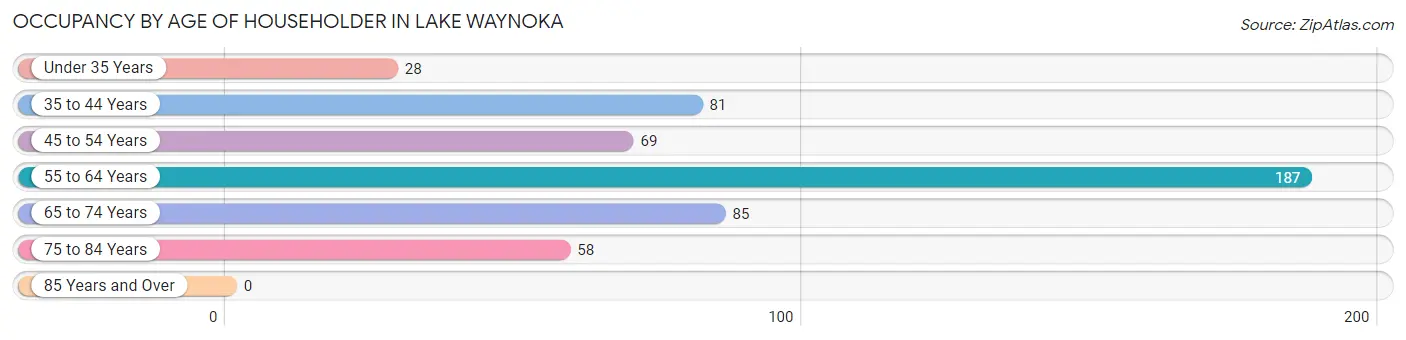
| Age Bracket | # Households | % Households |
| Under 35 Years | 28 | 5.5% |
| 35 to 44 Years | 81 | 15.9% |
| 45 to 54 Years | 69 | 13.6% |
| 55 to 64 Years | 187 | 36.8% |
| 65 to 74 Years | 85 | 16.7% |
| 75 to 84 Years | 58 | 11.4% |
| 85 Years and Over | 0 | 0.0% |
| Total | 508 | 100.0% |
Housing Finances in Lake Waynoka
Median Income by Occupancy in Lake Waynoka
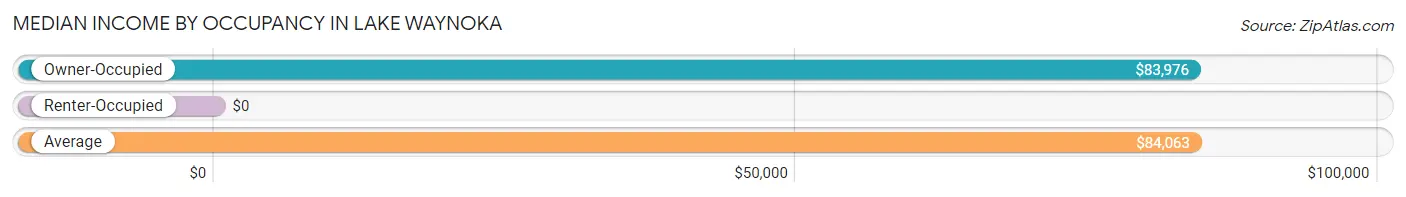
| Occupancy Type | # Households | Median Income |
| Owner-Occupied | 489 (96.3%) | $83,976 |
| Renter-Occupied | 19 (3.7%) | $0 |
| Average | 508 (100.0%) | $84,063 |
Occupancy by Householder Income Bracket in Lake Waynoka
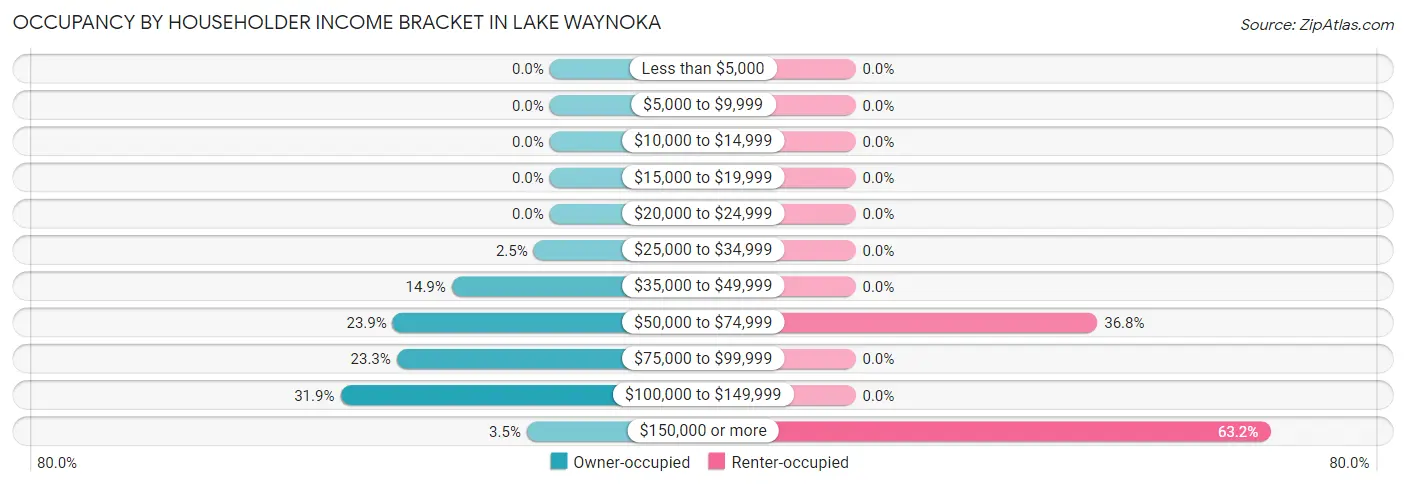
| Income Bracket | Owner-occupied | Renter-occupied |
| Less than $5,000 | 0 (0.0%) | 0 (0.0%) |
| $5,000 to $9,999 | 0 (0.0%) | 0 (0.0%) |
| $10,000 to $14,999 | 0 (0.0%) | 0 (0.0%) |
| $15,000 to $19,999 | 0 (0.0%) | 0 (0.0%) |
| $20,000 to $24,999 | 0 (0.0%) | 0 (0.0%) |
| $25,000 to $34,999 | 12 (2.5%) | 0 (0.0%) |
| $35,000 to $49,999 | 73 (14.9%) | 0 (0.0%) |
| $50,000 to $74,999 | 117 (23.9%) | 7 (36.8%) |
| $75,000 to $99,999 | 114 (23.3%) | 0 (0.0%) |
| $100,000 to $149,999 | 156 (31.9%) | 0 (0.0%) |
| $150,000 or more | 17 (3.5%) | 12 (63.2%) |
| Total | 489 (100.0%) | 19 (100.0%) |
Monthly Housing Cost Tiers in Lake Waynoka
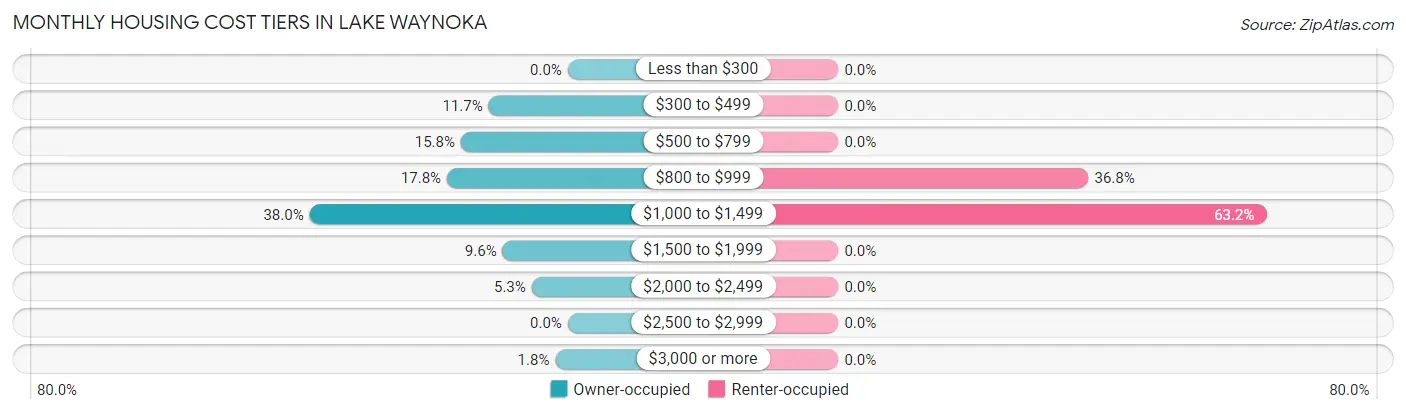
| Monthly Cost | Owner-occupied | Renter-occupied |
| Less than $300 | 0 (0.0%) | 0 (0.0%) |
| $300 to $499 | 57 (11.7%) | 0 (0.0%) |
| $500 to $799 | 77 (15.8%) | 0 (0.0%) |
| $800 to $999 | 87 (17.8%) | 7 (36.8%) |
| $1,000 to $1,499 | 186 (38.0%) | 12 (63.2%) |
| $1,500 to $1,999 | 47 (9.6%) | 0 (0.0%) |
| $2,000 to $2,499 | 26 (5.3%) | 0 (0.0%) |
| $2,500 to $2,999 | 0 (0.0%) | 0 (0.0%) |
| $3,000 or more | 9 (1.8%) | 0 (0.0%) |
| Total | 489 (100.0%) | 19 (100.0%) |
Physical Housing Characteristics in Lake Waynoka
Housing Structures in Lake Waynoka
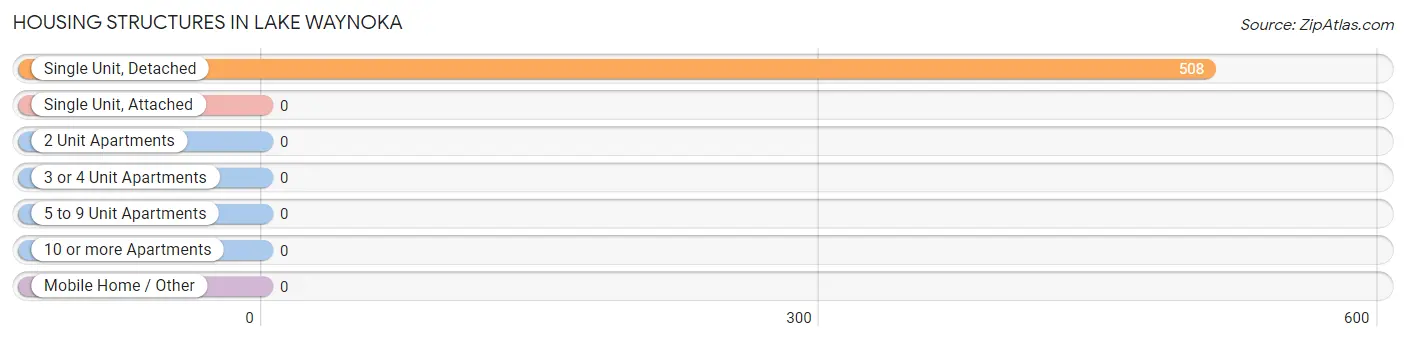
| Structure Type | # Housing Units | % Housing Units |
| Single Unit, Detached | 508 | 100.0% |
| Single Unit, Attached | 0 | 0.0% |
| 2 Unit Apartments | 0 | 0.0% |
| 3 or 4 Unit Apartments | 0 | 0.0% |
| 5 to 9 Unit Apartments | 0 | 0.0% |
| 10 or more Apartments | 0 | 0.0% |
| Mobile Home / Other | 0 | 0.0% |
| Total | 508 | 100.0% |
Housing Structures by Occupancy in Lake Waynoka
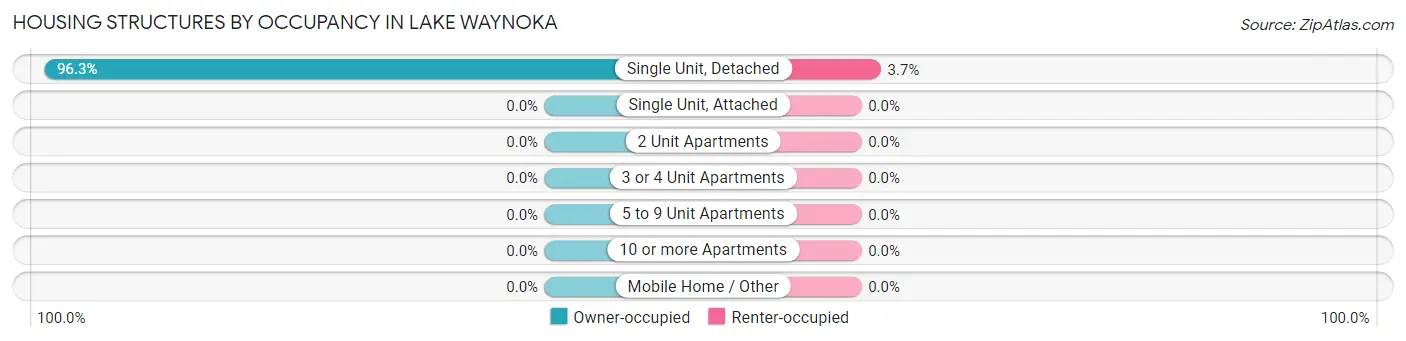
| Structure Type | Owner-occupied | Renter-occupied |
| Single Unit, Detached | 489 (96.3%) | 19 (3.7%) |
| Single Unit, Attached | 0 (0.0%) | 0 (0.0%) |
| 2 Unit Apartments | 0 (0.0%) | 0 (0.0%) |
| 3 or 4 Unit Apartments | 0 (0.0%) | 0 (0.0%) |
| 5 to 9 Unit Apartments | 0 (0.0%) | 0 (0.0%) |
| 10 or more Apartments | 0 (0.0%) | 0 (0.0%) |
| Mobile Home / Other | 0 (0.0%) | 0 (0.0%) |
| Total | 489 (96.3%) | 19 (3.7%) |
Housing Structures by Number of Rooms in Lake Waynoka
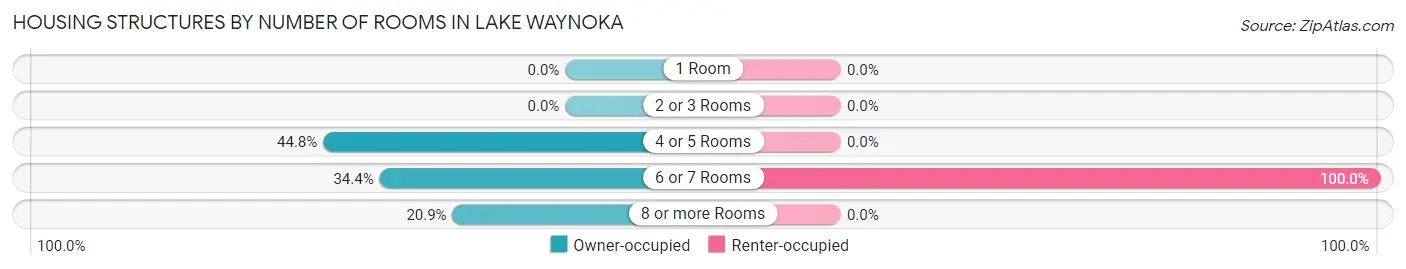
| Number of Rooms | Owner-occupied | Renter-occupied |
| 1 Room | 0 (0.0%) | 0 (0.0%) |
| 2 or 3 Rooms | 0 (0.0%) | 0 (0.0%) |
| 4 or 5 Rooms | 219 (44.8%) | 0 (0.0%) |
| 6 or 7 Rooms | 168 (34.4%) | 19 (100.0%) |
| 8 or more Rooms | 102 (20.9%) | 0 (0.0%) |
| Total | 489 (100.0%) | 19 (100.0%) |
Housing Structure by Heating Type in Lake Waynoka
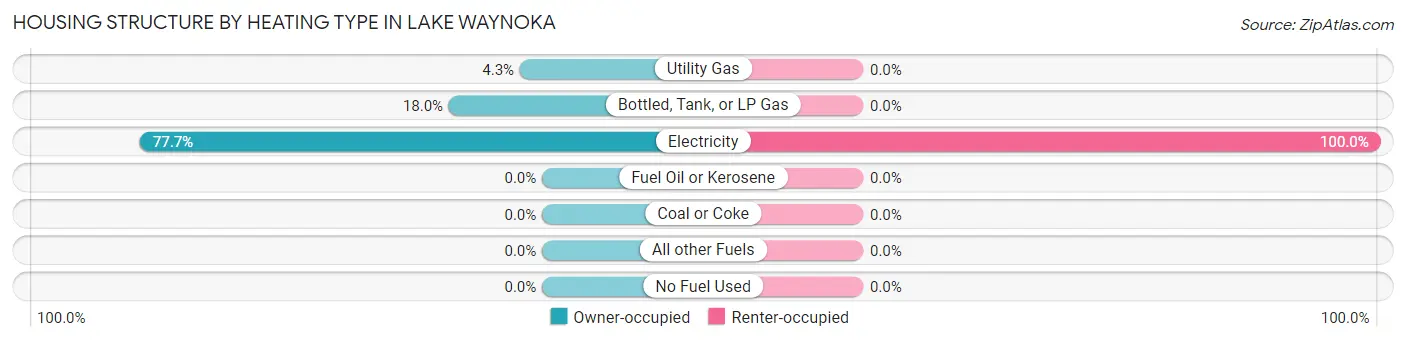
| Heating Type | Owner-occupied | Renter-occupied |
| Utility Gas | 21 (4.3%) | 0 (0.0%) |
| Bottled, Tank, or LP Gas | 88 (18.0%) | 0 (0.0%) |
| Electricity | 380 (77.7%) | 19 (100.0%) |
| Fuel Oil or Kerosene | 0 (0.0%) | 0 (0.0%) |
| Coal or Coke | 0 (0.0%) | 0 (0.0%) |
| All other Fuels | 0 (0.0%) | 0 (0.0%) |
| No Fuel Used | 0 (0.0%) | 0 (0.0%) |
| Total | 489 (100.0%) | 19 (100.0%) |
Household Vehicle Usage in Lake Waynoka
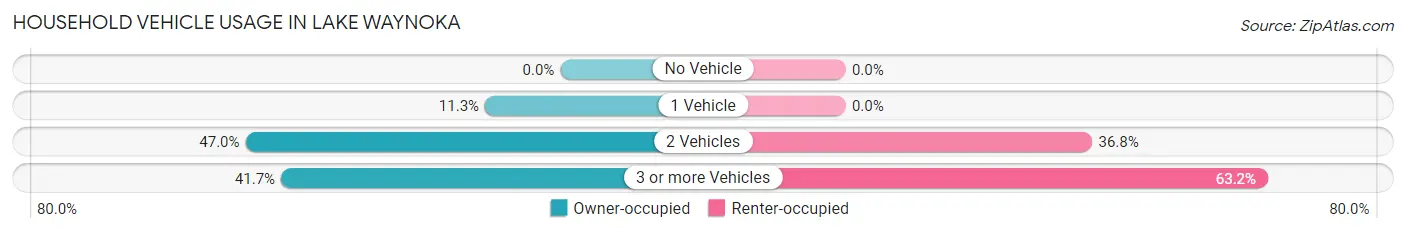
| Vehicles per Household | Owner-occupied | Renter-occupied |
| No Vehicle | 0 (0.0%) | 0 (0.0%) |
| 1 Vehicle | 55 (11.3%) | 0 (0.0%) |
| 2 Vehicles | 230 (47.0%) | 7 (36.8%) |
| 3 or more Vehicles | 204 (41.7%) | 12 (63.2%) |
| Total | 489 (100.0%) | 19 (100.0%) |
Real Estate & Mortgages in Lake Waynoka
Real Estate and Mortgage Overview in Lake Waynoka
| Characteristic | Without Mortgage | With Mortgage |
| Housing Units | 157 | 332 |
| Median Property Value | $217,900 | $234,800 |
| Median Household Income | $57,457 | $17 |
| Monthly Housing Costs | $602 | $9 |
| Real Estate Taxes | $2,090 | $0 |
Property Value by Mortgage Status in Lake Waynoka
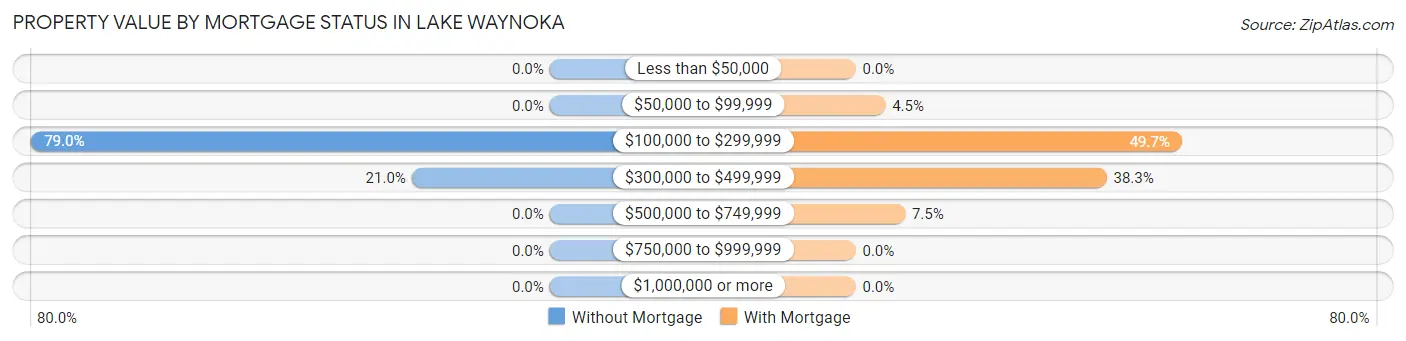
| Property Value | Without Mortgage | With Mortgage |
| Less than $50,000 | 0 (0.0%) | 0 (0.0%) |
| $50,000 to $99,999 | 0 (0.0%) | 15 (4.5%) |
| $100,000 to $299,999 | 124 (79.0%) | 165 (49.7%) |
| $300,000 to $499,999 | 33 (21.0%) | 127 (38.3%) |
| $500,000 to $749,999 | 0 (0.0%) | 25 (7.5%) |
| $750,000 to $999,999 | 0 (0.0%) | 0 (0.0%) |
| $1,000,000 or more | 0 (0.0%) | 0 (0.0%) |
| Total | 157 (100.0%) | 332 (100.0%) |
Household Income by Mortgage Status in Lake Waynoka
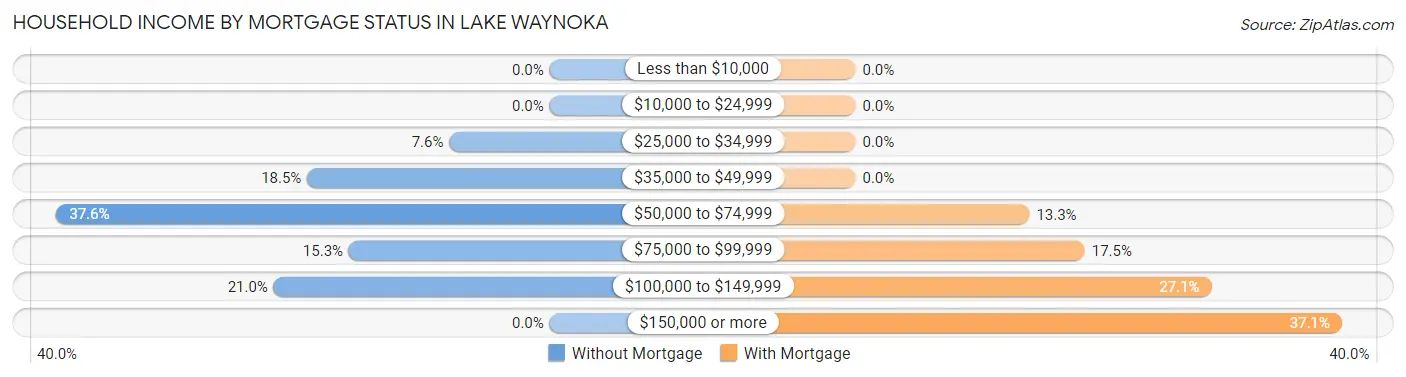
| Household Income | Without Mortgage | With Mortgage |
| Less than $10,000 | 0 (0.0%) | 0 (0.0%) |
| $10,000 to $24,999 | 0 (0.0%) | 0 (0.0%) |
| $25,000 to $34,999 | 12 (7.6%) | 0 (0.0%) |
| $35,000 to $49,999 | 29 (18.5%) | 0 (0.0%) |
| $50,000 to $74,999 | 59 (37.6%) | 44 (13.3%) |
| $75,000 to $99,999 | 24 (15.3%) | 58 (17.5%) |
| $100,000 to $149,999 | 33 (21.0%) | 90 (27.1%) |
| $150,000 or more | 0 (0.0%) | 123 (37.0%) |
| Total | 157 (100.0%) | 332 (100.0%) |
Property Value to Household Income Ratio in Lake Waynoka
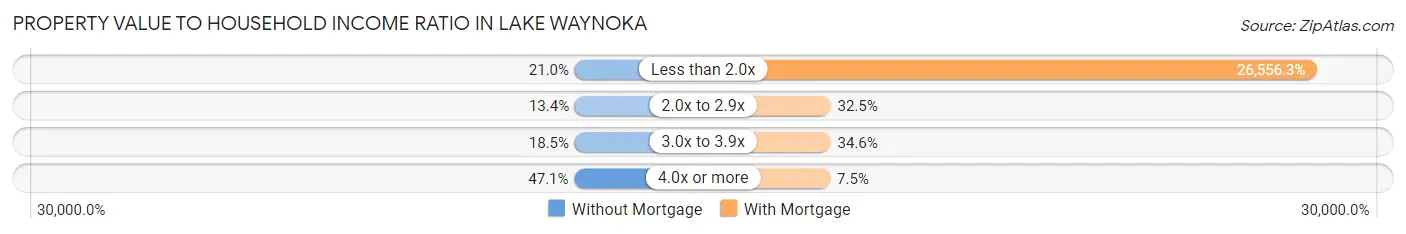
| Value-to-Income Ratio | Without Mortgage | With Mortgage |
| Less than 2.0x | 33 (21.0%) | 88,167 (26,556.3%) |
| 2.0x to 2.9x | 21 (13.4%) | 108 (32.5%) |
| 3.0x to 3.9x | 29 (18.5%) | 115 (34.6%) |
| 4.0x or more | 74 (47.1%) | 25 (7.5%) |
| Total | 157 (100.0%) | 332 (100.0%) |
Real Estate Taxes by Mortgage Status in Lake Waynoka
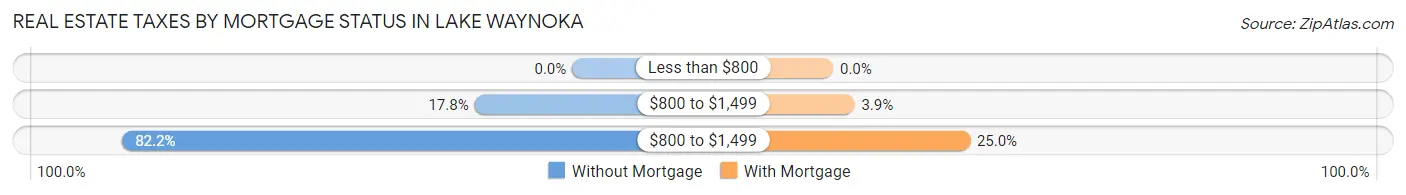
| Property Taxes | Without Mortgage | With Mortgage |
| Less than $800 | 0 (0.0%) | 0 (0.0%) |
| $800 to $1,499 | 28 (17.8%) | 13 (3.9%) |
| $800 to $1,499 | 129 (82.2%) | 83 (25.0%) |
| Total | 157 (100.0%) | 332 (100.0%) |
Health & Disability in Lake Waynoka
Health Insurance Coverage by Age in Lake Waynoka
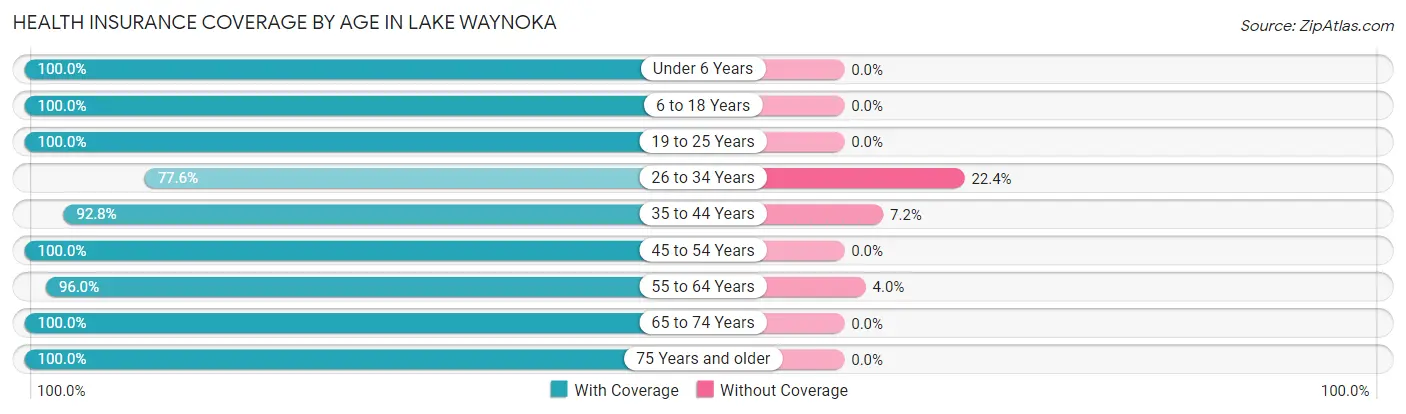
| Age Bracket | With Coverage | Without Coverage |
| Under 6 Years | 30 (100.0%) | 0 (0.0%) |
| 6 to 18 Years | 114 (100.0%) | 0 (0.0%) |
| 19 to 25 Years | 51 (100.0%) | 0 (0.0%) |
| 26 to 34 Years | 45 (77.6%) | 13 (22.4%) |
| 35 to 44 Years | 154 (92.8%) | 12 (7.2%) |
| 45 to 54 Years | 103 (100.0%) | 0 (0.0%) |
| 55 to 64 Years | 290 (96.0%) | 12 (4.0%) |
| 65 to 74 Years | 188 (100.0%) | 0 (0.0%) |
| 75 Years and older | 91 (100.0%) | 0 (0.0%) |
| Total | 1,066 (96.7%) | 37 (3.4%) |
Health Insurance Coverage by Citizenship Status in Lake Waynoka
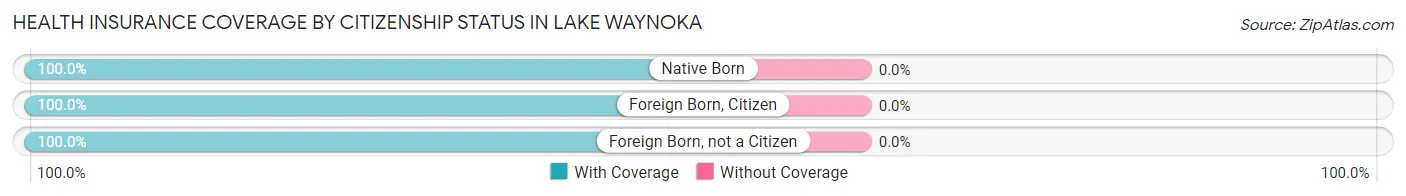
| Citizenship Status | With Coverage | Without Coverage |
| Native Born | 30 (100.0%) | 0 (0.0%) |
| Foreign Born, Citizen | 114 (100.0%) | 0 (0.0%) |
| Foreign Born, not a Citizen | 51 (100.0%) | 0 (0.0%) |
Health Insurance Coverage by Household Income in Lake Waynoka
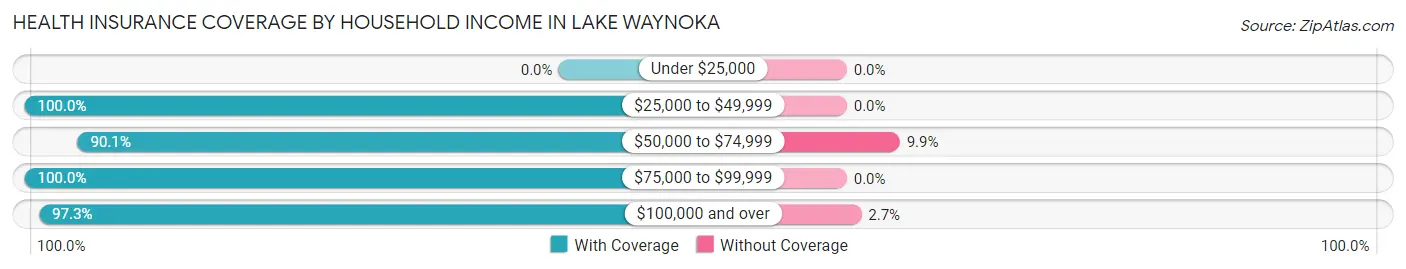
| Household Income | With Coverage | Without Coverage |
| Under $25,000 | 0 (0.0%) | 0 (0.0%) |
| $25,000 to $49,999 | 151 (100.0%) | 0 (0.0%) |
| $50,000 to $74,999 | 227 (90.1%) | 25 (9.9%) |
| $75,000 to $99,999 | 261 (100.0%) | 0 (0.0%) |
| $100,000 and over | 427 (97.3%) | 12 (2.7%) |
Public vs Private Health Insurance Coverage by Age in Lake Waynoka
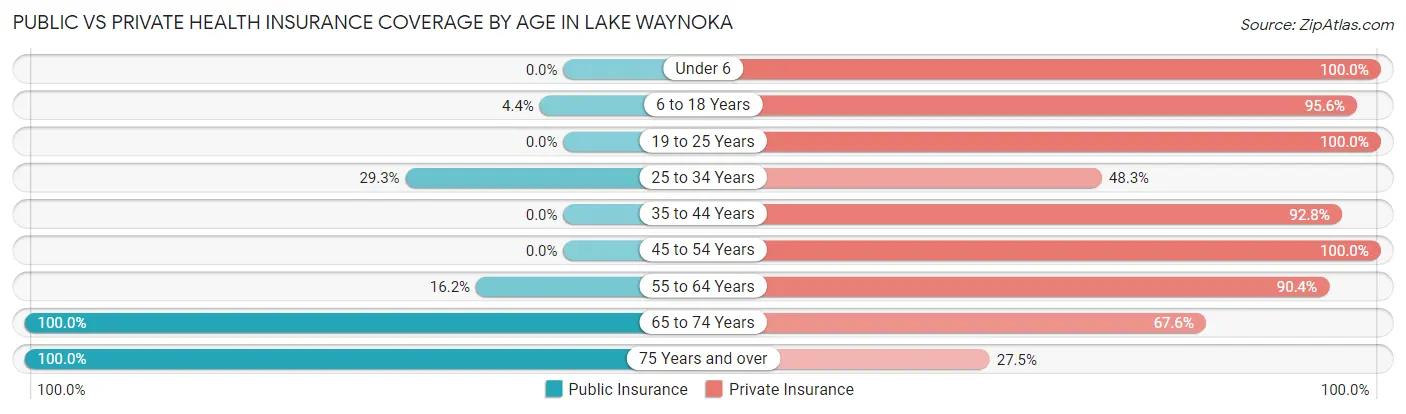
| Age Bracket | Public Insurance | Private Insurance |
| Under 6 | 0 (0.0%) | 30 (100.0%) |
| 6 to 18 Years | 5 (4.4%) | 109 (95.6%) |
| 19 to 25 Years | 0 (0.0%) | 51 (100.0%) |
| 25 to 34 Years | 17 (29.3%) | 28 (48.3%) |
| 35 to 44 Years | 0 (0.0%) | 154 (92.8%) |
| 45 to 54 Years | 0 (0.0%) | 103 (100.0%) |
| 55 to 64 Years | 49 (16.2%) | 273 (90.4%) |
| 65 to 74 Years | 188 (100.0%) | 127 (67.5%) |
| 75 Years and over | 91 (100.0%) | 25 (27.5%) |
| Total | 350 (31.7%) | 900 (81.6%) |
Disability Status by Sex by Age in Lake Waynoka
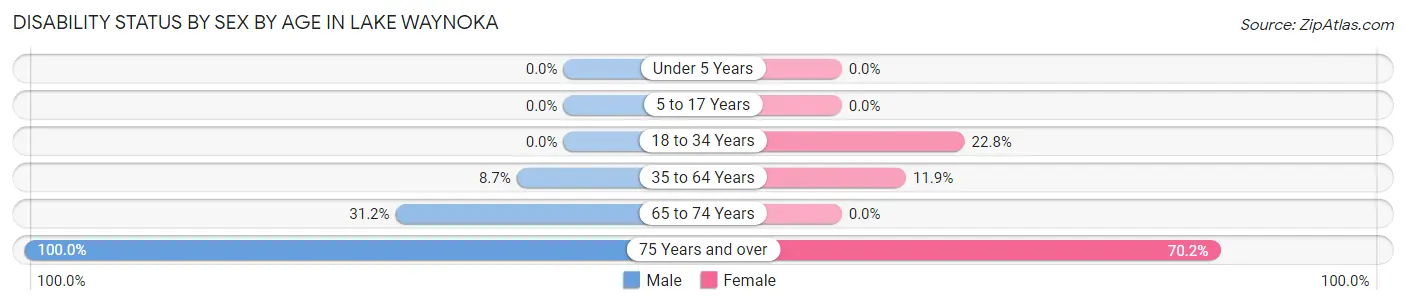
| Age Bracket | Male | Female |
| Under 5 Years | 0 (0.0%) | 0 (0.0%) |
| 5 to 17 Years | 0 (0.0%) | 0 (0.0%) |
| 18 to 34 Years | 0 (0.0%) | 13 (22.8%) |
| 35 to 64 Years | 27 (8.7%) | 31 (11.9%) |
| 65 to 74 Years | 29 (31.2%) | 0 (0.0%) |
| 75 Years and over | 44 (100.0%) | 33 (70.2%) |
Disability Class by Sex by Age in Lake Waynoka
Disability Class: Hearing Difficulty
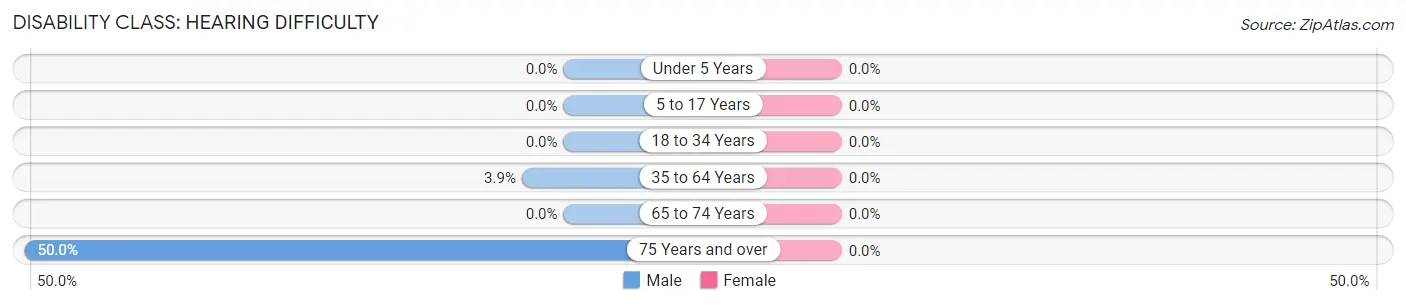
| Age Bracket | Male | Female |
| Under 5 Years | 0 (0.0%) | 0 (0.0%) |
| 5 to 17 Years | 0 (0.0%) | 0 (0.0%) |
| 18 to 34 Years | 0 (0.0%) | 0 (0.0%) |
| 35 to 64 Years | 12 (3.9%) | 0 (0.0%) |
| 65 to 74 Years | 0 (0.0%) | 0 (0.0%) |
| 75 Years and over | 22 (50.0%) | 0 (0.0%) |
Disability Class: Vision Difficulty
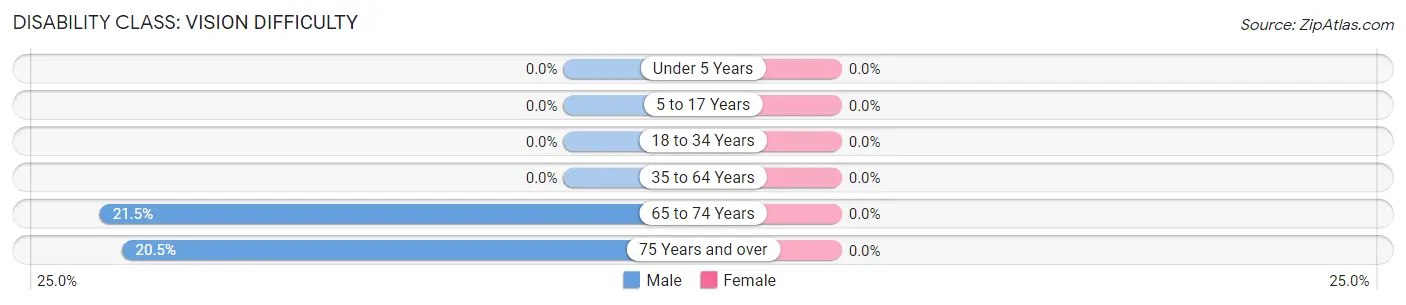
| Age Bracket | Male | Female |
| Under 5 Years | 0 (0.0%) | 0 (0.0%) |
| 5 to 17 Years | 0 (0.0%) | 0 (0.0%) |
| 18 to 34 Years | 0 (0.0%) | 0 (0.0%) |
| 35 to 64 Years | 0 (0.0%) | 0 (0.0%) |
| 65 to 74 Years | 20 (21.5%) | 0 (0.0%) |
| 75 Years and over | 9 (20.4%) | 0 (0.0%) |
Disability Class: Cognitive Difficulty
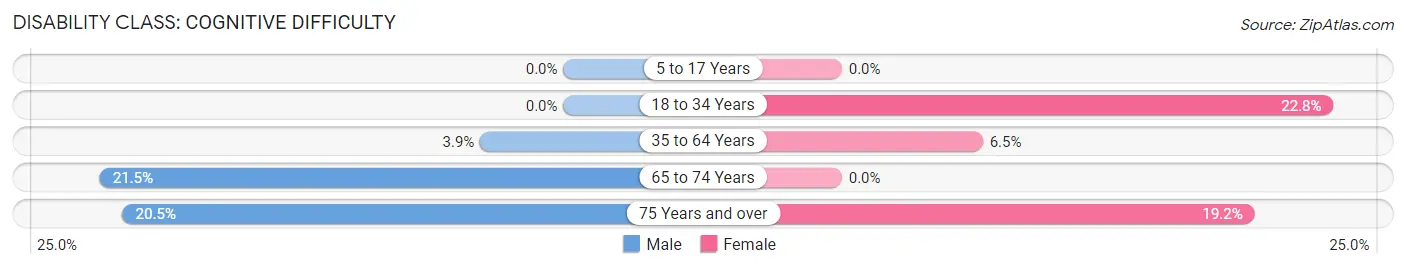
| Age Bracket | Male | Female |
| 5 to 17 Years | 0 (0.0%) | 0 (0.0%) |
| 18 to 34 Years | 0 (0.0%) | 13 (22.8%) |
| 35 to 64 Years | 12 (3.9%) | 17 (6.5%) |
| 65 to 74 Years | 20 (21.5%) | 0 (0.0%) |
| 75 Years and over | 9 (20.4%) | 9 (19.2%) |
Disability Class: Ambulatory Difficulty
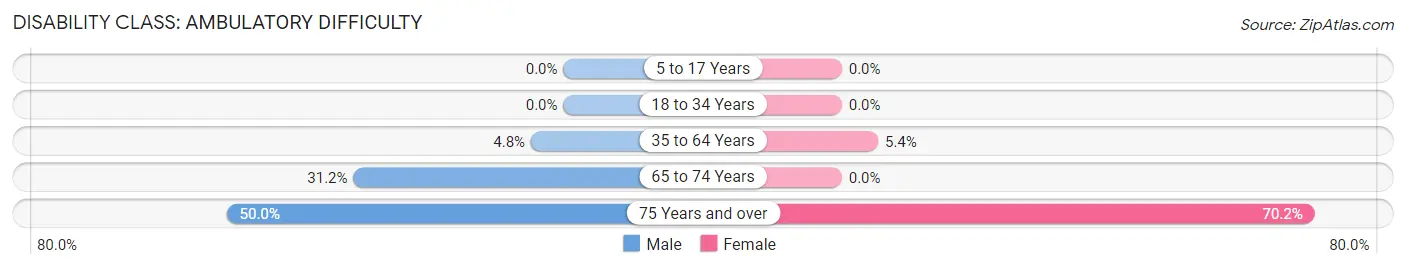
| Age Bracket | Male | Female |
| 5 to 17 Years | 0 (0.0%) | 0 (0.0%) |
| 18 to 34 Years | 0 (0.0%) | 0 (0.0%) |
| 35 to 64 Years | 15 (4.8%) | 14 (5.4%) |
| 65 to 74 Years | 29 (31.2%) | 0 (0.0%) |
| 75 Years and over | 22 (50.0%) | 33 (70.2%) |
Disability Class: Self-Care Difficulty
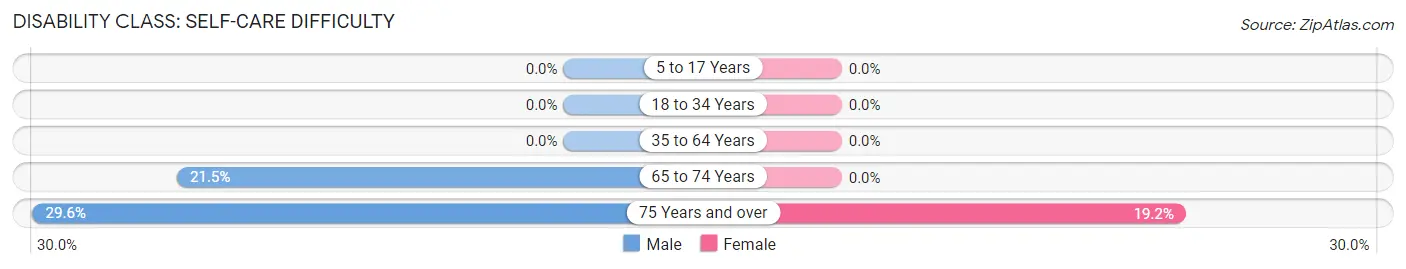
| Age Bracket | Male | Female |
| 5 to 17 Years | 0 (0.0%) | 0 (0.0%) |
| 18 to 34 Years | 0 (0.0%) | 0 (0.0%) |
| 35 to 64 Years | 0 (0.0%) | 0 (0.0%) |
| 65 to 74 Years | 20 (21.5%) | 0 (0.0%) |
| 75 Years and over | 13 (29.5%) | 9 (19.2%) |
Technology Access in Lake Waynoka
Computing Device Access in Lake Waynoka
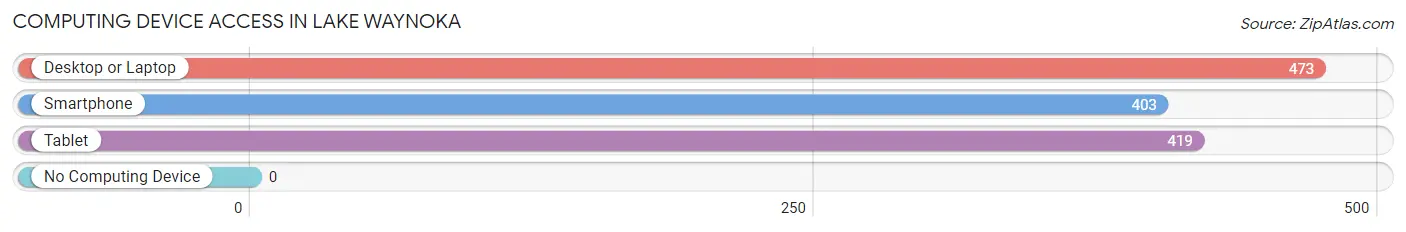
| Device Type | # Households | % Households |
| Desktop or Laptop | 473 | 93.1% |
| Smartphone | 403 | 79.3% |
| Tablet | 419 | 82.5% |
| No Computing Device | 0 | 0.0% |
| Total | 508 | 100.0% |
Internet Access in Lake Waynoka
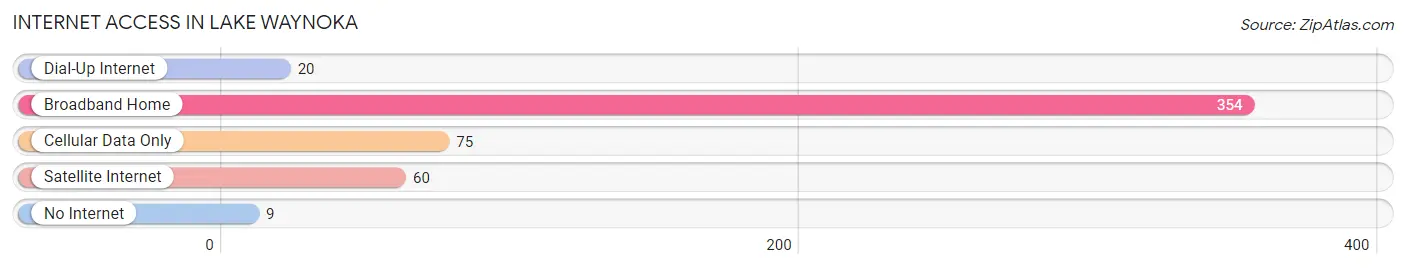
| Internet Type | # Households | % Households |
| Dial-Up Internet | 20 | 3.9% |
| Broadband Home | 354 | 69.7% |
| Cellular Data Only | 75 | 14.8% |
| Satellite Internet | 60 | 11.8% |
| No Internet | 9 | 1.8% |
| Total | 508 | 100.0% |
Lake Waynoka Summary
Waynoka, Ohio is a small village located in Brown County, Ohio. It is situated on the banks of Lake Waynoka, a man-made lake created in the 1950s. The village is home to approximately 1,000 people and is a popular destination for fishing, boating, and other outdoor activities.
History
Waynoka was founded in 1845 by a group of settlers from Kentucky. The village was named after Chief Waynoka, a Shawnee leader who lived in the area. The settlers built a log cabin and a small store, and the village quickly grew. By the late 1800s, Waynoka had become a thriving community with a post office, a school, and several businesses.
In the 1950s, the Army Corps of Engineers built a dam on the Little Miami River, creating Lake Waynoka. The lake quickly became a popular destination for fishing, boating, and other outdoor activities. In the 1960s, the village was incorporated and the population began to grow.
Geography
Waynoka is located in Brown County, Ohio, about 40 miles east of Cincinnati. The village is situated on the banks of Lake Waynoka, a man-made lake created in the 1950s. The lake covers an area of approximately 1,000 acres and is a popular destination for fishing, boating, and other outdoor activities.
The village is surrounded by rolling hills and farmland. The climate is humid continental, with hot summers and cold winters. The average annual temperature is around 50 degrees Fahrenheit.
Economy
The economy of Waynoka is largely based on tourism. The village is a popular destination for fishing, boating, and other outdoor activities. There are several marinas and boat rental businesses in the area.
In addition, the village is home to several small businesses, including a grocery store, a hardware store, and a few restaurants. The village also has a post office and a bank.
Demographics
As of the 2010 census, the population of Waynoka was 1,000. The racial makeup of the village was 97.2% White, 0.7% African American, 0.2% Native American, 0.2% Asian, and 1.7% from other races.
The median household income in Waynoka was $41,250, and the median family income was $45,000. The per capita income was $19,000. About 8.7% of the population was below the poverty line.
Conclusion
Waynoka, Ohio is a small village located in Brown County, Ohio. It is situated on the banks of Lake Waynoka, a man-made lake created in the 1950s. The village is home to approximately 1,000 people and is a popular destination for fishing, boating, and other outdoor activities. The economy of Waynoka is largely based on tourism, and the village is home to several small businesses. The population of Waynoka is predominantly White, with a median household income of $41,250.
Common Questions
What is Per Capita Income in Lake Waynoka?
Per Capita income in Lake Waynoka is $41,596.
What is the Median Family Income in Lake Waynoka?
Median Family Income in Lake Waynoka is $84,707.
What is the Median Household income in Lake Waynoka?
Median Household Income in Lake Waynoka is $84,063.
What is Income or Wage Gap in Lake Waynoka?
Income or Wage Gap in Lake Waynoka is 67.8%.
Women in Lake Waynoka earn 32.2 cents for every dollar earned by a man.
What is Inequality or Gini Index in Lake Waynoka?
Inequality or Gini Index in Lake Waynoka is 0.26.
What is the Total Population of Lake Waynoka?
Total Population of Lake Waynoka is 1,103.
What is the Total Male Population of Lake Waynoka?
Total Male Population of Lake Waynoka is 558.
What is the Total Female Population of Lake Waynoka?
Total Female Population of Lake Waynoka is 545.
What is the Ratio of Males per 100 Females in Lake Waynoka?
There are 102.39 Males per 100 Females in Lake Waynoka.
What is the Ratio of Females per 100 Males in Lake Waynoka?
There are 97.67 Females per 100 Males in Lake Waynoka.
What is the Median Population Age in Lake Waynoka?
Median Population Age in Lake Waynoka is 55.9 Years.
What is the Average Family Size in Lake Waynoka
Average Family Size in Lake Waynoka is 2.4 People.
What is the Average Household Size in Lake Waynoka
Average Household Size in Lake Waynoka is 2.2 People.
How Large is the Labor Force in Lake Waynoka?
There are 501 People in the Labor Forcein in Lake Waynoka.
What is the Percentage of People in the Labor Force in Lake Waynoka?
51.4% of People are in the Labor Force in Lake Waynoka.
What is the Unemployment Rate in Lake Waynoka?
Unemployment Rate in Lake Waynoka is 2.6%.