Sherwood, OH Map & Demographics
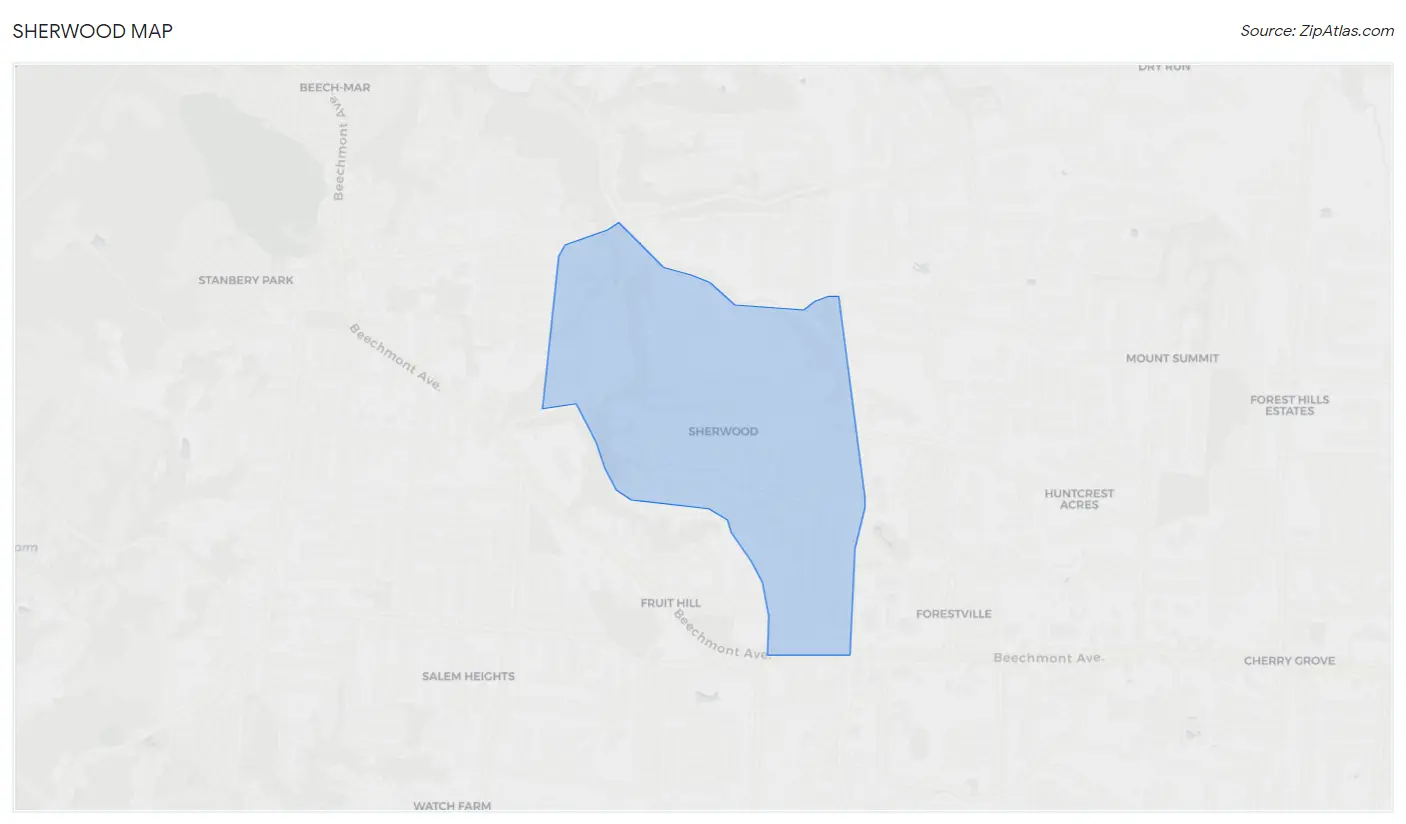
Sherwood Map
Sherwood Overview
$58,586
PER CAPITA INCOME
$149,965
AVG FAMILY INCOME
$140,788
AVG HOUSEHOLD INCOME
39.3%
WAGE / INCOME GAP [ % ]
60.7¢/ $1
WAGE / INCOME GAP [ $ ]
0.37
INEQUALITY / GINI INDEX
3,408
TOTAL POPULATION
1,442
MALE POPULATION
1,966
FEMALE POPULATION
73.35
MALES / 100 FEMALES
136.34
FEMALES / 100 MALES
47.1
MEDIAN AGE
2.8
AVG FAMILY SIZE
2.5
AVG HOUSEHOLD SIZE
1,934
LABOR FORCE [ PEOPLE ]
72.7%
PERCENT IN LABOR FORCE
5.1%
UNEMPLOYMENT RATE
Sherwood Zip Codes
Sherwood Area Codes
Income in Sherwood
Income Overview in Sherwood
Per Capita Income in Sherwood is $58,586, while median incomes of families and households are $149,965 and $140,788 respectively.
| Characteristic | Number | Measure |
| Per Capita Income | 3,408 | $58,586 |
| Median Family Income | 1,088 | $149,965 |
| Mean Family Income | 1,088 | $165,647 |
| Median Household Income | 1,393 | $140,788 |
| Mean Household Income | 1,393 | $143,415 |
| Income Deficit | 1,088 | $0 |
| Wage / Income Gap (%) | 3,408 | 39.33% |
| Wage / Income Gap ($) | 3,408 | 60.67¢ per $1 |
| Gini / Inequality Index | 3,408 | 0.37 |
Earnings by Sex in Sherwood
Average Earnings in Sherwood are $65,854, $84,647 for men and $51,357 for women, a difference of 39.3%.
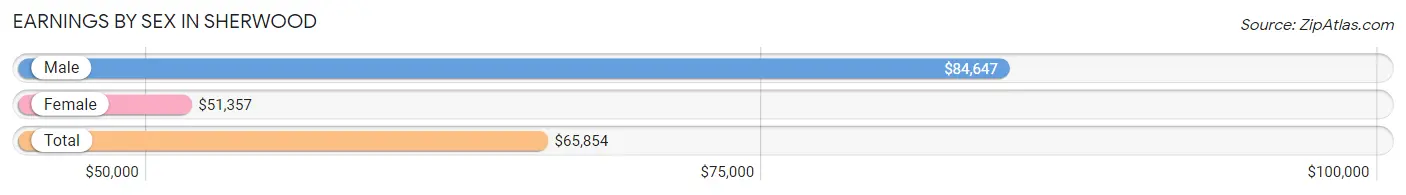
| Sex | Number | Average Earnings |
| Male | 851 (41.4%) | $84,647 |
| Female | 1,203 (58.6%) | $51,357 |
| Total | 2,054 (100.0%) | $65,854 |
Earnings by Sex by Income Bracket in Sherwood
The most common earnings brackets in Sherwood are $100,000+ for men (380 | 44.7%) and $100,000+ for women (317 | 26.4%).
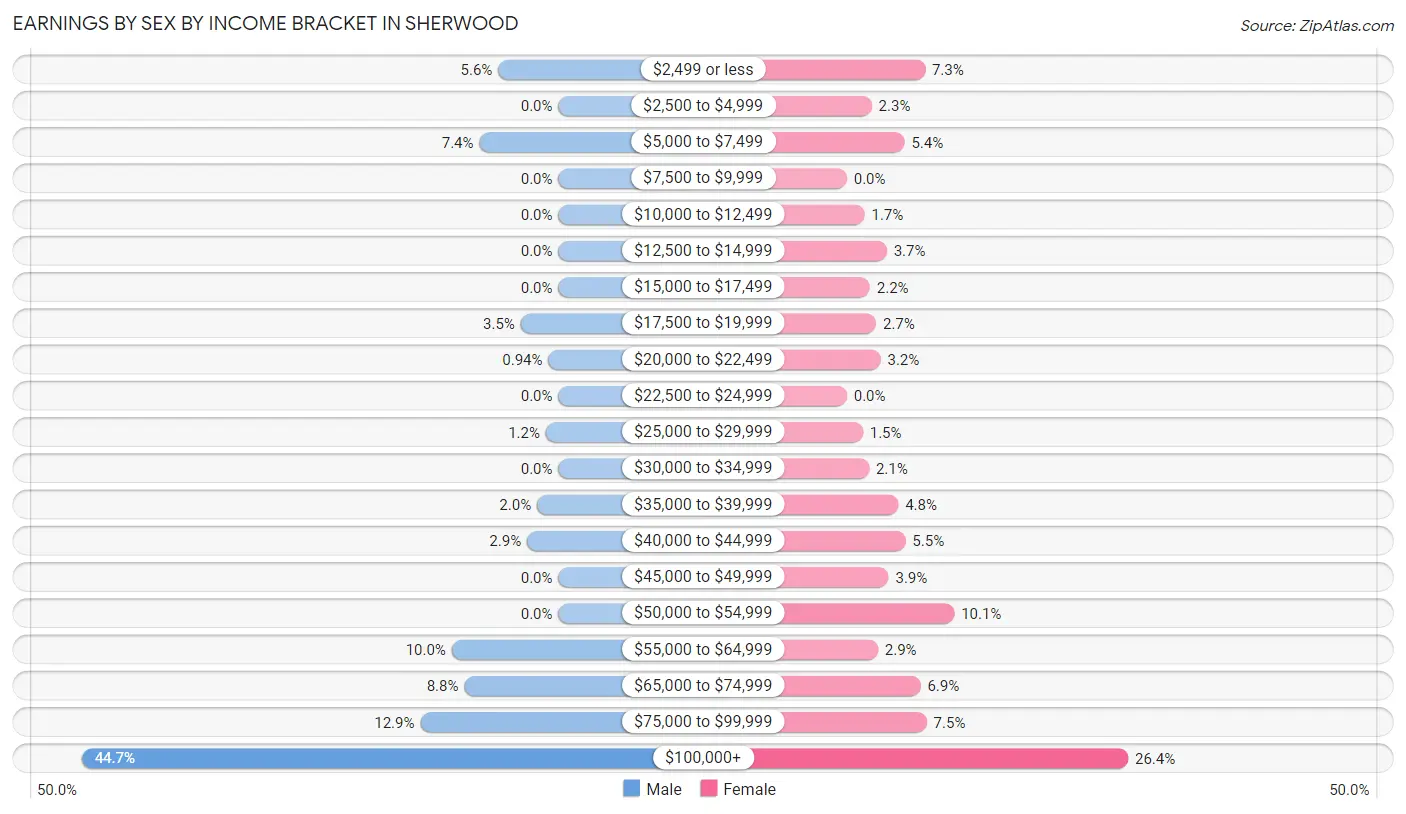
| Income | Male | Female |
| $2,499 or less | 48 (5.6%) | 88 (7.3%) |
| $2,500 to $4,999 | 0 (0.0%) | 28 (2.3%) |
| $5,000 to $7,499 | 63 (7.4%) | 65 (5.4%) |
| $7,500 to $9,999 | 0 (0.0%) | 0 (0.0%) |
| $10,000 to $12,499 | 0 (0.0%) | 20 (1.7%) |
| $12,500 to $14,999 | 0 (0.0%) | 45 (3.7%) |
| $15,000 to $17,499 | 0 (0.0%) | 26 (2.2%) |
| $17,500 to $19,999 | 30 (3.5%) | 33 (2.7%) |
| $20,000 to $22,499 | 8 (0.9%) | 38 (3.2%) |
| $22,500 to $24,999 | 0 (0.0%) | 0 (0.0%) |
| $25,000 to $29,999 | 10 (1.2%) | 18 (1.5%) |
| $30,000 to $34,999 | 0 (0.0%) | 25 (2.1%) |
| $35,000 to $39,999 | 17 (2.0%) | 58 (4.8%) |
| $40,000 to $44,999 | 25 (2.9%) | 66 (5.5%) |
| $45,000 to $49,999 | 0 (0.0%) | 47 (3.9%) |
| $50,000 to $54,999 | 0 (0.0%) | 121 (10.1%) |
| $55,000 to $64,999 | 85 (10.0%) | 35 (2.9%) |
| $65,000 to $74,999 | 75 (8.8%) | 83 (6.9%) |
| $75,000 to $99,999 | 110 (12.9%) | 90 (7.5%) |
| $100,000+ | 380 (44.7%) | 317 (26.4%) |
| Total | 851 (100.0%) | 1,203 (100.0%) |
Earnings by Sex by Educational Attainment in Sherwood
Average earnings in Sherwood are $101,450 for men and $53,109 for women, a difference of 47.6%. Men with an educational attainment of bachelor's degree enjoy the highest average annual earnings of $128,500, while those with high school diploma education earn the least with $66,731. Women with an educational attainment of graduate degree earn the most with the average annual earnings of $68,421, while those with college or associate's degree education have the smallest earnings of $42,794.
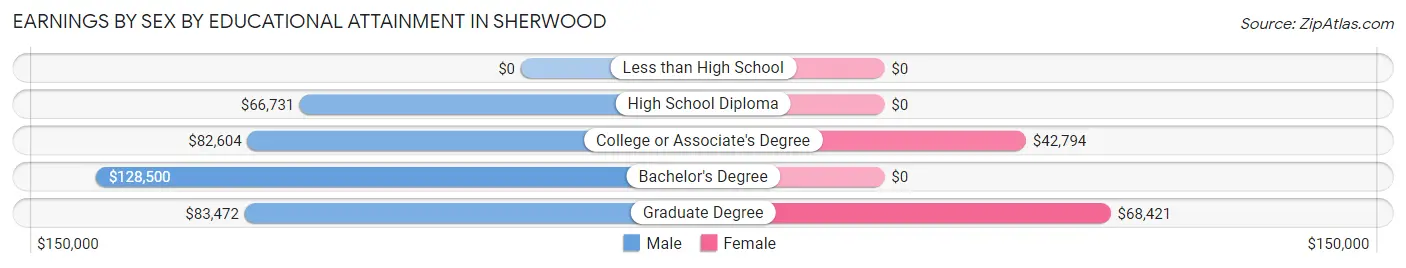
| Educational Attainment | Male Income | Female Income |
| Less than High School | - | - |
| High School Diploma | $66,731 | $0 |
| College or Associate's Degree | $82,604 | $42,794 |
| Bachelor's Degree | $128,500 | $0 |
| Graduate Degree | $83,472 | $68,421 |
| Total | $101,450 | $53,109 |
Family Income in Sherwood
Family Income Brackets in Sherwood
According to the Sherwood family income data, there are 341 families falling into the $150,000 to $199,999 income range, which is the most common income bracket and makes up 31.3% of all families.
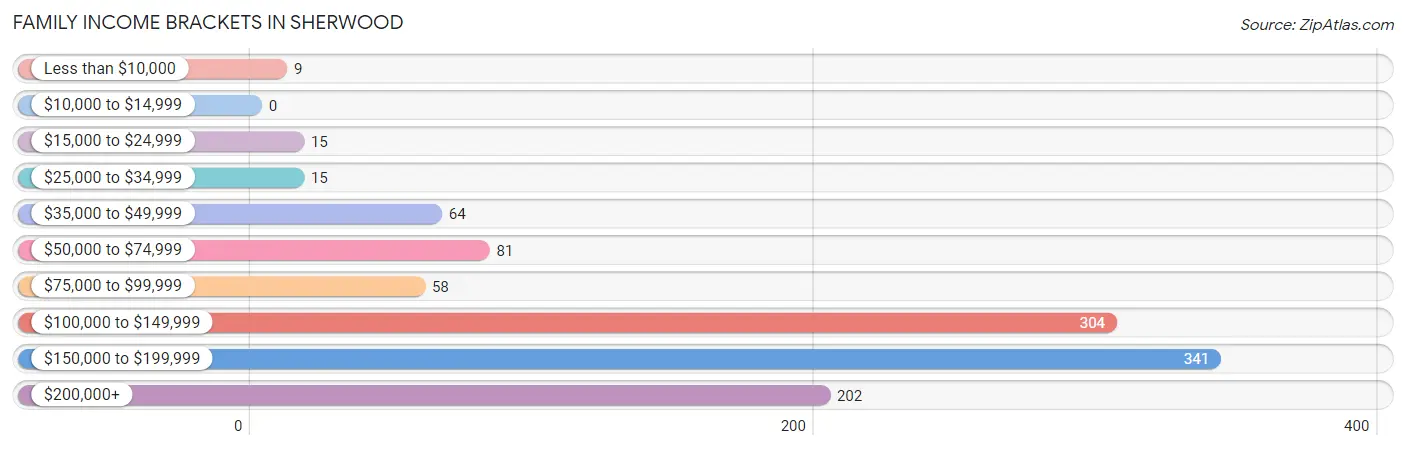
| Income Bracket | # Families | % Families |
| Less than $10,000 | 9 | 0.8% |
| $10,000 to $14,999 | 0 | 0.0% |
| $15,000 to $24,999 | 15 | 1.4% |
| $25,000 to $34,999 | 15 | 1.4% |
| $35,000 to $49,999 | 64 | 5.9% |
| $50,000 to $74,999 | 81 | 7.4% |
| $75,000 to $99,999 | 58 | 5.3% |
| $100,000 to $149,999 | 304 | 27.9% |
| $150,000 to $199,999 | 341 | 31.3% |
| $200,000+ | 202 | 18.6% |
Family Income by Famaliy Size in Sherwood
4-person families (249 | 22.9%) account for the highest median family income in Sherwood with $181,108 per family, while 2-person families (582 | 53.5%) have the highest median income of $74,870 per family member.
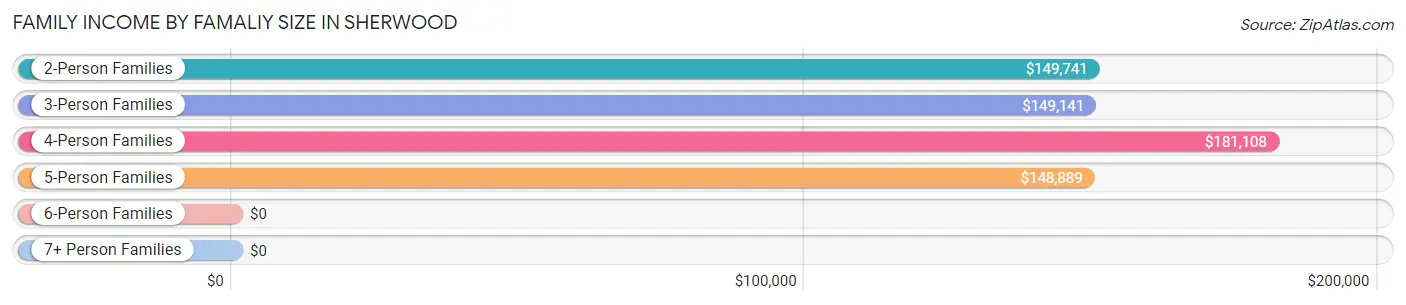
| Income Bracket | # Families | Median Income |
| 2-Person Families | 582 (53.5%) | $149,741 |
| 3-Person Families | 199 (18.3%) | $149,141 |
| 4-Person Families | 249 (22.9%) | $181,108 |
| 5-Person Families | 58 (5.3%) | $148,889 |
| 6-Person Families | 0 (0.0%) | $0 |
| 7+ Person Families | 0 (0.0%) | $0 |
| Total | 1,088 (100.0%) | $149,965 |
Family Income by Number of Earners in Sherwood
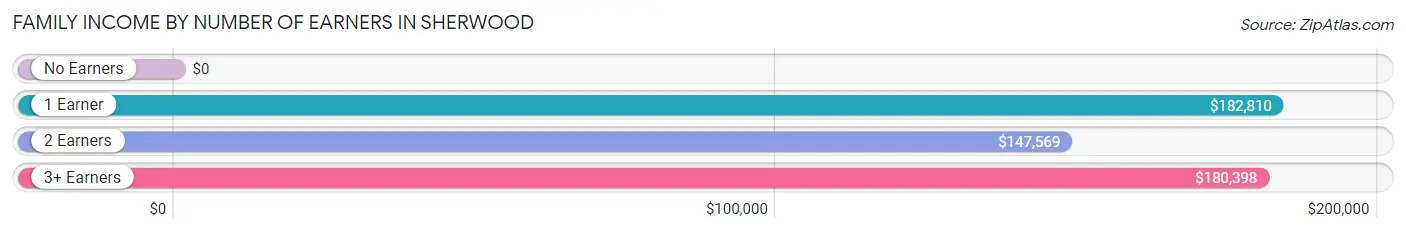
| Number of Earners | # Families | Median Income |
| No Earners | 22 (2.0%) | $0 |
| 1 Earner | 444 (40.8%) | $182,810 |
| 2 Earners | 506 (46.5%) | $147,569 |
| 3+ Earners | 116 (10.7%) | $180,398 |
| Total | 1,088 (100.0%) | $149,965 |
Household Income in Sherwood
Household Income Brackets in Sherwood
With 366 households falling in the category, the $100,000 to $149,999 income range is the most frequent in Sherwood, accounting for 26.3% of all households. In contrast, only 8 households (0.6%) fall into the less than $10,000 income bracket, making it the least populous group.
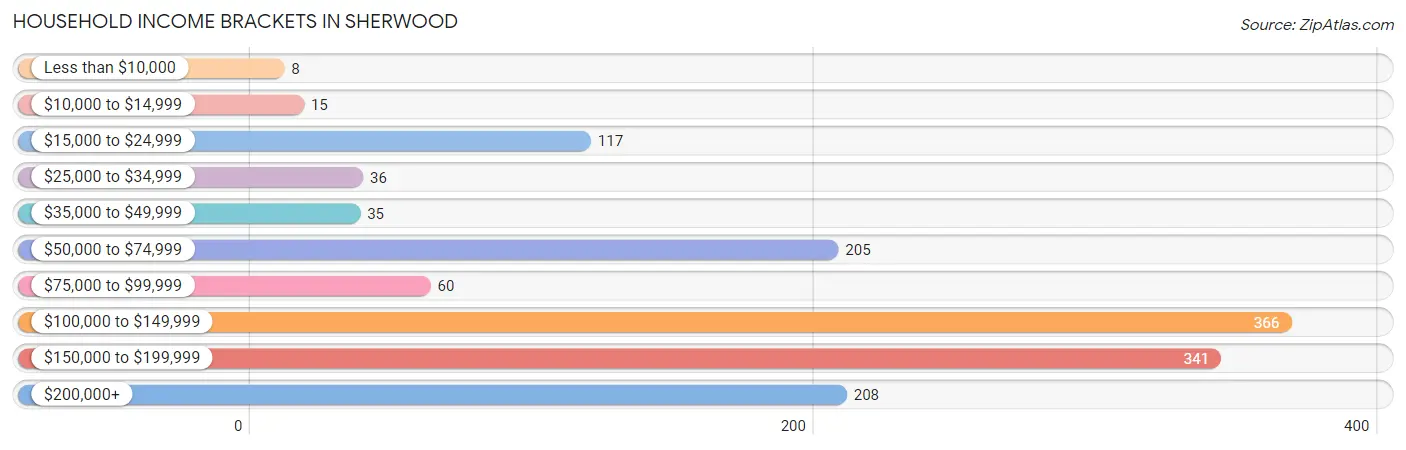
| Income Bracket | # Households | % Households |
| Less than $10,000 | 8 | 0.6% |
| $10,000 to $14,999 | 15 | 1.1% |
| $15,000 to $24,999 | 117 | 8.4% |
| $25,000 to $34,999 | 36 | 2.6% |
| $35,000 to $49,999 | 35 | 2.5% |
| $50,000 to $74,999 | 205 | 14.7% |
| $75,000 to $99,999 | 60 | 4.3% |
| $100,000 to $149,999 | 366 | 26.3% |
| $150,000 to $199,999 | 341 | 24.5% |
| $200,000+ | 208 | 14.9% |
Household Income by Householder Age in Sherwood
The median household income in Sherwood is $140,788, with the highest median household income of $180,227 found in the 45 to 64 years age bracket for the primary householder. A total of 664 households (47.7%) fall into this category. Meanwhile, the 15 to 24 years age bracket for the primary householder has the lowest median household income of $0, with 17 households (1.2%) in this group.
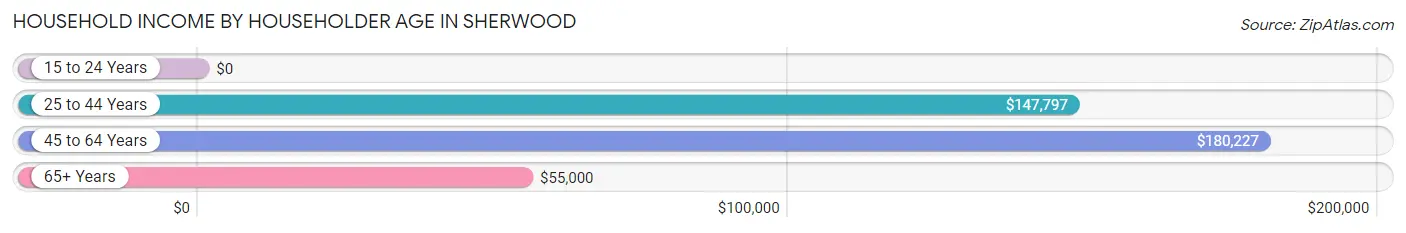
| Income Bracket | # Households | Median Income |
| 15 to 24 Years | 17 (1.2%) | $0 |
| 25 to 44 Years | 316 (22.7%) | $147,797 |
| 45 to 64 Years | 664 (47.7%) | $180,227 |
| 65+ Years | 396 (28.4%) | $55,000 |
| Total | 1,393 (100.0%) | $140,788 |
Poverty in Sherwood
Income Below Poverty by Sex and Age in Sherwood
With 1.8% poverty level for males and 1.5% for females among the residents of Sherwood, 65 to 74 year old males and 25 to 34 year old females are the most vulnerable to poverty, with 15 males (9.4%) and 18 females (11.4%) in their respective age groups living below the poverty level.
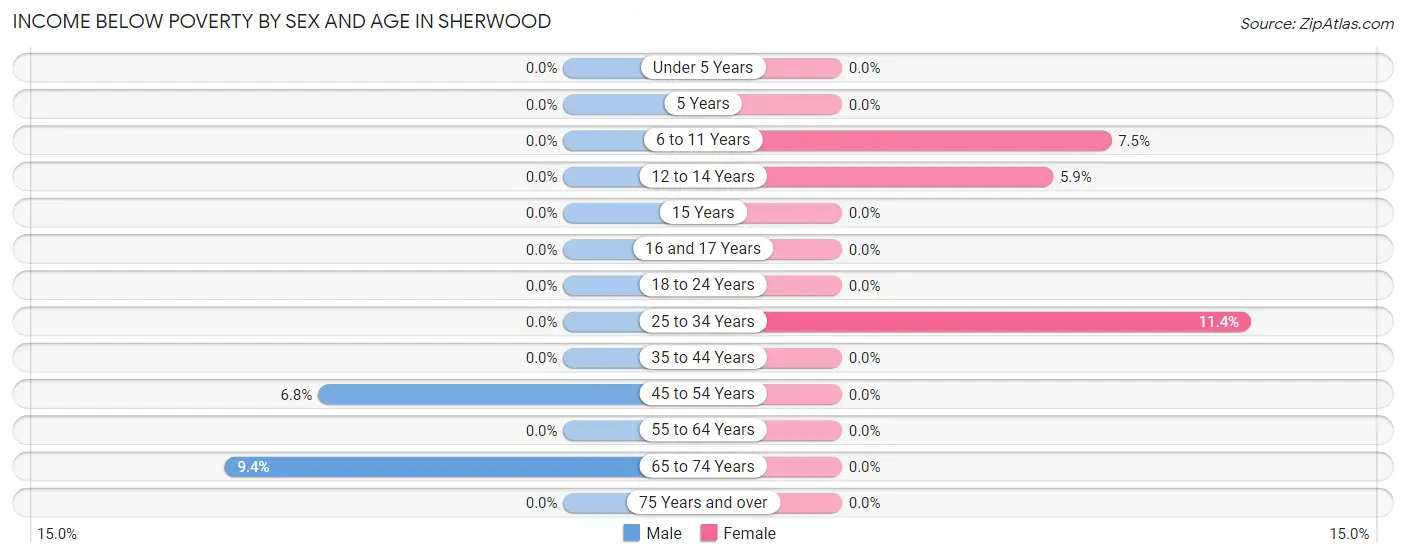
| Age Bracket | Male | Female |
| Under 5 Years | 0 (0.0%) | 0 (0.0%) |
| 5 Years | 0 (0.0%) | 0 (0.0%) |
| 6 to 11 Years | 0 (0.0%) | 6 (7.5%) |
| 12 to 14 Years | 0 (0.0%) | 6 (5.9%) |
| 15 Years | 0 (0.0%) | 0 (0.0%) |
| 16 and 17 Years | 0 (0.0%) | 0 (0.0%) |
| 18 to 24 Years | 0 (0.0%) | 0 (0.0%) |
| 25 to 34 Years | 0 (0.0%) | 18 (11.4%) |
| 35 to 44 Years | 0 (0.0%) | 0 (0.0%) |
| 45 to 54 Years | 11 (6.8%) | 0 (0.0%) |
| 55 to 64 Years | 0 (0.0%) | 0 (0.0%) |
| 65 to 74 Years | 15 (9.4%) | 0 (0.0%) |
| 75 Years and over | 0 (0.0%) | 0 (0.0%) |
| Total | 26 (1.8%) | 30 (1.5%) |
Income Above Poverty by Sex and Age in Sherwood
According to the poverty statistics in Sherwood, males aged under 5 years and females aged under 5 years are the age groups that are most secure financially, with 100.0% of males and 100.0% of females in these age groups living above the poverty line.
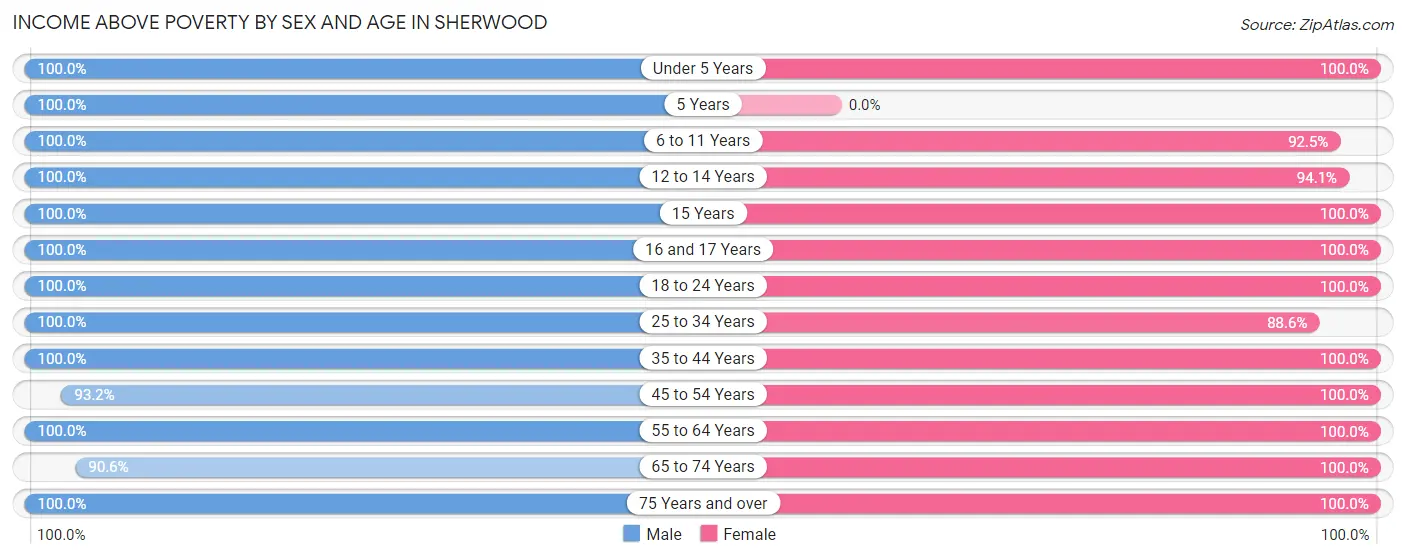
| Age Bracket | Male | Female |
| Under 5 Years | 206 (100.0%) | 149 (100.0%) |
| 5 Years | 37 (100.0%) | 0 (0.0%) |
| 6 to 11 Years | 81 (100.0%) | 74 (92.5%) |
| 12 to 14 Years | 17 (100.0%) | 96 (94.1%) |
| 15 Years | 26 (100.0%) | 50 (100.0%) |
| 16 and 17 Years | 55 (100.0%) | 49 (100.0%) |
| 18 to 24 Years | 72 (100.0%) | 72 (100.0%) |
| 25 to 34 Years | 98 (100.0%) | 140 (88.6%) |
| 35 to 44 Years | 214 (100.0%) | 173 (100.0%) |
| 45 to 54 Years | 150 (93.2%) | 513 (100.0%) |
| 55 to 64 Years | 227 (100.0%) | 197 (100.0%) |
| 65 to 74 Years | 144 (90.6%) | 141 (100.0%) |
| 75 Years and over | 89 (100.0%) | 282 (100.0%) |
| Total | 1,416 (98.2%) | 1,936 (98.5%) |
Income Below Poverty Among Married-Couple Families in Sherwood
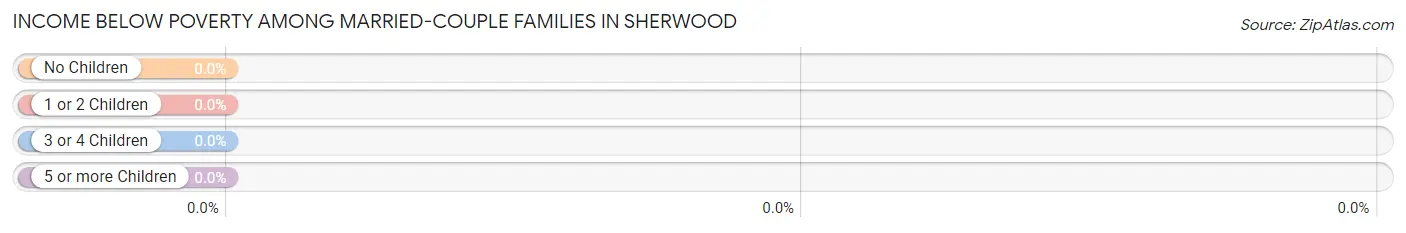
| Children | Above Poverty | Below Poverty |
| No Children | 352 (100.0%) | 0 (0.0%) |
| 1 or 2 Children | 320 (100.0%) | 0 (0.0%) |
| 3 or 4 Children | 44 (100.0%) | 0 (0.0%) |
| 5 or more Children | 0 (0.0%) | 0 (0.0%) |
| Total | 716 (100.0%) | 0 (0.0%) |
Income Below Poverty Among Single-Parent Households in Sherwood
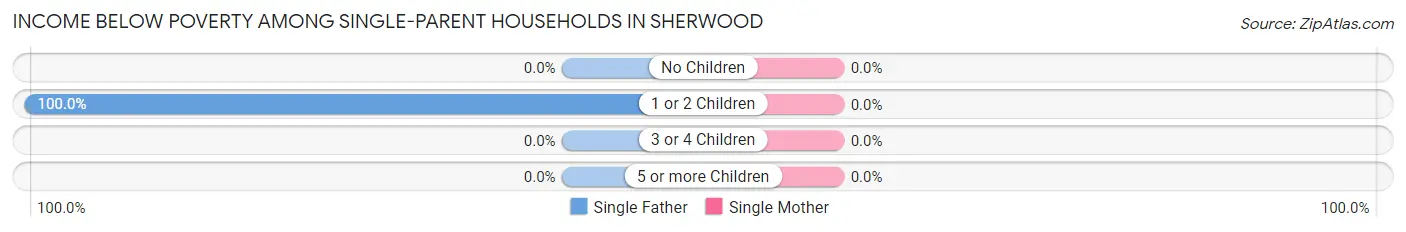
| Children | Single Father | Single Mother |
| No Children | 0 (0.0%) | 0 (0.0%) |
| 1 or 2 Children | 9 (100.0%) | 0 (0.0%) |
| 3 or 4 Children | 0 (0.0%) | 0 (0.0%) |
| 5 or more Children | 0 (0.0%) | 0 (0.0%) |
| Total | 9 (12.3%) | 0 (0.0%) |
Income Below Poverty Among Married-Couple vs Single-Parent Households in Sherwood
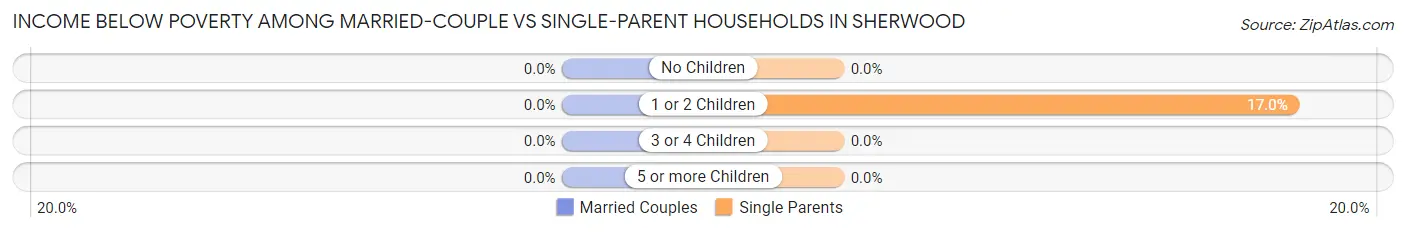
| Children | Married-Couple Families | Single-Parent Households |
| No Children | 0 (0.0%) | 0 (0.0%) |
| 1 or 2 Children | 0 (0.0%) | 9 (17.0%) |
| 3 or 4 Children | 0 (0.0%) | 0 (0.0%) |
| 5 or more Children | 0 (0.0%) | 0 (0.0%) |
| Total | 0 (0.0%) | 9 (2.4%) |
Race in Sherwood
The most populous races in Sherwood are White / Caucasian (3,115 | 91.4%), Asian (150 | 4.4%), and Two or more Races (119 | 3.5%).
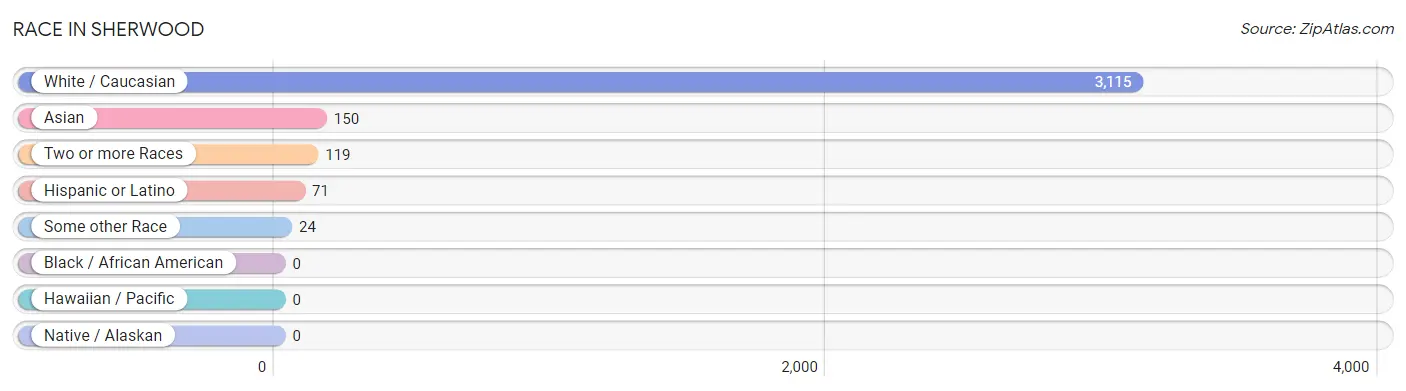
| Race | # Population | % Population |
| Asian | 150 | 4.4% |
| Black / African American | 0 | 0.0% |
| Hawaiian / Pacific | 0 | 0.0% |
| Hispanic or Latino | 71 | 2.1% |
| Native / Alaskan | 0 | 0.0% |
| White / Caucasian | 3,115 | 91.4% |
| Two or more Races | 119 | 3.5% |
| Some other Race | 24 | 0.7% |
| Total | 3,408 | 100.0% |
Ancestry in Sherwood
The most populous ancestries reported in Sherwood are German (1,194 | 35.0%), Irish (661 | 19.4%), English (562 | 16.5%), Scotch-Irish (128 | 3.8%), and American (103 | 3.0%), together accounting for 77.7% of all Sherwood residents.
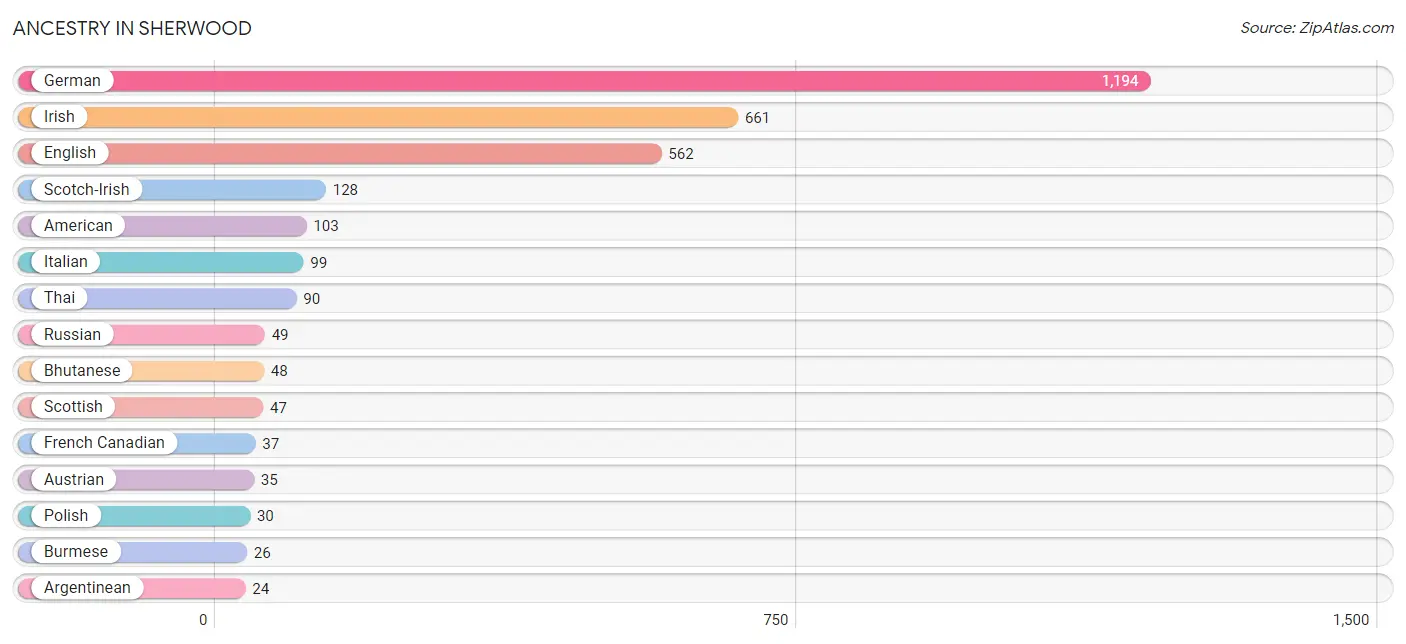
| Ancestry | # Population | % Population |
| American | 103 | 3.0% |
| Argentinean | 24 | 0.7% |
| Austrian | 35 | 1.0% |
| Bhutanese | 48 | 1.4% |
| Burmese | 26 | 0.8% |
| Central American | 24 | 0.7% |
| Cherokee | 1 | 0.0% |
| Czech | 14 | 0.4% |
| English | 562 | 16.5% |
| French | 19 | 0.6% |
| French Canadian | 37 | 1.1% |
| German | 1,194 | 35.0% |
| Greek | 15 | 0.4% |
| Irish | 661 | 19.4% |
| Italian | 99 | 2.9% |
| Korean | 17 | 0.5% |
| Macedonian | 13 | 0.4% |
| Mexican | 11 | 0.3% |
| Northern European | 2 | 0.1% |
| Panamanian | 24 | 0.7% |
| Polish | 30 | 0.9% |
| Russian | 49 | 1.4% |
| Scotch-Irish | 128 | 3.8% |
| Scottish | 47 | 1.4% |
| South American | 24 | 0.7% |
| Spaniard | 12 | 0.4% |
| Sri Lankan | 17 | 0.5% |
| Swedish | 22 | 0.6% |
| Thai | 90 | 2.6% | View All 29 Rows |
Immigrants in Sherwood
The most numerous immigrant groups reported in Sherwood came from Asia (66 | 1.9%), Latin America (48 | 1.4%), India (47 | 1.4%), South Central Asia (47 | 1.4%), and Argentina (24 | 0.7%), together accounting for 6.8% of all Sherwood residents.
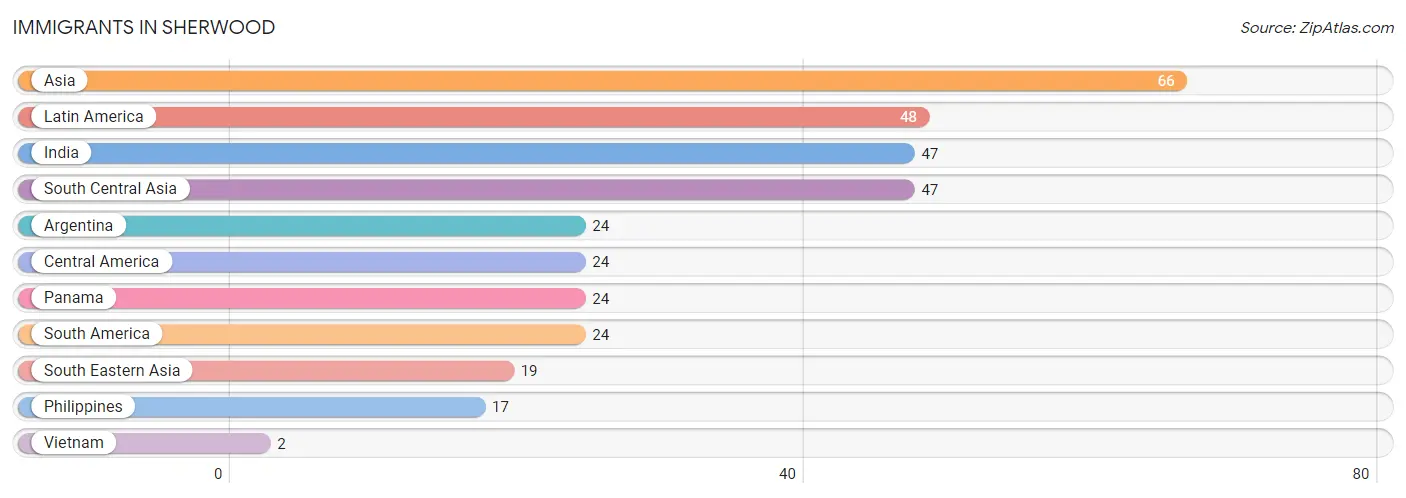
| Immigration Origin | # Population | % Population |
| Argentina | 24 | 0.7% |
| Asia | 66 | 1.9% |
| Central America | 24 | 0.7% |
| India | 47 | 1.4% |
| Latin America | 48 | 1.4% |
| Panama | 24 | 0.7% |
| Philippines | 17 | 0.5% |
| South America | 24 | 0.7% |
| South Central Asia | 47 | 1.4% |
| South Eastern Asia | 19 | 0.6% |
| Vietnam | 2 | 0.1% | View All 11 Rows |
Sex and Age in Sherwood
Sex and Age in Sherwood
The most populous age groups in Sherwood are Under 5 Years (206 | 14.3%) for men and 50 to 54 Years (414 | 21.1%) for women.
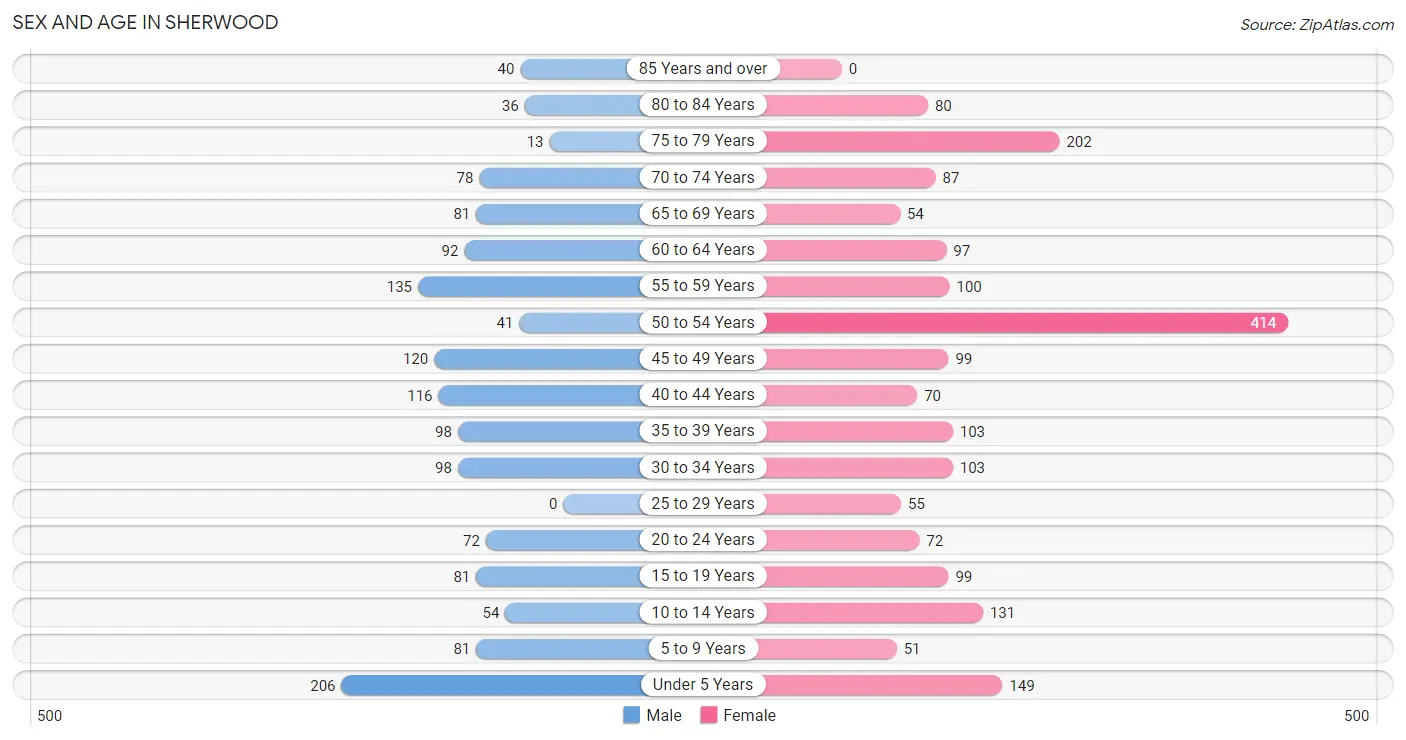
| Age Bracket | Male | Female |
| Under 5 Years | 206 (14.3%) | 149 (7.6%) |
| 5 to 9 Years | 81 (5.6%) | 51 (2.6%) |
| 10 to 14 Years | 54 (3.7%) | 131 (6.7%) |
| 15 to 19 Years | 81 (5.6%) | 99 (5.0%) |
| 20 to 24 Years | 72 (5.0%) | 72 (3.7%) |
| 25 to 29 Years | 0 (0.0%) | 55 (2.8%) |
| 30 to 34 Years | 98 (6.8%) | 103 (5.2%) |
| 35 to 39 Years | 98 (6.8%) | 103 (5.2%) |
| 40 to 44 Years | 116 (8.0%) | 70 (3.6%) |
| 45 to 49 Years | 120 (8.3%) | 99 (5.0%) |
| 50 to 54 Years | 41 (2.8%) | 414 (21.1%) |
| 55 to 59 Years | 135 (9.4%) | 100 (5.1%) |
| 60 to 64 Years | 92 (6.4%) | 97 (4.9%) |
| 65 to 69 Years | 81 (5.6%) | 54 (2.8%) |
| 70 to 74 Years | 78 (5.4%) | 87 (4.4%) |
| 75 to 79 Years | 13 (0.9%) | 202 (10.3%) |
| 80 to 84 Years | 36 (2.5%) | 80 (4.1%) |
| 85 Years and over | 40 (2.8%) | 0 (0.0%) |
| Total | 1,442 (100.0%) | 1,966 (100.0%) |
Families and Households in Sherwood
Median Family Size in Sherwood
The median family size in Sherwood is 2.80 persons per family, with married-couple families (716 | 65.8%) accounting for the largest median family size of 3.16 persons per family. On the other hand, single female/mother families (299 | 27.5%) represent the smallest median family size with 1.97 persons per family.
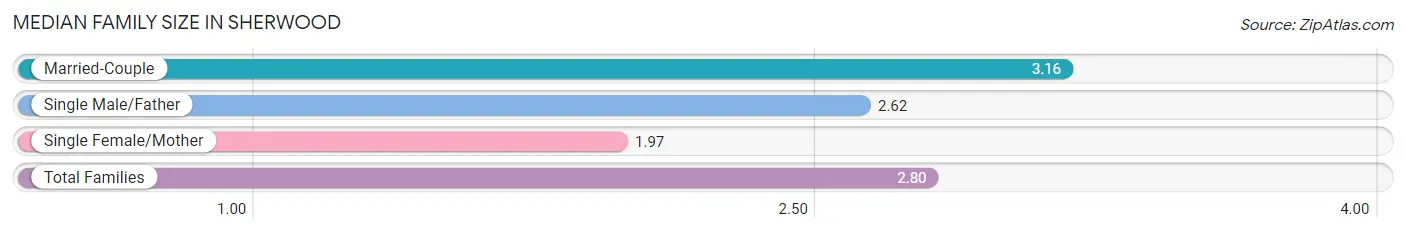
| Family Type | # Families | Family Size |
| Married-Couple | 716 (65.8%) | 3.16 |
| Single Male/Father | 73 (6.7%) | 2.62 |
| Single Female/Mother | 299 (27.5%) | 1.97 |
| Total Families | 1,088 (100.0%) | 2.80 |
Median Household Size in Sherwood
The median household size in Sherwood is 2.45 persons per household, with single male/father households (73 | 5.2%) accounting for the largest median household size of 3.21 persons per household. non-family households (305 | 21.9%) represent the smallest median household size with 1.04 persons per household.
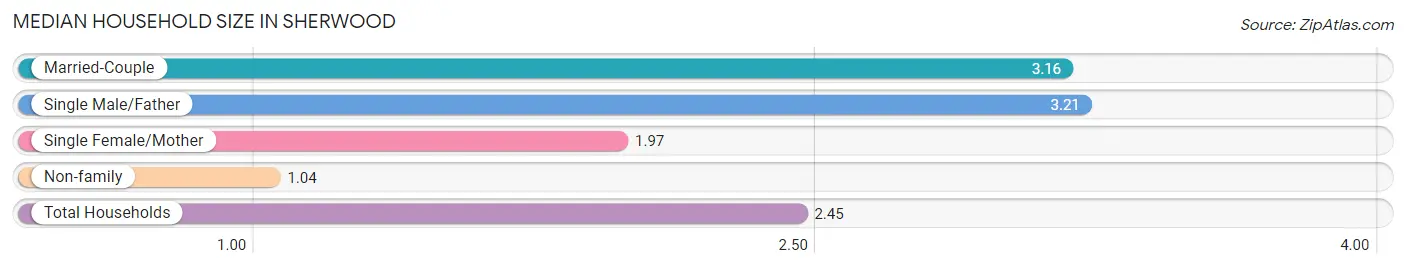
| Household Type | # Households | Household Size |
| Married-Couple | 716 (51.4%) | 3.16 |
| Single Male/Father | 73 (5.2%) | 3.21 |
| Single Female/Mother | 299 (21.5%) | 1.97 |
| Non-family | 305 (21.9%) | 1.04 |
| Total Households | 1,393 (100.0%) | 2.45 |
Household Size by Marriage Status in Sherwood
Out of a total of 1,393 households in Sherwood, 1,088 (78.1%) are family households, while 305 (21.9%) are nonfamily households. The most numerous type of family households are 2-person households, comprising 553, and the most common type of nonfamily households are 1-person households, comprising 294.
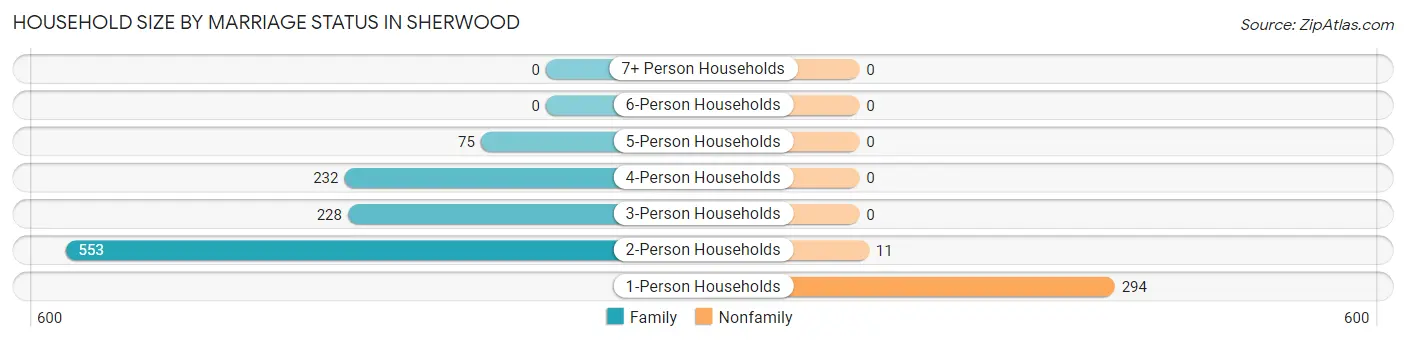
| Household Size | Family Households | Nonfamily Households |
| 1-Person Households | - | 294 (21.1%) |
| 2-Person Households | 553 (39.7%) | 11 (0.8%) |
| 3-Person Households | 228 (16.4%) | 0 (0.0%) |
| 4-Person Households | 232 (16.7%) | 0 (0.0%) |
| 5-Person Households | 75 (5.4%) | 0 (0.0%) |
| 6-Person Households | 0 (0.0%) | 0 (0.0%) |
| 7+ Person Households | 0 (0.0%) | 0 (0.0%) |
| Total | 1,088 (78.1%) | 305 (21.9%) |
Female Fertility in Sherwood
Fertility by Age in Sherwood
Average fertility rate in Sherwood is 150.0 births per 1,000 women. Women in the age bracket of 20 to 34 years have the highest fertility rate with 187.0 births per 1,000 women. Women in the age bracket of 35 to 50 years acount for 54.7% of all women with births.
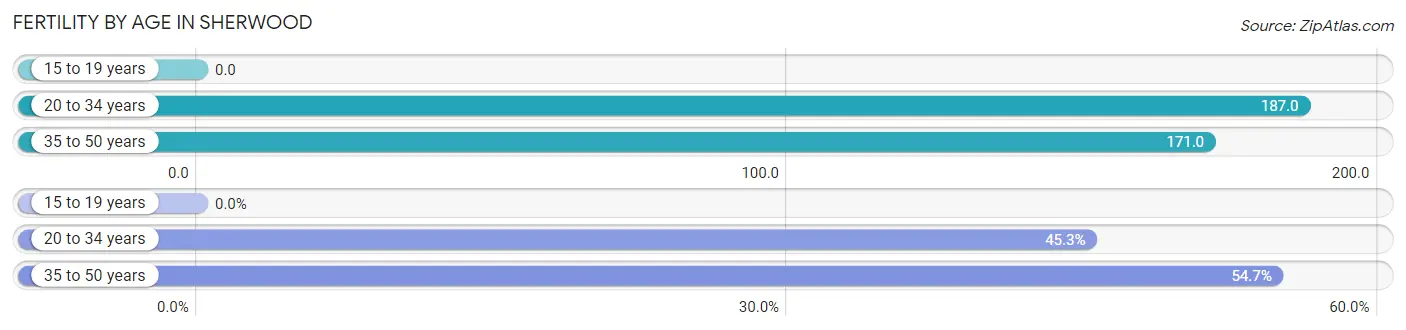
| Age Bracket | Women with Births | Births / 1,000 Women |
| 15 to 19 years | 0 (0.0%) | 0.0 |
| 20 to 34 years | 43 (45.3%) | 187.0 |
| 35 to 50 years | 52 (54.7%) | 171.0 |
| Total | 95 (100.0%) | 150.0 |
Fertility by Age by Marriage Status in Sherwood
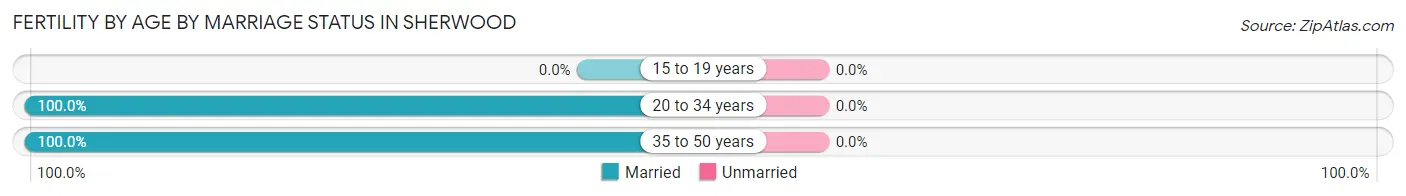
| Age Bracket | Married | Unmarried |
| 15 to 19 years | 0 (0.0%) | 0 (0.0%) |
| 20 to 34 years | 43 (100.0%) | 0 (0.0%) |
| 35 to 50 years | 52 (100.0%) | 0 (0.0%) |
| Total | 95 (100.0%) | 0 (0.0%) |
Fertility by Education in Sherwood
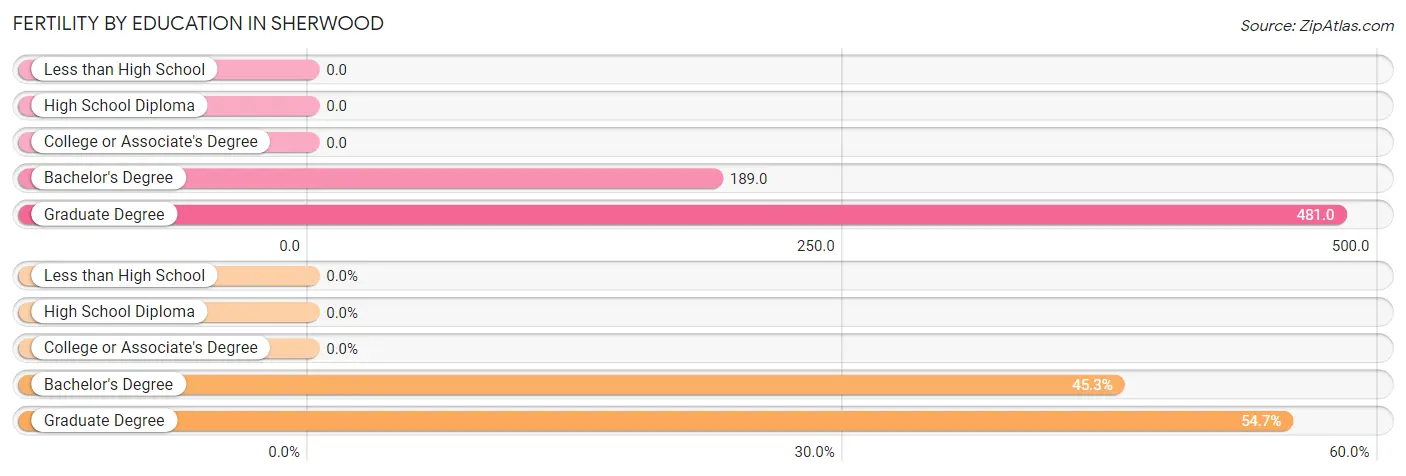
| Educational Attainment | Women with Births | Births / 1,000 Women |
| Less than High School | 0 (0.0%) | 0.0 |
| High School Diploma | 0 (0.0%) | 0.0 |
| College or Associate's Degree | 0 (0.0%) | 0.0 |
| Bachelor's Degree | 43 (45.3%) | 189.0 |
| Graduate Degree | 52 (54.7%) | 481.0 |
| Total | 95 (100.0%) | 150.0 |
Fertility by Education by Marriage Status in Sherwood
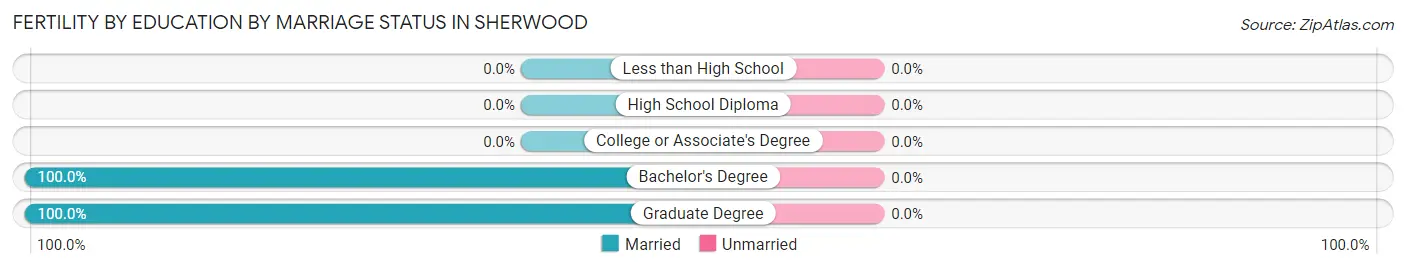
| Educational Attainment | Married | Unmarried |
| Less than High School | 0 (0.0%) | 0 (0.0%) |
| High School Diploma | 0 (0.0%) | 0 (0.0%) |
| College or Associate's Degree | 0 (0.0%) | 0 (0.0%) |
| Bachelor's Degree | 43 (100.0%) | 0 (0.0%) |
| Graduate Degree | 52 (100.0%) | 0 (0.0%) |
| Total | 95 (100.0%) | 0 (0.0%) |
Employment Characteristics in Sherwood
Employment by Class of Employer in Sherwood
Among the 1,822 employed individuals in Sherwood, private company employees (1,307 | 71.7%), not-for-profit organizations (185 | 10.2%), and local government employees (135 | 7.4%) make up the most common classes of employment.
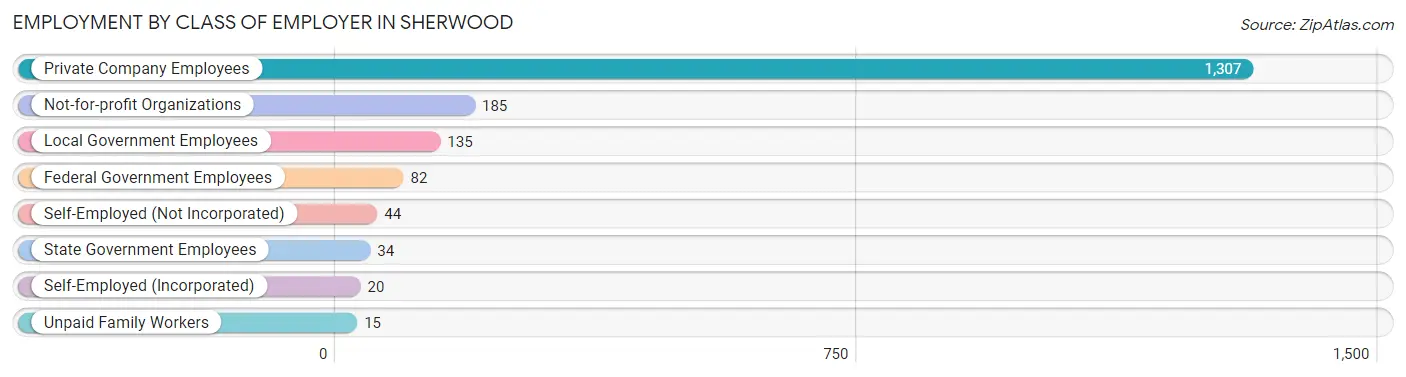
| Employer Class | # Employees | % Employees |
| Private Company Employees | 1,307 | 71.7% |
| Self-Employed (Incorporated) | 20 | 1.1% |
| Self-Employed (Not Incorporated) | 44 | 2.4% |
| Not-for-profit Organizations | 185 | 10.2% |
| Local Government Employees | 135 | 7.4% |
| State Government Employees | 34 | 1.9% |
| Federal Government Employees | 82 | 4.5% |
| Unpaid Family Workers | 15 | 0.8% |
| Total | 1,822 | 100.0% |
Employment Status by Age in Sherwood
According to the labor force statistics for Sherwood, out of the total population over 16 years of age (2,660), 72.7% or 1,934 individuals are in the labor force, with 5.1% or 99 of them unemployed. The age group with the highest labor force participation rate is 20 to 24 years, with 100.0% or 144 individuals in the labor force. Within the labor force, the 75 years and over age range has the highest percentage of unemployed individuals, with 60.7% or 65 of them being unemployed.
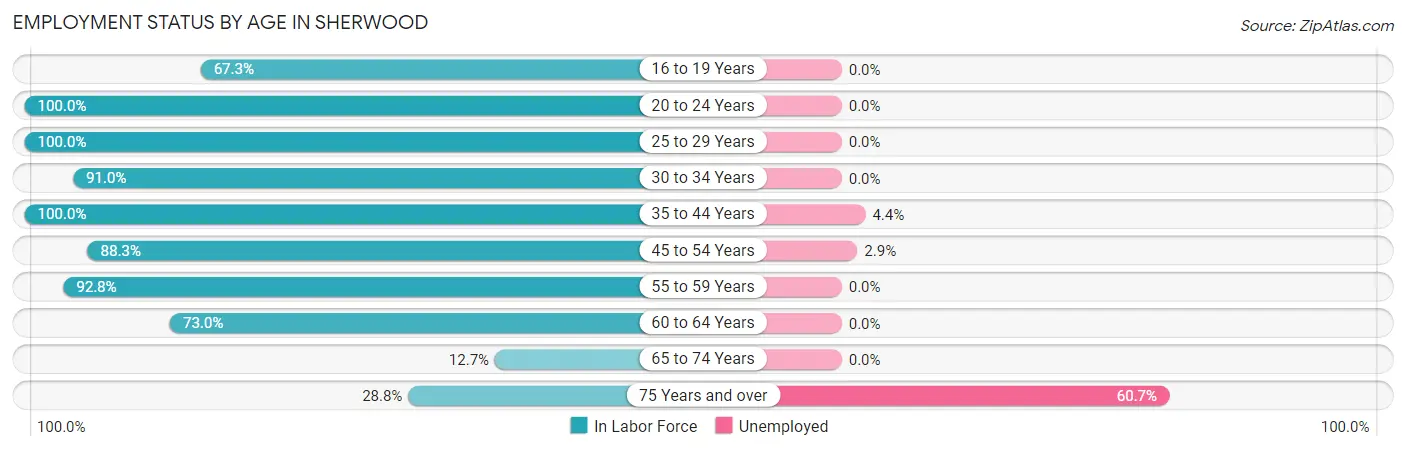
| Age Bracket | In Labor Force | Unemployed |
| 16 to 19 Years | 70 (67.3%) | 0 (0.0%) |
| 20 to 24 Years | 144 (100.0%) | 0 (0.0%) |
| 25 to 29 Years | 55 (100.0%) | 0 (0.0%) |
| 30 to 34 Years | 183 (91.0%) | 0 (0.0%) |
| 35 to 44 Years | 387 (100.0%) | 17 (4.4%) |
| 45 to 54 Years | 595 (88.3%) | 17 (2.9%) |
| 55 to 59 Years | 218 (92.8%) | 0 (0.0%) |
| 60 to 64 Years | 138 (73.0%) | 0 (0.0%) |
| 65 to 74 Years | 38 (12.7%) | 0 (0.0%) |
| 75 Years and over | 107 (28.8%) | 65 (60.7%) |
| Total | 1,934 (72.7%) | 99 (5.1%) |
Employment Status by Educational Attainment in Sherwood
According to labor force statistics for Sherwood, 90.5% of individuals (1,576) out of the total population between 25 and 64 years of age (1,741) are in the labor force, with 2.2% or 35 of them being unemployed. The group with the highest labor force participation rate are those with the educational attainment of less than high school, with 100.0% or 17 individuals in the labor force. Within the labor force, individuals with less than high school education have the highest percentage of unemployment, with 100.0% or 17 of them being unemployed.
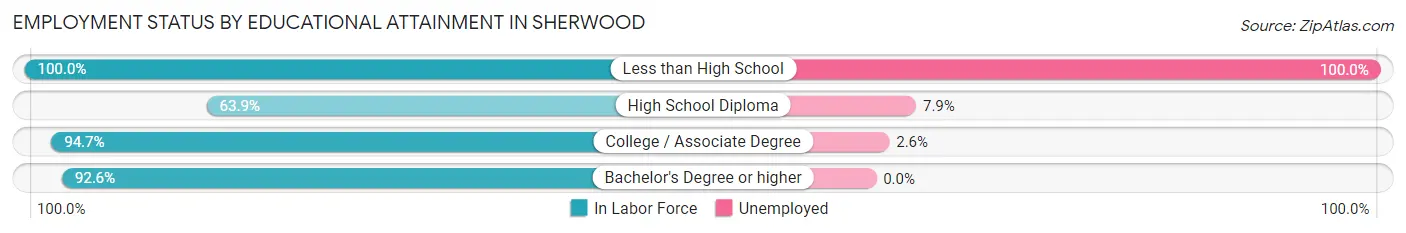
| Educational Attainment | In Labor Force | Unemployed |
| Less than High School | 17 (100.0%) | 17 (100.0%) |
| High School Diploma | 101 (63.9%) | 12 (7.9%) |
| College / Associate Degree | 340 (94.7%) | 9 (2.6%) |
| Bachelor's Degree or higher | 1,118 (92.6%) | 0 (0.0%) |
| Total | 1,576 (90.5%) | 38 (2.2%) |
Employment Occupations by Sex in Sherwood
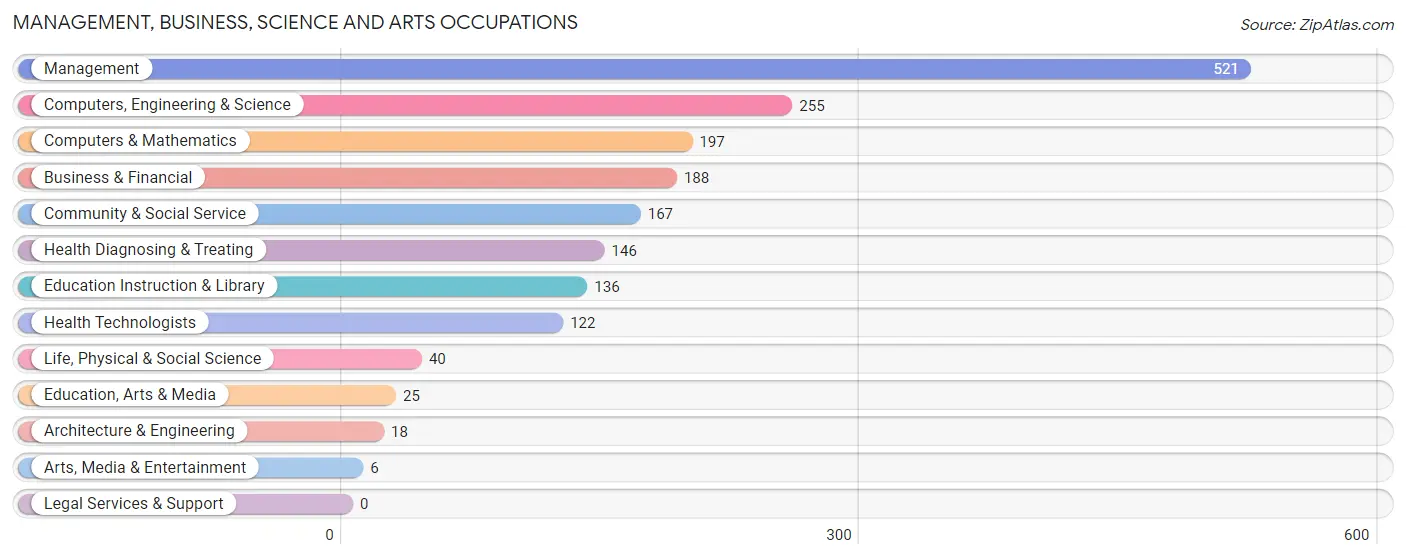
Management, Business, Science and Arts Occupations
The most common Management, Business, Science and Arts occupations in Sherwood are Management (521 | 28.4%), Computers, Engineering & Science (255 | 13.9%), Computers & Mathematics (197 | 10.7%), Business & Financial (188 | 10.2%), and Community & Social Service (167 | 9.1%).
Management, Business, Science and Arts Occupations by Sex
Within the Management, Business, Science and Arts occupations in Sherwood, the most male-oriented occupations are Architecture & Engineering (100.0%), Life, Physical & Social Science (100.0%), and Education, Arts & Media (100.0%), while the most female-oriented occupations are Arts, Media & Entertainment (100.0%), Education Instruction & Library (90.4%), and Community & Social Service (77.2%).
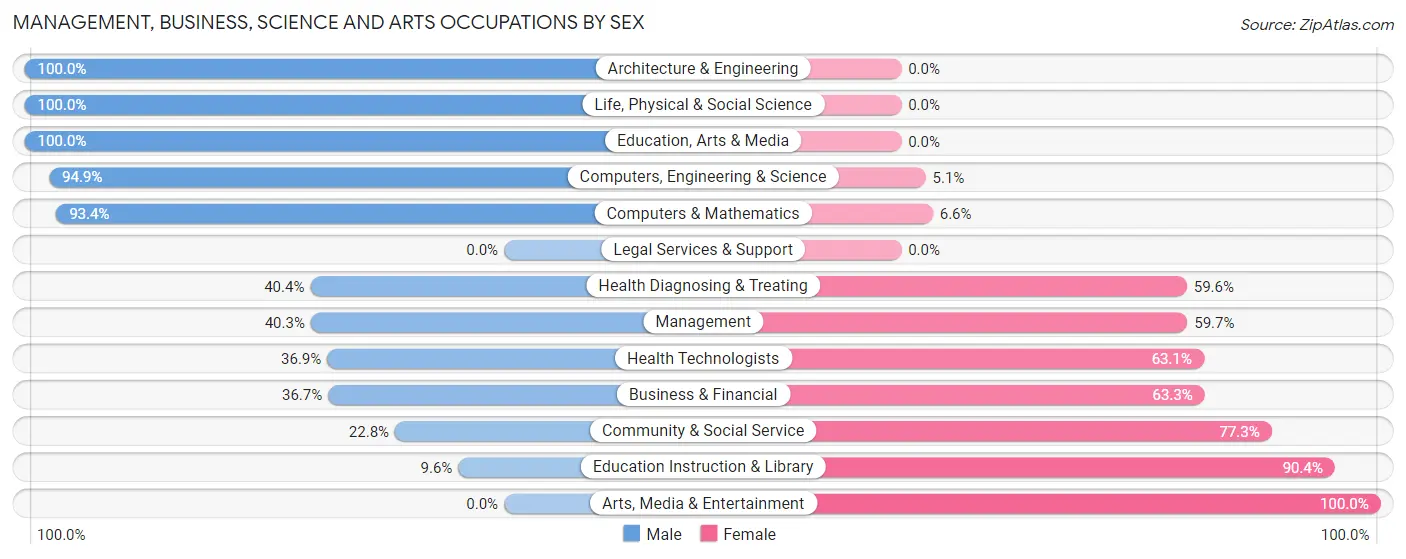
| Occupation | Male | Female |
| Management | 210 (40.3%) | 311 (59.7%) |
| Business & Financial | 69 (36.7%) | 119 (63.3%) |
| Computers, Engineering & Science | 242 (94.9%) | 13 (5.1%) |
| Computers & Mathematics | 184 (93.4%) | 13 (6.6%) |
| Architecture & Engineering | 18 (100.0%) | 0 (0.0%) |
| Life, Physical & Social Science | 40 (100.0%) | 0 (0.0%) |
| Community & Social Service | 38 (22.8%) | 129 (77.2%) |
| Education, Arts & Media | 25 (100.0%) | 0 (0.0%) |
| Legal Services & Support | 0 (0.0%) | 0 (0.0%) |
| Education Instruction & Library | 13 (9.6%) | 123 (90.4%) |
| Arts, Media & Entertainment | 0 (0.0%) | 6 (100.0%) |
| Health Diagnosing & Treating | 59 (40.4%) | 87 (59.6%) |
| Health Technologists | 45 (36.9%) | 77 (63.1%) |
| Total (Category) | 618 (48.4%) | 659 (51.6%) |
| Total (Overall) | 787 (42.9%) | 1,049 (57.1%) |
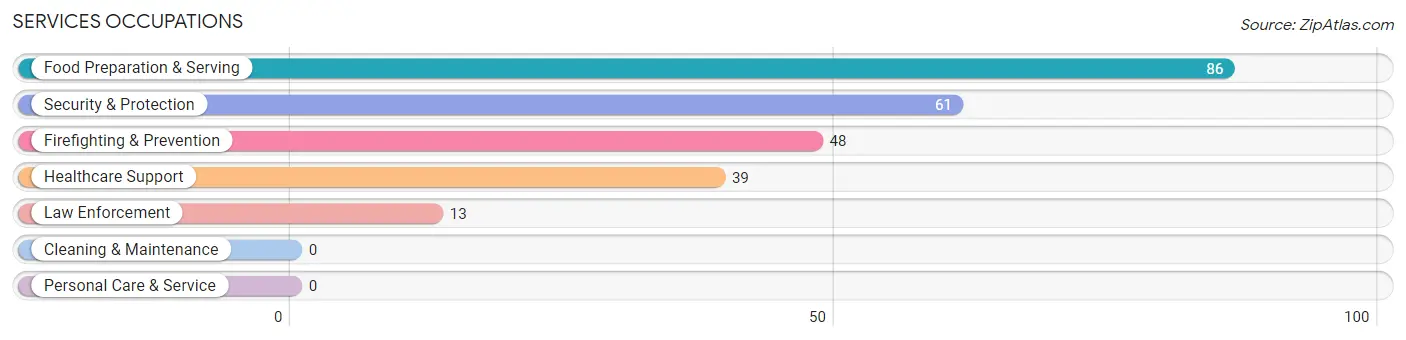
Services Occupations
The most common Services occupations in Sherwood are Food Preparation & Serving (86 | 4.7%), Security & Protection (61 | 3.3%), Firefighting & Prevention (48 | 2.6%), Healthcare Support (39 | 2.1%), and Law Enforcement (13 | 0.7%).
Services Occupations by Sex
Within the Services occupations in Sherwood, the most male-oriented occupations are Security & Protection (100.0%), Firefighting & Prevention (100.0%), and Law Enforcement (100.0%), while the most female-oriented occupations are Healthcare Support (100.0%), and Food Preparation & Serving (70.9%).
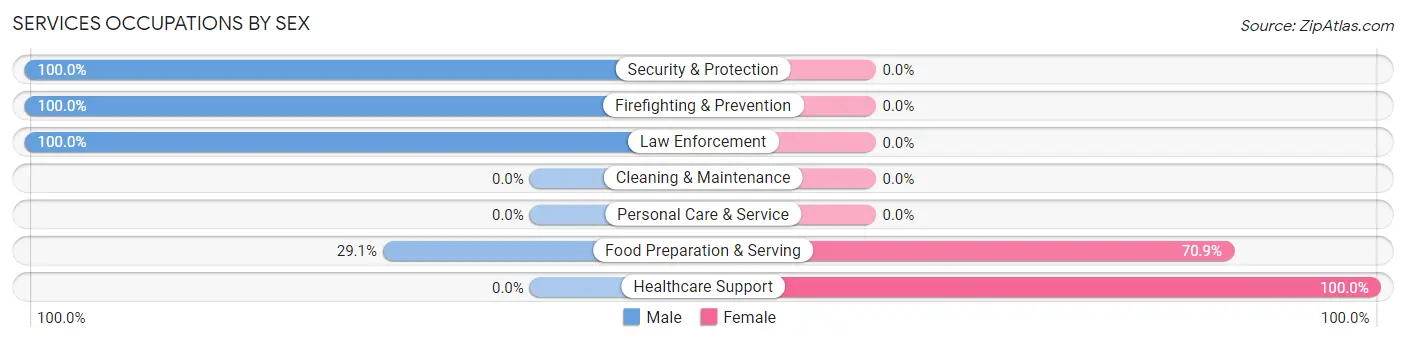
| Occupation | Male | Female |
| Healthcare Support | 0 (0.0%) | 39 (100.0%) |
| Security & Protection | 61 (100.0%) | 0 (0.0%) |
| Firefighting & Prevention | 48 (100.0%) | 0 (0.0%) |
| Law Enforcement | 13 (100.0%) | 0 (0.0%) |
| Food Preparation & Serving | 25 (29.1%) | 61 (70.9%) |
| Cleaning & Maintenance | 0 (0.0%) | 0 (0.0%) |
| Personal Care & Service | 0 (0.0%) | 0 (0.0%) |
| Total (Category) | 86 (46.2%) | 100 (53.8%) |
| Total (Overall) | 787 (42.9%) | 1,049 (57.1%) |
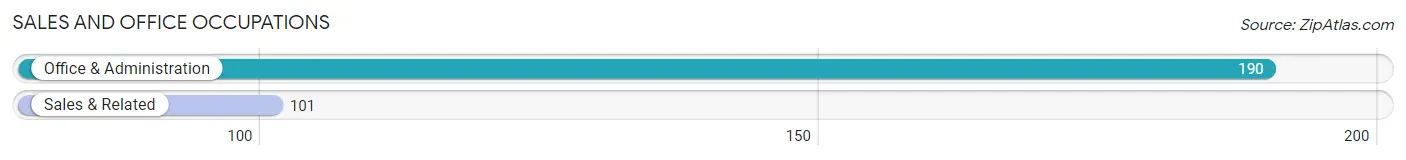
Sales and Office Occupations
The most common Sales and Office occupations in Sherwood are Office & Administration (190 | 10.3%), and Sales & Related (101 | 5.5%).
Sales and Office Occupations by Sex
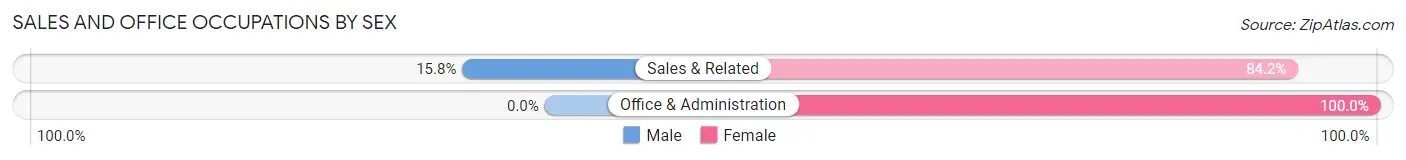
| Occupation | Male | Female |
| Sales & Related | 16 (15.8%) | 85 (84.2%) |
| Office & Administration | 0 (0.0%) | 190 (100.0%) |
| Total (Category) | 16 (5.5%) | 275 (94.5%) |
| Total (Overall) | 787 (42.9%) | 1,049 (57.1%) |
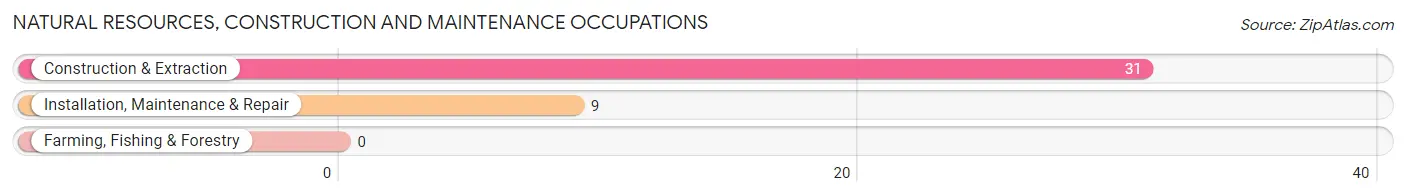
Natural Resources, Construction and Maintenance Occupations
The most common Natural Resources, Construction and Maintenance occupations in Sherwood are Construction & Extraction (31 | 1.7%), and Installation, Maintenance & Repair (9 | 0.5%).
Natural Resources, Construction and Maintenance Occupations by Sex
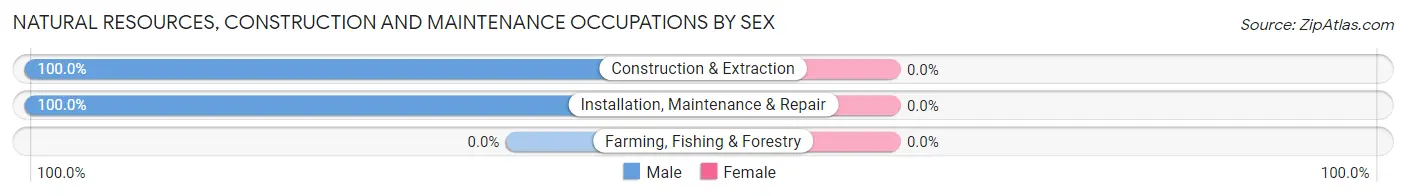
| Occupation | Male | Female |
| Farming, Fishing & Forestry | 0 (0.0%) | 0 (0.0%) |
| Construction & Extraction | 31 (100.0%) | 0 (0.0%) |
| Installation, Maintenance & Repair | 9 (100.0%) | 0 (0.0%) |
| Total (Category) | 40 (100.0%) | 0 (0.0%) |
| Total (Overall) | 787 (42.9%) | 1,049 (57.1%) |
Production, Transportation and Moving Occupations
The most common Production, Transportation and Moving occupations in Sherwood are Production (32 | 1.7%), and Material Moving (10 | 0.5%).
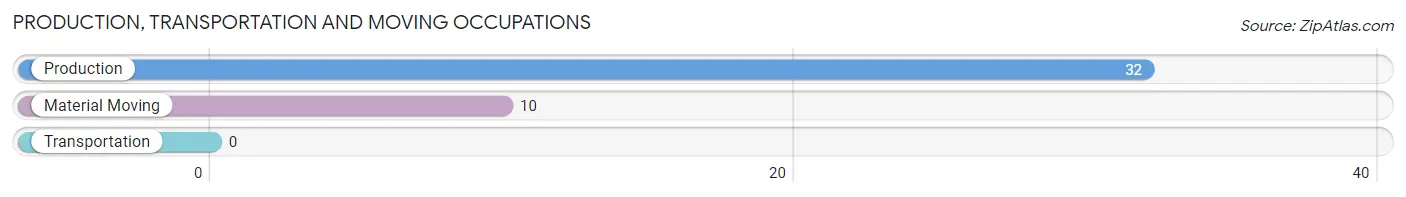
Production, Transportation and Moving Occupations by Sex
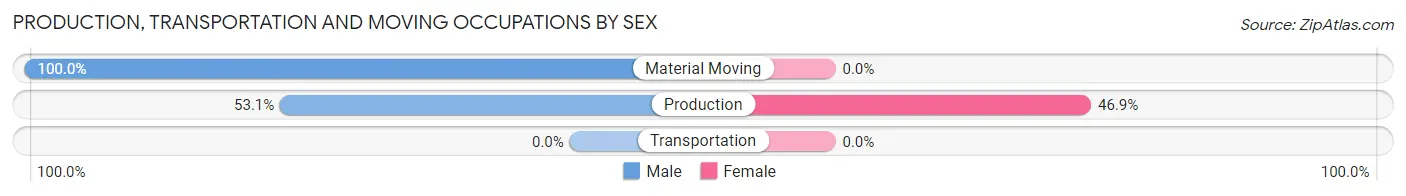
| Occupation | Male | Female |
| Production | 17 (53.1%) | 15 (46.9%) |
| Transportation | 0 (0.0%) | 0 (0.0%) |
| Material Moving | 10 (100.0%) | 0 (0.0%) |
| Total (Category) | 27 (64.3%) | 15 (35.7%) |
| Total (Overall) | 787 (42.9%) | 1,049 (57.1%) |
Employment Industries by Sex in Sherwood
Employment Industries in Sherwood
The major employment industries in Sherwood include Professional & Scientific (551 | 30.0%), Health Care & Social Assistance (259 | 14.1%), Educational Services (255 | 13.9%), Manufacturing (148 | 8.1%), and Arts, Entertainment & Recreation (109 | 5.9%).
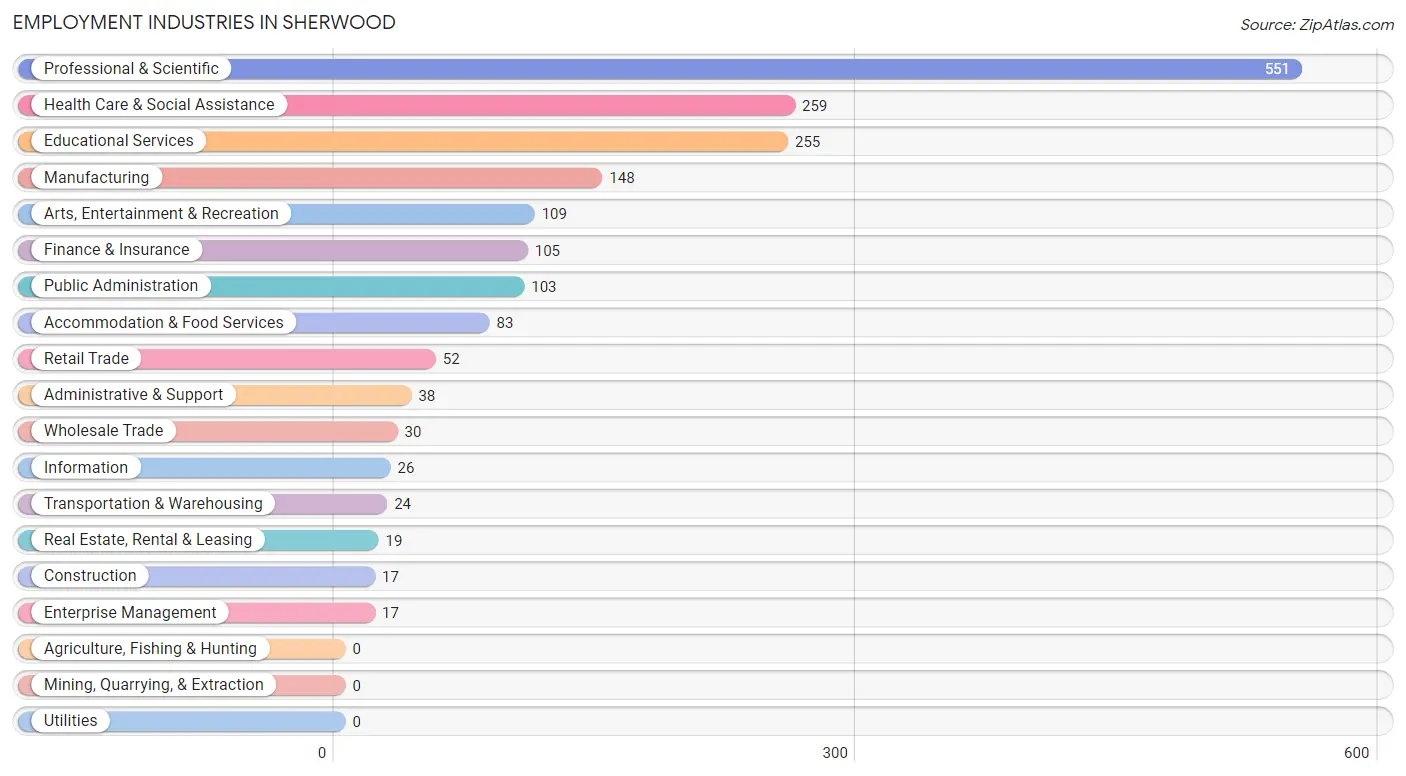
Employment Industries by Sex in Sherwood
The Sherwood industries that see more men than women are Construction (100.0%), Information (100.0%), and Enterprise Management (100.0%), whereas the industries that tend to have a higher number of women are Real Estate, Rental & Leasing (100.0%), Administrative & Support (100.0%), and Accommodation & Food Services (100.0%).
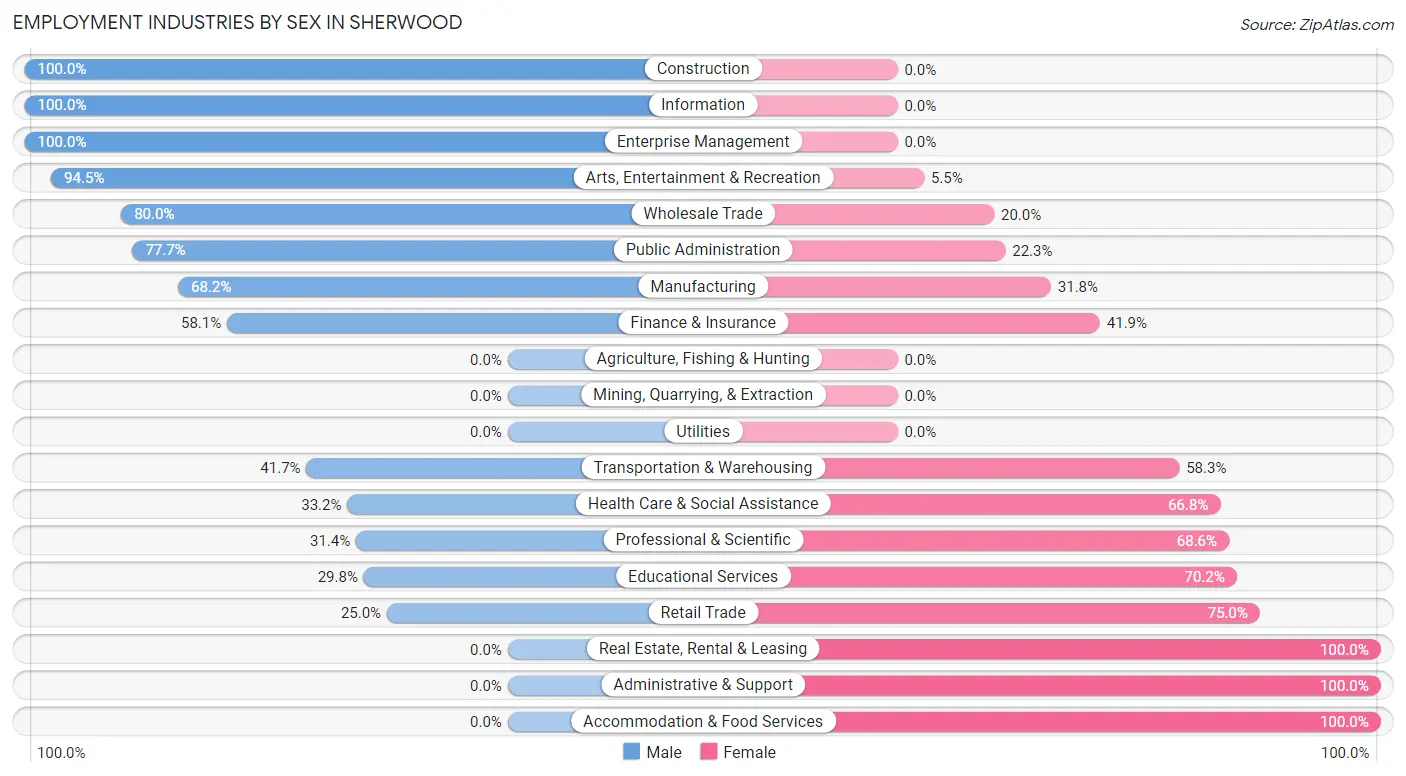
| Industry | Male | Female |
| Agriculture, Fishing & Hunting | 0 (0.0%) | 0 (0.0%) |
| Mining, Quarrying, & Extraction | 0 (0.0%) | 0 (0.0%) |
| Construction | 17 (100.0%) | 0 (0.0%) |
| Manufacturing | 101 (68.2%) | 47 (31.8%) |
| Wholesale Trade | 24 (80.0%) | 6 (20.0%) |
| Retail Trade | 13 (25.0%) | 39 (75.0%) |
| Transportation & Warehousing | 10 (41.7%) | 14 (58.3%) |
| Utilities | 0 (0.0%) | 0 (0.0%) |
| Information | 26 (100.0%) | 0 (0.0%) |
| Finance & Insurance | 61 (58.1%) | 44 (41.9%) |
| Real Estate, Rental & Leasing | 0 (0.0%) | 19 (100.0%) |
| Professional & Scientific | 173 (31.4%) | 378 (68.6%) |
| Enterprise Management | 17 (100.0%) | 0 (0.0%) |
| Administrative & Support | 0 (0.0%) | 38 (100.0%) |
| Educational Services | 76 (29.8%) | 179 (70.2%) |
| Health Care & Social Assistance | 86 (33.2%) | 173 (66.8%) |
| Arts, Entertainment & Recreation | 103 (94.5%) | 6 (5.5%) |
| Accommodation & Food Services | 0 (0.0%) | 83 (100.0%) |
| Public Administration | 80 (77.7%) | 23 (22.3%) |
| Total | 787 (42.9%) | 1,049 (57.1%) |
Education in Sherwood
School Enrollment in Sherwood
The most common levels of schooling among the 611 students in Sherwood are high school (189 | 30.9%), middle school (158 | 25.9%), and elementary school (98 | 16.0%).
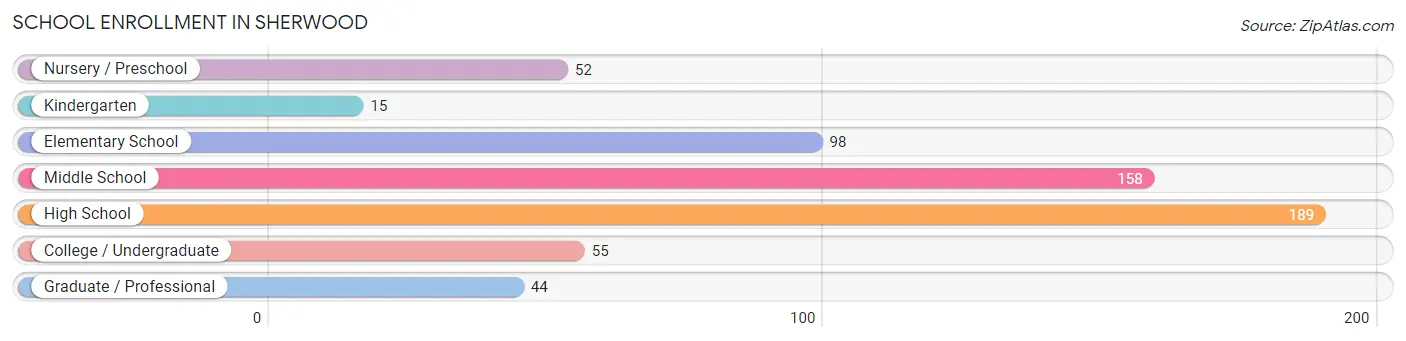
| School Level | # Students | % Students |
| Nursery / Preschool | 52 | 8.5% |
| Kindergarten | 15 | 2.5% |
| Elementary School | 98 | 16.0% |
| Middle School | 158 | 25.9% |
| High School | 189 | 30.9% |
| College / Undergraduate | 55 | 9.0% |
| Graduate / Professional | 44 | 7.2% |
| Total | 611 | 100.0% |
School Enrollment by Age by Funding Source in Sherwood
Out of a total of 611 students who are enrolled in schools in Sherwood, 88 (14.4%) attend a private institution, while the remaining 523 (85.6%) are enrolled in public schools. The age group of 5 to 9 year old has the highest likelihood of being enrolled in private schools, with 44 (38.3% in the age bracket) enrolled. Conversely, the age group of 3 to 4 year olds has the lowest likelihood of being enrolled in a private school, with 32 (100.0% in the age bracket) attending a public institution.
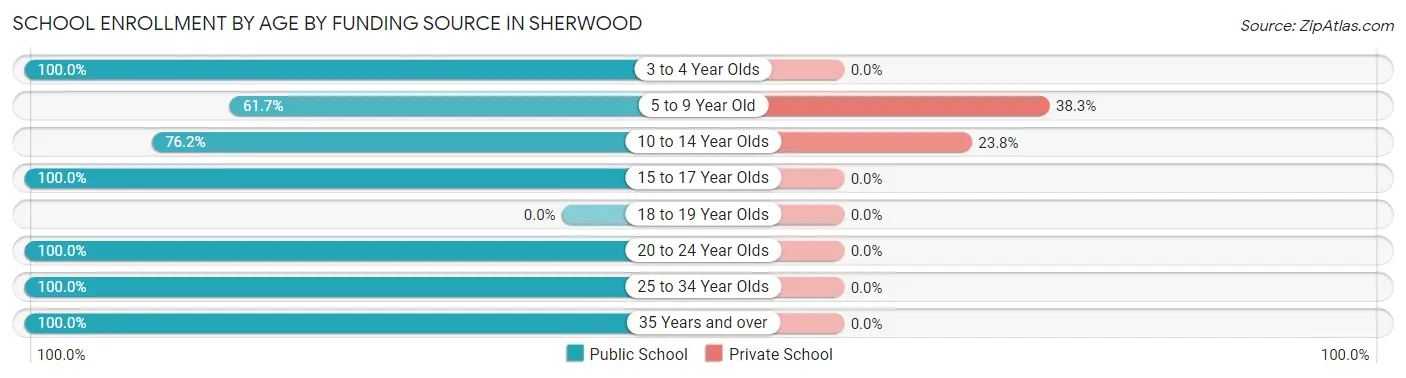
| Age Bracket | Public School | Private School |
| 3 to 4 Year Olds | 32 (100.0%) | 0 (0.0%) |
| 5 to 9 Year Old | 71 (61.7%) | 44 (38.3%) |
| 10 to 14 Year Olds | 141 (76.2%) | 44 (23.8%) |
| 15 to 17 Year Olds | 180 (100.0%) | 0 (0.0%) |
| 18 to 19 Year Olds | 0 (0.0%) | 0 (0.0%) |
| 20 to 24 Year Olds | 21 (100.0%) | 0 (0.0%) |
| 25 to 34 Year Olds | 40 (100.0%) | 0 (0.0%) |
| 35 Years and over | 38 (100.0%) | 0 (0.0%) |
| Total | 523 (85.6%) | 88 (14.4%) |
Educational Attainment by Field of Study in Sherwood
Social sciences (362 | 24.6%), business (287 | 19.5%), education (198 | 13.5%), science & technology (123 | 8.4%), and bio, nature & agricultural (101 | 6.9%) are the most common fields of study among 1,470 individuals in Sherwood who have obtained a bachelor's degree or higher.
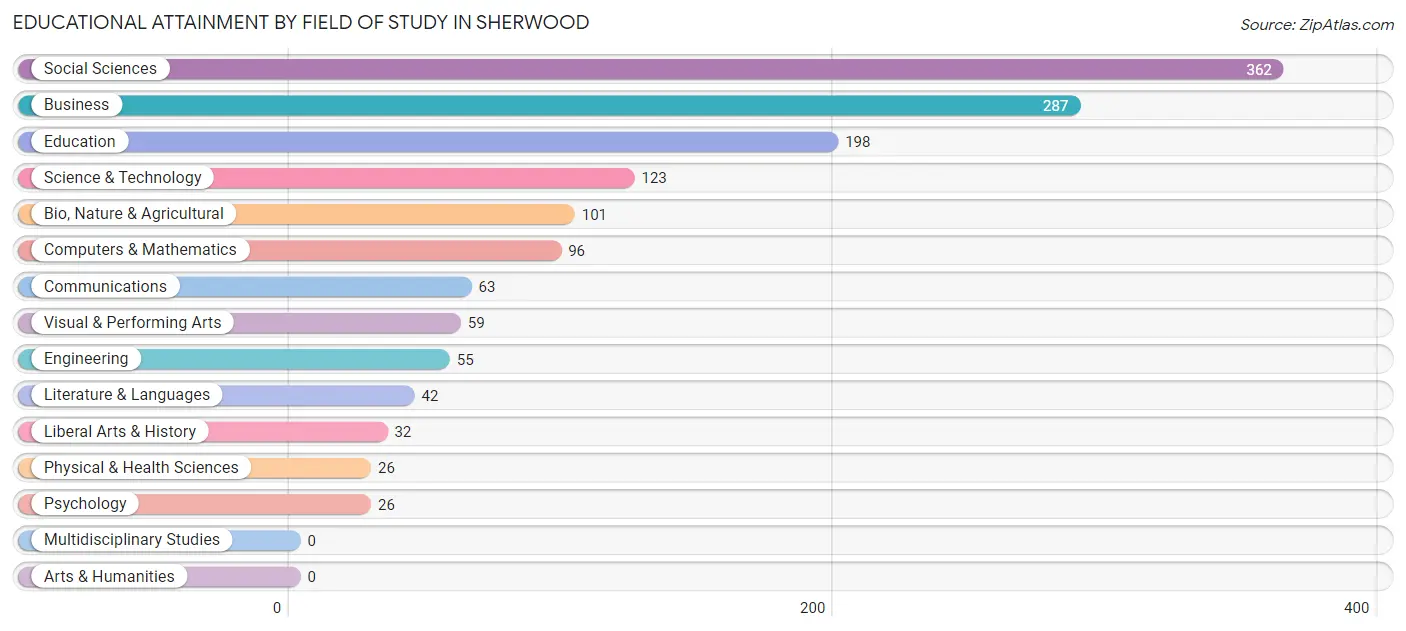
| Field of Study | # Graduates | % Graduates |
| Computers & Mathematics | 96 | 6.5% |
| Bio, Nature & Agricultural | 101 | 6.9% |
| Physical & Health Sciences | 26 | 1.8% |
| Psychology | 26 | 1.8% |
| Social Sciences | 362 | 24.6% |
| Engineering | 55 | 3.7% |
| Multidisciplinary Studies | 0 | 0.0% |
| Science & Technology | 123 | 8.4% |
| Business | 287 | 19.5% |
| Education | 198 | 13.5% |
| Literature & Languages | 42 | 2.9% |
| Liberal Arts & History | 32 | 2.2% |
| Visual & Performing Arts | 59 | 4.0% |
| Communications | 63 | 4.3% |
| Arts & Humanities | 0 | 0.0% |
| Total | 1,470 | 100.0% |
Transportation & Commute in Sherwood
Vehicle Availability by Sex in Sherwood
The most prevalent vehicle ownership categories in Sherwood are males with 2 vehicles (462, accounting for 58.7%) and females with 2 vehicles (689, making up 44.6%).
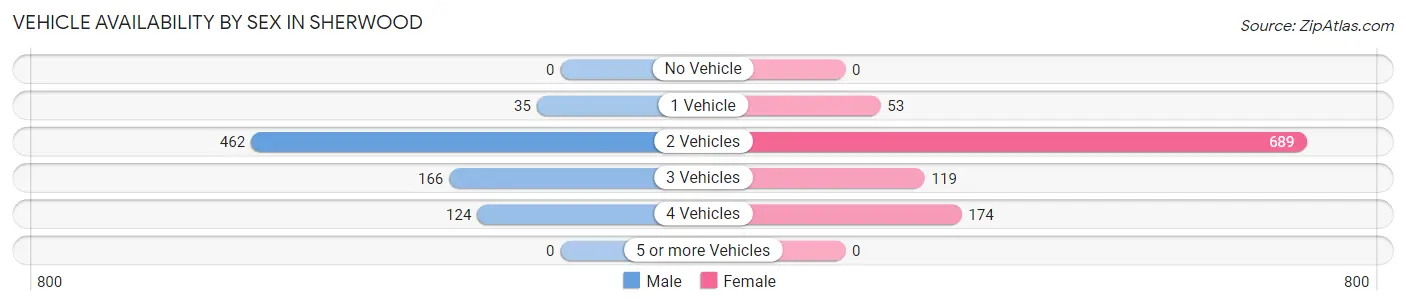
| Vehicles Available | Male | Female |
| No Vehicle | 0 (0.0%) | 0 (0.0%) |
| 1 Vehicle | 35 (4.4%) | 53 (5.1%) |
| 2 Vehicles | 462 (58.7%) | 689 (66.6%) |
| 3 Vehicles | 166 (21.1%) | 119 (11.5%) |
| 4 Vehicles | 124 (15.8%) | 174 (16.8%) |
| 5 or more Vehicles | 0 (0.0%) | 0 (0.0%) |
| Total | 787 (100.0%) | 1,035 (100.0%) |
Commute Time in Sherwood
The most frequently occuring commute durations in Sherwood are 10 to 14 minutes (359 commuters, 25.9%), 5 to 9 minutes (255 commuters, 18.4%), and 15 to 19 minutes (186 commuters, 13.4%).
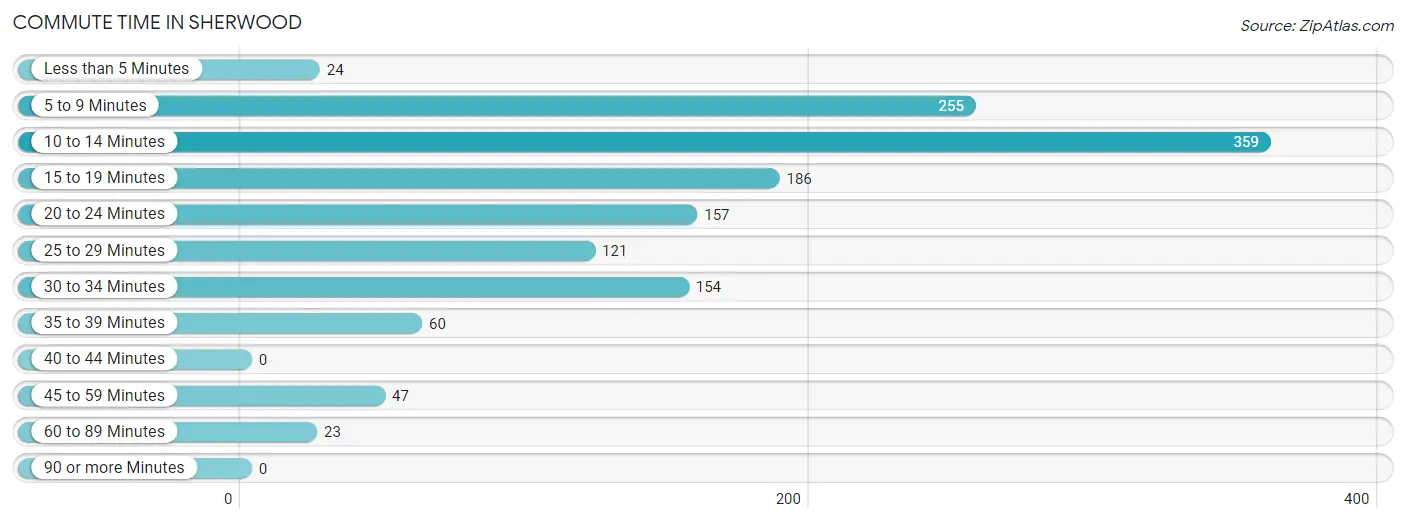
| Commute Time | # Commuters | % Commuters |
| Less than 5 Minutes | 24 | 1.7% |
| 5 to 9 Minutes | 255 | 18.4% |
| 10 to 14 Minutes | 359 | 25.9% |
| 15 to 19 Minutes | 186 | 13.4% |
| 20 to 24 Minutes | 157 | 11.3% |
| 25 to 29 Minutes | 121 | 8.7% |
| 30 to 34 Minutes | 154 | 11.1% |
| 35 to 39 Minutes | 60 | 4.3% |
| 40 to 44 Minutes | 0 | 0.0% |
| 45 to 59 Minutes | 47 | 3.4% |
| 60 to 89 Minutes | 23 | 1.7% |
| 90 or more Minutes | 0 | 0.0% |
Commute Time by Sex in Sherwood
The most common commute times in Sherwood are 20 to 24 minutes (89 commuters, 16.1%) for males and 10 to 14 minutes (277 commuters, 33.3%) for females.
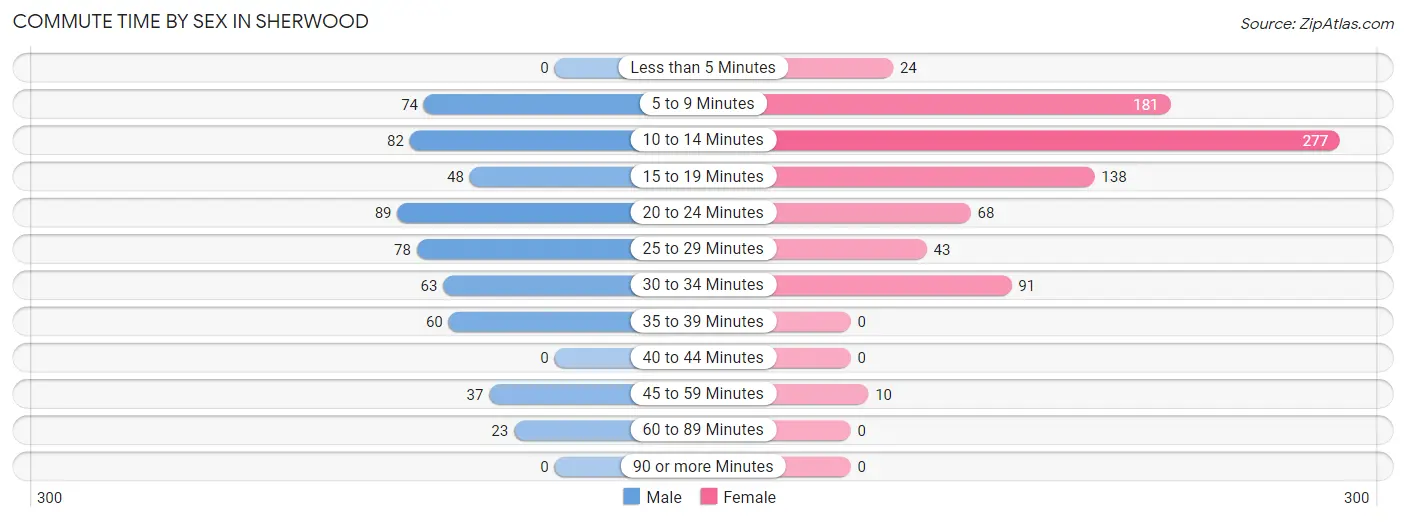
| Commute Time | Male | Female |
| Less than 5 Minutes | 0 (0.0%) | 24 (2.9%) |
| 5 to 9 Minutes | 74 (13.4%) | 181 (21.7%) |
| 10 to 14 Minutes | 82 (14.8%) | 277 (33.3%) |
| 15 to 19 Minutes | 48 (8.7%) | 138 (16.6%) |
| 20 to 24 Minutes | 89 (16.1%) | 68 (8.2%) |
| 25 to 29 Minutes | 78 (14.1%) | 43 (5.2%) |
| 30 to 34 Minutes | 63 (11.4%) | 91 (10.9%) |
| 35 to 39 Minutes | 60 (10.8%) | 0 (0.0%) |
| 40 to 44 Minutes | 0 (0.0%) | 0 (0.0%) |
| 45 to 59 Minutes | 37 (6.7%) | 10 (1.2%) |
| 60 to 89 Minutes | 23 (4.2%) | 0 (0.0%) |
| 90 or more Minutes | 0 (0.0%) | 0 (0.0%) |
Time of Departure to Work by Sex in Sherwood
The most frequent times of departure to work in Sherwood are 8:00 AM to 8:29 AM (192, 34.7%) for males and 7:00 AM to 7:29 AM (323, 38.8%) for females.
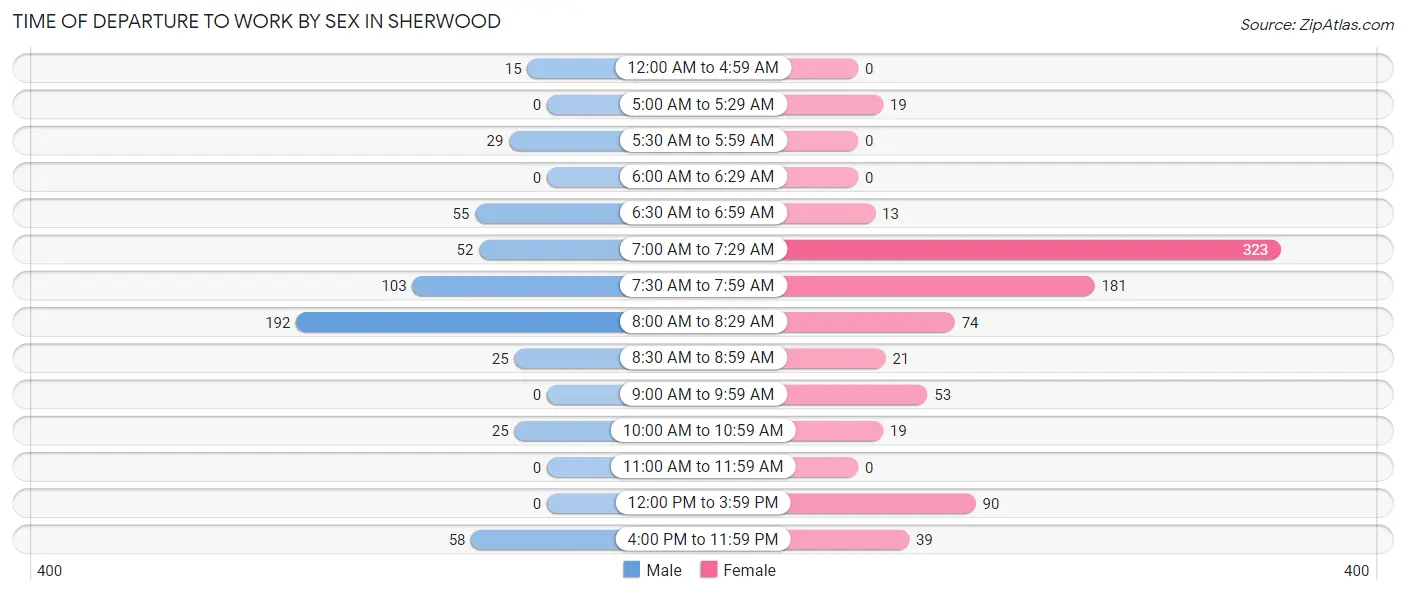
| Time of Departure | Male | Female |
| 12:00 AM to 4:59 AM | 15 (2.7%) | 0 (0.0%) |
| 5:00 AM to 5:29 AM | 0 (0.0%) | 19 (2.3%) |
| 5:30 AM to 5:59 AM | 29 (5.2%) | 0 (0.0%) |
| 6:00 AM to 6:29 AM | 0 (0.0%) | 0 (0.0%) |
| 6:30 AM to 6:59 AM | 55 (9.9%) | 13 (1.6%) |
| 7:00 AM to 7:29 AM | 52 (9.4%) | 323 (38.8%) |
| 7:30 AM to 7:59 AM | 103 (18.6%) | 181 (21.7%) |
| 8:00 AM to 8:29 AM | 192 (34.7%) | 74 (8.9%) |
| 8:30 AM to 8:59 AM | 25 (4.5%) | 21 (2.5%) |
| 9:00 AM to 9:59 AM | 0 (0.0%) | 53 (6.4%) |
| 10:00 AM to 10:59 AM | 25 (4.5%) | 19 (2.3%) |
| 11:00 AM to 11:59 AM | 0 (0.0%) | 0 (0.0%) |
| 12:00 PM to 3:59 PM | 0 (0.0%) | 90 (10.8%) |
| 4:00 PM to 11:59 PM | 58 (10.5%) | 39 (4.7%) |
| Total | 554 (100.0%) | 832 (100.0%) |
Housing Occupancy in Sherwood
Occupancy by Ownership in Sherwood
Of the total 1,393 dwellings in Sherwood, owner-occupied units account for 1,262 (90.6%), while renter-occupied units make up 131 (9.4%).
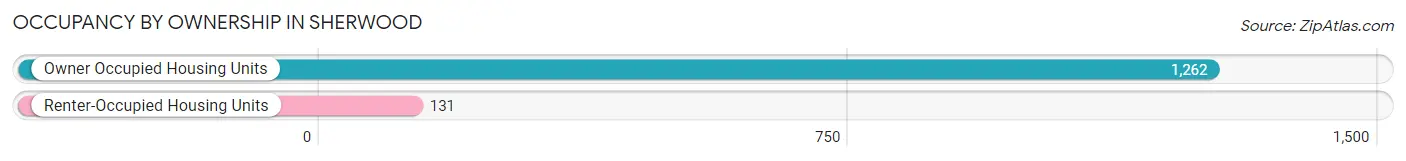
| Occupancy | # Housing Units | % Housing Units |
| Owner Occupied Housing Units | 1,262 | 90.6% |
| Renter-Occupied Housing Units | 131 | 9.4% |
| Total Occupied Housing Units | 1,393 | 100.0% |
Occupancy by Household Size in Sherwood
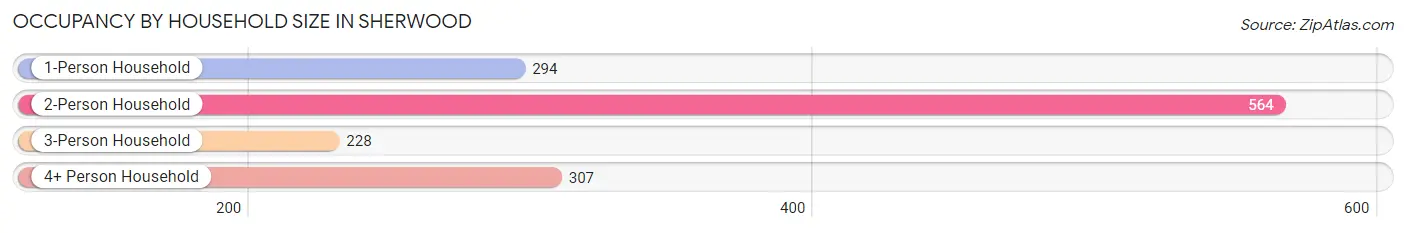
| Household Size | # Housing Units | % Housing Units |
| 1-Person Household | 294 | 21.1% |
| 2-Person Household | 564 | 40.5% |
| 3-Person Household | 228 | 16.4% |
| 4+ Person Household | 307 | 22.0% |
| Total Housing Units | 1,393 | 100.0% |
Occupancy by Ownership by Household Size in Sherwood
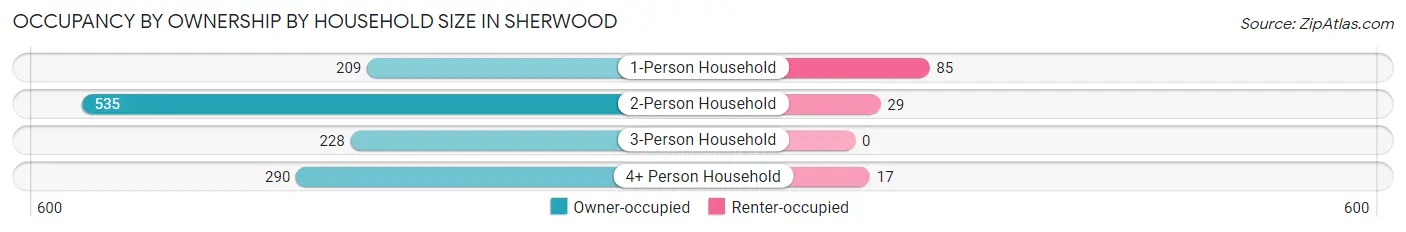
| Household Size | Owner-occupied | Renter-occupied |
| 1-Person Household | 209 (71.1%) | 85 (28.9%) |
| 2-Person Household | 535 (94.9%) | 29 (5.1%) |
| 3-Person Household | 228 (100.0%) | 0 (0.0%) |
| 4+ Person Household | 290 (94.5%) | 17 (5.5%) |
| Total Housing Units | 1,262 (90.6%) | 131 (9.4%) |
Occupancy by Educational Attainment in Sherwood
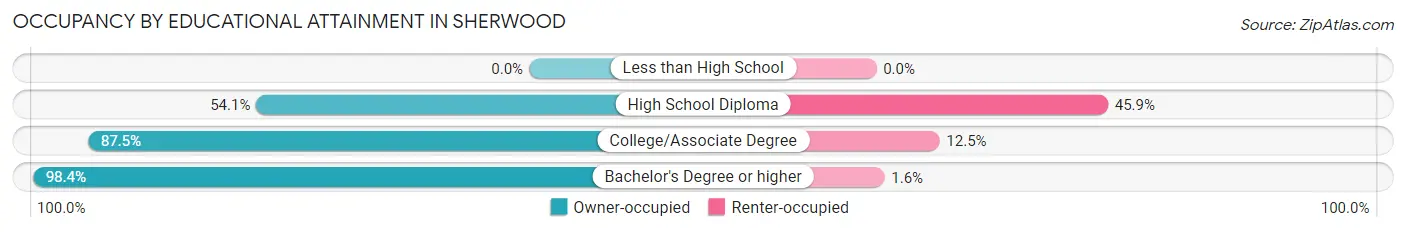
| Household Size | Owner-occupied | Renter-occupied |
| Less than High School | 0 (0.0%) | 0 (0.0%) |
| High School Diploma | 93 (54.1%) | 79 (45.9%) |
| College/Associate Degree | 258 (87.5%) | 37 (12.5%) |
| Bachelor's Degree or higher | 911 (98.4%) | 15 (1.6%) |
Occupancy by Age of Householder in Sherwood
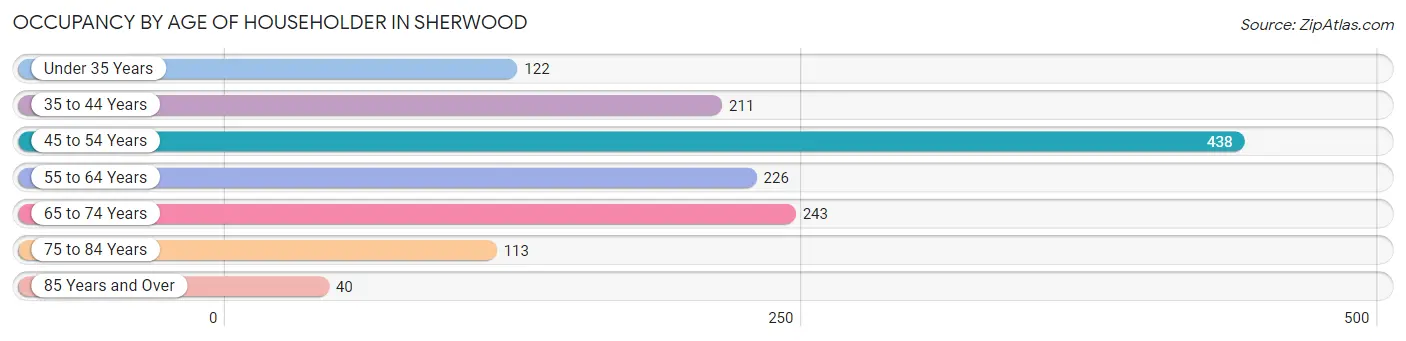
| Age Bracket | # Households | % Households |
| Under 35 Years | 122 | 8.8% |
| 35 to 44 Years | 211 | 15.1% |
| 45 to 54 Years | 438 | 31.4% |
| 55 to 64 Years | 226 | 16.2% |
| 65 to 74 Years | 243 | 17.4% |
| 75 to 84 Years | 113 | 8.1% |
| 85 Years and Over | 40 | 2.9% |
| Total | 1,393 | 100.0% |
Housing Finances in Sherwood
Median Income by Occupancy in Sherwood
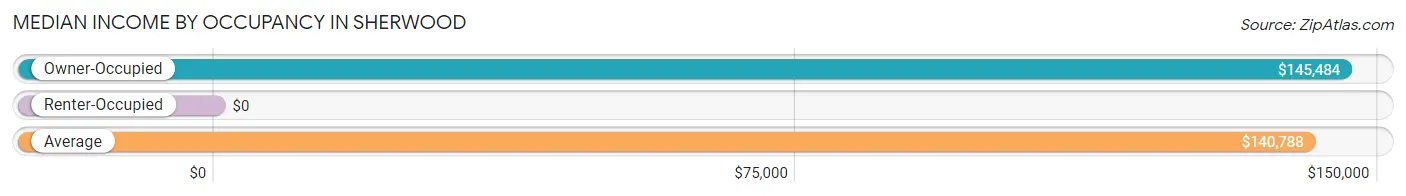
| Occupancy Type | # Households | Median Income |
| Owner-Occupied | 1,262 (90.6%) | $145,484 |
| Renter-Occupied | 131 (9.4%) | $0 |
| Average | 1,393 (100.0%) | $140,788 |
Occupancy by Householder Income Bracket in Sherwood
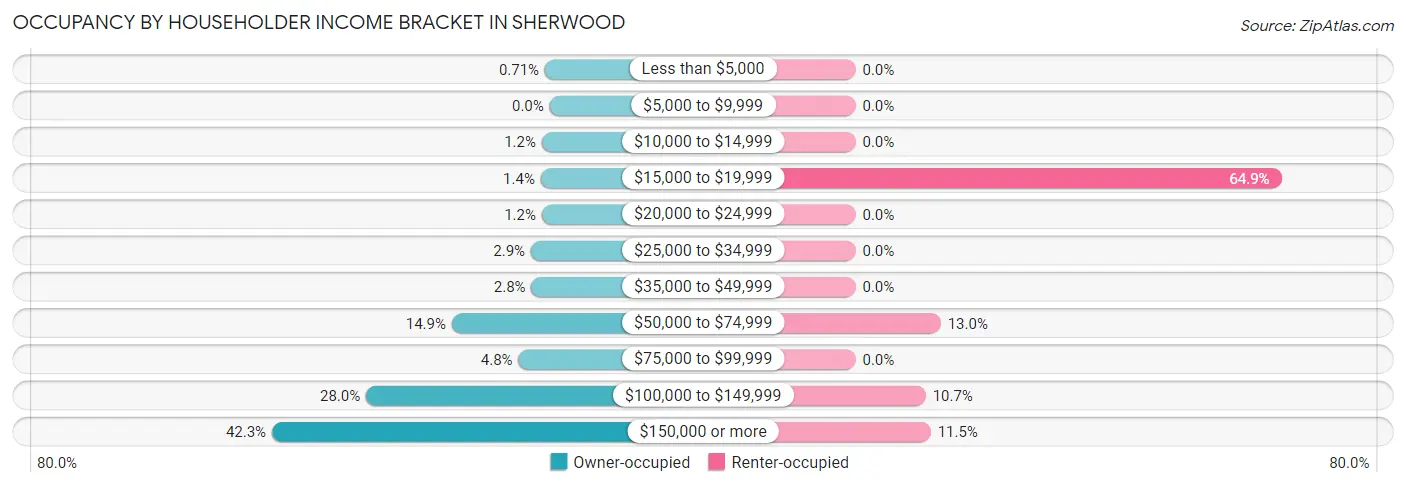
| Income Bracket | Owner-occupied | Renter-occupied |
| Less than $5,000 | 9 (0.7%) | 0 (0.0%) |
| $5,000 to $9,999 | 0 (0.0%) | 0 (0.0%) |
| $10,000 to $14,999 | 15 (1.2%) | 0 (0.0%) |
| $15,000 to $19,999 | 17 (1.3%) | 85 (64.9%) |
| $20,000 to $24,999 | 15 (1.2%) | 0 (0.0%) |
| $25,000 to $34,999 | 36 (2.9%) | 0 (0.0%) |
| $35,000 to $49,999 | 35 (2.8%) | 0 (0.0%) |
| $50,000 to $74,999 | 188 (14.9%) | 17 (13.0%) |
| $75,000 to $99,999 | 60 (4.8%) | 0 (0.0%) |
| $100,000 to $149,999 | 353 (28.0%) | 14 (10.7%) |
| $150,000 or more | 534 (42.3%) | 15 (11.5%) |
| Total | 1,262 (100.0%) | 131 (100.0%) |
Monthly Housing Cost Tiers in Sherwood
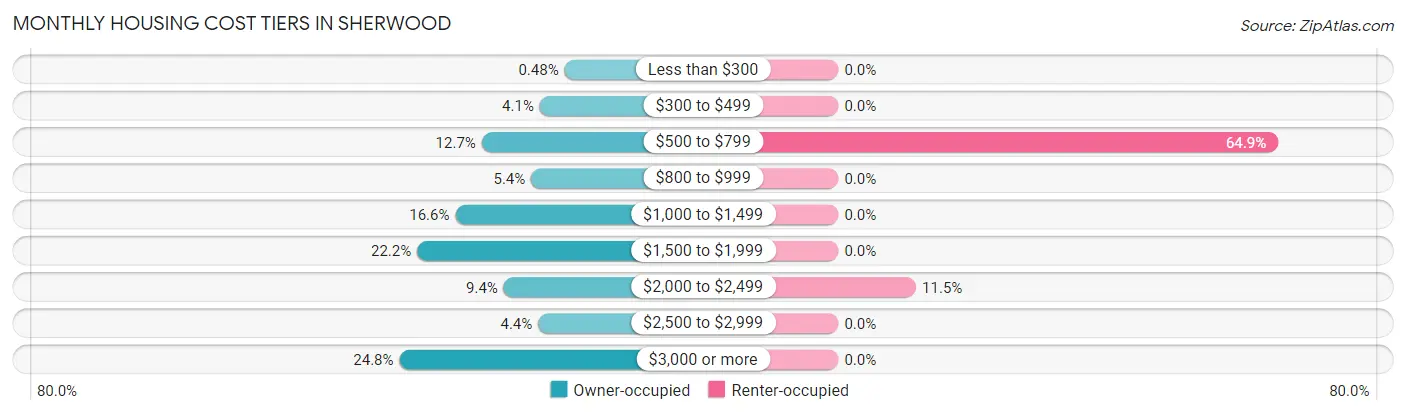
| Monthly Cost | Owner-occupied | Renter-occupied |
| Less than $300 | 6 (0.5%) | 0 (0.0%) |
| $300 to $499 | 52 (4.1%) | 0 (0.0%) |
| $500 to $799 | 160 (12.7%) | 85 (64.9%) |
| $800 to $999 | 68 (5.4%) | 0 (0.0%) |
| $1,000 to $1,499 | 209 (16.6%) | 0 (0.0%) |
| $1,500 to $1,999 | 280 (22.2%) | 0 (0.0%) |
| $2,000 to $2,499 | 119 (9.4%) | 15 (11.5%) |
| $2,500 to $2,999 | 55 (4.4%) | 0 (0.0%) |
| $3,000 or more | 313 (24.8%) | 0 (0.0%) |
| Total | 1,262 (100.0%) | 131 (100.0%) |
Physical Housing Characteristics in Sherwood
Housing Structures in Sherwood

| Structure Type | # Housing Units | % Housing Units |
| Single Unit, Detached | 1,373 | 98.6% |
| Single Unit, Attached | 0 | 0.0% |
| 2 Unit Apartments | 0 | 0.0% |
| 3 or 4 Unit Apartments | 0 | 0.0% |
| 5 to 9 Unit Apartments | 0 | 0.0% |
| 10 or more Apartments | 20 | 1.4% |
| Mobile Home / Other | 0 | 0.0% |
| Total | 1,393 | 100.0% |
Housing Structures by Occupancy in Sherwood
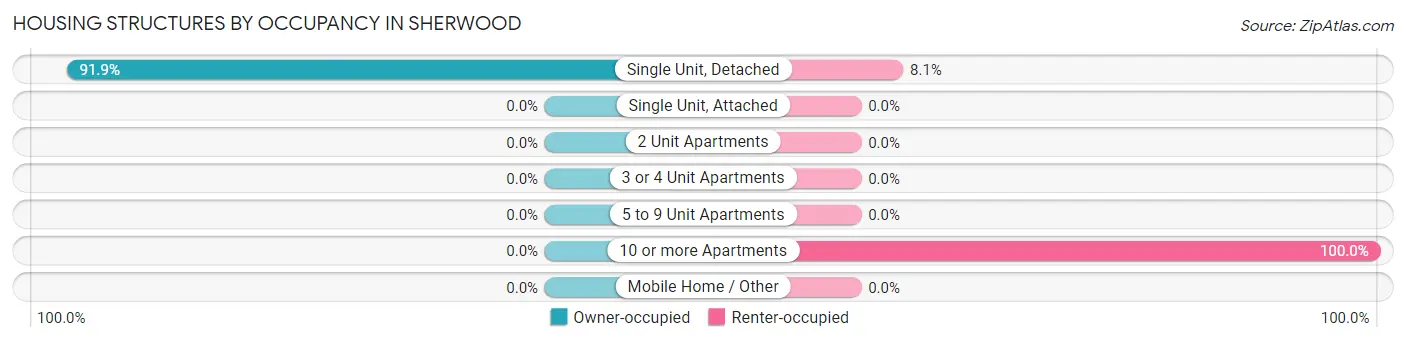
| Structure Type | Owner-occupied | Renter-occupied |
| Single Unit, Detached | 1,262 (91.9%) | 111 (8.1%) |
| Single Unit, Attached | 0 (0.0%) | 0 (0.0%) |
| 2 Unit Apartments | 0 (0.0%) | 0 (0.0%) |
| 3 or 4 Unit Apartments | 0 (0.0%) | 0 (0.0%) |
| 5 to 9 Unit Apartments | 0 (0.0%) | 0 (0.0%) |
| 10 or more Apartments | 0 (0.0%) | 20 (100.0%) |
| Mobile Home / Other | 0 (0.0%) | 0 (0.0%) |
| Total | 1,262 (90.6%) | 131 (9.4%) |
Housing Structures by Number of Rooms in Sherwood
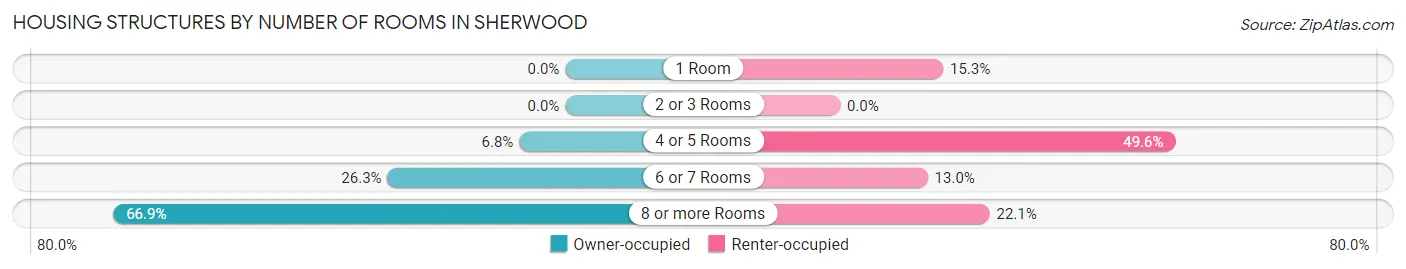
| Number of Rooms | Owner-occupied | Renter-occupied |
| 1 Room | 0 (0.0%) | 20 (15.3%) |
| 2 or 3 Rooms | 0 (0.0%) | 0 (0.0%) |
| 4 or 5 Rooms | 86 (6.8%) | 65 (49.6%) |
| 6 or 7 Rooms | 332 (26.3%) | 17 (13.0%) |
| 8 or more Rooms | 844 (66.9%) | 29 (22.1%) |
| Total | 1,262 (100.0%) | 131 (100.0%) |
Housing Structure by Heating Type in Sherwood
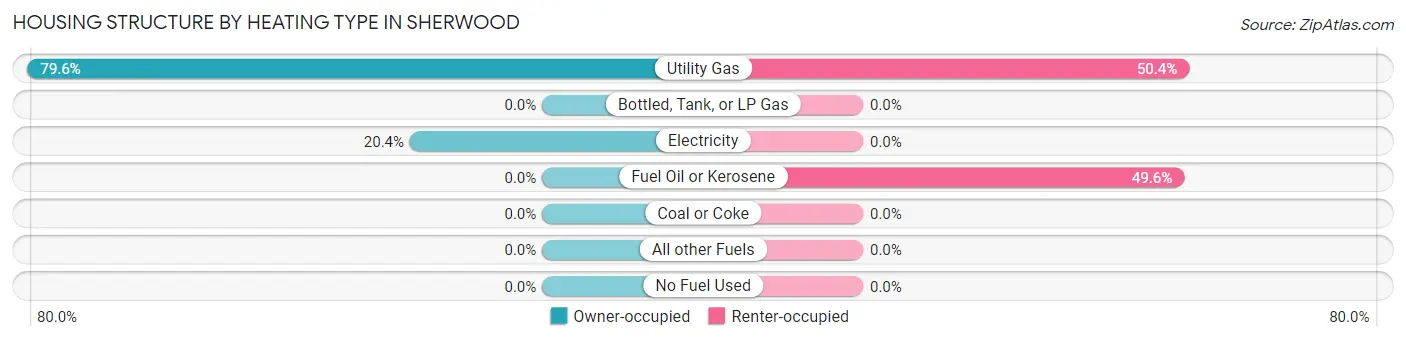
| Heating Type | Owner-occupied | Renter-occupied |
| Utility Gas | 1,004 (79.6%) | 66 (50.4%) |
| Bottled, Tank, or LP Gas | 0 (0.0%) | 0 (0.0%) |
| Electricity | 258 (20.4%) | 0 (0.0%) |
| Fuel Oil or Kerosene | 0 (0.0%) | 65 (49.6%) |
| Coal or Coke | 0 (0.0%) | 0 (0.0%) |
| All other Fuels | 0 (0.0%) | 0 (0.0%) |
| No Fuel Used | 0 (0.0%) | 0 (0.0%) |
| Total | 1,262 (100.0%) | 131 (100.0%) |
Household Vehicle Usage in Sherwood
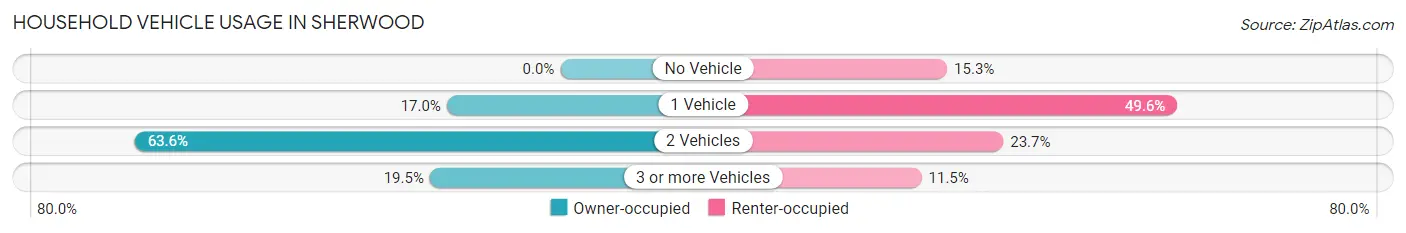
| Vehicles per Household | Owner-occupied | Renter-occupied |
| No Vehicle | 0 (0.0%) | 20 (15.3%) |
| 1 Vehicle | 214 (17.0%) | 65 (49.6%) |
| 2 Vehicles | 802 (63.5%) | 31 (23.7%) |
| 3 or more Vehicles | 246 (19.5%) | 15 (11.5%) |
| Total | 1,262 (100.0%) | 131 (100.0%) |
Real Estate & Mortgages in Sherwood
Real Estate and Mortgage Overview in Sherwood
| Characteristic | Without Mortgage | With Mortgage |
| Housing Units | 301 | 961 |
| Median Property Value | $245,800 | $310,700 |
| Median Household Income | $132,986 | $483 |
| Monthly Housing Costs | $656 | $313 |
| Real Estate Taxes | $3,864 | $0 |
Property Value by Mortgage Status in Sherwood
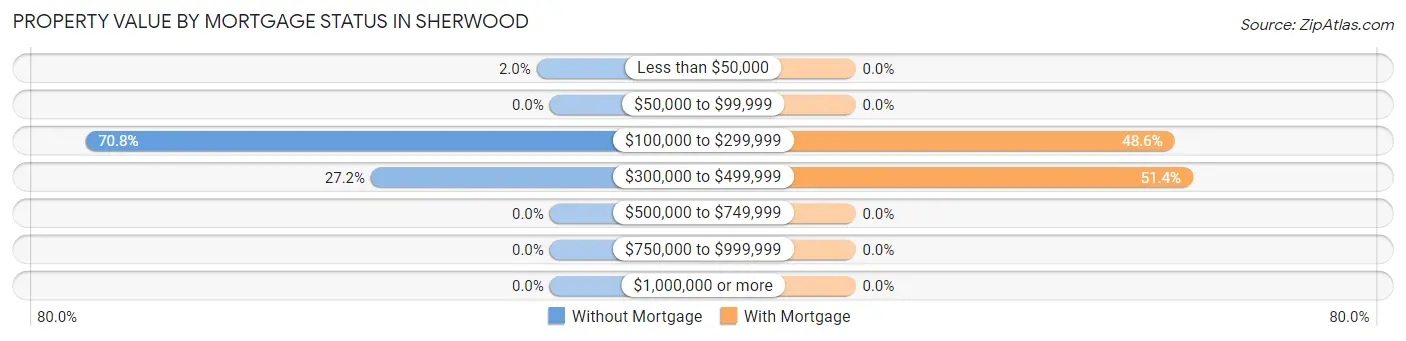
| Property Value | Without Mortgage | With Mortgage |
| Less than $50,000 | 6 (2.0%) | 0 (0.0%) |
| $50,000 to $99,999 | 0 (0.0%) | 0 (0.0%) |
| $100,000 to $299,999 | 213 (70.8%) | 467 (48.6%) |
| $300,000 to $499,999 | 82 (27.2%) | 494 (51.4%) |
| $500,000 to $749,999 | 0 (0.0%) | 0 (0.0%) |
| $750,000 to $999,999 | 0 (0.0%) | 0 (0.0%) |
| $1,000,000 or more | 0 (0.0%) | 0 (0.0%) |
| Total | 301 (100.0%) | 961 (100.0%) |
Household Income by Mortgage Status in Sherwood
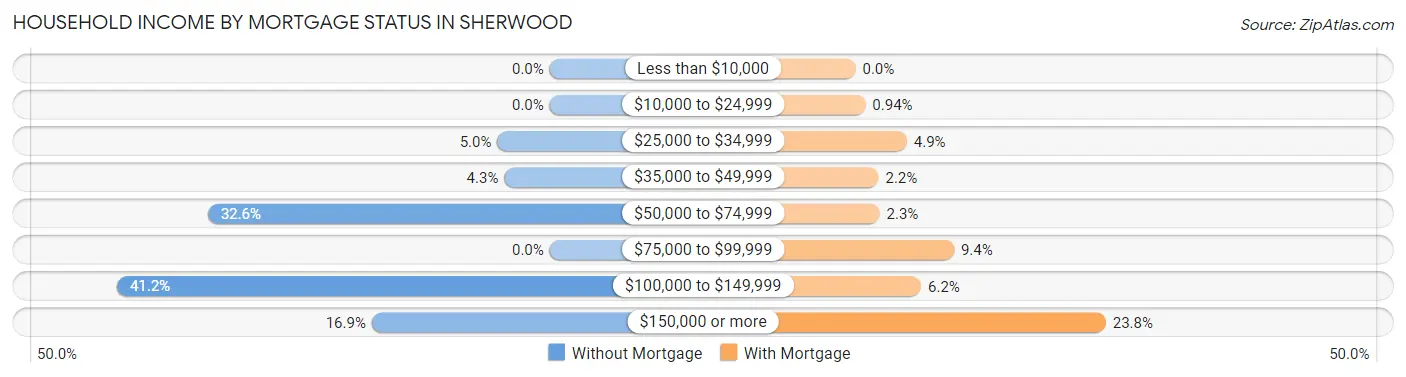
| Household Income | Without Mortgage | With Mortgage |
| Less than $10,000 | 0 (0.0%) | 0 (0.0%) |
| $10,000 to $24,999 | 0 (0.0%) | 9 (0.9%) |
| $25,000 to $34,999 | 15 (5.0%) | 47 (4.9%) |
| $35,000 to $49,999 | 13 (4.3%) | 21 (2.2%) |
| $50,000 to $74,999 | 98 (32.6%) | 22 (2.3%) |
| $75,000 to $99,999 | 0 (0.0%) | 90 (9.4%) |
| $100,000 to $149,999 | 124 (41.2%) | 60 (6.2%) |
| $150,000 or more | 51 (16.9%) | 229 (23.8%) |
| Total | 301 (100.0%) | 961 (100.0%) |
Property Value to Household Income Ratio in Sherwood
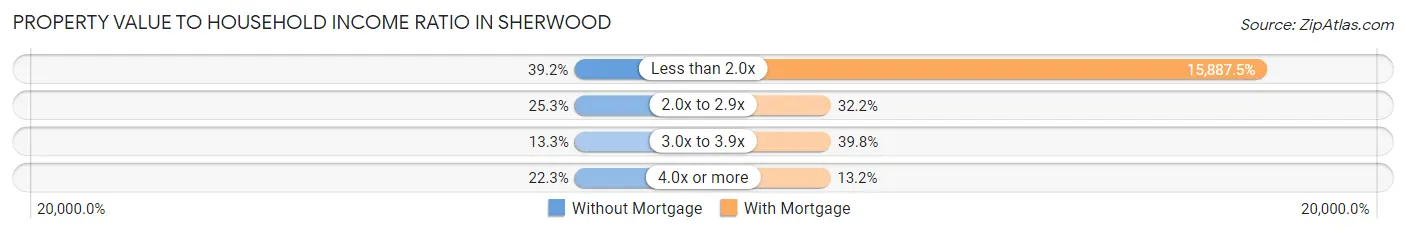
| Value-to-Income Ratio | Without Mortgage | With Mortgage |
| Less than 2.0x | 118 (39.2%) | 152,679 (15,887.5%) |
| 2.0x to 2.9x | 76 (25.3%) | 309 (32.2%) |
| 3.0x to 3.9x | 40 (13.3%) | 382 (39.8%) |
| 4.0x or more | 67 (22.3%) | 127 (13.2%) |
| Total | 301 (100.0%) | 961 (100.0%) |
Real Estate Taxes by Mortgage Status in Sherwood
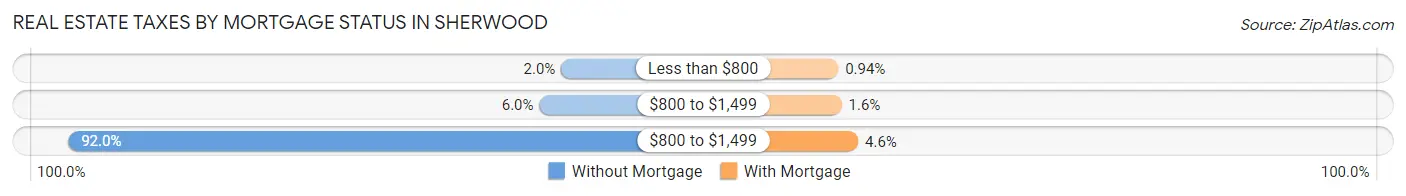
| Property Taxes | Without Mortgage | With Mortgage |
| Less than $800 | 6 (2.0%) | 9 (0.9%) |
| $800 to $1,499 | 18 (6.0%) | 15 (1.6%) |
| $800 to $1,499 | 277 (92.0%) | 44 (4.6%) |
| Total | 301 (100.0%) | 961 (100.0%) |
Health & Disability in Sherwood
Health Insurance Coverage by Age in Sherwood
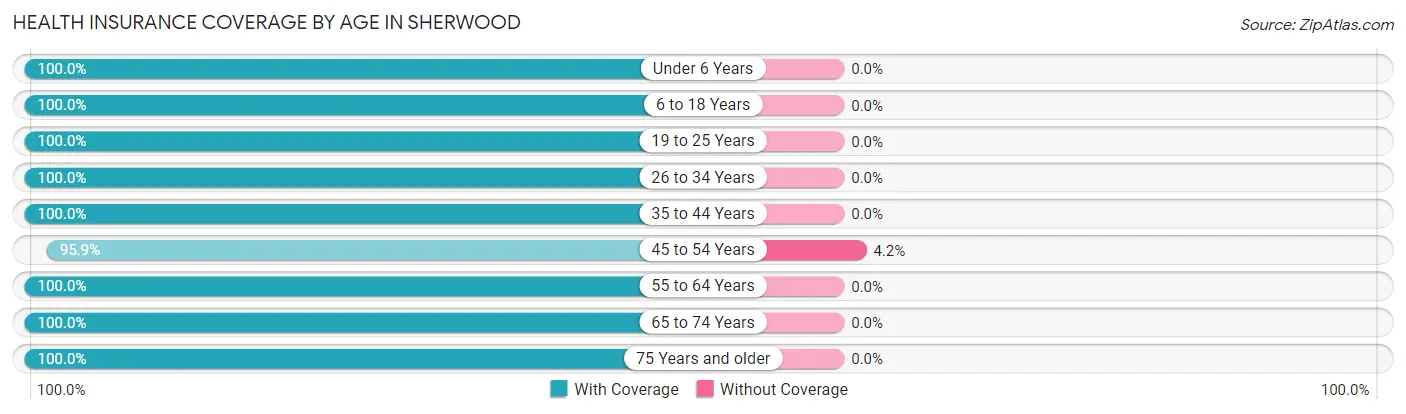
| Age Bracket | With Coverage | Without Coverage |
| Under 6 Years | 392 (100.0%) | 0 (0.0%) |
| 6 to 18 Years | 460 (100.0%) | 0 (0.0%) |
| 19 to 25 Years | 161 (100.0%) | 0 (0.0%) |
| 26 to 34 Years | 239 (100.0%) | 0 (0.0%) |
| 35 to 44 Years | 387 (100.0%) | 0 (0.0%) |
| 45 to 54 Years | 646 (95.9%) | 28 (4.2%) |
| 55 to 64 Years | 424 (100.0%) | 0 (0.0%) |
| 65 to 74 Years | 300 (100.0%) | 0 (0.0%) |
| 75 Years and older | 371 (100.0%) | 0 (0.0%) |
| Total | 3,380 (99.2%) | 28 (0.8%) |
Health Insurance Coverage by Citizenship Status in Sherwood
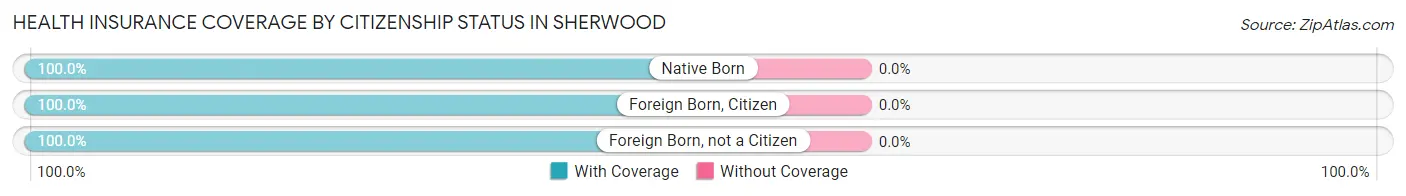
| Citizenship Status | With Coverage | Without Coverage |
| Native Born | 392 (100.0%) | 0 (0.0%) |
| Foreign Born, Citizen | 460 (100.0%) | 0 (0.0%) |
| Foreign Born, not a Citizen | 161 (100.0%) | 0 (0.0%) |
Health Insurance Coverage by Household Income in Sherwood
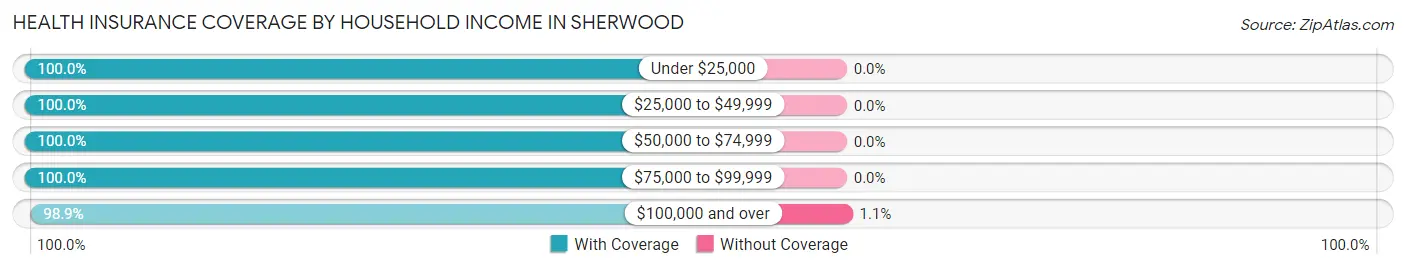
| Household Income | With Coverage | Without Coverage |
| Under $25,000 | 170 (100.0%) | 0 (0.0%) |
| $25,000 to $49,999 | 114 (100.0%) | 0 (0.0%) |
| $50,000 to $74,999 | 413 (100.0%) | 0 (0.0%) |
| $75,000 to $99,999 | 144 (100.0%) | 0 (0.0%) |
| $100,000 and over | 2,539 (98.9%) | 28 (1.1%) |
Public vs Private Health Insurance Coverage by Age in Sherwood
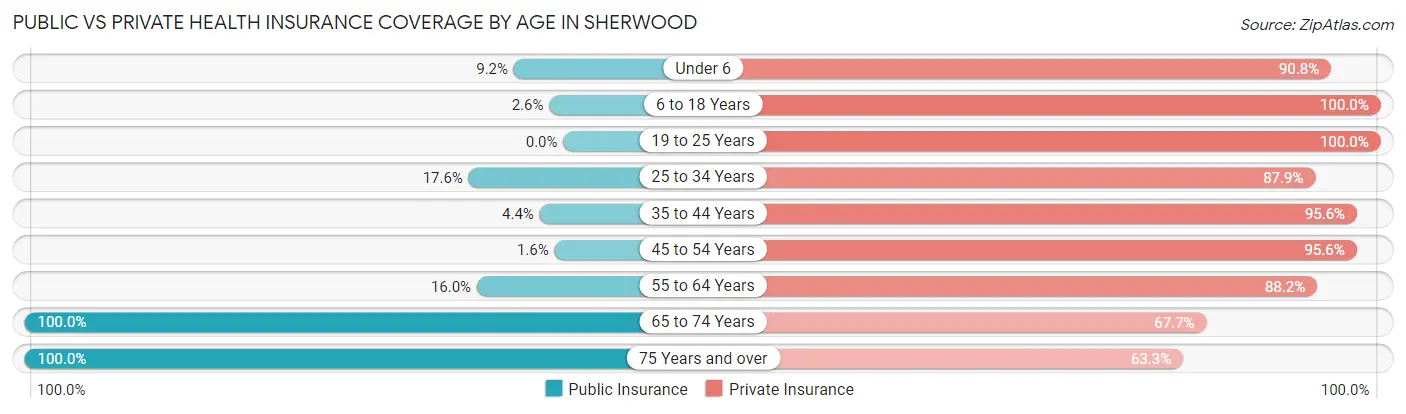
| Age Bracket | Public Insurance | Private Insurance |
| Under 6 | 36 (9.2%) | 356 (90.8%) |
| 6 to 18 Years | 12 (2.6%) | 460 (100.0%) |
| 19 to 25 Years | 0 (0.0%) | 161 (100.0%) |
| 25 to 34 Years | 42 (17.6%) | 210 (87.9%) |
| 35 to 44 Years | 17 (4.4%) | 370 (95.6%) |
| 45 to 54 Years | 11 (1.6%) | 644 (95.6%) |
| 55 to 64 Years | 68 (16.0%) | 374 (88.2%) |
| 65 to 74 Years | 300 (100.0%) | 203 (67.7%) |
| 75 Years and over | 371 (100.0%) | 235 (63.3%) |
| Total | 857 (25.2%) | 3,013 (88.4%) |
Disability Status by Sex by Age in Sherwood
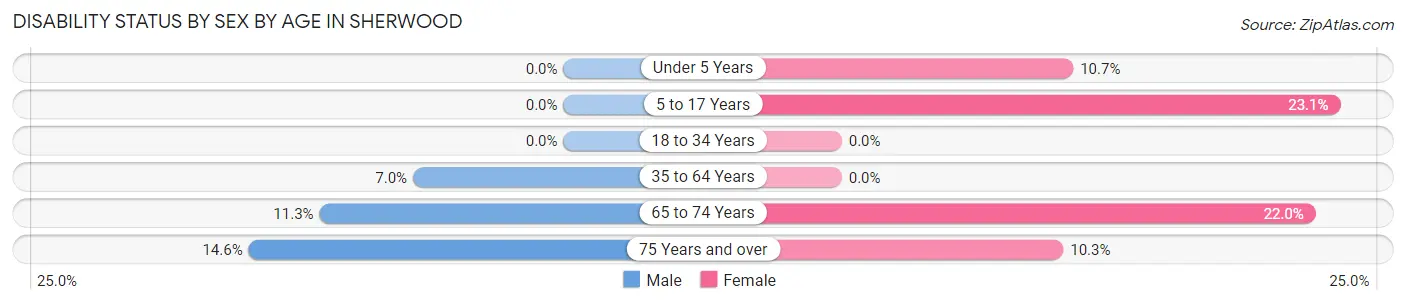
| Age Bracket | Male | Female |
| Under 5 Years | 0 (0.0%) | 16 (10.7%) |
| 5 to 17 Years | 0 (0.0%) | 65 (23.1%) |
| 18 to 34 Years | 0 (0.0%) | 0 (0.0%) |
| 35 to 64 Years | 42 (7.0%) | 0 (0.0%) |
| 65 to 74 Years | 18 (11.3%) | 31 (22.0%) |
| 75 Years and over | 13 (14.6%) | 29 (10.3%) |
Disability Class by Sex by Age in Sherwood
Disability Class: Hearing Difficulty
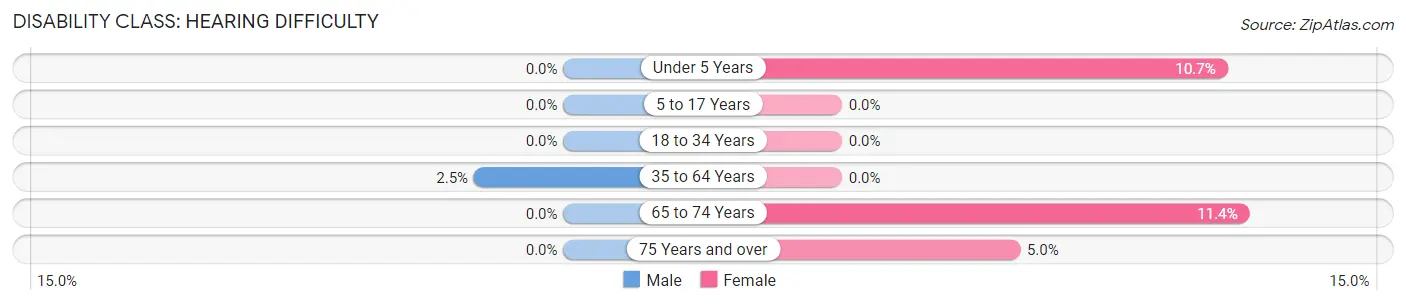
| Age Bracket | Male | Female |
| Under 5 Years | 0 (0.0%) | 16 (10.7%) |
| 5 to 17 Years | 0 (0.0%) | 0 (0.0%) |
| 18 to 34 Years | 0 (0.0%) | 0 (0.0%) |
| 35 to 64 Years | 15 (2.5%) | 0 (0.0%) |
| 65 to 74 Years | 0 (0.0%) | 16 (11.4%) |
| 75 Years and over | 0 (0.0%) | 14 (5.0%) |
Disability Class: Vision Difficulty
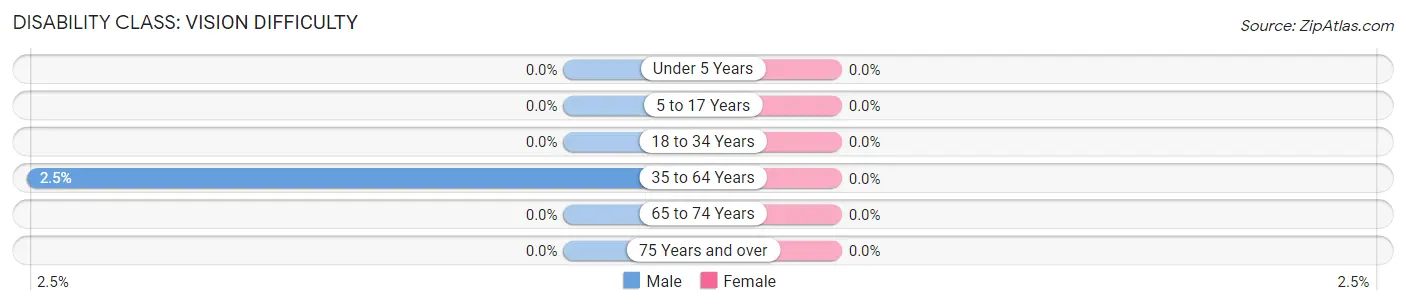
| Age Bracket | Male | Female |
| Under 5 Years | 0 (0.0%) | 0 (0.0%) |
| 5 to 17 Years | 0 (0.0%) | 0 (0.0%) |
| 18 to 34 Years | 0 (0.0%) | 0 (0.0%) |
| 35 to 64 Years | 15 (2.5%) | 0 (0.0%) |
| 65 to 74 Years | 0 (0.0%) | 0 (0.0%) |
| 75 Years and over | 0 (0.0%) | 0 (0.0%) |
Disability Class: Cognitive Difficulty
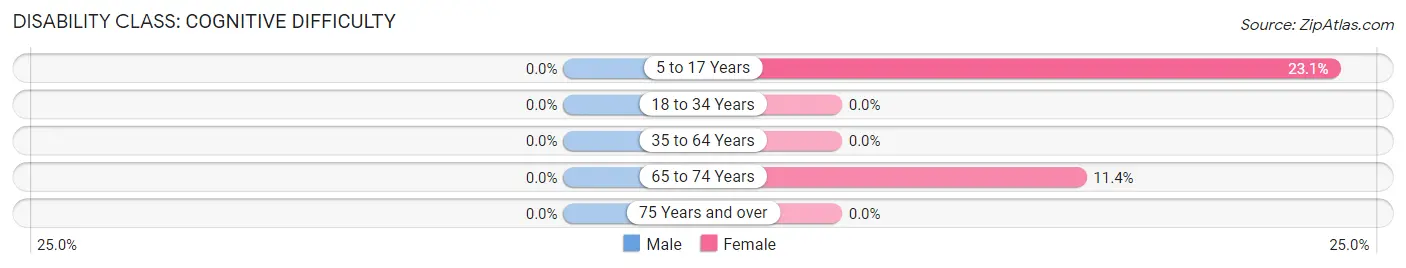
| Age Bracket | Male | Female |
| 5 to 17 Years | 0 (0.0%) | 65 (23.1%) |
| 18 to 34 Years | 0 (0.0%) | 0 (0.0%) |
| 35 to 64 Years | 0 (0.0%) | 0 (0.0%) |
| 65 to 74 Years | 0 (0.0%) | 16 (11.4%) |
| 75 Years and over | 0 (0.0%) | 0 (0.0%) |
Disability Class: Ambulatory Difficulty
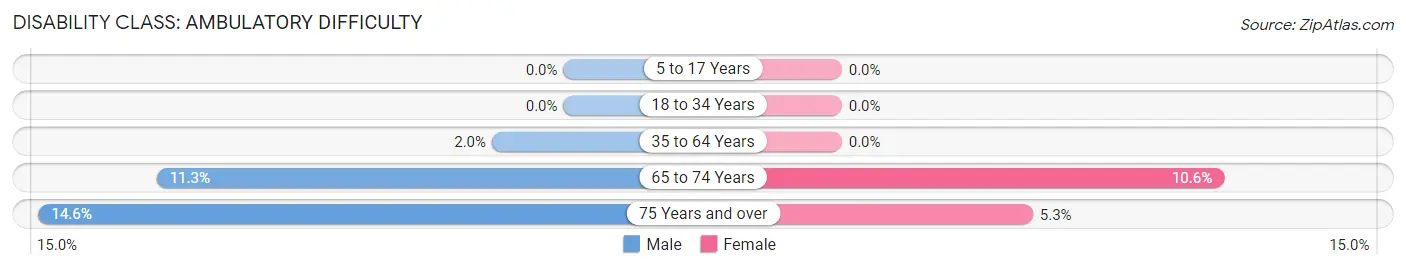
| Age Bracket | Male | Female |
| 5 to 17 Years | 0 (0.0%) | 0 (0.0%) |
| 18 to 34 Years | 0 (0.0%) | 0 (0.0%) |
| 35 to 64 Years | 12 (2.0%) | 0 (0.0%) |
| 65 to 74 Years | 18 (11.3%) | 15 (10.6%) |
| 75 Years and over | 13 (14.6%) | 15 (5.3%) |
Disability Class: Self-Care Difficulty
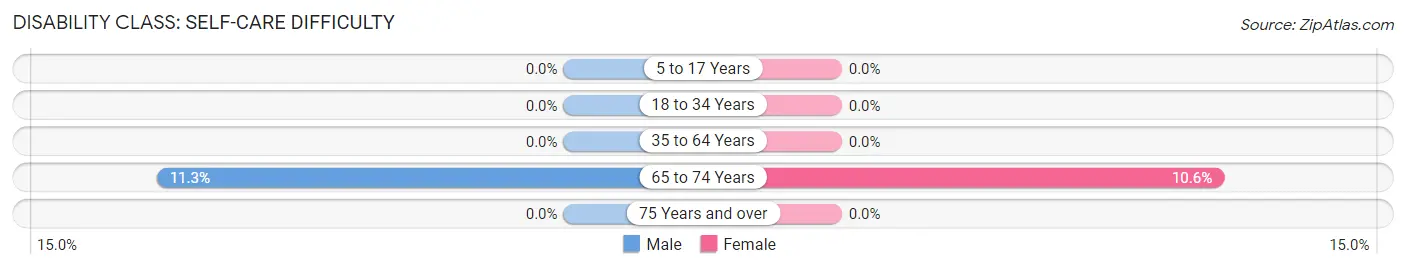
| Age Bracket | Male | Female |
| 5 to 17 Years | 0 (0.0%) | 0 (0.0%) |
| 18 to 34 Years | 0 (0.0%) | 0 (0.0%) |
| 35 to 64 Years | 0 (0.0%) | 0 (0.0%) |
| 65 to 74 Years | 18 (11.3%) | 15 (10.6%) |
| 75 Years and over | 0 (0.0%) | 0 (0.0%) |
Technology Access in Sherwood
Computing Device Access in Sherwood
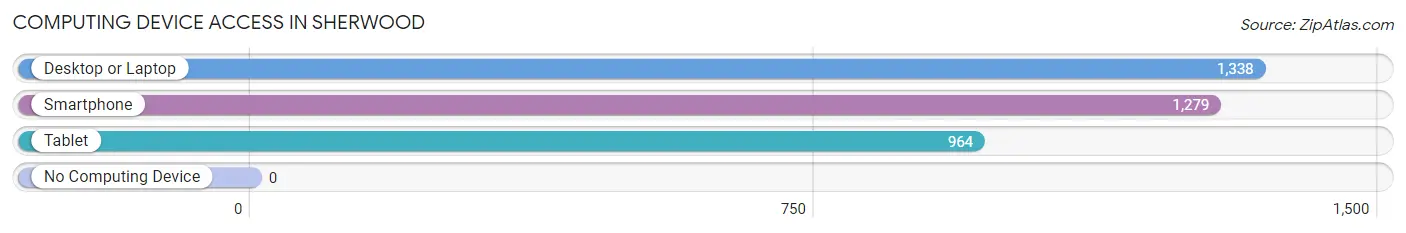
| Device Type | # Households | % Households |
| Desktop or Laptop | 1,338 | 96.1% |
| Smartphone | 1,279 | 91.8% |
| Tablet | 964 | 69.2% |
| No Computing Device | 0 | 0.0% |
| Total | 1,393 | 100.0% |
Internet Access in Sherwood
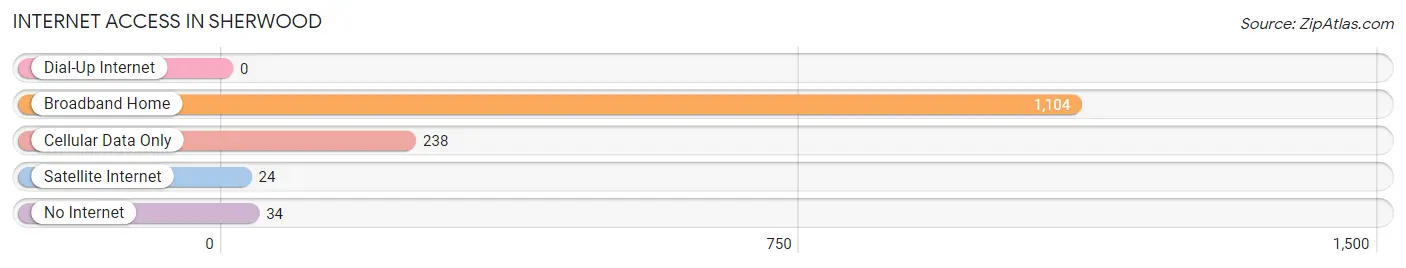
| Internet Type | # Households | % Households |
| Dial-Up Internet | 0 | 0.0% |
| Broadband Home | 1,104 | 79.2% |
| Cellular Data Only | 238 | 17.1% |
| Satellite Internet | 24 | 1.7% |
| No Internet | 34 | 2.4% |
| Total | 1,393 | 100.0% |
Sherwood Summary
Sherwood, Ohio is a small village located in the northwest corner of Lucas County, Ohio. It is situated on the banks of the Maumee River, just south of Toledo. The village has a population of approximately 1,400 people and covers an area of 0.7 square miles.
History
Sherwood was founded in 1835 by a group of settlers from New York. The village was named after the Sherwood Forest in England. The first settlers were primarily farmers and the village grew slowly over the years. In 1854, the village was incorporated and the first mayor was elected.
In the late 19th century, the village began to grow more rapidly. The railroad was built through the village in 1882, connecting it to Toledo and other nearby towns. This allowed for the growth of industry in the area, including a brickyard, a sawmill, and a flour mill.
In the early 20th century, the village continued to grow. The population increased from 1,000 in 1900 to 1,400 in 1920. The village also saw the construction of a new school, a library, and a post office.
Geography
Sherwood is located in the northwest corner of Lucas County, Ohio. It is situated on the banks of the Maumee River, just south of Toledo. The village covers an area of 0.7 square miles and is bordered by the towns of Maumee, Waterville, and Whitehouse.
The terrain of the village is mostly flat, with some rolling hills in the northern part of the village. The climate is humid continental, with hot summers and cold winters. The average annual temperature is around 50 degrees Fahrenheit.
Economy
The economy of Sherwood is largely based on agriculture and manufacturing. The village is home to several farms, which produce a variety of crops, including corn, soybeans, and wheat. The village also has several manufacturing plants, which produce a variety of products, including furniture, auto parts, and plastics.
The village also has several small businesses, including restaurants, retail stores, and service providers. The village is also home to a branch of the Toledo-Lucas County Public Library.
Demographics
As of the 2010 census, the population of Sherwood was 1,400. The racial makeup of the village was 97.4% White, 0.7% African American, 0.3% Native American, 0.3% Asian, and 1.3% from other races. The median household income was $45,000, and the median family income was $50,000.
The village is served by the Toledo Public Schools district. The village is also home to several churches, including the Sherwood United Methodist Church, the Sherwood Baptist Church, and the Sherwood Presbyterian Church.
Conclusion
Sherwood, Ohio is a small village located in the northwest corner of Lucas County, Ohio. It is situated on the banks of the Maumee River, just south of Toledo. The village has a population of approximately 1,400 people and covers an area of 0.7 square miles. The economy of the village is largely based on agriculture and manufacturing, and the village is served by the Toledo Public Schools district. The village is also home to several churches, including the Sherwood United Methodist Church, the Sherwood Baptist Church, and the Sherwood Presbyterian Church.
Common Questions
What is Per Capita Income in Sherwood?
Per Capita income in Sherwood is $58,586.
What is the Median Family Income in Sherwood?
Median Family Income in Sherwood is $149,965.
What is the Median Household income in Sherwood?
Median Household Income in Sherwood is $140,788.
What is Income or Wage Gap in Sherwood?
Income or Wage Gap in Sherwood is 39.3%.
Women in Sherwood earn 60.7 cents for every dollar earned by a man.
What is Inequality or Gini Index in Sherwood?
Inequality or Gini Index in Sherwood is 0.37.
What is the Total Population of Sherwood?
Total Population of Sherwood is 3,408.
What is the Total Male Population of Sherwood?
Total Male Population of Sherwood is 1,442.
What is the Total Female Population of Sherwood?
Total Female Population of Sherwood is 1,966.
What is the Ratio of Males per 100 Females in Sherwood?
There are 73.35 Males per 100 Females in Sherwood.
What is the Ratio of Females per 100 Males in Sherwood?
There are 136.34 Females per 100 Males in Sherwood.
What is the Median Population Age in Sherwood?
Median Population Age in Sherwood is 47.1 Years.
What is the Average Family Size in Sherwood
Average Family Size in Sherwood is 2.8 People.
What is the Average Household Size in Sherwood
Average Household Size in Sherwood is 2.5 People.
How Large is the Labor Force in Sherwood?
There are 1,934 People in the Labor Forcein in Sherwood.
What is the Percentage of People in the Labor Force in Sherwood?
72.7% of People are in the Labor Force in Sherwood.
What is the Unemployment Rate in Sherwood?
Unemployment Rate in Sherwood is 5.1%.