Zip Codes with the Highest Percentage of Population Employed in Computer & Mathematics in Cincinnati, OH
RELATED REPORTS & OPTIONS
Computer & Mathematics
Cincinnati
Compare Zip Codes
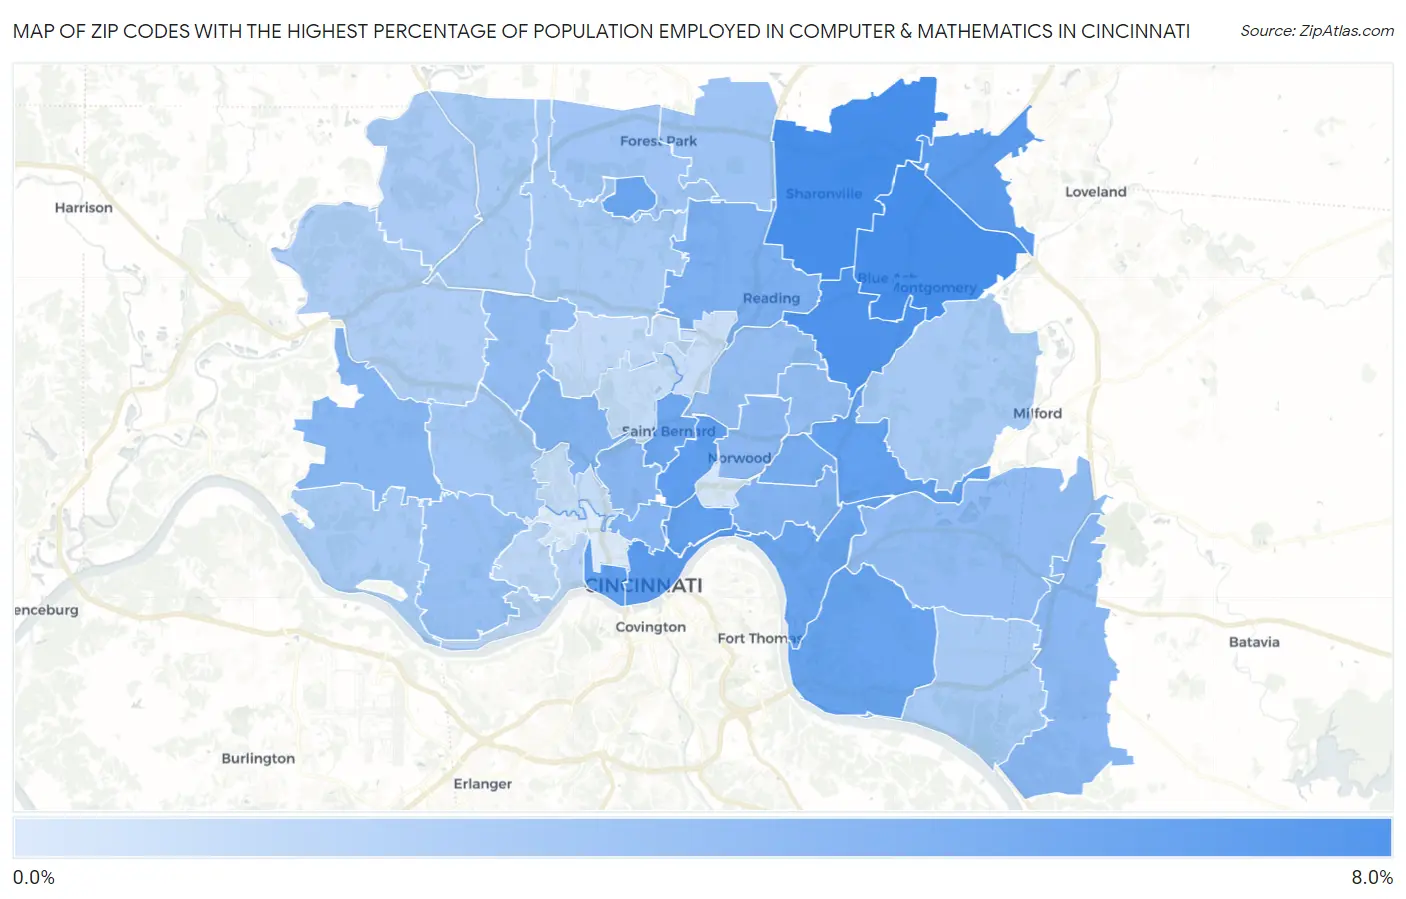
Map of Zip Codes with the Highest Percentage of Population Employed in Computer & Mathematics in Cincinnati
0.30%
6.8%
Zip Codes with the Highest Percentage of Population Employed in Computer & Mathematics in Cincinnati, OH
| Zip Code | % Employed | vs State | vs National | |
| 1. | 45242 | 6.8% | 3.0%(+3.73)#37 | 3.5%(+3.24)#1,755 |
| 2. | 45241 | 6.7% | 3.0%(+3.70)#38 | 3.5%(+3.21)#1,771 |
| 3. | 45236 | 6.3% | 3.0%(+3.29)#48 | 3.5%(+2.80)#2,053 |
| 4. | 45249 | 6.0% | 3.0%(+2.93)#64 | 3.5%(+2.43)#2,348 |
| 5. | 45202 | 5.8% | 3.0%(+2.80)#69 | 3.5%(+2.31)#2,468 |
| 6. | 45229 | 5.7% | 3.0%(+2.63)#72 | 3.5%(+2.14)#2,625 |
| 7. | 45203 | 5.6% | 3.0%(+2.61)#74 | 3.5%(+2.12)#2,640 |
| 8. | 45227 | 5.5% | 3.0%(+2.49)#78 | 3.5%(+2.00)#2,752 |
| 9. | 45206 | 5.5% | 3.0%(+2.46)#83 | 3.5%(+1.97)#2,794 |
| 10. | 45230 | 5.3% | 3.0%(+2.25)#91 | 3.5%(+1.76)#3,023 |
| 11. | 45226 | 5.1% | 3.0%(+2.09)#95 | 3.5%(+1.60)#3,206 |
| 12. | 45218 | 5.1% | 3.0%(+2.08)#96 | 3.5%(+1.59)#3,212 |
| 13. | 45217 | 5.1% | 3.0%(+2.02)#102 | 3.5%(+1.53)#3,291 |
| 14. | 45209 | 4.6% | 3.0%(+1.55)#127 | 3.5%(+1.06)#3,962 |
| 15. | 45215 | 4.5% | 3.0%(+1.45)#131 | 3.5%(+0.956)#4,111 |
| 16. | 45208 | 4.2% | 3.0%(+1.13)#147 | 3.5%(+0.639)#4,685 |
| 17. | 45219 | 4.1% | 3.0%(+1.03)#153 | 3.5%(+0.542)#4,892 |
| 18. | 45223 | 4.0% | 3.0%(+0.988)#158 | 3.5%(+0.497)#4,990 |
| 19. | 45248 | 3.9% | 3.0%(+0.910)#166 | 3.5%(+0.419)#5,168 |
| 20. | 45245 | 3.8% | 3.0%(+0.804)#174 | 3.5%(+0.313)#5,388 |
| 21. | 45220 | 3.8% | 3.0%(+0.797)#175 | 3.5%(+0.306)#5,402 |
| 22. | 45212 | 3.7% | 3.0%(+0.708)#185 | 3.5%(+0.217)#5,616 |
| 23. | 45244 | 3.6% | 3.0%(+0.523)#202 | 3.5%(+0.032)#6,052 |
| 24. | 45239 | 3.5% | 3.0%(+0.418)#215 | 3.5%(-0.073)#6,337 |
| 25. | 45213 | 3.5% | 3.0%(+0.417)#217 | 3.5%(-0.075)#6,345 |
| 26. | 45237 | 3.4% | 3.0%(+0.389)#219 | 3.5%(-0.102)#6,415 |
| 27. | 45238 | 3.3% | 3.0%(+0.228)#237 | 3.5%(-0.263)#6,904 |
| 28. | 45246 | 2.9% | 3.0%(-0.136)#274 | 3.5%(-0.627)#8,114 |
| 29. | 45240 | 2.9% | 3.0%(-0.154)#278 | 3.5%(-0.645)#8,169 |
| 30. | 45211 | 2.8% | 3.0%(-0.253)#290 | 3.5%(-0.745)#8,523 |
| 31. | 45233 | 2.6% | 3.0%(-0.482)#328 | 3.5%(-0.973)#9,413 |
| 32. | 45255 | 2.5% | 3.0%(-0.494)#334 | 3.5%(-0.986)#9,467 |
| 33. | 45243 | 2.5% | 3.0%(-0.519)#340 | 3.5%(-1.01)#9,584 |
| 34. | 45231 | 2.5% | 3.0%(-0.531)#343 | 3.5%(-1.02)#9,633 |
| 35. | 45251 | 2.5% | 3.0%(-0.534)#345 | 3.5%(-1.03)#9,653 |
| 36. | 45252 | 2.4% | 3.0%(-0.592)#350 | 3.5%(-1.08)#9,871 |
| 37. | 45247 | 2.2% | 3.0%(-0.798)#377 | 3.5%(-1.29)#10,737 |
| 38. | 45204 | 1.8% | 3.0%(-1.21)#463 | 3.5%(-1.71)#12,666 |
| 39. | 45205 | 1.7% | 3.0%(-1.37)#496 | 3.5%(-1.86)#13,445 |
| 40. | 45224 | 1.4% | 3.0%(-1.59)#548 | 3.5%(-2.08)#14,680 |
| 41. | 45232 | 1.3% | 3.0%(-1.74)#582 | 3.5%(-2.23)#15,534 |
| 42. | 45225 | 1.2% | 3.0%(-1.80)#597 | 3.5%(-2.29)#15,954 |
| 43. | 45216 | 1.2% | 3.0%(-1.83)#612 | 3.5%(-2.32)#16,104 |
| 44. | 45207 | 0.61% | 3.0%(-2.43)#750 | 3.5%(-2.92)#19,825 |
| 45. | 45214 | 0.30% | 3.0%(-2.73)#843 | 3.5%(-3.22)#21,626 |
1
Common Questions
What are the Top 10 Zip Codes with the Highest Percentage of Population Employed in Computer & Mathematics in Cincinnati, OH?
Top 10 Zip Codes with the Highest Percentage of Population Employed in Computer & Mathematics in Cincinnati, OH are:
What zip code has the Highest Percentage of Population Employed in Computer & Mathematics in Cincinnati, OH?
45242 has the Highest Percentage of Population Employed in Computer & Mathematics in Cincinnati, OH with 6.8%.
What is the Percentage of Population Employed in Computer & Mathematics in Cincinnati, OH?
Percentage of Population Employed in Computer & Mathematics in Cincinnati is 3.7%.
What is the Percentage of Population Employed in Computer & Mathematics in Ohio?
Percentage of Population Employed in Computer & Mathematics in Ohio is 3.0%.
What is the Percentage of Population Employed in Computer & Mathematics in the United States?
Percentage of Population Employed in Computer & Mathematics in the United States is 3.5%.