Sharonville, OH Map & Demographics
Sharonville Map
Sharonville Overview
$48,609
PER CAPITA INCOME
$79,310
AVG FAMILY INCOME
$71,544
AVG HOUSEHOLD INCOME
27.7%
WAGE / INCOME GAP [ % ]
72.3¢/ $1
WAGE / INCOME GAP [ $ ]
0.48
INEQUALITY / GINI INDEX
14,023
TOTAL POPULATION
6,960
MALE POPULATION
7,063
FEMALE POPULATION
98.54
MALES / 100 FEMALES
101.48
FEMALES / 100 MALES
45.4
MEDIAN AGE
2.9
AVG FAMILY SIZE
2.0
AVG HOUSEHOLD SIZE
7,533
LABOR FORCE [ PEOPLE ]
63.1%
PERCENT IN LABOR FORCE
1.7%
UNEMPLOYMENT RATE
Sharonville Area Codes
Income in Sharonville
Income Overview in Sharonville
Per Capita Income in Sharonville is $48,609, while median incomes of families and households are $79,310 and $71,544 respectively.
| Characteristic | Number | Measure |
| Per Capita Income | 14,023 | $48,609 |
| Median Family Income | 3,452 | $79,310 |
| Mean Family Income | 3,452 | $105,202 |
| Median Household Income | 6,750 | $71,544 |
| Mean Household Income | 6,750 | $99,877 |
| Income Deficit | 3,452 | $0 |
| Wage / Income Gap (%) | 14,023 | 27.65% |
| Wage / Income Gap ($) | 14,023 | 72.35¢ per $1 |
| Gini / Inequality Index | 14,023 | 0.48 |
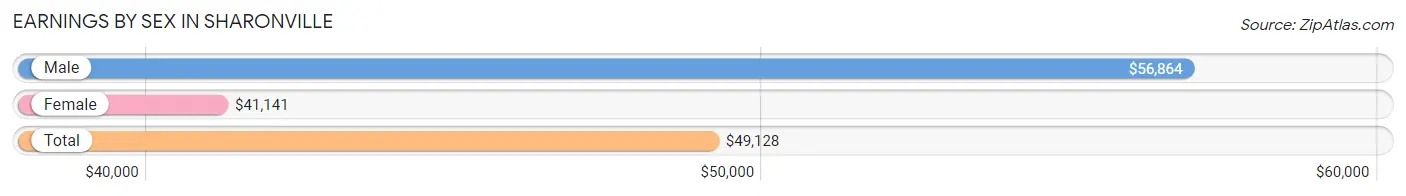
Earnings by Sex in Sharonville
Average Earnings in Sharonville are $49,128, $56,864 for men and $41,141 for women, a difference of 27.7%.
| Sex | Number | Average Earnings |
| Male | 4,024 (51.1%) | $56,864 |
| Female | 3,852 (48.9%) | $41,141 |
| Total | 7,876 (100.0%) | $49,128 |
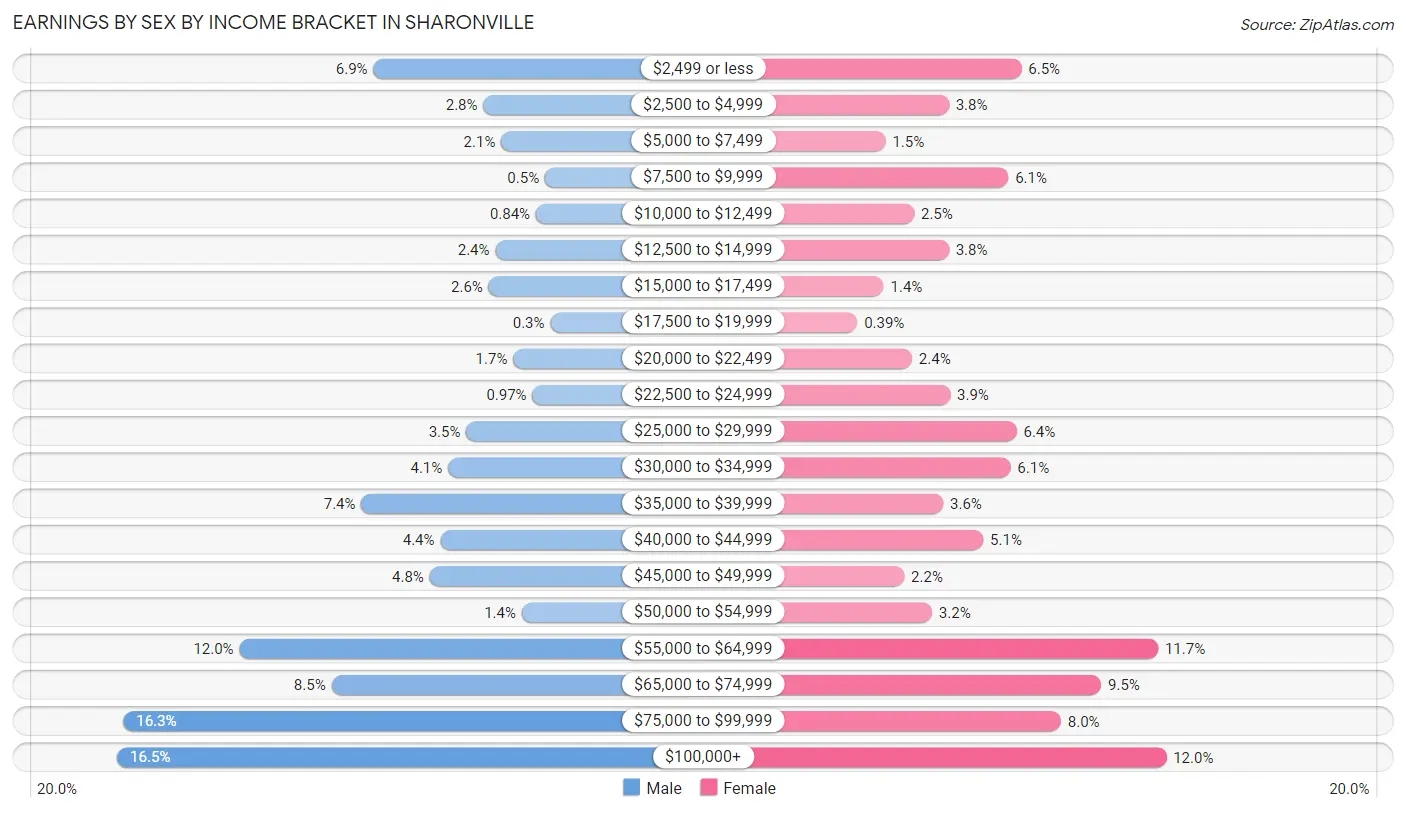
Earnings by Sex by Income Bracket in Sharonville
The most common earnings brackets in Sharonville are $100,000+ for men (665 | 16.5%) and $100,000+ for women (461 | 12.0%).
| Income | Male | Female |
| $2,499 or less | 279 (6.9%) | 252 (6.5%) |
| $2,500 to $4,999 | 113 (2.8%) | 147 (3.8%) |
| $5,000 to $7,499 | 86 (2.1%) | 56 (1.5%) |
| $7,500 to $9,999 | 20 (0.5%) | 233 (6.0%) |
| $10,000 to $12,499 | 34 (0.8%) | 97 (2.5%) |
| $12,500 to $14,999 | 95 (2.4%) | 147 (3.8%) |
| $15,000 to $17,499 | 105 (2.6%) | 53 (1.4%) |
| $17,500 to $19,999 | 12 (0.3%) | 15 (0.4%) |
| $20,000 to $22,499 | 68 (1.7%) | 94 (2.4%) |
| $22,500 to $24,999 | 39 (1.0%) | 149 (3.9%) |
| $25,000 to $29,999 | 139 (3.5%) | 245 (6.4%) |
| $30,000 to $34,999 | 166 (4.1%) | 236 (6.1%) |
| $35,000 to $39,999 | 297 (7.4%) | 139 (3.6%) |
| $40,000 to $44,999 | 178 (4.4%) | 197 (5.1%) |
| $45,000 to $49,999 | 194 (4.8%) | 83 (2.1%) |
| $50,000 to $54,999 | 55 (1.4%) | 123 (3.2%) |
| $55,000 to $64,999 | 481 (11.9%) | 449 (11.7%) |
| $65,000 to $74,999 | 342 (8.5%) | 367 (9.5%) |
| $75,000 to $99,999 | 656 (16.3%) | 309 (8.0%) |
| $100,000+ | 665 (16.5%) | 461 (12.0%) |
| Total | 4,024 (100.0%) | 3,852 (100.0%) |
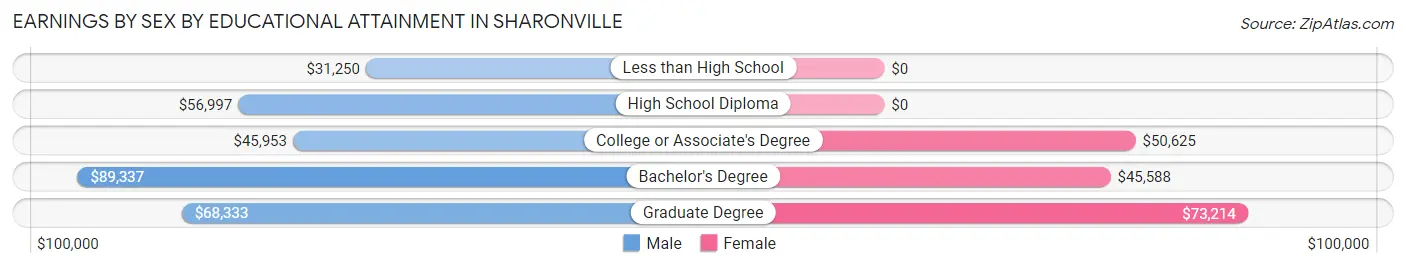
Earnings by Sex by Educational Attainment in Sharonville
Average earnings in Sharonville are $59,034 for men and $51,161 for women, a difference of 13.3%. Men with an educational attainment of bachelor's degree enjoy the highest average annual earnings of $89,337, while those with less than high school education earn the least with $31,250. Women with an educational attainment of graduate degree earn the most with the average annual earnings of $73,214, while those with bachelor's degree education have the smallest earnings of $45,588.
| Educational Attainment | Male Income | Female Income |
| Less than High School | $31,250 | $0 |
| High School Diploma | $56,997 | $0 |
| College or Associate's Degree | $45,953 | $50,625 |
| Bachelor's Degree | $89,337 | $45,588 |
| Graduate Degree | $68,333 | $73,214 |
| Total | $59,034 | $51,161 |
Family Income in Sharonville
Family Income Brackets in Sharonville
According to the Sharonville family income data, there are 766 families falling into the $50,000 to $74,999 income range, which is the most common income bracket and makes up 22.2% of all families. Conversely, the less than $10,000 income bracket is the least frequent group with only 38 families (1.1%) belonging to this category.
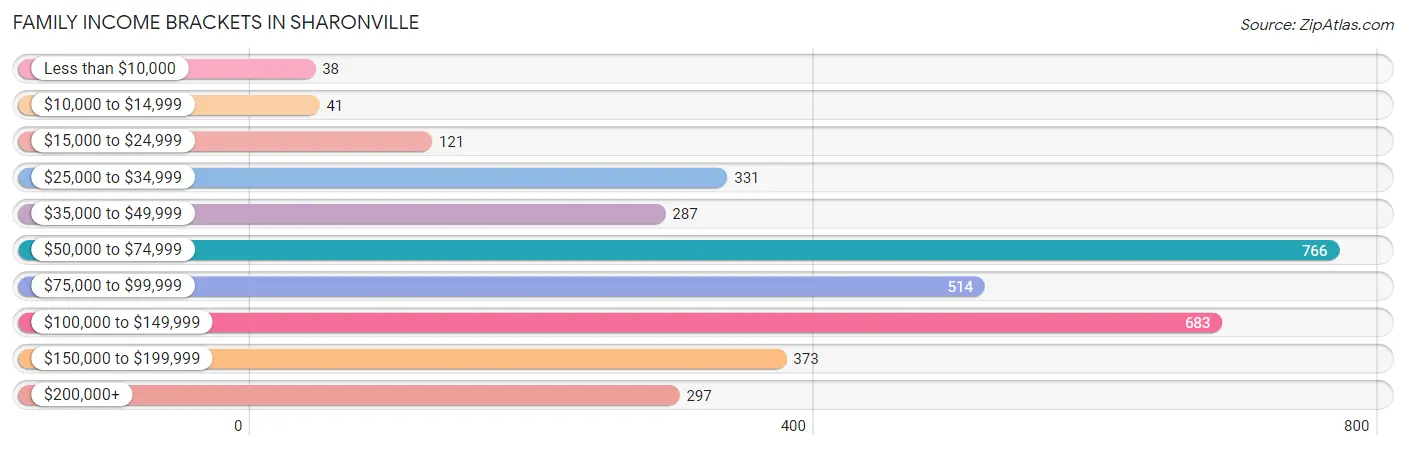
| Income Bracket | # Families | % Families |
| Less than $10,000 | 38 | 1.1% |
| $10,000 to $14,999 | 41 | 1.2% |
| $15,000 to $24,999 | 121 | 3.5% |
| $25,000 to $34,999 | 331 | 9.6% |
| $35,000 to $49,999 | 287 | 8.3% |
| $50,000 to $74,999 | 766 | 22.2% |
| $75,000 to $99,999 | 514 | 14.9% |
| $100,000 to $149,999 | 683 | 19.8% |
| $150,000 to $199,999 | 373 | 10.8% |
| $200,000+ | 297 | 8.6% |
Family Income by Famaliy Size in Sharonville
5-person families (234 | 6.8%) account for the highest median family income in Sharonville with $152,449 per family, while 2-person families (1,763 | 51.1%) have the highest median income of $41,670 per family member.
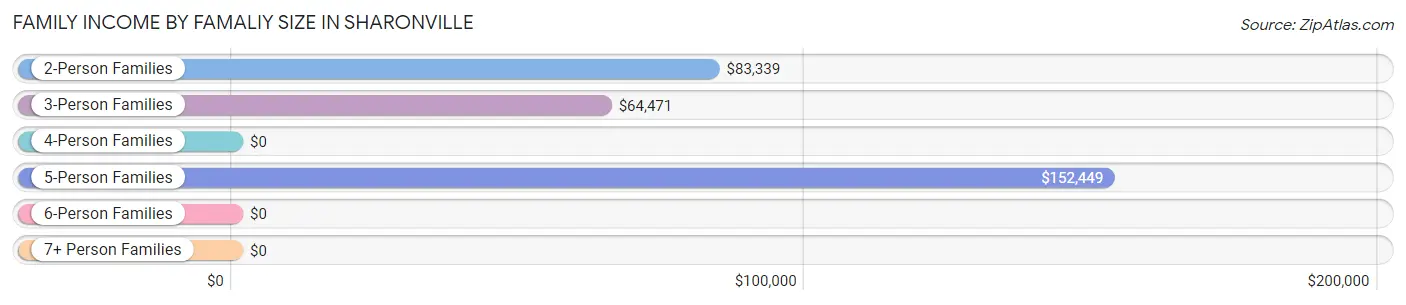
| Income Bracket | # Families | Median Income |
| 2-Person Families | 1,763 (51.1%) | $83,339 |
| 3-Person Families | 864 (25.0%) | $64,471 |
| 4-Person Families | 559 (16.2%) | $0 |
| 5-Person Families | 234 (6.8%) | $152,449 |
| 6-Person Families | 30 (0.9%) | $0 |
| 7+ Person Families | 2 (0.1%) | $0 |
| Total | 3,452 (100.0%) | $79,310 |
Family Income by Number of Earners in Sharonville
The median family income in Sharonville is $79,310, with families comprising 3+ earners (223) having the highest median family income of $151,301, while families with no earners (577) have the lowest median family income of $32,457, accounting for 6.5% and 16.7% of families, respectively.
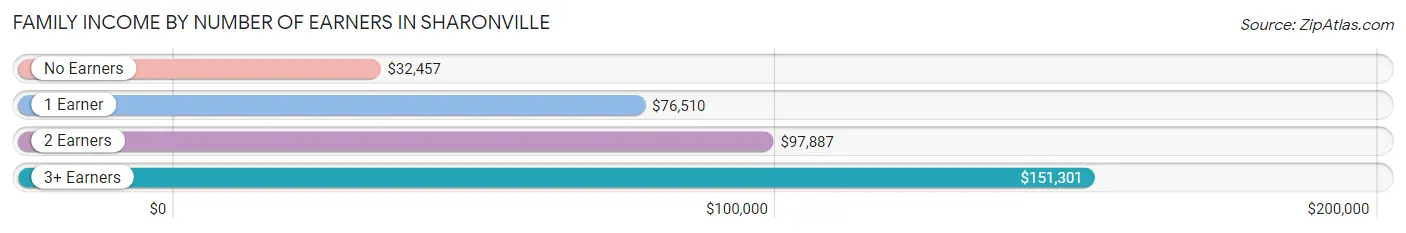
| Number of Earners | # Families | Median Income |
| No Earners | 577 (16.7%) | $32,457 |
| 1 Earner | 1,178 (34.1%) | $76,510 |
| 2 Earners | 1,474 (42.7%) | $97,887 |
| 3+ Earners | 223 (6.5%) | $151,301 |
| Total | 3,452 (100.0%) | $79,310 |
Household Income in Sharonville
Household Income Brackets in Sharonville
With 1,222 households falling in the category, the $50,000 to $74,999 income range is the most frequent in Sharonville, accounting for 18.1% of all households. In contrast, only 121 households (1.8%) fall into the $10,000 to $14,999 income bracket, making it the least populous group.
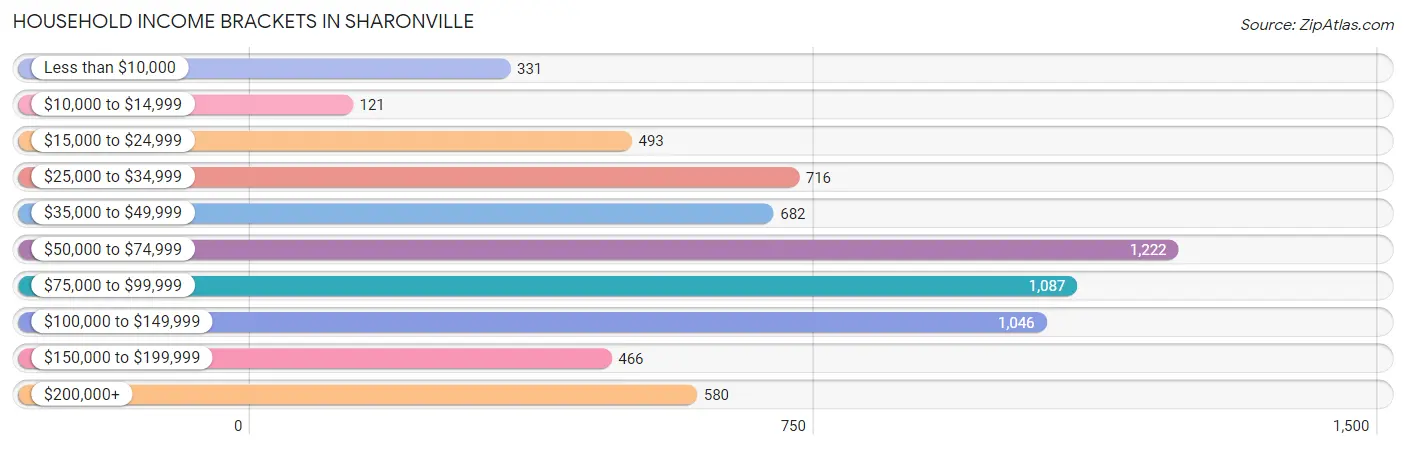
| Income Bracket | # Households | % Households |
| Less than $10,000 | 331 | 4.9% |
| $10,000 to $14,999 | 121 | 1.8% |
| $15,000 to $24,999 | 493 | 7.3% |
| $25,000 to $34,999 | 716 | 10.6% |
| $35,000 to $49,999 | 682 | 10.1% |
| $50,000 to $74,999 | 1,222 | 18.1% |
| $75,000 to $99,999 | 1,087 | 16.1% |
| $100,000 to $149,999 | 1,046 | 15.5% |
| $150,000 to $199,999 | 466 | 6.9% |
| $200,000+ | 580 | 8.6% |
Household Income by Householder Age in Sharonville
The median household income in Sharonville is $71,544, with the highest median household income of $81,583 found in the 45 to 64 years age bracket for the primary householder. A total of 2,249 households (33.3%) fall into this category. Meanwhile, the 15 to 24 years age bracket for the primary householder has the lowest median household income of $0, with 207 households (3.1%) in this group.
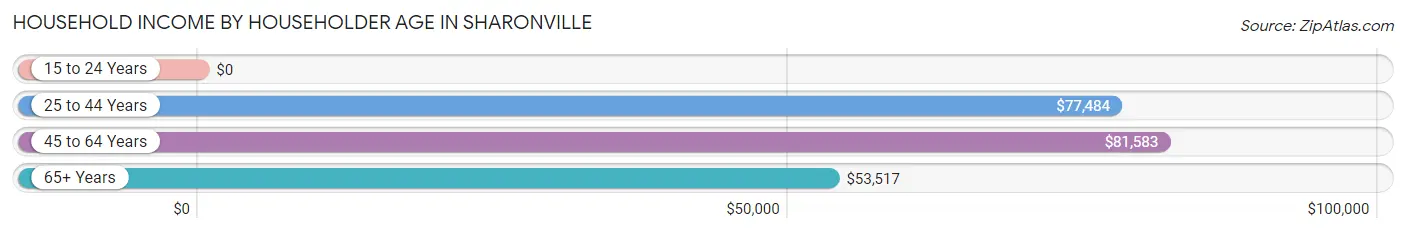
| Income Bracket | # Households | Median Income |
| 15 to 24 Years | 207 (3.1%) | $0 |
| 25 to 44 Years | 1,989 (29.5%) | $77,484 |
| 45 to 64 Years | 2,249 (33.3%) | $81,583 |
| 65+ Years | 2,305 (34.2%) | $53,517 |
| Total | 6,750 (100.0%) | $71,544 |
Poverty in Sharonville
Income Below Poverty by Sex and Age in Sharonville
With 7.4% poverty level for males and 8.2% for females among the residents of Sharonville, 18 to 24 year old males and 18 to 24 year old females are the most vulnerable to poverty, with 106 males (21.9%) and 183 females (34.1%) in their respective age groups living below the poverty level.
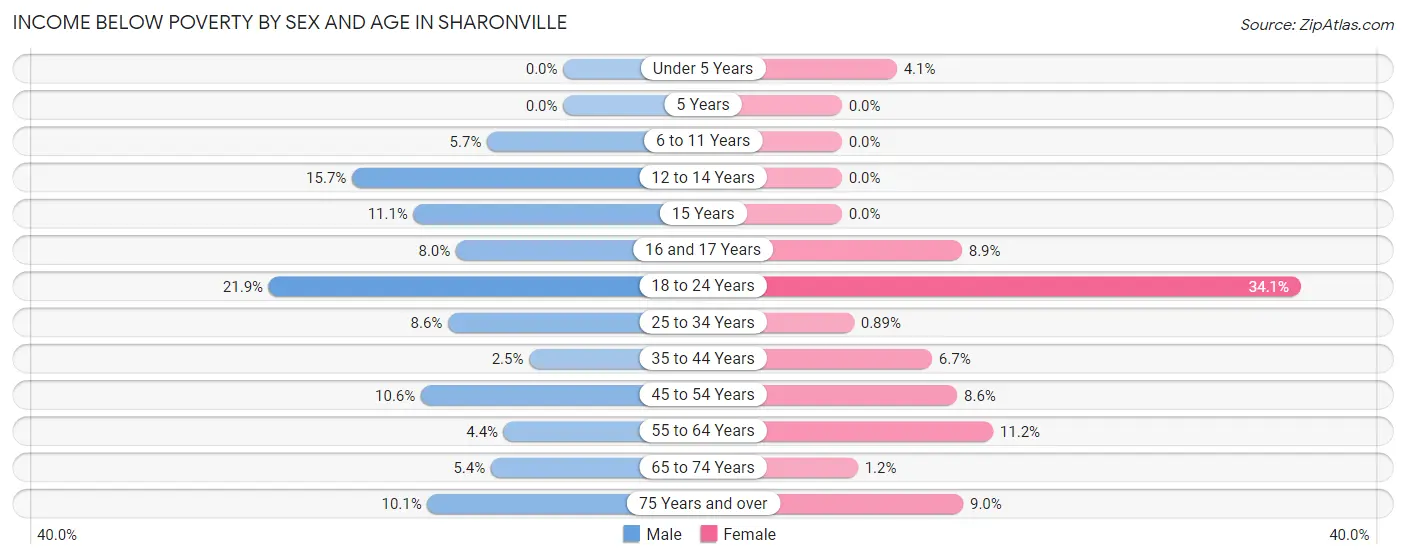
| Age Bracket | Male | Female |
| Under 5 Years | 0 (0.0%) | 12 (4.1%) |
| 5 Years | 0 (0.0%) | 0 (0.0%) |
| 6 to 11 Years | 21 (5.7%) | 0 (0.0%) |
| 12 to 14 Years | 37 (15.7%) | 0 (0.0%) |
| 15 Years | 16 (11.1%) | 0 (0.0%) |
| 16 and 17 Years | 16 (8.0%) | 9 (8.9%) |
| 18 to 24 Years | 106 (21.9%) | 183 (34.1%) |
| 25 to 34 Years | 101 (8.6%) | 9 (0.9%) |
| 35 to 44 Years | 18 (2.5%) | 41 (6.7%) |
| 45 to 54 Years | 72 (10.6%) | 64 (8.6%) |
| 55 to 64 Years | 52 (4.4%) | 154 (11.2%) |
| 65 to 74 Years | 31 (5.4%) | 12 (1.2%) |
| 75 Years and over | 39 (10.1%) | 88 (9.0%) |
| Total | 509 (7.4%) | 572 (8.2%) |
Income Above Poverty by Sex and Age in Sharonville
According to the poverty statistics in Sharonville, males aged under 5 years and females aged 5 years are the age groups that are most secure financially, with 100.0% of males and 100.0% of females in these age groups living above the poverty line.
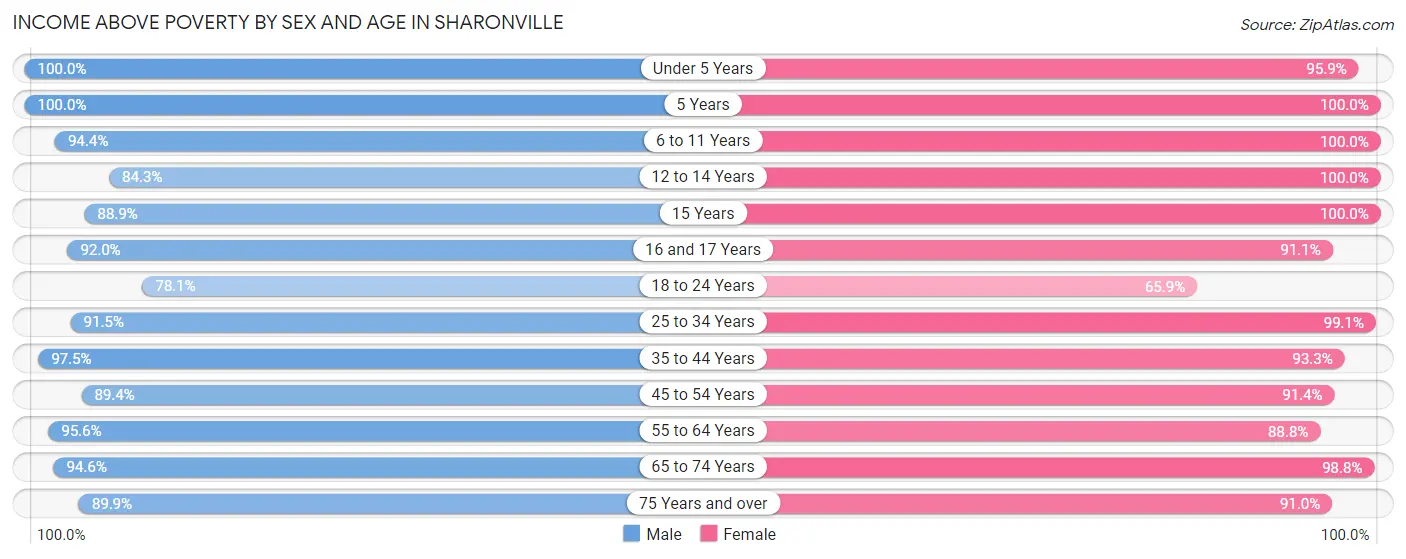
| Age Bracket | Male | Female |
| Under 5 Years | 685 (100.0%) | 282 (95.9%) |
| 5 Years | 70 (100.0%) | 28 (100.0%) |
| 6 to 11 Years | 351 (94.4%) | 124 (100.0%) |
| 12 to 14 Years | 199 (84.3%) | 54 (100.0%) |
| 15 Years | 128 (88.9%) | 68 (100.0%) |
| 16 and 17 Years | 185 (92.0%) | 92 (91.1%) |
| 18 to 24 Years | 379 (78.1%) | 354 (65.9%) |
| 25 to 34 Years | 1,080 (91.4%) | 1,006 (99.1%) |
| 35 to 44 Years | 694 (97.5%) | 572 (93.3%) |
| 45 to 54 Years | 610 (89.4%) | 684 (91.4%) |
| 55 to 64 Years | 1,126 (95.6%) | 1,218 (88.8%) |
| 65 to 74 Years | 546 (94.6%) | 1,005 (98.8%) |
| 75 Years and over | 348 (89.9%) | 890 (91.0%) |
| Total | 6,401 (92.6%) | 6,377 (91.8%) |
Income Below Poverty Among Married-Couple Families in Sharonville
The poverty statistics for married-couple families in Sharonville show that 2.8% or 76 of the total 2,686 families live below the poverty line. Families with no children have the highest poverty rate of 4.6%, comprising of 76 families. On the other hand, families with 1 or 2 children have the lowest poverty rate of 0.0%, which includes 0 families.
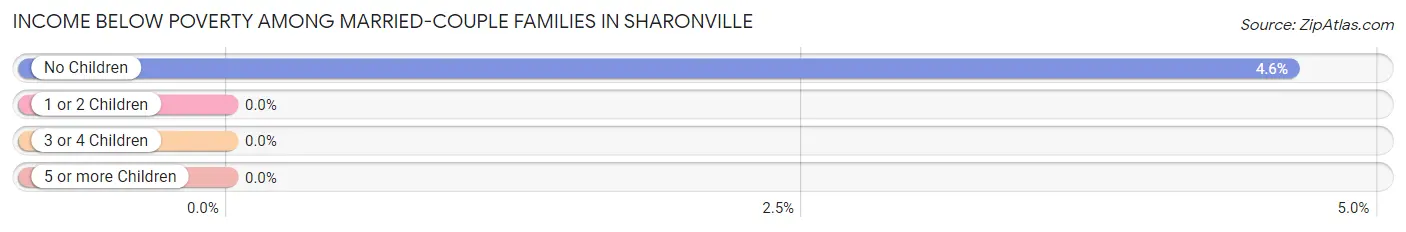
| Children | Above Poverty | Below Poverty |
| No Children | 1,568 (95.4%) | 76 (4.6%) |
| 1 or 2 Children | 831 (100.0%) | 0 (0.0%) |
| 3 or 4 Children | 211 (100.0%) | 0 (0.0%) |
| 5 or more Children | 0 (0.0%) | 0 (0.0%) |
| Total | 2,610 (97.2%) | 76 (2.8%) |
Income Below Poverty Among Single-Parent Households in Sharonville
According to the poverty data in Sharonville, 7.2% or 15 single-father households and 16.5% or 92 single-mother households are living below the poverty line. Among single-father households, those with no children have the highest poverty rate, with 15 households (8.3%) experiencing poverty. Likewise, among single-mother households, those with 1 or 2 children have the highest poverty rate, with 67 households (31.5%) falling below the poverty line.
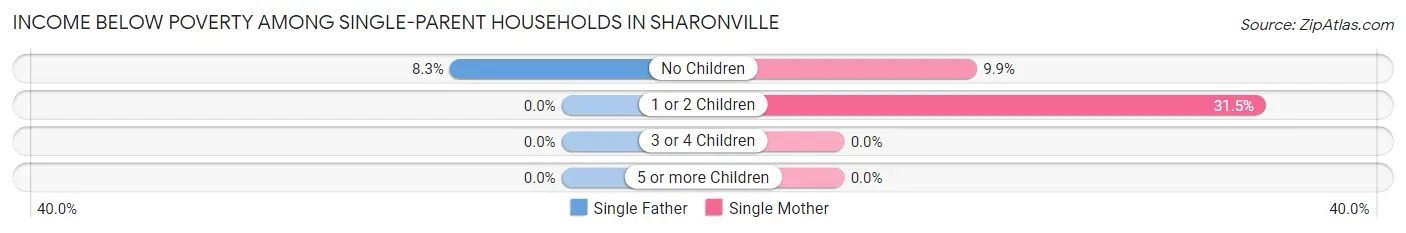
| Children | Single Father | Single Mother |
| No Children | 15 (8.3%) | 25 (9.9%) |
| 1 or 2 Children | 0 (0.0%) | 67 (31.5%) |
| 3 or 4 Children | 0 (0.0%) | 0 (0.0%) |
| 5 or more Children | 0 (0.0%) | 0 (0.0%) |
| Total | 15 (7.2%) | 92 (16.5%) |
Income Below Poverty Among Married-Couple vs Single-Parent Households in Sharonville
The poverty data for Sharonville shows that 76 of the married-couple family households (2.8%) and 107 of the single-parent households (14.0%) are living below the poverty level. Within the married-couple family households, those with no children have the highest poverty rate, with 76 households (4.6%) falling below the poverty line. Among the single-parent households, those with 1 or 2 children have the highest poverty rate, with 67 household (27.9%) living below poverty.
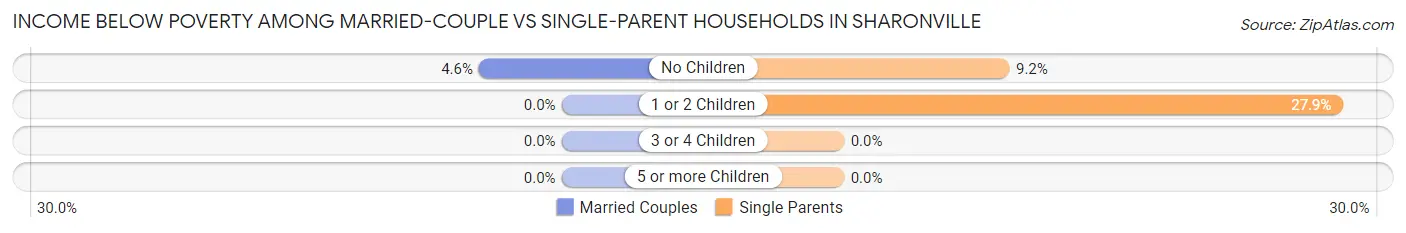
| Children | Married-Couple Families | Single-Parent Households |
| No Children | 76 (4.6%) | 40 (9.2%) |
| 1 or 2 Children | 0 (0.0%) | 67 (27.9%) |
| 3 or 4 Children | 0 (0.0%) | 0 (0.0%) |
| 5 or more Children | 0 (0.0%) | 0 (0.0%) |
| Total | 76 (2.8%) | 107 (14.0%) |
Race in Sharonville
The most populous races in Sharonville are White / Caucasian (11,048 | 78.8%), Black / African American (1,169 | 8.3%), and Hispanic or Latino (1,136 | 8.1%).
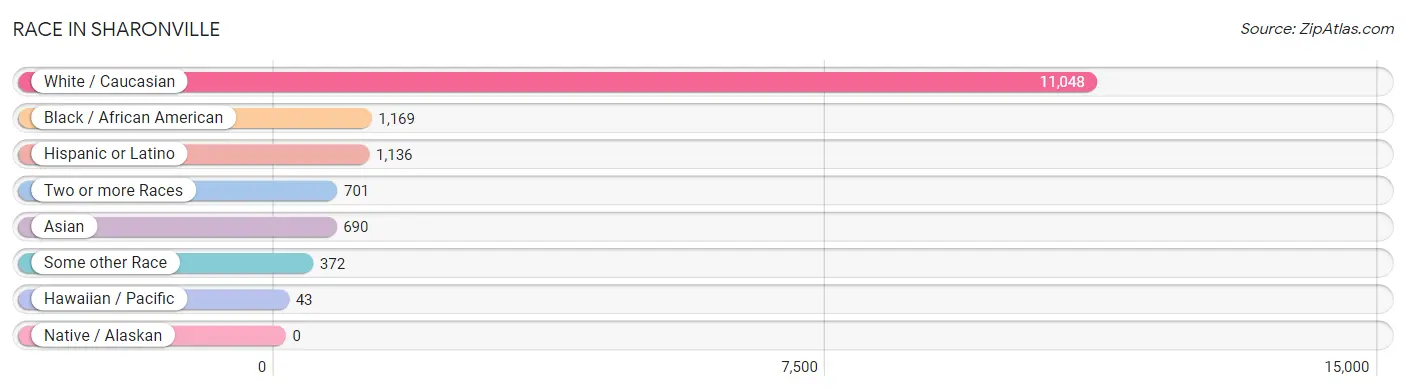
| Race | # Population | % Population |
| Asian | 690 | 4.9% |
| Black / African American | 1,169 | 8.3% |
| Hawaiian / Pacific | 43 | 0.3% |
| Hispanic or Latino | 1,136 | 8.1% |
| Native / Alaskan | 0 | 0.0% |
| White / Caucasian | 11,048 | 78.8% |
| Two or more Races | 701 | 5.0% |
| Some other Race | 372 | 2.6% |
| Total | 14,023 | 100.0% |
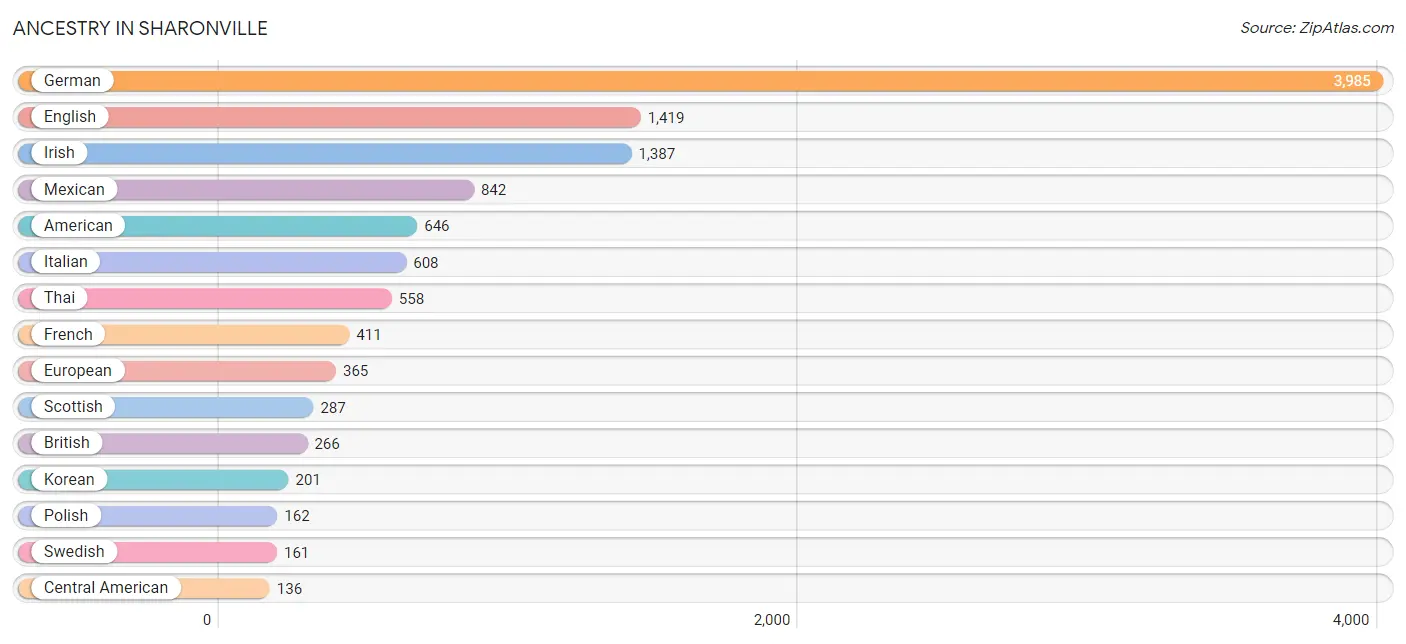
Ancestry in Sharonville
The most populous ancestries reported in Sharonville are German (3,985 | 28.4%), English (1,419 | 10.1%), Irish (1,387 | 9.9%), Mexican (842 | 6.0%), and American (646 | 4.6%), together accounting for 59.0% of all Sharonville residents.
| Ancestry | # Population | % Population |
| African | 22 | 0.2% |
| American | 646 | 4.6% |
| Arab | 59 | 0.4% |
| Bolivian | 32 | 0.2% |
| British | 266 | 1.9% |
| Burmese | 13 | 0.1% |
| Central American | 136 | 1.0% |
| Cherokee | 111 | 0.8% |
| Chilean | 36 | 0.3% |
| Colombian | 8 | 0.1% |
| Costa Rican | 22 | 0.2% |
| Croatian | 31 | 0.2% |
| Cuban | 82 | 0.6% |
| Czech | 15 | 0.1% |
| Czechoslovakian | 2 | 0.0% |
| Dutch | 47 | 0.3% |
| English | 1,419 | 10.1% |
| European | 365 | 2.6% |
| Finnish | 74 | 0.5% |
| French | 411 | 2.9% |
| French Canadian | 35 | 0.3% |
| German | 3,985 | 28.4% |
| Greek | 26 | 0.2% |
| Guatemalan | 114 | 0.8% |
| Hungarian | 68 | 0.5% |
| Indian (Asian) | 39 | 0.3% |
| Iranian | 43 | 0.3% |
| Irish | 1,387 | 9.9% |
| Italian | 608 | 4.3% |
| Korean | 201 | 1.4% |
| Lebanese | 36 | 0.3% |
| Lithuanian | 47 | 0.3% |
| Mexican | 842 | 6.0% |
| Native Hawaiian | 4 | 0.0% |
| Navajo | 10 | 0.1% |
| Northern European | 28 | 0.2% |
| Norwegian | 34 | 0.2% |
| Polish | 162 | 1.2% |
| Russian | 48 | 0.3% |
| Scandinavian | 46 | 0.3% |
| Scotch-Irish | 85 | 0.6% |
| Scottish | 287 | 2.1% |
| Senegalese | 21 | 0.2% |
| Sierra Leonean | 21 | 0.2% |
| Slovak | 15 | 0.1% |
| South American | 76 | 0.5% |
| Sri Lankan | 36 | 0.3% |
| Subsaharan African | 56 | 0.4% |
| Sudanese | 13 | 0.1% |
| Swedish | 161 | 1.1% |
| Swiss | 26 | 0.2% |
| Thai | 558 | 4.0% |
| Turkish | 33 | 0.2% |
| Welsh | 110 | 0.8% | View All 54 Rows |
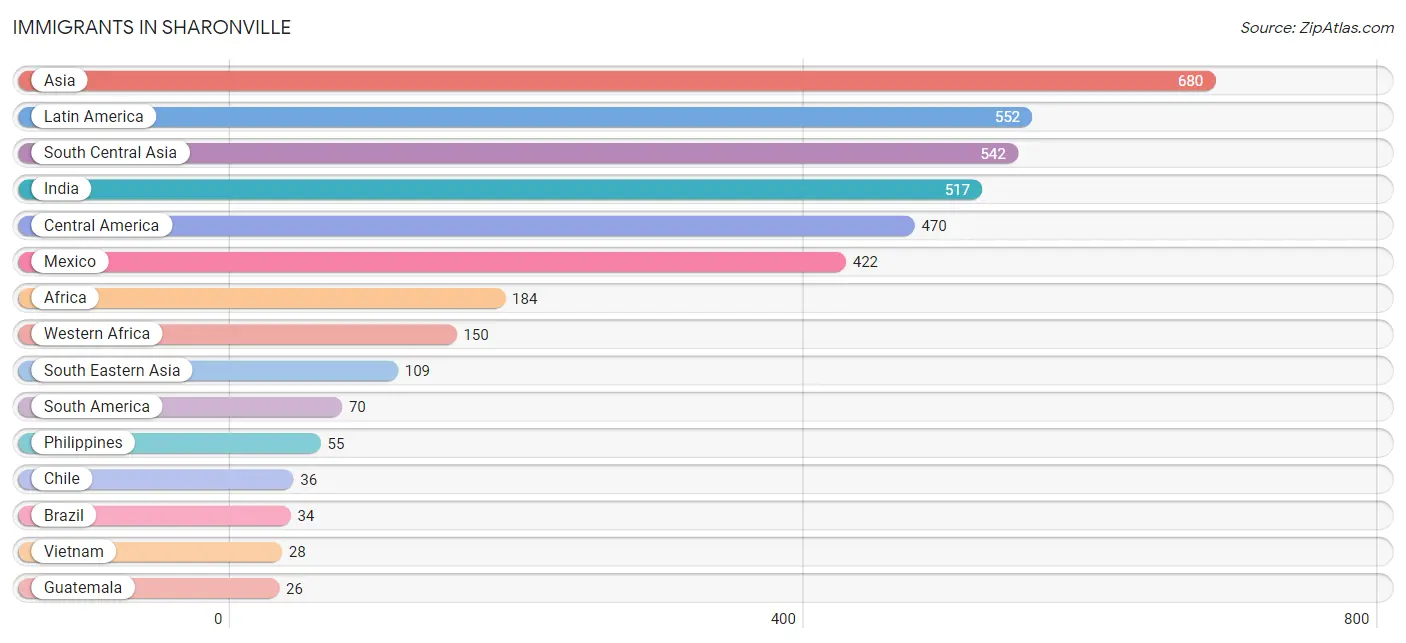
Immigrants in Sharonville
The most numerous immigrant groups reported in Sharonville came from Asia (680 | 4.9%), Latin America (552 | 3.9%), South Central Asia (542 | 3.9%), India (517 | 3.7%), and Central America (470 | 3.4%), together accounting for 19.7% of all Sharonville residents.
| Immigration Origin | # Population | % Population |
| Africa | 184 | 1.3% |
| Asia | 680 | 4.9% |
| Brazil | 34 | 0.2% |
| Cameroon | 11 | 0.1% |
| Canada | 13 | 0.1% |
| Caribbean | 12 | 0.1% |
| Central America | 470 | 3.4% |
| Chile | 36 | 0.3% |
| China | 13 | 0.1% |
| Costa Rica | 22 | 0.2% |
| Cuba | 12 | 0.1% |
| Eastern Asia | 13 | 0.1% |
| Eastern Europe | 11 | 0.1% |
| Europe | 23 | 0.2% |
| Guatemala | 26 | 0.2% |
| India | 517 | 3.7% |
| Italy | 12 | 0.1% |
| Latin America | 552 | 3.9% |
| Malaysia | 26 | 0.2% |
| Mexico | 422 | 3.0% |
| Micronesia | 21 | 0.2% |
| Middle Africa | 11 | 0.1% |
| Northern Africa | 23 | 0.2% |
| Oceania | 21 | 0.2% |
| Pakistan | 22 | 0.2% |
| Philippines | 55 | 0.4% |
| Russia | 11 | 0.1% |
| Sierra Leone | 21 | 0.2% |
| South America | 70 | 0.5% |
| South Central Asia | 542 | 3.9% |
| South Eastern Asia | 109 | 0.8% |
| Southern Europe | 12 | 0.1% |
| Turkey | 16 | 0.1% |
| Uzbekistan | 3 | 0.0% |
| Vietnam | 28 | 0.2% |
| Western Africa | 150 | 1.1% |
| Western Asia | 16 | 0.1% | View All 37 Rows |
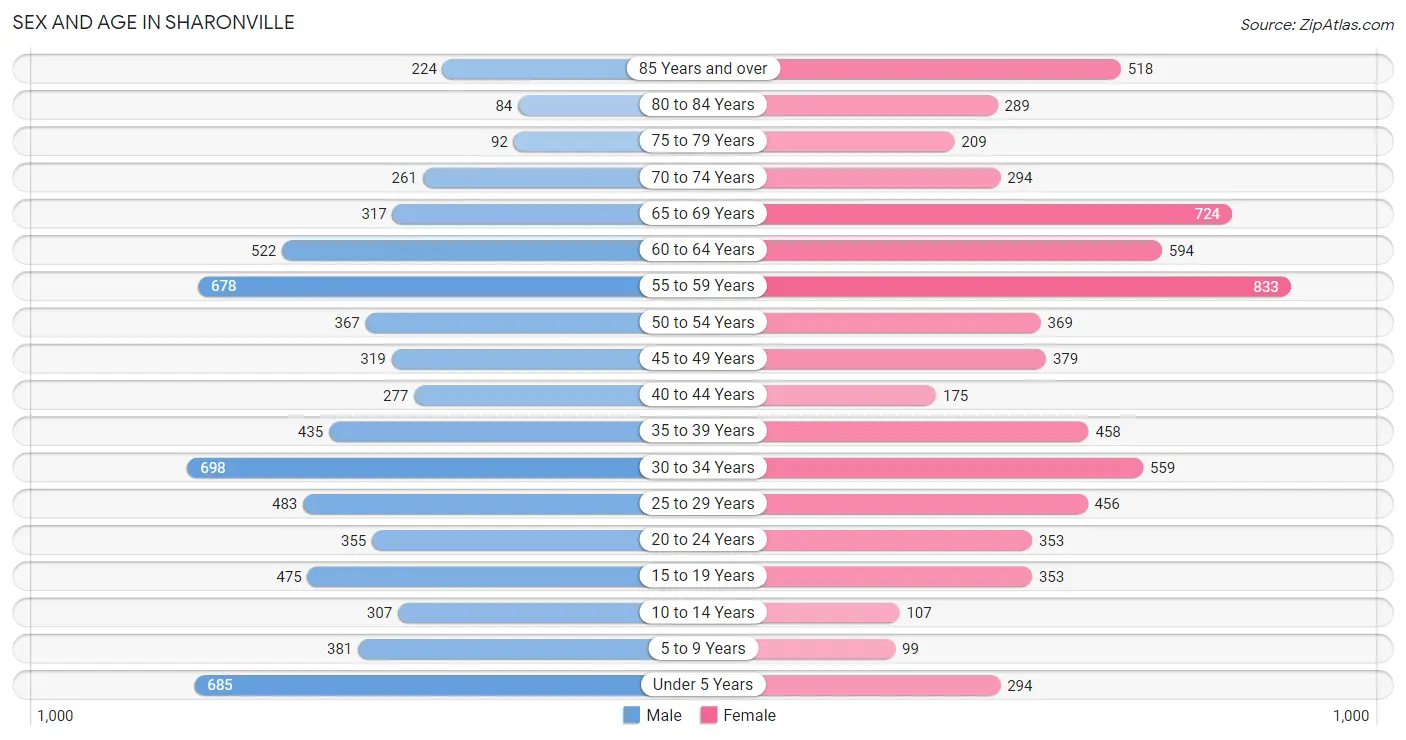
Sex and Age in Sharonville
Sex and Age in Sharonville
The most populous age groups in Sharonville are 30 to 34 Years (698 | 10.0%) for men and 55 to 59 Years (833 | 11.8%) for women.
| Age Bracket | Male | Female |
| Under 5 Years | 685 (9.8%) | 294 (4.2%) |
| 5 to 9 Years | 381 (5.5%) | 99 (1.4%) |
| 10 to 14 Years | 307 (4.4%) | 107 (1.5%) |
| 15 to 19 Years | 475 (6.8%) | 353 (5.0%) |
| 20 to 24 Years | 355 (5.1%) | 353 (5.0%) |
| 25 to 29 Years | 483 (6.9%) | 456 (6.5%) |
| 30 to 34 Years | 698 (10.0%) | 559 (7.9%) |
| 35 to 39 Years | 435 (6.2%) | 458 (6.5%) |
| 40 to 44 Years | 277 (4.0%) | 175 (2.5%) |
| 45 to 49 Years | 319 (4.6%) | 379 (5.4%) |
| 50 to 54 Years | 367 (5.3%) | 369 (5.2%) |
| 55 to 59 Years | 678 (9.7%) | 833 (11.8%) |
| 60 to 64 Years | 522 (7.5%) | 594 (8.4%) |
| 65 to 69 Years | 317 (4.5%) | 724 (10.2%) |
| 70 to 74 Years | 261 (3.7%) | 294 (4.2%) |
| 75 to 79 Years | 92 (1.3%) | 209 (3.0%) |
| 80 to 84 Years | 84 (1.2%) | 289 (4.1%) |
| 85 Years and over | 224 (3.2%) | 518 (7.3%) |
| Total | 6,960 (100.0%) | 7,063 (100.0%) |
Families and Households in Sharonville
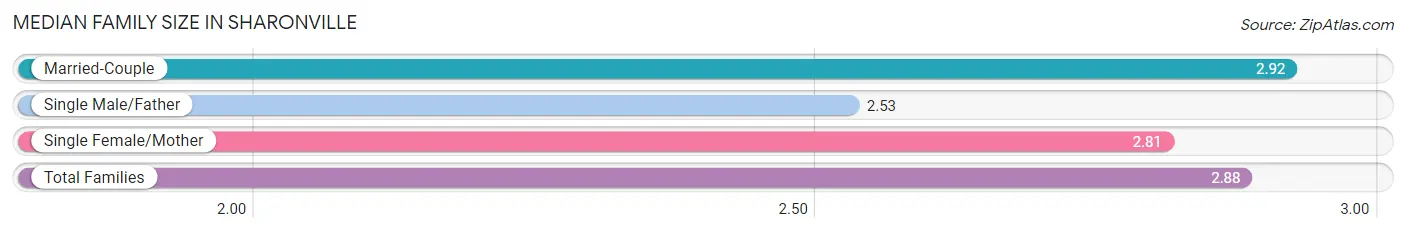
Median Family Size in Sharonville
The median family size in Sharonville is 2.88 persons per family, with married-couple families (2,686 | 77.8%) accounting for the largest median family size of 2.92 persons per family. On the other hand, single male/father families (207 | 6.0%) represent the smallest median family size with 2.53 persons per family.
| Family Type | # Families | Family Size |
| Married-Couple | 2,686 (77.8%) | 2.92 |
| Single Male/Father | 207 (6.0%) | 2.53 |
| Single Female/Mother | 559 (16.2%) | 2.81 |
| Total Families | 3,452 (100.0%) | 2.88 |
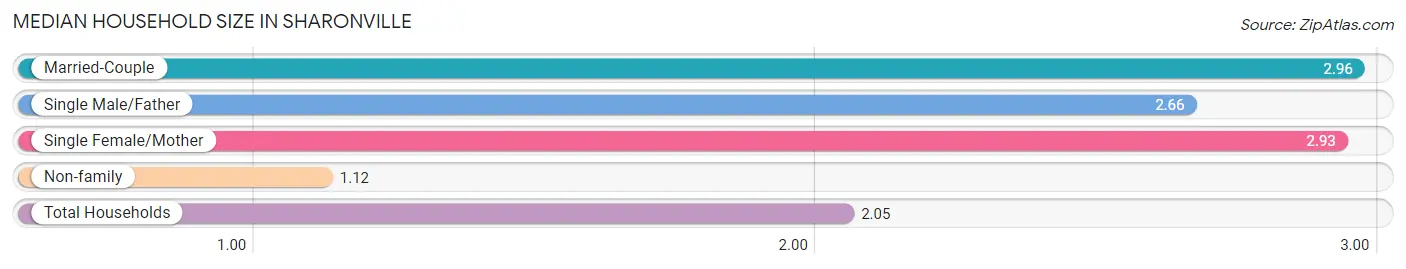
Median Household Size in Sharonville
The median household size in Sharonville is 2.05 persons per household, with married-couple households (2,686 | 39.8%) accounting for the largest median household size of 2.96 persons per household. non-family households (3,298 | 48.9%) represent the smallest median household size with 1.12 persons per household.
| Household Type | # Households | Household Size |
| Married-Couple | 2,686 (39.8%) | 2.96 |
| Single Male/Father | 207 (3.1%) | 2.66 |
| Single Female/Mother | 559 (8.3%) | 2.93 |
| Non-family | 3,298 (48.9%) | 1.12 |
| Total Households | 6,750 (100.0%) | 2.05 |
Household Size by Marriage Status in Sharonville
Out of a total of 6,750 households in Sharonville, 3,452 (51.1%) are family households, while 3,298 (48.9%) are nonfamily households. The most numerous type of family households are 2-person households, comprising 1,642, and the most common type of nonfamily households are 1-person households, comprising 2,886.
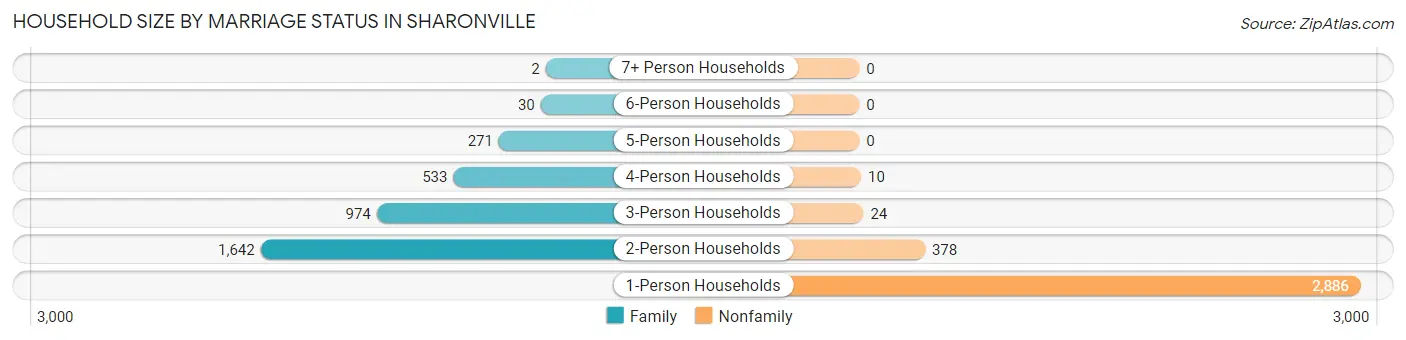
| Household Size | Family Households | Nonfamily Households |
| 1-Person Households | - | 2,886 (42.8%) |
| 2-Person Households | 1,642 (24.3%) | 378 (5.6%) |
| 3-Person Households | 974 (14.4%) | 24 (0.4%) |
| 4-Person Households | 533 (7.9%) | 10 (0.2%) |
| 5-Person Households | 271 (4.0%) | 0 (0.0%) |
| 6-Person Households | 30 (0.4%) | 0 (0.0%) |
| 7+ Person Households | 2 (0.0%) | 0 (0.0%) |
| Total | 3,452 (51.1%) | 3,298 (48.9%) |
Female Fertility in Sharonville
Fertility by Age in Sharonville
Average fertility rate in Sharonville is 100.0 births per 1,000 women. Women in the age bracket of 20 to 34 years have the highest fertility rate with 154.0 births per 1,000 women. Women in the age bracket of 20 to 34 years acount for 76.2% of all women with births.
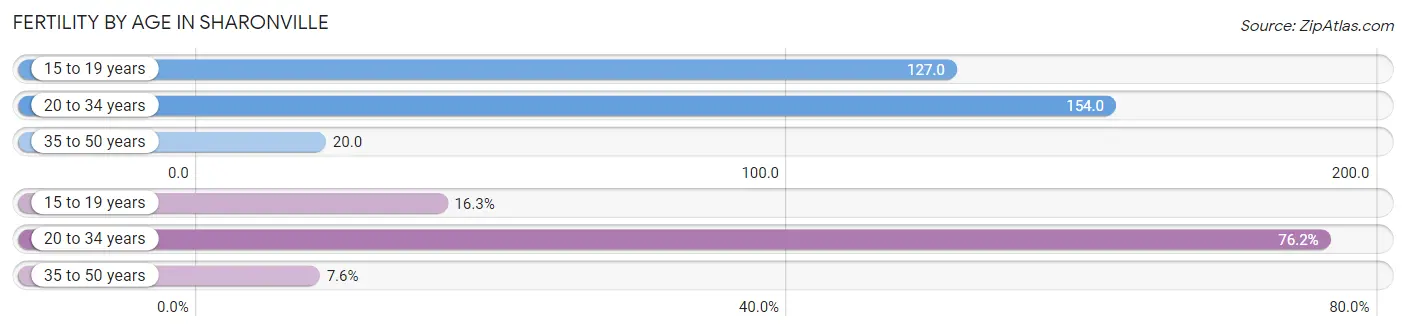
| Age Bracket | Women with Births | Births / 1,000 Women |
| 15 to 19 years | 45 (16.3%) | 127.0 |
| 20 to 34 years | 211 (76.2%) | 154.0 |
| 35 to 50 years | 21 (7.6%) | 20.0 |
| Total | 277 (100.0%) | 100.0 |
Fertility by Age by Marriage Status in Sharonville
78.3% of women with births (277) in Sharonville are married. The highest percentage of unmarried women with births falls into 15 to 19 years age bracket with 100.0% of them unmarried at the time of birth, while the lowest percentage of unmarried women with births belong to 35 to 50 years age bracket with 0.0% of them unmarried.
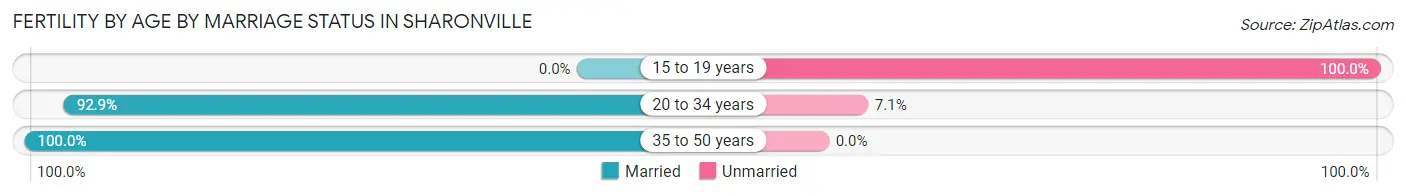
| Age Bracket | Married | Unmarried |
| 15 to 19 years | 0 (0.0%) | 45 (100.0%) |
| 20 to 34 years | 196 (92.9%) | 15 (7.1%) |
| 35 to 50 years | 21 (100.0%) | 0 (0.0%) |
| Total | 217 (78.3%) | 60 (21.7%) |
Fertility by Education in Sharonville
Average fertility rate in Sharonville is 100.0 births per 1,000 women. Women with the education attainment of less than high school have the highest fertility rate of 128.0 births per 1,000 women, while women with the education attainment of bachelor's degree have the lowest fertility at 70.0 births per 1,000 women. Women with the education attainment of high school diploma represent 30.7% of all women with births.
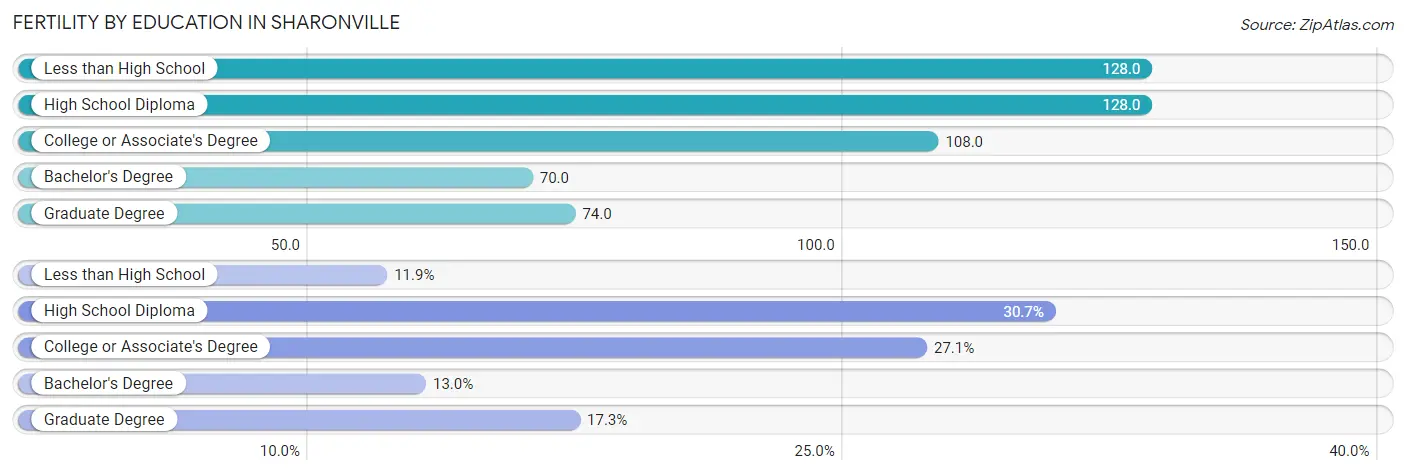
| Educational Attainment | Women with Births | Births / 1,000 Women |
| Less than High School | 33 (11.9%) | 128.0 |
| High School Diploma | 85 (30.7%) | 128.0 |
| College or Associate's Degree | 75 (27.1%) | 108.0 |
| Bachelor's Degree | 36 (13.0%) | 70.0 |
| Graduate Degree | 48 (17.3%) | 74.0 |
| Total | 277 (100.0%) | 100.0 |
Fertility by Education by Marriage Status in Sharonville
21.7% of women with births in Sharonville are unmarried. Women with the educational attainment of less than high school are most likely to be married with 100.0% of them married at childbirth, while women with the educational attainment of high school diploma are least likely to be married with 52.9% of them unmarried at childbirth.
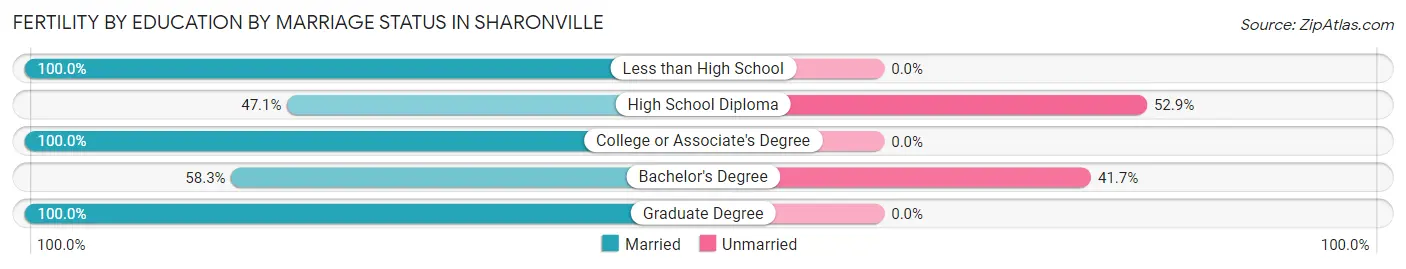
| Educational Attainment | Married | Unmarried |
| Less than High School | 33 (100.0%) | 0 (0.0%) |
| High School Diploma | 40 (47.1%) | 45 (52.9%) |
| College or Associate's Degree | 75 (100.0%) | 0 (0.0%) |
| Bachelor's Degree | 21 (58.3%) | 15 (41.7%) |
| Graduate Degree | 48 (100.0%) | 0 (0.0%) |
| Total | 217 (78.3%) | 60 (21.7%) |
Employment Characteristics in Sharonville
Employment by Class of Employer in Sharonville
Among the 7,300 employed individuals in Sharonville, private company employees (5,625 | 77.0%), not-for-profit organizations (527 | 7.2%), and self-employed (not incorporated) (414 | 5.7%) make up the most common classes of employment.
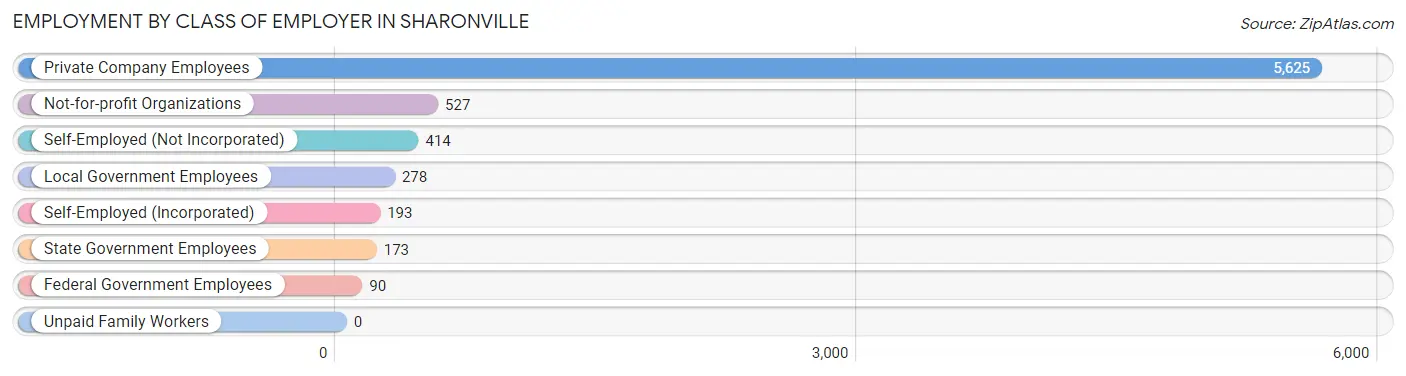
| Employer Class | # Employees | % Employees |
| Private Company Employees | 5,625 | 77.0% |
| Self-Employed (Incorporated) | 193 | 2.6% |
| Self-Employed (Not Incorporated) | 414 | 5.7% |
| Not-for-profit Organizations | 527 | 7.2% |
| Local Government Employees | 278 | 3.8% |
| State Government Employees | 173 | 2.4% |
| Federal Government Employees | 90 | 1.2% |
| Unpaid Family Workers | 0 | 0.0% |
| Total | 7,300 | 100.0% |
Employment Status by Age in Sharonville
According to the labor force statistics for Sharonville, out of the total population over 16 years of age (11,938), 63.1% or 7,533 individuals are in the labor force, with 1.7% or 128 of them unemployed. The age group with the highest labor force participation rate is 25 to 29 years, with 90.7% or 852 individuals in the labor force. Within the labor force, the 20 to 24 years age range has the highest percentage of unemployed individuals, with 8.8% or 46 of them being unemployed.
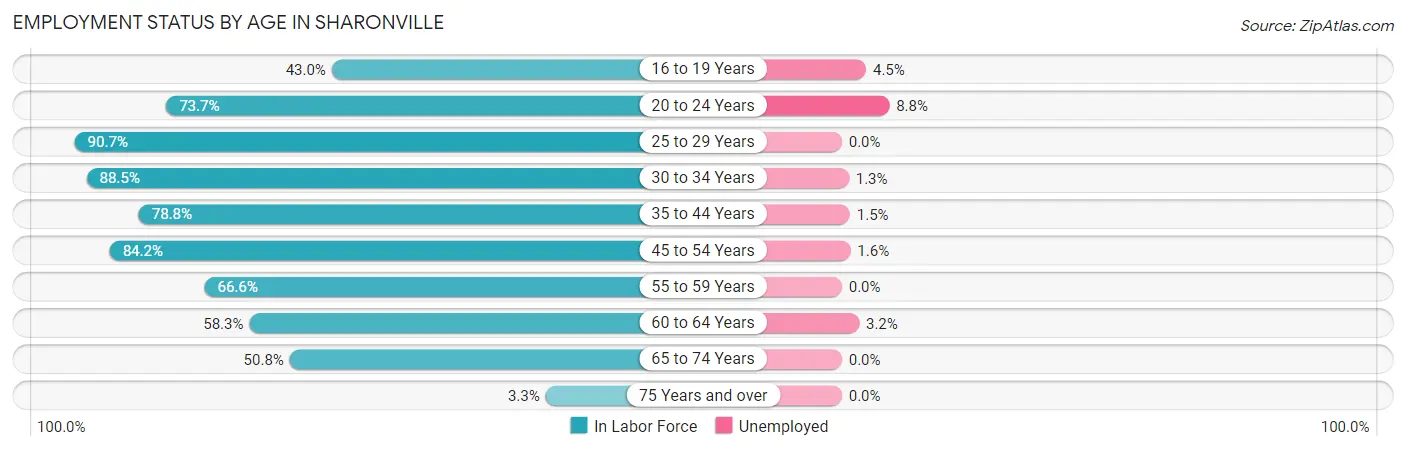
| Age Bracket | In Labor Force | Unemployed |
| 16 to 19 Years | 265 (43.0%) | 12 (4.5%) |
| 20 to 24 Years | 522 (73.7%) | 46 (8.8%) |
| 25 to 29 Years | 852 (90.7%) | 0 (0.0%) |
| 30 to 34 Years | 1,112 (88.5%) | 14 (1.3%) |
| 35 to 44 Years | 1,060 (78.8%) | 16 (1.5%) |
| 45 to 54 Years | 1,207 (84.2%) | 19 (1.6%) |
| 55 to 59 Years | 1,006 (66.6%) | 0 (0.0%) |
| 60 to 64 Years | 651 (58.3%) | 21 (3.2%) |
| 65 to 74 Years | 811 (50.8%) | 0 (0.0%) |
| 75 Years and over | 47 (3.3%) | 0 (0.0%) |
| Total | 7,533 (63.1%) | 128 (1.7%) |
Employment Status by Educational Attainment in Sharonville
According to labor force statistics for Sharonville, 77.5% of individuals (5,892) out of the total population between 25 and 64 years of age (7,602) are in the labor force, with 1.2% or 71 of them being unemployed. The group with the highest labor force participation rate are those with the educational attainment of bachelor's degree or higher, with 81.1% or 2,416 individuals in the labor force. Within the labor force, individuals with less than high school education have the highest percentage of unemployment, with 3.7% or 19 of them being unemployed.
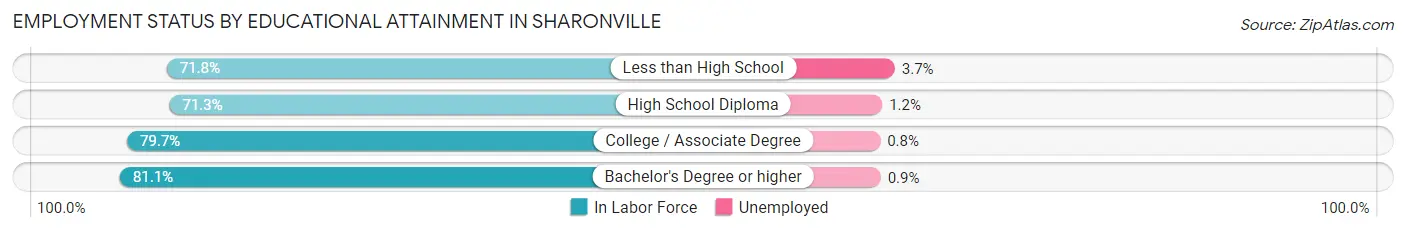
| Educational Attainment | In Labor Force | Unemployed |
| Less than High School | 508 (71.8%) | 26 (3.7%) |
| High School Diploma | 1,313 (71.3%) | 22 (1.2%) |
| College / Associate Degree | 1,653 (79.7%) | 17 (0.8%) |
| Bachelor's Degree or higher | 2,416 (81.1%) | 27 (0.9%) |
| Total | 5,892 (77.5%) | 91 (1.2%) |
Employment Occupations by Sex in Sharonville
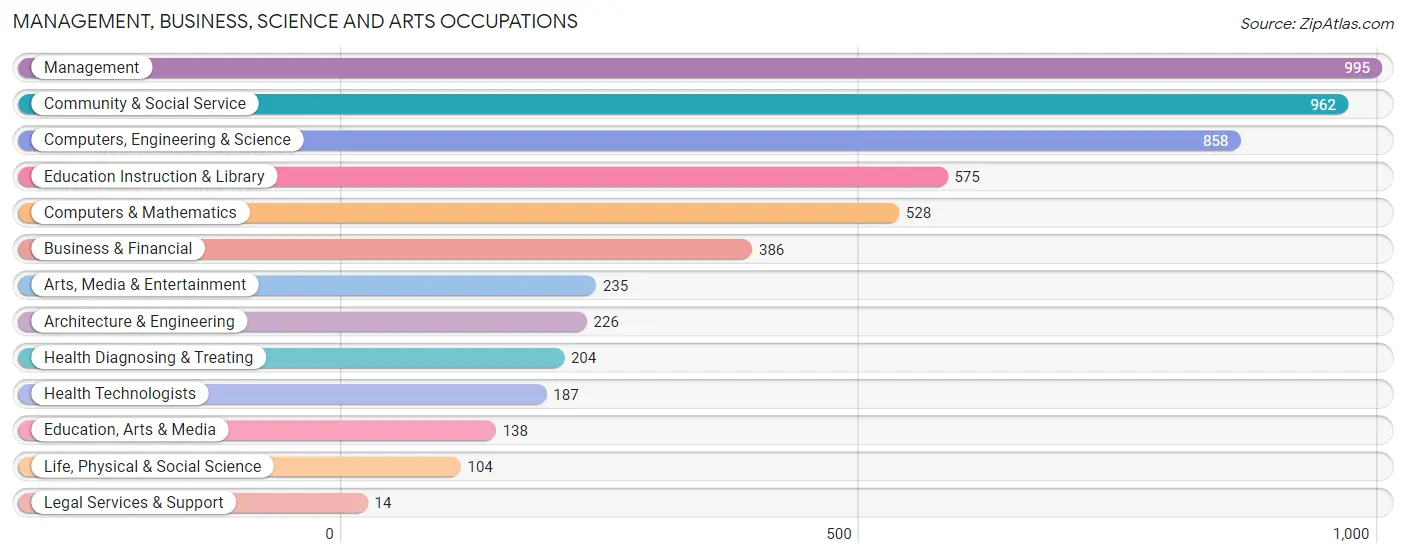
Management, Business, Science and Arts Occupations
The most common Management, Business, Science and Arts occupations in Sharonville are Management (995 | 13.4%), Community & Social Service (962 | 13.0%), Computers, Engineering & Science (858 | 11.6%), Education Instruction & Library (575 | 7.8%), and Computers & Mathematics (528 | 7.1%).
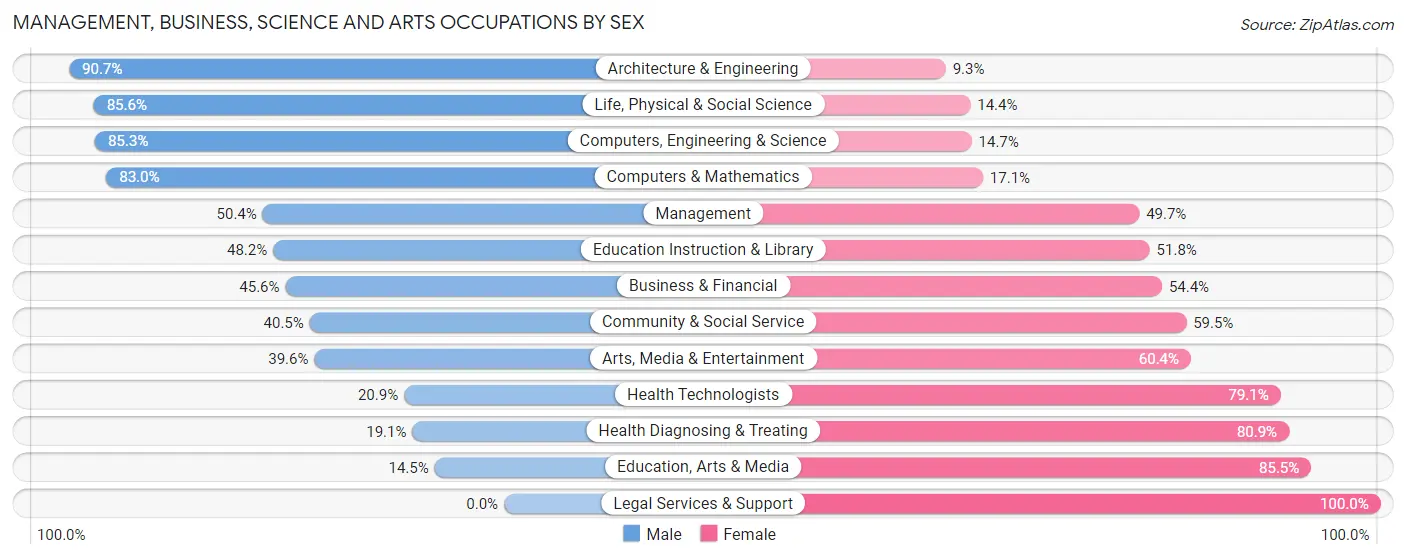
Management, Business, Science and Arts Occupations by Sex
Within the Management, Business, Science and Arts occupations in Sharonville, the most male-oriented occupations are Architecture & Engineering (90.7%), Life, Physical & Social Science (85.6%), and Computers, Engineering & Science (85.3%), while the most female-oriented occupations are Legal Services & Support (100.0%), Education, Arts & Media (85.5%), and Health Diagnosing & Treating (80.9%).
| Occupation | Male | Female |
| Management | 501 (50.3%) | 494 (49.6%) |
| Business & Financial | 176 (45.6%) | 210 (54.4%) |
| Computers, Engineering & Science | 732 (85.3%) | 126 (14.7%) |
| Computers & Mathematics | 438 (83.0%) | 90 (17.1%) |
| Architecture & Engineering | 205 (90.7%) | 21 (9.3%) |
| Life, Physical & Social Science | 89 (85.6%) | 15 (14.4%) |
| Community & Social Service | 390 (40.5%) | 572 (59.5%) |
| Education, Arts & Media | 20 (14.5%) | 118 (85.5%) |
| Legal Services & Support | 0 (0.0%) | 14 (100.0%) |
| Education Instruction & Library | 277 (48.2%) | 298 (51.8%) |
| Arts, Media & Entertainment | 93 (39.6%) | 142 (60.4%) |
| Health Diagnosing & Treating | 39 (19.1%) | 165 (80.9%) |
| Health Technologists | 39 (20.9%) | 148 (79.1%) |
| Total (Category) | 1,838 (54.0%) | 1,567 (46.0%) |
| Total (Overall) | 3,768 (50.9%) | 3,637 (49.1%) |
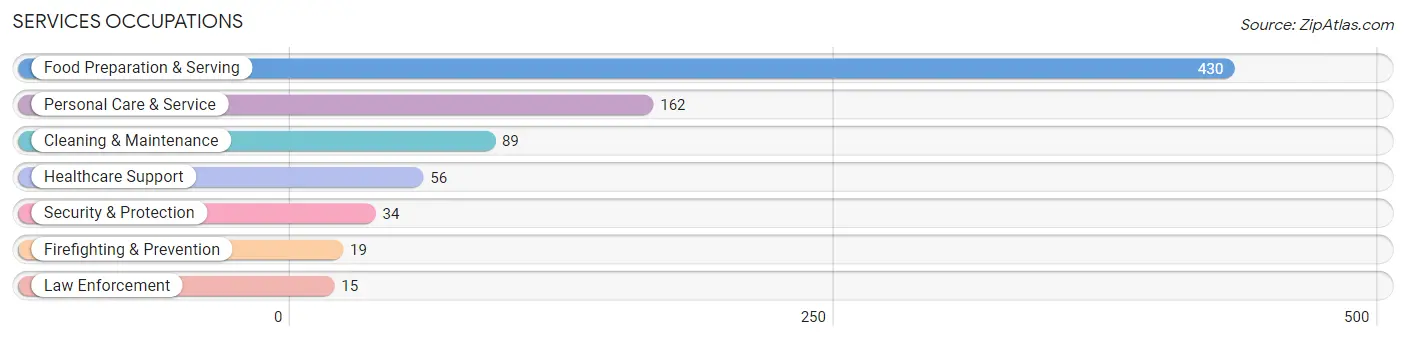
Services Occupations
The most common Services occupations in Sharonville are Food Preparation & Serving (430 | 5.8%), Personal Care & Service (162 | 2.2%), Cleaning & Maintenance (89 | 1.2%), Healthcare Support (56 | 0.8%), and Security & Protection (34 | 0.5%).
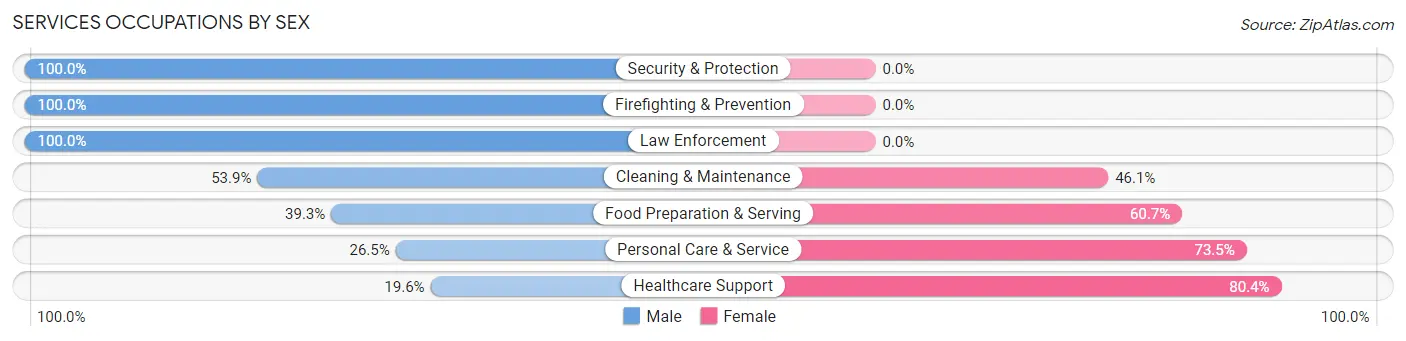
Services Occupations by Sex
Within the Services occupations in Sharonville, the most male-oriented occupations are Security & Protection (100.0%), Firefighting & Prevention (100.0%), and Law Enforcement (100.0%), while the most female-oriented occupations are Healthcare Support (80.4%), Personal Care & Service (73.5%), and Food Preparation & Serving (60.7%).
| Occupation | Male | Female |
| Healthcare Support | 11 (19.6%) | 45 (80.4%) |
| Security & Protection | 34 (100.0%) | 0 (0.0%) |
| Firefighting & Prevention | 19 (100.0%) | 0 (0.0%) |
| Law Enforcement | 15 (100.0%) | 0 (0.0%) |
| Food Preparation & Serving | 169 (39.3%) | 261 (60.7%) |
| Cleaning & Maintenance | 48 (53.9%) | 41 (46.1%) |
| Personal Care & Service | 43 (26.5%) | 119 (73.5%) |
| Total (Category) | 305 (39.6%) | 466 (60.4%) |
| Total (Overall) | 3,768 (50.9%) | 3,637 (49.1%) |
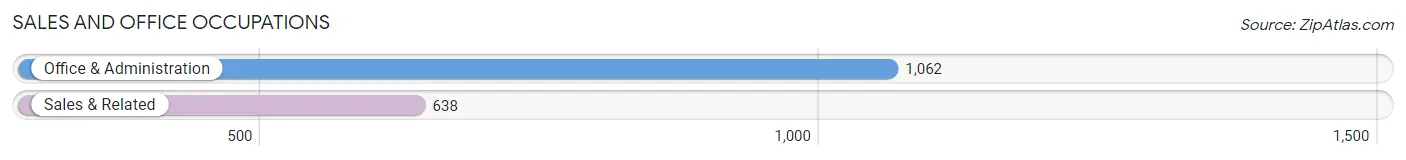
Sales and Office Occupations
The most common Sales and Office occupations in Sharonville are Office & Administration (1,062 | 14.3%), and Sales & Related (638 | 8.6%).
Sales and Office Occupations by Sex
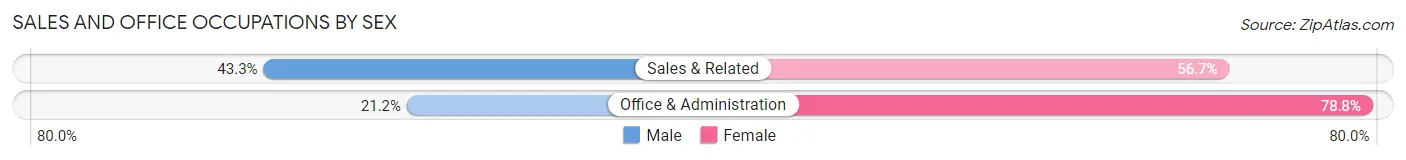
| Occupation | Male | Female |
| Sales & Related | 276 (43.3%) | 362 (56.7%) |
| Office & Administration | 225 (21.2%) | 837 (78.8%) |
| Total (Category) | 501 (29.5%) | 1,199 (70.5%) |
| Total (Overall) | 3,768 (50.9%) | 3,637 (49.1%) |
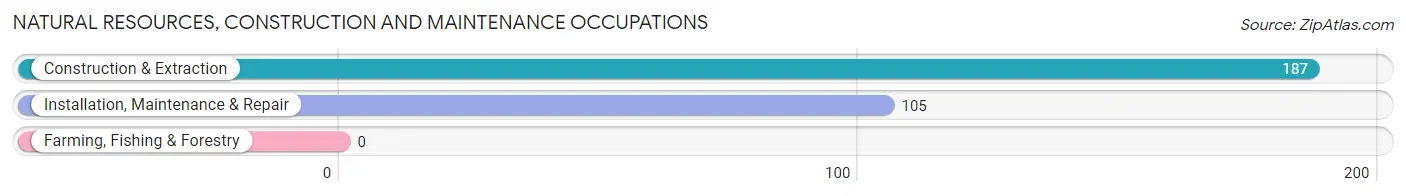
Natural Resources, Construction and Maintenance Occupations
The most common Natural Resources, Construction and Maintenance occupations in Sharonville are Construction & Extraction (187 | 2.5%), and Installation, Maintenance & Repair (105 | 1.4%).
Natural Resources, Construction and Maintenance Occupations by Sex
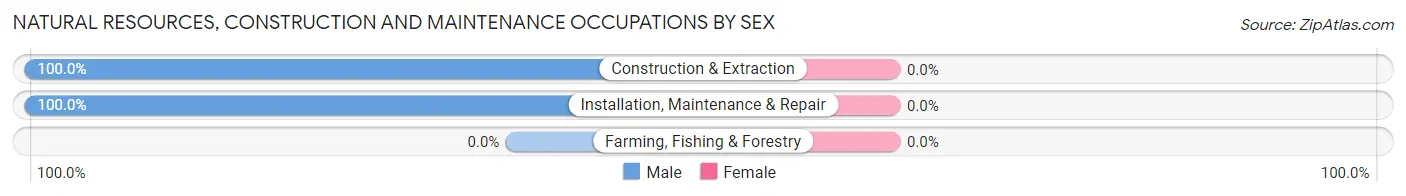
| Occupation | Male | Female |
| Farming, Fishing & Forestry | 0 (0.0%) | 0 (0.0%) |
| Construction & Extraction | 187 (100.0%) | 0 (0.0%) |
| Installation, Maintenance & Repair | 105 (100.0%) | 0 (0.0%) |
| Total (Category) | 292 (100.0%) | 0 (0.0%) |
| Total (Overall) | 3,768 (50.9%) | 3,637 (49.1%) |
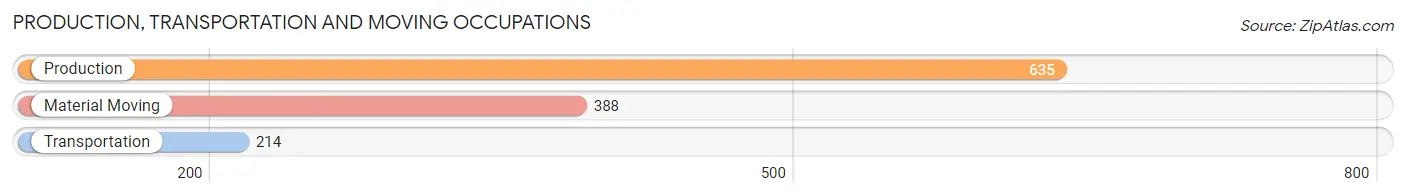
Production, Transportation and Moving Occupations
The most common Production, Transportation and Moving occupations in Sharonville are Production (635 | 8.6%), Material Moving (388 | 5.2%), and Transportation (214 | 2.9%).
Production, Transportation and Moving Occupations by Sex
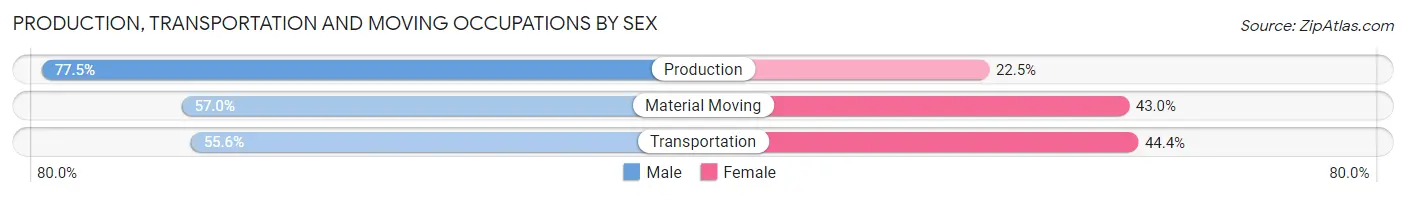
| Occupation | Male | Female |
| Production | 492 (77.5%) | 143 (22.5%) |
| Transportation | 119 (55.6%) | 95 (44.4%) |
| Material Moving | 221 (57.0%) | 167 (43.0%) |
| Total (Category) | 832 (67.3%) | 405 (32.7%) |
| Total (Overall) | 3,768 (50.9%) | 3,637 (49.1%) |
Employment Industries by Sex in Sharonville
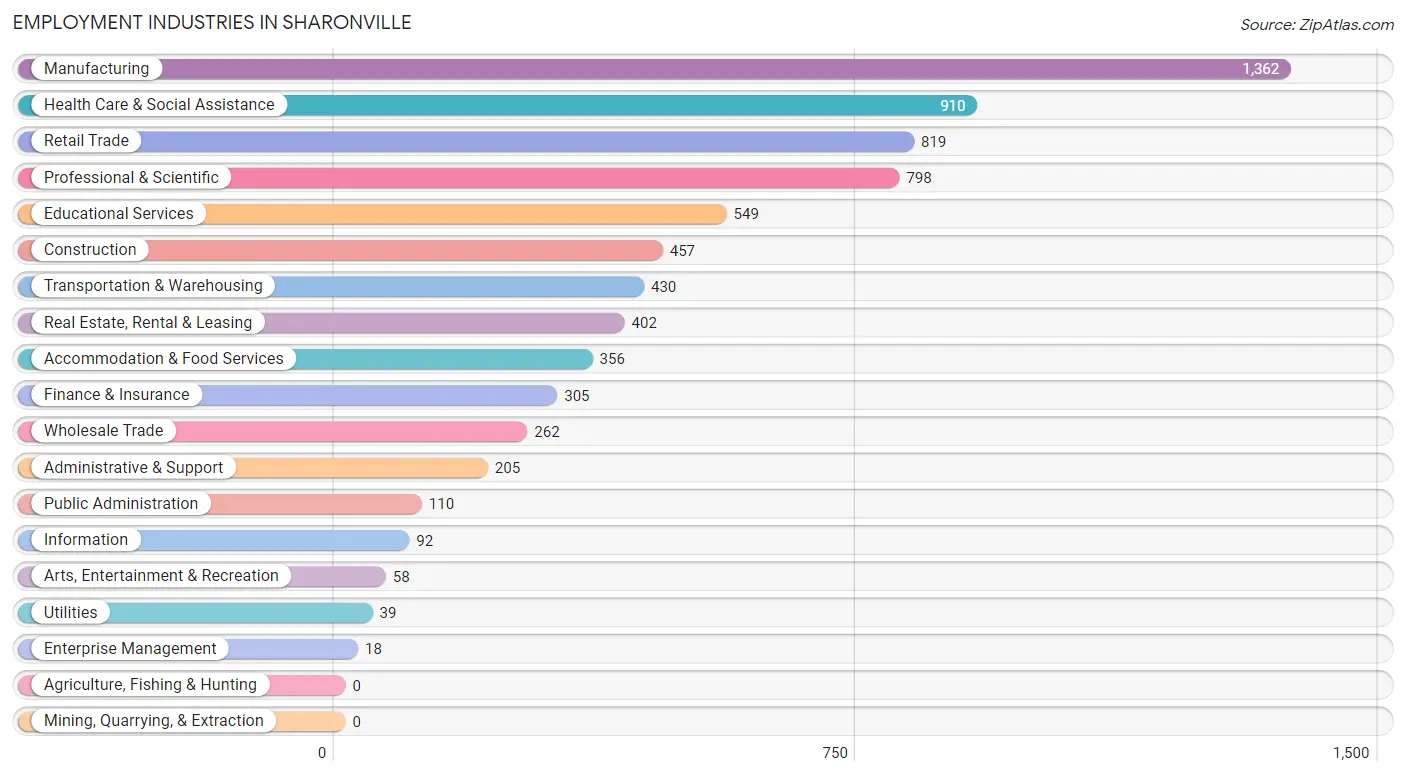
Employment Industries in Sharonville
The major employment industries in Sharonville include Manufacturing (1,362 | 18.4%), Health Care & Social Assistance (910 | 12.3%), Retail Trade (819 | 11.1%), Professional & Scientific (798 | 10.8%), and Educational Services (549 | 7.4%).
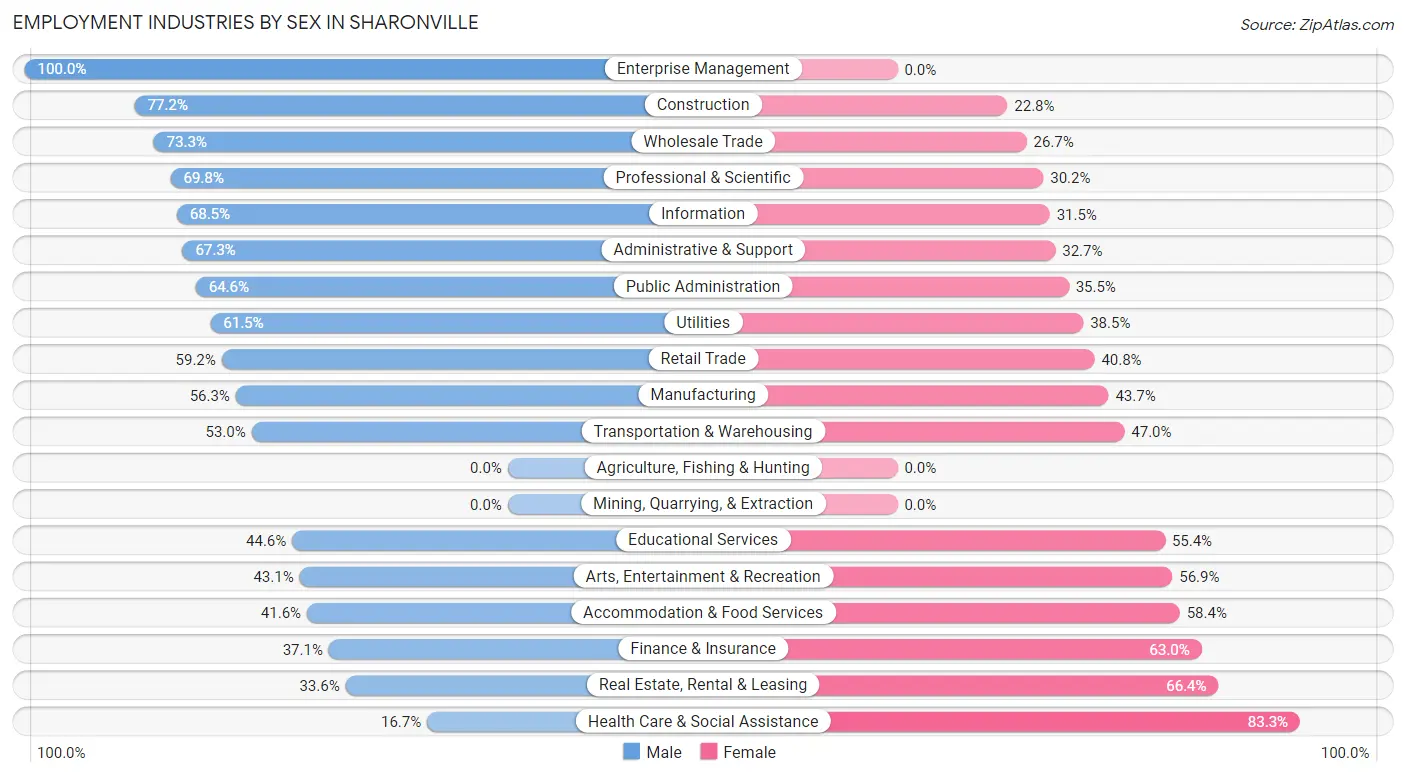
Employment Industries by Sex in Sharonville
The Sharonville industries that see more men than women are Enterprise Management (100.0%), Construction (77.2%), and Wholesale Trade (73.3%), whereas the industries that tend to have a higher number of women are Health Care & Social Assistance (83.3%), Real Estate, Rental & Leasing (66.4%), and Finance & Insurance (62.9%).
| Industry | Male | Female |
| Agriculture, Fishing & Hunting | 0 (0.0%) | 0 (0.0%) |
| Mining, Quarrying, & Extraction | 0 (0.0%) | 0 (0.0%) |
| Construction | 353 (77.2%) | 104 (22.8%) |
| Manufacturing | 767 (56.3%) | 595 (43.7%) |
| Wholesale Trade | 192 (73.3%) | 70 (26.7%) |
| Retail Trade | 485 (59.2%) | 334 (40.8%) |
| Transportation & Warehousing | 228 (53.0%) | 202 (47.0%) |
| Utilities | 24 (61.5%) | 15 (38.5%) |
| Information | 63 (68.5%) | 29 (31.5%) |
| Finance & Insurance | 113 (37.0%) | 192 (62.9%) |
| Real Estate, Rental & Leasing | 135 (33.6%) | 267 (66.4%) |
| Professional & Scientific | 557 (69.8%) | 241 (30.2%) |
| Enterprise Management | 18 (100.0%) | 0 (0.0%) |
| Administrative & Support | 138 (67.3%) | 67 (32.7%) |
| Educational Services | 245 (44.6%) | 304 (55.4%) |
| Health Care & Social Assistance | 152 (16.7%) | 758 (83.3%) |
| Arts, Entertainment & Recreation | 25 (43.1%) | 33 (56.9%) |
| Accommodation & Food Services | 148 (41.6%) | 208 (58.4%) |
| Public Administration | 71 (64.5%) | 39 (35.4%) |
| Total | 3,768 (50.9%) | 3,637 (49.1%) |
Education in Sharonville
School Enrollment in Sharonville
The most common levels of schooling among the 2,382 students in Sharonville are high school (647 | 27.2%), college / undergraduate (500 | 21.0%), and elementary school (330 | 13.9%).
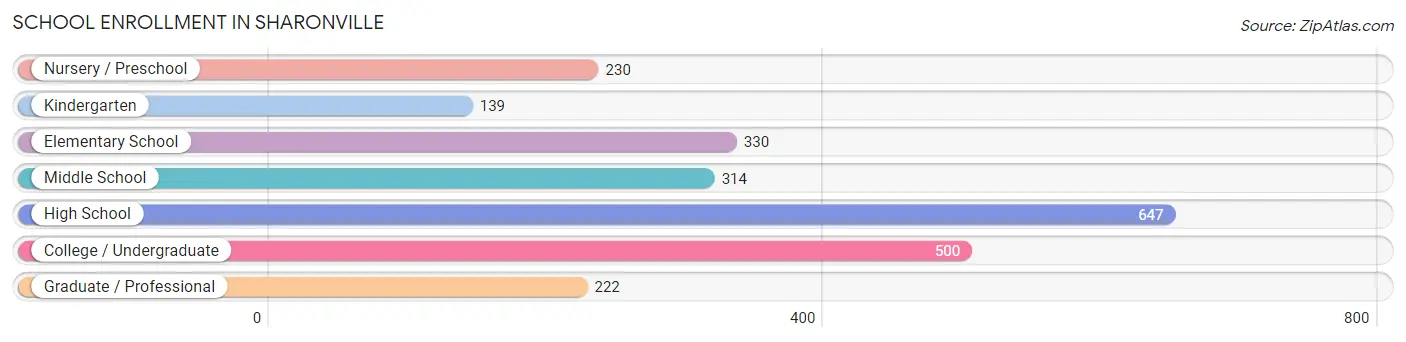
| School Level | # Students | % Students |
| Nursery / Preschool | 230 | 9.7% |
| Kindergarten | 139 | 5.8% |
| Elementary School | 330 | 13.9% |
| Middle School | 314 | 13.2% |
| High School | 647 | 27.2% |
| College / Undergraduate | 500 | 21.0% |
| Graduate / Professional | 222 | 9.3% |
| Total | 2,382 | 100.0% |
School Enrollment by Age by Funding Source in Sharonville
Out of a total of 2,382 students who are enrolled in schools in Sharonville, 369 (15.5%) attend a private institution, while the remaining 2,013 (84.5%) are enrolled in public schools. The age group of 5 to 9 year old has the highest likelihood of being enrolled in private schools, with 106 (22.1% in the age bracket) enrolled. Conversely, the age group of 10 to 14 year olds has the lowest likelihood of being enrolled in a private school, with 393 (94.9% in the age bracket) attending a public institution.
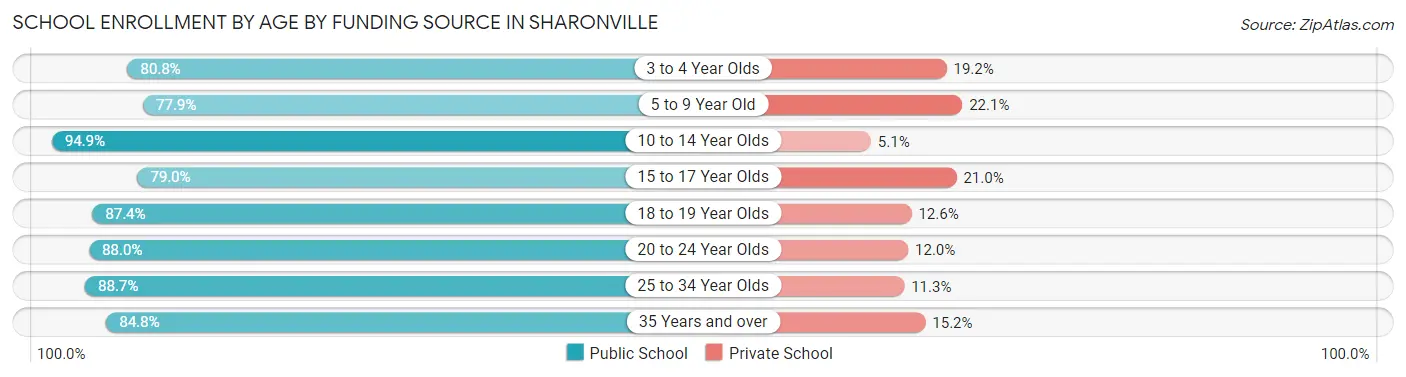
| Age Bracket | Public School | Private School |
| 3 to 4 Year Olds | 173 (80.8%) | 41 (19.2%) |
| 5 to 9 Year Old | 374 (77.9%) | 106 (22.1%) |
| 10 to 14 Year Olds | 393 (94.9%) | 21 (5.1%) |
| 15 to 17 Year Olds | 406 (79.0%) | 108 (21.0%) |
| 18 to 19 Year Olds | 173 (87.4%) | 25 (12.6%) |
| 20 to 24 Year Olds | 242 (88.0%) | 33 (12.0%) |
| 25 to 34 Year Olds | 173 (88.7%) | 22 (11.3%) |
| 35 Years and over | 78 (84.8%) | 14 (15.2%) |
| Total | 2,013 (84.5%) | 369 (15.5%) |
Educational Attainment by Field of Study in Sharonville
Business (590 | 14.3%), science & technology (479 | 11.6%), education (457 | 11.1%), engineering (444 | 10.8%), and computers & mathematics (353 | 8.6%) are the most common fields of study among 4,128 individuals in Sharonville who have obtained a bachelor's degree or higher.
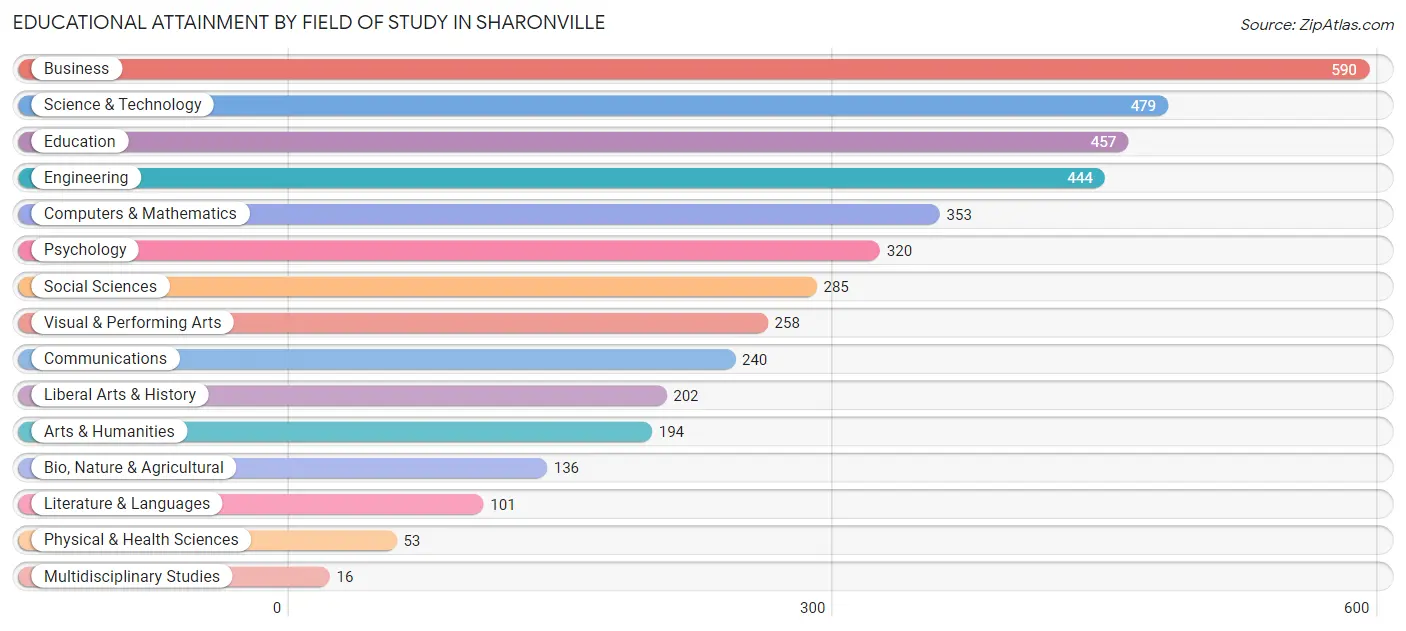
| Field of Study | # Graduates | % Graduates |
| Computers & Mathematics | 353 | 8.6% |
| Bio, Nature & Agricultural | 136 | 3.3% |
| Physical & Health Sciences | 53 | 1.3% |
| Psychology | 320 | 7.7% |
| Social Sciences | 285 | 6.9% |
| Engineering | 444 | 10.8% |
| Multidisciplinary Studies | 16 | 0.4% |
| Science & Technology | 479 | 11.6% |
| Business | 590 | 14.3% |
| Education | 457 | 11.1% |
| Literature & Languages | 101 | 2.5% |
| Liberal Arts & History | 202 | 4.9% |
| Visual & Performing Arts | 258 | 6.2% |
| Communications | 240 | 5.8% |
| Arts & Humanities | 194 | 4.7% |
| Total | 4,128 | 100.0% |
Transportation & Commute in Sharonville
Vehicle Availability by Sex in Sharonville
The most prevalent vehicle ownership categories in Sharonville are males with 2 vehicles (1,780, accounting for 47.8%) and females with 2 vehicles (1,512, making up 49.8%).
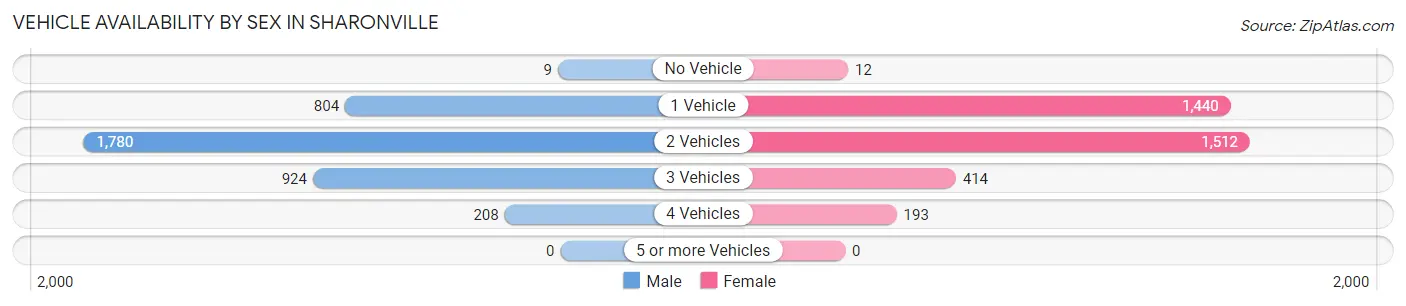
| Vehicles Available | Male | Female |
| No Vehicle | 9 (0.2%) | 12 (0.3%) |
| 1 Vehicle | 804 (21.6%) | 1,440 (40.3%) |
| 2 Vehicles | 1,780 (47.8%) | 1,512 (42.3%) |
| 3 Vehicles | 924 (24.8%) | 414 (11.6%) |
| 4 Vehicles | 208 (5.6%) | 193 (5.4%) |
| 5 or more Vehicles | 0 (0.0%) | 0 (0.0%) |
| Total | 3,725 (100.0%) | 3,571 (100.0%) |
Commute Time in Sharonville
The most frequently occuring commute durations in Sharonville are 20 to 24 minutes (1,295 commuters, 19.5%), 15 to 19 minutes (1,265 commuters, 19.0%), and 10 to 14 minutes (1,115 commuters, 16.8%).
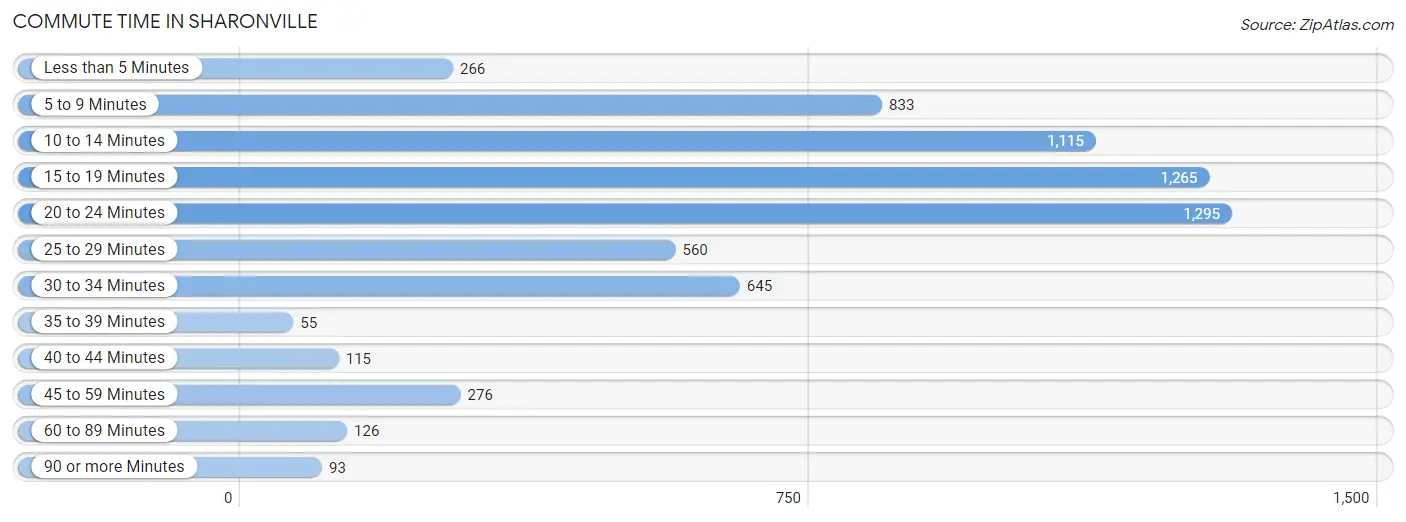
| Commute Time | # Commuters | % Commuters |
| Less than 5 Minutes | 266 | 4.0% |
| 5 to 9 Minutes | 833 | 12.5% |
| 10 to 14 Minutes | 1,115 | 16.8% |
| 15 to 19 Minutes | 1,265 | 19.0% |
| 20 to 24 Minutes | 1,295 | 19.5% |
| 25 to 29 Minutes | 560 | 8.4% |
| 30 to 34 Minutes | 645 | 9.7% |
| 35 to 39 Minutes | 55 | 0.8% |
| 40 to 44 Minutes | 115 | 1.7% |
| 45 to 59 Minutes | 276 | 4.2% |
| 60 to 89 Minutes | 126 | 1.9% |
| 90 or more Minutes | 93 | 1.4% |
Commute Time by Sex in Sharonville
The most common commute times in Sharonville are 20 to 24 minutes (812 commuters, 24.0%) for males and 10 to 14 minutes (650 commuters, 20.0%) for females.
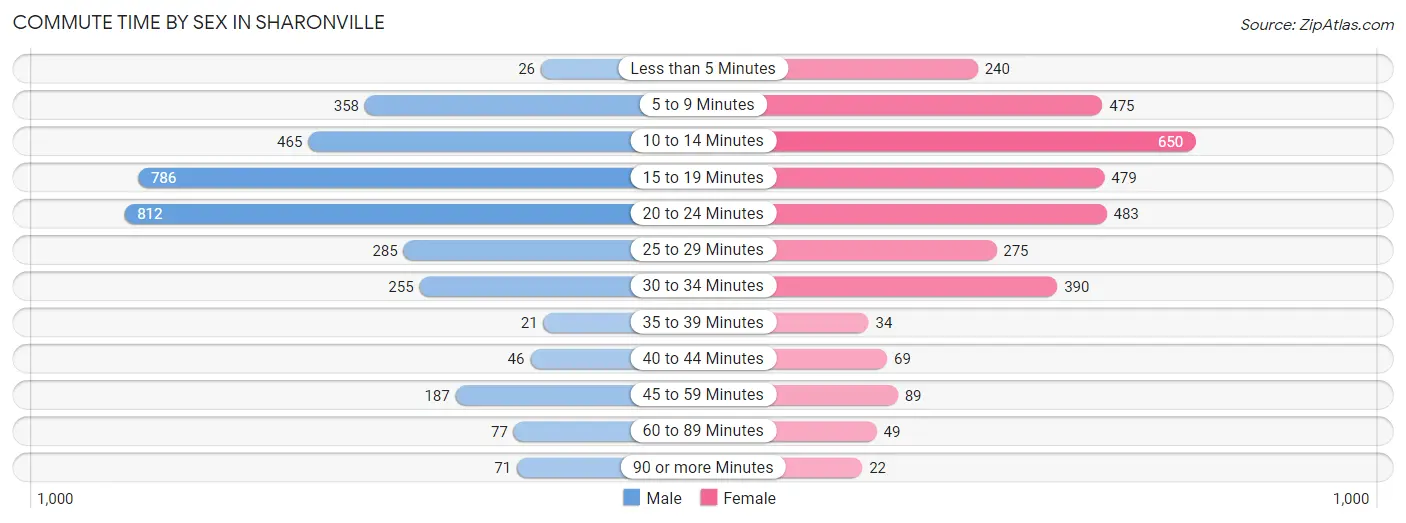
| Commute Time | Male | Female |
| Less than 5 Minutes | 26 (0.8%) | 240 (7.4%) |
| 5 to 9 Minutes | 358 (10.6%) | 475 (14.6%) |
| 10 to 14 Minutes | 465 (13.7%) | 650 (20.0%) |
| 15 to 19 Minutes | 786 (23.2%) | 479 (14.7%) |
| 20 to 24 Minutes | 812 (24.0%) | 483 (14.8%) |
| 25 to 29 Minutes | 285 (8.4%) | 275 (8.5%) |
| 30 to 34 Minutes | 255 (7.5%) | 390 (12.0%) |
| 35 to 39 Minutes | 21 (0.6%) | 34 (1.0%) |
| 40 to 44 Minutes | 46 (1.4%) | 69 (2.1%) |
| 45 to 59 Minutes | 187 (5.5%) | 89 (2.7%) |
| 60 to 89 Minutes | 77 (2.3%) | 49 (1.5%) |
| 90 or more Minutes | 71 (2.1%) | 22 (0.7%) |
Time of Departure to Work by Sex in Sharonville
The most frequent times of departure to work in Sharonville are 8:00 AM to 8:29 AM (460, 13.6%) for males and 7:30 AM to 7:59 AM (768, 23.6%) for females.
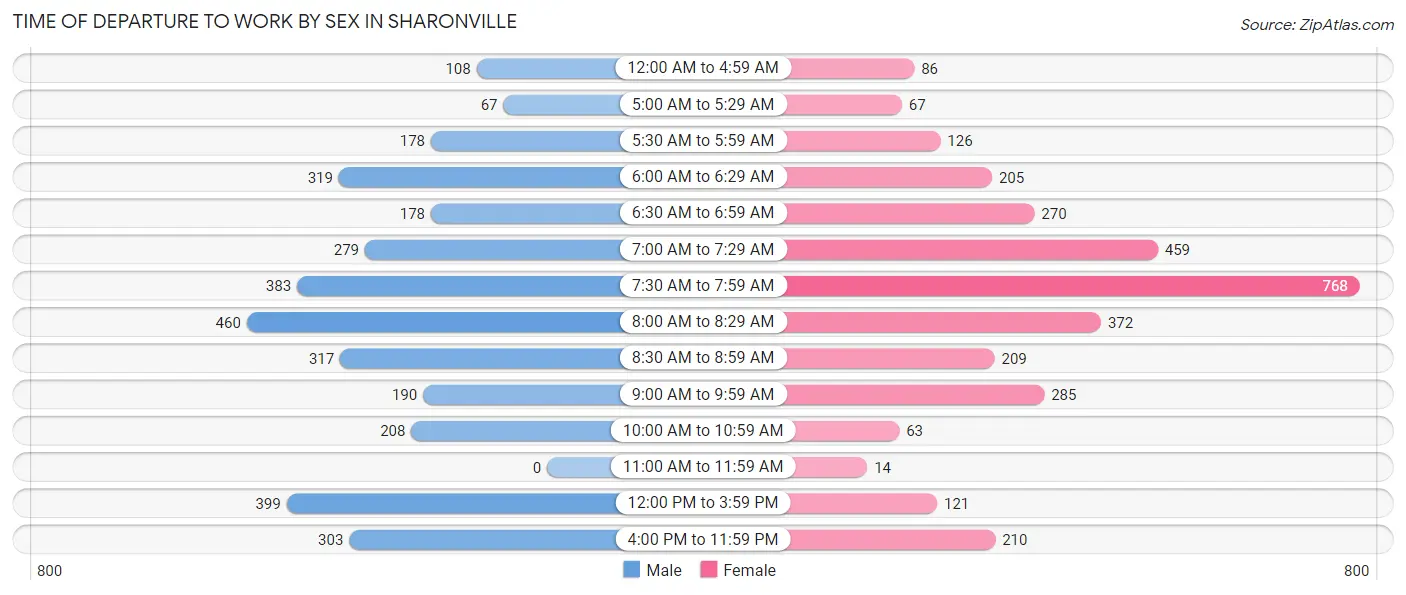
| Time of Departure | Male | Female |
| 12:00 AM to 4:59 AM | 108 (3.2%) | 86 (2.6%) |
| 5:00 AM to 5:29 AM | 67 (2.0%) | 67 (2.1%) |
| 5:30 AM to 5:59 AM | 178 (5.2%) | 126 (3.9%) |
| 6:00 AM to 6:29 AM | 319 (9.4%) | 205 (6.3%) |
| 6:30 AM to 6:59 AM | 178 (5.2%) | 270 (8.3%) |
| 7:00 AM to 7:29 AM | 279 (8.2%) | 459 (14.1%) |
| 7:30 AM to 7:59 AM | 383 (11.3%) | 768 (23.6%) |
| 8:00 AM to 8:29 AM | 460 (13.6%) | 372 (11.4%) |
| 8:30 AM to 8:59 AM | 317 (9.3%) | 209 (6.4%) |
| 9:00 AM to 9:59 AM | 190 (5.6%) | 285 (8.8%) |
| 10:00 AM to 10:59 AM | 208 (6.1%) | 63 (1.9%) |
| 11:00 AM to 11:59 AM | 0 (0.0%) | 14 (0.4%) |
| 12:00 PM to 3:59 PM | 399 (11.8%) | 121 (3.7%) |
| 4:00 PM to 11:59 PM | 303 (8.9%) | 210 (6.5%) |
| Total | 3,389 (100.0%) | 3,255 (100.0%) |
Housing Occupancy in Sharonville
Occupancy by Ownership in Sharonville
Of the total 6,750 dwellings in Sharonville, owner-occupied units account for 3,939 (58.4%), while renter-occupied units make up 2,811 (41.6%).
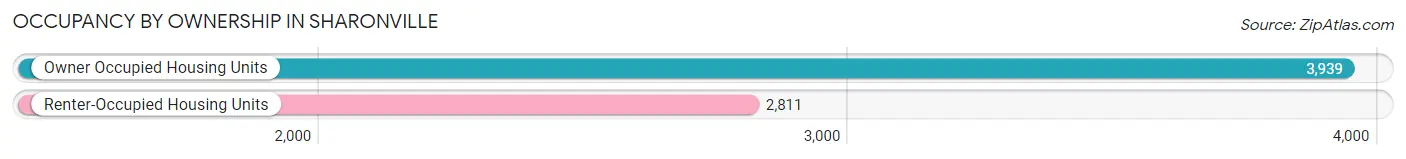
| Occupancy | # Housing Units | % Housing Units |
| Owner Occupied Housing Units | 3,939 | 58.4% |
| Renter-Occupied Housing Units | 2,811 | 41.6% |
| Total Occupied Housing Units | 6,750 | 100.0% |
Occupancy by Household Size in Sharonville
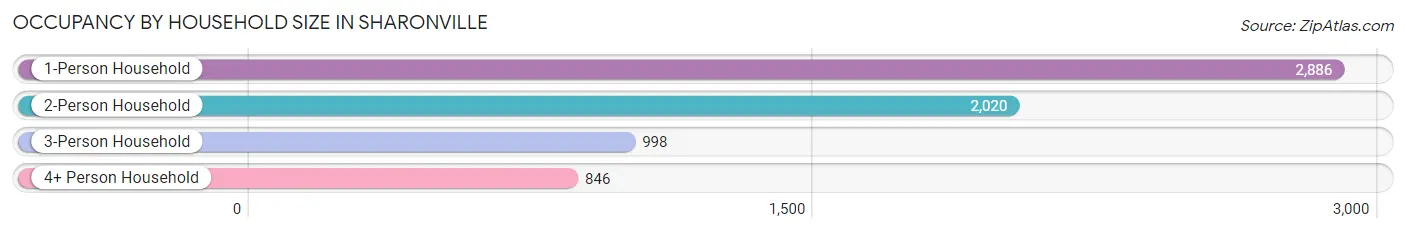
| Household Size | # Housing Units | % Housing Units |
| 1-Person Household | 2,886 | 42.8% |
| 2-Person Household | 2,020 | 29.9% |
| 3-Person Household | 998 | 14.8% |
| 4+ Person Household | 846 | 12.5% |
| Total Housing Units | 6,750 | 100.0% |
Occupancy by Ownership by Household Size in Sharonville
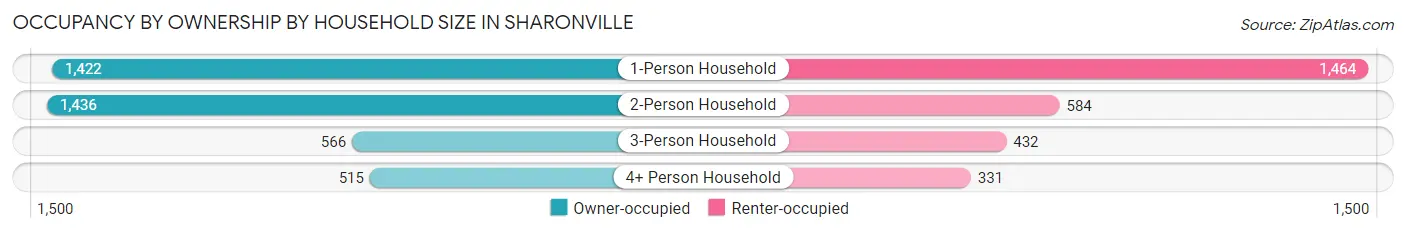
| Household Size | Owner-occupied | Renter-occupied |
| 1-Person Household | 1,422 (49.3%) | 1,464 (50.7%) |
| 2-Person Household | 1,436 (71.1%) | 584 (28.9%) |
| 3-Person Household | 566 (56.7%) | 432 (43.3%) |
| 4+ Person Household | 515 (60.9%) | 331 (39.1%) |
| Total Housing Units | 3,939 (58.4%) | 2,811 (41.6%) |
Occupancy by Educational Attainment in Sharonville
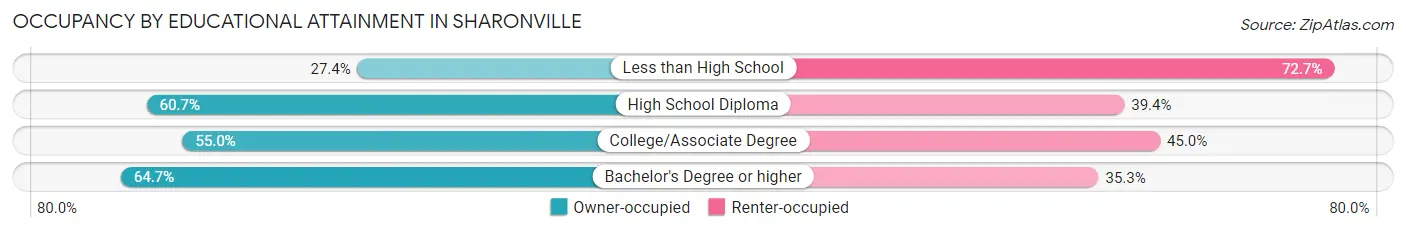
| Household Size | Owner-occupied | Renter-occupied |
| Less than High School | 122 (27.4%) | 324 (72.7%) |
| High School Diploma | 1,253 (60.7%) | 813 (39.4%) |
| College/Associate Degree | 1,008 (55.0%) | 826 (45.0%) |
| Bachelor's Degree or higher | 1,556 (64.7%) | 848 (35.3%) |
Occupancy by Age of Householder in Sharonville
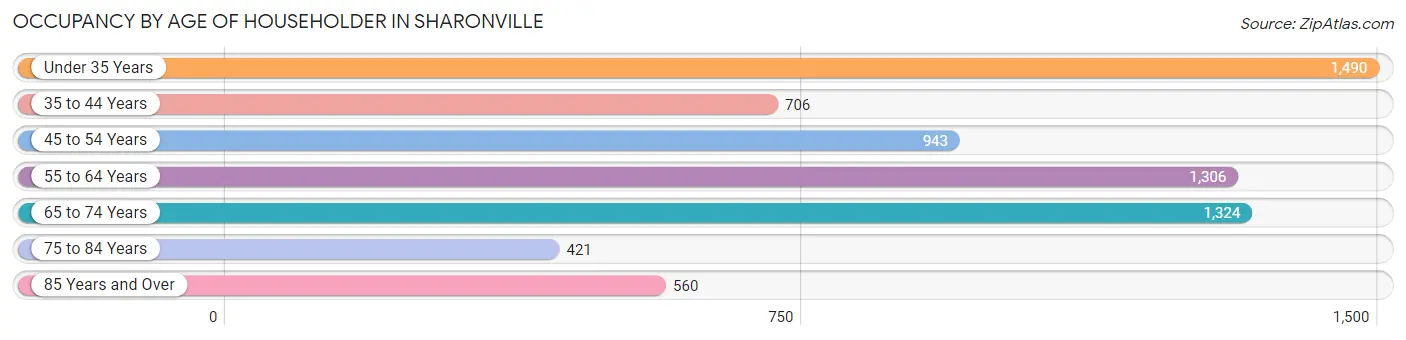
| Age Bracket | # Households | % Households |
| Under 35 Years | 1,490 | 22.1% |
| 35 to 44 Years | 706 | 10.5% |
| 45 to 54 Years | 943 | 14.0% |
| 55 to 64 Years | 1,306 | 19.4% |
| 65 to 74 Years | 1,324 | 19.6% |
| 75 to 84 Years | 421 | 6.2% |
| 85 Years and Over | 560 | 8.3% |
| Total | 6,750 | 100.0% |
Housing Finances in Sharonville
Median Income by Occupancy in Sharonville
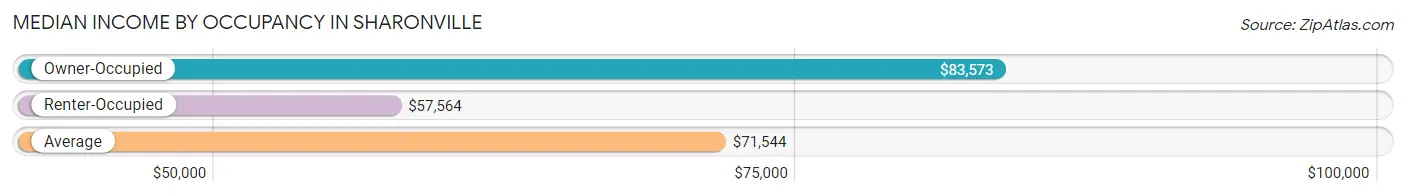
| Occupancy Type | # Households | Median Income |
| Owner-Occupied | 3,939 (58.4%) | $83,573 |
| Renter-Occupied | 2,811 (41.6%) | $57,564 |
| Average | 6,750 (100.0%) | $71,544 |
Occupancy by Householder Income Bracket in Sharonville
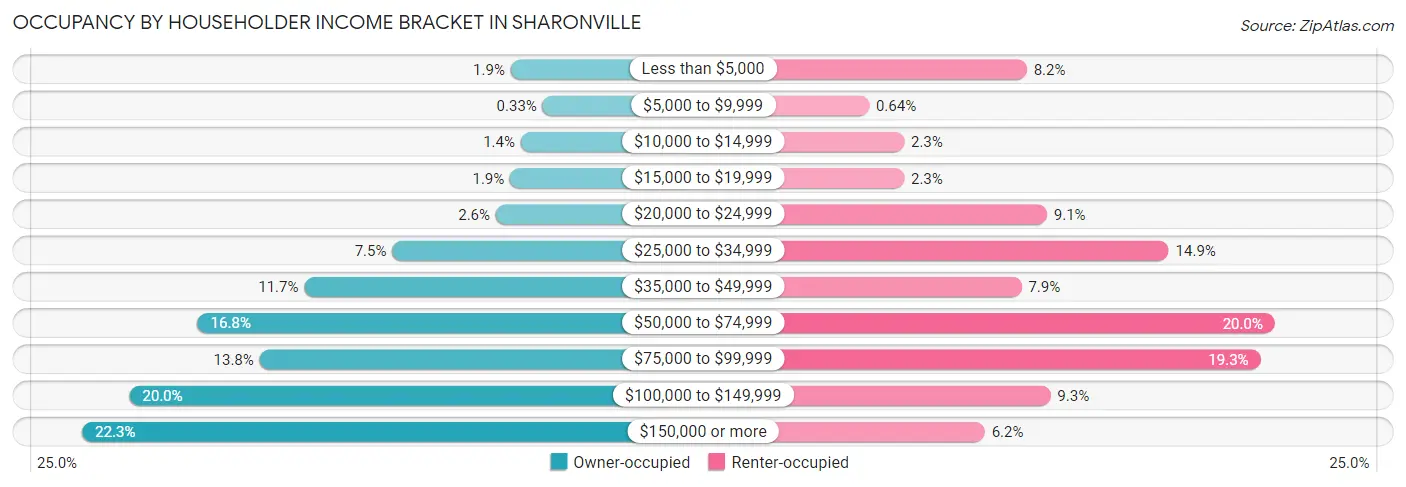
| Income Bracket | Owner-occupied | Renter-occupied |
| Less than $5,000 | 73 (1.8%) | 229 (8.2%) |
| $5,000 to $9,999 | 13 (0.3%) | 18 (0.6%) |
| $10,000 to $14,999 | 54 (1.4%) | 65 (2.3%) |
| $15,000 to $19,999 | 74 (1.9%) | 65 (2.3%) |
| $20,000 to $24,999 | 101 (2.6%) | 256 (9.1%) |
| $25,000 to $34,999 | 295 (7.5%) | 419 (14.9%) |
| $35,000 to $49,999 | 460 (11.7%) | 222 (7.9%) |
| $50,000 to $74,999 | 660 (16.8%) | 561 (20.0%) |
| $75,000 to $99,999 | 544 (13.8%) | 542 (19.3%) |
| $100,000 to $149,999 | 788 (20.0%) | 261 (9.3%) |
| $150,000 or more | 877 (22.3%) | 173 (6.1%) |
| Total | 3,939 (100.0%) | 2,811 (100.0%) |
Monthly Housing Cost Tiers in Sharonville
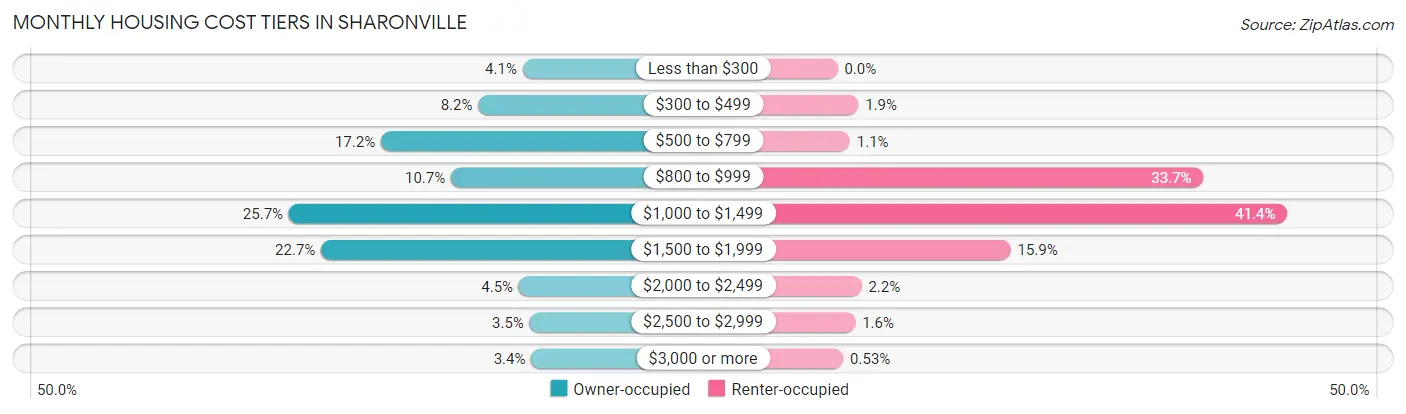
| Monthly Cost | Owner-occupied | Renter-occupied |
| Less than $300 | 163 (4.1%) | 0 (0.0%) |
| $300 to $499 | 324 (8.2%) | 54 (1.9%) |
| $500 to $799 | 677 (17.2%) | 32 (1.1%) |
| $800 to $999 | 423 (10.7%) | 947 (33.7%) |
| $1,000 to $1,499 | 1,011 (25.7%) | 1,164 (41.4%) |
| $1,500 to $1,999 | 894 (22.7%) | 448 (15.9%) |
| $2,000 to $2,499 | 177 (4.5%) | 62 (2.2%) |
| $2,500 to $2,999 | 138 (3.5%) | 46 (1.6%) |
| $3,000 or more | 132 (3.4%) | 15 (0.5%) |
| Total | 3,939 (100.0%) | 2,811 (100.0%) |
Physical Housing Characteristics in Sharonville
Housing Structures in Sharonville
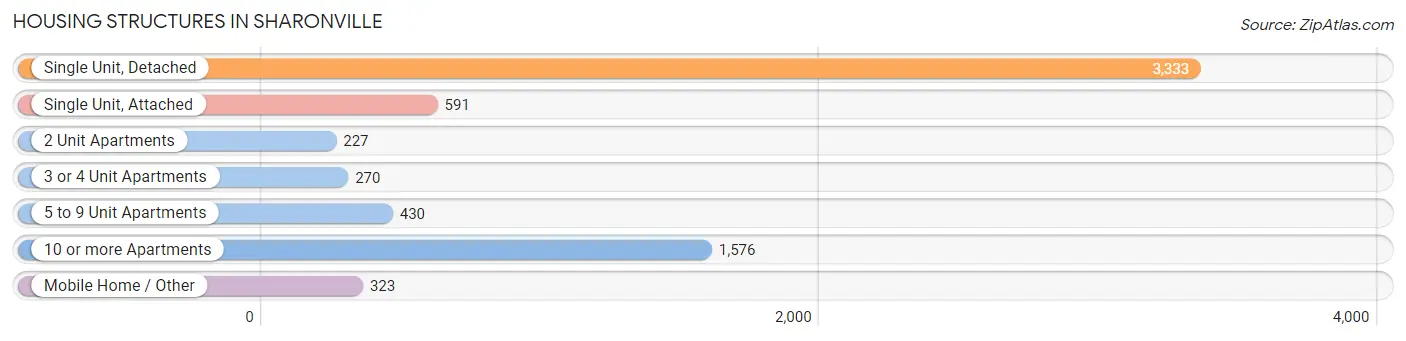
| Structure Type | # Housing Units | % Housing Units |
| Single Unit, Detached | 3,333 | 49.4% |
| Single Unit, Attached | 591 | 8.8% |
| 2 Unit Apartments | 227 | 3.4% |
| 3 or 4 Unit Apartments | 270 | 4.0% |
| 5 to 9 Unit Apartments | 430 | 6.4% |
| 10 or more Apartments | 1,576 | 23.4% |
| Mobile Home / Other | 323 | 4.8% |
| Total | 6,750 | 100.0% |
Housing Structures by Occupancy in Sharonville
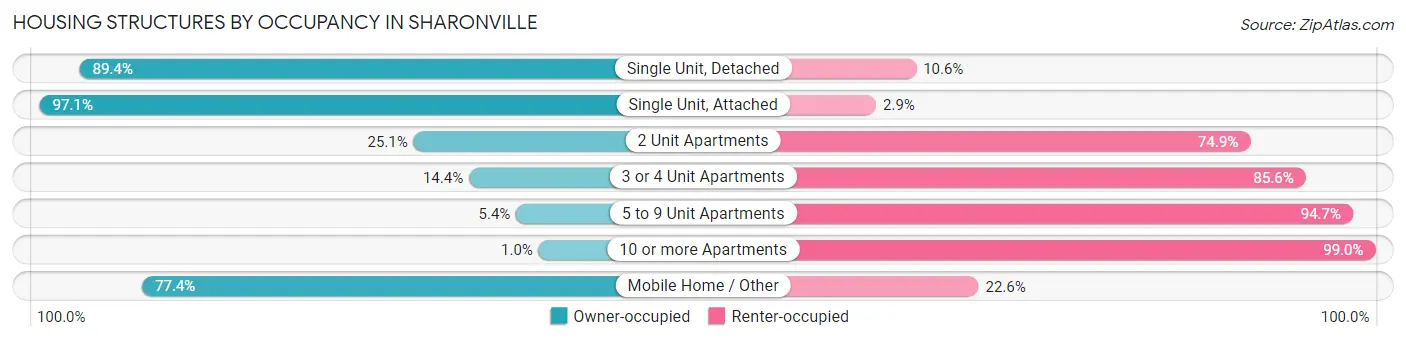
| Structure Type | Owner-occupied | Renter-occupied |
| Single Unit, Detached | 2,980 (89.4%) | 353 (10.6%) |
| Single Unit, Attached | 574 (97.1%) | 17 (2.9%) |
| 2 Unit Apartments | 57 (25.1%) | 170 (74.9%) |
| 3 or 4 Unit Apartments | 39 (14.4%) | 231 (85.6%) |
| 5 to 9 Unit Apartments | 23 (5.3%) | 407 (94.7%) |
| 10 or more Apartments | 16 (1.0%) | 1,560 (99.0%) |
| Mobile Home / Other | 250 (77.4%) | 73 (22.6%) |
| Total | 3,939 (58.4%) | 2,811 (41.6%) |
Housing Structures by Number of Rooms in Sharonville
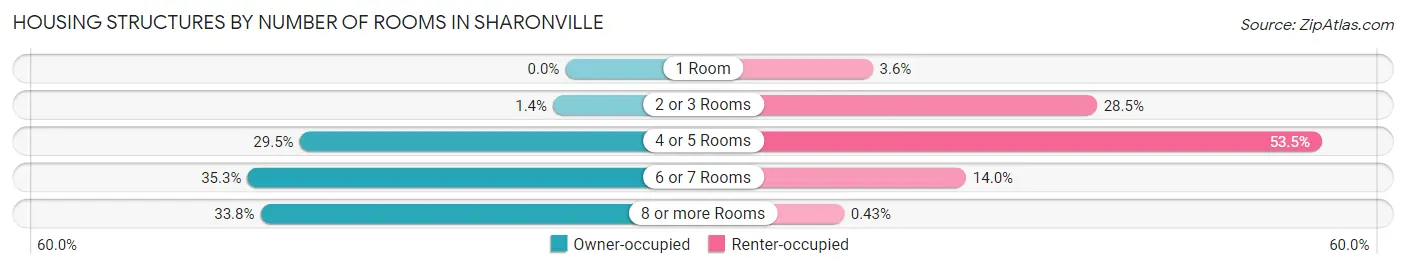
| Number of Rooms | Owner-occupied | Renter-occupied |
| 1 Room | 0 (0.0%) | 102 (3.6%) |
| 2 or 3 Rooms | 54 (1.4%) | 801 (28.5%) |
| 4 or 5 Rooms | 1,162 (29.5%) | 1,503 (53.5%) |
| 6 or 7 Rooms | 1,390 (35.3%) | 393 (14.0%) |
| 8 or more Rooms | 1,333 (33.8%) | 12 (0.4%) |
| Total | 3,939 (100.0%) | 2,811 (100.0%) |
Housing Structure by Heating Type in Sharonville
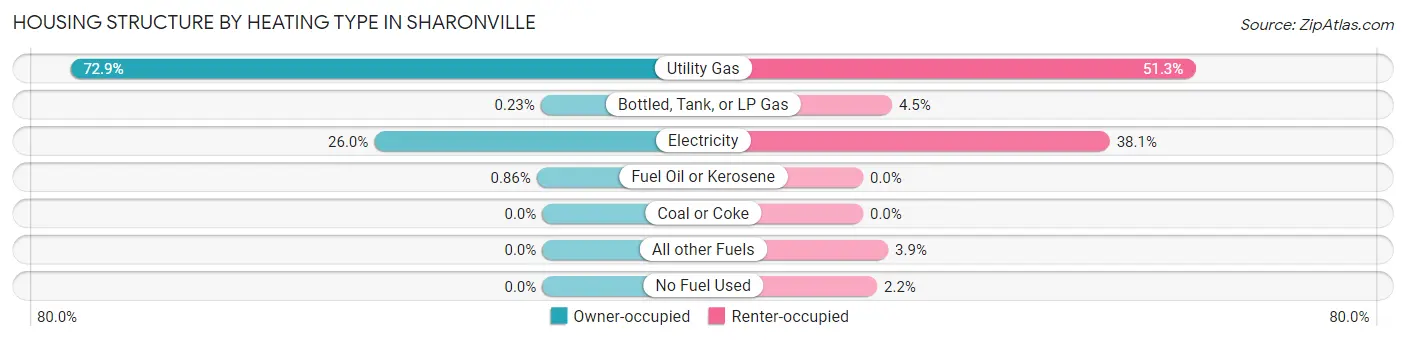
| Heating Type | Owner-occupied | Renter-occupied |
| Utility Gas | 2,873 (72.9%) | 1,443 (51.3%) |
| Bottled, Tank, or LP Gas | 9 (0.2%) | 126 (4.5%) |
| Electricity | 1,023 (26.0%) | 1,072 (38.1%) |
| Fuel Oil or Kerosene | 34 (0.9%) | 0 (0.0%) |
| Coal or Coke | 0 (0.0%) | 0 (0.0%) |
| All other Fuels | 0 (0.0%) | 109 (3.9%) |
| No Fuel Used | 0 (0.0%) | 61 (2.2%) |
| Total | 3,939 (100.0%) | 2,811 (100.0%) |
Household Vehicle Usage in Sharonville
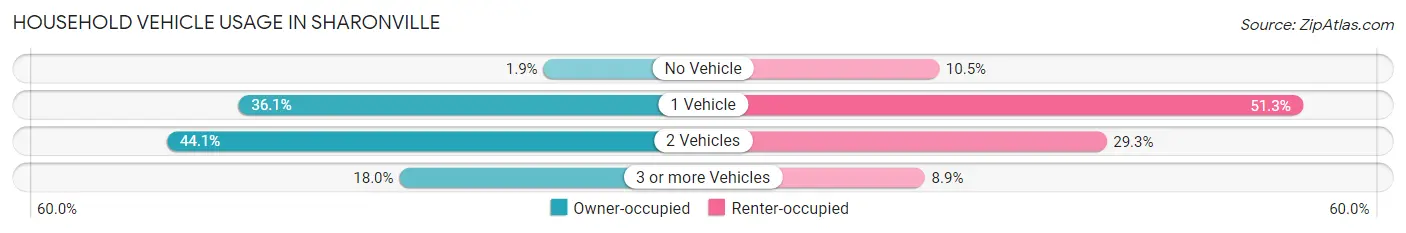
| Vehicles per Household | Owner-occupied | Renter-occupied |
| No Vehicle | 74 (1.9%) | 296 (10.5%) |
| 1 Vehicle | 1,420 (36.0%) | 1,441 (51.3%) |
| 2 Vehicles | 1,735 (44.1%) | 823 (29.3%) |
| 3 or more Vehicles | 710 (18.0%) | 251 (8.9%) |
| Total | 3,939 (100.0%) | 2,811 (100.0%) |
Real Estate & Mortgages in Sharonville
Real Estate and Mortgage Overview in Sharonville
| Characteristic | Without Mortgage | With Mortgage |
| Housing Units | 1,475 | 2,464 |
| Median Property Value | $191,900 | $188,700 |
| Median Household Income | $64,496 | $667 |
| Monthly Housing Costs | $586 | $119 |
| Real Estate Taxes | $2,723 | $26 |
Property Value by Mortgage Status in Sharonville
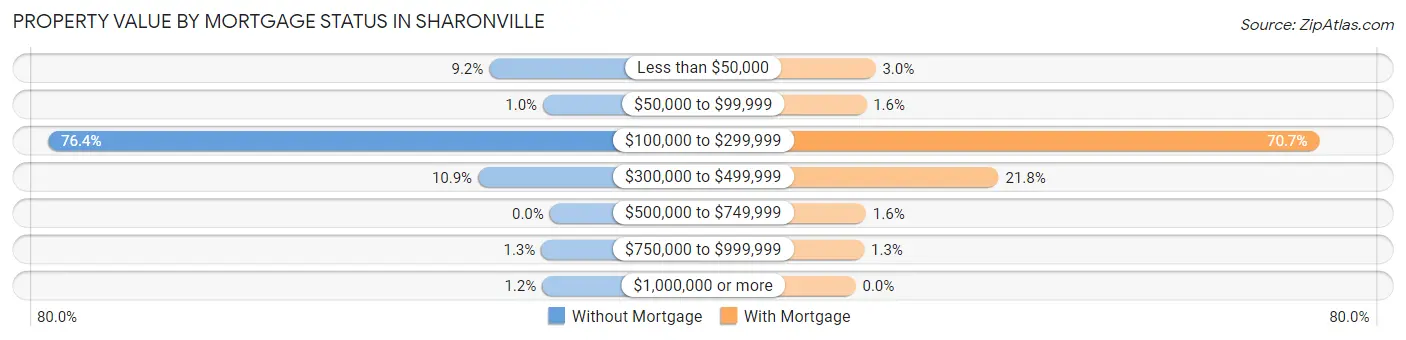
| Property Value | Without Mortgage | With Mortgage |
| Less than $50,000 | 136 (9.2%) | 75 (3.0%) |
| $50,000 to $99,999 | 15 (1.0%) | 40 (1.6%) |
| $100,000 to $299,999 | 1,127 (76.4%) | 1,741 (70.7%) |
| $300,000 to $499,999 | 161 (10.9%) | 537 (21.8%) |
| $500,000 to $749,999 | 0 (0.0%) | 39 (1.6%) |
| $750,000 to $999,999 | 19 (1.3%) | 32 (1.3%) |
| $1,000,000 or more | 17 (1.1%) | 0 (0.0%) |
| Total | 1,475 (100.0%) | 2,464 (100.0%) |
Household Income by Mortgage Status in Sharonville
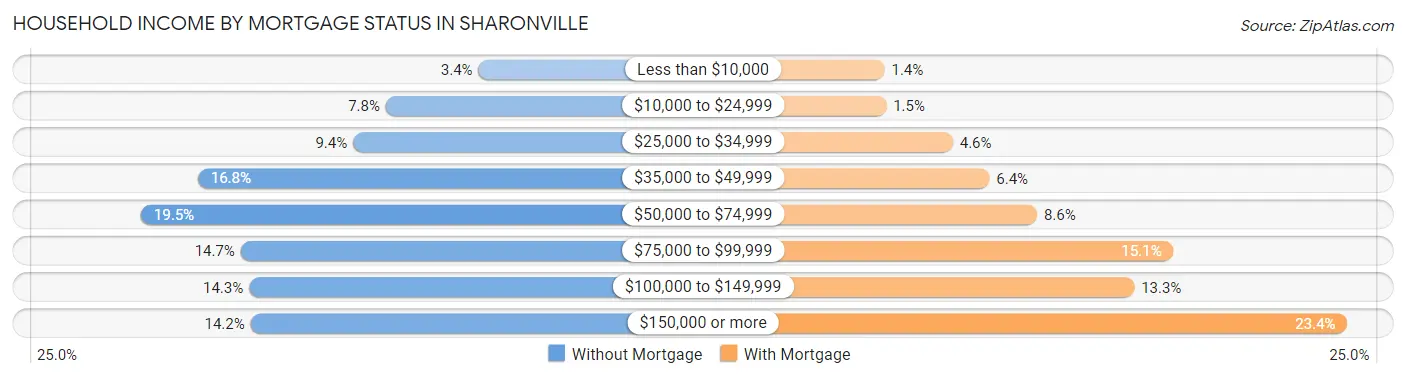
| Household Income | Without Mortgage | With Mortgage |
| Less than $10,000 | 50 (3.4%) | 34 (1.4%) |
| $10,000 to $24,999 | 115 (7.8%) | 36 (1.5%) |
| $25,000 to $34,999 | 138 (9.4%) | 114 (4.6%) |
| $35,000 to $49,999 | 247 (16.8%) | 157 (6.4%) |
| $50,000 to $74,999 | 287 (19.5%) | 213 (8.6%) |
| $75,000 to $99,999 | 217 (14.7%) | 373 (15.1%) |
| $100,000 to $149,999 | 211 (14.3%) | 327 (13.3%) |
| $150,000 or more | 210 (14.2%) | 577 (23.4%) |
| Total | 1,475 (100.0%) | 2,464 (100.0%) |
Property Value to Household Income Ratio in Sharonville
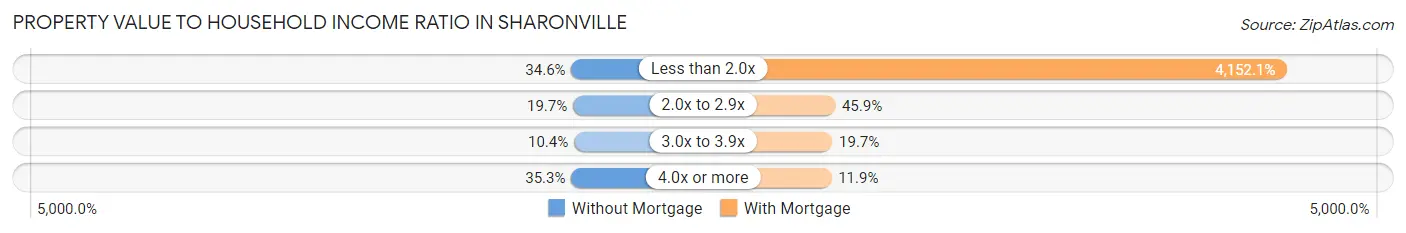
| Value-to-Income Ratio | Without Mortgage | With Mortgage |
| Less than 2.0x | 510 (34.6%) | 102,308 (4,152.1%) |
| 2.0x to 2.9x | 290 (19.7%) | 1,131 (45.9%) |
| 3.0x to 3.9x | 154 (10.4%) | 486 (19.7%) |
| 4.0x or more | 521 (35.3%) | 292 (11.8%) |
| Total | 1,475 (100.0%) | 2,464 (100.0%) |
Real Estate Taxes by Mortgage Status in Sharonville
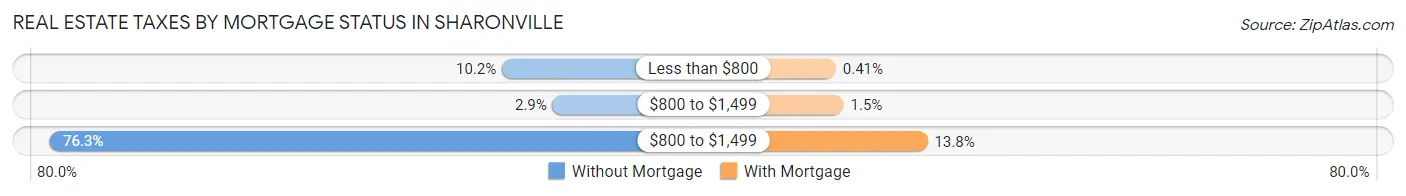
| Property Taxes | Without Mortgage | With Mortgage |
| Less than $800 | 151 (10.2%) | 10 (0.4%) |
| $800 to $1,499 | 42 (2.9%) | 38 (1.5%) |
| $800 to $1,499 | 1,125 (76.3%) | 340 (13.8%) |
| Total | 1,475 (100.0%) | 2,464 (100.0%) |
Health & Disability in Sharonville
Health Insurance Coverage by Age in Sharonville
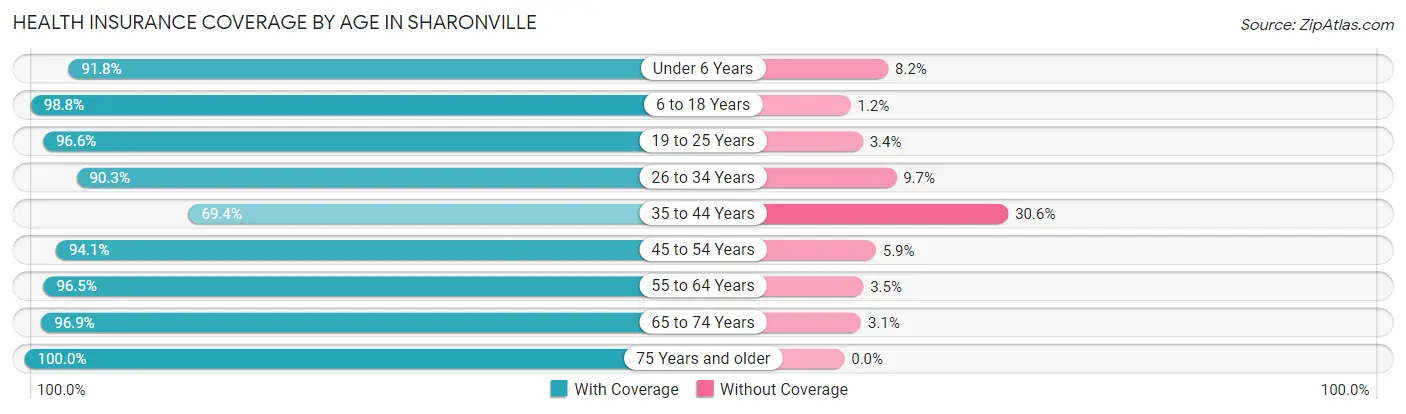
| Age Bracket | With Coverage | Without Coverage |
| Under 6 Years | 989 (91.8%) | 88 (8.2%) |
| 6 to 18 Years | 1,445 (98.8%) | 17 (1.2%) |
| 19 to 25 Years | 986 (96.6%) | 35 (3.4%) |
| 26 to 34 Years | 1,847 (90.3%) | 198 (9.7%) |
| 35 to 44 Years | 920 (69.4%) | 405 (30.6%) |
| 45 to 54 Years | 1,346 (94.1%) | 84 (5.9%) |
| 55 to 64 Years | 2,460 (96.5%) | 90 (3.5%) |
| 65 to 74 Years | 1,544 (96.9%) | 50 (3.1%) |
| 75 Years and older | 1,365 (100.0%) | 0 (0.0%) |
| Total | 12,902 (93.0%) | 967 (7.0%) |
Health Insurance Coverage by Citizenship Status in Sharonville
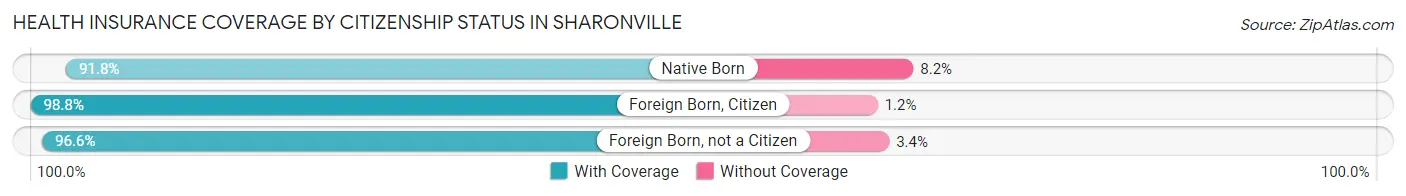
| Citizenship Status | With Coverage | Without Coverage |
| Native Born | 989 (91.8%) | 88 (8.2%) |
| Foreign Born, Citizen | 1,445 (98.8%) | 17 (1.2%) |
| Foreign Born, not a Citizen | 986 (96.6%) | 35 (3.4%) |
Health Insurance Coverage by Household Income in Sharonville
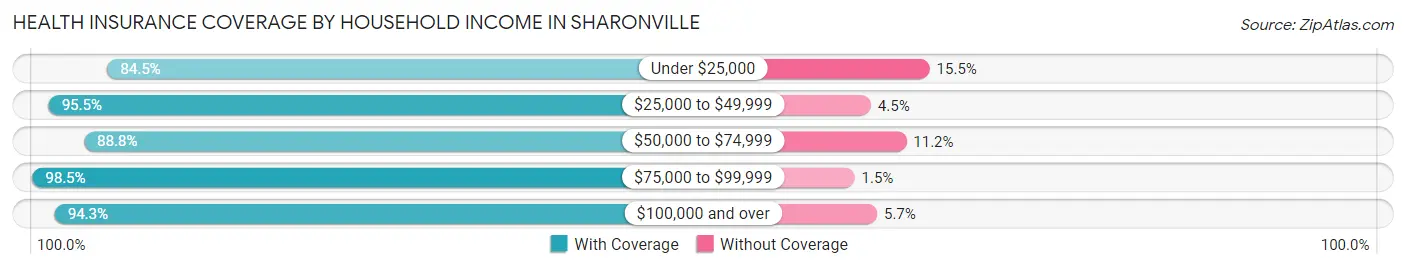
| Household Income | With Coverage | Without Coverage |
| Under $25,000 | 1,067 (84.5%) | 196 (15.5%) |
| $25,000 to $49,999 | 2,326 (95.5%) | 110 (4.5%) |
| $50,000 to $74,999 | 2,652 (88.8%) | 333 (11.2%) |
| $75,000 to $99,999 | 1,827 (98.5%) | 27 (1.5%) |
| $100,000 and over | 5,006 (94.3%) | 301 (5.7%) |
Public vs Private Health Insurance Coverage by Age in Sharonville
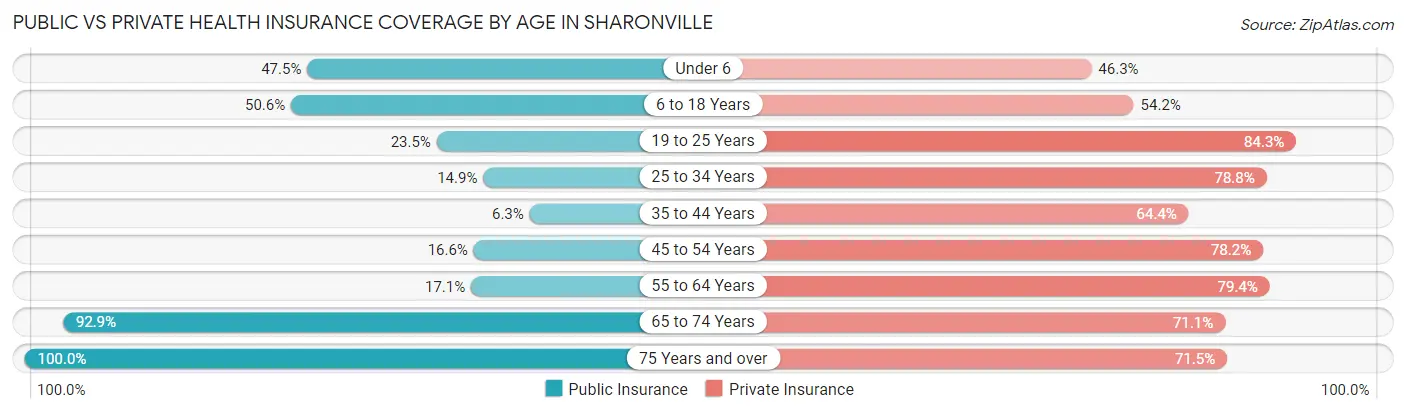
| Age Bracket | Public Insurance | Private Insurance |
| Under 6 | 512 (47.5%) | 499 (46.3%) |
| 6 to 18 Years | 739 (50.5%) | 792 (54.2%) |
| 19 to 25 Years | 240 (23.5%) | 861 (84.3%) |
| 25 to 34 Years | 304 (14.9%) | 1,612 (78.8%) |
| 35 to 44 Years | 83 (6.3%) | 853 (64.4%) |
| 45 to 54 Years | 238 (16.6%) | 1,118 (78.2%) |
| 55 to 64 Years | 437 (17.1%) | 2,025 (79.4%) |
| 65 to 74 Years | 1,481 (92.9%) | 1,134 (71.1%) |
| 75 Years and over | 1,365 (100.0%) | 976 (71.5%) |
| Total | 5,399 (38.9%) | 9,870 (71.2%) |
Disability Status by Sex by Age in Sharonville
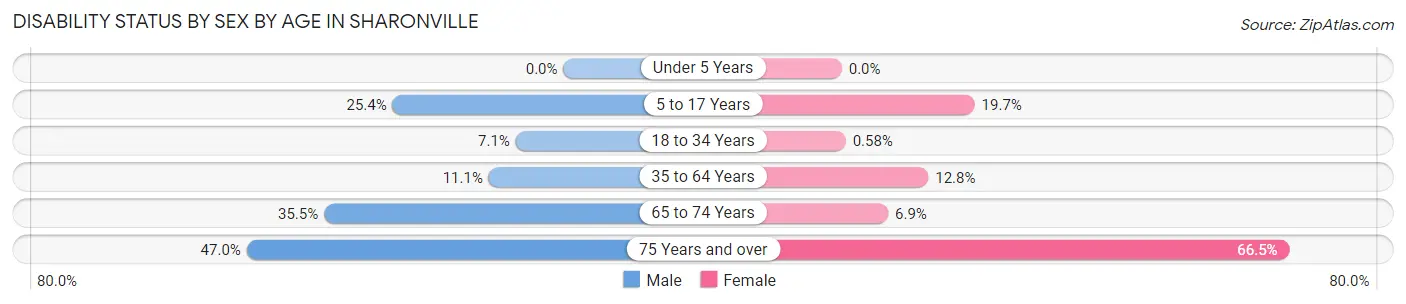
| Age Bracket | Male | Female |
| Under 5 Years | 0 (0.0%) | 0 (0.0%) |
| 5 to 17 Years | 262 (25.4%) | 74 (19.7%) |
| 18 to 34 Years | 118 (7.1%) | 9 (0.6%) |
| 35 to 64 Years | 285 (11.1%) | 351 (12.8%) |
| 65 to 74 Years | 205 (35.5%) | 70 (6.9%) |
| 75 Years and over | 182 (47.0%) | 650 (66.5%) |
Disability Class by Sex by Age in Sharonville
Disability Class: Hearing Difficulty
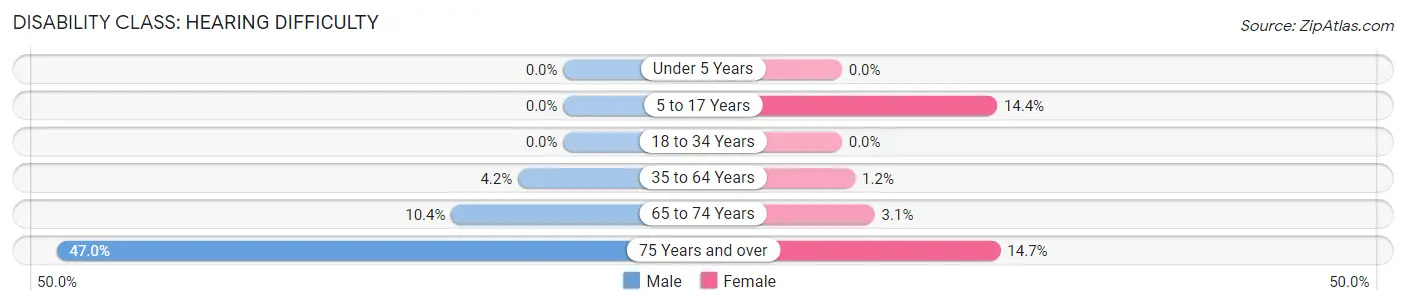
| Age Bracket | Male | Female |
| Under 5 Years | 0 (0.0%) | 0 (0.0%) |
| 5 to 17 Years | 0 (0.0%) | 54 (14.4%) |
| 18 to 34 Years | 0 (0.0%) | 0 (0.0%) |
| 35 to 64 Years | 108 (4.2%) | 34 (1.2%) |
| 65 to 74 Years | 60 (10.4%) | 31 (3.0%) |
| 75 Years and over | 182 (47.0%) | 144 (14.7%) |
Disability Class: Vision Difficulty
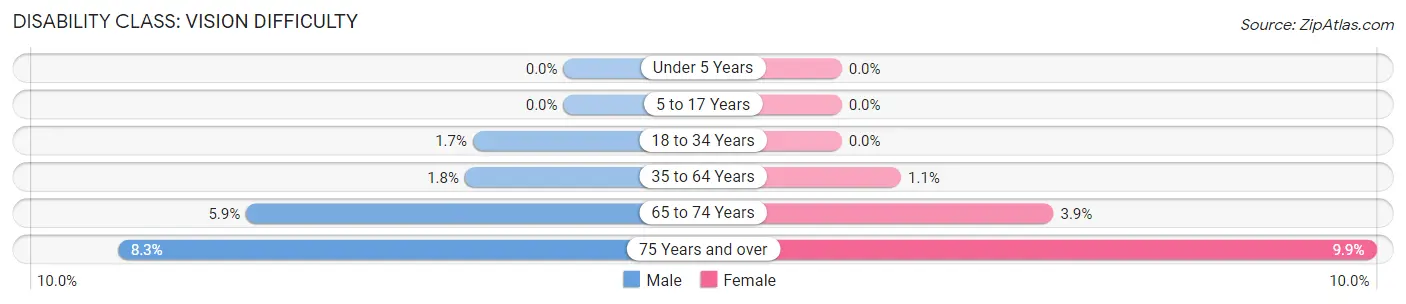
| Age Bracket | Male | Female |
| Under 5 Years | 0 (0.0%) | 0 (0.0%) |
| 5 to 17 Years | 0 (0.0%) | 0 (0.0%) |
| 18 to 34 Years | 28 (1.7%) | 0 (0.0%) |
| 35 to 64 Years | 47 (1.8%) | 30 (1.1%) |
| 65 to 74 Years | 34 (5.9%) | 40 (3.9%) |
| 75 Years and over | 32 (8.3%) | 97 (9.9%) |
Disability Class: Cognitive Difficulty
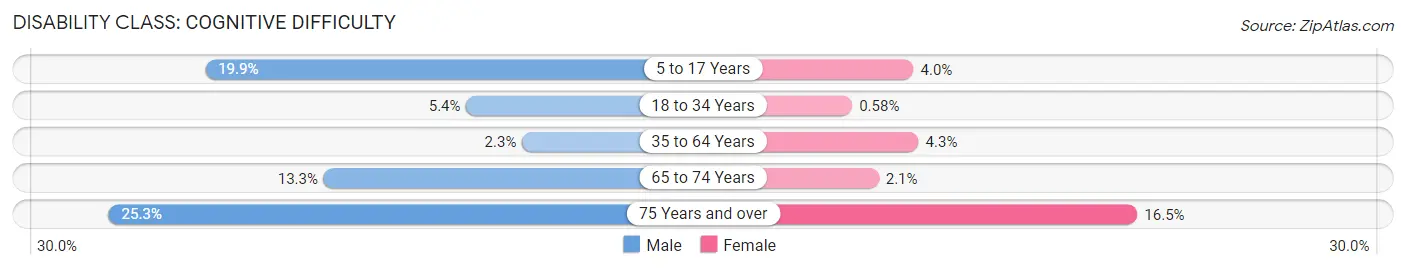
| Age Bracket | Male | Female |
| 5 to 17 Years | 206 (19.9%) | 15 (4.0%) |
| 18 to 34 Years | 90 (5.4%) | 9 (0.6%) |
| 35 to 64 Years | 59 (2.3%) | 117 (4.3%) |
| 65 to 74 Years | 77 (13.3%) | 21 (2.1%) |
| 75 Years and over | 98 (25.3%) | 161 (16.5%) |
Disability Class: Ambulatory Difficulty
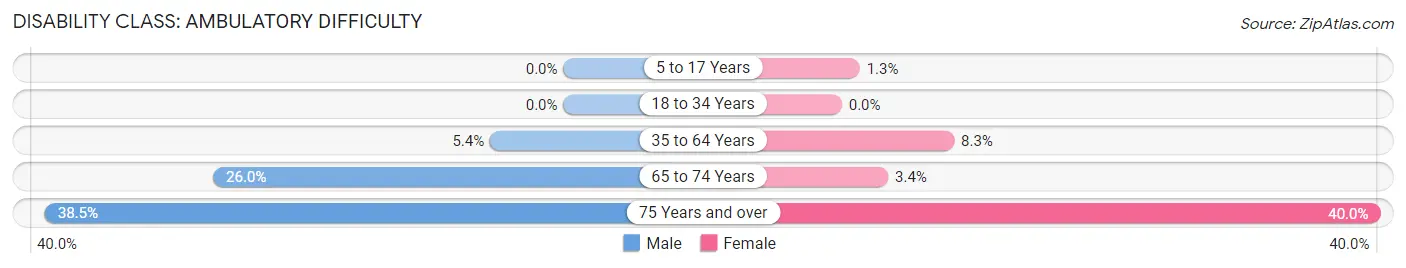
| Age Bracket | Male | Female |
| 5 to 17 Years | 0 (0.0%) | 5 (1.3%) |
| 18 to 34 Years | 0 (0.0%) | 0 (0.0%) |
| 35 to 64 Years | 140 (5.4%) | 228 (8.3%) |
| 65 to 74 Years | 150 (26.0%) | 35 (3.4%) |
| 75 Years and over | 149 (38.5%) | 391 (40.0%) |
Disability Class: Self-Care Difficulty
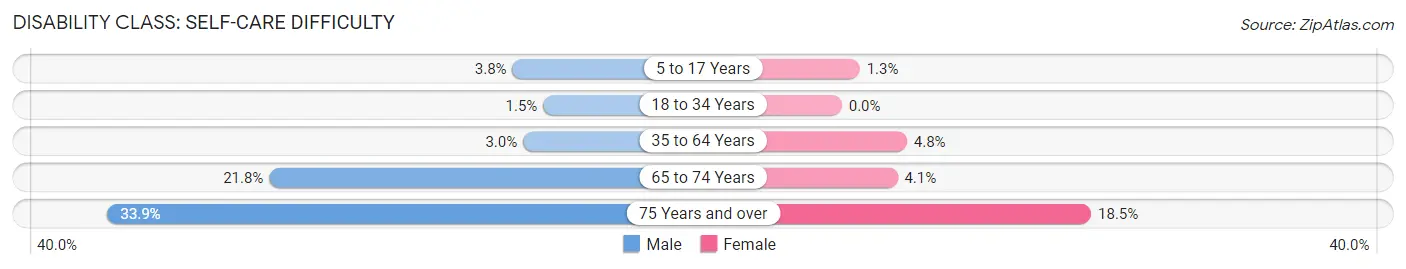
| Age Bracket | Male | Female |
| 5 to 17 Years | 39 (3.8%) | 5 (1.3%) |
| 18 to 34 Years | 25 (1.5%) | 0 (0.0%) |
| 35 to 64 Years | 77 (3.0%) | 132 (4.8%) |
| 65 to 74 Years | 126 (21.8%) | 42 (4.1%) |
| 75 Years and over | 131 (33.9%) | 181 (18.5%) |
Technology Access in Sharonville
Computing Device Access in Sharonville
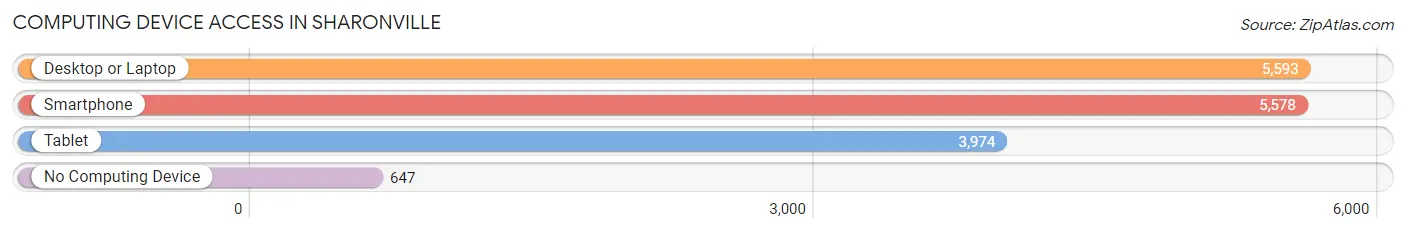
| Device Type | # Households | % Households |
| Desktop or Laptop | 5,593 | 82.9% |
| Smartphone | 5,578 | 82.6% |
| Tablet | 3,974 | 58.9% |
| No Computing Device | 647 | 9.6% |
| Total | 6,750 | 100.0% |
Internet Access in Sharonville
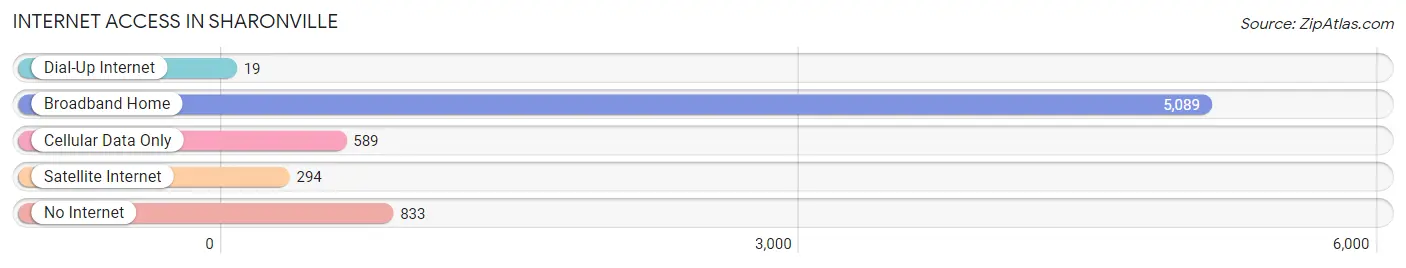
| Internet Type | # Households | % Households |
| Dial-Up Internet | 19 | 0.3% |
| Broadband Home | 5,089 | 75.4% |
| Cellular Data Only | 589 | 8.7% |
| Satellite Internet | 294 | 4.4% |
| No Internet | 833 | 12.3% |
| Total | 6,750 | 100.0% |
Sharonville Summary
Sharonville, Ohio is a city located in Hamilton and Butler counties in the southwestern part of the state. It is a suburb of Cincinnati and is part of the Cincinnati metropolitan area. The city has a population of 13,560 as of the 2010 census.
History
Sharonville was founded in 1817 by a group of settlers from Sharon, Connecticut. The settlers named the town after their hometown. The town was incorporated in 1841 and was originally part of Symmes Township. In 1853, Sharonville was divided into two townships, Symmes and Sharon. In 1911, the two townships were merged to form the city of Sharonville.
Geography
Sharonville is located at 39°17'25"N 84°25'17"W (39.290278, -84.421389). It is situated in the southwestern part of Ohio, about 15 miles north of Cincinnati. The city has a total area of 5.2 square miles, all of which is land.
Economy
Sharonville is home to a variety of businesses and industries. The city is home to several corporate headquarters, including the headquarters of the Kroger Company, the largest grocery store chain in the United States. Other major employers in the city include the Cincinnati/Northern Kentucky International Airport, the Cincinnati Zoo and Botanical Garden, and the University of Cincinnati.
Demographics
As of the 2010 census, there were 13,560 people, 5,845 households, and 3,541 families residing in the city. The population density was 2,611.2 people per square mile. The racial makeup of the city was 81.2% White, 11.2% African American, 0.3% Native American, 2.7% Asian, 0.1% Pacific Islander, 1.7% from other races, and 2.8% from two or more races. Hispanic or Latino of any race were 4.2% of the population.
The median income for a household in the city was $50,945, and the median income for a family was $62,917. The per capita income for the city was $25,945. About 5.2% of families and 7.2% of the population were below the poverty line, including 9.2% of those under age 18 and 5.2% of those age 65 or over.
Sharonville is a diverse city with a variety of cultures and backgrounds. The city is home to a large number of immigrants from India, China, and other countries. The city also has a large population of African Americans, Hispanics, and other minority groups.
Common Questions
What is Per Capita Income in Sharonville?
Per Capita income in Sharonville is $48,609.
What is the Median Family Income in Sharonville?
Median Family Income in Sharonville is $79,310.
What is the Median Household income in Sharonville?
Median Household Income in Sharonville is $71,544.
What is Income or Wage Gap in Sharonville?
Income or Wage Gap in Sharonville is 27.7%.
Women in Sharonville earn 72.3 cents for every dollar earned by a man.
What is Inequality or Gini Index in Sharonville?
Inequality or Gini Index in Sharonville is 0.48.
What is the Total Population of Sharonville?
Total Population of Sharonville is 14,023.
What is the Total Male Population of Sharonville?
Total Male Population of Sharonville is 6,960.
What is the Total Female Population of Sharonville?
Total Female Population of Sharonville is 7,063.
What is the Ratio of Males per 100 Females in Sharonville?
There are 98.54 Males per 100 Females in Sharonville.
What is the Ratio of Females per 100 Males in Sharonville?
There are 101.48 Females per 100 Males in Sharonville.
What is the Median Population Age in Sharonville?
Median Population Age in Sharonville is 45.4 Years.
What is the Average Family Size in Sharonville
Average Family Size in Sharonville is 2.9 People.
What is the Average Household Size in Sharonville
Average Household Size in Sharonville is 2.0 People.
How Large is the Labor Force in Sharonville?
There are 7,533 People in the Labor Forcein in Sharonville.
What is the Percentage of People in the Labor Force in Sharonville?
63.1% of People are in the Labor Force in Sharonville.
What is the Unemployment Rate in Sharonville?
Unemployment Rate in Sharonville is 1.7%.