Zip Codes with the Highest Percentage of Population Employed in Computer & Mathematics in Dayton, OH

RELATED REPORTS & OPTIONS

Computer & Mathematics
Population
Families and Households
Female Fertility
Female Fertility (Unmarried)
Race (Community Size)
Race (Percentage)
Ancestry (Community Size)
AfricanAlbanianAlsatianAmericanApacheArabArgentineanArmenianAustralianAustrianBasqueBelgianBhutaneseBlackfeetBolivianBrazilianBritishBulgarianBurmeseCajunCanadianCape VerdeanCelticCentral AmericanCentral American IndianCherokeeChileanChippewaChoctawColombianCosta RicanCreekCroatianCubanCzechCzechoslovakianDanishDominicanDutchEastern EuropeanEcuadorianEgyptianEnglishEstonianEthiopianEuropeanFilipinoFinnishFrenchFrench CanadianGermanGhanaianGreekGuamanian / ChamorroGuatemalanHaitianHonduranHungarianIcelanderIndian (Asian)InupiatIranianIraqiIrishIroquoisItalianJamaicanJapaneseKenyanKoreanLaotianLatvianLebaneseLiberianLithuanianLuxembourgerMacedonianMalteseMexicanMexican American IndianMoroccanNative HawaiianNavajoNicaraguanNigerianNorthern EuropeanNorwegianOkinawanPakistaniPalestinianPanamanianPennsylvania GermanPeruvianPolishPortuguesePotawatomiPuerto RicanRomanianRussianSalvadoranSamoanScandinavianScotch-IrishScottishSeminoleSenegaleseSerbianSiouxSlavicSlovakSloveneSouth AfricanSouth AmericanSpaniardSpanishSri LankanSubsaharan AfricanSudaneseSwedishSwissSyrianThaiTrinidadian and TobagonianTurkishUkrainianVenezuelanWelshWest IndianYugoslavian
Ancestry (Percentage)
AfricanAlbanianAlsatianAmericanApacheArabArgentineanArmenianAustralianAustrianBasqueBelgianBhutaneseBlackfeetBolivianBrazilianBritishBulgarianBurmeseCajunCanadianCape VerdeanCelticCentral AmericanCentral American IndianCherokeeChileanChippewaChoctawColombianCosta RicanCreekCroatianCubanCzechCzechoslovakianDanishDominicanDutchEastern EuropeanEcuadorianEgyptianEnglishEstonianEthiopianEuropeanFilipinoFinnishFrenchFrench CanadianGermanGhanaianGreekGuamanian / ChamorroGuatemalanHaitianHonduranHungarianIcelanderIndian (Asian)InupiatIranianIraqiIrishIroquoisItalianJamaicanJapaneseKenyanKoreanLaotianLatvianLebaneseLiberianLithuanianLuxembourgerMacedonianMalteseMexicanMexican American IndianMoroccanNative HawaiianNavajoNicaraguanNigerianNorthern EuropeanNorwegianOkinawanPakistaniPalestinianPanamanianPennsylvania GermanPeruvianPolishPortuguesePotawatomiPuerto RicanRomanianRussianSalvadoranSamoanScandinavianScotch-IrishScottishSeminoleSenegaleseSerbianSiouxSlavicSlovakSloveneSouth AfricanSouth AmericanSpaniardSpanishSri LankanSubsaharan AfricanSudaneseSwedishSwissSyrianThaiTrinidadian and TobagonianTurkishUkrainianVenezuelanWelshWest IndianYugoslavian
Immigrant Origin (Total)
AfricaArgentinaAsiaAustraliaBelarusBosnia and HerzegovinaBrazilBulgariaCambodiaCameroonCanadaCaribbeanCentral AmericaChinaColombiaCongoCosta RicaCubaDominican RepublicEastern AfricaEastern AsiaEastern EuropeEcuadorEgyptEl SalvadorEnglandEthiopiaEuropeFranceGermanyGhanaGreeceGuatemalaGuyanaHaitiHondurasHong KongHungaryIndiaIndonesiaIranIraqIrelandIsraelItalyJamaicaJapanJordanKenyaKoreaKuwaitLatin AmericaLebanonLiberiaMalaysiaMexicoMiddle AfricaMoldovaMoroccoNetherlandsNigeriaNorthern AfricaNorthern EuropeNorwayOceaniaPakistanPanamaPeruPhilippinesPolandPortugalRomaniaRussiaSaudi ArabiaScotlandSenegalSingaporeSouth AfricaSouth AmericaSouth Central AsiaSouth Eastern AsiaSouthern EuropeSpainSudanTaiwanThailandTrinidad and TobagoTurkeyUkraineUzbekistanVenezuelaVietnamWestern AfricaWestern AsiaWestern EuropeZaire
Immigrant Origin (Percentage)
AfricaArgentinaAsiaAustraliaBelarusBosnia and HerzegovinaBrazilBulgariaCambodiaCameroonCanadaCaribbeanCentral AmericaChinaColombiaCongoCosta RicaCubaDominican RepublicEastern AfricaEastern AsiaEastern EuropeEcuadorEgyptEl SalvadorEnglandEthiopiaEuropeFranceGermanyGhanaGreeceGuatemalaGuyanaHaitiHondurasHong KongHungaryIndiaIndonesiaIranIraqIrelandIsraelItalyJamaicaJapanJordanKenyaKoreaKuwaitLatin AmericaLebanonLiberiaMalaysiaMexicoMiddle AfricaMoldovaMoroccoNetherlandsNigeriaNorthern AfricaNorthern EuropeNorwayOceaniaPakistanPanamaPeruPhilippinesPolandPortugalRomaniaRussiaSaudi ArabiaScotlandSenegalSingaporeSouth AfricaSouth AmericaSouth Central AsiaSouth Eastern AsiaSouthern EuropeSpainSudanTaiwanThailandTrinidad and TobagoTurkeyUkraineUzbekistanVenezuelaVietnamWestern AfricaWestern AsiaWestern EuropeZaire
Income
Income (Families)
Income (Households)
Poverty
Poverty (Families)
Unemployment
Employment Occupations
Employment Industries
Employer Class
Commute Time
Commute Means
School Enrollment
Education by Degree Field
Occupancy
Finances
Physical Characteristics
Dayton
Compare Zip Codes
Comparison Subject

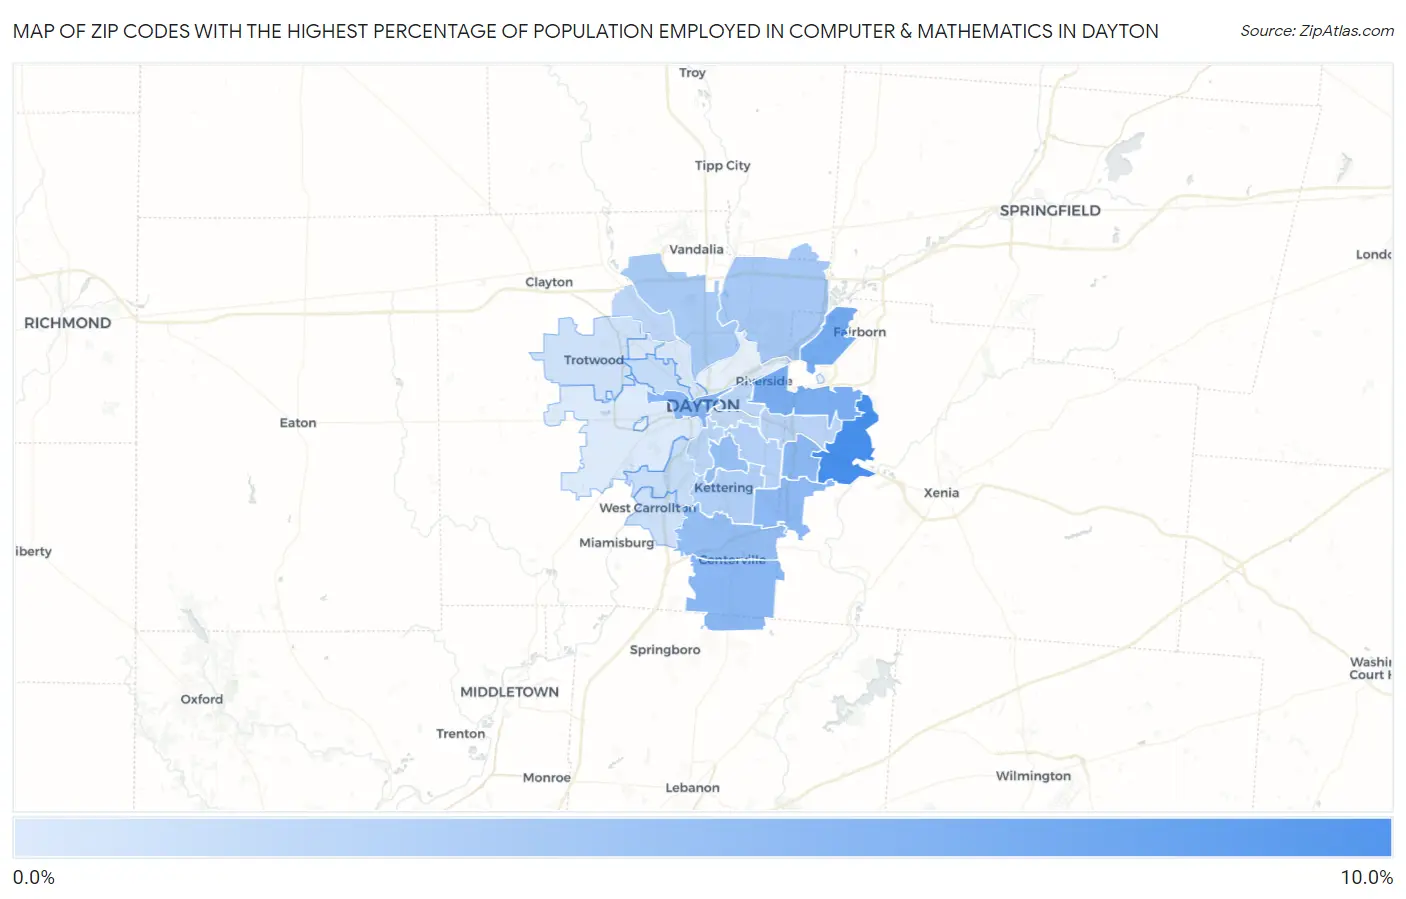
Map of Zip Codes with the Highest Percentage of Population Employed in Computer & Mathematics in Dayton

0.0%
10.0%
Zip Codes with the Highest Percentage of Population Employed in Computer & Mathematics in Dayton Map

Zip Codes with the Highest Percentage of Population Employed in Computer & Mathematics in Dayton, OH

Zip Code % Employed vs State vs National
1.454349.7%3.0%(+6.71)#113.5%(+6.22)#748
2.454337.0%3.0%(+3.95)#313.5%(+3.46)#1,630
3.454316.6%3.0%(+3.60)#423.5%(+3.11)#1,837
4.454585.7%3.0%(+2.67)#713.5%(+2.18)#2,585
5.454305.7%3.0%(+2.62)#733.5%(+2.13)#2,631
6.454025.6%3.0%(+2.57)#753.5%(+2.08)#2,675
7.454405.5%3.0%(+2.43)#853.5%(+1.94)#2,824
8.454595.1%3.0%(+2.11)#943.5%(+1.62)#3,183
9.454194.9%3.0%(+1.88)#1073.5%(+1.39)#3,482
10.454244.0%3.0%(+1.01)#1553.5%(+0.516)#4,946
11.454143.9%3.0%(+0.839)#1703.5%(+0.348)#5,307
12.454293.3%3.0%(+0.312)#2313.5%(-0.179)#6,640
13.454203.2%3.0%(+0.154)#2453.5%(-0.337)#7,135
14.454322.9%3.0%(-0.110)#2683.5%(-0.601)#8,025
15.454092.8%3.0%(-0.222)#2863.5%(-0.713)#8,406
16.454032.7%3.0%(-0.288)#2943.5%(-0.779)#8,645
17.454152.6%3.0%(-0.415)#3163.5%(-0.906)#9,147
18.454102.4%3.0%(-0.603)#3543.5%(-1.09)#9,919
19.454062.2%3.0%(-0.845)#3883.5%(-1.34)#10,940
20.454392.2%3.0%(-0.853)#3913.5%(-1.34)#10,985
21.454491.7%3.0%(-1.28)#4753.5%(-1.78)#12,977
22.454261.7%3.0%(-1.36)#4943.5%(-1.86)#13,423
23.454051.0%3.0%(-1.99)#6503.5%(-2.48)#17,096
24.454161.0%3.0%(-1.99)#6533.5%(-2.48)#17,123
25.454170.82%3.0%(-2.21)#7023.5%(-2.70)#18,514

Common Questions

What are the Top 10 Zip Codes with the Highest Percentage of Population Employed in Computer & Mathematics in Dayton, OH?
Top 10 Zip Codes with the Highest Percentage of Population Employed in Computer & Mathematics in Dayton, OH are:
#1
9.7%
#2
7.0%
#3
6.6%
#4
5.7%
#5
5.7%
#6
5.6%
#7
5.5%
#8
5.1%
#9
4.9%
#10
4.0%
What zip code has the Highest Percentage of Population Employed in Computer & Mathematics in Dayton, OH?
45434 has the Highest Percentage of Population Employed in Computer & Mathematics in Dayton, OH with 9.7%.
What is the Percentage of Population Employed in Computer & Mathematics in Dayton, OH?
Percentage of Population Employed in Computer & Mathematics in Dayton is 2.5%.
What is the Percentage of Population Employed in Computer & Mathematics in Ohio?
Percentage of Population Employed in Computer & Mathematics in Ohio is 3.0%.
What is the Percentage of Population Employed in Computer & Mathematics in the United States?
Percentage of Population Employed in Computer & Mathematics in the United States is 3.5%.