Silverton, OH Map & Demographics
Silverton Map
Silverton Overview
$40,794
PER CAPITA INCOME
$98,015
AVG FAMILY INCOME
$50,489
AVG HOUSEHOLD INCOME
20.4%
WAGE / INCOME GAP [ % ]
79.6¢/ $1
WAGE / INCOME GAP [ $ ]
0.52
INEQUALITY / GINI INDEX
4,883
TOTAL POPULATION
2,393
MALE POPULATION
2,490
FEMALE POPULATION
96.10
MALES / 100 FEMALES
104.05
FEMALES / 100 MALES
40.8
MEDIAN AGE
3.0
AVG FAMILY SIZE
2.0
AVG HOUSEHOLD SIZE
2,606
LABOR FORCE [ PEOPLE ]
62.1%
PERCENT IN LABOR FORCE
6.1%
UNEMPLOYMENT RATE
Silverton Area Codes
Income in Silverton
Income Overview in Silverton
Per Capita Income in Silverton is $40,794, while median incomes of families and households are $98,015 and $50,489 respectively.
| Characteristic | Number | Measure |
| Per Capita Income | 4,883 | $40,794 |
| Median Family Income | 1,031 | $98,015 |
| Mean Family Income | 1,031 | $101,960 |
| Median Household Income | 2,425 | $50,489 |
| Mean Household Income | 2,425 | $79,510 |
| Income Deficit | 1,031 | $0 |
| Wage / Income Gap (%) | 4,883 | 20.35% |
| Wage / Income Gap ($) | 4,883 | 79.65¢ per $1 |
| Gini / Inequality Index | 4,883 | 0.52 |
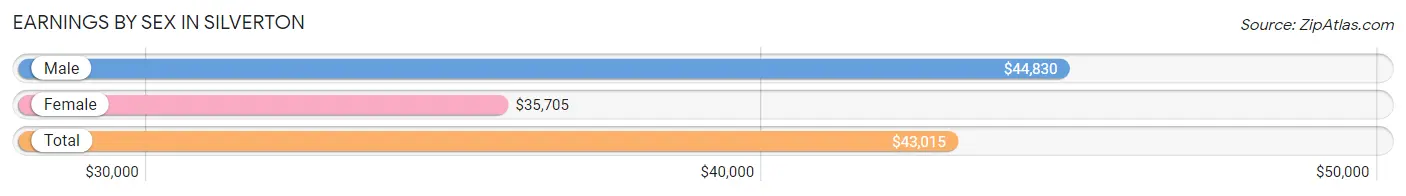
Earnings by Sex in Silverton
Average Earnings in Silverton are $43,015, $44,830 for men and $35,705 for women, a difference of 20.3%.
| Sex | Number | Average Earnings |
| Male | 1,217 (46.0%) | $44,830 |
| Female | 1,429 (54.0%) | $35,705 |
| Total | 2,646 (100.0%) | $43,015 |
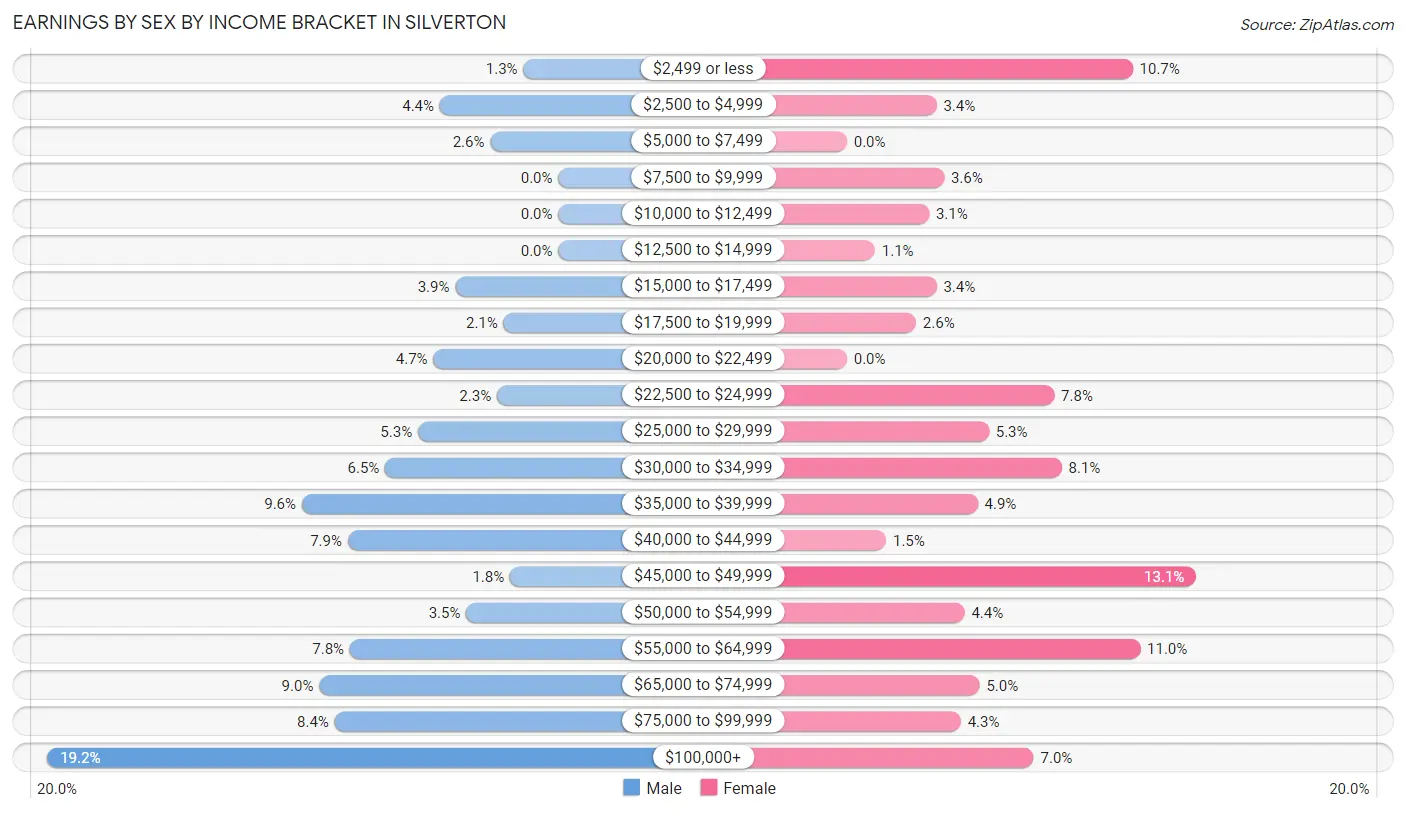
Earnings by Sex by Income Bracket in Silverton
The most common earnings brackets in Silverton are $100,000+ for men (233 | 19.2%) and $45,000 to $49,999 for women (187 | 13.1%).
| Income | Male | Female |
| $2,499 or less | 16 (1.3%) | 153 (10.7%) |
| $2,500 to $4,999 | 54 (4.4%) | 48 (3.4%) |
| $5,000 to $7,499 | 31 (2.5%) | 0 (0.0%) |
| $7,500 to $9,999 | 0 (0.0%) | 52 (3.6%) |
| $10,000 to $12,499 | 0 (0.0%) | 44 (3.1%) |
| $12,500 to $14,999 | 0 (0.0%) | 15 (1.1%) |
| $15,000 to $17,499 | 47 (3.9%) | 48 (3.4%) |
| $17,500 to $19,999 | 25 (2.1%) | 37 (2.6%) |
| $20,000 to $22,499 | 57 (4.7%) | 0 (0.0%) |
| $22,500 to $24,999 | 28 (2.3%) | 111 (7.8%) |
| $25,000 to $29,999 | 64 (5.3%) | 76 (5.3%) |
| $30,000 to $34,999 | 79 (6.5%) | 115 (8.1%) |
| $35,000 to $39,999 | 117 (9.6%) | 70 (4.9%) |
| $40,000 to $44,999 | 96 (7.9%) | 21 (1.5%) |
| $45,000 to $49,999 | 22 (1.8%) | 187 (13.1%) |
| $50,000 to $54,999 | 42 (3.5%) | 63 (4.4%) |
| $55,000 to $64,999 | 95 (7.8%) | 157 (11.0%) |
| $65,000 to $74,999 | 109 (9.0%) | 71 (5.0%) |
| $75,000 to $99,999 | 102 (8.4%) | 61 (4.3%) |
| $100,000+ | 233 (19.2%) | 100 (7.0%) |
| Total | 1,217 (100.0%) | 1,429 (100.0%) |
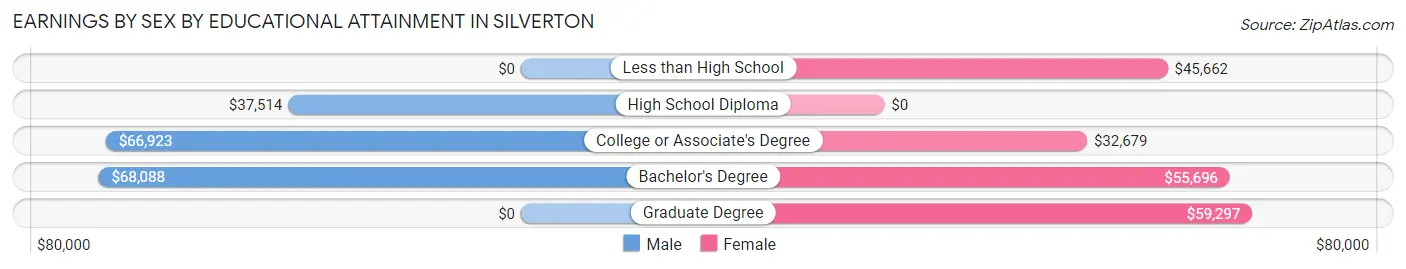
Earnings by Sex by Educational Attainment in Silverton
Average earnings in Silverton are $47,125 for men and $45,036 for women, a difference of 4.4%. Men with an educational attainment of bachelor's degree enjoy the highest average annual earnings of $68,088, while those with high school diploma education earn the least with $37,514. Women with an educational attainment of graduate degree earn the most with the average annual earnings of $59,297, while those with college or associate's degree education have the smallest earnings of $32,679.
| Educational Attainment | Male Income | Female Income |
| Less than High School | - | - |
| High School Diploma | $37,514 | $0 |
| College or Associate's Degree | $66,923 | $32,679 |
| Bachelor's Degree | $68,088 | $55,696 |
| Graduate Degree | - | - |
| Total | $47,125 | $45,036 |
Family Income in Silverton
Family Income Brackets in Silverton
According to the Silverton family income data, there are 348 families falling into the $100,000 to $149,999 income range, which is the most common income bracket and makes up 33.8% of all families.
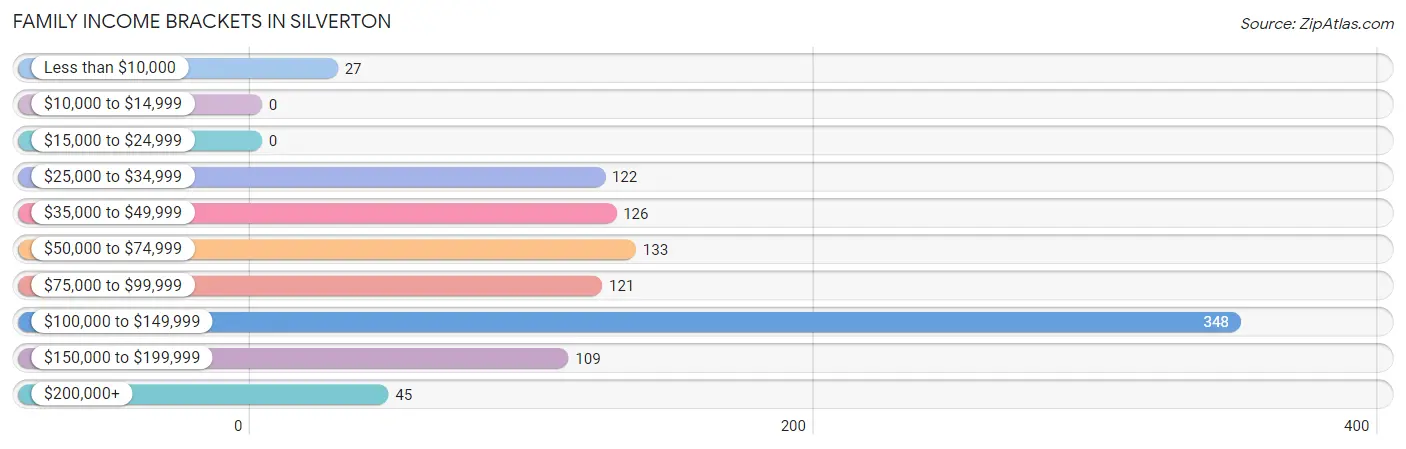
| Income Bracket | # Families | % Families |
| Less than $10,000 | 27 | 2.6% |
| $10,000 to $14,999 | 0 | 0.0% |
| $15,000 to $24,999 | 0 | 0.0% |
| $25,000 to $34,999 | 122 | 11.8% |
| $35,000 to $49,999 | 126 | 12.2% |
| $50,000 to $74,999 | 133 | 12.9% |
| $75,000 to $99,999 | 121 | 11.7% |
| $100,000 to $149,999 | 348 | 33.8% |
| $150,000 to $199,999 | 109 | 10.6% |
| $200,000+ | 45 | 4.4% |
Family Income by Famaliy Size in Silverton
3-person families (257 | 24.9%) account for the highest median family income in Silverton with $103,606 per family, while 2-person families (561 | 54.4%) have the highest median income of $40,542 per family member.
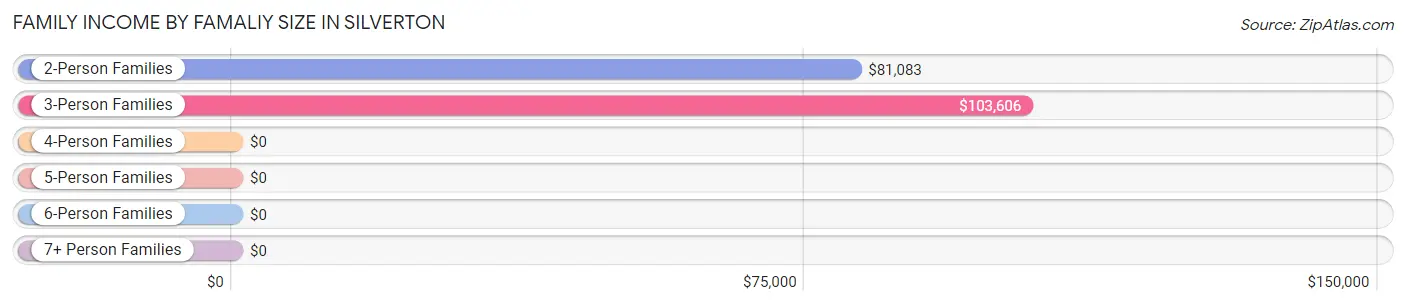
| Income Bracket | # Families | Median Income |
| 2-Person Families | 561 (54.4%) | $81,083 |
| 3-Person Families | 257 (24.9%) | $103,606 |
| 4-Person Families | 153 (14.8%) | $0 |
| 5-Person Families | 37 (3.6%) | $0 |
| 6-Person Families | 11 (1.1%) | $0 |
| 7+ Person Families | 12 (1.2%) | $0 |
| Total | 1,031 (100.0%) | $98,015 |
Family Income by Number of Earners in Silverton
The median family income in Silverton is $98,015, with families comprising 3+ earners (75) having the highest median family income of $127,583, while families with no earners (114) have the lowest median family income of $68,333, accounting for 7.3% and 11.1% of families, respectively.
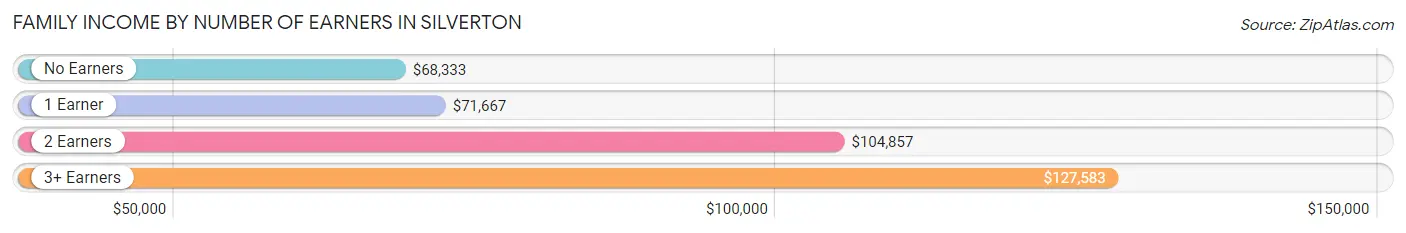
| Number of Earners | # Families | Median Income |
| No Earners | 114 (11.1%) | $68,333 |
| 1 Earner | 236 (22.9%) | $71,667 |
| 2 Earners | 606 (58.8%) | $104,857 |
| 3+ Earners | 75 (7.3%) | $127,583 |
| Total | 1,031 (100.0%) | $98,015 |
Household Income in Silverton
Household Income Brackets in Silverton
With 451 households falling in the category, the $100,000 to $149,999 income range is the most frequent in Silverton, accounting for 18.6% of all households. In contrast, only 68 households (2.8%) fall into the $200,000+ income bracket, making it the least populous group.
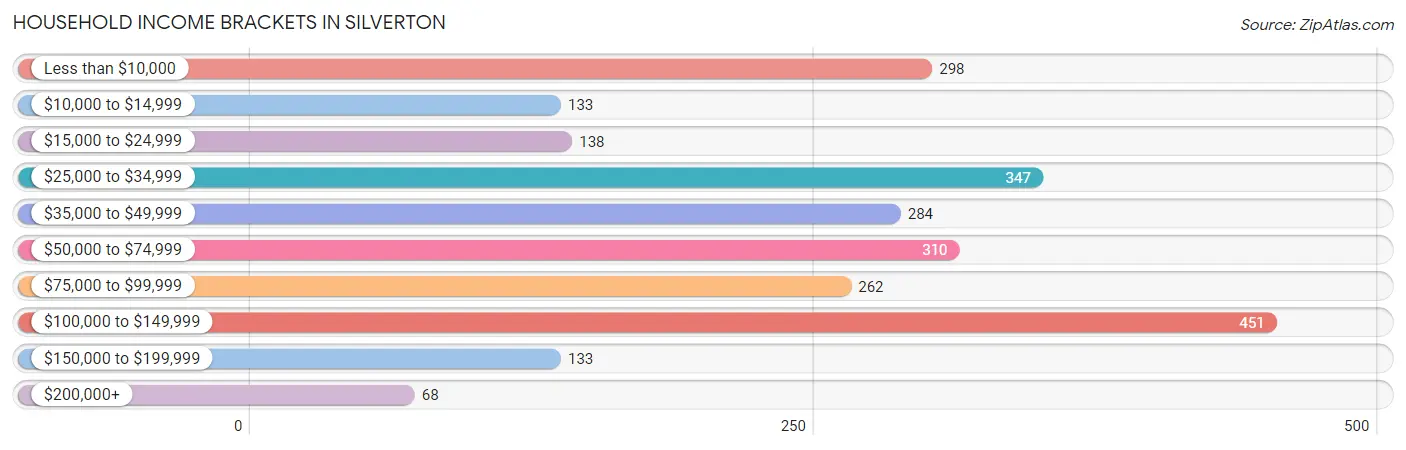
| Income Bracket | # Households | % Households |
| Less than $10,000 | 298 | 12.3% |
| $10,000 to $14,999 | 133 | 5.5% |
| $15,000 to $24,999 | 138 | 5.7% |
| $25,000 to $34,999 | 347 | 14.3% |
| $35,000 to $49,999 | 284 | 11.7% |
| $50,000 to $74,999 | 310 | 12.8% |
| $75,000 to $99,999 | 262 | 10.8% |
| $100,000 to $149,999 | 451 | 18.6% |
| $150,000 to $199,999 | 133 | 5.5% |
| $200,000+ | 68 | 2.8% |
Household Income by Householder Age in Silverton
The median household income in Silverton is $50,489, with the highest median household income of $65,735 found in the 25 to 44 years age bracket for the primary householder. A total of 892 households (36.8%) fall into this category. Meanwhile, the 15 to 24 years age bracket for the primary householder has the lowest median household income of $0, with 81 households (3.3%) in this group.
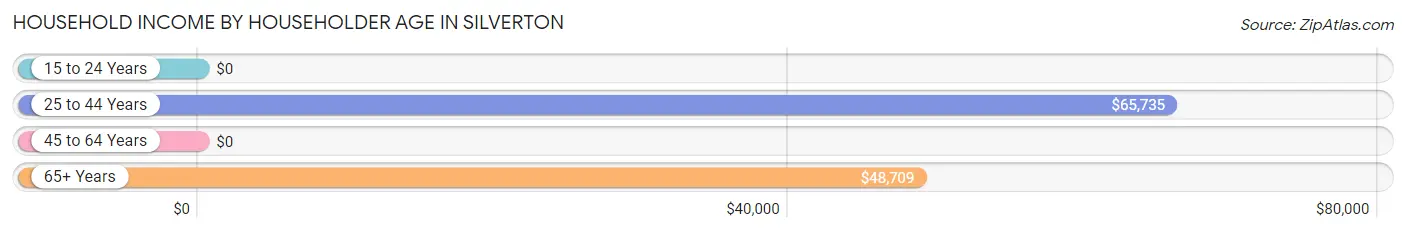
| Income Bracket | # Households | Median Income |
| 15 to 24 Years | 81 (3.3%) | $0 |
| 25 to 44 Years | 892 (36.8%) | $65,735 |
| 45 to 64 Years | 663 (27.3%) | $0 |
| 65+ Years | 789 (32.5%) | $48,709 |
| Total | 2,425 (100.0%) | $50,489 |
Poverty in Silverton
Income Below Poverty by Sex and Age in Silverton
With 14.3% poverty level for males and 19.0% for females among the residents of Silverton, 16 and 17 year old males and 12 to 14 year old females are the most vulnerable to poverty, with 61 males (100.0%) and 63 females (100.0%) in their respective age groups living below the poverty level.
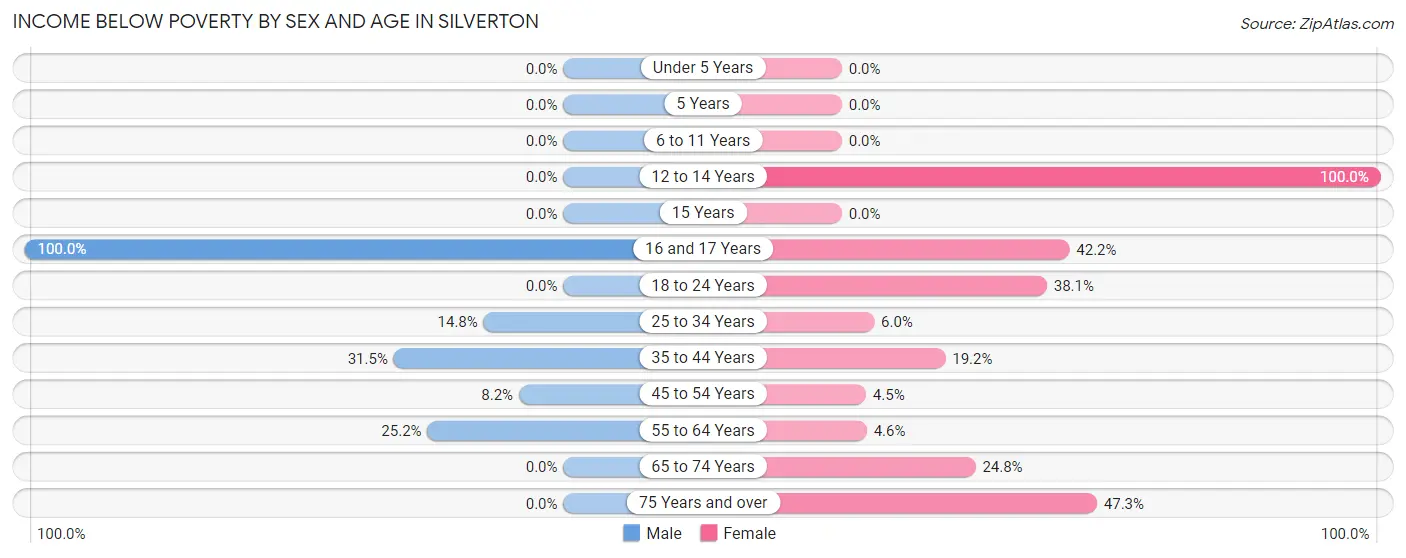
| Age Bracket | Male | Female |
| Under 5 Years | 0 (0.0%) | 0 (0.0%) |
| 5 Years | 0 (0.0%) | 0 (0.0%) |
| 6 to 11 Years | 0 (0.0%) | 0 (0.0%) |
| 12 to 14 Years | 0 (0.0%) | 63 (100.0%) |
| 15 Years | 0 (0.0%) | 0 (0.0%) |
| 16 and 17 Years | 61 (100.0%) | 49 (42.2%) |
| 18 to 24 Years | 0 (0.0%) | 43 (38.1%) |
| 25 to 34 Years | 78 (14.8%) | 24 (6.0%) |
| 35 to 44 Years | 96 (31.5%) | 63 (19.2%) |
| 45 to 54 Years | 14 (8.2%) | 11 (4.5%) |
| 55 to 64 Years | 84 (25.2%) | 21 (4.6%) |
| 65 to 74 Years | 0 (0.0%) | 97 (24.8%) |
| 75 Years and over | 0 (0.0%) | 98 (47.3%) |
| Total | 333 (14.3%) | 469 (19.0%) |
Income Above Poverty by Sex and Age in Silverton
According to the poverty statistics in Silverton, males aged under 5 years and females aged under 5 years are the age groups that are most secure financially, with 100.0% of males and 100.0% of females in these age groups living above the poverty line.
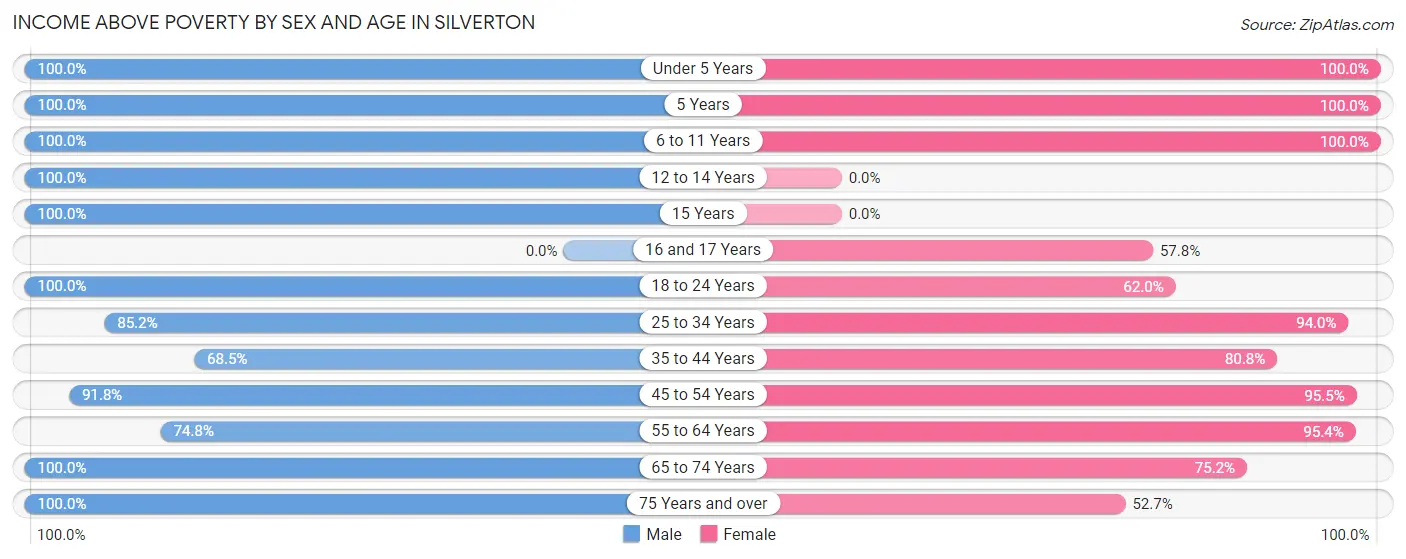
| Age Bracket | Male | Female |
| Under 5 Years | 202 (100.0%) | 61 (100.0%) |
| 5 Years | 18 (100.0%) | 19 (100.0%) |
| 6 to 11 Years | 57 (100.0%) | 67 (100.0%) |
| 12 to 14 Years | 141 (100.0%) | 0 (0.0%) |
| 15 Years | 58 (100.0%) | 0 (0.0%) |
| 16 and 17 Years | 0 (0.0%) | 67 (57.8%) |
| 18 to 24 Years | 28 (100.0%) | 70 (62.0%) |
| 25 to 34 Years | 449 (85.2%) | 377 (94.0%) |
| 35 to 44 Years | 209 (68.5%) | 265 (80.8%) |
| 45 to 54 Years | 156 (91.8%) | 235 (95.5%) |
| 55 to 64 Years | 249 (74.8%) | 433 (95.4%) |
| 65 to 74 Years | 274 (100.0%) | 294 (75.2%) |
| 75 Years and over | 151 (100.0%) | 109 (52.7%) |
| Total | 1,992 (85.7%) | 1,997 (81.0%) |
Income Below Poverty Among Married-Couple Families in Silverton
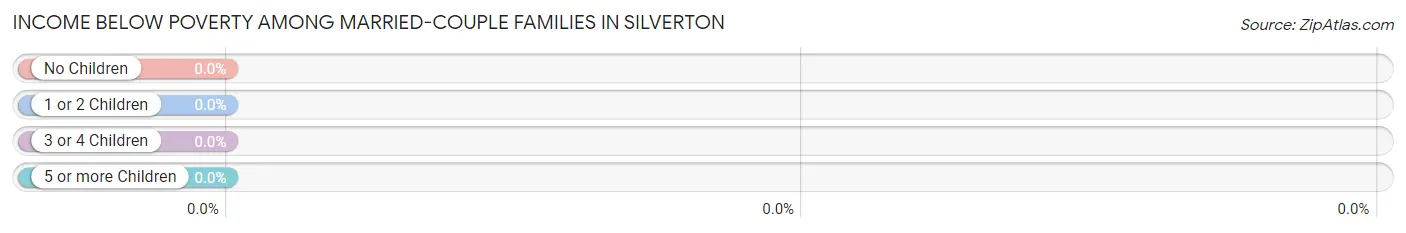
| Children | Above Poverty | Below Poverty |
| No Children | 528 (100.0%) | 0 (0.0%) |
| 1 or 2 Children | 218 (100.0%) | 0 (0.0%) |
| 3 or 4 Children | 21 (100.0%) | 0 (0.0%) |
| 5 or more Children | 0 (0.0%) | 0 (0.0%) |
| Total | 767 (100.0%) | 0 (0.0%) |
Income Below Poverty Among Single-Parent Households in Silverton
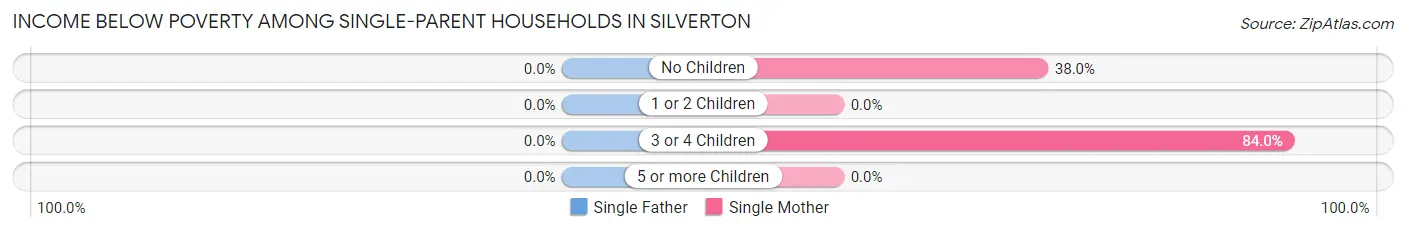
| Children | Single Father | Single Mother |
| No Children | 0 (0.0%) | 27 (38.0%) |
| 1 or 2 Children | 0 (0.0%) | 0 (0.0%) |
| 3 or 4 Children | 0 (0.0%) | 63 (84.0%) |
| 5 or more Children | 0 (0.0%) | 0 (0.0%) |
| Total | 0 (0.0%) | 90 (37.0%) |
Income Below Poverty Among Married-Couple vs Single-Parent Households in Silverton
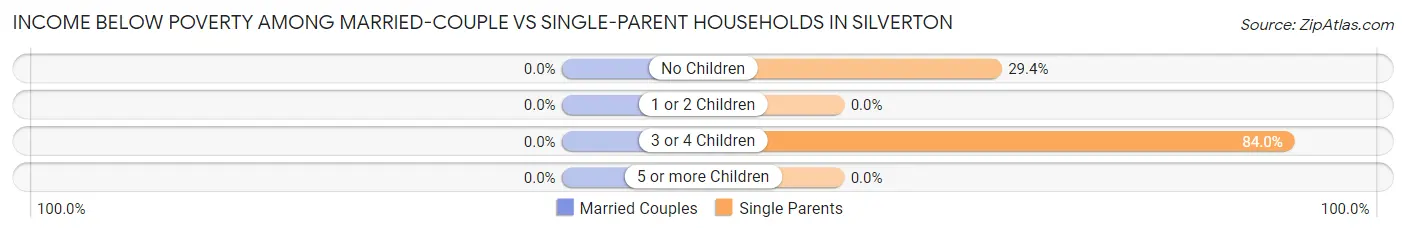
| Children | Married-Couple Families | Single-Parent Households |
| No Children | 0 (0.0%) | 27 (29.3%) |
| 1 or 2 Children | 0 (0.0%) | 0 (0.0%) |
| 3 or 4 Children | 0 (0.0%) | 63 (84.0%) |
| 5 or more Children | 0 (0.0%) | 0 (0.0%) |
| Total | 0 (0.0%) | 90 (34.1%) |
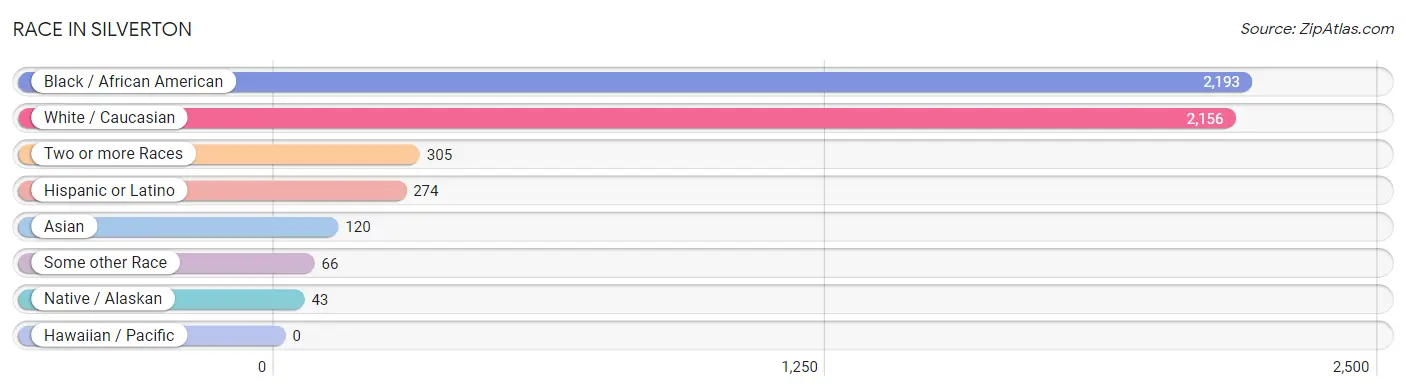
Race in Silverton
The most populous races in Silverton are Black / African American (2,193 | 44.9%), White / Caucasian (2,156 | 44.2%), and Two or more Races (305 | 6.2%).
| Race | # Population | % Population |
| Asian | 120 | 2.5% |
| Black / African American | 2,193 | 44.9% |
| Hawaiian / Pacific | 0 | 0.0% |
| Hispanic or Latino | 274 | 5.6% |
| Native / Alaskan | 43 | 0.9% |
| White / Caucasian | 2,156 | 44.2% |
| Two or more Races | 305 | 6.2% |
| Some other Race | 66 | 1.3% |
| Total | 4,883 | 100.0% |
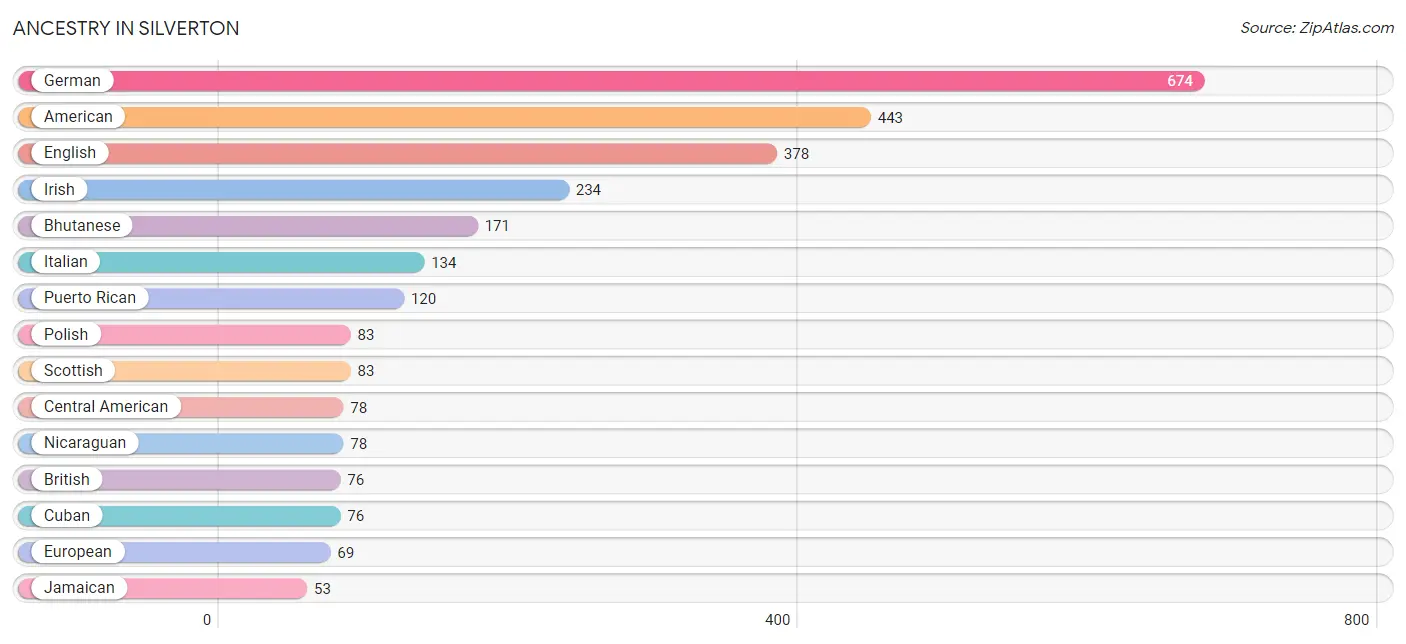
Ancestry in Silverton
The most populous ancestries reported in Silverton are German (674 | 13.8%), American (443 | 9.1%), English (378 | 7.7%), Irish (234 | 4.8%), and Bhutanese (171 | 3.5%), together accounting for 38.9% of all Silverton residents.
| Ancestry | # Population | % Population |
| African | 28 | 0.6% |
| Alsatian | 10 | 0.2% |
| American | 443 | 9.1% |
| Austrian | 29 | 0.6% |
| Bhutanese | 171 | 3.5% |
| British | 76 | 1.6% |
| Burmese | 25 | 0.5% |
| Central American | 78 | 1.6% |
| Cuban | 76 | 1.6% |
| English | 378 | 7.7% |
| European | 69 | 1.4% |
| French | 17 | 0.4% |
| German | 674 | 13.8% |
| Greek | 22 | 0.4% |
| Hungarian | 38 | 0.8% |
| Irish | 234 | 4.8% |
| Italian | 134 | 2.7% |
| Jamaican | 53 | 1.1% |
| Lithuanian | 22 | 0.4% |
| Nicaraguan | 78 | 1.6% |
| Norwegian | 21 | 0.4% |
| Polish | 83 | 1.7% |
| Puerto Rican | 120 | 2.5% |
| Scottish | 83 | 1.7% |
| Slovak | 22 | 0.4% |
| Slovene | 13 | 0.3% |
| Subsaharan African | 28 | 0.6% |
| Swiss | 17 | 0.4% |
| Welsh | 14 | 0.3% | View All 29 Rows |
Immigrants in Silverton
The most numerous immigrant groups reported in Silverton came from Latin America (155 | 3.2%), Central America (78 | 1.6%), Nicaragua (78 | 1.6%), Peru (46 | 0.9%), and South America (46 | 0.9%), together accounting for 8.3% of all Silverton residents.
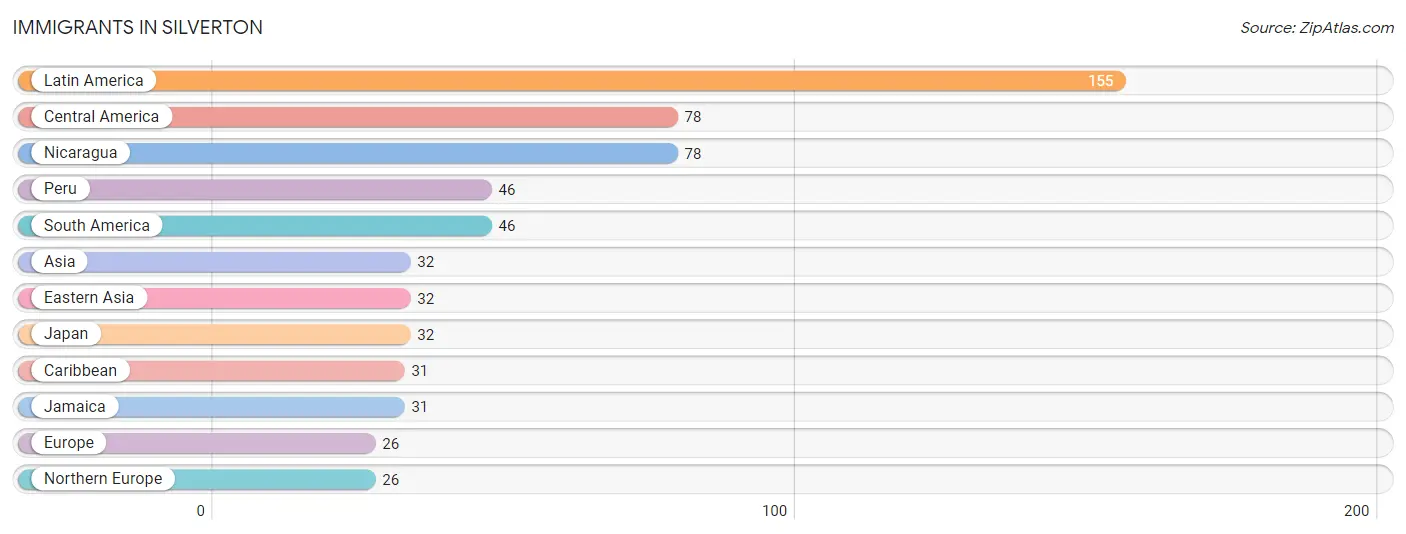
| Immigration Origin | # Population | % Population |
| Asia | 32 | 0.7% |
| Caribbean | 31 | 0.6% |
| Central America | 78 | 1.6% |
| Eastern Asia | 32 | 0.7% |
| Europe | 26 | 0.5% |
| Jamaica | 31 | 0.6% |
| Japan | 32 | 0.7% |
| Latin America | 155 | 3.2% |
| Nicaragua | 78 | 1.6% |
| Northern Europe | 26 | 0.5% |
| Peru | 46 | 0.9% |
| South America | 46 | 0.9% | View All 12 Rows |
Sex and Age in Silverton
Sex and Age in Silverton
The most populous age groups in Silverton are 30 to 34 Years (274 | 11.5%) for men and 60 to 64 Years (296 | 11.9%) for women.
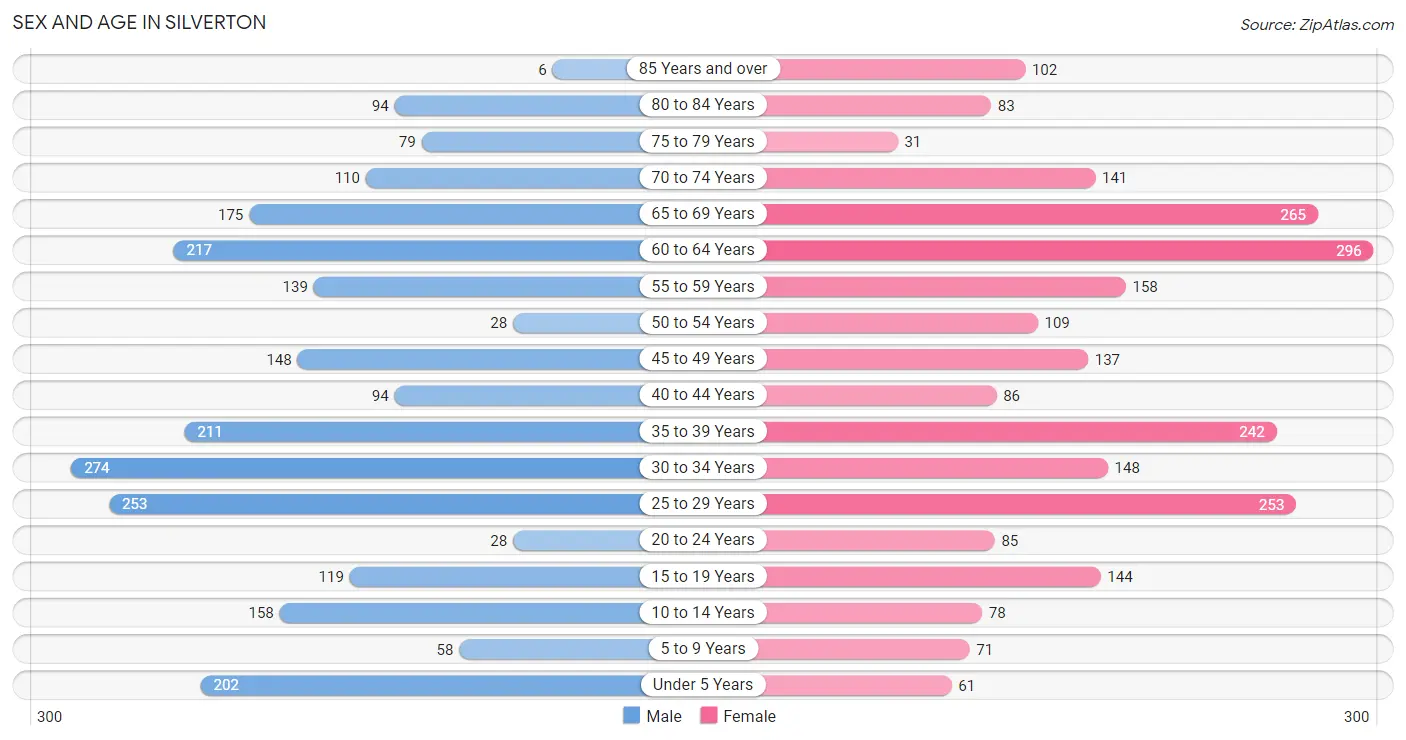
| Age Bracket | Male | Female |
| Under 5 Years | 202 (8.4%) | 61 (2.5%) |
| 5 to 9 Years | 58 (2.4%) | 71 (2.9%) |
| 10 to 14 Years | 158 (6.6%) | 78 (3.1%) |
| 15 to 19 Years | 119 (5.0%) | 144 (5.8%) |
| 20 to 24 Years | 28 (1.2%) | 85 (3.4%) |
| 25 to 29 Years | 253 (10.6%) | 253 (10.2%) |
| 30 to 34 Years | 274 (11.5%) | 148 (5.9%) |
| 35 to 39 Years | 211 (8.8%) | 242 (9.7%) |
| 40 to 44 Years | 94 (3.9%) | 86 (3.5%) |
| 45 to 49 Years | 148 (6.2%) | 137 (5.5%) |
| 50 to 54 Years | 28 (1.2%) | 109 (4.4%) |
| 55 to 59 Years | 139 (5.8%) | 158 (6.4%) |
| 60 to 64 Years | 217 (9.1%) | 296 (11.9%) |
| 65 to 69 Years | 175 (7.3%) | 265 (10.6%) |
| 70 to 74 Years | 110 (4.6%) | 141 (5.7%) |
| 75 to 79 Years | 79 (3.3%) | 31 (1.2%) |
| 80 to 84 Years | 94 (3.9%) | 83 (3.3%) |
| 85 Years and over | 6 (0.3%) | 102 (4.1%) |
| Total | 2,393 (100.0%) | 2,490 (100.0%) |
Families and Households in Silverton
Median Family Size in Silverton
The median family size in Silverton is 3.01 persons per family, with single male/father families (21 | 2.0%) accounting for the largest median family size of 5.33 persons per family. On the other hand, married-couple families (767 | 74.4%) represent the smallest median family size with 2.86 persons per family.
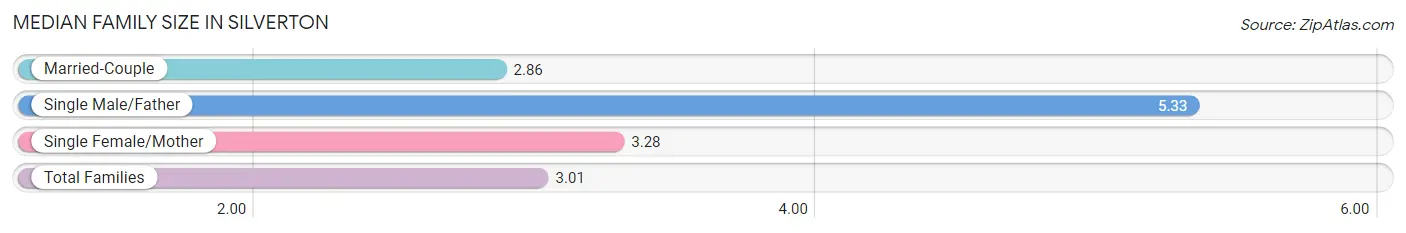
| Family Type | # Families | Family Size |
| Married-Couple | 767 (74.4%) | 2.86 |
| Single Male/Father | 21 (2.0%) | 5.33 |
| Single Female/Mother | 243 (23.6%) | 3.28 |
| Total Families | 1,031 (100.0%) | 3.01 |
Median Household Size in Silverton
The median household size in Silverton is 1.96 persons per household, with single male/father households (21 | 0.9%) accounting for the largest median household size of 5.33 persons per household. non-family households (1,394 | 57.5%) represent the smallest median household size with 1.17 persons per household.
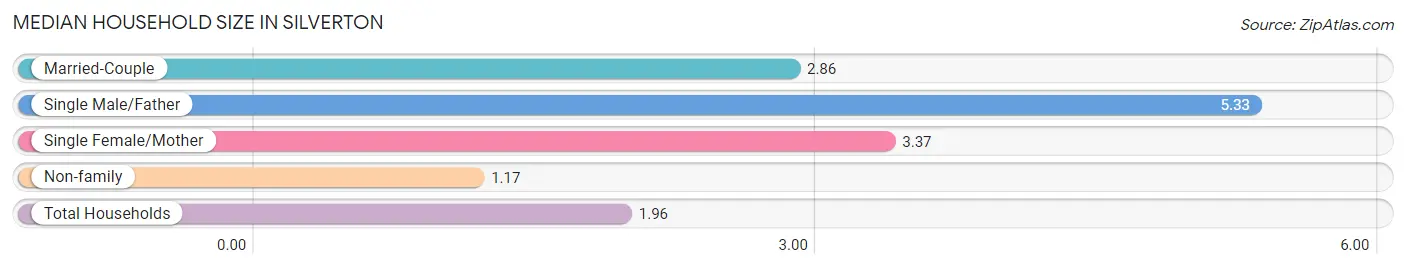
| Household Type | # Households | Household Size |
| Married-Couple | 767 (31.6%) | 2.86 |
| Single Male/Father | 21 (0.9%) | 5.33 |
| Single Female/Mother | 243 (10.0%) | 3.37 |
| Non-family | 1,394 (57.5%) | 1.17 |
| Total Households | 2,425 (100.0%) | 1.96 |
Household Size by Marriage Status in Silverton
Out of a total of 2,425 households in Silverton, 1,031 (42.5%) are family households, while 1,394 (57.5%) are nonfamily households. The most numerous type of family households are 2-person households, comprising 541, and the most common type of nonfamily households are 1-person households, comprising 1,179.
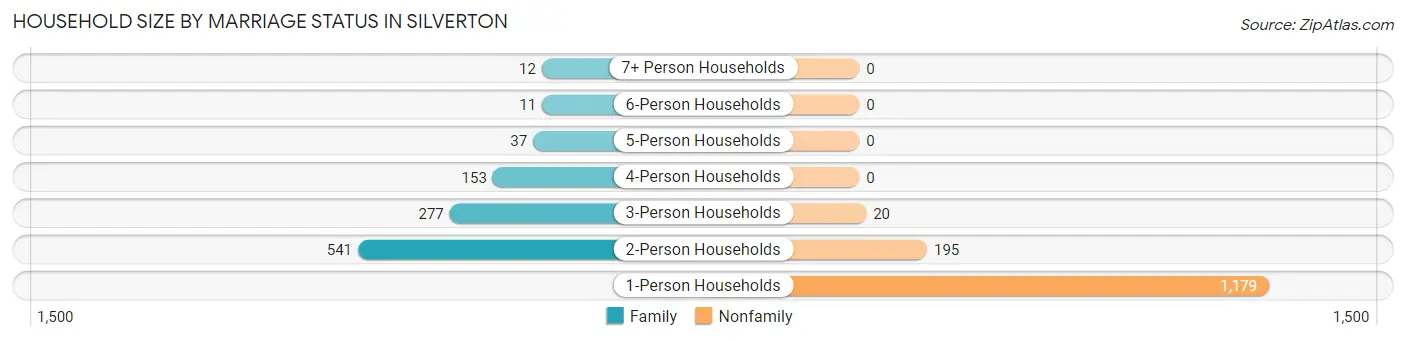
| Household Size | Family Households | Nonfamily Households |
| 1-Person Households | - | 1,179 (48.6%) |
| 2-Person Households | 541 (22.3%) | 195 (8.0%) |
| 3-Person Households | 277 (11.4%) | 20 (0.8%) |
| 4-Person Households | 153 (6.3%) | 0 (0.0%) |
| 5-Person Households | 37 (1.5%) | 0 (0.0%) |
| 6-Person Households | 11 (0.4%) | 0 (0.0%) |
| 7+ Person Households | 12 (0.5%) | 0 (0.0%) |
| Total | 1,031 (42.5%) | 1,394 (57.5%) |
Female Fertility in Silverton
Fertility by Age in Silverton
Average fertility rate in Silverton is 82.0 births per 1,000 women. Women in the age bracket of 20 to 34 years have the highest fertility rate with 150.0 births per 1,000 women. Women in the age bracket of 20 to 34 years acount for 81.1% of all women with births.
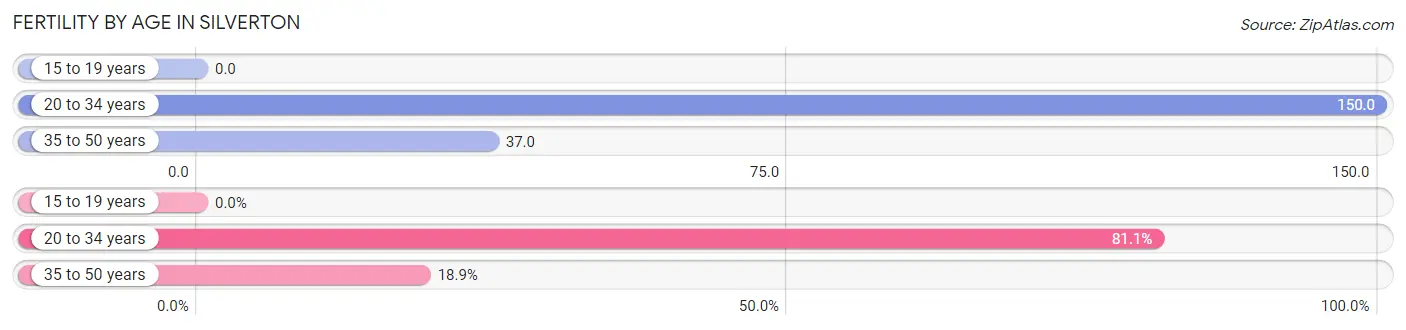
| Age Bracket | Women with Births | Births / 1,000 Women |
| 15 to 19 years | 0 (0.0%) | 0.0 |
| 20 to 34 years | 73 (81.1%) | 150.0 |
| 35 to 50 years | 17 (18.9%) | 37.0 |
| Total | 90 (100.0%) | 82.0 |
Fertility by Age by Marriage Status in Silverton
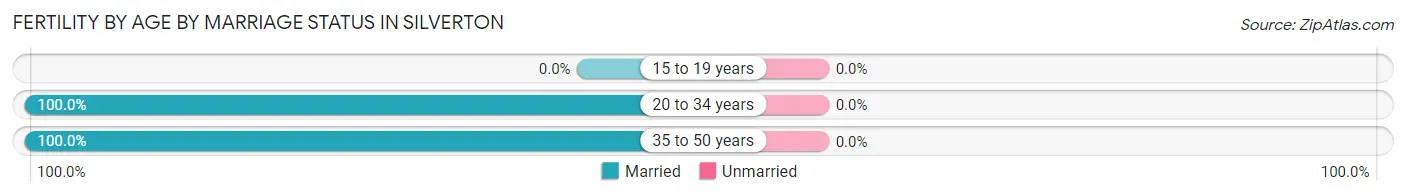
| Age Bracket | Married | Unmarried |
| 15 to 19 years | 0 (0.0%) | 0 (0.0%) |
| 20 to 34 years | 73 (100.0%) | 0 (0.0%) |
| 35 to 50 years | 17 (100.0%) | 0 (0.0%) |
| Total | 90 (100.0%) | 0 (0.0%) |
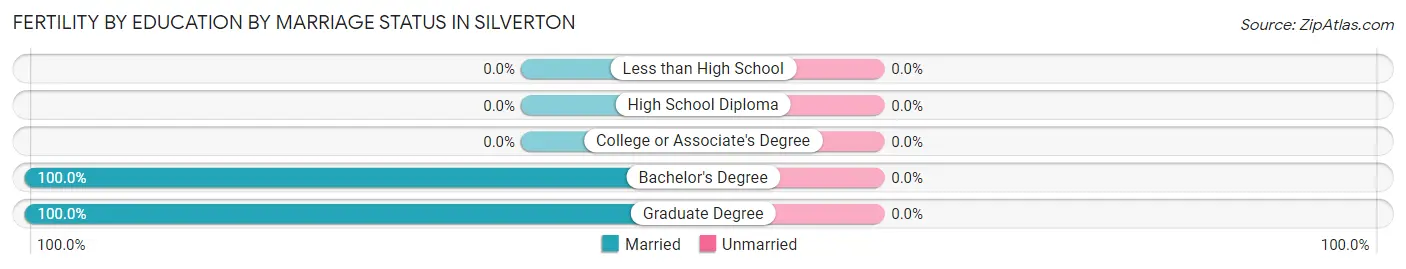
Fertility by Education in Silverton
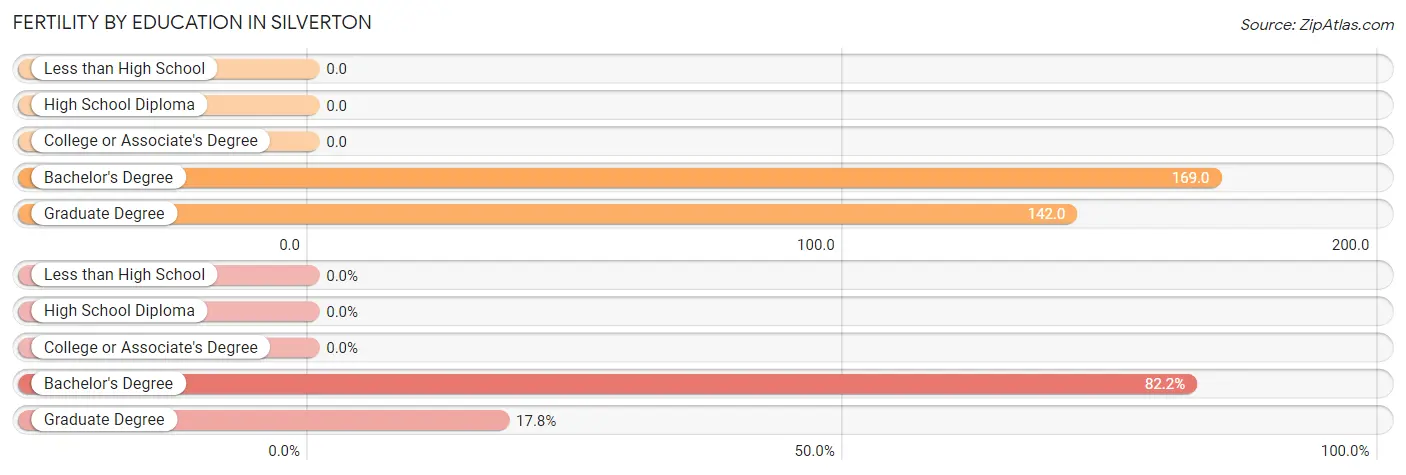
| Educational Attainment | Women with Births | Births / 1,000 Women |
| Less than High School | 0 (0.0%) | 0.0 |
| High School Diploma | 0 (0.0%) | 0.0 |
| College or Associate's Degree | 0 (0.0%) | 0.0 |
| Bachelor's Degree | 74 (82.2%) | 169.0 |
| Graduate Degree | 16 (17.8%) | 142.0 |
| Total | 90 (100.0%) | 82.0 |
Fertility by Education by Marriage Status in Silverton
| Educational Attainment | Married | Unmarried |
| Less than High School | 0 (0.0%) | 0 (0.0%) |
| High School Diploma | 0 (0.0%) | 0 (0.0%) |
| College or Associate's Degree | 0 (0.0%) | 0 (0.0%) |
| Bachelor's Degree | 74 (100.0%) | 0 (0.0%) |
| Graduate Degree | 16 (100.0%) | 0 (0.0%) |
| Total | 90 (100.0%) | 0 (0.0%) |
Employment Characteristics in Silverton
Employment by Class of Employer in Silverton
Among the 2,344 employed individuals in Silverton, private company employees (1,319 | 56.3%), not-for-profit organizations (448 | 19.1%), and local government employees (278 | 11.9%) make up the most common classes of employment.
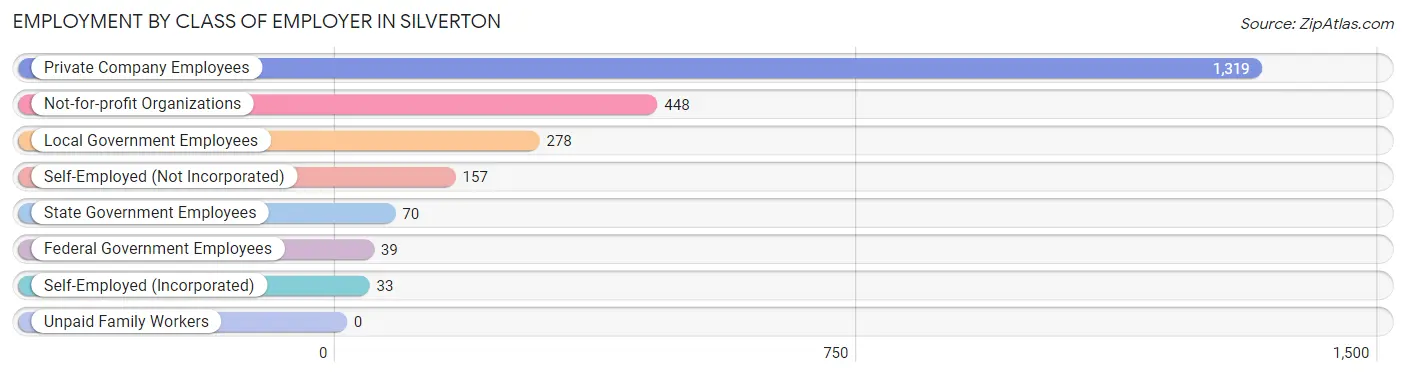
| Employer Class | # Employees | % Employees |
| Private Company Employees | 1,319 | 56.3% |
| Self-Employed (Incorporated) | 33 | 1.4% |
| Self-Employed (Not Incorporated) | 157 | 6.7% |
| Not-for-profit Organizations | 448 | 19.1% |
| Local Government Employees | 278 | 11.9% |
| State Government Employees | 70 | 3.0% |
| Federal Government Employees | 39 | 1.7% |
| Unpaid Family Workers | 0 | 0.0% |
| Total | 2,344 | 100.0% |
Employment Status by Age in Silverton
According to the labor force statistics for Silverton, out of the total population over 16 years of age (4,197), 62.1% or 2,606 individuals are in the labor force, with 6.1% or 159 of them unemployed. The age group with the highest labor force participation rate is 20 to 24 years, with 100.0% or 113 individuals in the labor force. Within the labor force, the 16 to 19 years age range has the highest percentage of unemployed individuals, with 55.5% or 61 of them being unemployed.
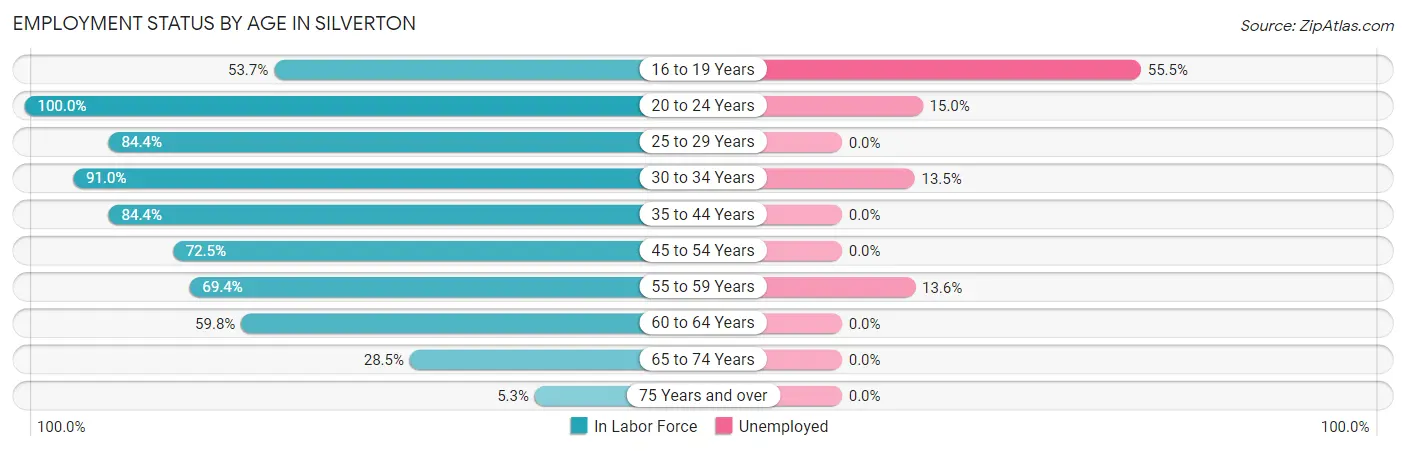
| Age Bracket | In Labor Force | Unemployed |
| 16 to 19 Years | 110 (53.7%) | 61 (55.5%) |
| 20 to 24 Years | 113 (100.0%) | 17 (15.0%) |
| 25 to 29 Years | 427 (84.4%) | 0 (0.0%) |
| 30 to 34 Years | 384 (91.0%) | 52 (13.5%) |
| 35 to 44 Years | 534 (84.4%) | 0 (0.0%) |
| 45 to 54 Years | 306 (72.5%) | 0 (0.0%) |
| 55 to 59 Years | 206 (69.4%) | 28 (13.6%) |
| 60 to 64 Years | 307 (59.8%) | 0 (0.0%) |
| 65 to 74 Years | 197 (28.5%) | 0 (0.0%) |
| 75 Years and over | 21 (5.3%) | 0 (0.0%) |
| Total | 2,606 (62.1%) | 159 (6.1%) |
Employment Status by Educational Attainment in Silverton
According to labor force statistics for Silverton, 77.5% of individuals (2,165) out of the total population between 25 and 64 years of age (2,793) are in the labor force, with 3.7% or 80 of them being unemployed. The group with the highest labor force participation rate are those with the educational attainment of college / associate degree, with 94.3% or 904 individuals in the labor force. Within the labor force, individuals with high school diploma education have the highest percentage of unemployment, with 7.0% or 29 of them being unemployed.
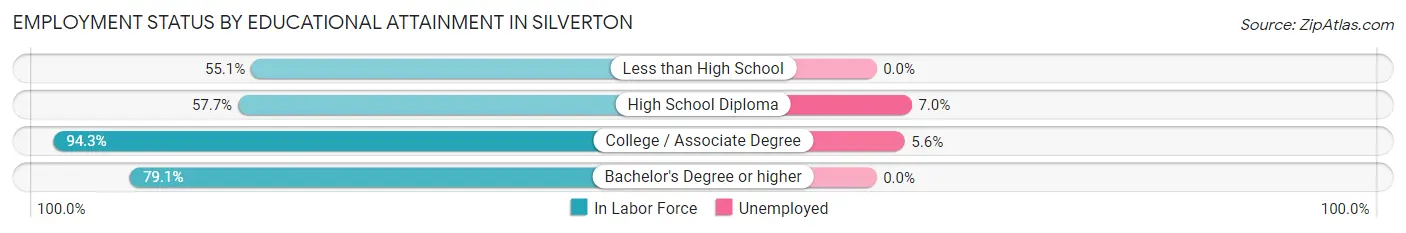
| Educational Attainment | In Labor Force | Unemployed |
| Less than High School | 86 (55.1%) | 0 (0.0%) |
| High School Diploma | 415 (57.7%) | 50 (7.0%) |
| College / Associate Degree | 904 (94.3%) | 54 (5.6%) |
| Bachelor's Degree or higher | 759 (79.1%) | 0 (0.0%) |
| Total | 2,165 (77.5%) | 103 (3.7%) |
Employment Occupations by Sex in Silverton
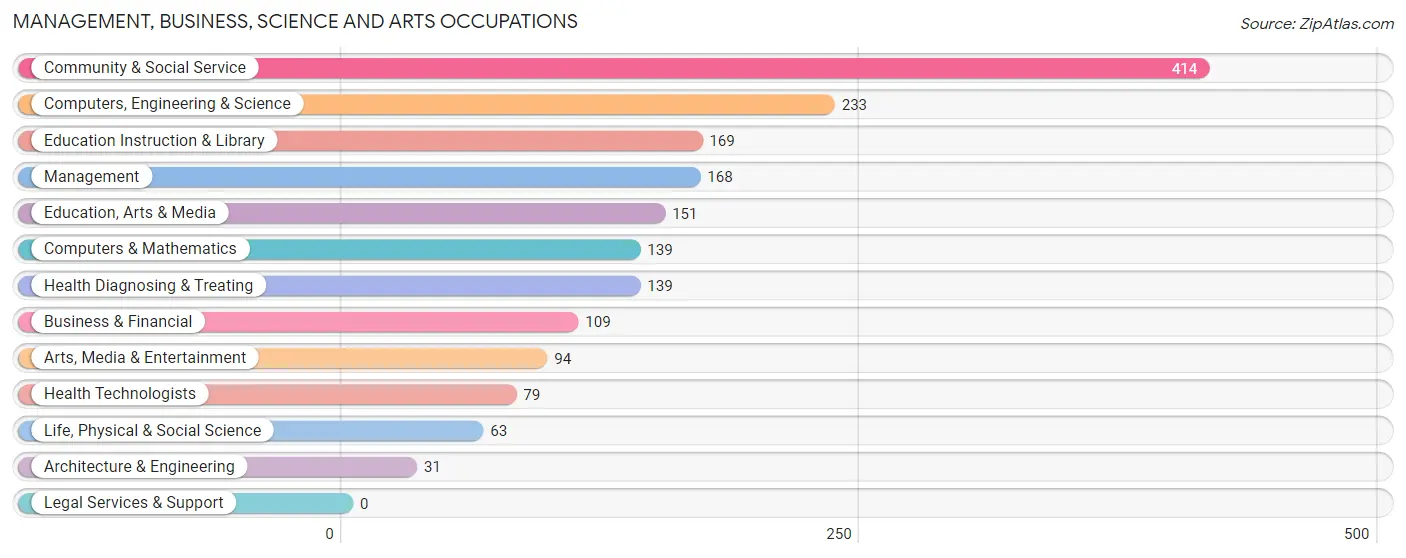
Management, Business, Science and Arts Occupations
The most common Management, Business, Science and Arts occupations in Silverton are Community & Social Service (414 | 16.9%), Computers, Engineering & Science (233 | 9.5%), Education Instruction & Library (169 | 6.9%), Management (168 | 6.9%), and Education, Arts & Media (151 | 6.2%).
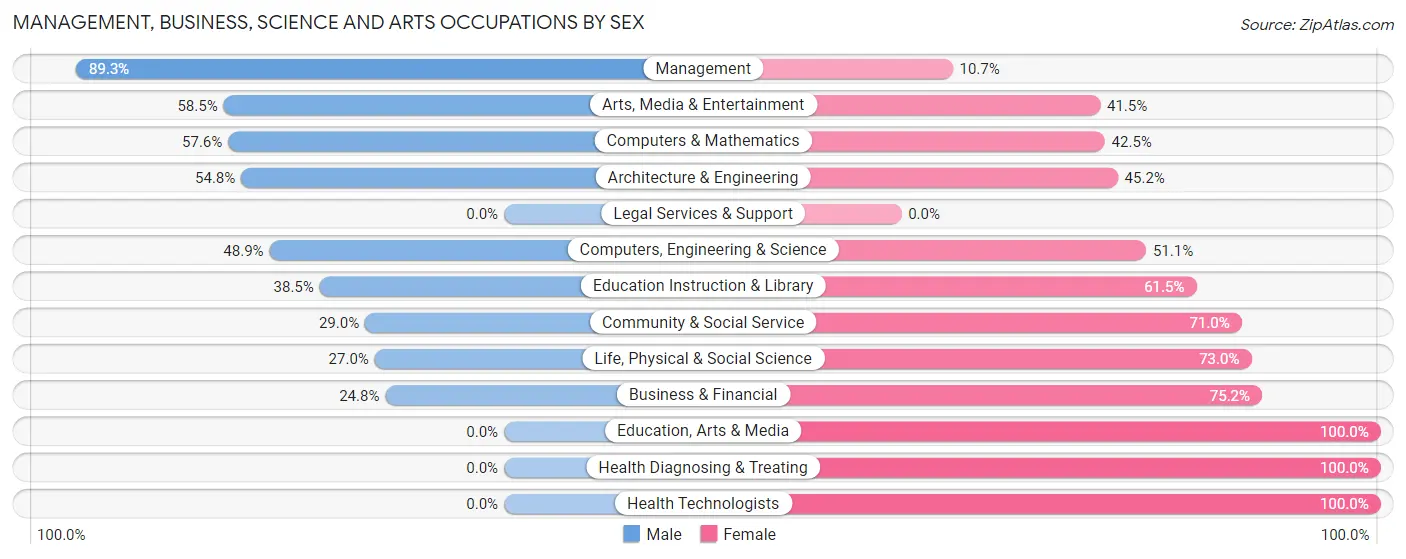
Management, Business, Science and Arts Occupations by Sex
Within the Management, Business, Science and Arts occupations in Silverton, the most male-oriented occupations are Management (89.3%), Arts, Media & Entertainment (58.5%), and Computers & Mathematics (57.6%), while the most female-oriented occupations are Education, Arts & Media (100.0%), Health Diagnosing & Treating (100.0%), and Health Technologists (100.0%).
| Occupation | Male | Female |
| Management | 150 (89.3%) | 18 (10.7%) |
| Business & Financial | 27 (24.8%) | 82 (75.2%) |
| Computers, Engineering & Science | 114 (48.9%) | 119 (51.1%) |
| Computers & Mathematics | 80 (57.6%) | 59 (42.4%) |
| Architecture & Engineering | 17 (54.8%) | 14 (45.2%) |
| Life, Physical & Social Science | 17 (27.0%) | 46 (73.0%) |
| Community & Social Service | 120 (29.0%) | 294 (71.0%) |
| Education, Arts & Media | 0 (0.0%) | 151 (100.0%) |
| Legal Services & Support | 0 (0.0%) | 0 (0.0%) |
| Education Instruction & Library | 65 (38.5%) | 104 (61.5%) |
| Arts, Media & Entertainment | 55 (58.5%) | 39 (41.5%) |
| Health Diagnosing & Treating | 0 (0.0%) | 139 (100.0%) |
| Health Technologists | 0 (0.0%) | 79 (100.0%) |
| Total (Category) | 411 (38.7%) | 652 (61.3%) |
| Total (Overall) | 1,139 (46.6%) | 1,308 (53.4%) |
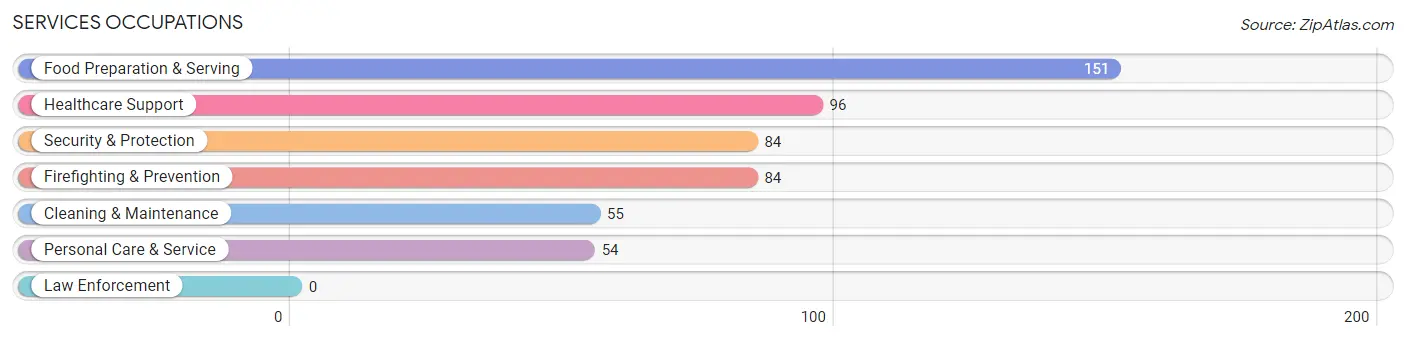
Services Occupations
The most common Services occupations in Silverton are Food Preparation & Serving (151 | 6.2%), Healthcare Support (96 | 3.9%), Security & Protection (84 | 3.4%), Firefighting & Prevention (84 | 3.4%), and Cleaning & Maintenance (55 | 2.2%).
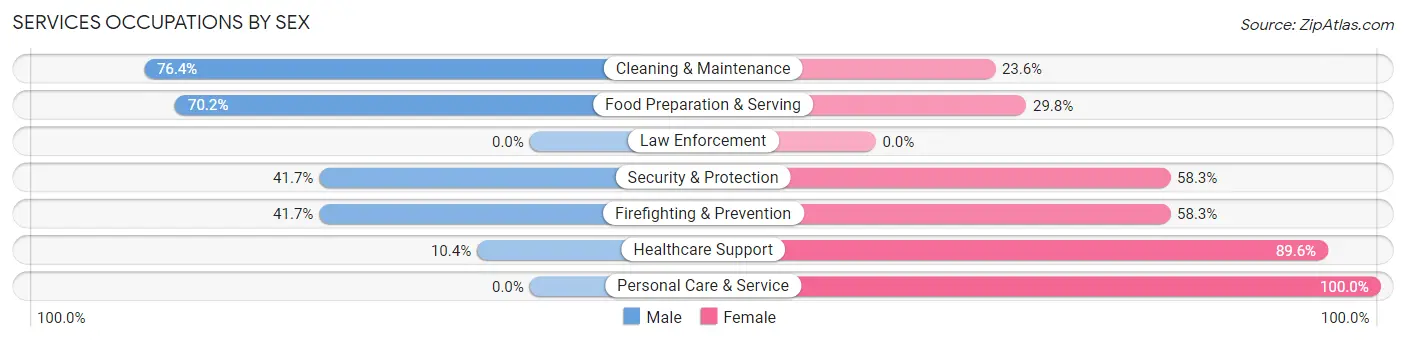
Services Occupations by Sex
Within the Services occupations in Silverton, the most male-oriented occupations are Cleaning & Maintenance (76.4%), Food Preparation & Serving (70.2%), and Security & Protection (41.7%), while the most female-oriented occupations are Personal Care & Service (100.0%), Healthcare Support (89.6%), and Security & Protection (58.3%).
| Occupation | Male | Female |
| Healthcare Support | 10 (10.4%) | 86 (89.6%) |
| Security & Protection | 35 (41.7%) | 49 (58.3%) |
| Firefighting & Prevention | 35 (41.7%) | 49 (58.3%) |
| Law Enforcement | 0 (0.0%) | 0 (0.0%) |
| Food Preparation & Serving | 106 (70.2%) | 45 (29.8%) |
| Cleaning & Maintenance | 42 (76.4%) | 13 (23.6%) |
| Personal Care & Service | 0 (0.0%) | 54 (100.0%) |
| Total (Category) | 193 (43.9%) | 247 (56.1%) |
| Total (Overall) | 1,139 (46.6%) | 1,308 (53.4%) |
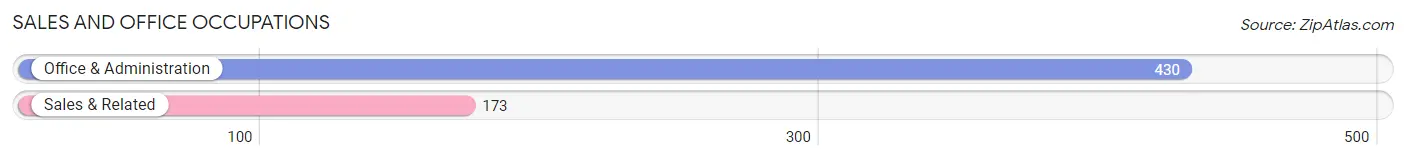
Sales and Office Occupations
The most common Sales and Office occupations in Silverton are Office & Administration (430 | 17.6%), and Sales & Related (173 | 7.1%).
Sales and Office Occupations by Sex
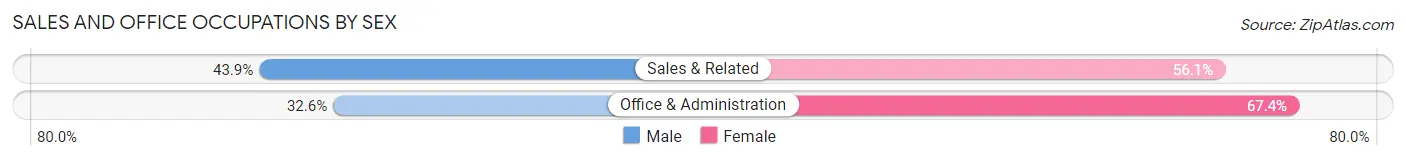
| Occupation | Male | Female |
| Sales & Related | 76 (43.9%) | 97 (56.1%) |
| Office & Administration | 140 (32.6%) | 290 (67.4%) |
| Total (Category) | 216 (35.8%) | 387 (64.2%) |
| Total (Overall) | 1,139 (46.6%) | 1,308 (53.4%) |
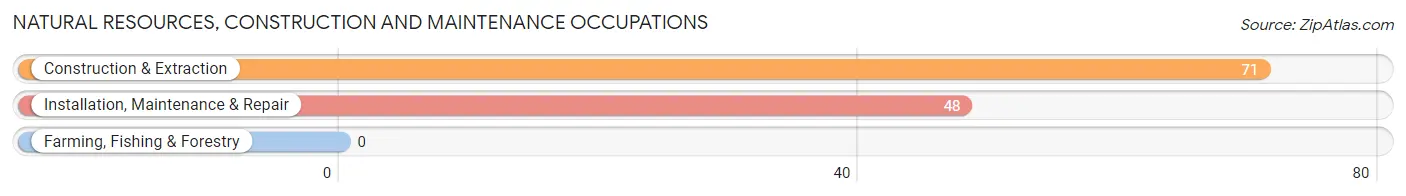
Natural Resources, Construction and Maintenance Occupations
The most common Natural Resources, Construction and Maintenance occupations in Silverton are Construction & Extraction (71 | 2.9%), and Installation, Maintenance & Repair (48 | 2.0%).
Natural Resources, Construction and Maintenance Occupations by Sex
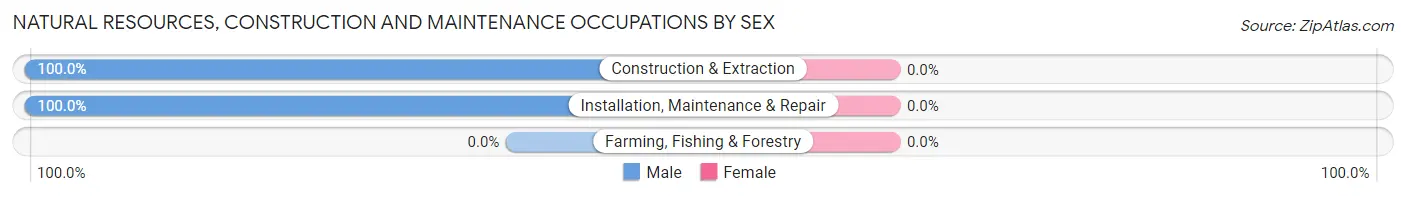
| Occupation | Male | Female |
| Farming, Fishing & Forestry | 0 (0.0%) | 0 (0.0%) |
| Construction & Extraction | 71 (100.0%) | 0 (0.0%) |
| Installation, Maintenance & Repair | 48 (100.0%) | 0 (0.0%) |
| Total (Category) | 119 (100.0%) | 0 (0.0%) |
| Total (Overall) | 1,139 (46.6%) | 1,308 (53.4%) |
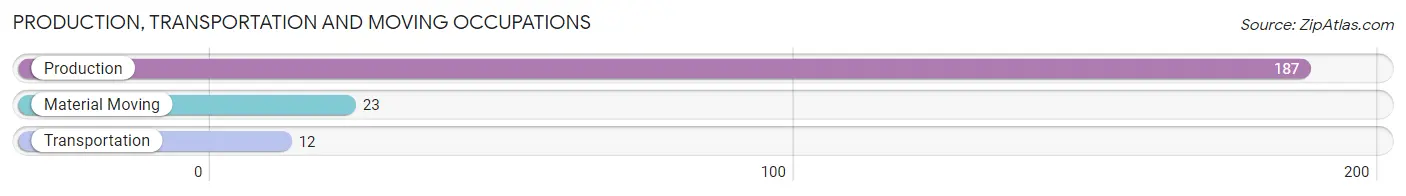
Production, Transportation and Moving Occupations
The most common Production, Transportation and Moving occupations in Silverton are Production (187 | 7.6%), Material Moving (23 | 0.9%), and Transportation (12 | 0.5%).
Production, Transportation and Moving Occupations by Sex
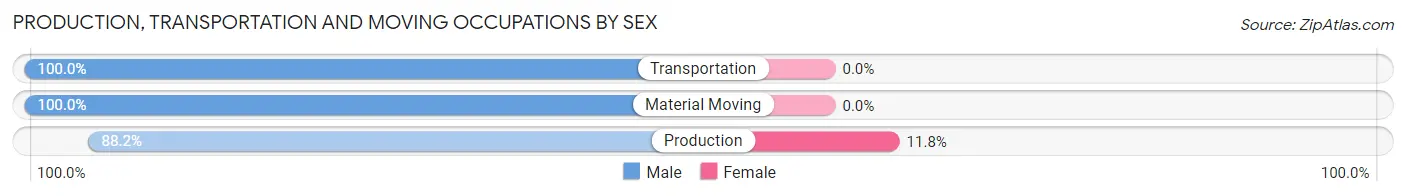
| Occupation | Male | Female |
| Production | 165 (88.2%) | 22 (11.8%) |
| Transportation | 12 (100.0%) | 0 (0.0%) |
| Material Moving | 23 (100.0%) | 0 (0.0%) |
| Total (Category) | 200 (90.1%) | 22 (9.9%) |
| Total (Overall) | 1,139 (46.6%) | 1,308 (53.4%) |
Employment Industries by Sex in Silverton
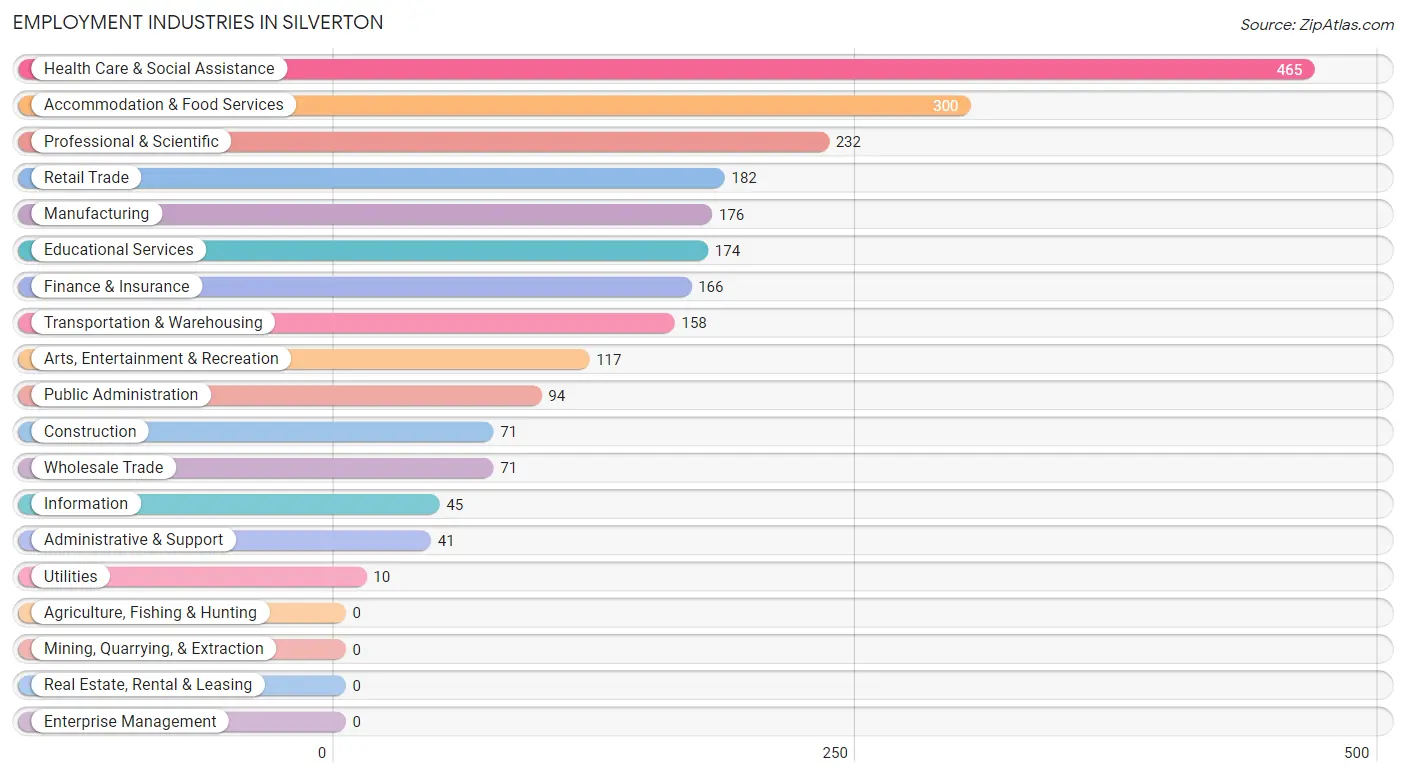
Employment Industries in Silverton
The major employment industries in Silverton include Health Care & Social Assistance (465 | 19.0%), Accommodation & Food Services (300 | 12.3%), Professional & Scientific (232 | 9.5%), Retail Trade (182 | 7.4%), and Manufacturing (176 | 7.2%).
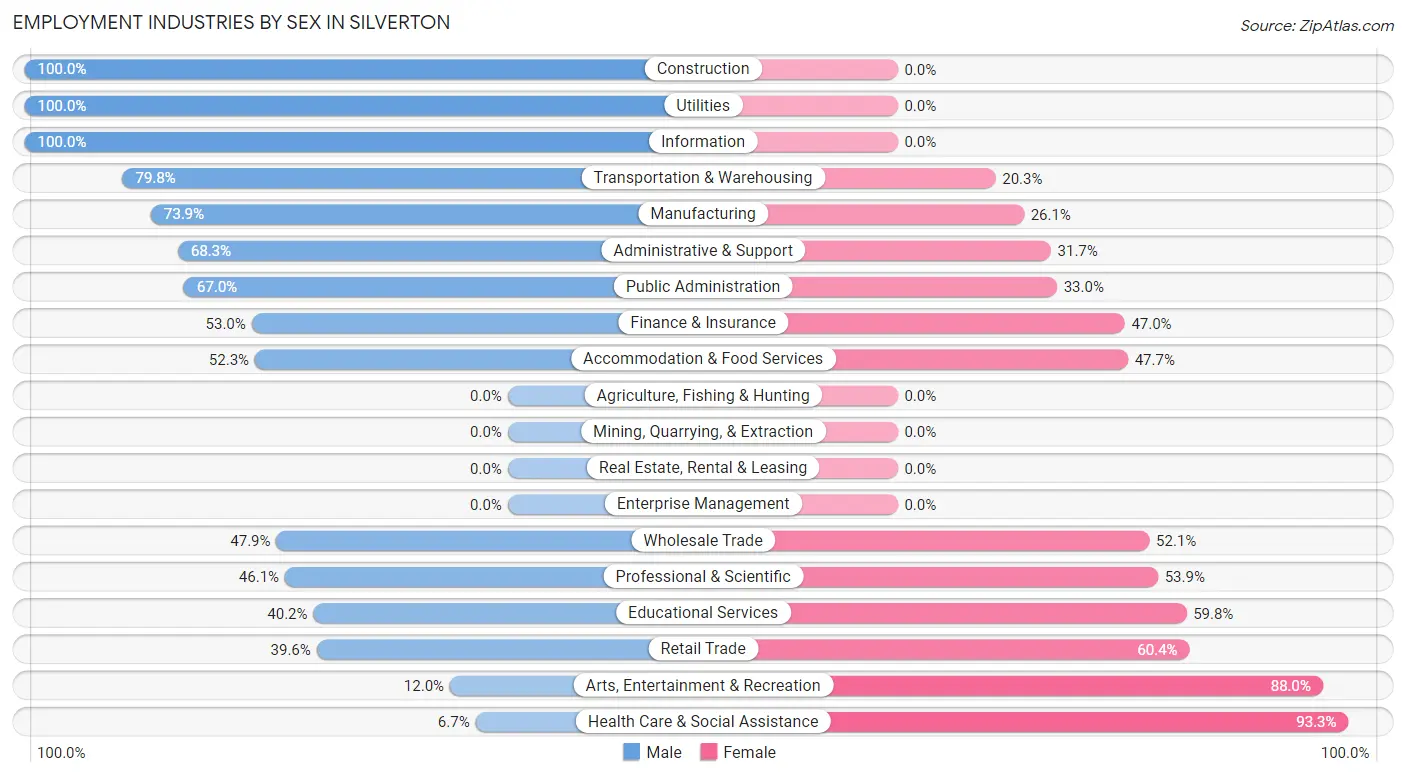
Employment Industries by Sex in Silverton
The Silverton industries that see more men than women are Construction (100.0%), Utilities (100.0%), and Information (100.0%), whereas the industries that tend to have a higher number of women are Health Care & Social Assistance (93.3%), Arts, Entertainment & Recreation (88.0%), and Retail Trade (60.4%).
| Industry | Male | Female |
| Agriculture, Fishing & Hunting | 0 (0.0%) | 0 (0.0%) |
| Mining, Quarrying, & Extraction | 0 (0.0%) | 0 (0.0%) |
| Construction | 71 (100.0%) | 0 (0.0%) |
| Manufacturing | 130 (73.9%) | 46 (26.1%) |
| Wholesale Trade | 34 (47.9%) | 37 (52.1%) |
| Retail Trade | 72 (39.6%) | 110 (60.4%) |
| Transportation & Warehousing | 126 (79.7%) | 32 (20.3%) |
| Utilities | 10 (100.0%) | 0 (0.0%) |
| Information | 45 (100.0%) | 0 (0.0%) |
| Finance & Insurance | 88 (53.0%) | 78 (47.0%) |
| Real Estate, Rental & Leasing | 0 (0.0%) | 0 (0.0%) |
| Professional & Scientific | 107 (46.1%) | 125 (53.9%) |
| Enterprise Management | 0 (0.0%) | 0 (0.0%) |
| Administrative & Support | 28 (68.3%) | 13 (31.7%) |
| Educational Services | 70 (40.2%) | 104 (59.8%) |
| Health Care & Social Assistance | 31 (6.7%) | 434 (93.3%) |
| Arts, Entertainment & Recreation | 14 (12.0%) | 103 (88.0%) |
| Accommodation & Food Services | 157 (52.3%) | 143 (47.7%) |
| Public Administration | 63 (67.0%) | 31 (33.0%) |
| Total | 1,139 (46.6%) | 1,308 (53.4%) |
Education in Silverton
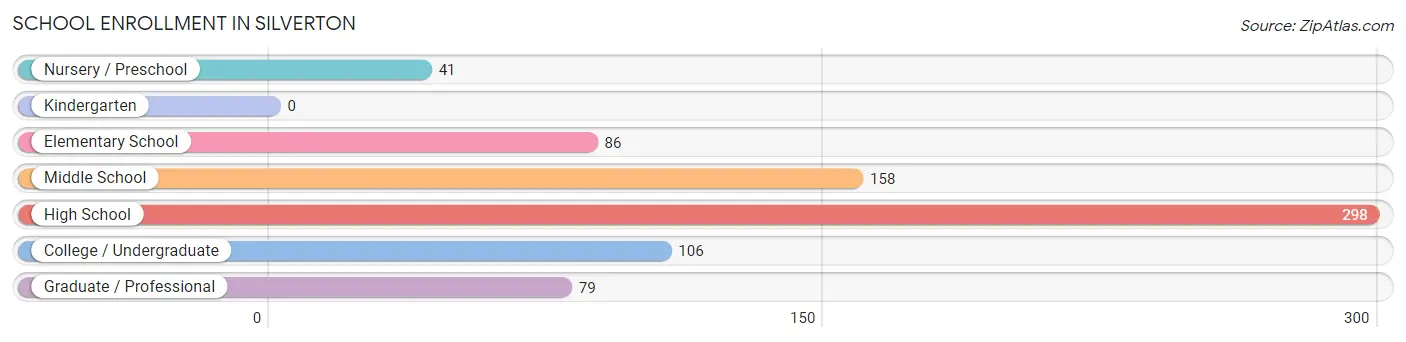
School Enrollment in Silverton
The most common levels of schooling among the 768 students in Silverton are high school (298 | 38.8%), middle school (158 | 20.6%), and college / undergraduate (106 | 13.8%).
| School Level | # Students | % Students |
| Nursery / Preschool | 41 | 5.3% |
| Kindergarten | 0 | 0.0% |
| Elementary School | 86 | 11.2% |
| Middle School | 158 | 20.6% |
| High School | 298 | 38.8% |
| College / Undergraduate | 106 | 13.8% |
| Graduate / Professional | 79 | 10.3% |
| Total | 768 | 100.0% |
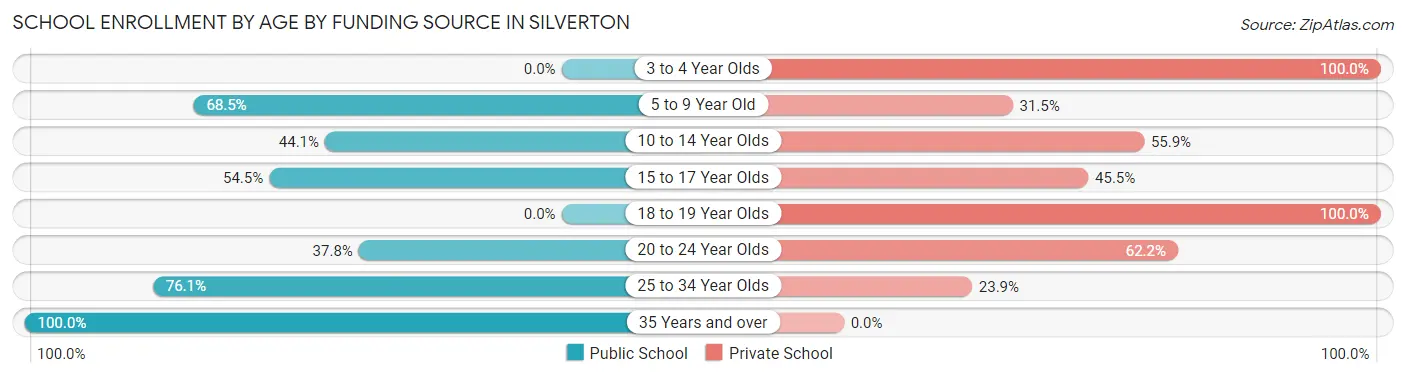
School Enrollment by Age by Funding Source in Silverton
Out of a total of 768 students who are enrolled in schools in Silverton, 362 (47.1%) attend a private institution, while the remaining 406 (52.9%) are enrolled in public schools. The age group of 3 to 4 year olds has the highest likelihood of being enrolled in private schools, with 23 (100.0% in the age bracket) enrolled. Conversely, the age group of 35 years and over has the lowest likelihood of being enrolled in a private school, with 45 (100.0% in the age bracket) attending a public institution.
| Age Bracket | Public School | Private School |
| 3 to 4 Year Olds | 0 (0.0%) | 23 (100.0%) |
| 5 to 9 Year Old | 61 (68.5%) | 28 (31.5%) |
| 10 to 14 Year Olds | 104 (44.1%) | 132 (55.9%) |
| 15 to 17 Year Olds | 128 (54.5%) | 107 (45.5%) |
| 18 to 19 Year Olds | 0 (0.0%) | 28 (100.0%) |
| 20 to 24 Year Olds | 17 (37.8%) | 28 (62.2%) |
| 25 to 34 Year Olds | 51 (76.1%) | 16 (23.9%) |
| 35 Years and over | 45 (100.0%) | 0 (0.0%) |
| Total | 406 (52.9%) | 362 (47.1%) |
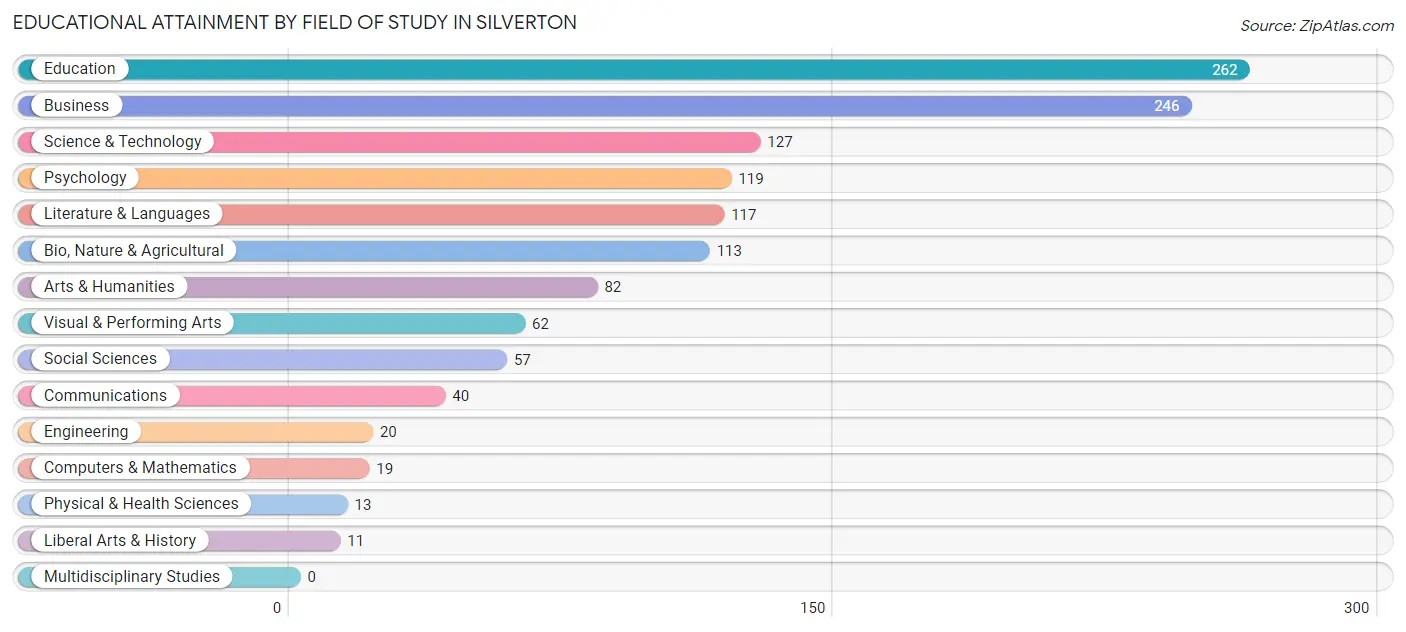
Educational Attainment by Field of Study in Silverton
Education (262 | 20.3%), business (246 | 19.1%), science & technology (127 | 9.9%), psychology (119 | 9.2%), and literature & languages (117 | 9.1%) are the most common fields of study among 1,288 individuals in Silverton who have obtained a bachelor's degree or higher.
| Field of Study | # Graduates | % Graduates |
| Computers & Mathematics | 19 | 1.5% |
| Bio, Nature & Agricultural | 113 | 8.8% |
| Physical & Health Sciences | 13 | 1.0% |
| Psychology | 119 | 9.2% |
| Social Sciences | 57 | 4.4% |
| Engineering | 20 | 1.5% |
| Multidisciplinary Studies | 0 | 0.0% |
| Science & Technology | 127 | 9.9% |
| Business | 246 | 19.1% |
| Education | 262 | 20.3% |
| Literature & Languages | 117 | 9.1% |
| Liberal Arts & History | 11 | 0.9% |
| Visual & Performing Arts | 62 | 4.8% |
| Communications | 40 | 3.1% |
| Arts & Humanities | 82 | 6.4% |
| Total | 1,288 | 100.0% |
Transportation & Commute in Silverton
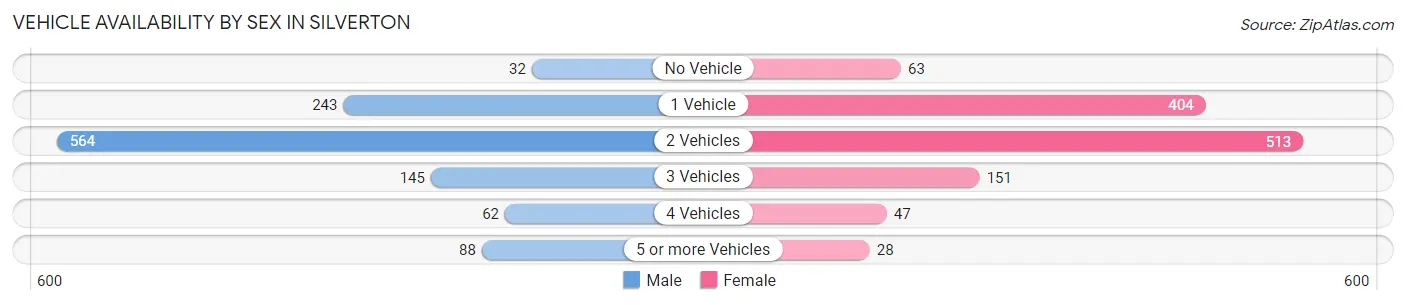
Vehicle Availability by Sex in Silverton
The most prevalent vehicle ownership categories in Silverton are males with 2 vehicles (564, accounting for 49.7%) and females with 2 vehicles (513, making up 46.8%).
| Vehicles Available | Male | Female |
| No Vehicle | 32 (2.8%) | 63 (5.2%) |
| 1 Vehicle | 243 (21.4%) | 404 (33.5%) |
| 2 Vehicles | 564 (49.7%) | 513 (42.5%) |
| 3 Vehicles | 145 (12.8%) | 151 (12.5%) |
| 4 Vehicles | 62 (5.5%) | 47 (3.9%) |
| 5 or more Vehicles | 88 (7.8%) | 28 (2.3%) |
| Total | 1,134 (100.0%) | 1,206 (100.0%) |
Commute Time in Silverton
The most frequently occuring commute durations in Silverton are 15 to 19 minutes (567 commuters, 27.2%), 20 to 24 minutes (550 commuters, 26.4%), and 10 to 14 minutes (257 commuters, 12.3%).
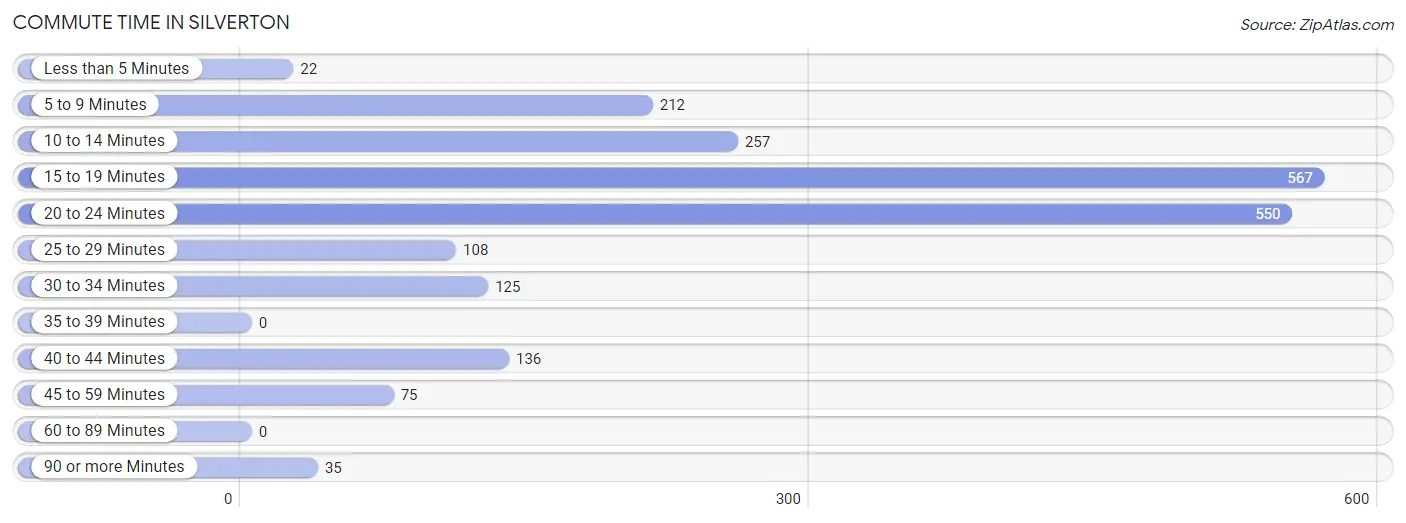
| Commute Time | # Commuters | % Commuters |
| Less than 5 Minutes | 22 | 1.1% |
| 5 to 9 Minutes | 212 | 10.2% |
| 10 to 14 Minutes | 257 | 12.3% |
| 15 to 19 Minutes | 567 | 27.2% |
| 20 to 24 Minutes | 550 | 26.4% |
| 25 to 29 Minutes | 108 | 5.2% |
| 30 to 34 Minutes | 125 | 6.0% |
| 35 to 39 Minutes | 0 | 0.0% |
| 40 to 44 Minutes | 136 | 6.5% |
| 45 to 59 Minutes | 75 | 3.6% |
| 60 to 89 Minutes | 0 | 0.0% |
| 90 or more Minutes | 35 | 1.7% |
Commute Time by Sex in Silverton
The most common commute times in Silverton are 15 to 19 minutes (271 commuters, 27.0%) for males and 15 to 19 minutes (296 commuters, 27.3%) for females.
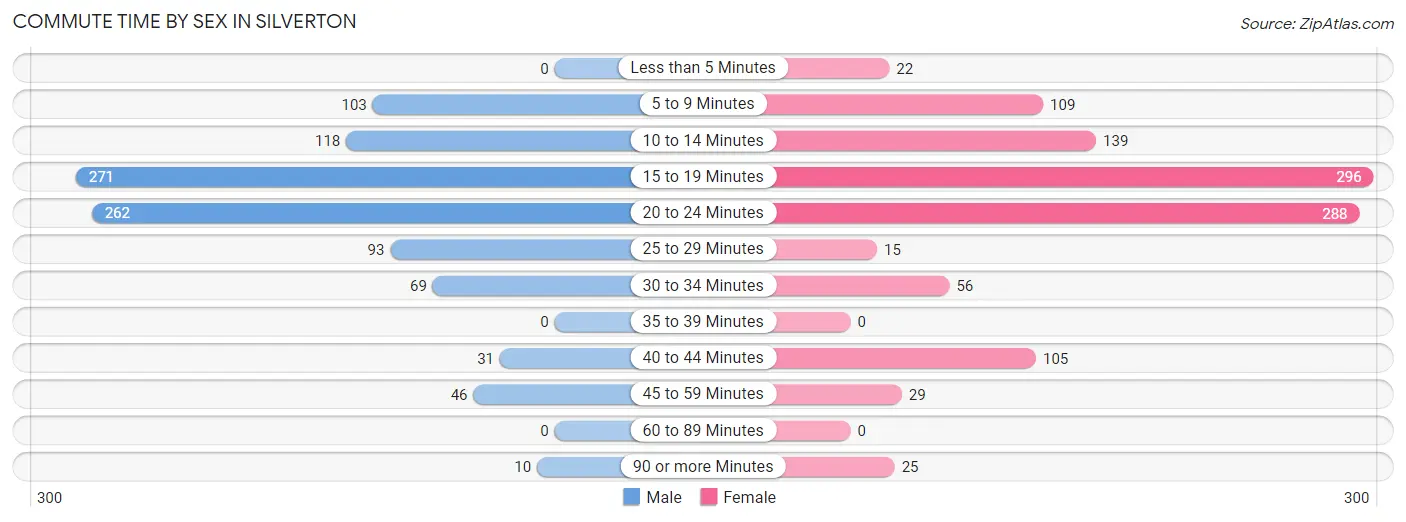
| Commute Time | Male | Female |
| Less than 5 Minutes | 0 (0.0%) | 22 (2.0%) |
| 5 to 9 Minutes | 103 (10.3%) | 109 (10.1%) |
| 10 to 14 Minutes | 118 (11.8%) | 139 (12.8%) |
| 15 to 19 Minutes | 271 (27.0%) | 296 (27.3%) |
| 20 to 24 Minutes | 262 (26.1%) | 288 (26.6%) |
| 25 to 29 Minutes | 93 (9.3%) | 15 (1.4%) |
| 30 to 34 Minutes | 69 (6.9%) | 56 (5.2%) |
| 35 to 39 Minutes | 0 (0.0%) | 0 (0.0%) |
| 40 to 44 Minutes | 31 (3.1%) | 105 (9.7%) |
| 45 to 59 Minutes | 46 (4.6%) | 29 (2.7%) |
| 60 to 89 Minutes | 0 (0.0%) | 0 (0.0%) |
| 90 or more Minutes | 10 (1.0%) | 25 (2.3%) |
Time of Departure to Work by Sex in Silverton
The most frequent times of departure to work in Silverton are 7:30 AM to 7:59 AM (163, 16.3%) for males and 7:30 AM to 7:59 AM (250, 23.1%) for females.
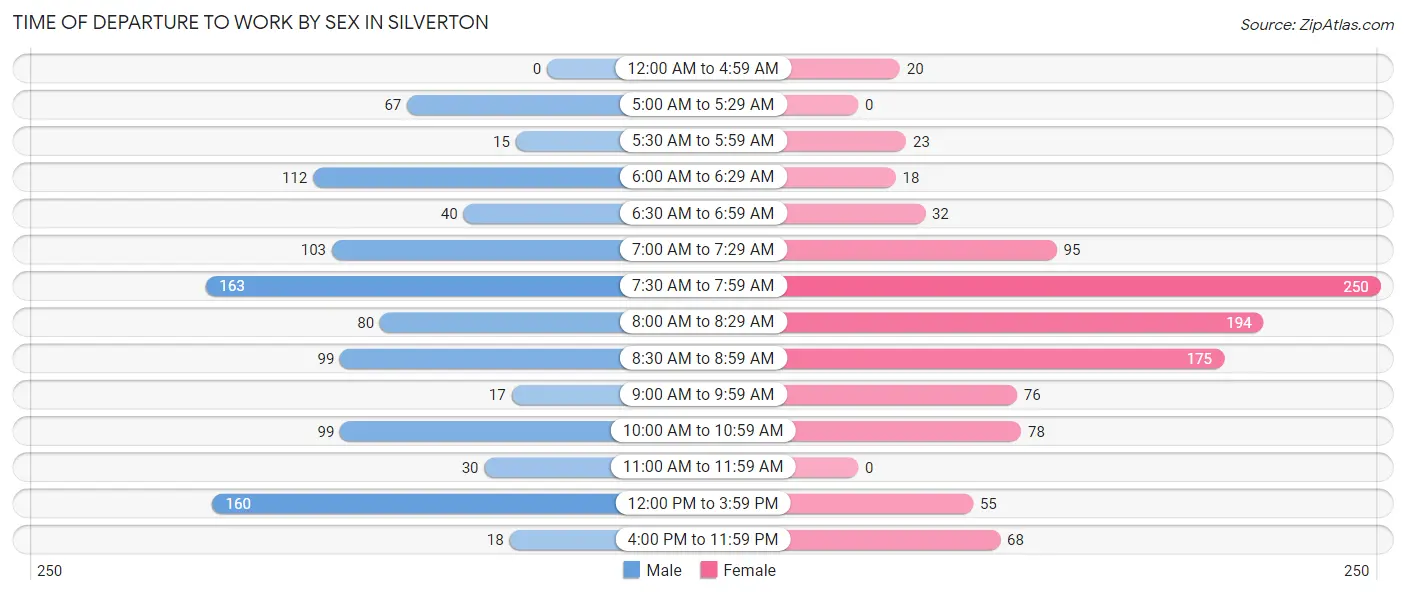
| Time of Departure | Male | Female |
| 12:00 AM to 4:59 AM | 0 (0.0%) | 20 (1.8%) |
| 5:00 AM to 5:29 AM | 67 (6.7%) | 0 (0.0%) |
| 5:30 AM to 5:59 AM | 15 (1.5%) | 23 (2.1%) |
| 6:00 AM to 6:29 AM | 112 (11.2%) | 18 (1.7%) |
| 6:30 AM to 6:59 AM | 40 (4.0%) | 32 (2.9%) |
| 7:00 AM to 7:29 AM | 103 (10.3%) | 95 (8.8%) |
| 7:30 AM to 7:59 AM | 163 (16.3%) | 250 (23.1%) |
| 8:00 AM to 8:29 AM | 80 (8.0%) | 194 (17.9%) |
| 8:30 AM to 8:59 AM | 99 (9.9%) | 175 (16.1%) |
| 9:00 AM to 9:59 AM | 17 (1.7%) | 76 (7.0%) |
| 10:00 AM to 10:59 AM | 99 (9.9%) | 78 (7.2%) |
| 11:00 AM to 11:59 AM | 30 (3.0%) | 0 (0.0%) |
| 12:00 PM to 3:59 PM | 160 (16.0%) | 55 (5.1%) |
| 4:00 PM to 11:59 PM | 18 (1.8%) | 68 (6.3%) |
| Total | 1,003 (100.0%) | 1,084 (100.0%) |
Housing Occupancy in Silverton
Occupancy by Ownership in Silverton
Of the total 2,425 dwellings in Silverton, owner-occupied units account for 1,223 (50.4%), while renter-occupied units make up 1,202 (49.6%).
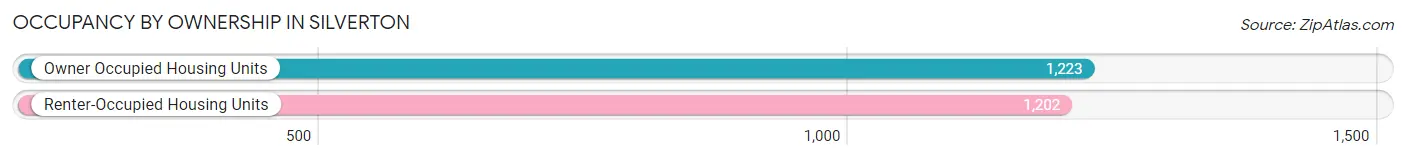
| Occupancy | # Housing Units | % Housing Units |
| Owner Occupied Housing Units | 1,223 | 50.4% |
| Renter-Occupied Housing Units | 1,202 | 49.6% |
| Total Occupied Housing Units | 2,425 | 100.0% |
Occupancy by Household Size in Silverton
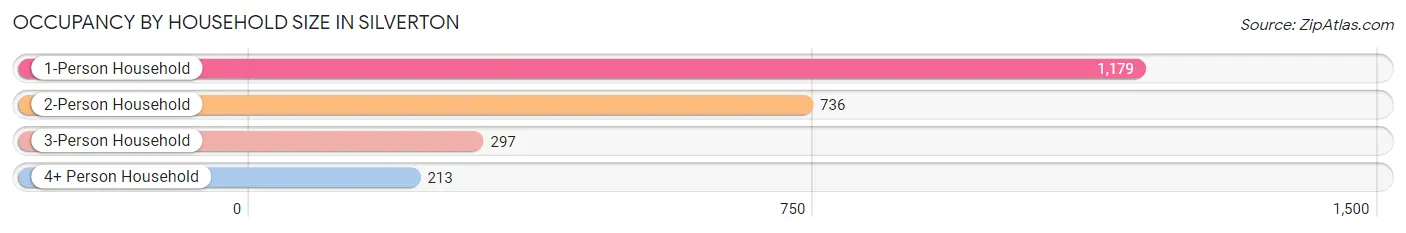
| Household Size | # Housing Units | % Housing Units |
| 1-Person Household | 1,179 | 48.6% |
| 2-Person Household | 736 | 30.3% |
| 3-Person Household | 297 | 12.2% |
| 4+ Person Household | 213 | 8.8% |
| Total Housing Units | 2,425 | 100.0% |
Occupancy by Ownership by Household Size in Silverton
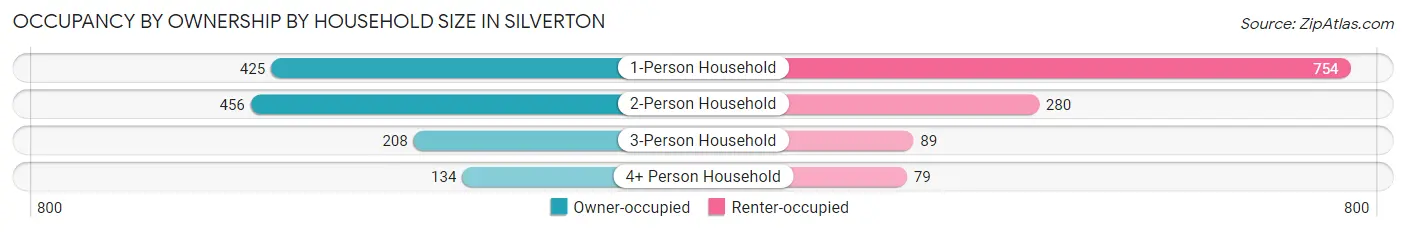
| Household Size | Owner-occupied | Renter-occupied |
| 1-Person Household | 425 (36.0%) | 754 (63.9%) |
| 2-Person Household | 456 (62.0%) | 280 (38.0%) |
| 3-Person Household | 208 (70.0%) | 89 (30.0%) |
| 4+ Person Household | 134 (62.9%) | 79 (37.1%) |
| Total Housing Units | 1,223 (50.4%) | 1,202 (49.6%) |
Occupancy by Educational Attainment in Silverton
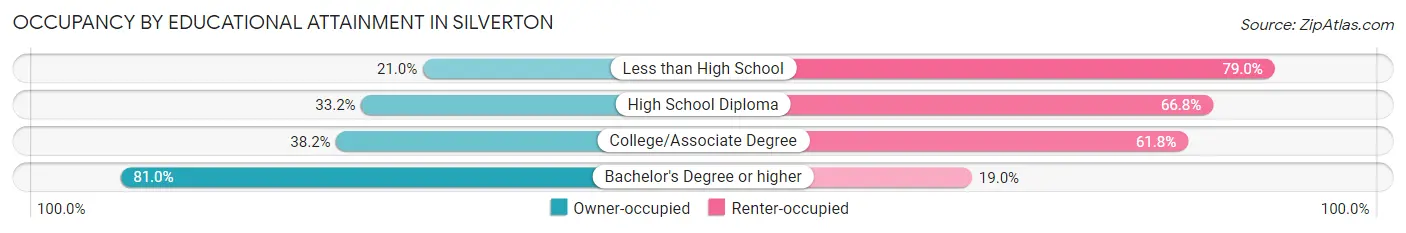
| Household Size | Owner-occupied | Renter-occupied |
| Less than High School | 21 (21.0%) | 79 (79.0%) |
| High School Diploma | 193 (33.2%) | 388 (66.8%) |
| College/Associate Degree | 360 (38.2%) | 583 (61.8%) |
| Bachelor's Degree or higher | 649 (81.0%) | 152 (19.0%) |
Occupancy by Age of Householder in Silverton
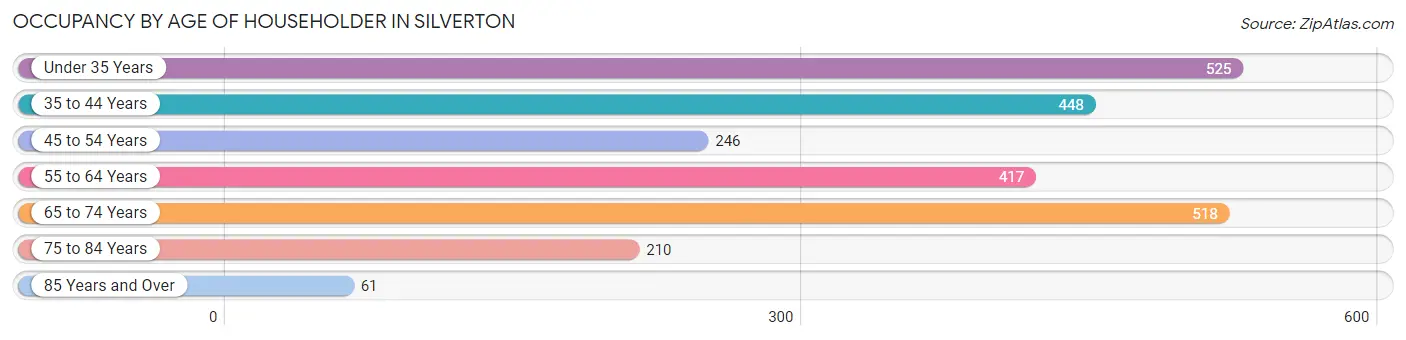
| Age Bracket | # Households | % Households |
| Under 35 Years | 525 | 21.6% |
| 35 to 44 Years | 448 | 18.5% |
| 45 to 54 Years | 246 | 10.1% |
| 55 to 64 Years | 417 | 17.2% |
| 65 to 74 Years | 518 | 21.4% |
| 75 to 84 Years | 210 | 8.7% |
| 85 Years and Over | 61 | 2.5% |
| Total | 2,425 | 100.0% |
Housing Finances in Silverton
Median Income by Occupancy in Silverton
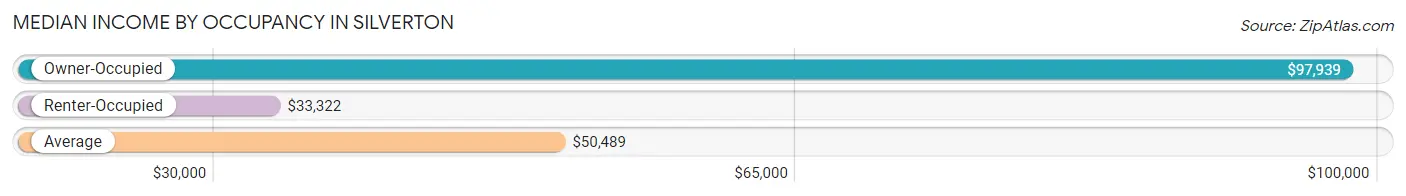
| Occupancy Type | # Households | Median Income |
| Owner-Occupied | 1,223 (50.4%) | $97,939 |
| Renter-Occupied | 1,202 (49.6%) | $33,322 |
| Average | 2,425 (100.0%) | $50,489 |
Occupancy by Householder Income Bracket in Silverton
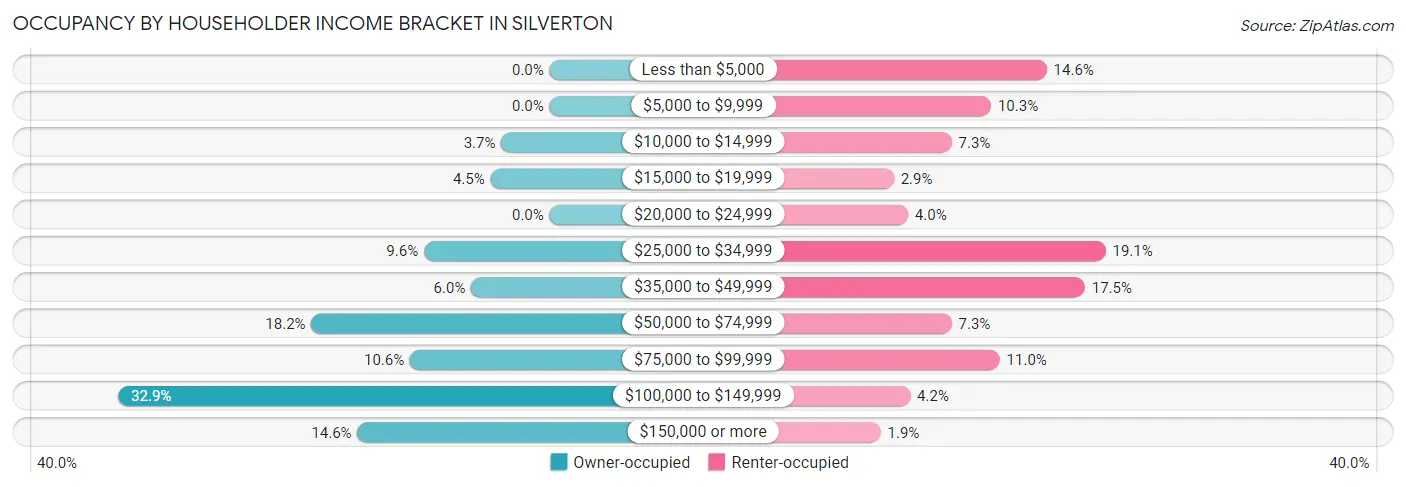
| Income Bracket | Owner-occupied | Renter-occupied |
| Less than $5,000 | 0 (0.0%) | 175 (14.6%) |
| $5,000 to $9,999 | 0 (0.0%) | 124 (10.3%) |
| $10,000 to $14,999 | 45 (3.7%) | 88 (7.3%) |
| $15,000 to $19,999 | 55 (4.5%) | 35 (2.9%) |
| $20,000 to $24,999 | 0 (0.0%) | 48 (4.0%) |
| $25,000 to $34,999 | 117 (9.6%) | 229 (19.1%) |
| $35,000 to $49,999 | 73 (6.0%) | 210 (17.5%) |
| $50,000 to $74,999 | 222 (18.1%) | 88 (7.3%) |
| $75,000 to $99,999 | 130 (10.6%) | 132 (11.0%) |
| $100,000 to $149,999 | 402 (32.9%) | 50 (4.2%) |
| $150,000 or more | 179 (14.6%) | 23 (1.9%) |
| Total | 1,223 (100.0%) | 1,202 (100.0%) |
Monthly Housing Cost Tiers in Silverton
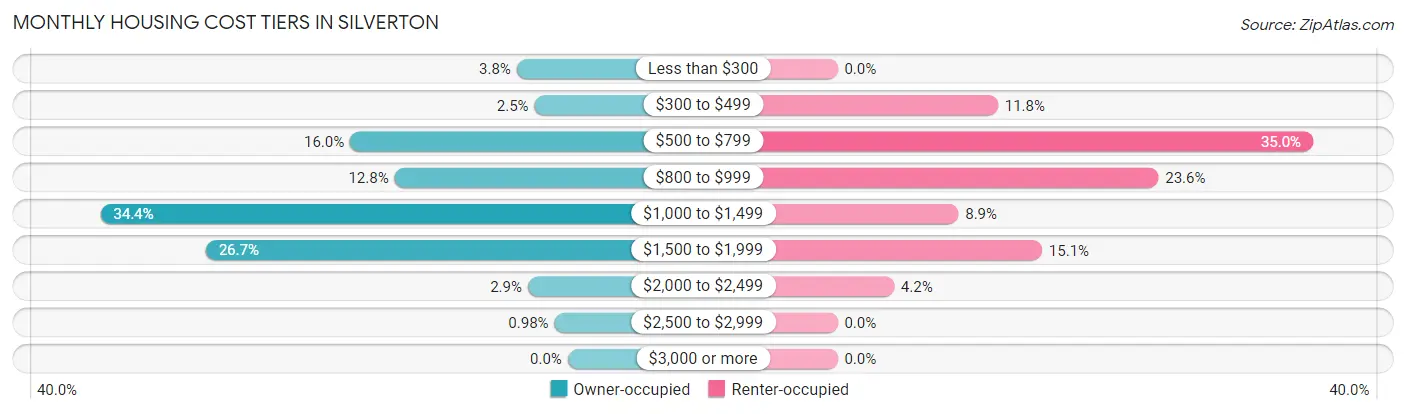
| Monthly Cost | Owner-occupied | Renter-occupied |
| Less than $300 | 46 (3.8%) | 0 (0.0%) |
| $300 to $499 | 30 (2.5%) | 142 (11.8%) |
| $500 to $799 | 196 (16.0%) | 421 (35.0%) |
| $800 to $999 | 156 (12.8%) | 284 (23.6%) |
| $1,000 to $1,499 | 421 (34.4%) | 107 (8.9%) |
| $1,500 to $1,999 | 326 (26.7%) | 181 (15.1%) |
| $2,000 to $2,499 | 36 (2.9%) | 50 (4.2%) |
| $2,500 to $2,999 | 12 (1.0%) | 0 (0.0%) |
| $3,000 or more | 0 (0.0%) | 0 (0.0%) |
| Total | 1,223 (100.0%) | 1,202 (100.0%) |
Physical Housing Characteristics in Silverton
Housing Structures in Silverton
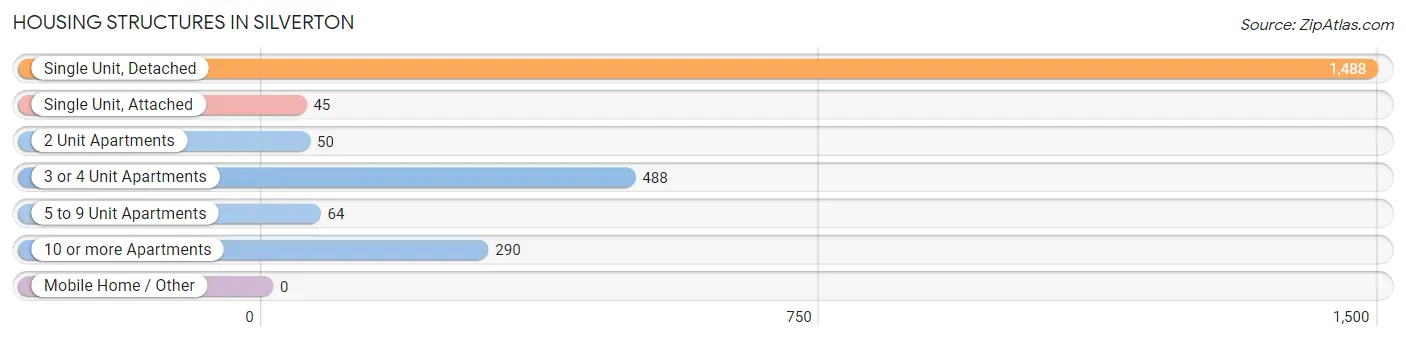
| Structure Type | # Housing Units | % Housing Units |
| Single Unit, Detached | 1,488 | 61.4% |
| Single Unit, Attached | 45 | 1.9% |
| 2 Unit Apartments | 50 | 2.1% |
| 3 or 4 Unit Apartments | 488 | 20.1% |
| 5 to 9 Unit Apartments | 64 | 2.6% |
| 10 or more Apartments | 290 | 12.0% |
| Mobile Home / Other | 0 | 0.0% |
| Total | 2,425 | 100.0% |
Housing Structures by Occupancy in Silverton
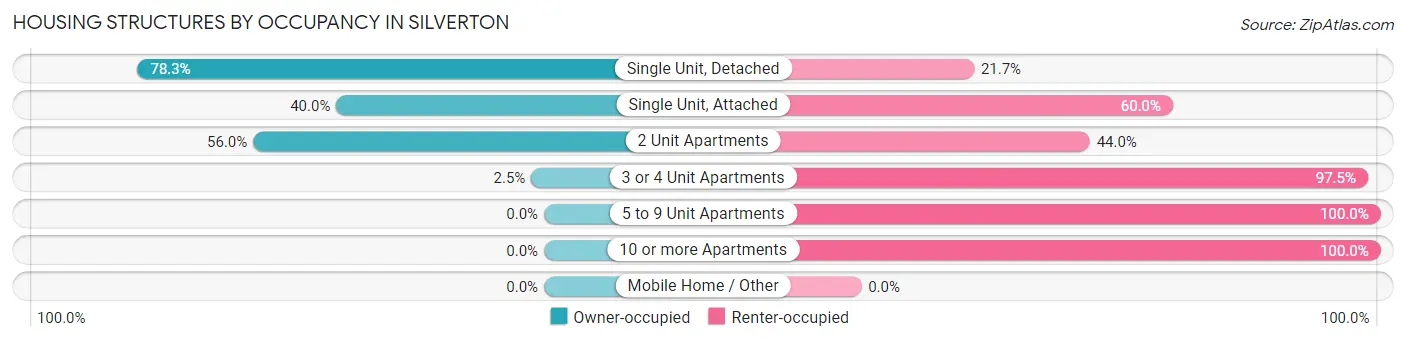
| Structure Type | Owner-occupied | Renter-occupied |
| Single Unit, Detached | 1,165 (78.3%) | 323 (21.7%) |
| Single Unit, Attached | 18 (40.0%) | 27 (60.0%) |
| 2 Unit Apartments | 28 (56.0%) | 22 (44.0%) |
| 3 or 4 Unit Apartments | 12 (2.5%) | 476 (97.5%) |
| 5 to 9 Unit Apartments | 0 (0.0%) | 64 (100.0%) |
| 10 or more Apartments | 0 (0.0%) | 290 (100.0%) |
| Mobile Home / Other | 0 (0.0%) | 0 (0.0%) |
| Total | 1,223 (50.4%) | 1,202 (49.6%) |
Housing Structures by Number of Rooms in Silverton
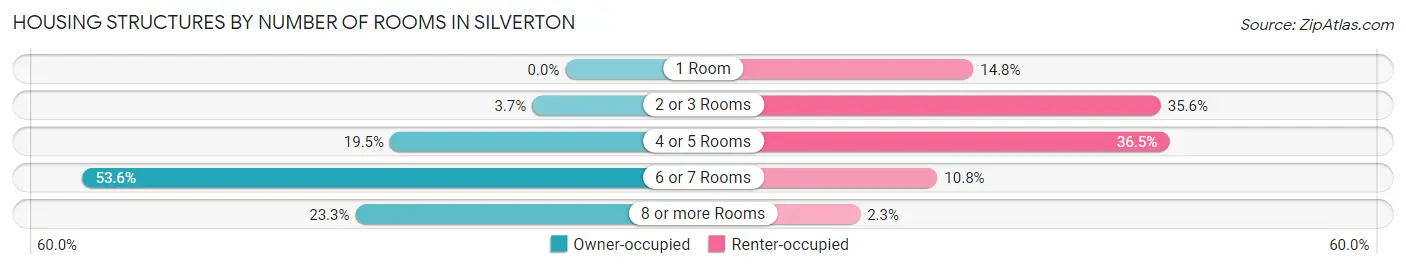
| Number of Rooms | Owner-occupied | Renter-occupied |
| 1 Room | 0 (0.0%) | 178 (14.8%) |
| 2 or 3 Rooms | 45 (3.7%) | 428 (35.6%) |
| 4 or 5 Rooms | 238 (19.5%) | 439 (36.5%) |
| 6 or 7 Rooms | 655 (53.6%) | 130 (10.8%) |
| 8 or more Rooms | 285 (23.3%) | 27 (2.2%) |
| Total | 1,223 (100.0%) | 1,202 (100.0%) |
Housing Structure by Heating Type in Silverton
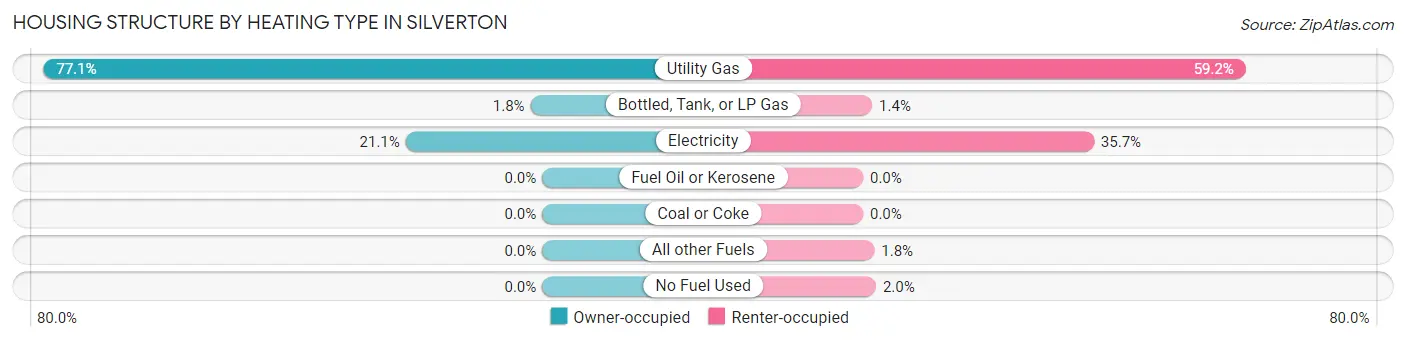
| Heating Type | Owner-occupied | Renter-occupied |
| Utility Gas | 943 (77.1%) | 711 (59.2%) |
| Bottled, Tank, or LP Gas | 22 (1.8%) | 17 (1.4%) |
| Electricity | 258 (21.1%) | 429 (35.7%) |
| Fuel Oil or Kerosene | 0 (0.0%) | 0 (0.0%) |
| Coal or Coke | 0 (0.0%) | 0 (0.0%) |
| All other Fuels | 0 (0.0%) | 21 (1.8%) |
| No Fuel Used | 0 (0.0%) | 24 (2.0%) |
| Total | 1,223 (100.0%) | 1,202 (100.0%) |
Household Vehicle Usage in Silverton
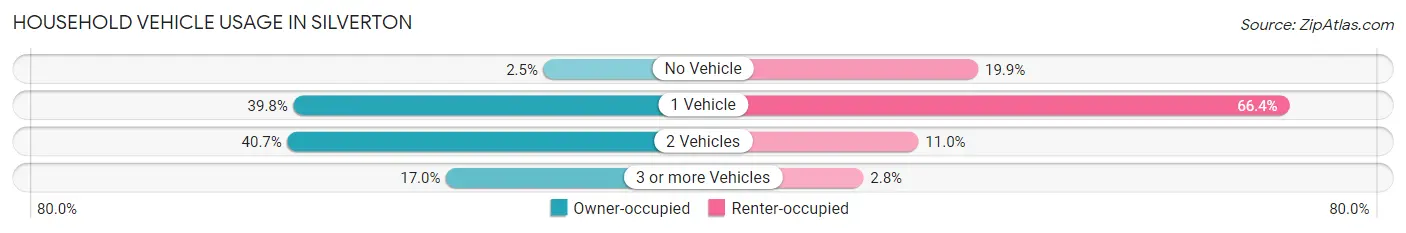
| Vehicles per Household | Owner-occupied | Renter-occupied |
| No Vehicle | 30 (2.5%) | 239 (19.9%) |
| 1 Vehicle | 487 (39.8%) | 798 (66.4%) |
| 2 Vehicles | 498 (40.7%) | 132 (11.0%) |
| 3 or more Vehicles | 208 (17.0%) | 33 (2.8%) |
| Total | 1,223 (100.0%) | 1,202 (100.0%) |
Real Estate & Mortgages in Silverton
Real Estate and Mortgage Overview in Silverton
| Characteristic | Without Mortgage | With Mortgage |
| Housing Units | 323 | 900 |
| Median Property Value | $136,600 | $168,200 |
| Median Household Income | - | - |
| Monthly Housing Costs | $629 | $0 |
| Real Estate Taxes | $2,945 | $0 |
Property Value by Mortgage Status in Silverton
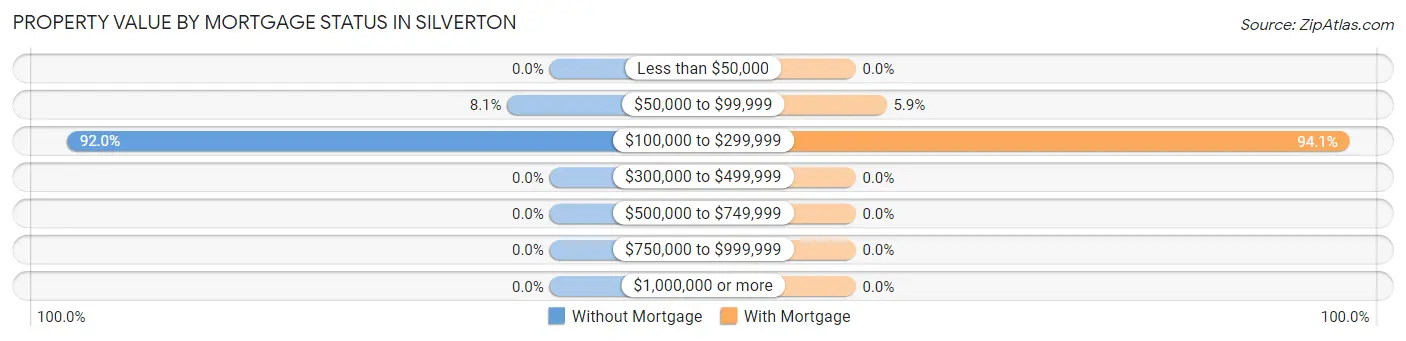
| Property Value | Without Mortgage | With Mortgage |
| Less than $50,000 | 0 (0.0%) | 0 (0.0%) |
| $50,000 to $99,999 | 26 (8.1%) | 53 (5.9%) |
| $100,000 to $299,999 | 297 (91.9%) | 847 (94.1%) |
| $300,000 to $499,999 | 0 (0.0%) | 0 (0.0%) |
| $500,000 to $749,999 | 0 (0.0%) | 0 (0.0%) |
| $750,000 to $999,999 | 0 (0.0%) | 0 (0.0%) |
| $1,000,000 or more | 0 (0.0%) | 0 (0.0%) |
| Total | 323 (100.0%) | 900 (100.0%) |
Household Income by Mortgage Status in Silverton
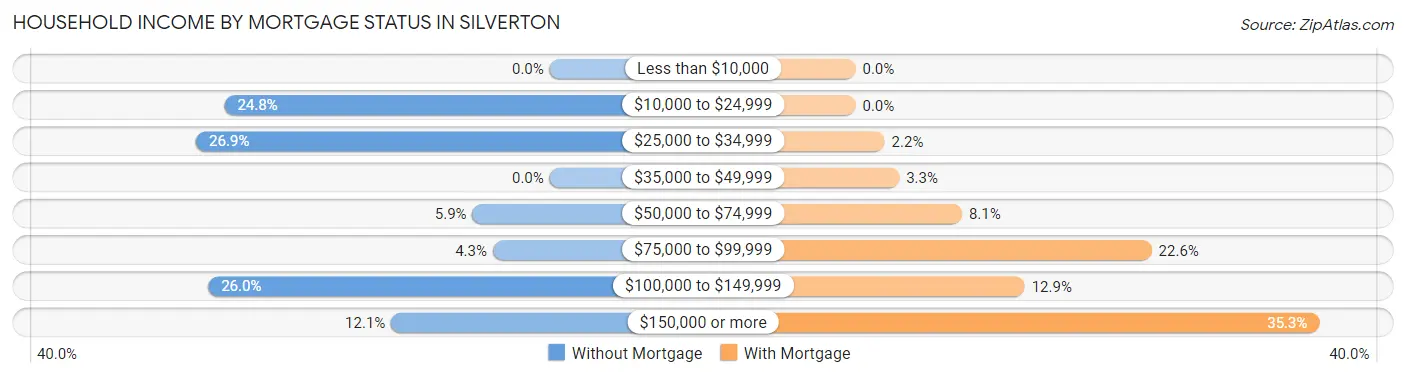
| Household Income | Without Mortgage | With Mortgage |
| Less than $10,000 | 0 (0.0%) | 0 (0.0%) |
| $10,000 to $24,999 | 80 (24.8%) | 0 (0.0%) |
| $25,000 to $34,999 | 87 (26.9%) | 20 (2.2%) |
| $35,000 to $49,999 | 0 (0.0%) | 30 (3.3%) |
| $50,000 to $74,999 | 19 (5.9%) | 73 (8.1%) |
| $75,000 to $99,999 | 14 (4.3%) | 203 (22.6%) |
| $100,000 to $149,999 | 84 (26.0%) | 116 (12.9%) |
| $150,000 or more | 39 (12.1%) | 318 (35.3%) |
| Total | 323 (100.0%) | 900 (100.0%) |
Property Value to Household Income Ratio in Silverton
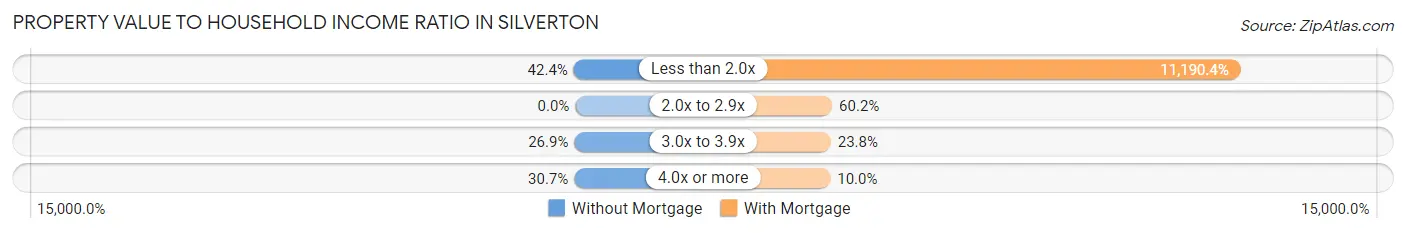
| Value-to-Income Ratio | Without Mortgage | With Mortgage |
| Less than 2.0x | 137 (42.4%) | 100,714 (11,190.4%) |
| 2.0x to 2.9x | 0 (0.0%) | 542 (60.2%) |
| 3.0x to 3.9x | 87 (26.9%) | 214 (23.8%) |
| 4.0x or more | 99 (30.6%) | 90 (10.0%) |
| Total | 323 (100.0%) | 900 (100.0%) |
Real Estate Taxes by Mortgage Status in Silverton
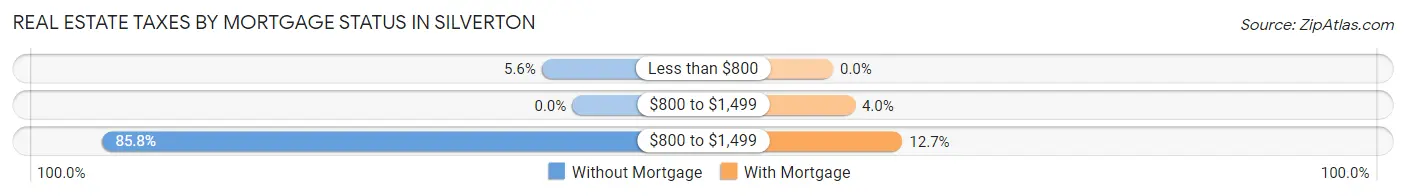
| Property Taxes | Without Mortgage | With Mortgage |
| Less than $800 | 18 (5.6%) | 0 (0.0%) |
| $800 to $1,499 | 0 (0.0%) | 36 (4.0%) |
| $800 to $1,499 | 277 (85.8%) | 114 (12.7%) |
| Total | 323 (100.0%) | 900 (100.0%) |
Health & Disability in Silverton
Health Insurance Coverage by Age in Silverton
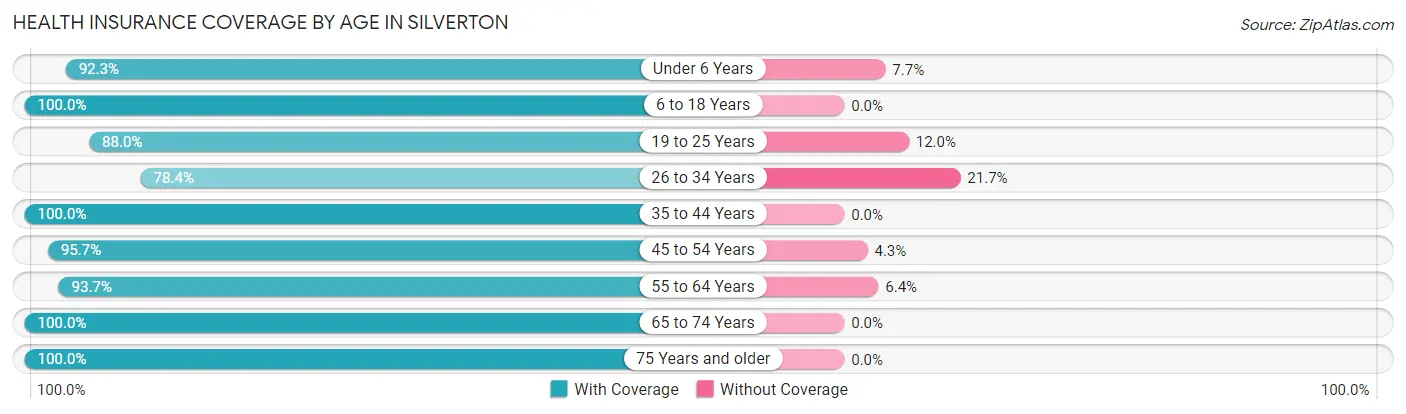
| Age Bracket | With Coverage | Without Coverage |
| Under 6 Years | 277 (92.3%) | 23 (7.7%) |
| 6 to 18 Years | 563 (100.0%) | 0 (0.0%) |
| 19 to 25 Years | 205 (88.0%) | 28 (12.0%) |
| 26 to 34 Years | 655 (78.3%) | 181 (21.6%) |
| 35 to 44 Years | 633 (100.0%) | 0 (0.0%) |
| 45 to 54 Years | 398 (95.7%) | 18 (4.3%) |
| 55 to 64 Years | 737 (93.6%) | 50 (6.4%) |
| 65 to 74 Years | 665 (100.0%) | 0 (0.0%) |
| 75 Years and older | 358 (100.0%) | 0 (0.0%) |
| Total | 4,491 (93.7%) | 300 (6.3%) |
Health Insurance Coverage by Citizenship Status in Silverton
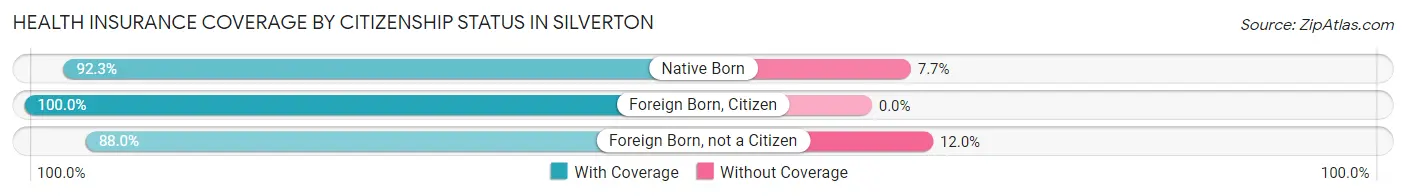
| Citizenship Status | With Coverage | Without Coverage |
| Native Born | 277 (92.3%) | 23 (7.7%) |
| Foreign Born, Citizen | 563 (100.0%) | 0 (0.0%) |
| Foreign Born, not a Citizen | 205 (88.0%) | 28 (12.0%) |
Health Insurance Coverage by Household Income in Silverton
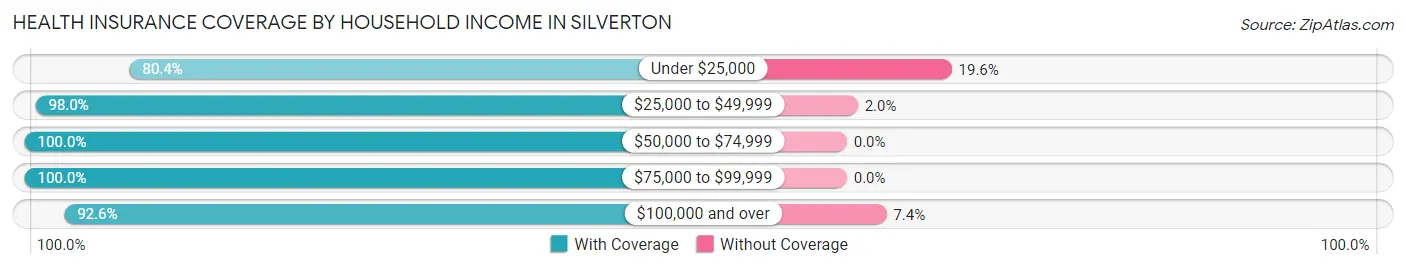
| Household Income | With Coverage | Without Coverage |
| Under $25,000 | 532 (80.4%) | 130 (19.6%) |
| $25,000 to $49,999 | 1,055 (98.0%) | 22 (2.0%) |
| $50,000 to $74,999 | 474 (100.0%) | 0 (0.0%) |
| $75,000 to $99,999 | 546 (100.0%) | 0 (0.0%) |
| $100,000 and over | 1,844 (92.6%) | 148 (7.4%) |
Public vs Private Health Insurance Coverage by Age in Silverton
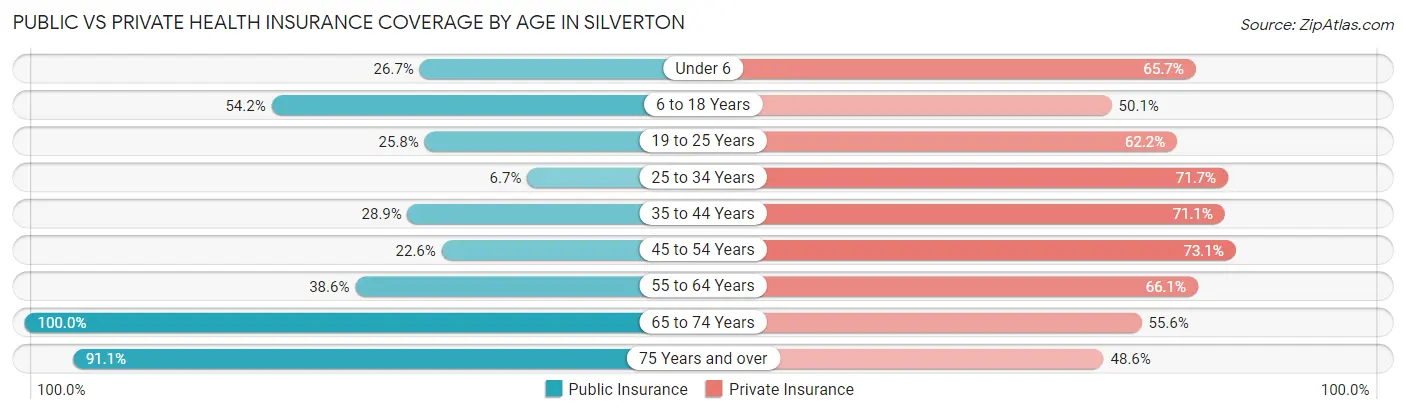
| Age Bracket | Public Insurance | Private Insurance |
| Under 6 | 80 (26.7%) | 197 (65.7%) |
| 6 to 18 Years | 305 (54.2%) | 282 (50.1%) |
| 19 to 25 Years | 60 (25.8%) | 145 (62.2%) |
| 25 to 34 Years | 56 (6.7%) | 599 (71.7%) |
| 35 to 44 Years | 183 (28.9%) | 450 (71.1%) |
| 45 to 54 Years | 94 (22.6%) | 304 (73.1%) |
| 55 to 64 Years | 304 (38.6%) | 520 (66.1%) |
| 65 to 74 Years | 665 (100.0%) | 370 (55.6%) |
| 75 Years and over | 326 (91.1%) | 174 (48.6%) |
| Total | 2,073 (43.3%) | 3,041 (63.5%) |
Disability Status by Sex by Age in Silverton
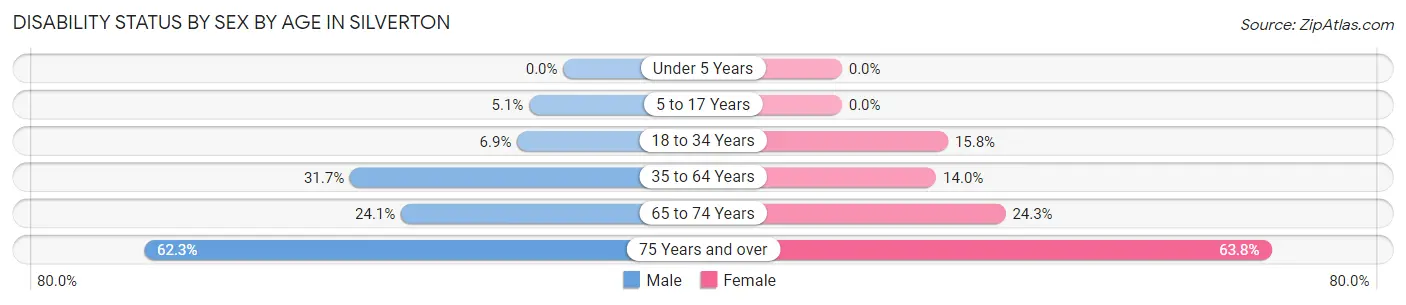
| Age Bracket | Male | Female |
| Under 5 Years | 0 (0.0%) | 0 (0.0%) |
| 5 to 17 Years | 17 (5.1%) | 0 (0.0%) |
| 18 to 34 Years | 38 (6.9%) | 81 (15.8%) |
| 35 to 64 Years | 256 (31.7%) | 144 (14.0%) |
| 65 to 74 Years | 66 (24.1%) | 95 (24.3%) |
| 75 Years and over | 94 (62.3%) | 132 (63.8%) |
Disability Class by Sex by Age in Silverton
Disability Class: Hearing Difficulty
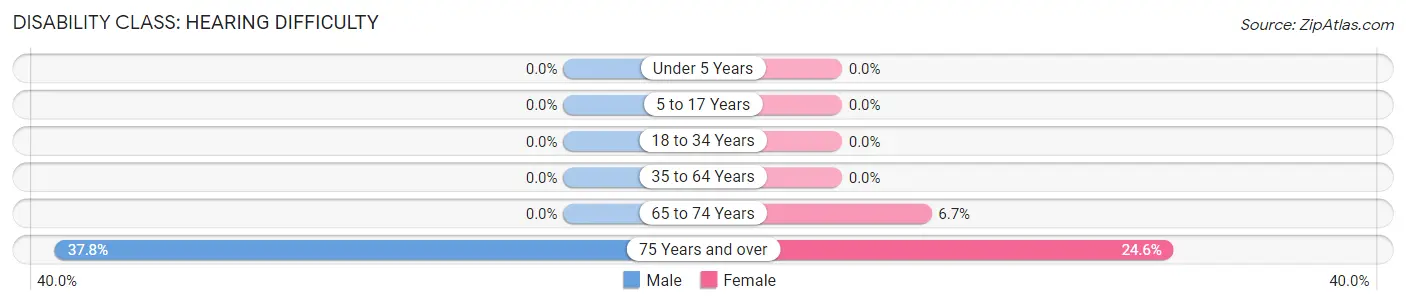
| Age Bracket | Male | Female |
| Under 5 Years | 0 (0.0%) | 0 (0.0%) |
| 5 to 17 Years | 0 (0.0%) | 0 (0.0%) |
| 18 to 34 Years | 0 (0.0%) | 0 (0.0%) |
| 35 to 64 Years | 0 (0.0%) | 0 (0.0%) |
| 65 to 74 Years | 0 (0.0%) | 26 (6.7%) |
| 75 Years and over | 57 (37.8%) | 51 (24.6%) |
Disability Class: Vision Difficulty
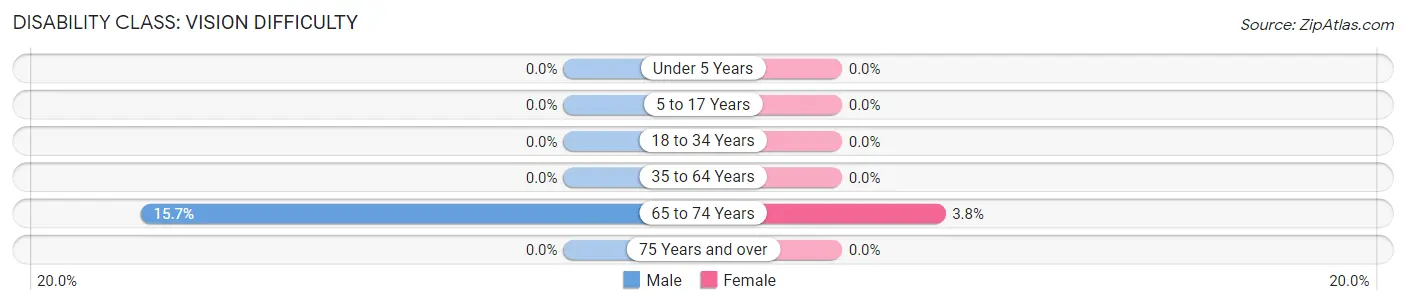
| Age Bracket | Male | Female |
| Under 5 Years | 0 (0.0%) | 0 (0.0%) |
| 5 to 17 Years | 0 (0.0%) | 0 (0.0%) |
| 18 to 34 Years | 0 (0.0%) | 0 (0.0%) |
| 35 to 64 Years | 0 (0.0%) | 0 (0.0%) |
| 65 to 74 Years | 43 (15.7%) | 15 (3.8%) |
| 75 Years and over | 0 (0.0%) | 0 (0.0%) |
Disability Class: Cognitive Difficulty
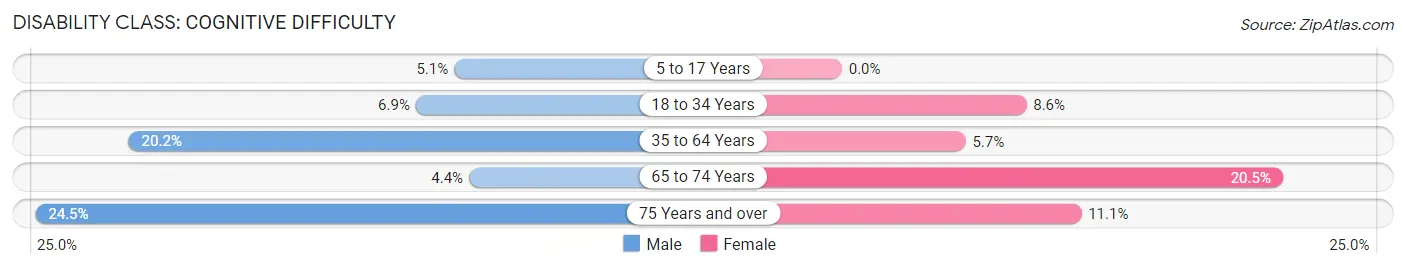
| Age Bracket | Male | Female |
| 5 to 17 Years | 17 (5.1%) | 0 (0.0%) |
| 18 to 34 Years | 38 (6.9%) | 44 (8.6%) |
| 35 to 64 Years | 163 (20.2%) | 59 (5.7%) |
| 65 to 74 Years | 12 (4.4%) | 80 (20.5%) |
| 75 Years and over | 37 (24.5%) | 23 (11.1%) |
Disability Class: Ambulatory Difficulty
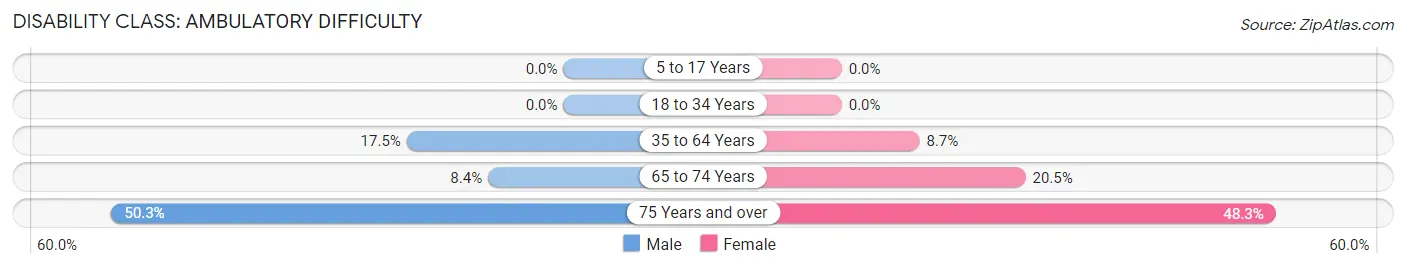
| Age Bracket | Male | Female |
| 5 to 17 Years | 0 (0.0%) | 0 (0.0%) |
| 18 to 34 Years | 0 (0.0%) | 0 (0.0%) |
| 35 to 64 Years | 141 (17.4%) | 89 (8.7%) |
| 65 to 74 Years | 23 (8.4%) | 80 (20.5%) |
| 75 Years and over | 76 (50.3%) | 100 (48.3%) |
Disability Class: Self-Care Difficulty
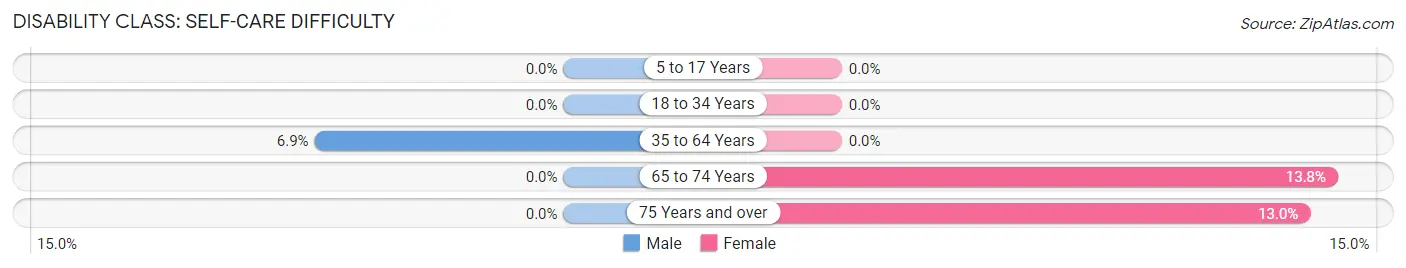
| Age Bracket | Male | Female |
| 5 to 17 Years | 0 (0.0%) | 0 (0.0%) |
| 18 to 34 Years | 0 (0.0%) | 0 (0.0%) |
| 35 to 64 Years | 56 (6.9%) | 0 (0.0%) |
| 65 to 74 Years | 0 (0.0%) | 54 (13.8%) |
| 75 Years and over | 0 (0.0%) | 27 (13.0%) |
Technology Access in Silverton
Computing Device Access in Silverton
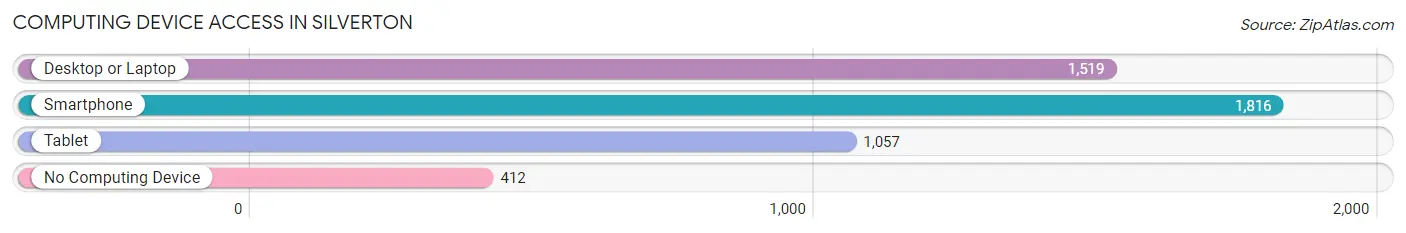
| Device Type | # Households | % Households |
| Desktop or Laptop | 1,519 | 62.6% |
| Smartphone | 1,816 | 74.9% |
| Tablet | 1,057 | 43.6% |
| No Computing Device | 412 | 17.0% |
| Total | 2,425 | 100.0% |
Internet Access in Silverton
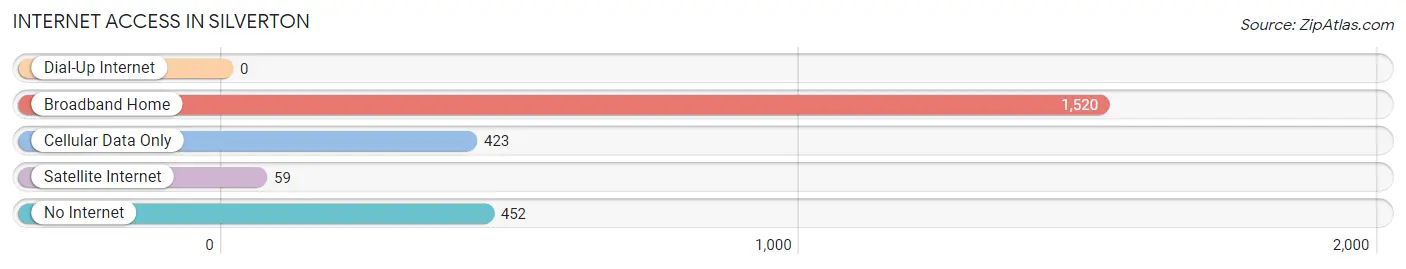
| Internet Type | # Households | % Households |
| Dial-Up Internet | 0 | 0.0% |
| Broadband Home | 1,520 | 62.7% |
| Cellular Data Only | 423 | 17.4% |
| Satellite Internet | 59 | 2.4% |
| No Internet | 452 | 18.6% |
| Total | 2,425 | 100.0% |
Silverton Summary
Silverton, Ohio is a small village located in Hamilton County, Ohio. It is situated on the east side of the Great Miami River, just north of the city of Cincinnati. The village was founded in 1817 and has a population of approximately 4,000 people.
History
Silverton was founded in 1817 by a group of settlers from Pennsylvania. The village was named after the silver mines that were located nearby. The first settlers were mostly farmers and the village grew slowly over the years. In 1845, the village was incorporated and the first mayor was elected.
In the late 19th century, Silverton began to experience a period of growth. The village was connected to Cincinnati by a railroad line and the population began to increase. By the early 20th century, Silverton had become a popular destination for tourists and the village was known for its many parks and recreational areas.
Geography
Silverton is located in Hamilton County, Ohio. It is situated on the east side of the Great Miami River, just north of the city of Cincinnati. The village is bordered by the cities of Sharonville and Blue Ash to the north, and by the townships of Sycamore and Springfield to the south. The village covers an area of approximately 1.5 square miles.
The terrain of Silverton is mostly flat, with some rolling hills in the northern part of the village. The climate is humid continental, with hot summers and cold winters. The average annual temperature is around 50 degrees Fahrenheit.
Economy
The economy of Silverton is largely based on the service industry. The village is home to several small businesses, including restaurants, retail stores, and professional services. The village also has a few manufacturing companies, including a plastics factory and a metal fabrication plant.
The village is also home to several educational institutions, including a public school district and a community college. The village is served by the Cincinnati/Northern Kentucky International Airport, which is located just a few miles away.
Demographics
As of the 2010 census, the population of Silverton was 4,000. The racial makeup of the village was 94.3% White, 2.2% African American, 0.3% Native American, 0.7% Asian, and 2.5% from other races. The median household income was $45,000, and the median family income was $50,000.
The village is home to a diverse population, with a variety of religious backgrounds. The largest religious group is the Roman Catholic Church, followed by the United Methodist Church and the Lutheran Church.
Conclusion
Silverton, Ohio is a small village located in Hamilton County, Ohio. It was founded in 1817 and has a population of approximately 4,000 people. The village is situated on the east side of the Great Miami River, just north of the city of Cincinnati. The economy of Silverton is largely based on the service industry, and the village is home to several small businesses, educational institutions, and manufacturing companies. The village is also home to a diverse population, with a variety of religious backgrounds.
Common Questions
What is Per Capita Income in Silverton?
Per Capita income in Silverton is $40,794.
What is the Median Family Income in Silverton?
Median Family Income in Silverton is $98,015.
What is the Median Household income in Silverton?
Median Household Income in Silverton is $50,489.
What is Income or Wage Gap in Silverton?
Income or Wage Gap in Silverton is 20.4%.
Women in Silverton earn 79.6 cents for every dollar earned by a man.
What is Inequality or Gini Index in Silverton?
Inequality or Gini Index in Silverton is 0.52.
What is the Total Population of Silverton?
Total Population of Silverton is 4,883.
What is the Total Male Population of Silverton?
Total Male Population of Silverton is 2,393.
What is the Total Female Population of Silverton?
Total Female Population of Silverton is 2,490.
What is the Ratio of Males per 100 Females in Silverton?
There are 96.10 Males per 100 Females in Silverton.
What is the Ratio of Females per 100 Males in Silverton?
There are 104.05 Females per 100 Males in Silverton.
What is the Median Population Age in Silverton?
Median Population Age in Silverton is 40.8 Years.
What is the Average Family Size in Silverton
Average Family Size in Silverton is 3.0 People.
What is the Average Household Size in Silverton
Average Household Size in Silverton is 2.0 People.
How Large is the Labor Force in Silverton?
There are 2,606 People in the Labor Forcein in Silverton.
What is the Percentage of People in the Labor Force in Silverton?
62.1% of People are in the Labor Force in Silverton.
What is the Unemployment Rate in Silverton?
Unemployment Rate in Silverton is 6.1%.