North Hampton, OH Map & Demographics
North Hampton Map
North Hampton Overview
$35,235
PER CAPITA INCOME
$86,250
AVG FAMILY INCOME
$79,250
AVG HOUSEHOLD INCOME
24.2%
WAGE / INCOME GAP [ % ]
75.8¢/ $1
WAGE / INCOME GAP [ $ ]
0.34
INEQUALITY / GINI INDEX
397
TOTAL POPULATION
192
MALE POPULATION
205
FEMALE POPULATION
93.66
MALES / 100 FEMALES
106.77
FEMALES / 100 MALES
48.9
MEDIAN AGE
2.9
AVG FAMILY SIZE
2.5
AVG HOUSEHOLD SIZE
205
LABOR FORCE [ PEOPLE ]
61.9%
PERCENT IN LABOR FORCE
1.5%
UNEMPLOYMENT RATE
North Hampton Zip Codes
North Hampton Area Codes
Income in North Hampton
Income Overview in North Hampton
Per Capita Income in North Hampton is $35,235, while median incomes of families and households are $86,250 and $79,250 respectively.
| Characteristic | Number | Measure |
| Per Capita Income | 397 | $35,235 |
| Median Family Income | 109 | $86,250 |
| Mean Family Income | 109 | $99,855 |
| Median Household Income | 156 | $79,250 |
| Mean Household Income | 156 | $88,855 |
| Income Deficit | 109 | $0 |
| Wage / Income Gap (%) | 397 | 24.23% |
| Wage / Income Gap ($) | 397 | 75.77¢ per $1 |
| Gini / Inequality Index | 397 | 0.34 |
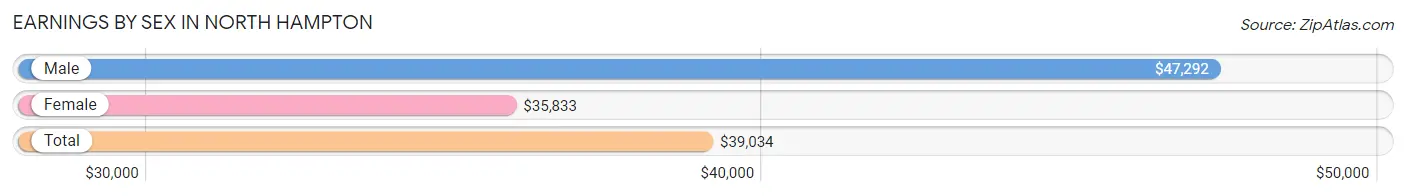
Earnings by Sex in North Hampton
Average Earnings in North Hampton are $39,034, $47,292 for men and $35,833 for women, a difference of 24.2%.
| Sex | Number | Average Earnings |
| Male | 117 (55.4%) | $47,292 |
| Female | 94 (44.6%) | $35,833 |
| Total | 211 (100.0%) | $39,034 |
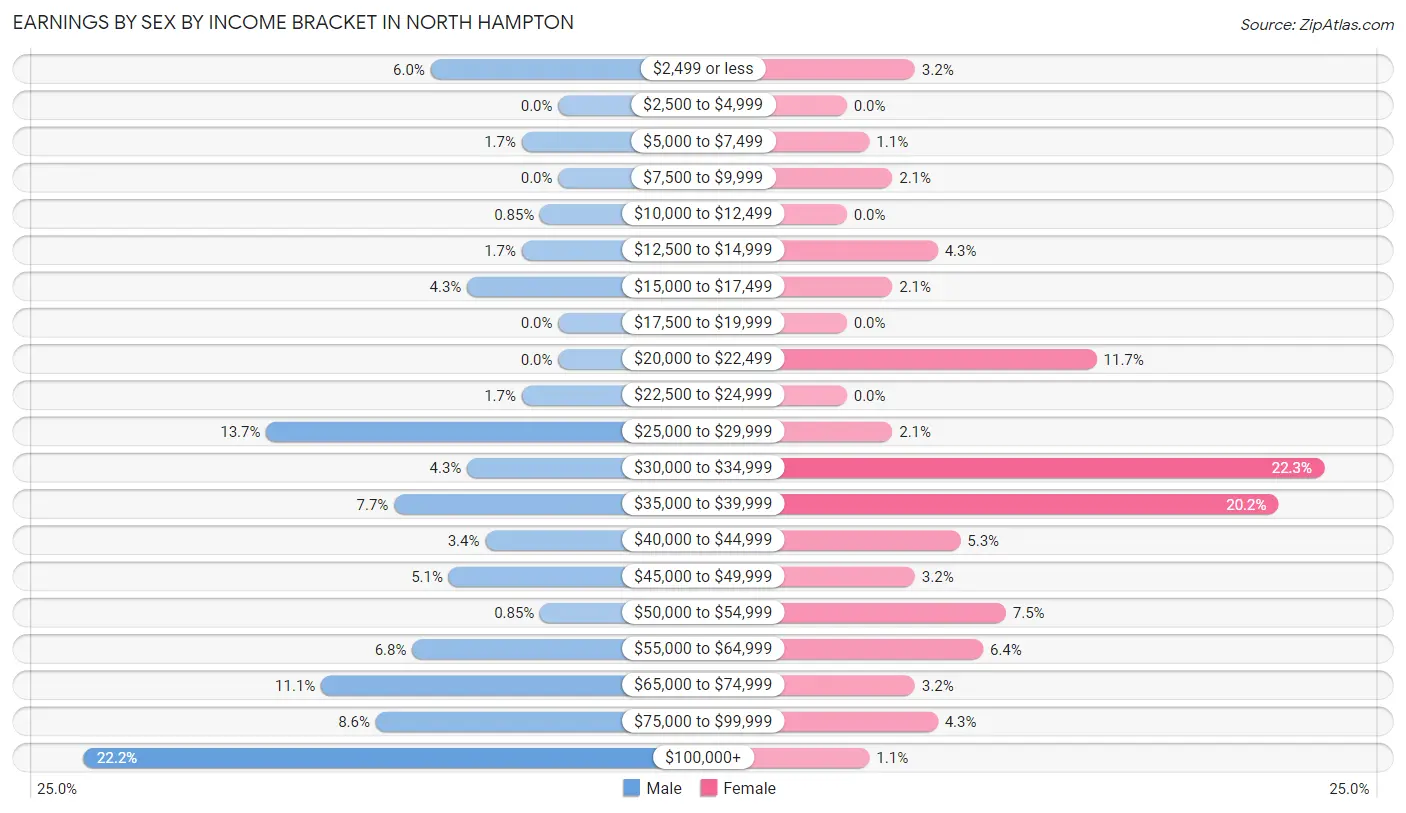
Earnings by Sex by Income Bracket in North Hampton
The most common earnings brackets in North Hampton are $100,000+ for men (26 | 22.2%) and $30,000 to $34,999 for women (21 | 22.3%).
| Income | Male | Female |
| $2,499 or less | 7 (6.0%) | 3 (3.2%) |
| $2,500 to $4,999 | 0 (0.0%) | 0 (0.0%) |
| $5,000 to $7,499 | 2 (1.7%) | 1 (1.1%) |
| $7,500 to $9,999 | 0 (0.0%) | 2 (2.1%) |
| $10,000 to $12,499 | 1 (0.9%) | 0 (0.0%) |
| $12,500 to $14,999 | 2 (1.7%) | 4 (4.3%) |
| $15,000 to $17,499 | 5 (4.3%) | 2 (2.1%) |
| $17,500 to $19,999 | 0 (0.0%) | 0 (0.0%) |
| $20,000 to $22,499 | 0 (0.0%) | 11 (11.7%) |
| $22,500 to $24,999 | 2 (1.7%) | 0 (0.0%) |
| $25,000 to $29,999 | 16 (13.7%) | 2 (2.1%) |
| $30,000 to $34,999 | 5 (4.3%) | 21 (22.3%) |
| $35,000 to $39,999 | 9 (7.7%) | 19 (20.2%) |
| $40,000 to $44,999 | 4 (3.4%) | 5 (5.3%) |
| $45,000 to $49,999 | 6 (5.1%) | 3 (3.2%) |
| $50,000 to $54,999 | 1 (0.9%) | 7 (7.4%) |
| $55,000 to $64,999 | 8 (6.8%) | 6 (6.4%) |
| $65,000 to $74,999 | 13 (11.1%) | 3 (3.2%) |
| $75,000 to $99,999 | 10 (8.6%) | 4 (4.3%) |
| $100,000+ | 26 (22.2%) | 1 (1.1%) |
| Total | 117 (100.0%) | 94 (100.0%) |
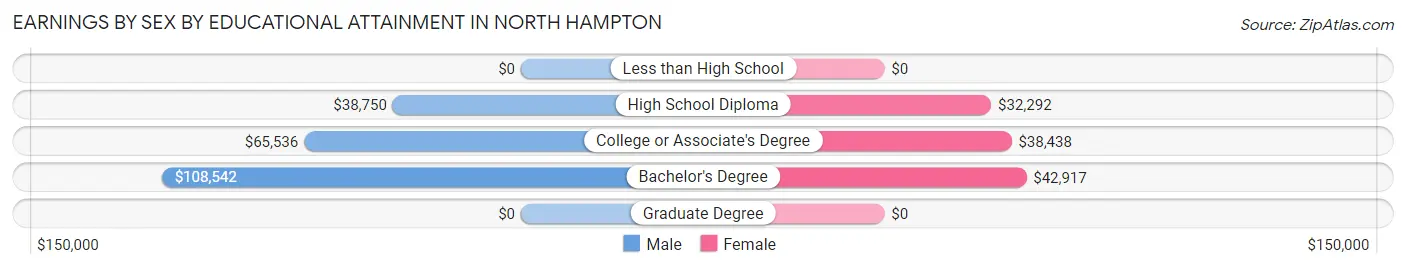
Earnings by Sex by Educational Attainment in North Hampton
Average earnings in North Hampton are $61,250 for men and $37,734 for women, a difference of 38.4%. Men with an educational attainment of bachelor's degree enjoy the highest average annual earnings of $108,542, while those with high school diploma education earn the least with $38,750. Women with an educational attainment of bachelor's degree earn the most with the average annual earnings of $42,917, while those with high school diploma education have the smallest earnings of $32,292.
| Educational Attainment | Male Income | Female Income |
| Less than High School | - | - |
| High School Diploma | $38,750 | $32,292 |
| College or Associate's Degree | $65,536 | $38,438 |
| Bachelor's Degree | $108,542 | $42,917 |
| Graduate Degree | - | - |
| Total | $61,250 | $37,734 |
Family Income in North Hampton
Family Income Brackets in North Hampton
According to the North Hampton family income data, there are 32 families falling into the $50,000 to $74,999 income range, which is the most common income bracket and makes up 29.4% of all families.
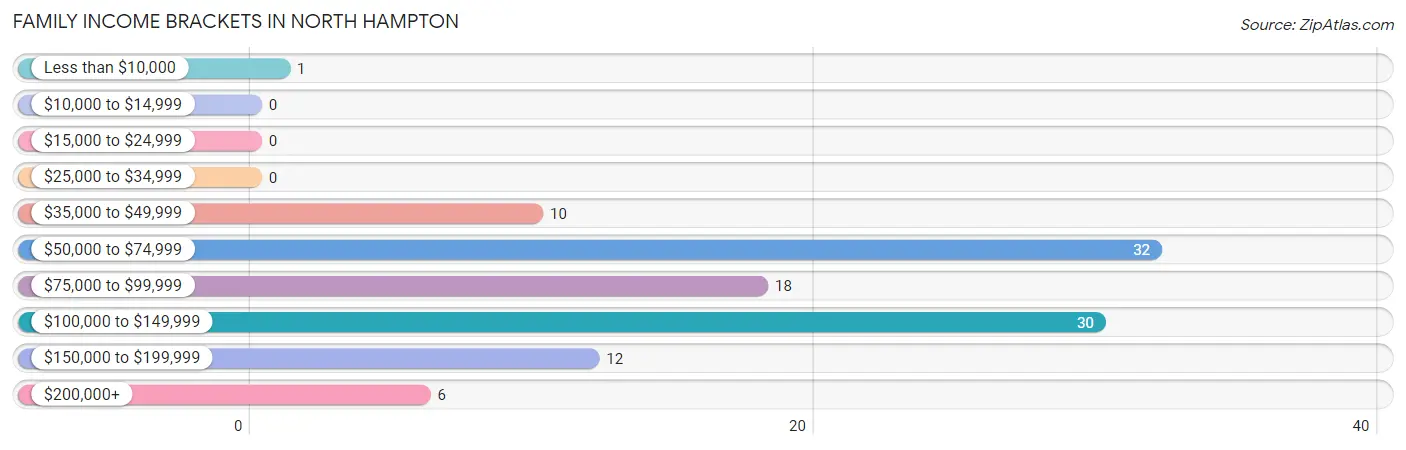
| Income Bracket | # Families | % Families |
| Less than $10,000 | 1 | 0.9% |
| $10,000 to $14,999 | 0 | 0.0% |
| $15,000 to $24,999 | 0 | 0.0% |
| $25,000 to $34,999 | 0 | 0.0% |
| $35,000 to $49,999 | 10 | 9.2% |
| $50,000 to $74,999 | 32 | 29.4% |
| $75,000 to $99,999 | 18 | 16.5% |
| $100,000 to $149,999 | 30 | 27.5% |
| $150,000 to $199,999 | 12 | 11.0% |
| $200,000+ | 6 | 5.5% |
Family Income by Famaliy Size in North Hampton
3-person families (6 | 5.5%) account for the highest median family income in North Hampton with $131,250 per family, while 3-person families (6 | 5.5%) have the highest median income of $43,750 per family member.
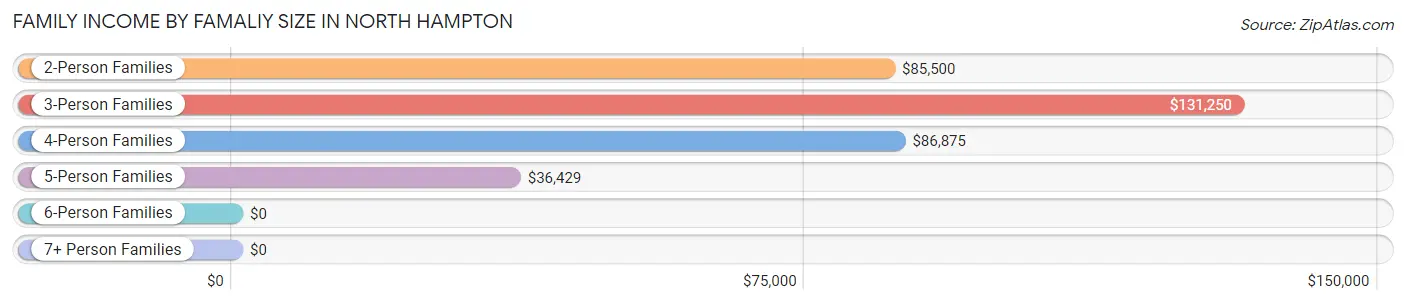
| Income Bracket | # Families | Median Income |
| 2-Person Families | 74 (67.9%) | $85,500 |
| 3-Person Families | 6 (5.5%) | $131,250 |
| 4-Person Families | 15 (13.8%) | $86,875 |
| 5-Person Families | 8 (7.3%) | $36,429 |
| 6-Person Families | 4 (3.7%) | $0 |
| 7+ Person Families | 2 (1.8%) | $0 |
| Total | 109 (100.0%) | $86,250 |
Family Income by Number of Earners in North Hampton
The median family income in North Hampton is $86,250, with families comprising 3+ earners (13) having the highest median family income of $165,625, while families with no earners (16) have the lowest median family income of $52,000, accounting for 11.9% and 14.7% of families, respectively.
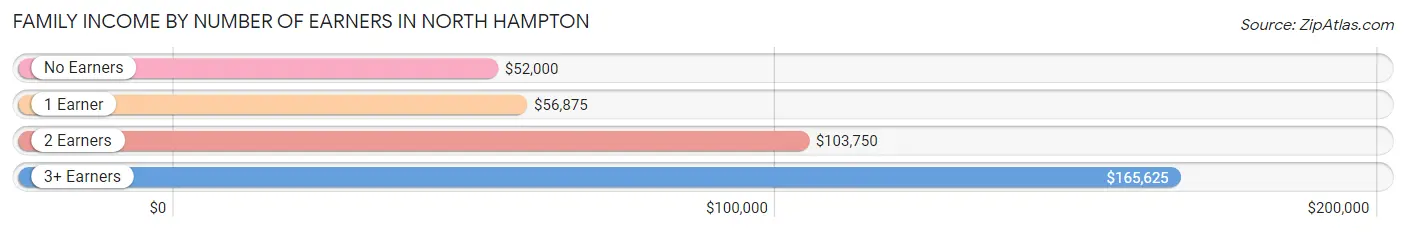
| Number of Earners | # Families | Median Income |
| No Earners | 16 (14.7%) | $52,000 |
| 1 Earner | 47 (43.1%) | $56,875 |
| 2 Earners | 33 (30.3%) | $103,750 |
| 3+ Earners | 13 (11.9%) | $165,625 |
| Total | 109 (100.0%) | $86,250 |
Household Income in North Hampton
Household Income Brackets in North Hampton
With 38 households falling in the category, the $100,000 to $149,999 income range is the most frequent in North Hampton, accounting for 24.4% of all households.
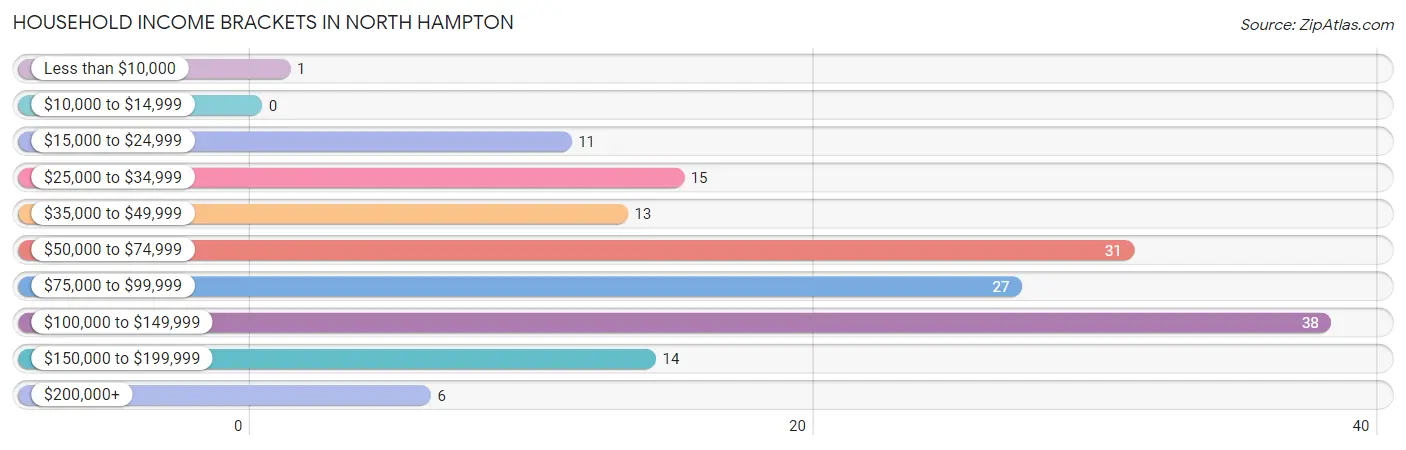
| Income Bracket | # Households | % Households |
| Less than $10,000 | 1 | 0.6% |
| $10,000 to $14,999 | 0 | 0.0% |
| $15,000 to $24,999 | 11 | 7.1% |
| $25,000 to $34,999 | 15 | 9.6% |
| $35,000 to $49,999 | 13 | 8.3% |
| $50,000 to $74,999 | 31 | 19.9% |
| $75,000 to $99,999 | 27 | 17.3% |
| $100,000 to $149,999 | 38 | 24.4% |
| $150,000 to $199,999 | 14 | 9.0% |
| $200,000+ | 6 | 3.8% |
Household Income by Householder Age in North Hampton
The median household income in North Hampton is $79,250, with the highest median household income of $103,750 found in the 45 to 64 years age bracket for the primary householder. A total of 77 households (49.4%) fall into this category. Meanwhile, the 15 to 24 years age bracket for the primary householder has the lowest median household income of $0, with 2 households (1.3%) in this group.
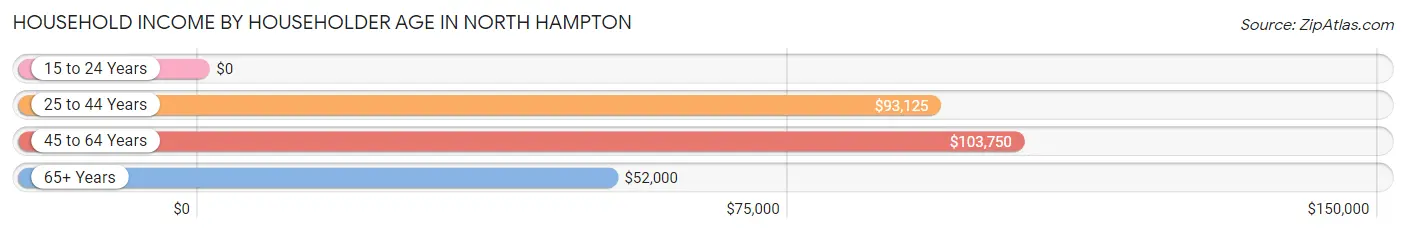
| Income Bracket | # Households | Median Income |
| 15 to 24 Years | 2 (1.3%) | $0 |
| 25 to 44 Years | 35 (22.4%) | $93,125 |
| 45 to 64 Years | 77 (49.4%) | $103,750 |
| 65+ Years | 42 (26.9%) | $52,000 |
| Total | 156 (100.0%) | $79,250 |
Poverty in North Hampton
Income Below Poverty by Sex and Age in North Hampton
With 2.6% poverty level for males and 5.9% for females among the residents of North Hampton, 16 and 17 year old males and 45 to 54 year old females are the most vulnerable to poverty, with 2 males (50.0%) and 6 females (17.6%) in their respective age groups living below the poverty level.
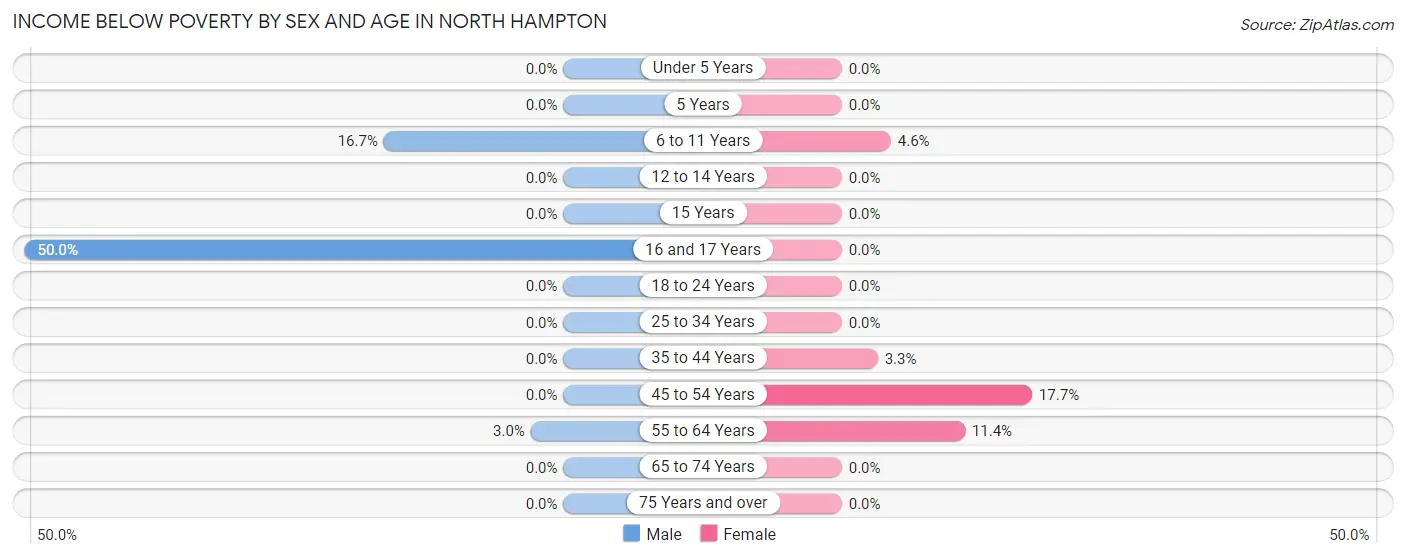
| Age Bracket | Male | Female |
| Under 5 Years | 0 (0.0%) | 0 (0.0%) |
| 5 Years | 0 (0.0%) | 0 (0.0%) |
| 6 to 11 Years | 2 (16.7%) | 1 (4.5%) |
| 12 to 14 Years | 0 (0.0%) | 0 (0.0%) |
| 15 Years | 0 (0.0%) | 0 (0.0%) |
| 16 and 17 Years | 2 (50.0%) | 0 (0.0%) |
| 18 to 24 Years | 0 (0.0%) | 0 (0.0%) |
| 25 to 34 Years | 0 (0.0%) | 0 (0.0%) |
| 35 to 44 Years | 0 (0.0%) | 1 (3.3%) |
| 45 to 54 Years | 0 (0.0%) | 6 (17.6%) |
| 55 to 64 Years | 1 (3.0%) | 4 (11.4%) |
| 65 to 74 Years | 0 (0.0%) | 0 (0.0%) |
| 75 Years and over | 0 (0.0%) | 0 (0.0%) |
| Total | 5 (2.6%) | 12 (5.9%) |
Income Above Poverty by Sex and Age in North Hampton
According to the poverty statistics in North Hampton, males aged under 5 years and females aged under 5 years are the age groups that are most secure financially, with 100.0% of males and 100.0% of females in these age groups living above the poverty line.
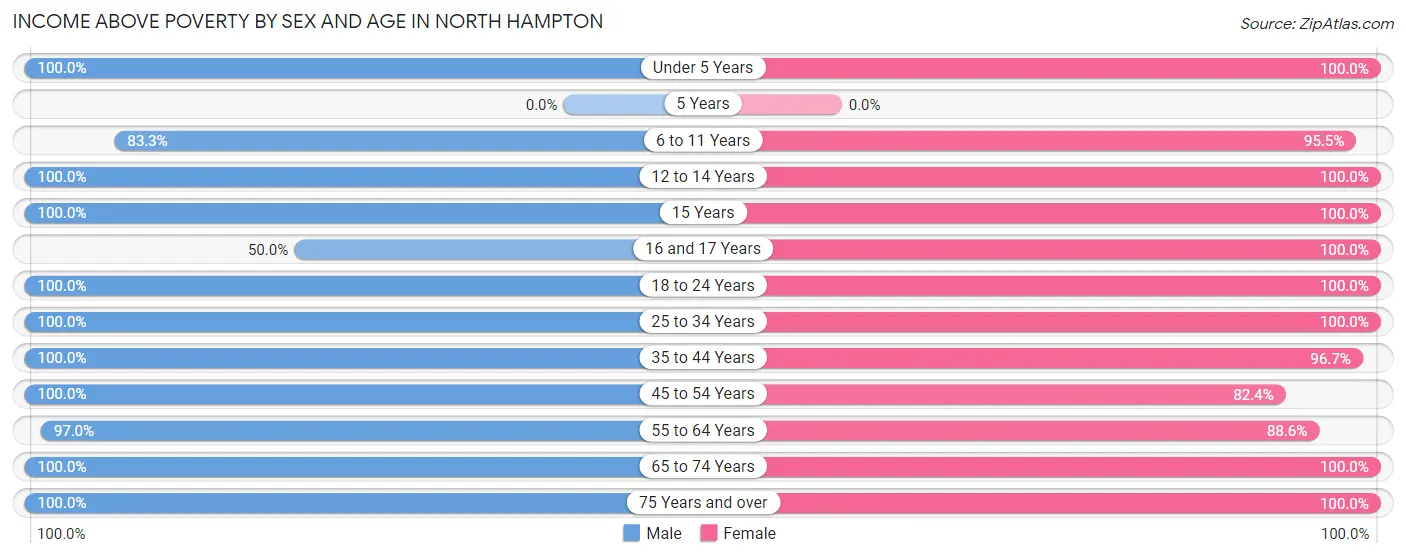
| Age Bracket | Male | Female |
| Under 5 Years | 8 (100.0%) | 1 (100.0%) |
| 5 Years | 0 (0.0%) | 0 (0.0%) |
| 6 to 11 Years | 10 (83.3%) | 21 (95.5%) |
| 12 to 14 Years | 7 (100.0%) | 5 (100.0%) |
| 15 Years | 8 (100.0%) | 3 (100.0%) |
| 16 and 17 Years | 2 (50.0%) | 6 (100.0%) |
| 18 to 24 Years | 16 (100.0%) | 10 (100.0%) |
| 25 to 34 Years | 14 (100.0%) | 17 (100.0%) |
| 35 to 44 Years | 20 (100.0%) | 29 (96.7%) |
| 45 to 54 Years | 41 (100.0%) | 28 (82.4%) |
| 55 to 64 Years | 32 (97.0%) | 31 (88.6%) |
| 65 to 74 Years | 11 (100.0%) | 24 (100.0%) |
| 75 Years and over | 18 (100.0%) | 18 (100.0%) |
| Total | 187 (97.4%) | 193 (94.2%) |
Income Below Poverty Among Married-Couple Families in North Hampton
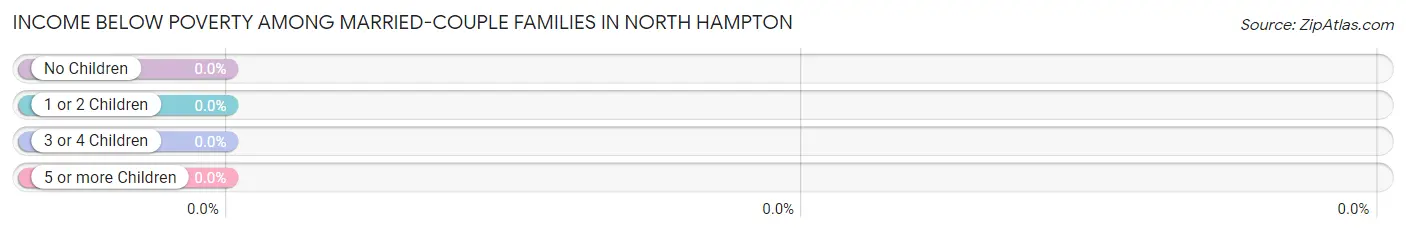
| Children | Above Poverty | Below Poverty |
| No Children | 64 (100.0%) | 0 (0.0%) |
| 1 or 2 Children | 11 (100.0%) | 0 (0.0%) |
| 3 or 4 Children | 5 (100.0%) | 0 (0.0%) |
| 5 or more Children | 0 (0.0%) | 0 (0.0%) |
| Total | 80 (100.0%) | 0 (0.0%) |
Income Below Poverty Among Single-Parent Households in North Hampton
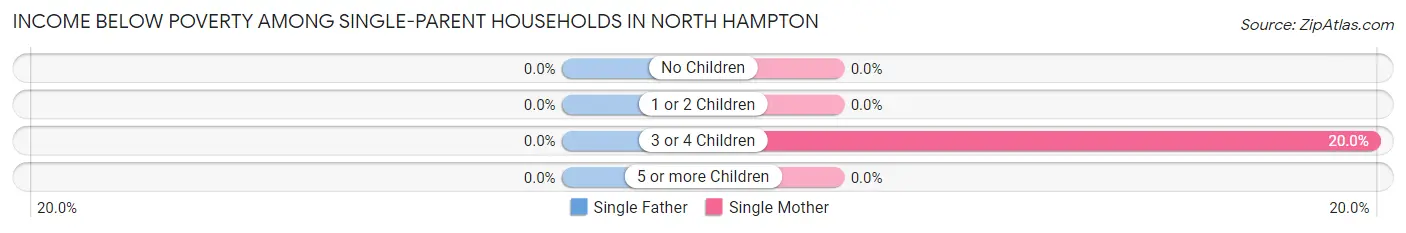
| Children | Single Father | Single Mother |
| No Children | 0 (0.0%) | 0 (0.0%) |
| 1 or 2 Children | 0 (0.0%) | 0 (0.0%) |
| 3 or 4 Children | 0 (0.0%) | 1 (20.0%) |
| 5 or more Children | 0 (0.0%) | 0 (0.0%) |
| Total | 0 (0.0%) | 1 (5.6%) |
Income Below Poverty Among Married-Couple vs Single-Parent Households in North Hampton
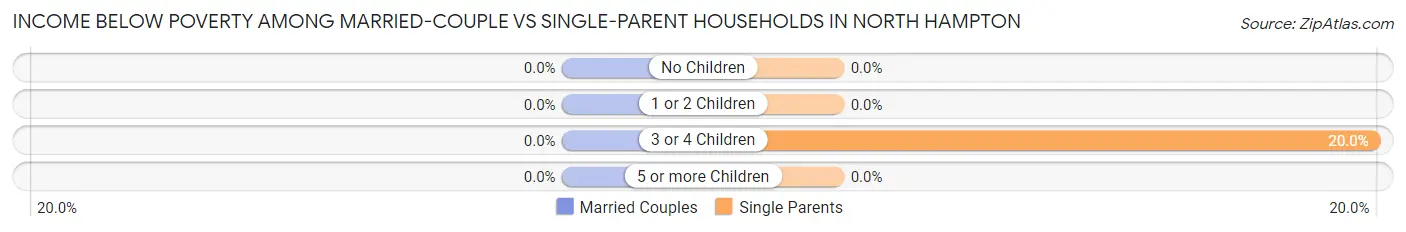
| Children | Married-Couple Families | Single-Parent Households |
| No Children | 0 (0.0%) | 0 (0.0%) |
| 1 or 2 Children | 0 (0.0%) | 0 (0.0%) |
| 3 or 4 Children | 0 (0.0%) | 1 (20.0%) |
| 5 or more Children | 0 (0.0%) | 0 (0.0%) |
| Total | 0 (0.0%) | 1 (3.5%) |
Race in North Hampton
The most populous races in North Hampton are White / Caucasian (393 | 99.0%), Hispanic or Latino (6 | 1.5%), and Two or more Races (4 | 1.0%).
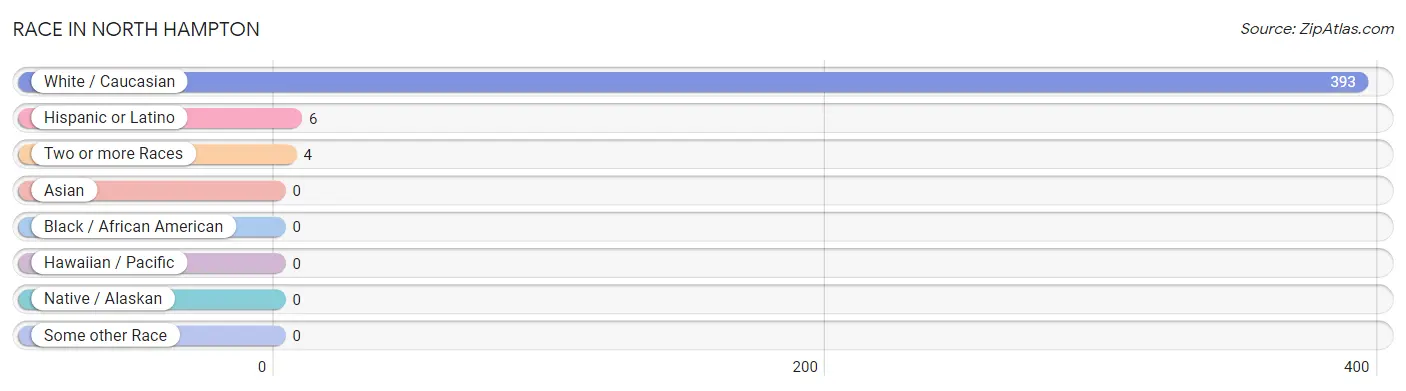
| Race | # Population | % Population |
| Asian | 0 | 0.0% |
| Black / African American | 0 | 0.0% |
| Hawaiian / Pacific | 0 | 0.0% |
| Hispanic or Latino | 6 | 1.5% |
| Native / Alaskan | 0 | 0.0% |
| White / Caucasian | 393 | 99.0% |
| Two or more Races | 4 | 1.0% |
| Some other Race | 0 | 0.0% |
| Total | 397 | 100.0% |
Ancestry in North Hampton
The most populous ancestries reported in North Hampton are German (117 | 29.5%), English (70 | 17.6%), Irish (61 | 15.4%), American (43 | 10.8%), and European (23 | 5.8%), together accounting for 79.1% of all North Hampton residents.
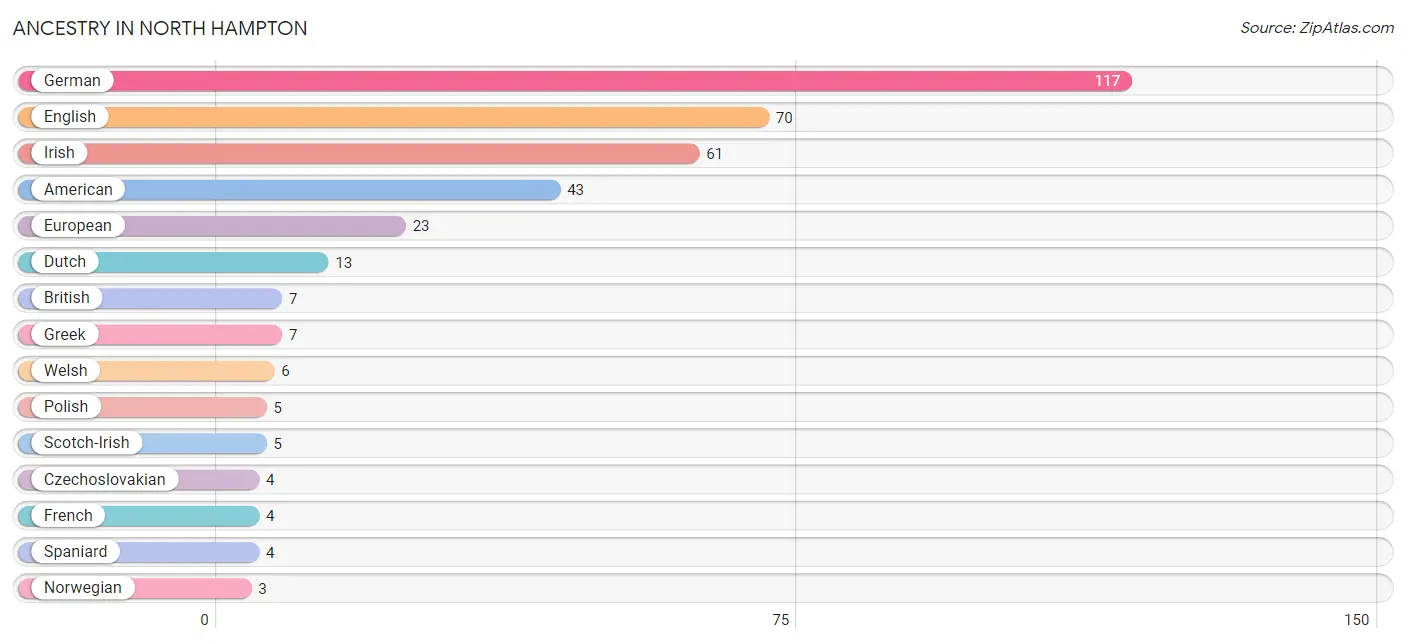
| Ancestry | # Population | % Population |
| American | 43 | 10.8% |
| British | 7 | 1.8% |
| Czechoslovakian | 4 | 1.0% |
| Dutch | 13 | 3.3% |
| English | 70 | 17.6% |
| European | 23 | 5.8% |
| French | 4 | 1.0% |
| German | 117 | 29.5% |
| Greek | 7 | 1.8% |
| Irish | 61 | 15.4% |
| Italian | 2 | 0.5% |
| Mexican | 1 | 0.3% |
| Northern European | 1 | 0.3% |
| Norwegian | 3 | 0.8% |
| Polish | 5 | 1.3% |
| Puerto Rican | 1 | 0.3% |
| Scotch-Irish | 5 | 1.3% |
| Scottish | 2 | 0.5% |
| Spaniard | 4 | 1.0% |
| Trinidadian and Tobagonian | 2 | 0.5% |
| Welsh | 6 | 1.5% | View All 21 Rows |
Immigrants in North Hampton

| Immigration Origin | # Population | % Population | View All 0 Rows |
Sex and Age in North Hampton
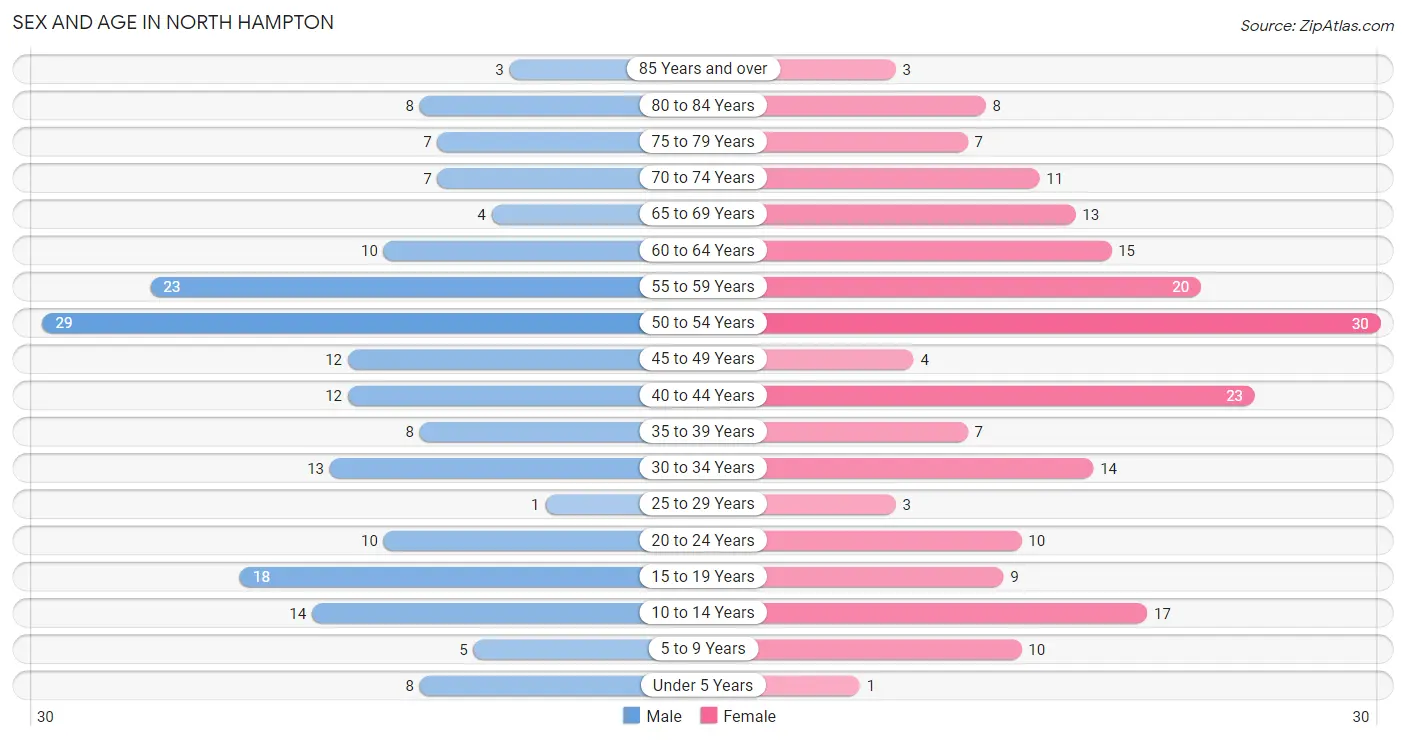
Sex and Age in North Hampton
The most populous age groups in North Hampton are 50 to 54 Years (29 | 15.1%) for men and 50 to 54 Years (30 | 14.6%) for women.
| Age Bracket | Male | Female |
| Under 5 Years | 8 (4.2%) | 1 (0.5%) |
| 5 to 9 Years | 5 (2.6%) | 10 (4.9%) |
| 10 to 14 Years | 14 (7.3%) | 17 (8.3%) |
| 15 to 19 Years | 18 (9.4%) | 9 (4.4%) |
| 20 to 24 Years | 10 (5.2%) | 10 (4.9%) |
| 25 to 29 Years | 1 (0.5%) | 3 (1.5%) |
| 30 to 34 Years | 13 (6.8%) | 14 (6.8%) |
| 35 to 39 Years | 8 (4.2%) | 7 (3.4%) |
| 40 to 44 Years | 12 (6.2%) | 23 (11.2%) |
| 45 to 49 Years | 12 (6.2%) | 4 (1.9%) |
| 50 to 54 Years | 29 (15.1%) | 30 (14.6%) |
| 55 to 59 Years | 23 (12.0%) | 20 (9.8%) |
| 60 to 64 Years | 10 (5.2%) | 15 (7.3%) |
| 65 to 69 Years | 4 (2.1%) | 13 (6.3%) |
| 70 to 74 Years | 7 (3.6%) | 11 (5.4%) |
| 75 to 79 Years | 7 (3.6%) | 7 (3.4%) |
| 80 to 84 Years | 8 (4.2%) | 8 (3.9%) |
| 85 Years and over | 3 (1.6%) | 3 (1.5%) |
| Total | 192 (100.0%) | 205 (100.0%) |
Families and Households in North Hampton
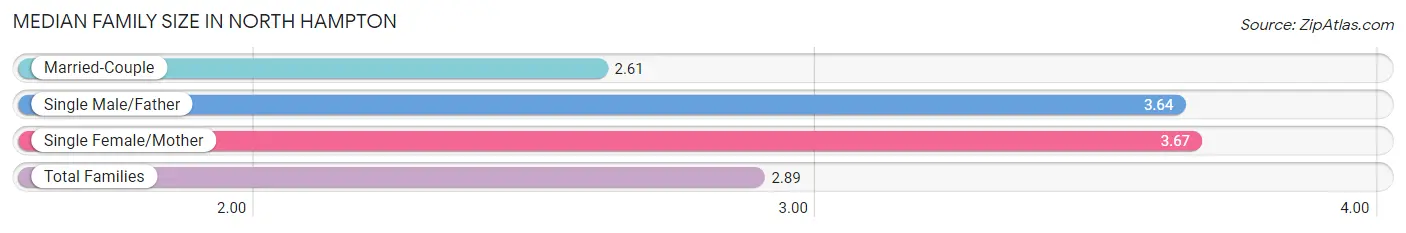
Median Family Size in North Hampton
The median family size in North Hampton is 2.89 persons per family, with single female/mother families (18 | 16.5%) accounting for the largest median family size of 3.67 persons per family. On the other hand, married-couple families (80 | 73.4%) represent the smallest median family size with 2.61 persons per family.
| Family Type | # Families | Family Size |
| Married-Couple | 80 (73.4%) | 2.61 |
| Single Male/Father | 11 (10.1%) | 3.64 |
| Single Female/Mother | 18 (16.5%) | 3.67 |
| Total Families | 109 (100.0%) | 2.89 |
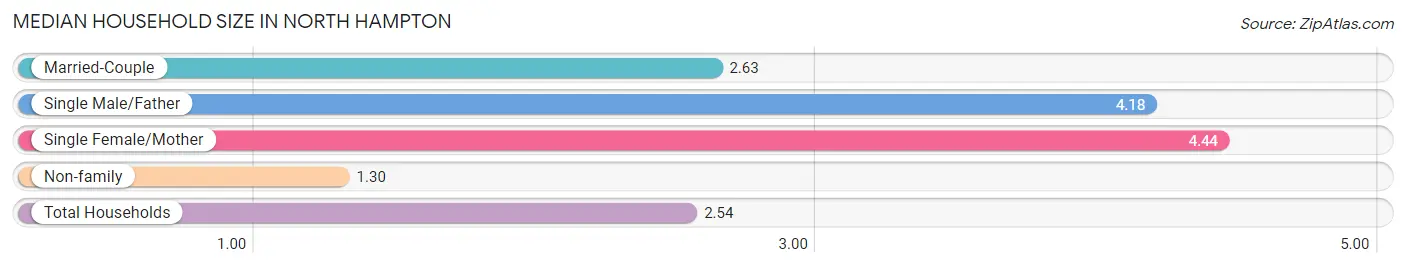
Median Household Size in North Hampton
The median household size in North Hampton is 2.54 persons per household, with single female/mother households (18 | 11.5%) accounting for the largest median household size of 4.44 persons per household. non-family households (47 | 30.1%) represent the smallest median household size with 1.30 persons per household.
| Household Type | # Households | Household Size |
| Married-Couple | 80 (51.3%) | 2.63 |
| Single Male/Father | 11 (7.0%) | 4.18 |
| Single Female/Mother | 18 (11.5%) | 4.44 |
| Non-family | 47 (30.1%) | 1.30 |
| Total Households | 156 (100.0%) | 2.54 |
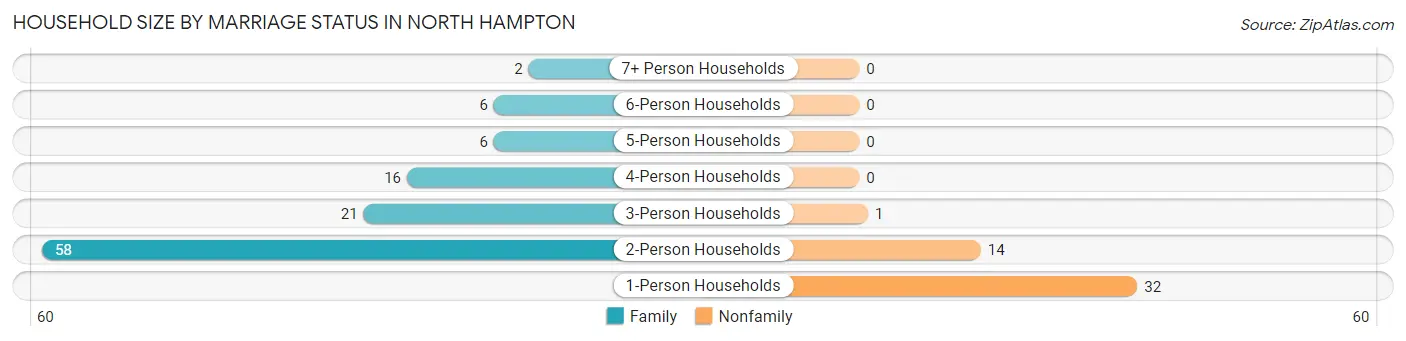
Household Size by Marriage Status in North Hampton
Out of a total of 156 households in North Hampton, 109 (69.9%) are family households, while 47 (30.1%) are nonfamily households. The most numerous type of family households are 2-person households, comprising 58, and the most common type of nonfamily households are 1-person households, comprising 32.
| Household Size | Family Households | Nonfamily Households |
| 1-Person Households | - | 32 (20.5%) |
| 2-Person Households | 58 (37.2%) | 14 (9.0%) |
| 3-Person Households | 21 (13.5%) | 1 (0.6%) |
| 4-Person Households | 16 (10.3%) | 0 (0.0%) |
| 5-Person Households | 6 (3.8%) | 0 (0.0%) |
| 6-Person Households | 6 (3.8%) | 0 (0.0%) |
| 7+ Person Households | 2 (1.3%) | 0 (0.0%) |
| Total | 109 (69.9%) | 47 (30.1%) |
Female Fertility in North Hampton
Fertility by Age in North Hampton
Average fertility rate in North Hampton is 39.0 births per 1,000 women. Women in the age bracket of 20 to 34 years have the highest fertility rate with 111.0 births per 1,000 women. Women in the age bracket of 20 to 34 years acount for 100.0% of all women with births.
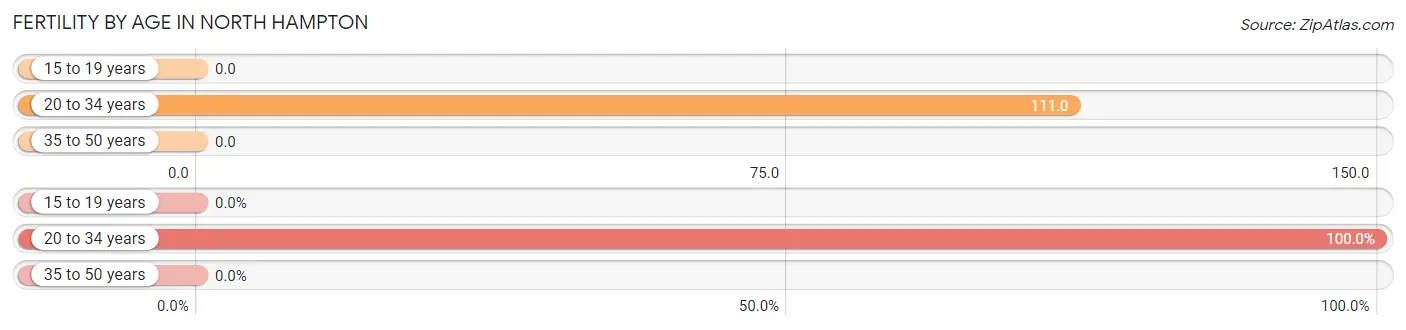
| Age Bracket | Women with Births | Births / 1,000 Women |
| 15 to 19 years | 0 (0.0%) | 0.0 |
| 20 to 34 years | 3 (100.0%) | 111.0 |
| 35 to 50 years | 0 (0.0%) | 0.0 |
| Total | 3 (100.0%) | 39.0 |
Fertility by Age by Marriage Status in North Hampton
33.3% of women with births (3) in North Hampton are married. The highest percentage of unmarried women with births falls into 20 to 34 years age bracket with 66.7% of them unmarried at the time of birth, while the lowest percentage of unmarried women with births belong to 20 to 34 years age bracket with 66.7% of them unmarried.
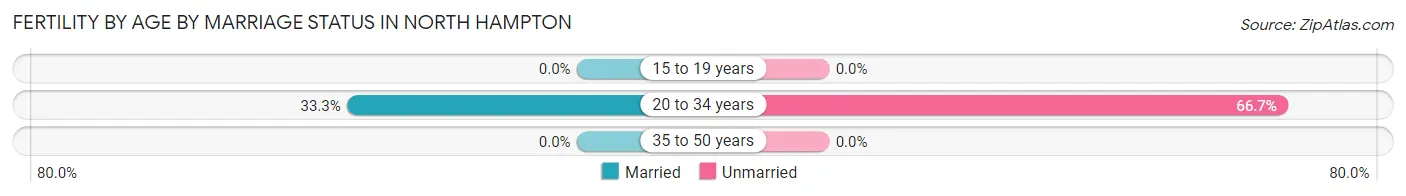
| Age Bracket | Married | Unmarried |
| 15 to 19 years | 0 (0.0%) | 0 (0.0%) |
| 20 to 34 years | 1 (33.3%) | 2 (66.7%) |
| 35 to 50 years | 0 (0.0%) | 0 (0.0%) |
| Total | 1 (33.3%) | 2 (66.7%) |
Fertility by Education in North Hampton
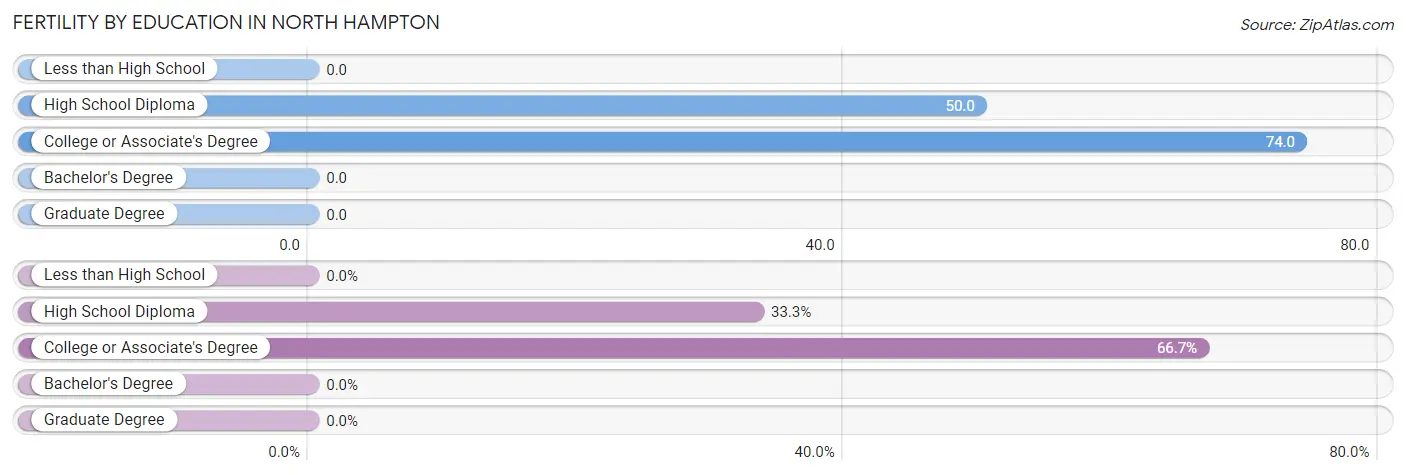
| Educational Attainment | Women with Births | Births / 1,000 Women |
| Less than High School | 0 (0.0%) | 0.0 |
| High School Diploma | 1 (33.3%) | 50.0 |
| College or Associate's Degree | 2 (66.7%) | 74.0 |
| Bachelor's Degree | 0 (0.0%) | 0.0 |
| Graduate Degree | 0 (0.0%) | 0.0 |
| Total | 3 (100.0%) | 39.0 |
Fertility by Education by Marriage Status in North Hampton
66.7% of women with births in North Hampton are unmarried. Women with the educational attainment of high school diploma are most likely to be married with 100.0% of them married at childbirth, while women with the educational attainment of college or associate's degree are least likely to be married with 100.0% of them unmarried at childbirth.
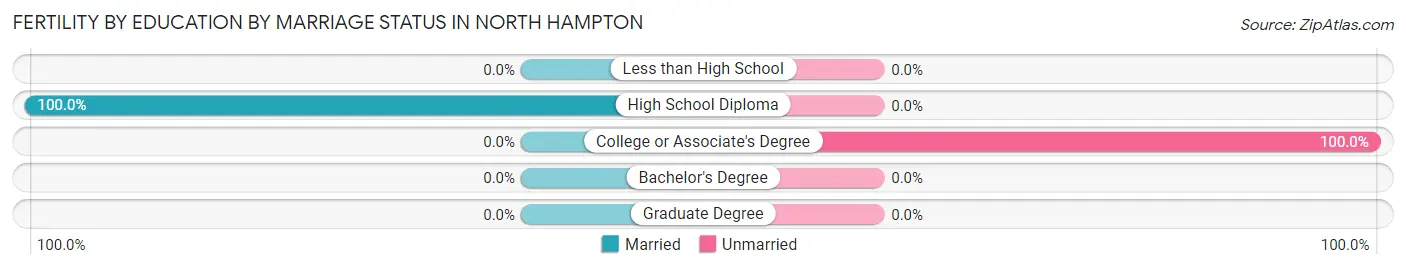
| Educational Attainment | Married | Unmarried |
| Less than High School | 0 (0.0%) | 0 (0.0%) |
| High School Diploma | 1 (100.0%) | 0 (0.0%) |
| College or Associate's Degree | 0 (0.0%) | 2 (100.0%) |
| Bachelor's Degree | 0 (0.0%) | 0 (0.0%) |
| Graduate Degree | 0 (0.0%) | 0 (0.0%) |
| Total | 1 (33.3%) | 2 (66.7%) |
Employment Characteristics in North Hampton
Employment by Class of Employer in North Hampton
Among the 200 employed individuals in North Hampton, private company employees (129 | 64.5%), not-for-profit organizations (29 | 14.5%), and local government employees (27 | 13.5%) make up the most common classes of employment.
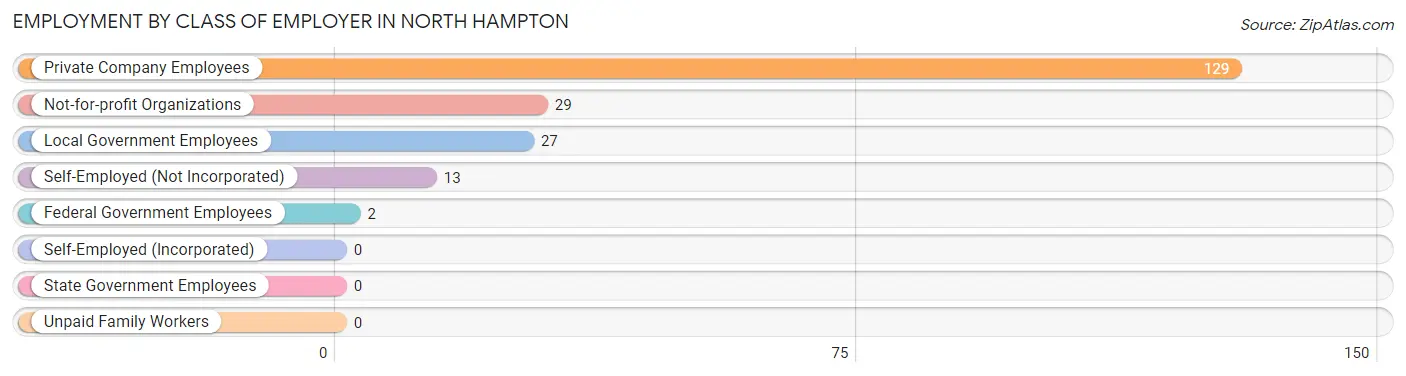
| Employer Class | # Employees | % Employees |
| Private Company Employees | 129 | 64.5% |
| Self-Employed (Incorporated) | 0 | 0.0% |
| Self-Employed (Not Incorporated) | 13 | 6.5% |
| Not-for-profit Organizations | 29 | 14.5% |
| Local Government Employees | 27 | 13.5% |
| State Government Employees | 0 | 0.0% |
| Federal Government Employees | 2 | 1.0% |
| Unpaid Family Workers | 0 | 0.0% |
| Total | 200 | 100.0% |
Employment Status by Age in North Hampton
According to the labor force statistics for North Hampton, out of the total population over 16 years of age (331), 61.9% or 205 individuals are in the labor force, with 1.5% or 3 of them unemployed. The age group with the highest labor force participation rate is 25 to 29 years, with 100.0% or 4 individuals in the labor force. Within the labor force, the 20 to 24 years age range has the highest percentage of unemployed individuals, with 12.5% or 2 of them being unemployed.
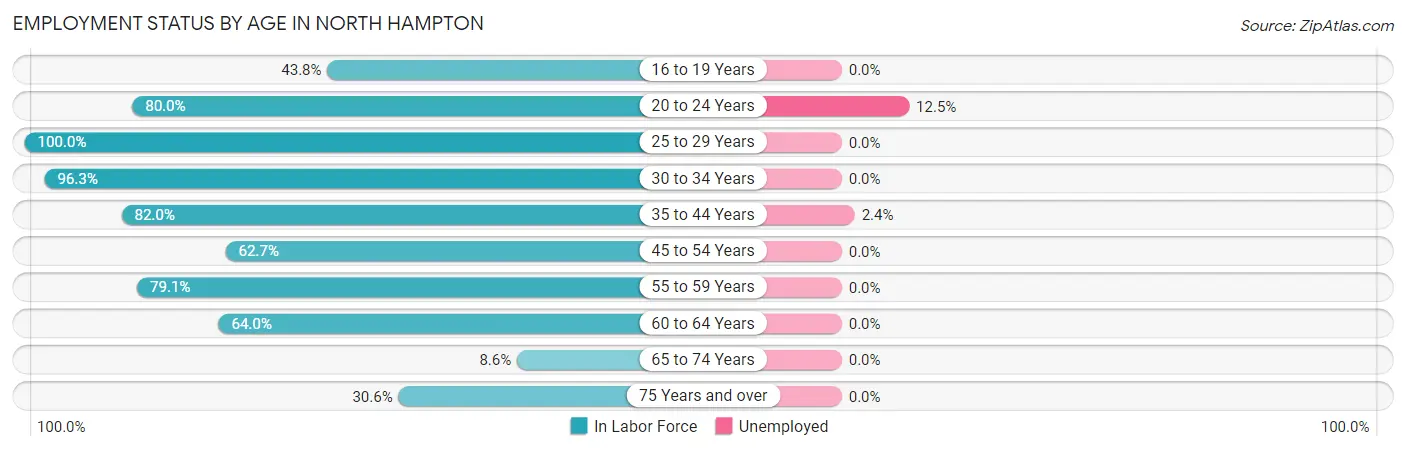
| Age Bracket | In Labor Force | Unemployed |
| 16 to 19 Years | 7 (43.8%) | 0 (0.0%) |
| 20 to 24 Years | 16 (80.0%) | 2 (12.5%) |
| 25 to 29 Years | 4 (100.0%) | 0 (0.0%) |
| 30 to 34 Years | 26 (96.3%) | 0 (0.0%) |
| 35 to 44 Years | 41 (82.0%) | 1 (2.4%) |
| 45 to 54 Years | 47 (62.7%) | 0 (0.0%) |
| 55 to 59 Years | 34 (79.1%) | 0 (0.0%) |
| 60 to 64 Years | 16 (64.0%) | 0 (0.0%) |
| 65 to 74 Years | 3 (8.6%) | 0 (0.0%) |
| 75 Years and over | 11 (30.6%) | 0 (0.0%) |
| Total | 205 (61.9%) | 3 (1.5%) |
Employment Status by Educational Attainment in North Hampton
According to labor force statistics for North Hampton, 75.0% of individuals (168) out of the total population between 25 and 64 years of age (224) are in the labor force, with 0.6% or 1 of them being unemployed. The group with the highest labor force participation rate are those with the educational attainment of college / associate degree, with 86.7% or 78 individuals in the labor force. Within the labor force, individuals with college / associate degree education have the highest percentage of unemployment, with 1.3% or 1 of them being unemployed.
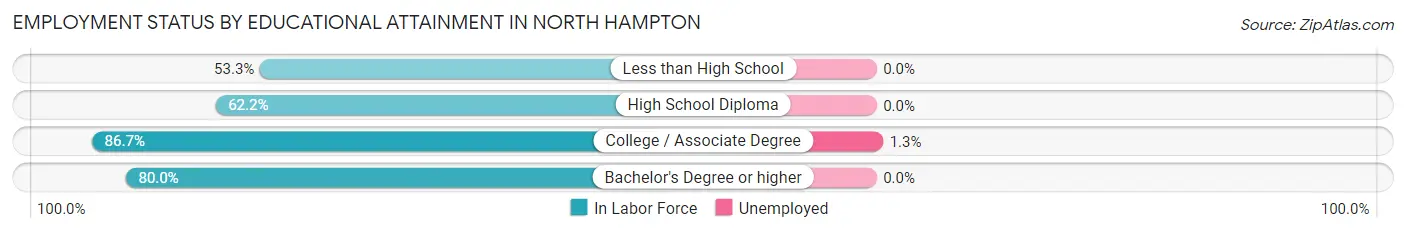
| Educational Attainment | In Labor Force | Unemployed |
| Less than High School | 8 (53.3%) | 0 (0.0%) |
| High School Diploma | 46 (62.2%) | 0 (0.0%) |
| College / Associate Degree | 78 (86.7%) | 1 (1.3%) |
| Bachelor's Degree or higher | 36 (80.0%) | 0 (0.0%) |
| Total | 168 (75.0%) | 1 (0.6%) |
Employment Occupations by Sex in North Hampton
Management, Business, Science and Arts Occupations
The most common Management, Business, Science and Arts occupations in North Hampton are Computers, Engineering & Science (22 | 10.9%), Business & Financial (17 | 8.4%), Computers & Mathematics (16 | 7.9%), Community & Social Service (11 | 5.4%), and Health Diagnosing & Treating (11 | 5.4%).
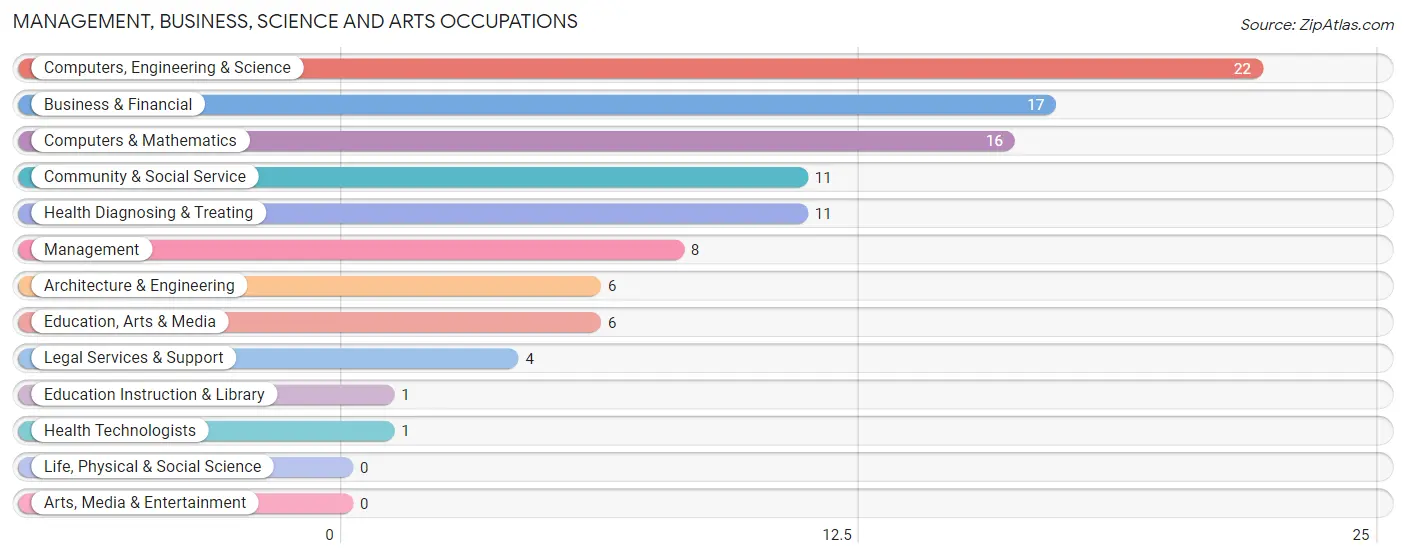
Management, Business, Science and Arts Occupations by Sex
Within the Management, Business, Science and Arts occupations in North Hampton, the most male-oriented occupations are Architecture & Engineering (100.0%), Legal Services & Support (100.0%), and Business & Financial (76.5%), while the most female-oriented occupations are Education, Arts & Media (100.0%), Education Instruction & Library (100.0%), and Health Diagnosing & Treating (100.0%).
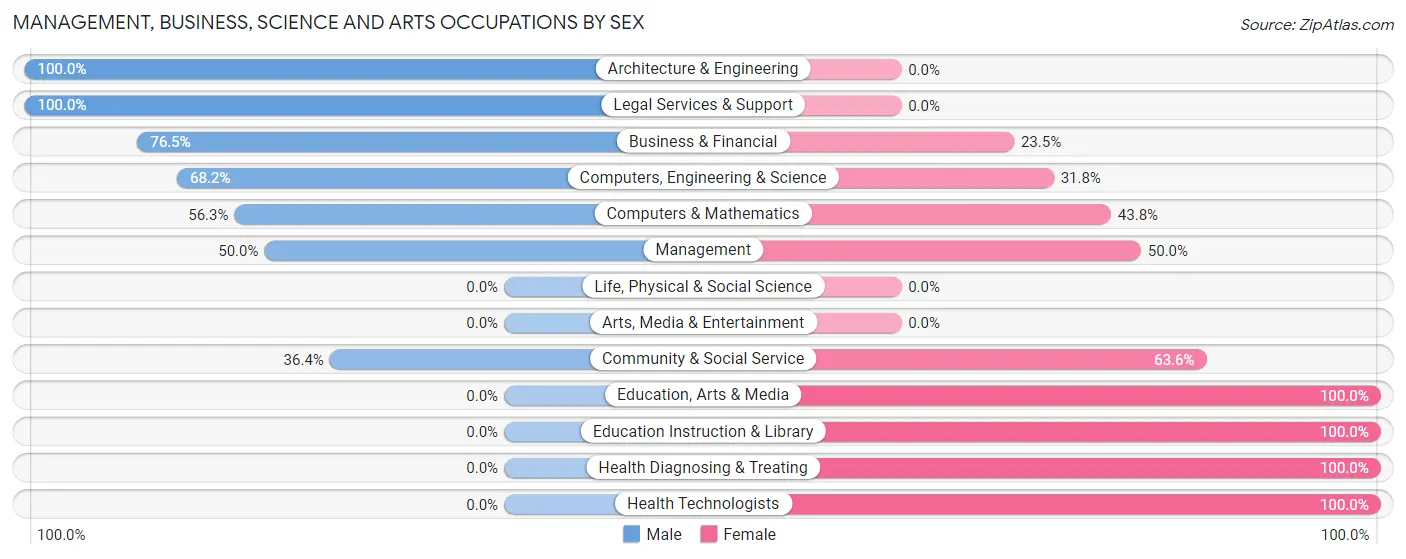
| Occupation | Male | Female |
| Management | 4 (50.0%) | 4 (50.0%) |
| Business & Financial | 13 (76.5%) | 4 (23.5%) |
| Computers, Engineering & Science | 15 (68.2%) | 7 (31.8%) |
| Computers & Mathematics | 9 (56.2%) | 7 (43.8%) |
| Architecture & Engineering | 6 (100.0%) | 0 (0.0%) |
| Life, Physical & Social Science | 0 (0.0%) | 0 (0.0%) |
| Community & Social Service | 4 (36.4%) | 7 (63.6%) |
| Education, Arts & Media | 0 (0.0%) | 6 (100.0%) |
| Legal Services & Support | 4 (100.0%) | 0 (0.0%) |
| Education Instruction & Library | 0 (0.0%) | 1 (100.0%) |
| Arts, Media & Entertainment | 0 (0.0%) | 0 (0.0%) |
| Health Diagnosing & Treating | 0 (0.0%) | 11 (100.0%) |
| Health Technologists | 0 (0.0%) | 1 (100.0%) |
| Total (Category) | 36 (52.2%) | 33 (47.8%) |
| Total (Overall) | 111 (54.9%) | 91 (45.1%) |
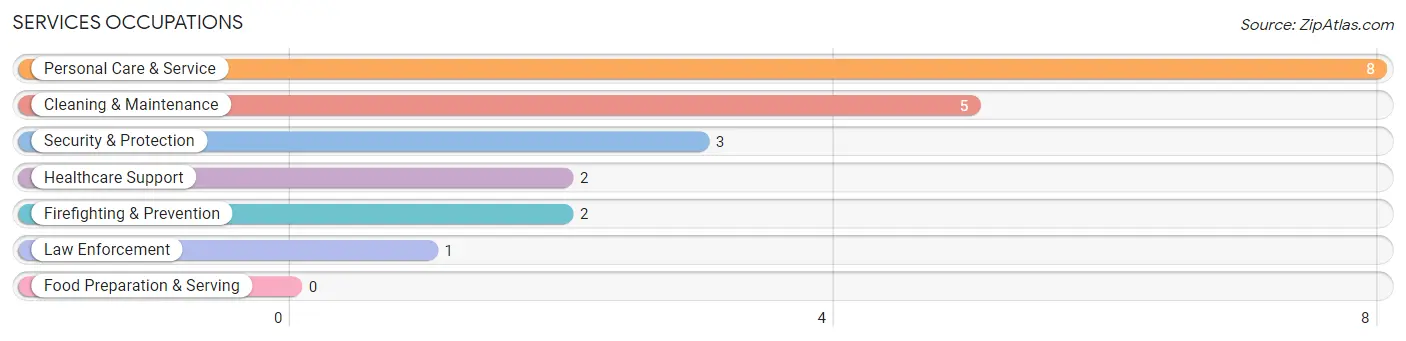
Services Occupations
The most common Services occupations in North Hampton are Personal Care & Service (8 | 4.0%), Cleaning & Maintenance (5 | 2.5%), Security & Protection (3 | 1.5%), Healthcare Support (2 | 1.0%), and Firefighting & Prevention (2 | 1.0%).
Services Occupations by Sex
Within the Services occupations in North Hampton, the most male-oriented occupations are Security & Protection (100.0%), Firefighting & Prevention (100.0%), and Law Enforcement (100.0%), while the most female-oriented occupations are Healthcare Support (100.0%), and Personal Care & Service (100.0%).
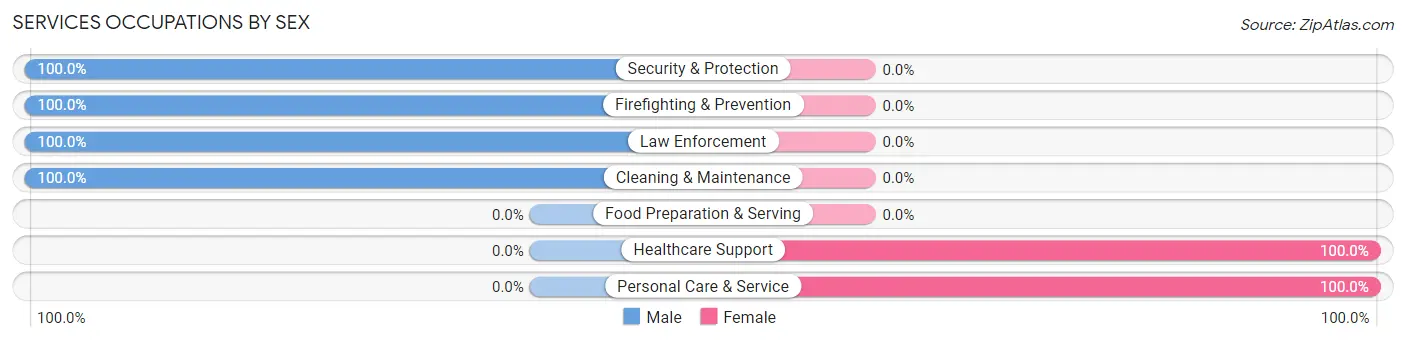
| Occupation | Male | Female |
| Healthcare Support | 0 (0.0%) | 2 (100.0%) |
| Security & Protection | 3 (100.0%) | 0 (0.0%) |
| Firefighting & Prevention | 2 (100.0%) | 0 (0.0%) |
| Law Enforcement | 1 (100.0%) | 0 (0.0%) |
| Food Preparation & Serving | 0 (0.0%) | 0 (0.0%) |
| Cleaning & Maintenance | 5 (100.0%) | 0 (0.0%) |
| Personal Care & Service | 0 (0.0%) | 8 (100.0%) |
| Total (Category) | 8 (44.4%) | 10 (55.6%) |
| Total (Overall) | 111 (54.9%) | 91 (45.1%) |
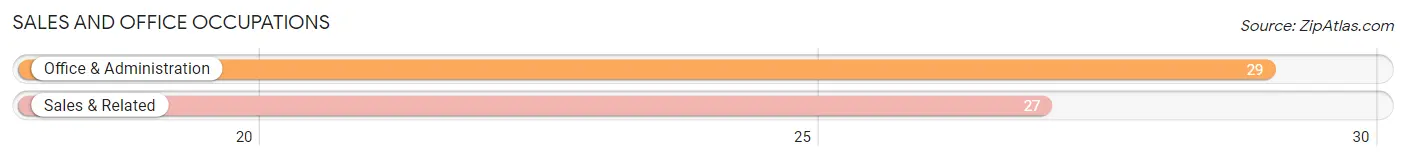
Sales and Office Occupations
The most common Sales and Office occupations in North Hampton are Office & Administration (29 | 14.4%), and Sales & Related (27 | 13.4%).
Sales and Office Occupations by Sex
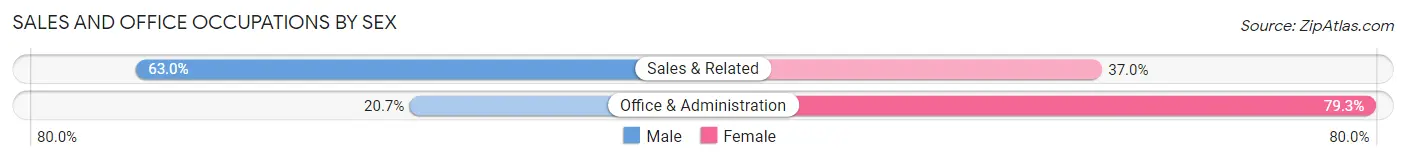
| Occupation | Male | Female |
| Sales & Related | 17 (63.0%) | 10 (37.0%) |
| Office & Administration | 6 (20.7%) | 23 (79.3%) |
| Total (Category) | 23 (41.1%) | 33 (58.9%) |
| Total (Overall) | 111 (54.9%) | 91 (45.1%) |
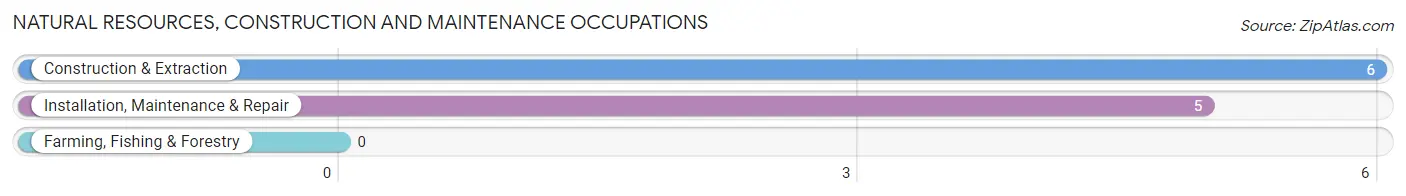
Natural Resources, Construction and Maintenance Occupations
The most common Natural Resources, Construction and Maintenance occupations in North Hampton are Construction & Extraction (6 | 3.0%), and Installation, Maintenance & Repair (5 | 2.5%).
Natural Resources, Construction and Maintenance Occupations by Sex
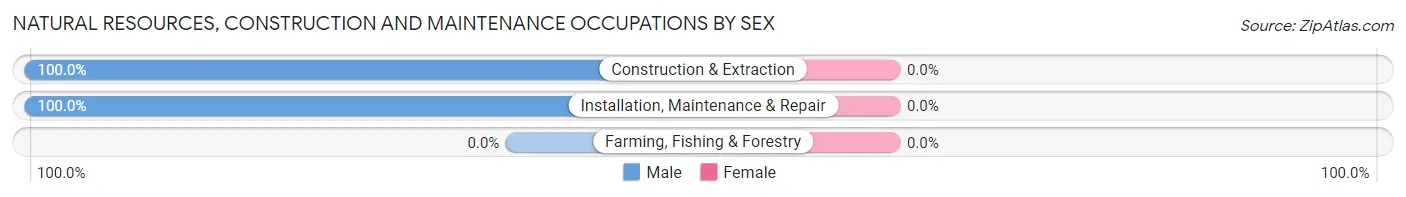
| Occupation | Male | Female |
| Farming, Fishing & Forestry | 0 (0.0%) | 0 (0.0%) |
| Construction & Extraction | 6 (100.0%) | 0 (0.0%) |
| Installation, Maintenance & Repair | 5 (100.0%) | 0 (0.0%) |
| Total (Category) | 11 (100.0%) | 0 (0.0%) |
| Total (Overall) | 111 (54.9%) | 91 (45.1%) |
Production, Transportation and Moving Occupations
The most common Production, Transportation and Moving occupations in North Hampton are Production (17 | 8.4%), Material Moving (16 | 7.9%), and Transportation (15 | 7.4%).
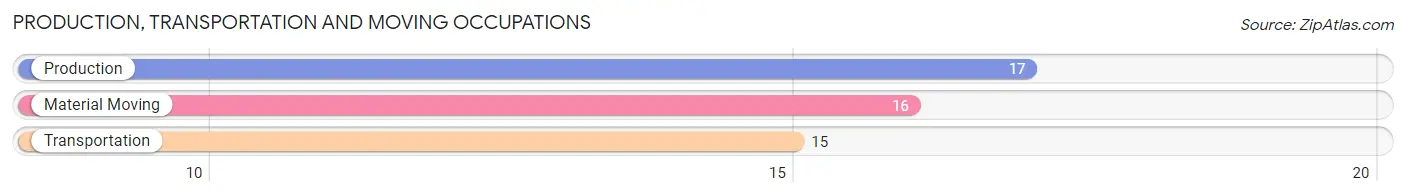
Production, Transportation and Moving Occupations by Sex
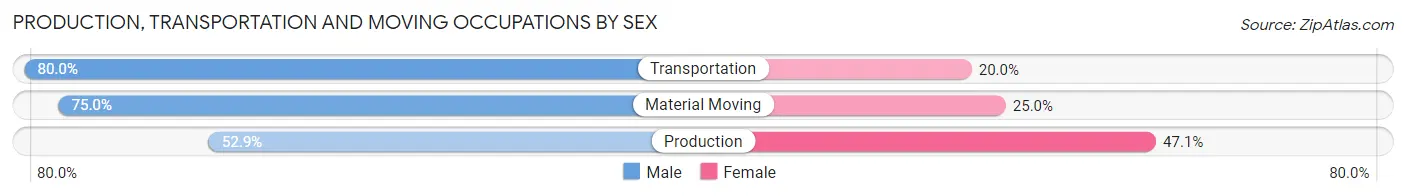
| Occupation | Male | Female |
| Production | 9 (52.9%) | 8 (47.1%) |
| Transportation | 12 (80.0%) | 3 (20.0%) |
| Material Moving | 12 (75.0%) | 4 (25.0%) |
| Total (Category) | 33 (68.8%) | 15 (31.2%) |
| Total (Overall) | 111 (54.9%) | 91 (45.1%) |
Employment Industries by Sex in North Hampton
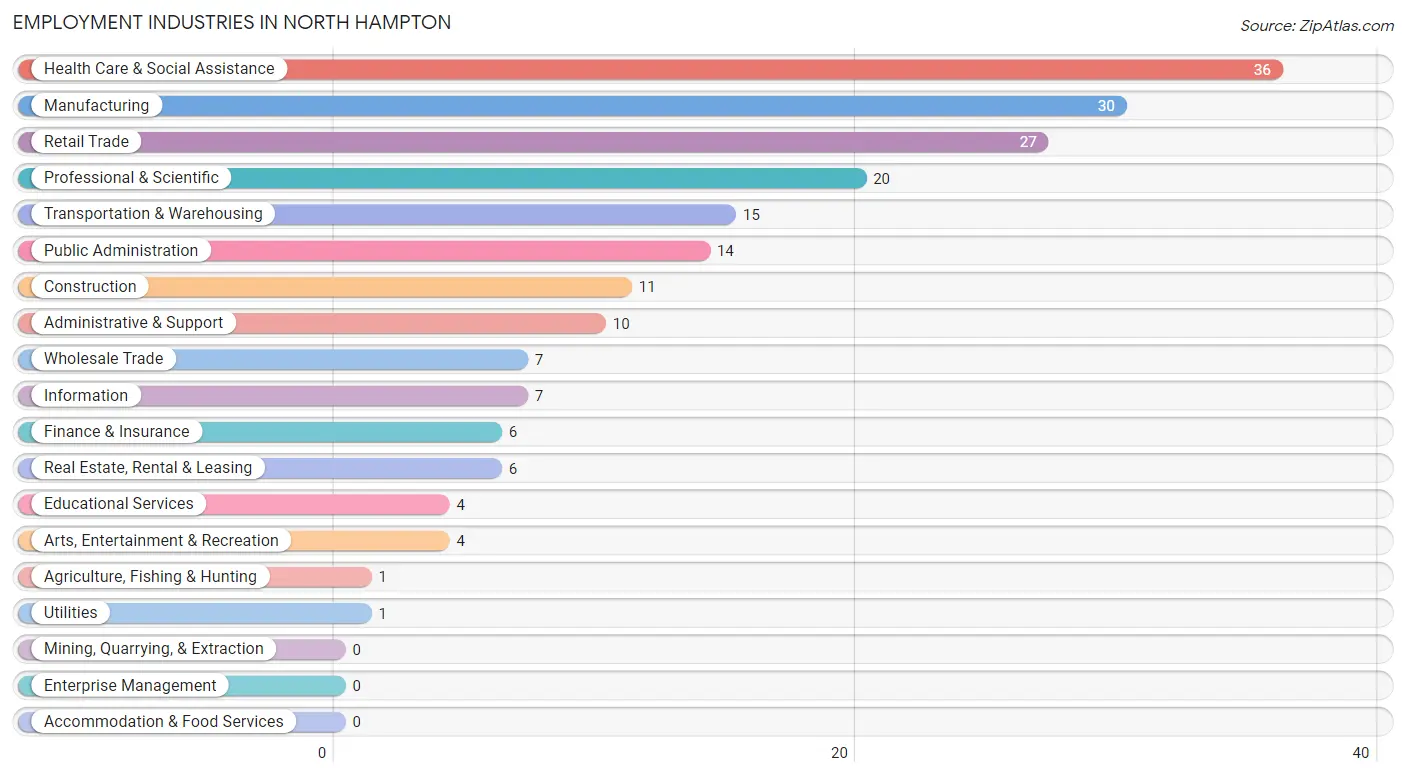
Employment Industries in North Hampton
The major employment industries in North Hampton include Health Care & Social Assistance (36 | 17.8%), Manufacturing (30 | 14.8%), Retail Trade (27 | 13.4%), Professional & Scientific (20 | 9.9%), and Transportation & Warehousing (15 | 7.4%).
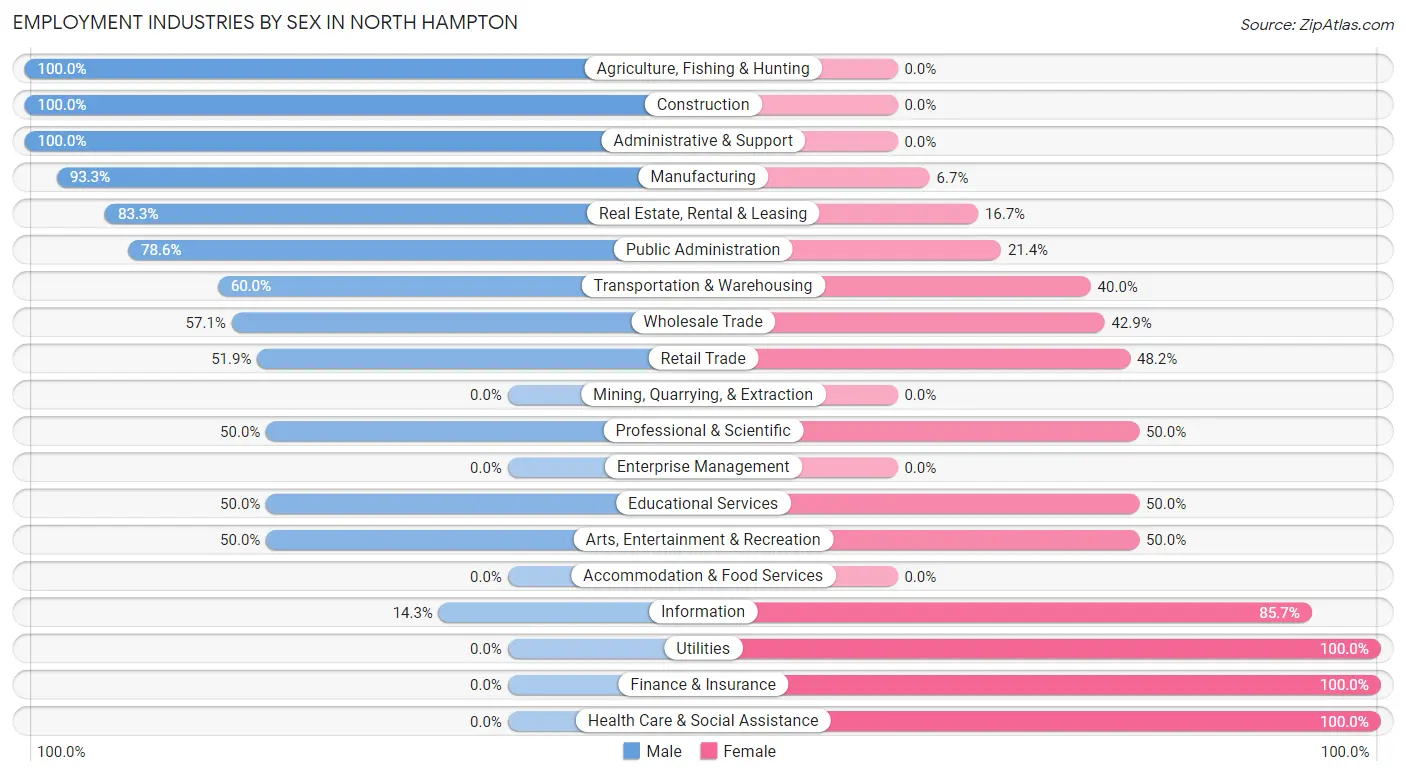
Employment Industries by Sex in North Hampton
The North Hampton industries that see more men than women are Agriculture, Fishing & Hunting (100.0%), Construction (100.0%), and Administrative & Support (100.0%), whereas the industries that tend to have a higher number of women are Utilities (100.0%), Finance & Insurance (100.0%), and Health Care & Social Assistance (100.0%).
| Industry | Male | Female |
| Agriculture, Fishing & Hunting | 1 (100.0%) | 0 (0.0%) |
| Mining, Quarrying, & Extraction | 0 (0.0%) | 0 (0.0%) |
| Construction | 11 (100.0%) | 0 (0.0%) |
| Manufacturing | 28 (93.3%) | 2 (6.7%) |
| Wholesale Trade | 4 (57.1%) | 3 (42.9%) |
| Retail Trade | 14 (51.8%) | 13 (48.1%) |
| Transportation & Warehousing | 9 (60.0%) | 6 (40.0%) |
| Utilities | 0 (0.0%) | 1 (100.0%) |
| Information | 1 (14.3%) | 6 (85.7%) |
| Finance & Insurance | 0 (0.0%) | 6 (100.0%) |
| Real Estate, Rental & Leasing | 5 (83.3%) | 1 (16.7%) |
| Professional & Scientific | 10 (50.0%) | 10 (50.0%) |
| Enterprise Management | 0 (0.0%) | 0 (0.0%) |
| Administrative & Support | 10 (100.0%) | 0 (0.0%) |
| Educational Services | 2 (50.0%) | 2 (50.0%) |
| Health Care & Social Assistance | 0 (0.0%) | 36 (100.0%) |
| Arts, Entertainment & Recreation | 2 (50.0%) | 2 (50.0%) |
| Accommodation & Food Services | 0 (0.0%) | 0 (0.0%) |
| Public Administration | 11 (78.6%) | 3 (21.4%) |
| Total | 111 (54.9%) | 91 (45.1%) |
Education in North Hampton
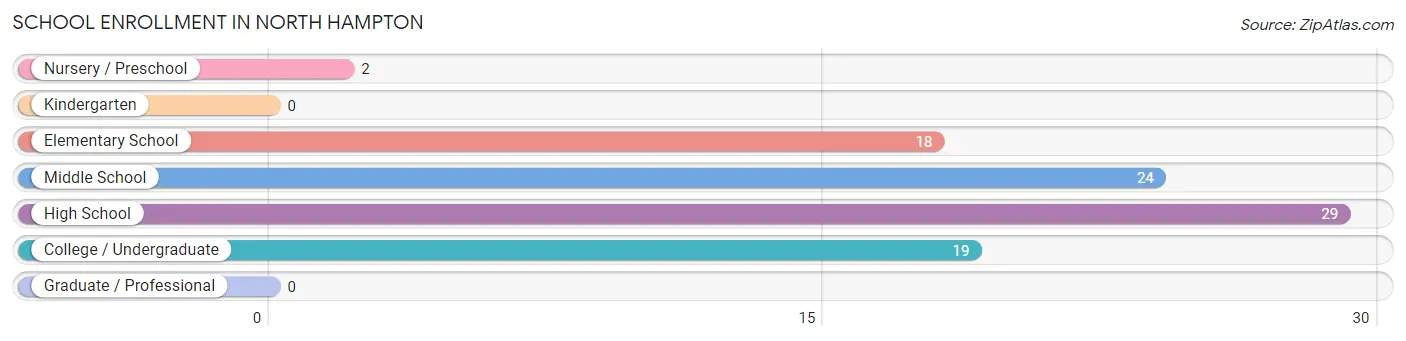
School Enrollment in North Hampton
The most common levels of schooling among the 92 students in North Hampton are high school (29 | 31.5%), middle school (24 | 26.1%), and college / undergraduate (19 | 20.6%).
| School Level | # Students | % Students |
| Nursery / Preschool | 2 | 2.2% |
| Kindergarten | 0 | 0.0% |
| Elementary School | 18 | 19.6% |
| Middle School | 24 | 26.1% |
| High School | 29 | 31.5% |
| College / Undergraduate | 19 | 20.6% |
| Graduate / Professional | 0 | 0.0% |
| Total | 92 | 100.0% |
School Enrollment by Age by Funding Source in North Hampton
Out of a total of 92 students who are enrolled in schools in North Hampton, 16 (17.4%) attend a private institution, while the remaining 76 (82.6%) are enrolled in public schools. The age group of 3 to 4 year olds has the highest likelihood of being enrolled in private schools, with 2 (100.0% in the age bracket) enrolled. Conversely, the age group of 5 to 9 year old has the lowest likelihood of being enrolled in a private school, with 11 (100.0% in the age bracket) attending a public institution.
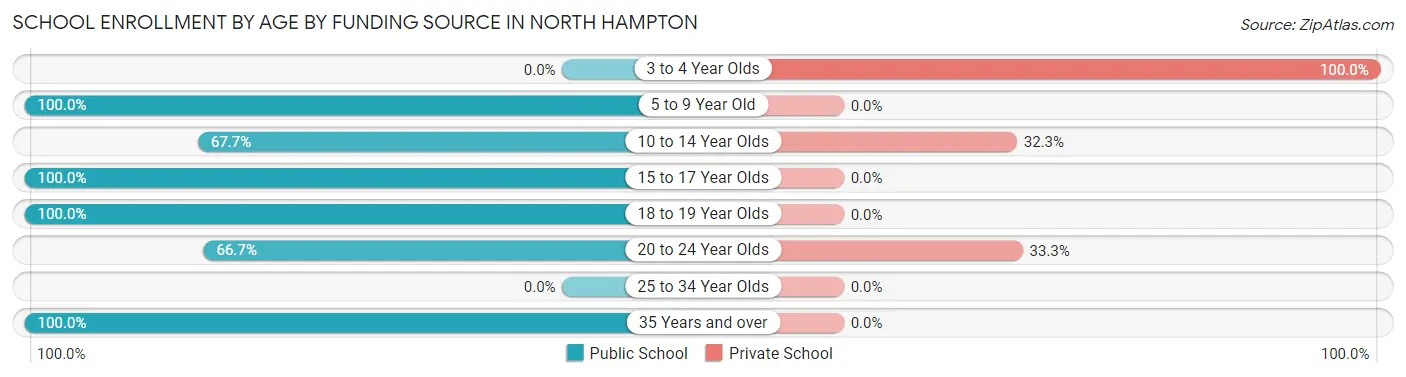
| Age Bracket | Public School | Private School |
| 3 to 4 Year Olds | 0 (0.0%) | 2 (100.0%) |
| 5 to 9 Year Old | 11 (100.0%) | 0 (0.0%) |
| 10 to 14 Year Olds | 21 (67.7%) | 10 (32.3%) |
| 15 to 17 Year Olds | 21 (100.0%) | 0 (0.0%) |
| 18 to 19 Year Olds | 6 (100.0%) | 0 (0.0%) |
| 20 to 24 Year Olds | 8 (66.7%) | 4 (33.3%) |
| 25 to 34 Year Olds | 0 (0.0%) | 0 (0.0%) |
| 35 Years and over | 9 (100.0%) | 0 (0.0%) |
| Total | 76 (82.6%) | 16 (17.4%) |
Educational Attainment by Field of Study in North Hampton
Business (21 | 38.9%), education (10 | 18.5%), social sciences (6 | 11.1%), engineering (6 | 11.1%), and computers & mathematics (5 | 9.3%) are the most common fields of study among 54 individuals in North Hampton who have obtained a bachelor's degree or higher.
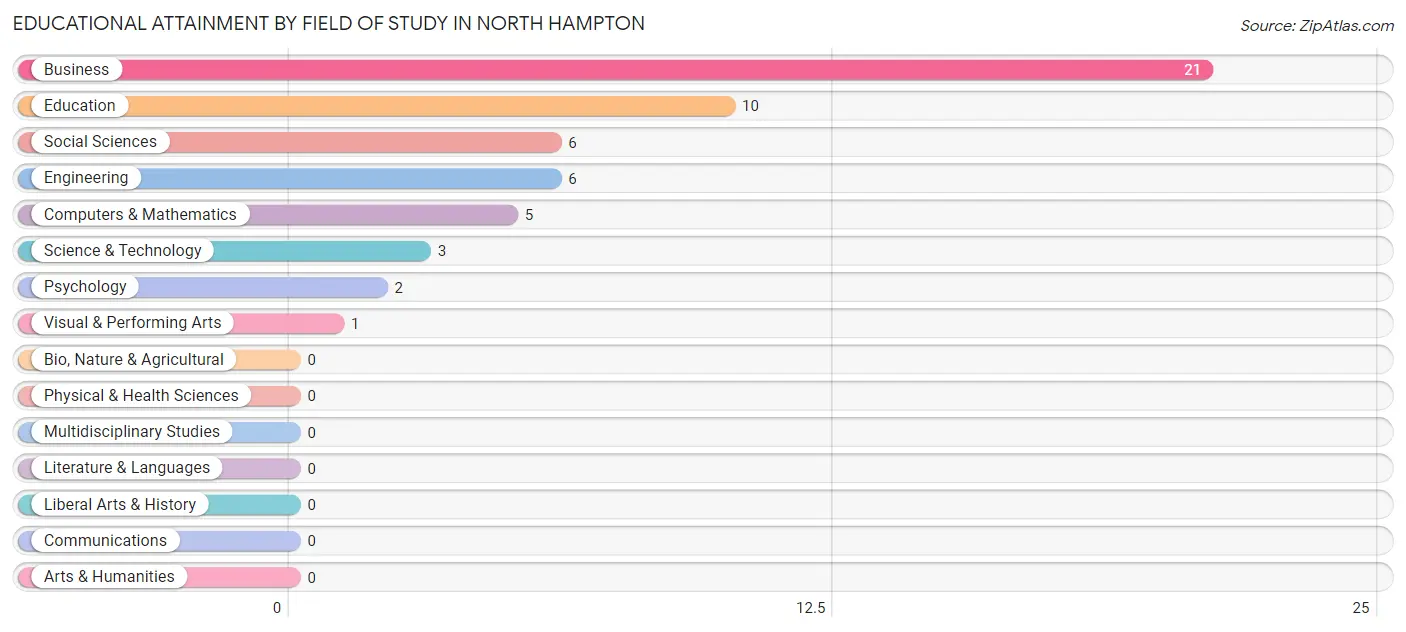
| Field of Study | # Graduates | % Graduates |
| Computers & Mathematics | 5 | 9.3% |
| Bio, Nature & Agricultural | 0 | 0.0% |
| Physical & Health Sciences | 0 | 0.0% |
| Psychology | 2 | 3.7% |
| Social Sciences | 6 | 11.1% |
| Engineering | 6 | 11.1% |
| Multidisciplinary Studies | 0 | 0.0% |
| Science & Technology | 3 | 5.6% |
| Business | 21 | 38.9% |
| Education | 10 | 18.5% |
| Literature & Languages | 0 | 0.0% |
| Liberal Arts & History | 0 | 0.0% |
| Visual & Performing Arts | 1 | 1.8% |
| Communications | 0 | 0.0% |
| Arts & Humanities | 0 | 0.0% |
| Total | 54 | 100.0% |
Transportation & Commute in North Hampton
Vehicle Availability by Sex in North Hampton
The most prevalent vehicle ownership categories in North Hampton are males with 2 vehicles (42, accounting for 38.5%) and females with 2 vehicles (31, making up 46.2%).
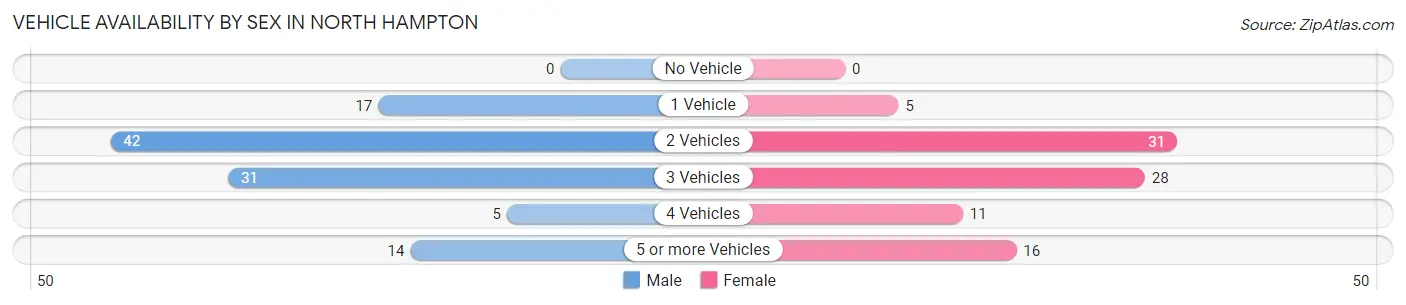
| Vehicles Available | Male | Female |
| No Vehicle | 0 (0.0%) | 0 (0.0%) |
| 1 Vehicle | 17 (15.6%) | 5 (5.5%) |
| 2 Vehicles | 42 (38.5%) | 31 (34.1%) |
| 3 Vehicles | 31 (28.4%) | 28 (30.8%) |
| 4 Vehicles | 5 (4.6%) | 11 (12.1%) |
| 5 or more Vehicles | 14 (12.8%) | 16 (17.6%) |
| Total | 109 (100.0%) | 91 (100.0%) |
Commute Time in North Hampton
The most frequently occuring commute durations in North Hampton are 15 to 19 minutes (45 commuters, 24.1%), 30 to 34 minutes (36 commuters, 19.3%), and 20 to 24 minutes (32 commuters, 17.1%).
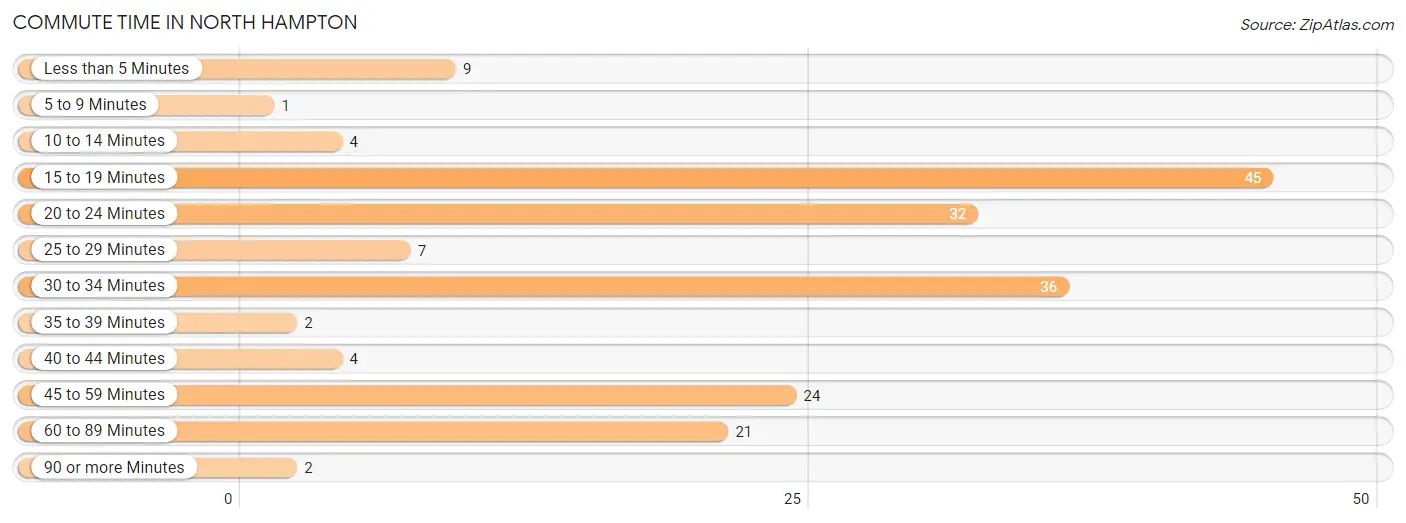
| Commute Time | # Commuters | % Commuters |
| Less than 5 Minutes | 9 | 4.8% |
| 5 to 9 Minutes | 1 | 0.5% |
| 10 to 14 Minutes | 4 | 2.1% |
| 15 to 19 Minutes | 45 | 24.1% |
| 20 to 24 Minutes | 32 | 17.1% |
| 25 to 29 Minutes | 7 | 3.7% |
| 30 to 34 Minutes | 36 | 19.3% |
| 35 to 39 Minutes | 2 | 1.1% |
| 40 to 44 Minutes | 4 | 2.1% |
| 45 to 59 Minutes | 24 | 12.8% |
| 60 to 89 Minutes | 21 | 11.2% |
| 90 or more Minutes | 2 | 1.1% |
Commute Time by Sex in North Hampton
The most common commute times in North Hampton are 30 to 34 minutes (22 commuters, 21.8%) for males and 15 to 19 minutes (36 commuters, 41.9%) for females.
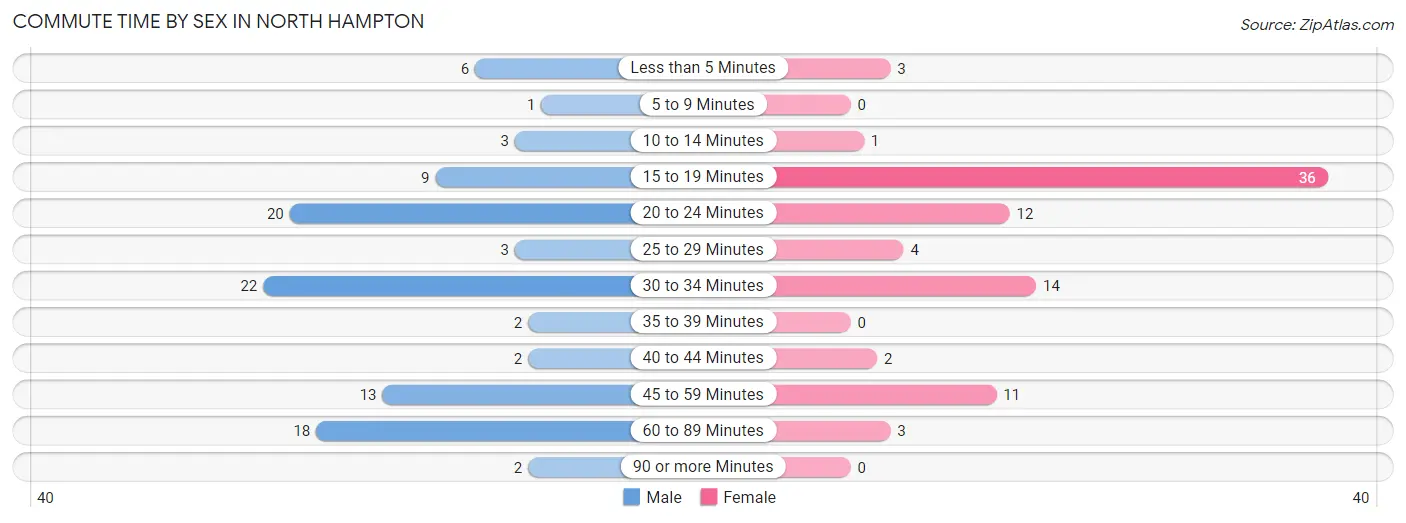
| Commute Time | Male | Female |
| Less than 5 Minutes | 6 (5.9%) | 3 (3.5%) |
| 5 to 9 Minutes | 1 (1.0%) | 0 (0.0%) |
| 10 to 14 Minutes | 3 (3.0%) | 1 (1.2%) |
| 15 to 19 Minutes | 9 (8.9%) | 36 (41.9%) |
| 20 to 24 Minutes | 20 (19.8%) | 12 (14.0%) |
| 25 to 29 Minutes | 3 (3.0%) | 4 (4.6%) |
| 30 to 34 Minutes | 22 (21.8%) | 14 (16.3%) |
| 35 to 39 Minutes | 2 (2.0%) | 0 (0.0%) |
| 40 to 44 Minutes | 2 (2.0%) | 2 (2.3%) |
| 45 to 59 Minutes | 13 (12.9%) | 11 (12.8%) |
| 60 to 89 Minutes | 18 (17.8%) | 3 (3.5%) |
| 90 or more Minutes | 2 (2.0%) | 0 (0.0%) |
Time of Departure to Work by Sex in North Hampton
The most frequent times of departure to work in North Hampton are 6:00 AM to 6:29 AM (16, 15.8%) for males and 6:00 AM to 6:29 AM (22, 25.6%) for females.
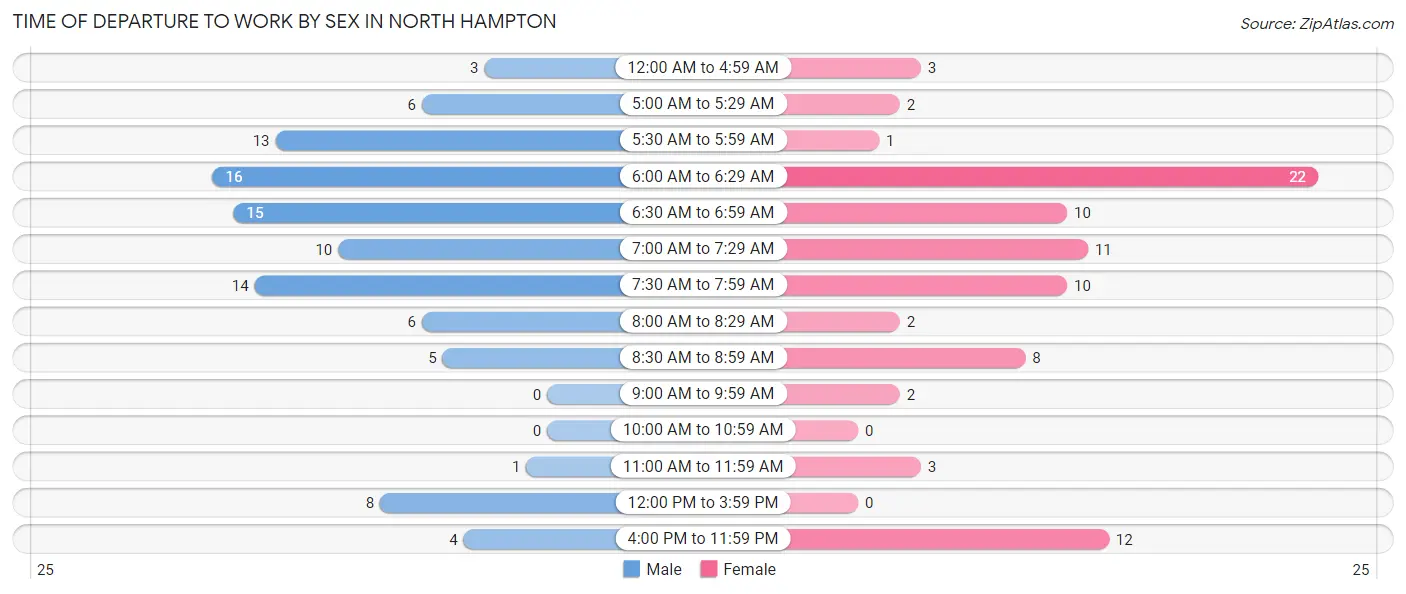
| Time of Departure | Male | Female |
| 12:00 AM to 4:59 AM | 3 (3.0%) | 3 (3.5%) |
| 5:00 AM to 5:29 AM | 6 (5.9%) | 2 (2.3%) |
| 5:30 AM to 5:59 AM | 13 (12.9%) | 1 (1.2%) |
| 6:00 AM to 6:29 AM | 16 (15.8%) | 22 (25.6%) |
| 6:30 AM to 6:59 AM | 15 (14.8%) | 10 (11.6%) |
| 7:00 AM to 7:29 AM | 10 (9.9%) | 11 (12.8%) |
| 7:30 AM to 7:59 AM | 14 (13.9%) | 10 (11.6%) |
| 8:00 AM to 8:29 AM | 6 (5.9%) | 2 (2.3%) |
| 8:30 AM to 8:59 AM | 5 (5.0%) | 8 (9.3%) |
| 9:00 AM to 9:59 AM | 0 (0.0%) | 2 (2.3%) |
| 10:00 AM to 10:59 AM | 0 (0.0%) | 0 (0.0%) |
| 11:00 AM to 11:59 AM | 1 (1.0%) | 3 (3.5%) |
| 12:00 PM to 3:59 PM | 8 (7.9%) | 0 (0.0%) |
| 4:00 PM to 11:59 PM | 4 (4.0%) | 12 (14.0%) |
| Total | 101 (100.0%) | 86 (100.0%) |
Housing Occupancy in North Hampton
Occupancy by Ownership in North Hampton
Of the total 156 dwellings in North Hampton, owner-occupied units account for 134 (85.9%), while renter-occupied units make up 22 (14.1%).
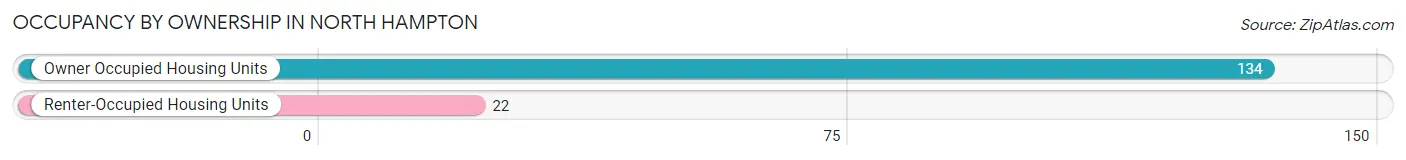
| Occupancy | # Housing Units | % Housing Units |
| Owner Occupied Housing Units | 134 | 85.9% |
| Renter-Occupied Housing Units | 22 | 14.1% |
| Total Occupied Housing Units | 156 | 100.0% |
Occupancy by Household Size in North Hampton
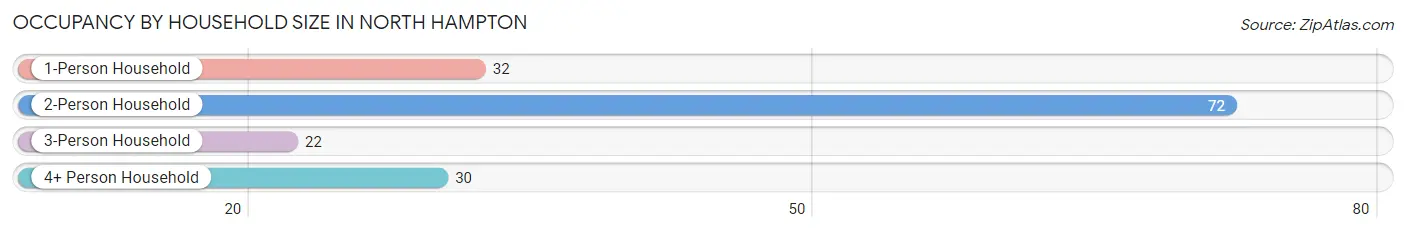
| Household Size | # Housing Units | % Housing Units |
| 1-Person Household | 32 | 20.5% |
| 2-Person Household | 72 | 46.2% |
| 3-Person Household | 22 | 14.1% |
| 4+ Person Household | 30 | 19.2% |
| Total Housing Units | 156 | 100.0% |
Occupancy by Ownership by Household Size in North Hampton
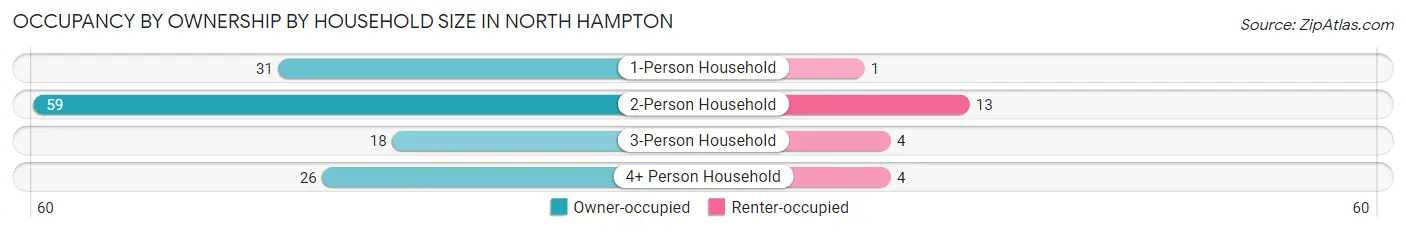
| Household Size | Owner-occupied | Renter-occupied |
| 1-Person Household | 31 (96.9%) | 1 (3.1%) |
| 2-Person Household | 59 (81.9%) | 13 (18.1%) |
| 3-Person Household | 18 (81.8%) | 4 (18.2%) |
| 4+ Person Household | 26 (86.7%) | 4 (13.3%) |
| Total Housing Units | 134 (85.9%) | 22 (14.1%) |
Occupancy by Educational Attainment in North Hampton
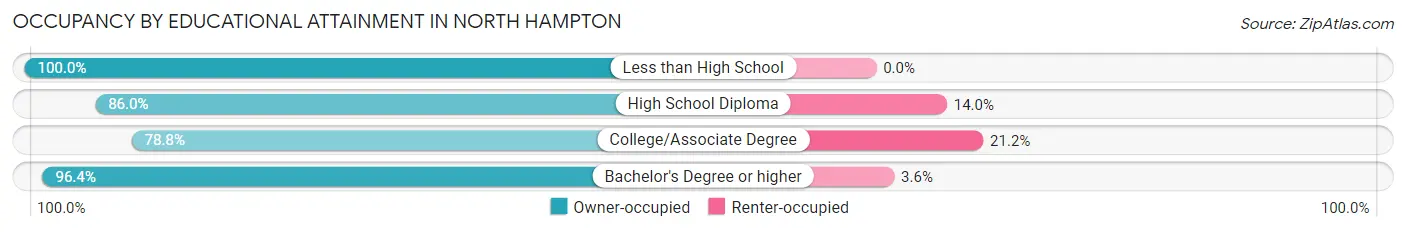
| Household Size | Owner-occupied | Renter-occupied |
| Less than High School | 12 (100.0%) | 0 (0.0%) |
| High School Diploma | 43 (86.0%) | 7 (14.0%) |
| College/Associate Degree | 52 (78.8%) | 14 (21.2%) |
| Bachelor's Degree or higher | 27 (96.4%) | 1 (3.6%) |
Occupancy by Age of Householder in North Hampton
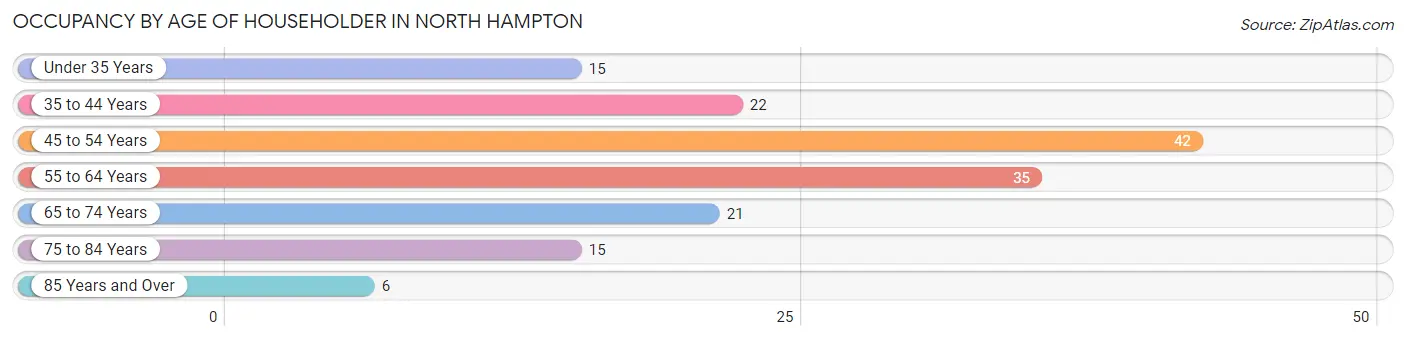
| Age Bracket | # Households | % Households |
| Under 35 Years | 15 | 9.6% |
| 35 to 44 Years | 22 | 14.1% |
| 45 to 54 Years | 42 | 26.9% |
| 55 to 64 Years | 35 | 22.4% |
| 65 to 74 Years | 21 | 13.5% |
| 75 to 84 Years | 15 | 9.6% |
| 85 Years and Over | 6 | 3.8% |
| Total | 156 | 100.0% |
Housing Finances in North Hampton
Median Income by Occupancy in North Hampton
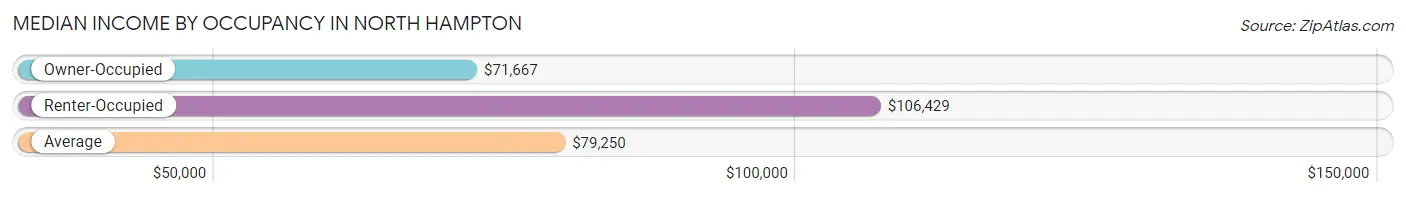
| Occupancy Type | # Households | Median Income |
| Owner-Occupied | 134 (85.9%) | $71,667 |
| Renter-Occupied | 22 (14.1%) | $106,429 |
| Average | 156 (100.0%) | $79,250 |
Occupancy by Householder Income Bracket in North Hampton
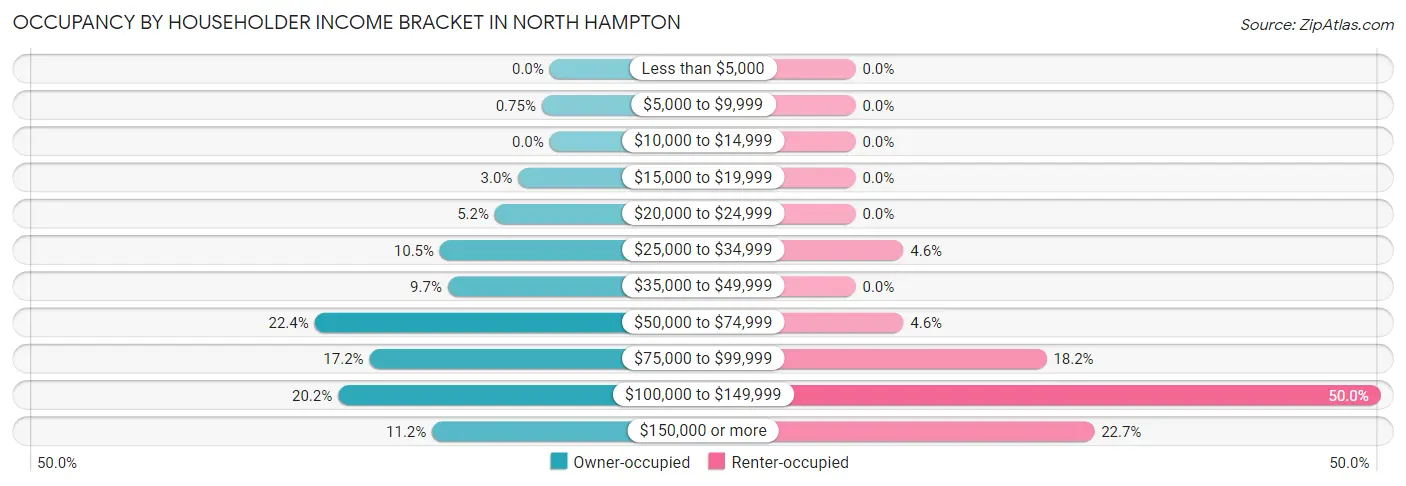
| Income Bracket | Owner-occupied | Renter-occupied |
| Less than $5,000 | 0 (0.0%) | 0 (0.0%) |
| $5,000 to $9,999 | 1 (0.7%) | 0 (0.0%) |
| $10,000 to $14,999 | 0 (0.0%) | 0 (0.0%) |
| $15,000 to $19,999 | 4 (3.0%) | 0 (0.0%) |
| $20,000 to $24,999 | 7 (5.2%) | 0 (0.0%) |
| $25,000 to $34,999 | 14 (10.4%) | 1 (4.5%) |
| $35,000 to $49,999 | 13 (9.7%) | 0 (0.0%) |
| $50,000 to $74,999 | 30 (22.4%) | 1 (4.5%) |
| $75,000 to $99,999 | 23 (17.2%) | 4 (18.2%) |
| $100,000 to $149,999 | 27 (20.2%) | 11 (50.0%) |
| $150,000 or more | 15 (11.2%) | 5 (22.7%) |
| Total | 134 (100.0%) | 22 (100.0%) |
Monthly Housing Cost Tiers in North Hampton
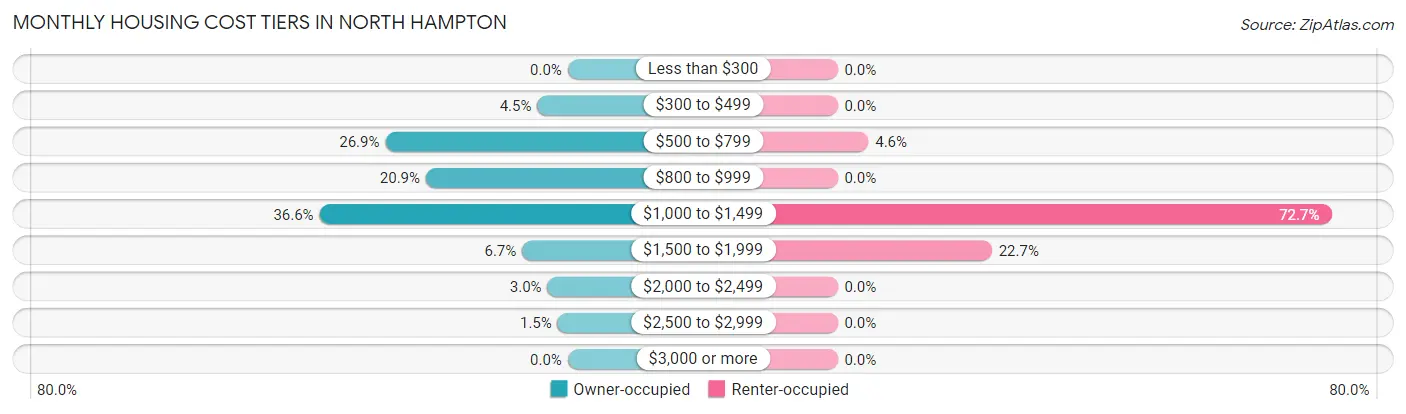
| Monthly Cost | Owner-occupied | Renter-occupied |
| Less than $300 | 0 (0.0%) | 0 (0.0%) |
| $300 to $499 | 6 (4.5%) | 0 (0.0%) |
| $500 to $799 | 36 (26.9%) | 1 (4.5%) |
| $800 to $999 | 28 (20.9%) | 0 (0.0%) |
| $1,000 to $1,499 | 49 (36.6%) | 16 (72.7%) |
| $1,500 to $1,999 | 9 (6.7%) | 5 (22.7%) |
| $2,000 to $2,499 | 4 (3.0%) | 0 (0.0%) |
| $2,500 to $2,999 | 2 (1.5%) | 0 (0.0%) |
| $3,000 or more | 0 (0.0%) | 0 (0.0%) |
| Total | 134 (100.0%) | 22 (100.0%) |
Physical Housing Characteristics in North Hampton
Housing Structures in North Hampton
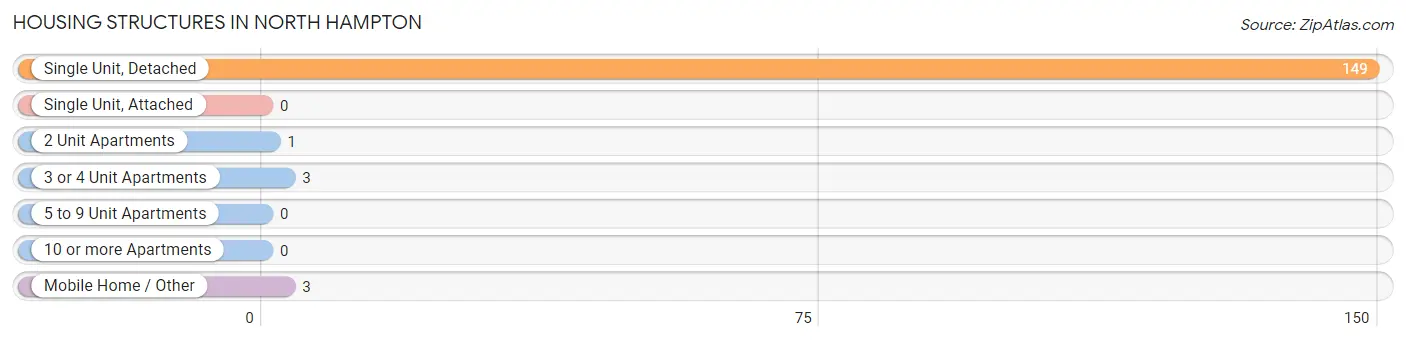
| Structure Type | # Housing Units | % Housing Units |
| Single Unit, Detached | 149 | 95.5% |
| Single Unit, Attached | 0 | 0.0% |
| 2 Unit Apartments | 1 | 0.6% |
| 3 or 4 Unit Apartments | 3 | 1.9% |
| 5 to 9 Unit Apartments | 0 | 0.0% |
| 10 or more Apartments | 0 | 0.0% |
| Mobile Home / Other | 3 | 1.9% |
| Total | 156 | 100.0% |
Housing Structures by Occupancy in North Hampton
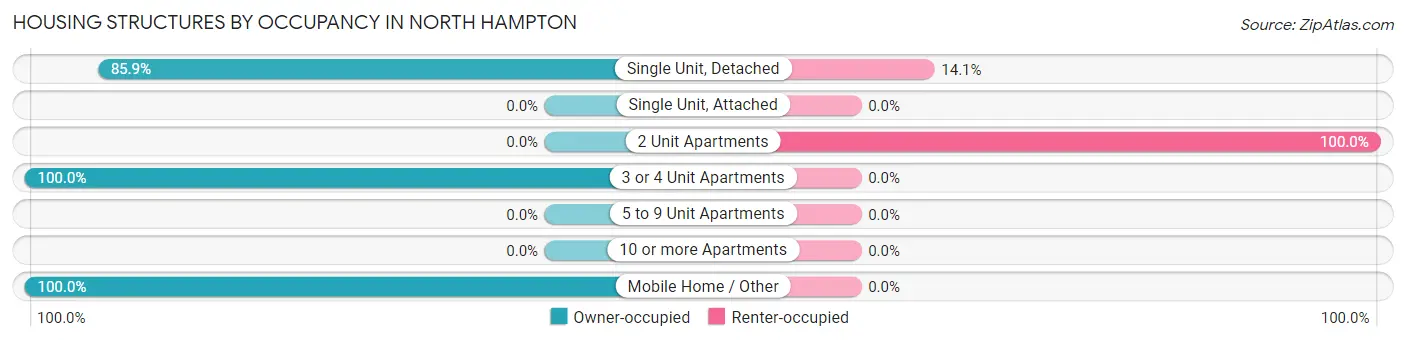
| Structure Type | Owner-occupied | Renter-occupied |
| Single Unit, Detached | 128 (85.9%) | 21 (14.1%) |
| Single Unit, Attached | 0 (0.0%) | 0 (0.0%) |
| 2 Unit Apartments | 0 (0.0%) | 1 (100.0%) |
| 3 or 4 Unit Apartments | 3 (100.0%) | 0 (0.0%) |
| 5 to 9 Unit Apartments | 0 (0.0%) | 0 (0.0%) |
| 10 or more Apartments | 0 (0.0%) | 0 (0.0%) |
| Mobile Home / Other | 3 (100.0%) | 0 (0.0%) |
| Total | 134 (85.9%) | 22 (14.1%) |
Housing Structures by Number of Rooms in North Hampton
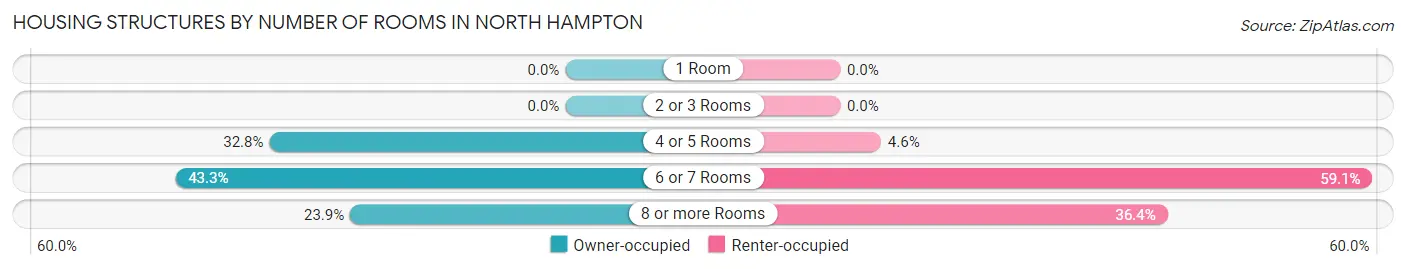
| Number of Rooms | Owner-occupied | Renter-occupied |
| 1 Room | 0 (0.0%) | 0 (0.0%) |
| 2 or 3 Rooms | 0 (0.0%) | 0 (0.0%) |
| 4 or 5 Rooms | 44 (32.8%) | 1 (4.5%) |
| 6 or 7 Rooms | 58 (43.3%) | 13 (59.1%) |
| 8 or more Rooms | 32 (23.9%) | 8 (36.4%) |
| Total | 134 (100.0%) | 22 (100.0%) |
Housing Structure by Heating Type in North Hampton
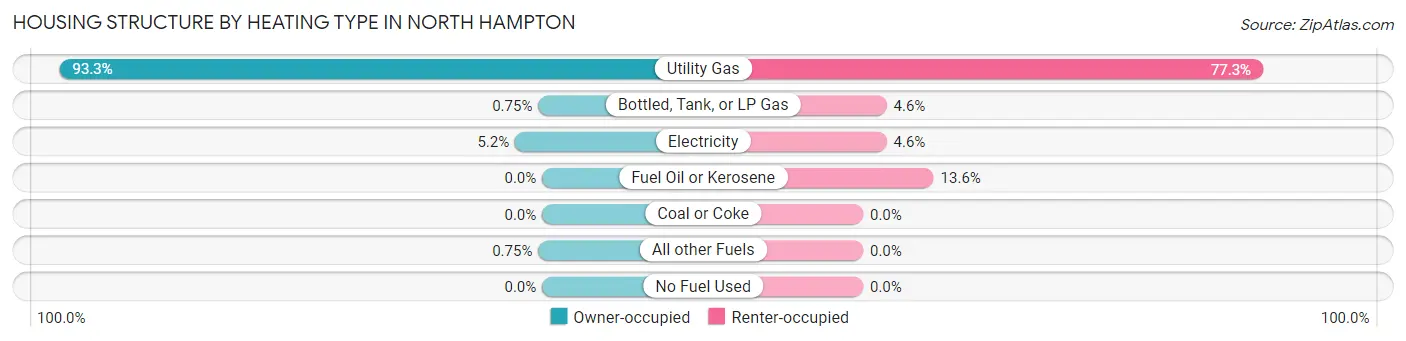
| Heating Type | Owner-occupied | Renter-occupied |
| Utility Gas | 125 (93.3%) | 17 (77.3%) |
| Bottled, Tank, or LP Gas | 1 (0.7%) | 1 (4.5%) |
| Electricity | 7 (5.2%) | 1 (4.5%) |
| Fuel Oil or Kerosene | 0 (0.0%) | 3 (13.6%) |
| Coal or Coke | 0 (0.0%) | 0 (0.0%) |
| All other Fuels | 1 (0.7%) | 0 (0.0%) |
| No Fuel Used | 0 (0.0%) | 0 (0.0%) |
| Total | 134 (100.0%) | 22 (100.0%) |
Household Vehicle Usage in North Hampton
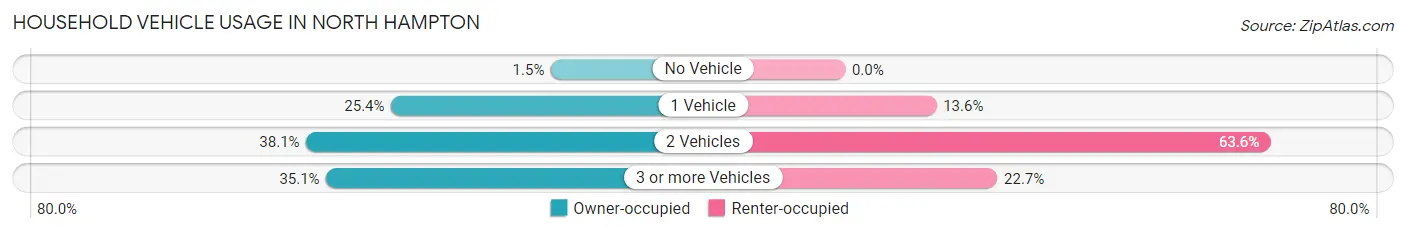
| Vehicles per Household | Owner-occupied | Renter-occupied |
| No Vehicle | 2 (1.5%) | 0 (0.0%) |
| 1 Vehicle | 34 (25.4%) | 3 (13.6%) |
| 2 Vehicles | 51 (38.1%) | 14 (63.6%) |
| 3 or more Vehicles | 47 (35.1%) | 5 (22.7%) |
| Total | 134 (100.0%) | 22 (100.0%) |
Real Estate & Mortgages in North Hampton
Real Estate and Mortgage Overview in North Hampton
| Characteristic | Without Mortgage | With Mortgage |
| Housing Units | 48 | 86 |
| Median Property Value | $162,500 | $136,100 |
| Median Household Income | $51,250 | $11 |
| Monthly Housing Costs | $642 | $0 |
| Real Estate Taxes | $2,423 | $0 |
Property Value by Mortgage Status in North Hampton
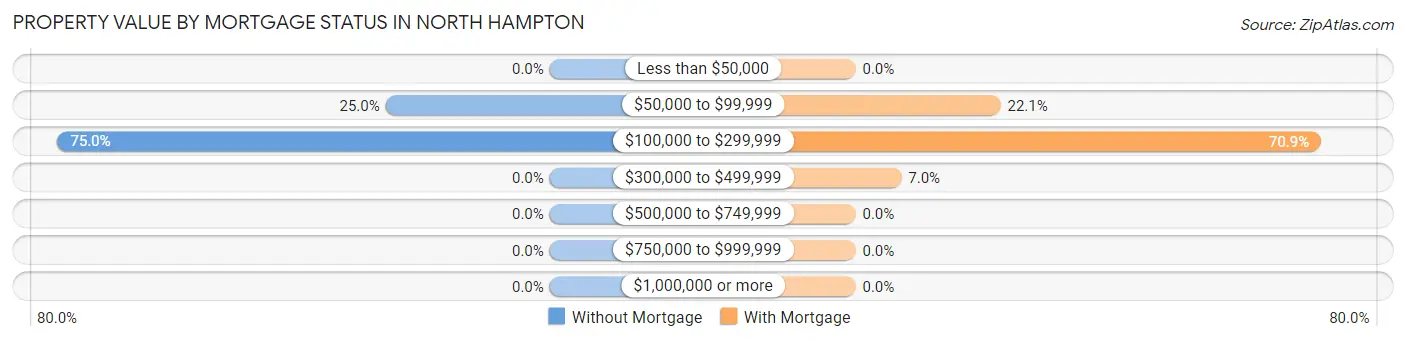
| Property Value | Without Mortgage | With Mortgage |
| Less than $50,000 | 0 (0.0%) | 0 (0.0%) |
| $50,000 to $99,999 | 12 (25.0%) | 19 (22.1%) |
| $100,000 to $299,999 | 36 (75.0%) | 61 (70.9%) |
| $300,000 to $499,999 | 0 (0.0%) | 6 (7.0%) |
| $500,000 to $749,999 | 0 (0.0%) | 0 (0.0%) |
| $750,000 to $999,999 | 0 (0.0%) | 0 (0.0%) |
| $1,000,000 or more | 0 (0.0%) | 0 (0.0%) |
| Total | 48 (100.0%) | 86 (100.0%) |
Household Income by Mortgage Status in North Hampton
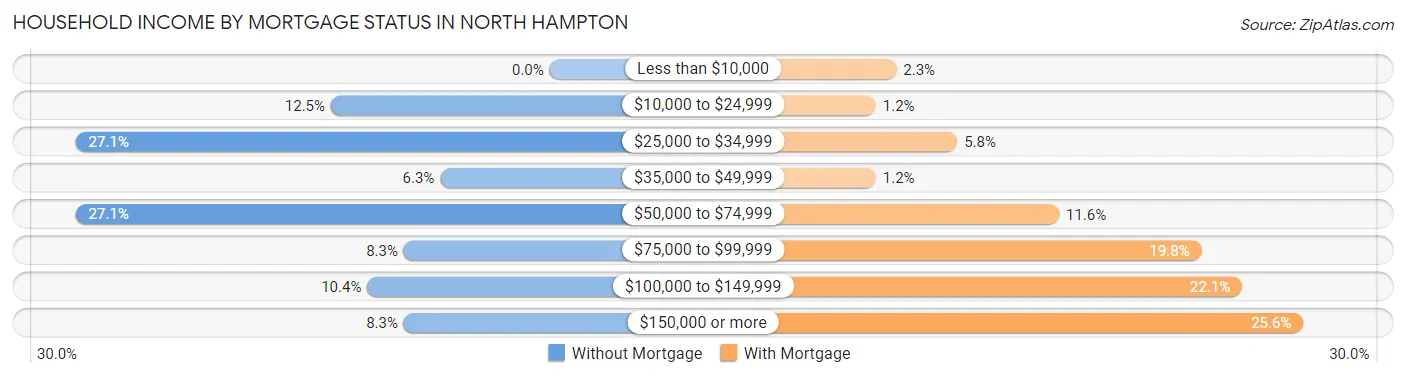
| Household Income | Without Mortgage | With Mortgage |
| Less than $10,000 | 0 (0.0%) | 2 (2.3%) |
| $10,000 to $24,999 | 6 (12.5%) | 1 (1.2%) |
| $25,000 to $34,999 | 13 (27.1%) | 5 (5.8%) |
| $35,000 to $49,999 | 3 (6.2%) | 1 (1.2%) |
| $50,000 to $74,999 | 13 (27.1%) | 10 (11.6%) |
| $75,000 to $99,999 | 4 (8.3%) | 17 (19.8%) |
| $100,000 to $149,999 | 5 (10.4%) | 19 (22.1%) |
| $150,000 or more | 4 (8.3%) | 22 (25.6%) |
| Total | 48 (100.0%) | 86 (100.0%) |
Property Value to Household Income Ratio in North Hampton
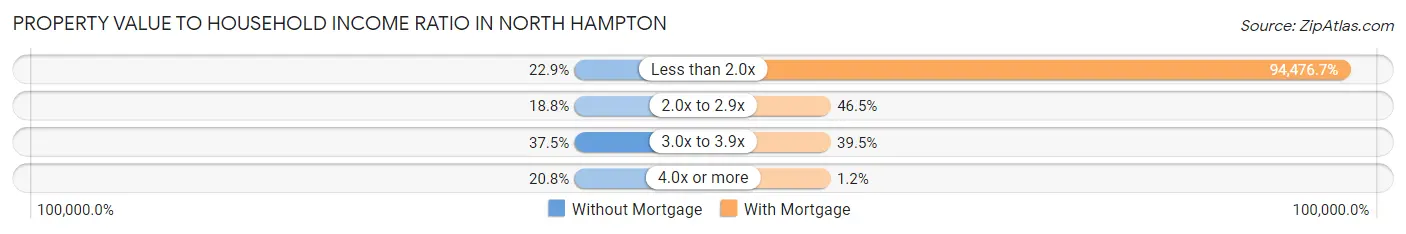
| Value-to-Income Ratio | Without Mortgage | With Mortgage |
| Less than 2.0x | 11 (22.9%) | 81,250 (94,476.7%) |
| 2.0x to 2.9x | 9 (18.8%) | 40 (46.5%) |
| 3.0x to 3.9x | 18 (37.5%) | 34 (39.5%) |
| 4.0x or more | 10 (20.8%) | 1 (1.2%) |
| Total | 48 (100.0%) | 86 (100.0%) |
Real Estate Taxes by Mortgage Status in North Hampton
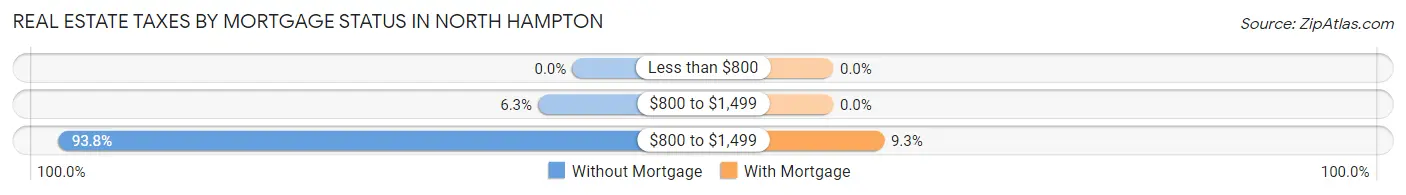
| Property Taxes | Without Mortgage | With Mortgage |
| Less than $800 | 0 (0.0%) | 0 (0.0%) |
| $800 to $1,499 | 3 (6.2%) | 0 (0.0%) |
| $800 to $1,499 | 45 (93.8%) | 8 (9.3%) |
| Total | 48 (100.0%) | 86 (100.0%) |
Health & Disability in North Hampton
Health Insurance Coverage by Age in North Hampton
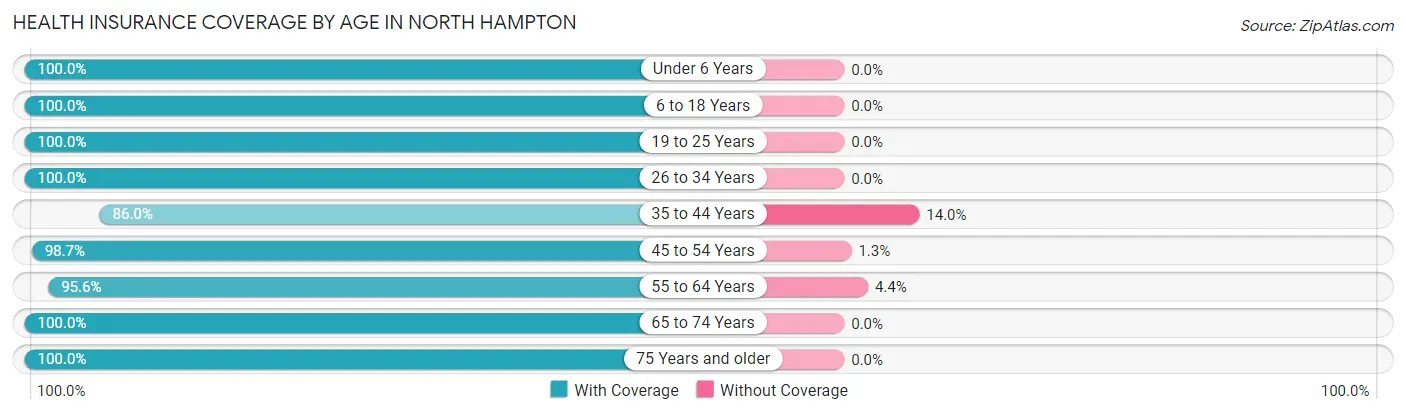
| Age Bracket | With Coverage | Without Coverage |
| Under 6 Years | 9 (100.0%) | 0 (0.0%) |
| 6 to 18 Years | 71 (100.0%) | 0 (0.0%) |
| 19 to 25 Years | 25 (100.0%) | 0 (0.0%) |
| 26 to 34 Years | 28 (100.0%) | 0 (0.0%) |
| 35 to 44 Years | 43 (86.0%) | 7 (14.0%) |
| 45 to 54 Years | 74 (98.7%) | 1 (1.3%) |
| 55 to 64 Years | 65 (95.6%) | 3 (4.4%) |
| 65 to 74 Years | 35 (100.0%) | 0 (0.0%) |
| 75 Years and older | 36 (100.0%) | 0 (0.0%) |
| Total | 386 (97.2%) | 11 (2.8%) |
Health Insurance Coverage by Citizenship Status in North Hampton
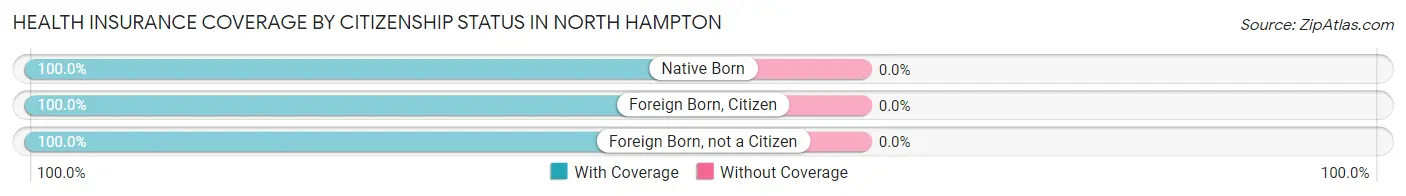
| Citizenship Status | With Coverage | Without Coverage |
| Native Born | 9 (100.0%) | 0 (0.0%) |
| Foreign Born, Citizen | 71 (100.0%) | 0 (0.0%) |
| Foreign Born, not a Citizen | 25 (100.0%) | 0 (0.0%) |
Health Insurance Coverage by Household Income in North Hampton
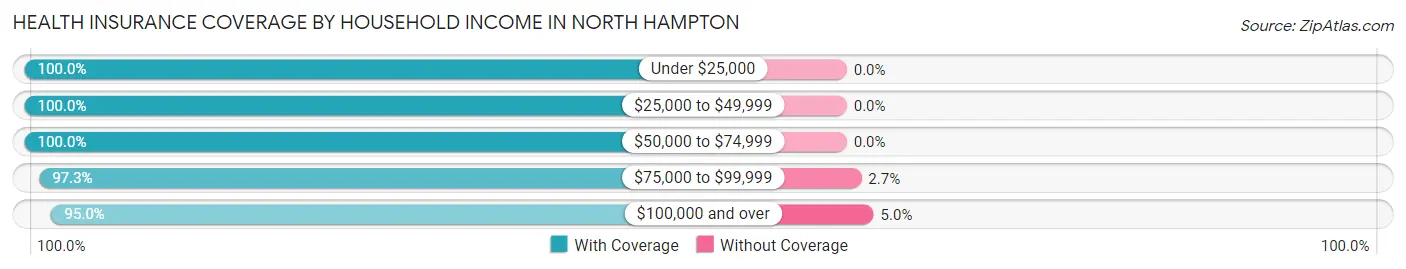
| Household Income | With Coverage | Without Coverage |
| Under $25,000 | 17 (100.0%) | 0 (0.0%) |
| $25,000 to $49,999 | 58 (100.0%) | 0 (0.0%) |
| $50,000 to $74,999 | 70 (100.0%) | 0 (0.0%) |
| $75,000 to $99,999 | 71 (97.3%) | 2 (2.7%) |
| $100,000 and over | 170 (95.0%) | 9 (5.0%) |
Public vs Private Health Insurance Coverage by Age in North Hampton
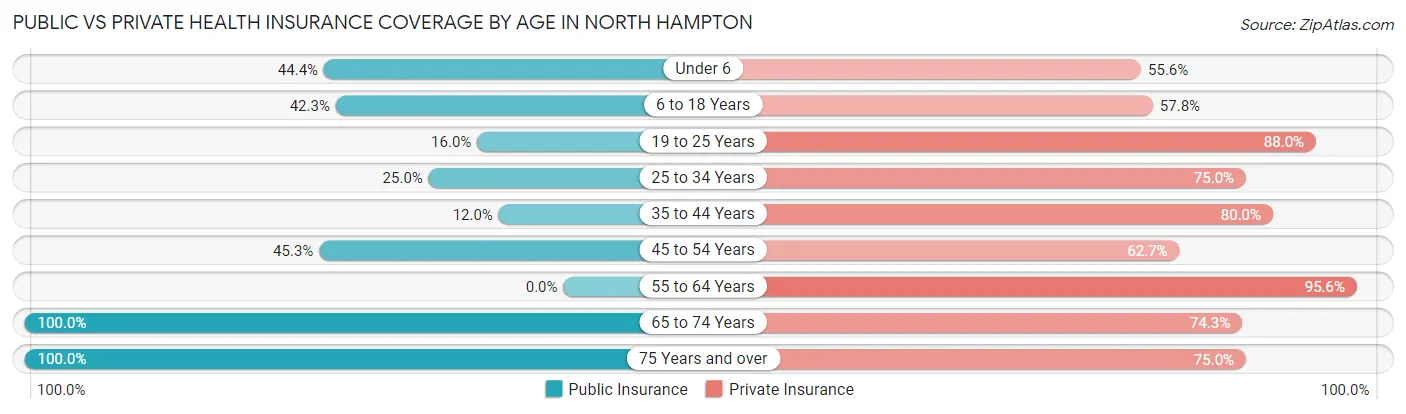
| Age Bracket | Public Insurance | Private Insurance |
| Under 6 | 4 (44.4%) | 5 (55.6%) |
| 6 to 18 Years | 30 (42.2%) | 41 (57.8%) |
| 19 to 25 Years | 4 (16.0%) | 22 (88.0%) |
| 25 to 34 Years | 7 (25.0%) | 21 (75.0%) |
| 35 to 44 Years | 6 (12.0%) | 40 (80.0%) |
| 45 to 54 Years | 34 (45.3%) | 47 (62.7%) |
| 55 to 64 Years | 0 (0.0%) | 65 (95.6%) |
| 65 to 74 Years | 35 (100.0%) | 26 (74.3%) |
| 75 Years and over | 36 (100.0%) | 27 (75.0%) |
| Total | 156 (39.3%) | 294 (74.1%) |
Disability Status by Sex by Age in North Hampton
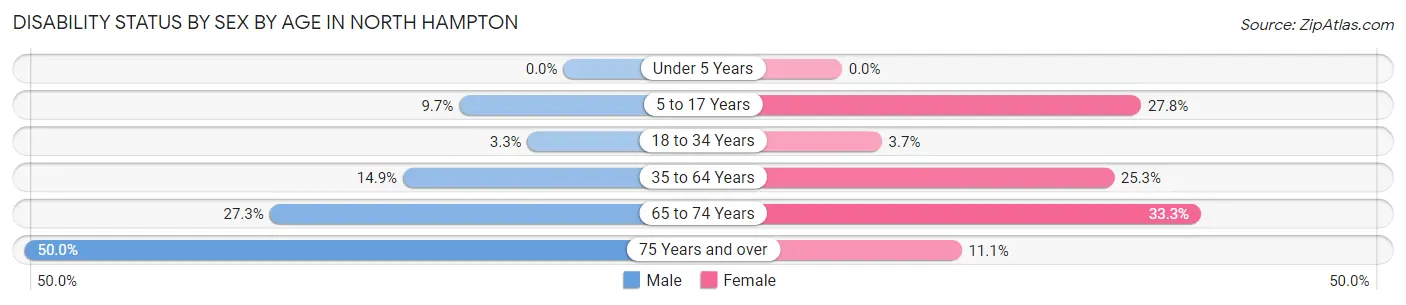
| Age Bracket | Male | Female |
| Under 5 Years | 0 (0.0%) | 0 (0.0%) |
| 5 to 17 Years | 3 (9.7%) | 10 (27.8%) |
| 18 to 34 Years | 1 (3.3%) | 1 (3.7%) |
| 35 to 64 Years | 14 (14.9%) | 25 (25.3%) |
| 65 to 74 Years | 3 (27.3%) | 8 (33.3%) |
| 75 Years and over | 9 (50.0%) | 2 (11.1%) |
Disability Class by Sex by Age in North Hampton
Disability Class: Hearing Difficulty
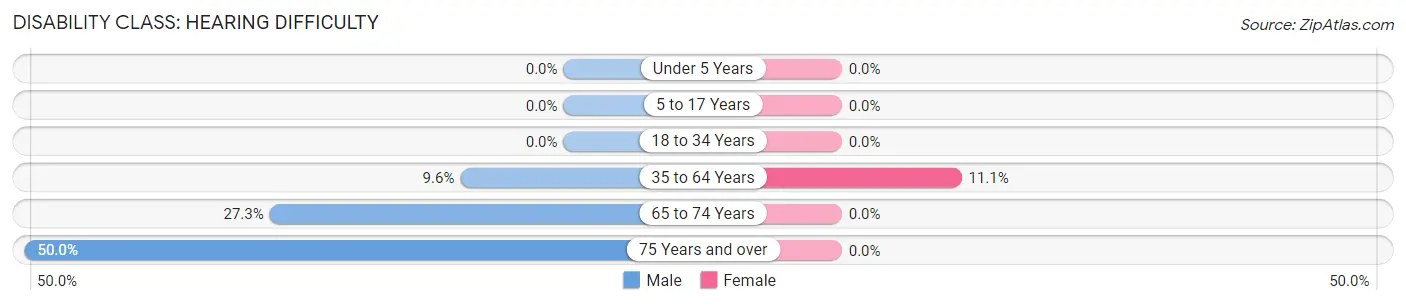
| Age Bracket | Male | Female |
| Under 5 Years | 0 (0.0%) | 0 (0.0%) |
| 5 to 17 Years | 0 (0.0%) | 0 (0.0%) |
| 18 to 34 Years | 0 (0.0%) | 0 (0.0%) |
| 35 to 64 Years | 9 (9.6%) | 11 (11.1%) |
| 65 to 74 Years | 3 (27.3%) | 0 (0.0%) |
| 75 Years and over | 9 (50.0%) | 0 (0.0%) |
Disability Class: Vision Difficulty
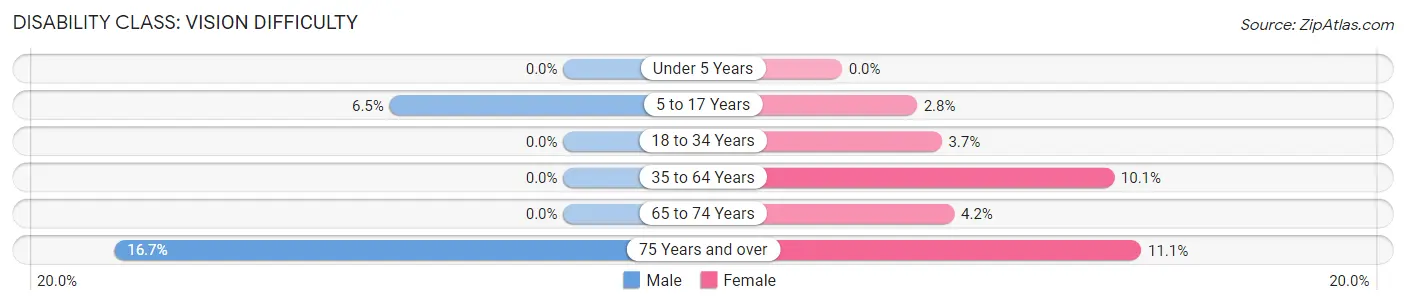
| Age Bracket | Male | Female |
| Under 5 Years | 0 (0.0%) | 0 (0.0%) |
| 5 to 17 Years | 2 (6.5%) | 1 (2.8%) |
| 18 to 34 Years | 0 (0.0%) | 1 (3.7%) |
| 35 to 64 Years | 0 (0.0%) | 10 (10.1%) |
| 65 to 74 Years | 0 (0.0%) | 1 (4.2%) |
| 75 Years and over | 3 (16.7%) | 2 (11.1%) |
Disability Class: Cognitive Difficulty
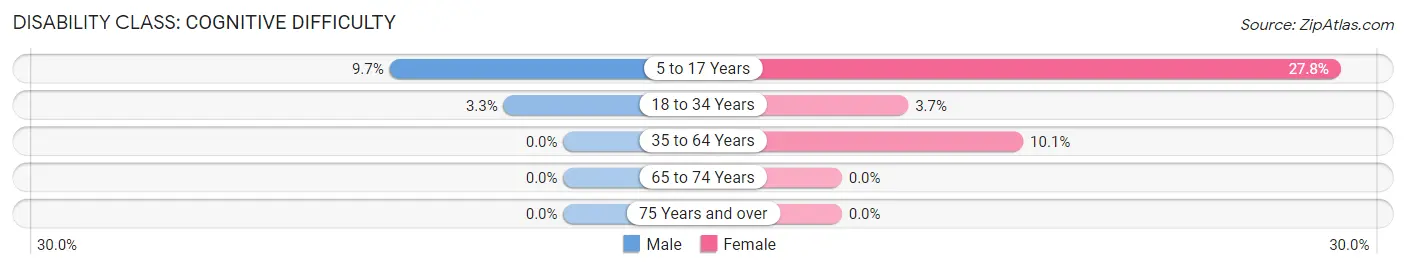
| Age Bracket | Male | Female |
| 5 to 17 Years | 3 (9.7%) | 10 (27.8%) |
| 18 to 34 Years | 1 (3.3%) | 1 (3.7%) |
| 35 to 64 Years | 0 (0.0%) | 10 (10.1%) |
| 65 to 74 Years | 0 (0.0%) | 0 (0.0%) |
| 75 Years and over | 0 (0.0%) | 0 (0.0%) |
Disability Class: Ambulatory Difficulty
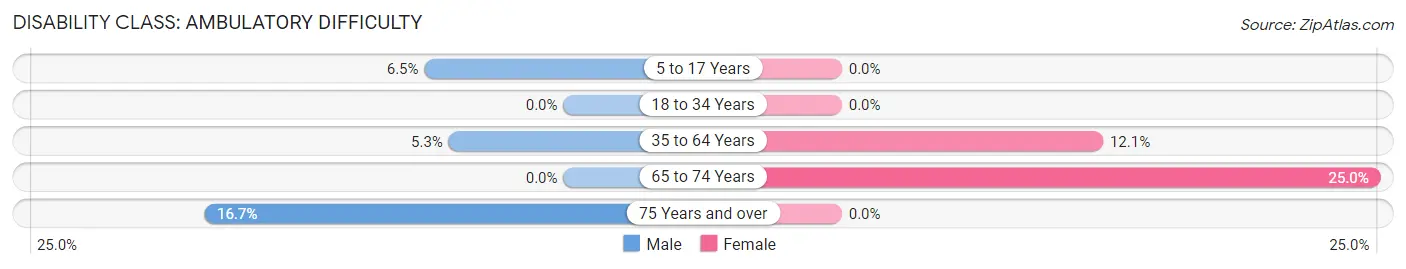
| Age Bracket | Male | Female |
| 5 to 17 Years | 2 (6.5%) | 0 (0.0%) |
| 18 to 34 Years | 0 (0.0%) | 0 (0.0%) |
| 35 to 64 Years | 5 (5.3%) | 12 (12.1%) |
| 65 to 74 Years | 0 (0.0%) | 6 (25.0%) |
| 75 Years and over | 3 (16.7%) | 0 (0.0%) |
Disability Class: Self-Care Difficulty
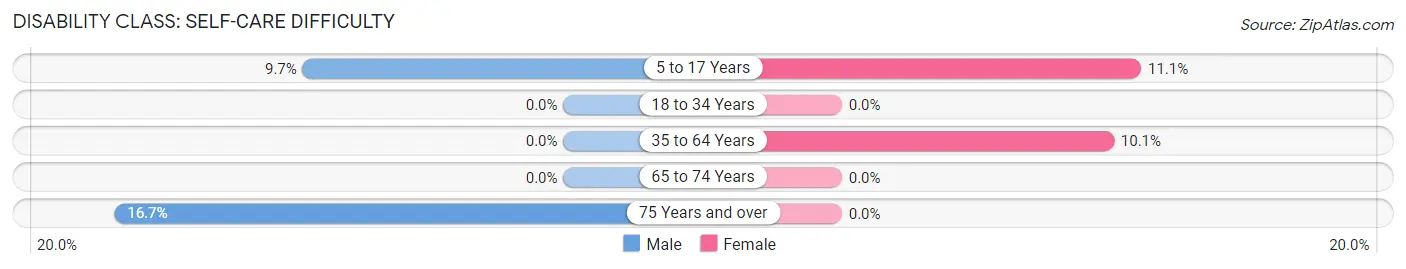
| Age Bracket | Male | Female |
| 5 to 17 Years | 3 (9.7%) | 4 (11.1%) |
| 18 to 34 Years | 0 (0.0%) | 0 (0.0%) |
| 35 to 64 Years | 0 (0.0%) | 10 (10.1%) |
| 65 to 74 Years | 0 (0.0%) | 0 (0.0%) |
| 75 Years and over | 3 (16.7%) | 0 (0.0%) |
Technology Access in North Hampton
Computing Device Access in North Hampton
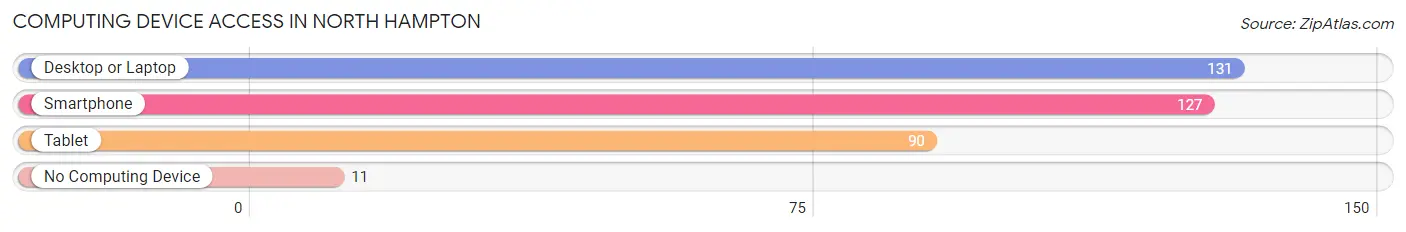
| Device Type | # Households | % Households |
| Desktop or Laptop | 131 | 84.0% |
| Smartphone | 127 | 81.4% |
| Tablet | 90 | 57.7% |
| No Computing Device | 11 | 7.0% |
| Total | 156 | 100.0% |
Internet Access in North Hampton
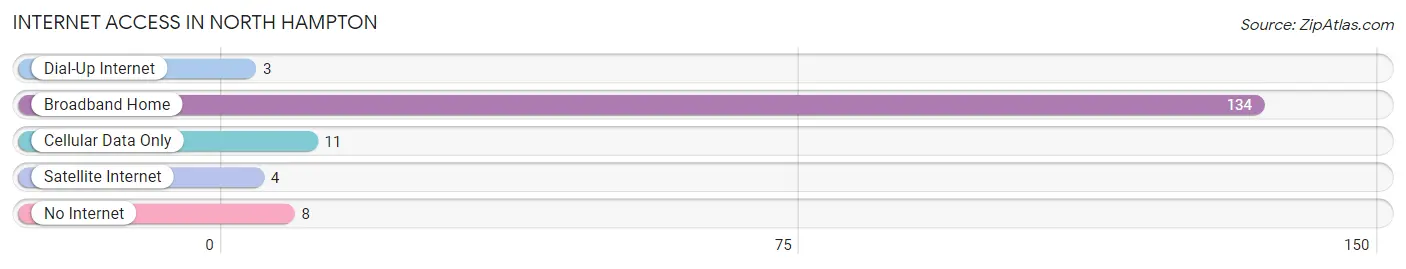
| Internet Type | # Households | % Households |
| Dial-Up Internet | 3 | 1.9% |
| Broadband Home | 134 | 85.9% |
| Cellular Data Only | 11 | 7.0% |
| Satellite Internet | 4 | 2.6% |
| No Internet | 8 | 5.1% |
| Total | 156 | 100.0% |
North Hampton Summary
History
North Hampton, Ohio is a small village located in Clark County, Ohio. It is situated on the banks of the Mad River, and is part of the Springfield Metropolitan Statistical Area. The village was founded in 1817 by a group of settlers from Northampton, Massachusetts. The settlers were attracted to the area by the abundance of natural resources, including timber, coal, and limestone.
The village was originally known as Northampton, but the name was changed to North Hampton in 1820. The village was incorporated in 1837, and the first mayor was elected in 1838.
The village grew slowly over the years, and by the turn of the 20th century, it had a population of just over 500. The village was primarily an agricultural community, with a few small businesses.
In the early 1900s, the village began to experience a period of growth and development. The first bank was established in 1906, and the first newspaper was published in 1908. The village also saw the construction of a number of new homes and businesses.
The village continued to grow throughout the 20th century, and by the year 2000, the population had grown to over 1,000. The village is now home to a variety of businesses, including a grocery store, a hardware store, a pharmacy, and a number of restaurants.
Geography
North Hampton is located in Clark County, Ohio, approximately 25 miles west of Columbus. The village is situated on the banks of the Mad River, and is part of the Springfield Metropolitan Statistical Area.
The village is located in a rural area, and is surrounded by farmland. The terrain is mostly flat, with some rolling hills. The climate is temperate, with hot summers and cold winters.
Economy
The economy of North Hampton is primarily based on agriculture and small businesses. The village is home to a variety of businesses, including a grocery store, a hardware store, a pharmacy, and a number of restaurants.
The village also has a number of manufacturing businesses, including a plastics factory and a metal fabrication plant. The village is also home to a number of small farms, which produce a variety of crops, including corn, soybeans, and wheat.
Demographics
As of the 2010 census, the population of North Hampton was 1,093. The population is primarily white (96.2%), with a small percentage of African Americans (1.7%) and Hispanics (1.1%). The median household income is $45,000, and the median age is 40.
The village is home to a number of churches, including the North Hampton United Methodist Church, the North Hampton Baptist Church, and the North Hampton Presbyterian Church. The village also has a public library, a post office, and a number of parks and recreational facilities.
Common Questions
What is Per Capita Income in North Hampton?
Per Capita income in North Hampton is $35,235.
What is the Median Family Income in North Hampton?
Median Family Income in North Hampton is $86,250.
What is the Median Household income in North Hampton?
Median Household Income in North Hampton is $79,250.
What is Income or Wage Gap in North Hampton?
Income or Wage Gap in North Hampton is 24.2%.
Women in North Hampton earn 75.8 cents for every dollar earned by a man.
What is Inequality or Gini Index in North Hampton?
Inequality or Gini Index in North Hampton is 0.34.
What is the Total Population of North Hampton?
Total Population of North Hampton is 397.
What is the Total Male Population of North Hampton?
Total Male Population of North Hampton is 192.
What is the Total Female Population of North Hampton?
Total Female Population of North Hampton is 205.
What is the Ratio of Males per 100 Females in North Hampton?
There are 93.66 Males per 100 Females in North Hampton.
What is the Ratio of Females per 100 Males in North Hampton?
There are 106.77 Females per 100 Males in North Hampton.
What is the Median Population Age in North Hampton?
Median Population Age in North Hampton is 48.9 Years.
What is the Average Family Size in North Hampton
Average Family Size in North Hampton is 2.9 People.
What is the Average Household Size in North Hampton
Average Household Size in North Hampton is 2.5 People.
How Large is the Labor Force in North Hampton?
There are 205 People in the Labor Forcein in North Hampton.
What is the Percentage of People in the Labor Force in North Hampton?
61.9% of People are in the Labor Force in North Hampton.
What is the Unemployment Rate in North Hampton?
Unemployment Rate in North Hampton is 1.5%.