Delaware, OH Map & Demographics
Delaware Map
Delaware Overview
$38,895
PER CAPITA INCOME
$101,121
AVG FAMILY INCOME
$86,387
AVG HOUSEHOLD INCOME
33.9%
WAGE / INCOME GAP [ % ]
66.1¢/ $1
WAGE / INCOME GAP [ $ ]
0.39
INEQUALITY / GINI INDEX
41,926
TOTAL POPULATION
20,926
MALE POPULATION
21,000
FEMALE POPULATION
99.65
MALES / 100 FEMALES
100.35
FEMALES / 100 MALES
36.6
MEDIAN AGE
3.0
AVG FAMILY SIZE
2.5
AVG HOUSEHOLD SIZE
23,509
LABOR FORCE [ PEOPLE ]
70.7%
PERCENT IN LABOR FORCE
3.2%
UNEMPLOYMENT RATE
Delaware Zip Codes
Delaware Area Codes
Income in Delaware
Income Overview in Delaware
Per Capita Income in Delaware is $38,895, while median incomes of families and households are $101,121 and $86,387 respectively.
| Characteristic | Number | Measure |
| Per Capita Income | 41,926 | $38,895 |
| Median Family Income | 11,004 | $101,121 |
| Mean Family Income | 11,004 | $117,388 |
| Median Household Income | 16,026 | $86,387 |
| Mean Household Income | 16,026 | $98,803 |
| Income Deficit | 11,004 | $0 |
| Wage / Income Gap (%) | 41,926 | 33.86% |
| Wage / Income Gap ($) | 41,926 | 66.14¢ per $1 |
| Gini / Inequality Index | 41,926 | 0.39 |
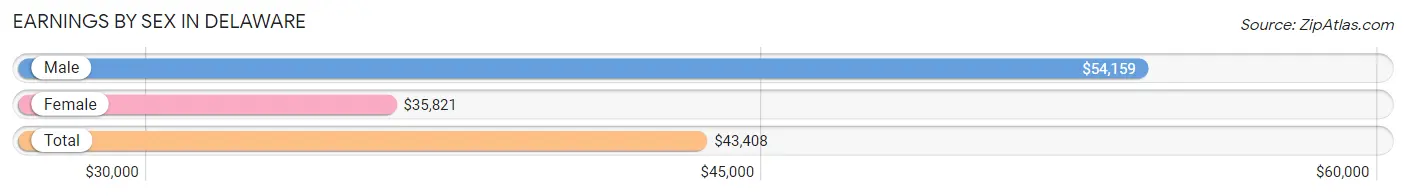
Earnings by Sex in Delaware
Average Earnings in Delaware are $43,408, $54,159 for men and $35,821 for women, a difference of 33.9%.
| Sex | Number | Average Earnings |
| Male | 13,483 (53.7%) | $54,159 |
| Female | 11,633 (46.3%) | $35,821 |
| Total | 25,116 (100.0%) | $43,408 |
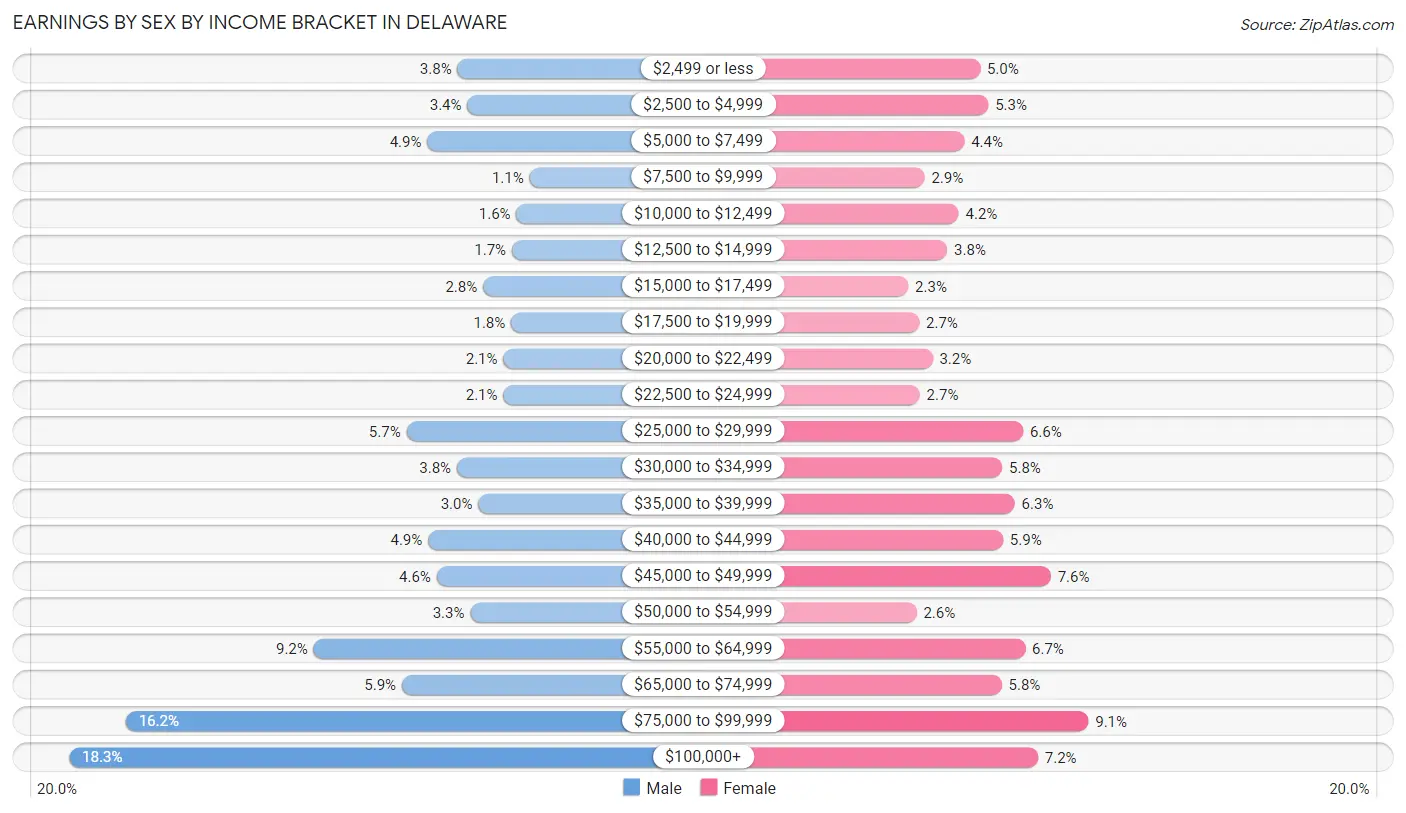
Earnings by Sex by Income Bracket in Delaware
The most common earnings brackets in Delaware are $100,000+ for men (2,471 | 18.3%) and $75,000 to $99,999 for women (1,053 | 9.0%).
| Income | Male | Female |
| $2,499 or less | 509 (3.8%) | 581 (5.0%) |
| $2,500 to $4,999 | 460 (3.4%) | 616 (5.3%) |
| $5,000 to $7,499 | 662 (4.9%) | 512 (4.4%) |
| $7,500 to $9,999 | 145 (1.1%) | 338 (2.9%) |
| $10,000 to $12,499 | 212 (1.6%) | 488 (4.2%) |
| $12,500 to $14,999 | 234 (1.7%) | 437 (3.8%) |
| $15,000 to $17,499 | 380 (2.8%) | 267 (2.3%) |
| $17,500 to $19,999 | 239 (1.8%) | 315 (2.7%) |
| $20,000 to $22,499 | 278 (2.1%) | 374 (3.2%) |
| $22,500 to $24,999 | 278 (2.1%) | 317 (2.7%) |
| $25,000 to $29,999 | 767 (5.7%) | 768 (6.6%) |
| $30,000 to $34,999 | 513 (3.8%) | 677 (5.8%) |
| $35,000 to $39,999 | 405 (3.0%) | 732 (6.3%) |
| $40,000 to $44,999 | 658 (4.9%) | 680 (5.9%) |
| $45,000 to $49,999 | 615 (4.6%) | 889 (7.6%) |
| $50,000 to $54,999 | 445 (3.3%) | 304 (2.6%) |
| $55,000 to $64,999 | 1,237 (9.2%) | 777 (6.7%) |
| $65,000 to $74,999 | 790 (5.9%) | 675 (5.8%) |
| $75,000 to $99,999 | 2,185 (16.2%) | 1,053 (9.0%) |
| $100,000+ | 2,471 (18.3%) | 833 (7.2%) |
| Total | 13,483 (100.0%) | 11,633 (100.0%) |
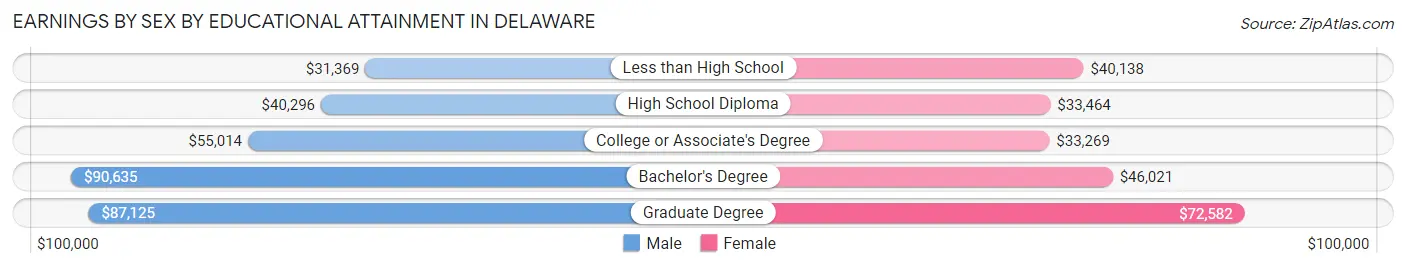
Earnings by Sex by Educational Attainment in Delaware
Average earnings in Delaware are $63,770 for men and $41,875 for women, a difference of 34.3%. Men with an educational attainment of bachelor's degree enjoy the highest average annual earnings of $90,635, while those with less than high school education earn the least with $31,369. Women with an educational attainment of graduate degree earn the most with the average annual earnings of $72,582, while those with college or associate's degree education have the smallest earnings of $33,269.
| Educational Attainment | Male Income | Female Income |
| Less than High School | $31,369 | $40,138 |
| High School Diploma | $40,296 | $33,464 |
| College or Associate's Degree | $55,014 | $33,269 |
| Bachelor's Degree | $90,635 | $46,021 |
| Graduate Degree | $87,125 | $72,582 |
| Total | $63,770 | $41,875 |
Family Income in Delaware
Family Income Brackets in Delaware
According to the Delaware family income data, there are 2,806 families falling into the $100,000 to $149,999 income range, which is the most common income bracket and makes up 25.5% of all families. Conversely, the $10,000 to $14,999 income bracket is the least frequent group with only 121 families (1.1%) belonging to this category.
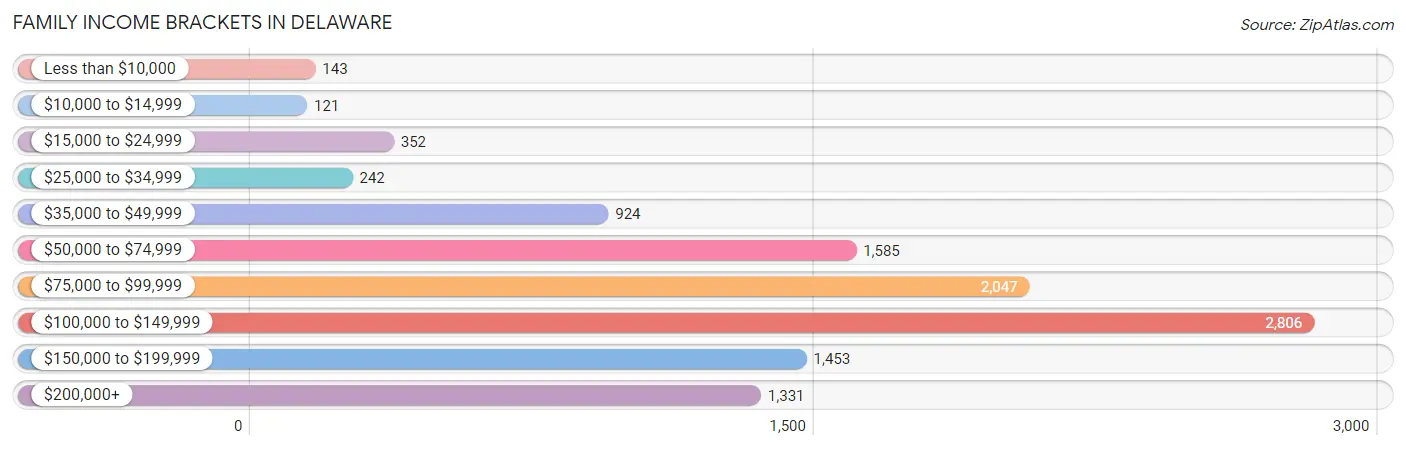
| Income Bracket | # Families | % Families |
| Less than $10,000 | 143 | 1.3% |
| $10,000 to $14,999 | 121 | 1.1% |
| $15,000 to $24,999 | 352 | 3.2% |
| $25,000 to $34,999 | 242 | 2.2% |
| $35,000 to $49,999 | 924 | 8.4% |
| $50,000 to $74,999 | 1,585 | 14.4% |
| $75,000 to $99,999 | 2,047 | 18.6% |
| $100,000 to $149,999 | 2,806 | 25.5% |
| $150,000 to $199,999 | 1,453 | 13.2% |
| $200,000+ | 1,331 | 12.1% |
Family Income by Famaliy Size in Delaware
6-person families (134 | 1.2%) account for the highest median family income in Delaware with $144,000 per family, while 2-person families (4,890 | 44.4%) have the highest median income of $42,967 per family member.
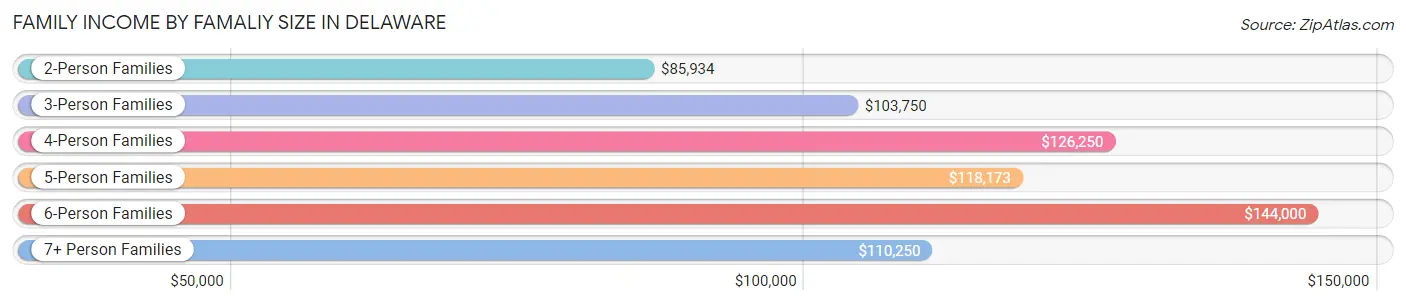
| Income Bracket | # Families | Median Income |
| 2-Person Families | 4,890 (44.4%) | $85,934 |
| 3-Person Families | 2,481 (22.6%) | $103,750 |
| 4-Person Families | 2,468 (22.4%) | $126,250 |
| 5-Person Families | 930 (8.5%) | $118,173 |
| 6-Person Families | 134 (1.2%) | $144,000 |
| 7+ Person Families | 101 (0.9%) | $110,250 |
| Total | 11,004 (100.0%) | $101,121 |
Family Income by Number of Earners in Delaware
The median family income in Delaware is $101,121, with families comprising 3+ earners (1,072) having the highest median family income of $148,284, while families with no earners (973) have the lowest median family income of $52,792, accounting for 9.7% and 8.8% of families, respectively.
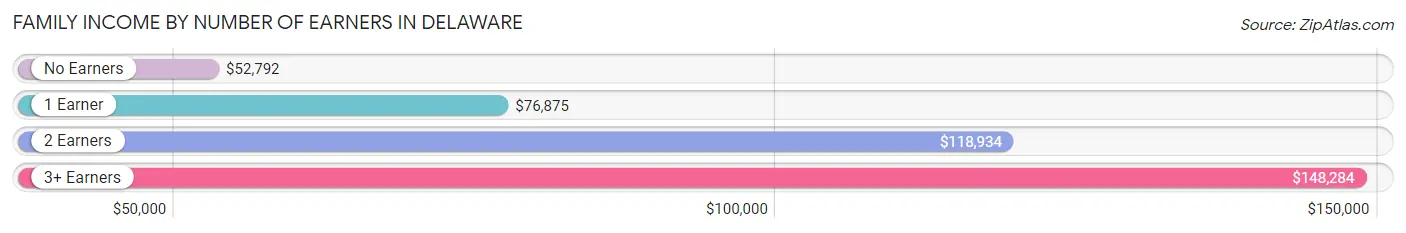
| Number of Earners | # Families | Median Income |
| No Earners | 973 (8.8%) | $52,792 |
| 1 Earner | 2,943 (26.7%) | $76,875 |
| 2 Earners | 6,016 (54.7%) | $118,934 |
| 3+ Earners | 1,072 (9.7%) | $148,284 |
| Total | 11,004 (100.0%) | $101,121 |
Household Income in Delaware
Household Income Brackets in Delaware
With 3,189 households falling in the category, the $100,000 to $149,999 income range is the most frequent in Delaware, accounting for 19.9% of all households. In contrast, only 288 households (1.8%) fall into the $10,000 to $14,999 income bracket, making it the least populous group.
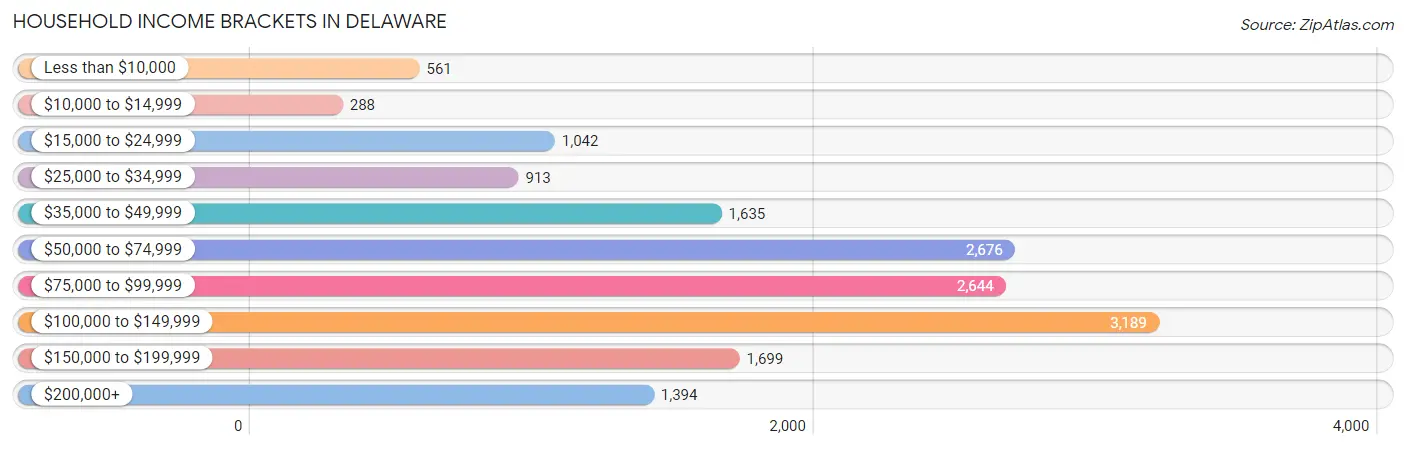
| Income Bracket | # Households | % Households |
| Less than $10,000 | 561 | 3.5% |
| $10,000 to $14,999 | 288 | 1.8% |
| $15,000 to $24,999 | 1,042 | 6.5% |
| $25,000 to $34,999 | 913 | 5.7% |
| $35,000 to $49,999 | 1,635 | 10.2% |
| $50,000 to $74,999 | 2,676 | 16.7% |
| $75,000 to $99,999 | 2,644 | 16.5% |
| $100,000 to $149,999 | 3,189 | 19.9% |
| $150,000 to $199,999 | 1,699 | 10.6% |
| $200,000+ | 1,394 | 8.7% |
Household Income by Householder Age in Delaware
The median household income in Delaware is $86,387, with the highest median household income of $102,295 found in the 25 to 44 years age bracket for the primary householder. A total of 5,914 households (36.9%) fall into this category. Meanwhile, the 15 to 24 years age bracket for the primary householder has the lowest median household income of $50,473, with 837 households (5.2%) in this group.
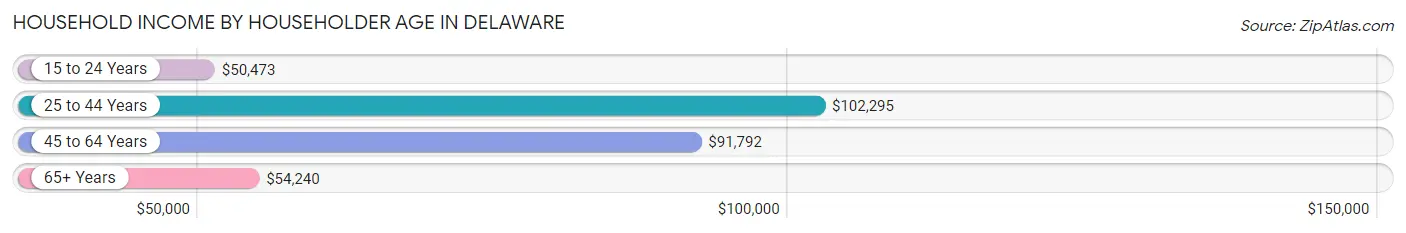
| Income Bracket | # Households | Median Income |
| 15 to 24 Years | 837 (5.2%) | $50,473 |
| 25 to 44 Years | 5,914 (36.9%) | $102,295 |
| 45 to 64 Years | 5,412 (33.8%) | $91,792 |
| 65+ Years | 3,863 (24.1%) | $54,240 |
| Total | 16,026 (100.0%) | $86,387 |
Poverty in Delaware
Income Below Poverty by Sex and Age in Delaware
With 6.5% poverty level for males and 8.1% for females among the residents of Delaware, 5 year old males and 16 and 17 year old females are the most vulnerable to poverty, with 61 males (27.5%) and 79 females (14.3%) in their respective age groups living below the poverty level.
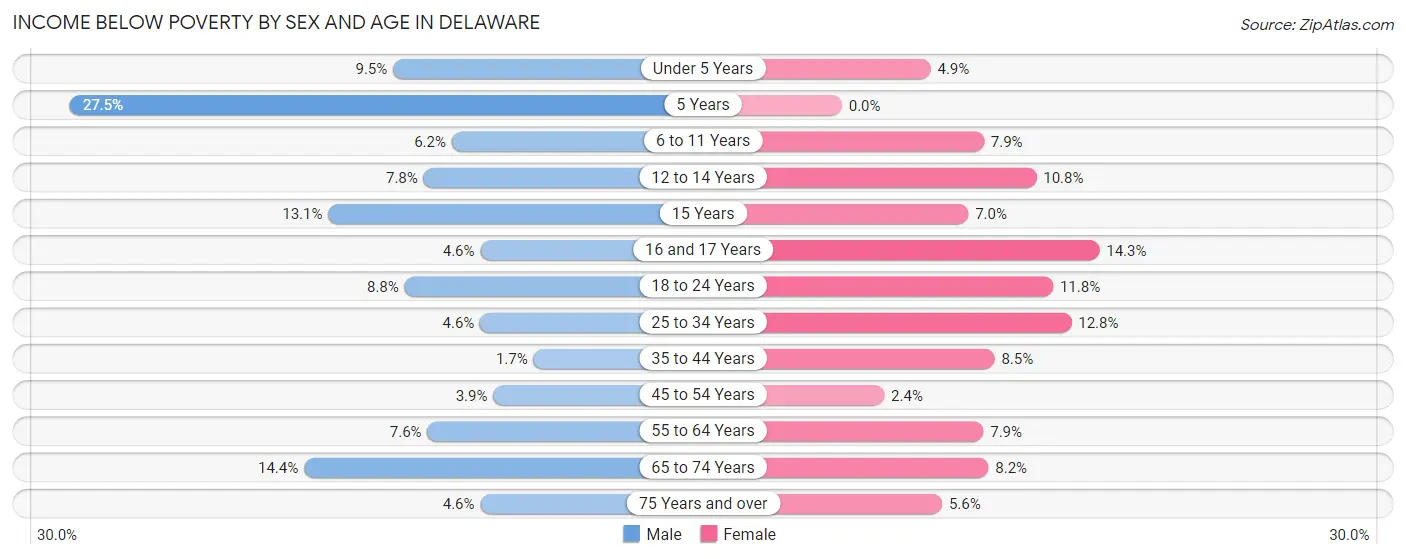
| Age Bracket | Male | Female |
| Under 5 Years | 115 (9.5%) | 66 (4.9%) |
| 5 Years | 61 (27.5%) | 0 (0.0%) |
| 6 to 11 Years | 94 (6.2%) | 130 (7.9%) |
| 12 to 14 Years | 71 (7.8%) | 90 (10.8%) |
| 15 Years | 25 (13.1%) | 19 (7.0%) |
| 16 and 17 Years | 23 (4.6%) | 79 (14.3%) |
| 18 to 24 Years | 181 (8.8%) | 144 (11.8%) |
| 25 to 34 Years | 125 (4.6%) | 383 (12.8%) |
| 35 to 44 Years | 54 (1.7%) | 258 (8.5%) |
| 45 to 54 Years | 114 (3.9%) | 58 (2.4%) |
| 55 to 64 Years | 158 (7.6%) | 174 (7.9%) |
| 65 to 74 Years | 238 (14.4%) | 144 (8.2%) |
| 75 Years and over | 38 (4.6%) | 73 (5.6%) |
| Total | 1,297 (6.5%) | 1,618 (8.1%) |
Income Above Poverty by Sex and Age in Delaware
According to the poverty statistics in Delaware, males aged 35 to 44 years and females aged 5 years are the age groups that are most secure financially, with 98.3% of males and 100.0% of females in these age groups living above the poverty line.
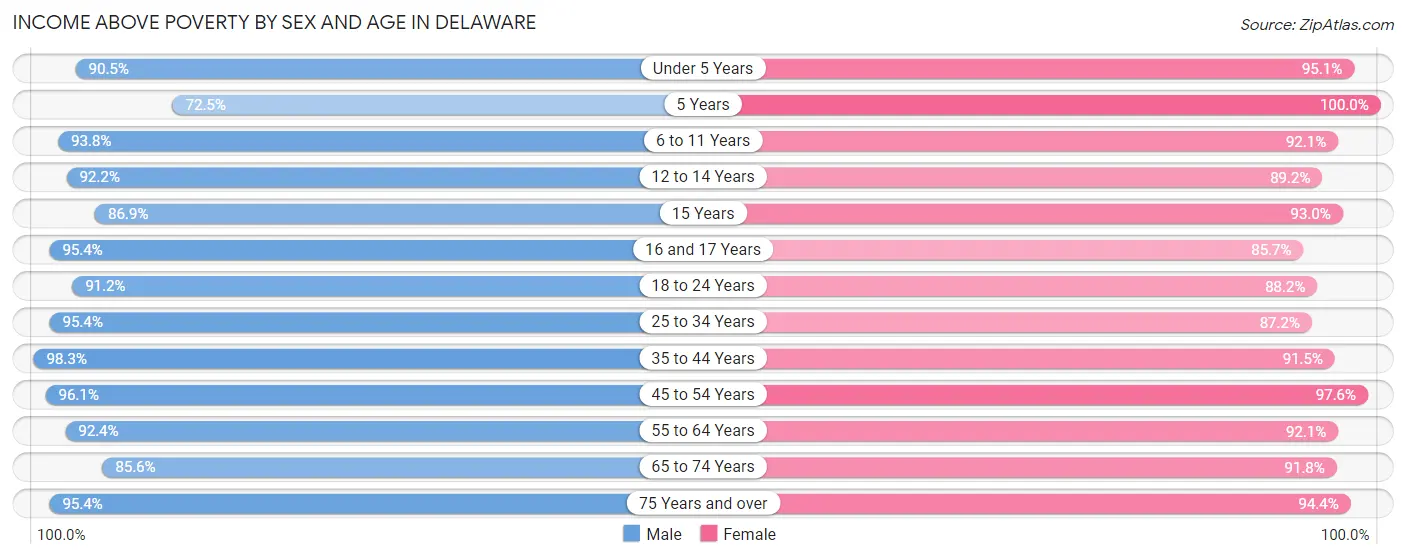
| Age Bracket | Male | Female |
| Under 5 Years | 1,098 (90.5%) | 1,271 (95.1%) |
| 5 Years | 161 (72.5%) | 360 (100.0%) |
| 6 to 11 Years | 1,419 (93.8%) | 1,514 (92.1%) |
| 12 to 14 Years | 842 (92.2%) | 741 (89.2%) |
| 15 Years | 166 (86.9%) | 251 (93.0%) |
| 16 and 17 Years | 475 (95.4%) | 472 (85.7%) |
| 18 to 24 Years | 1,866 (91.2%) | 1,080 (88.2%) |
| 25 to 34 Years | 2,574 (95.4%) | 2,615 (87.2%) |
| 35 to 44 Years | 3,202 (98.3%) | 2,776 (91.5%) |
| 45 to 54 Years | 2,810 (96.1%) | 2,399 (97.6%) |
| 55 to 64 Years | 1,930 (92.4%) | 2,035 (92.1%) |
| 65 to 74 Years | 1,410 (85.6%) | 1,621 (91.8%) |
| 75 Years and over | 785 (95.4%) | 1,236 (94.4%) |
| Total | 18,738 (93.5%) | 18,371 (91.9%) |
Income Below Poverty Among Married-Couple Families in Delaware
The poverty statistics for married-couple families in Delaware show that 1.7% or 146 of the total 8,572 families live below the poverty line. Families with 5 or more children have the highest poverty rate of 18.2%, comprising of 16 families. On the other hand, families with 1 or 2 children have the lowest poverty rate of 0.5%, which includes 16 families.
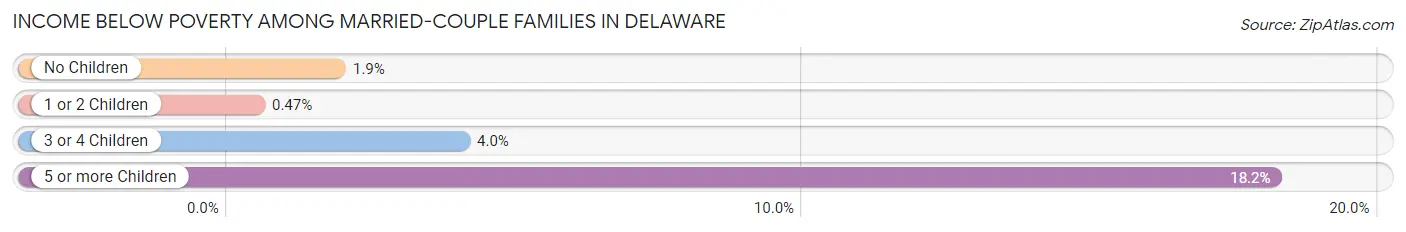
| Children | Above Poverty | Below Poverty |
| No Children | 4,174 (98.1%) | 80 (1.9%) |
| 1 or 2 Children | 3,372 (99.5%) | 16 (0.5%) |
| 3 or 4 Children | 808 (96.0%) | 34 (4.0%) |
| 5 or more Children | 72 (81.8%) | 16 (18.2%) |
| Total | 8,426 (98.3%) | 146 (1.7%) |
Income Below Poverty Among Single-Parent Households in Delaware
According to the poverty data in Delaware, 3.9% or 35 single-father households and 25.3% or 388 single-mother households are living below the poverty line. Among single-father households, those with 1 or 2 children have the highest poverty rate, with 35 households (8.4%) experiencing poverty. Likewise, among single-mother households, those with 3 or 4 children have the highest poverty rate, with 61 households (54.5%) falling below the poverty line.
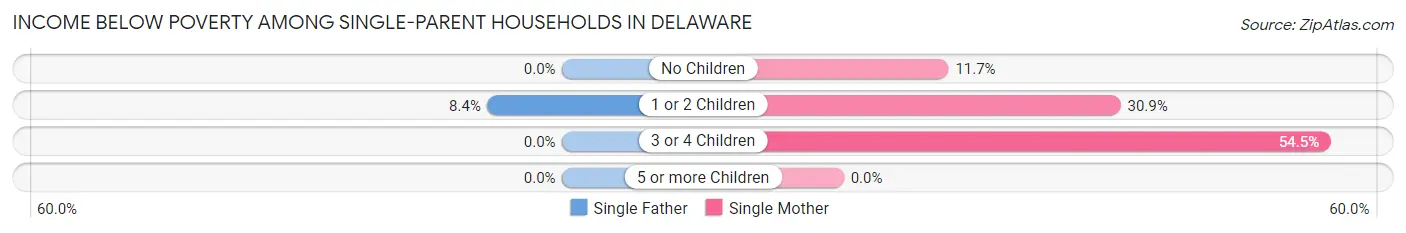
| Children | Single Father | Single Mother |
| No Children | 0 (0.0%) | 69 (11.7%) |
| 1 or 2 Children | 35 (8.4%) | 258 (30.9%) |
| 3 or 4 Children | 0 (0.0%) | 61 (54.5%) |
| 5 or more Children | 0 (0.0%) | 0 (0.0%) |
| Total | 35 (3.9%) | 388 (25.3%) |
Income Below Poverty Among Married-Couple vs Single-Parent Households in Delaware
The poverty data for Delaware shows that 146 of the married-couple family households (1.7%) and 423 of the single-parent households (17.4%) are living below the poverty level. Within the married-couple family households, those with 5 or more children have the highest poverty rate, with 16 households (18.2%) falling below the poverty line. Among the single-parent households, those with 3 or 4 children have the highest poverty rate, with 61 household (39.6%) living below poverty.
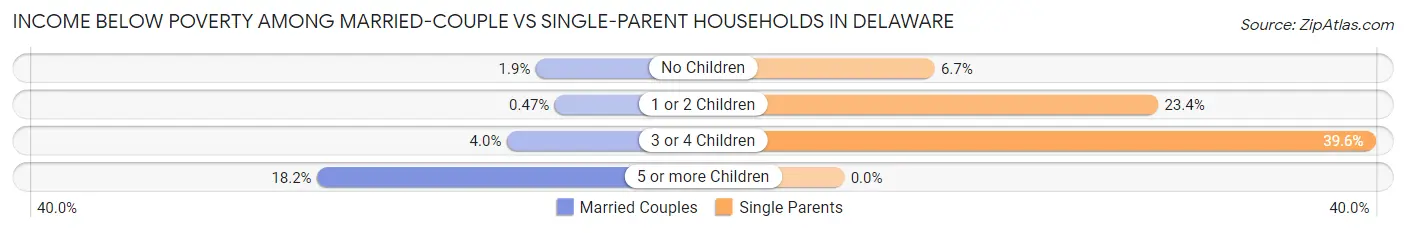
| Children | Married-Couple Families | Single-Parent Households |
| No Children | 80 (1.9%) | 69 (6.7%) |
| 1 or 2 Children | 16 (0.5%) | 293 (23.4%) |
| 3 or 4 Children | 34 (4.0%) | 61 (39.6%) |
| 5 or more Children | 16 (18.2%) | 0 (0.0%) |
| Total | 146 (1.7%) | 423 (17.4%) |
Race in Delaware
The most populous races in Delaware are White / Caucasian (34,666 | 82.7%), Two or more Races (2,660 | 6.3%), and Asian (2,168 | 5.2%).
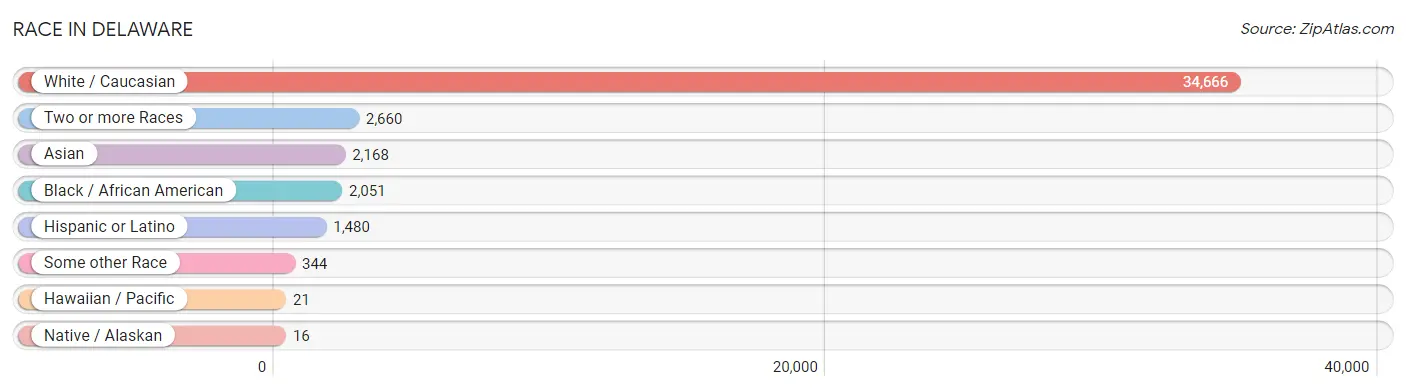
| Race | # Population | % Population |
| Asian | 2,168 | 5.2% |
| Black / African American | 2,051 | 4.9% |
| Hawaiian / Pacific | 21 | 0.1% |
| Hispanic or Latino | 1,480 | 3.5% |
| Native / Alaskan | 16 | 0.0% |
| White / Caucasian | 34,666 | 82.7% |
| Two or more Races | 2,660 | 6.3% |
| Some other Race | 344 | 0.8% |
| Total | 41,926 | 100.0% |
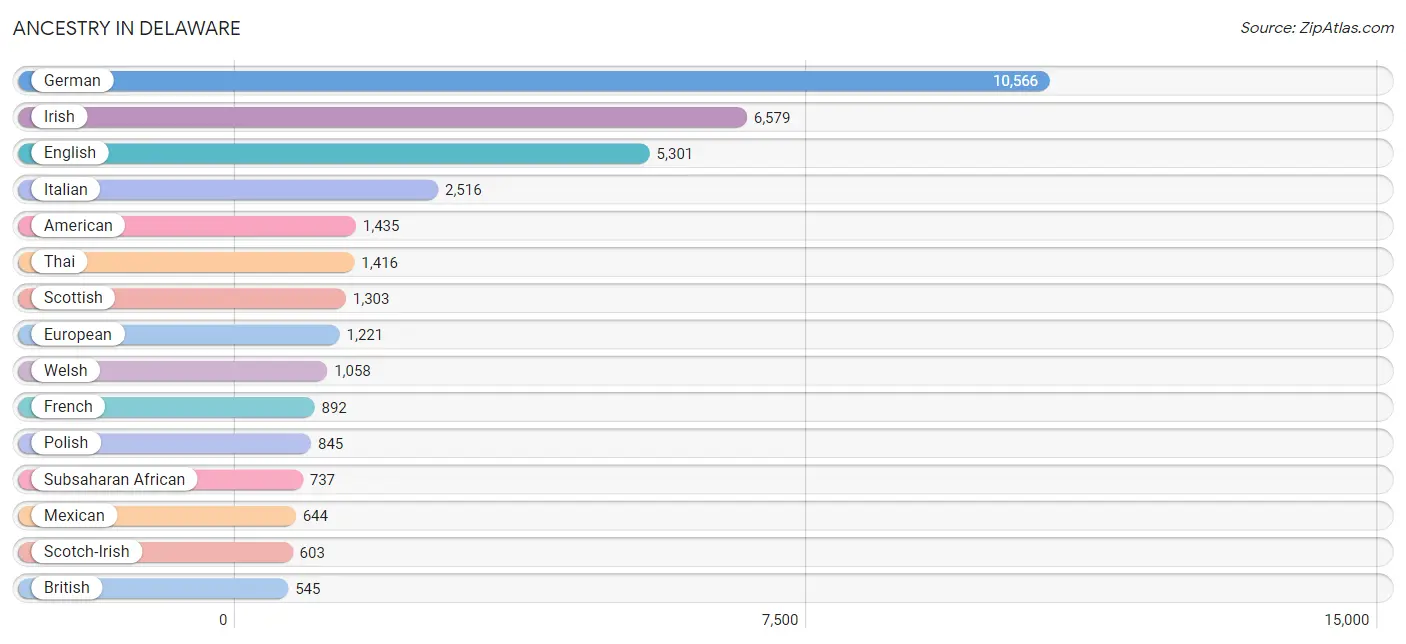
Ancestry in Delaware
The most populous ancestries reported in Delaware are German (10,566 | 25.2%), Irish (6,579 | 15.7%), English (5,301 | 12.6%), Italian (2,516 | 6.0%), and American (1,435 | 3.4%), together accounting for 63.0% of all Delaware residents.
| Ancestry | # Population | % Population |
| African | 368 | 0.9% |
| American | 1,435 | 3.4% |
| Arab | 30 | 0.1% |
| Argentinean | 22 | 0.1% |
| Austrian | 31 | 0.1% |
| Bhutanese | 311 | 0.7% |
| British | 545 | 1.3% |
| Burmese | 172 | 0.4% |
| Canadian | 92 | 0.2% |
| Celtic | 23 | 0.1% |
| Central American | 81 | 0.2% |
| Central American Indian | 36 | 0.1% |
| Cherokee | 64 | 0.2% |
| Colombian | 36 | 0.1% |
| Croatian | 52 | 0.1% |
| Cypriot | 8 | 0.0% |
| Czech | 111 | 0.3% |
| Czechoslovakian | 76 | 0.2% |
| Danish | 18 | 0.0% |
| Dutch | 452 | 1.1% |
| Eastern European | 143 | 0.3% |
| English | 5,301 | 12.6% |
| Ethiopian | 4 | 0.0% |
| European | 1,221 | 2.9% |
| Filipino | 10 | 0.0% |
| French | 892 | 2.1% |
| French Canadian | 141 | 0.3% |
| German | 10,566 | 25.2% |
| Ghanaian | 105 | 0.3% |
| Greek | 248 | 0.6% |
| Guatemalan | 8 | 0.0% |
| Haitian | 12 | 0.0% |
| Honduran | 73 | 0.2% |
| Hungarian | 314 | 0.7% |
| Indian (Asian) | 471 | 1.1% |
| Irish | 6,579 | 15.7% |
| Iroquois | 19 | 0.1% |
| Italian | 2,516 | 6.0% |
| Jamaican | 46 | 0.1% |
| Kenyan | 37 | 0.1% |
| Korean | 107 | 0.3% |
| Lebanese | 9 | 0.0% |
| Lithuanian | 62 | 0.2% |
| Mexican | 644 | 1.5% |
| Nigerian | 14 | 0.0% |
| Northern European | 64 | 0.2% |
| Norwegian | 197 | 0.5% |
| Pakistani | 24 | 0.1% |
| Peruvian | 109 | 0.3% |
| Polish | 845 | 2.0% |
| Portuguese | 36 | 0.1% |
| Puerto Rican | 491 | 1.2% |
| Romanian | 47 | 0.1% |
| Russian | 69 | 0.2% |
| Samoan | 21 | 0.1% |
| Scandinavian | 395 | 0.9% |
| Scotch-Irish | 603 | 1.4% |
| Scottish | 1,303 | 3.1% |
| Seminole | 10 | 0.0% |
| Senegalese | 52 | 0.1% |
| Serbian | 13 | 0.0% |
| Sierra Leonean | 71 | 0.2% |
| Slavic | 30 | 0.1% |
| Slovak | 95 | 0.2% |
| Somali | 77 | 0.2% |
| South African | 6 | 0.0% |
| South American | 167 | 0.4% |
| Spaniard | 78 | 0.2% |
| Sri Lankan | 285 | 0.7% |
| Subsaharan African | 737 | 1.8% |
| Swedish | 327 | 0.8% |
| Swiss | 290 | 0.7% |
| Thai | 1,416 | 3.4% |
| Ukrainian | 12 | 0.0% |
| Welsh | 1,058 | 2.5% |
| West Indian | 48 | 0.1% |
| Yugoslavian | 60 | 0.1% | View All 77 Rows |
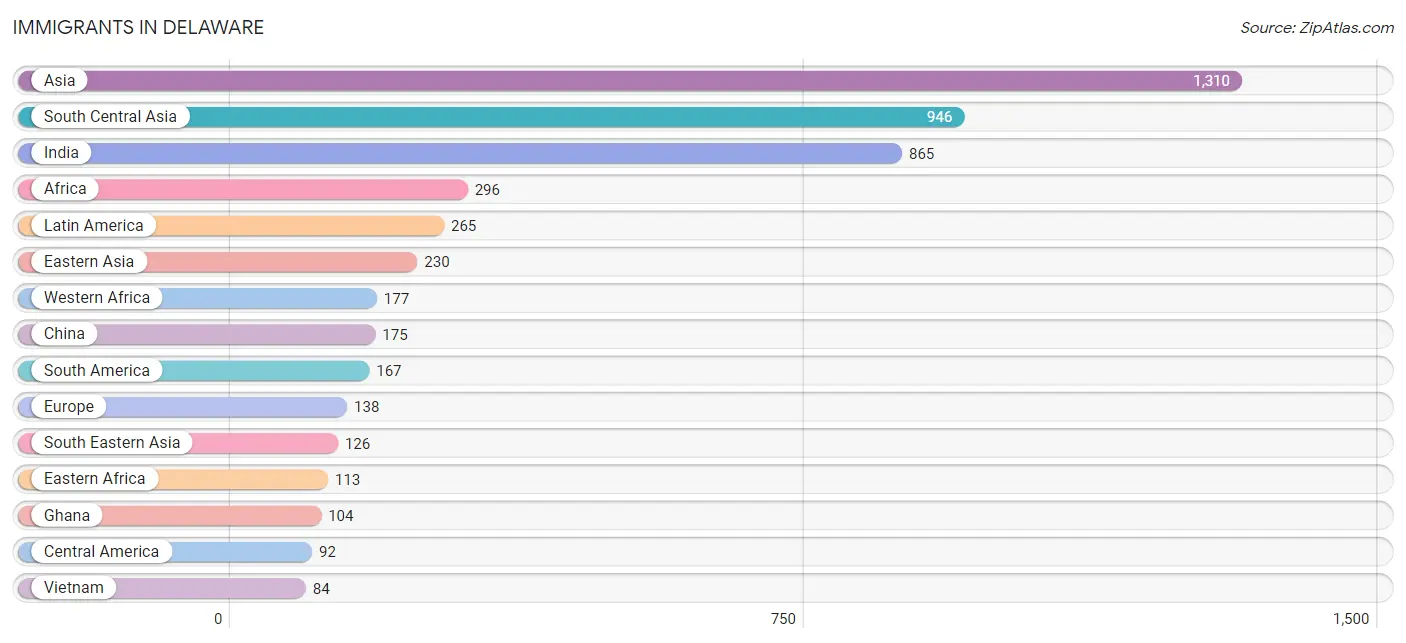
Immigrants in Delaware
The most numerous immigrant groups reported in Delaware came from Asia (1,310 | 3.1%), South Central Asia (946 | 2.3%), India (865 | 2.1%), Africa (296 | 0.7%), and Latin America (265 | 0.6%), together accounting for 8.8% of all Delaware residents.
| Immigration Origin | # Population | % Population |
| Africa | 296 | 0.7% |
| Argentina | 22 | 0.1% |
| Asia | 1,310 | 3.1% |
| Belize | 33 | 0.1% |
| Brazil | 52 | 0.1% |
| Canada | 43 | 0.1% |
| Caribbean | 6 | 0.0% |
| Central America | 92 | 0.2% |
| China | 175 | 0.4% |
| Colombia | 24 | 0.1% |
| Eastern Africa | 113 | 0.3% |
| Eastern Asia | 230 | 0.5% |
| Eastern Europe | 10 | 0.0% |
| El Salvador | 16 | 0.0% |
| England | 23 | 0.1% |
| Ethiopia | 4 | 0.0% |
| Europe | 138 | 0.3% |
| Germany | 48 | 0.1% |
| Ghana | 104 | 0.3% |
| India | 865 | 2.1% |
| Indonesia | 10 | 0.0% |
| Jamaica | 6 | 0.0% |
| Japan | 7 | 0.0% |
| Kenya | 36 | 0.1% |
| Korea | 48 | 0.1% |
| Latin America | 265 | 0.6% |
| Latvia | 10 | 0.0% |
| Liberia | 20 | 0.1% |
| Mexico | 43 | 0.1% |
| Nigeria | 7 | 0.0% |
| Northern Europe | 49 | 0.1% |
| Oceania | 32 | 0.1% |
| Pakistan | 81 | 0.2% |
| Peru | 69 | 0.2% |
| Philippines | 32 | 0.1% |
| Sierra Leone | 46 | 0.1% |
| Somalia | 42 | 0.1% |
| South Africa | 6 | 0.0% |
| South America | 167 | 0.4% |
| South Central Asia | 946 | 2.3% |
| South Eastern Asia | 126 | 0.3% |
| Southern Europe | 31 | 0.1% |
| Spain | 31 | 0.1% |
| Vietnam | 84 | 0.2% |
| Western Africa | 177 | 0.4% |
| Western Asia | 8 | 0.0% |
| Western Europe | 48 | 0.1% |
| Zimbabwe | 12 | 0.0% | View All 48 Rows |
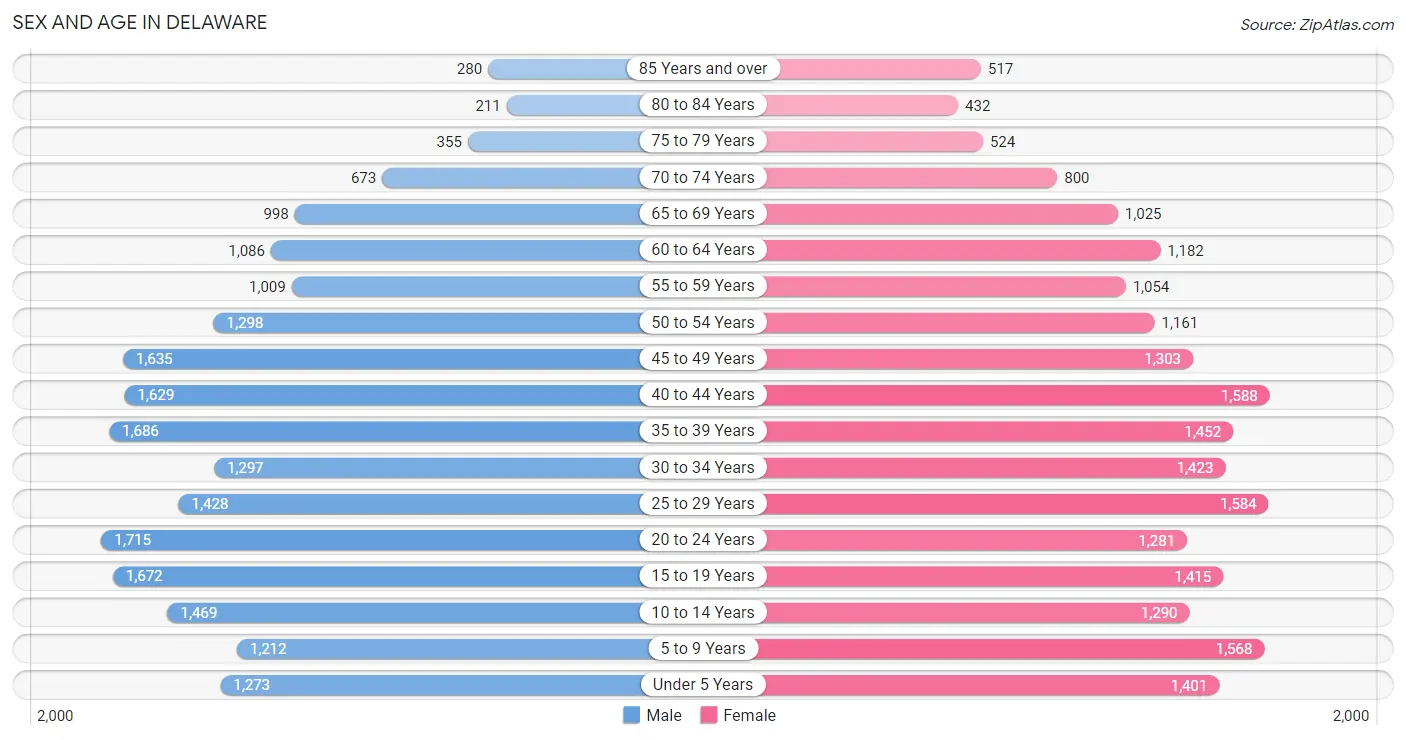
Sex and Age in Delaware
Sex and Age in Delaware
The most populous age groups in Delaware are 20 to 24 Years (1,715 | 8.2%) for men and 40 to 44 Years (1,588 | 7.6%) for women.
| Age Bracket | Male | Female |
| Under 5 Years | 1,273 (6.1%) | 1,401 (6.7%) |
| 5 to 9 Years | 1,212 (5.8%) | 1,568 (7.5%) |
| 10 to 14 Years | 1,469 (7.0%) | 1,290 (6.1%) |
| 15 to 19 Years | 1,672 (8.0%) | 1,415 (6.7%) |
| 20 to 24 Years | 1,715 (8.2%) | 1,281 (6.1%) |
| 25 to 29 Years | 1,428 (6.8%) | 1,584 (7.5%) |
| 30 to 34 Years | 1,297 (6.2%) | 1,423 (6.8%) |
| 35 to 39 Years | 1,686 (8.1%) | 1,452 (6.9%) |
| 40 to 44 Years | 1,629 (7.8%) | 1,588 (7.6%) |
| 45 to 49 Years | 1,635 (7.8%) | 1,303 (6.2%) |
| 50 to 54 Years | 1,298 (6.2%) | 1,161 (5.5%) |
| 55 to 59 Years | 1,009 (4.8%) | 1,054 (5.0%) |
| 60 to 64 Years | 1,086 (5.2%) | 1,182 (5.6%) |
| 65 to 69 Years | 998 (4.8%) | 1,025 (4.9%) |
| 70 to 74 Years | 673 (3.2%) | 800 (3.8%) |
| 75 to 79 Years | 355 (1.7%) | 524 (2.5%) |
| 80 to 84 Years | 211 (1.0%) | 432 (2.1%) |
| 85 Years and over | 280 (1.3%) | 517 (2.5%) |
| Total | 20,926 (100.0%) | 21,000 (100.0%) |
Families and Households in Delaware
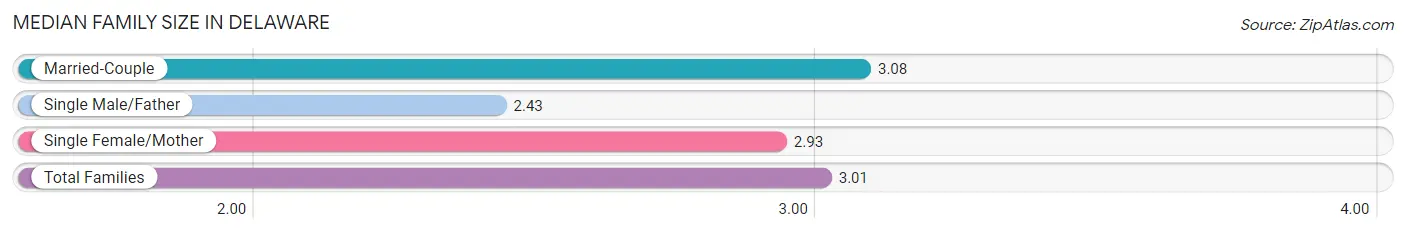
Median Family Size in Delaware
The median family size in Delaware is 3.01 persons per family, with married-couple families (8,572 | 77.9%) accounting for the largest median family size of 3.08 persons per family. On the other hand, single male/father families (897 | 8.2%) represent the smallest median family size with 2.43 persons per family.
| Family Type | # Families | Family Size |
| Married-Couple | 8,572 (77.9%) | 3.08 |
| Single Male/Father | 897 (8.2%) | 2.43 |
| Single Female/Mother | 1,535 (14.0%) | 2.93 |
| Total Families | 11,004 (100.0%) | 3.01 |
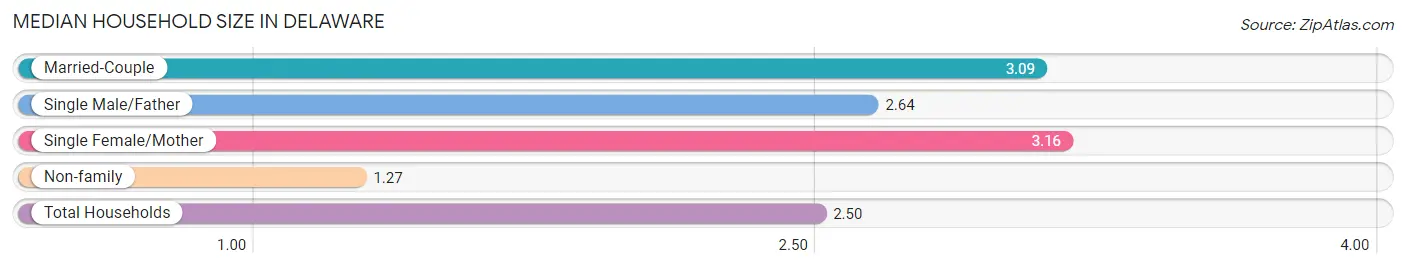
Median Household Size in Delaware
The median household size in Delaware is 2.50 persons per household, with single female/mother households (1,535 | 9.6%) accounting for the largest median household size of 3.16 persons per household. non-family households (5,022 | 31.3%) represent the smallest median household size with 1.27 persons per household.
| Household Type | # Households | Household Size |
| Married-Couple | 8,572 (53.5%) | 3.09 |
| Single Male/Father | 897 (5.6%) | 2.64 |
| Single Female/Mother | 1,535 (9.6%) | 3.16 |
| Non-family | 5,022 (31.3%) | 1.27 |
| Total Households | 16,026 (100.0%) | 2.50 |
Household Size by Marriage Status in Delaware
Out of a total of 16,026 households in Delaware, 11,004 (68.7%) are family households, while 5,022 (31.3%) are nonfamily households. The most numerous type of family households are 2-person households, comprising 4,644, and the most common type of nonfamily households are 1-person households, comprising 4,031.
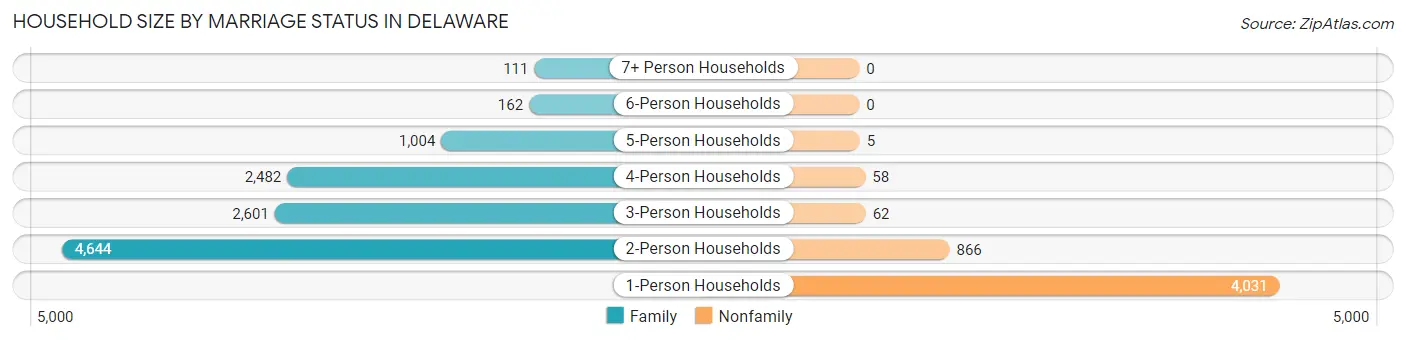
| Household Size | Family Households | Nonfamily Households |
| 1-Person Households | - | 4,031 (25.2%) |
| 2-Person Households | 4,644 (29.0%) | 866 (5.4%) |
| 3-Person Households | 2,601 (16.2%) | 62 (0.4%) |
| 4-Person Households | 2,482 (15.5%) | 58 (0.4%) |
| 5-Person Households | 1,004 (6.3%) | 5 (0.0%) |
| 6-Person Households | 162 (1.0%) | 0 (0.0%) |
| 7+ Person Households | 111 (0.7%) | 0 (0.0%) |
| Total | 11,004 (68.7%) | 5,022 (31.3%) |
Female Fertility in Delaware
Fertility by Age in Delaware
Average fertility rate in Delaware is 46.0 births per 1,000 women. Women in the age bracket of 20 to 34 years have the highest fertility rate with 97.0 births per 1,000 women. Women in the age bracket of 20 to 34 years acount for 88.4% of all women with births.
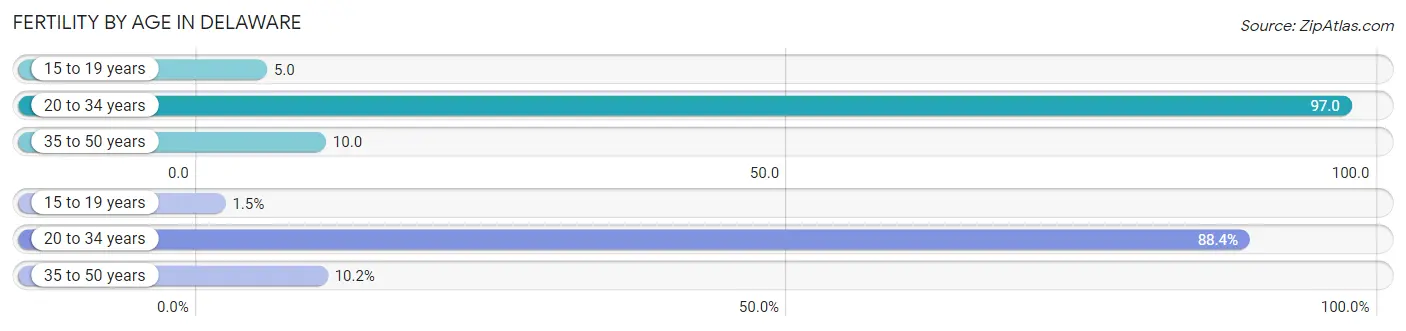
| Age Bracket | Women with Births | Births / 1,000 Women |
| 15 to 19 years | 7 (1.5%) | 5.0 |
| 20 to 34 years | 418 (88.4%) | 97.0 |
| 35 to 50 years | 48 (10.2%) | 10.0 |
| Total | 473 (100.0%) | 46.0 |
Fertility by Age by Marriage Status in Delaware
85.4% of women with births (473) in Delaware are married. The highest percentage of unmarried women with births falls into 20 to 34 years age bracket with 16.5% of them unmarried at the time of birth, while the lowest percentage of unmarried women with births belong to 15 to 19 years age bracket with 0.0% of them unmarried.
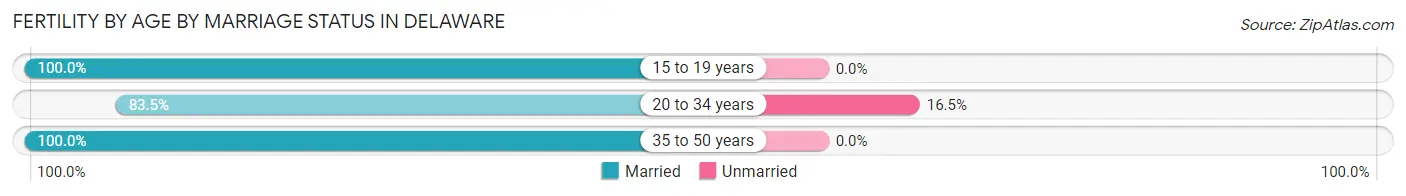
| Age Bracket | Married | Unmarried |
| 15 to 19 years | 7 (100.0%) | 0 (0.0%) |
| 20 to 34 years | 349 (83.5%) | 69 (16.5%) |
| 35 to 50 years | 48 (100.0%) | 0 (0.0%) |
| Total | 404 (85.4%) | 69 (14.6%) |
Fertility by Education in Delaware
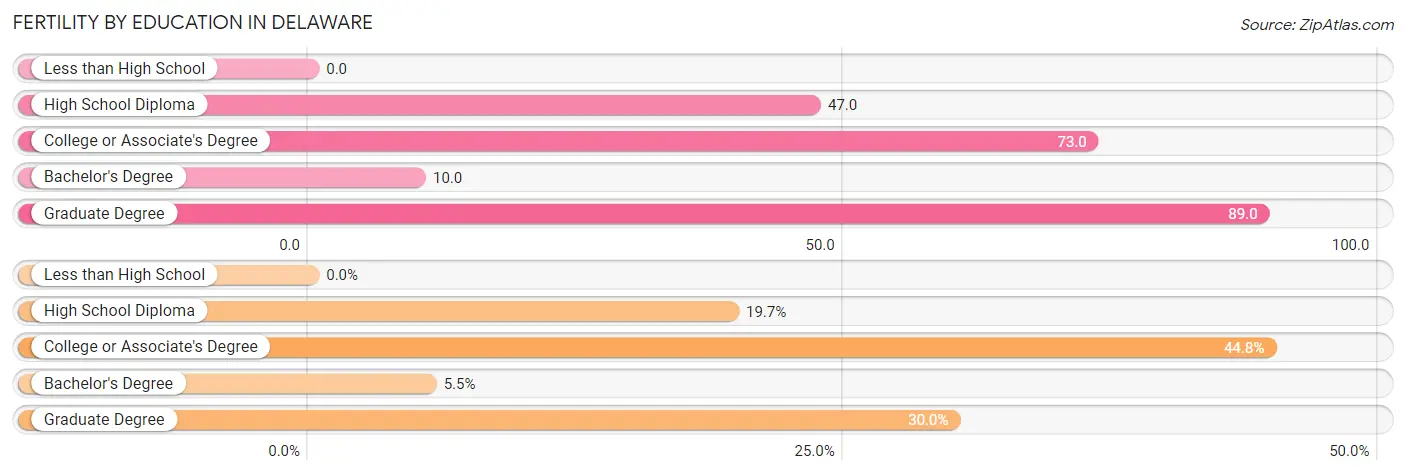
| Educational Attainment | Women with Births | Births / 1,000 Women |
| Less than High School | 0 (0.0%) | 0.0 |
| High School Diploma | 93 (19.7%) | 47.0 |
| College or Associate's Degree | 212 (44.8%) | 73.0 |
| Bachelor's Degree | 26 (5.5%) | 10.0 |
| Graduate Degree | 142 (30.0%) | 89.0 |
| Total | 473 (100.0%) | 46.0 |
Fertility by Education by Marriage Status in Delaware
14.6% of women with births in Delaware are unmarried. Women with the educational attainment of graduate degree are most likely to be married with 100.0% of them married at childbirth, while women with the educational attainment of bachelor's degree are least likely to be married with 42.3% of them unmarried at childbirth.
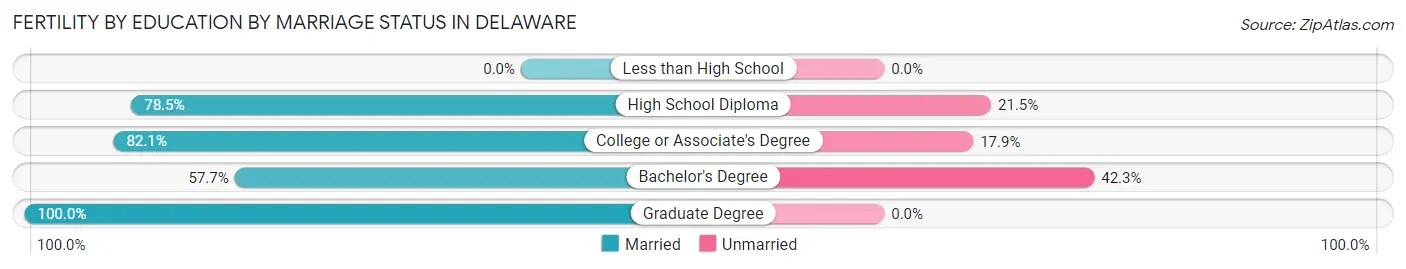
| Educational Attainment | Married | Unmarried |
| Less than High School | 0 (0.0%) | 0 (0.0%) |
| High School Diploma | 73 (78.5%) | 20 (21.5%) |
| College or Associate's Degree | 174 (82.1%) | 38 (17.9%) |
| Bachelor's Degree | 15 (57.7%) | 11 (42.3%) |
| Graduate Degree | 142 (100.0%) | 0 (0.0%) |
| Total | 404 (85.4%) | 69 (14.6%) |
Employment Characteristics in Delaware
Employment by Class of Employer in Delaware
Among the 22,282 employed individuals in Delaware, private company employees (14,903 | 66.9%), not-for-profit organizations (2,917 | 13.1%), and local government employees (1,919 | 8.6%) make up the most common classes of employment.
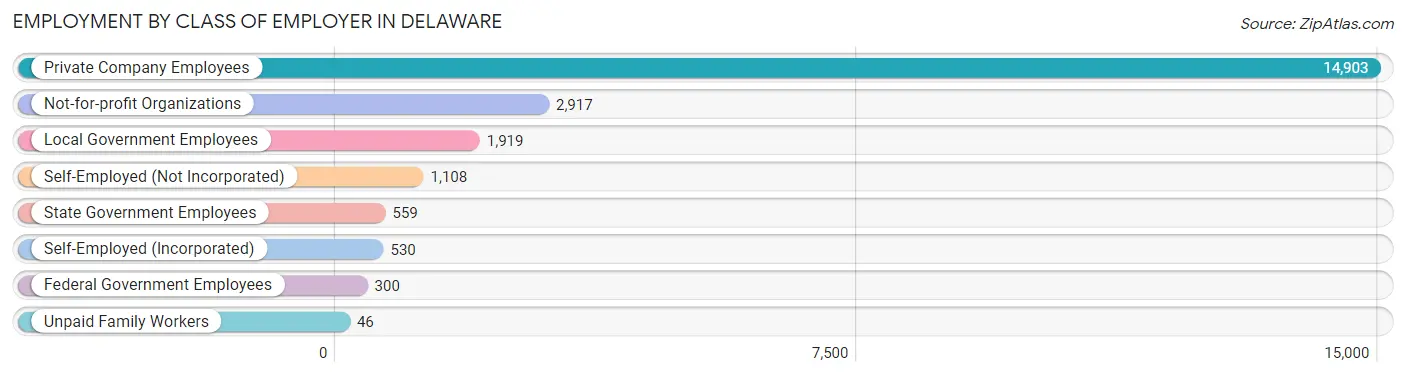
| Employer Class | # Employees | % Employees |
| Private Company Employees | 14,903 | 66.9% |
| Self-Employed (Incorporated) | 530 | 2.4% |
| Self-Employed (Not Incorporated) | 1,108 | 5.0% |
| Not-for-profit Organizations | 2,917 | 13.1% |
| Local Government Employees | 1,919 | 8.6% |
| State Government Employees | 559 | 2.5% |
| Federal Government Employees | 300 | 1.3% |
| Unpaid Family Workers | 46 | 0.2% |
| Total | 22,282 | 100.0% |
Employment Status by Age in Delaware
According to the labor force statistics for Delaware, out of the total population over 16 years of age (33,252), 70.7% or 23,509 individuals are in the labor force, with 3.2% or 752 of them unemployed. The age group with the highest labor force participation rate is 35 to 44 years, with 90.2% or 5,732 individuals in the labor force. Within the labor force, the 16 to 19 years age range has the highest percentage of unemployed individuals, with 7.6% or 106 of them being unemployed.
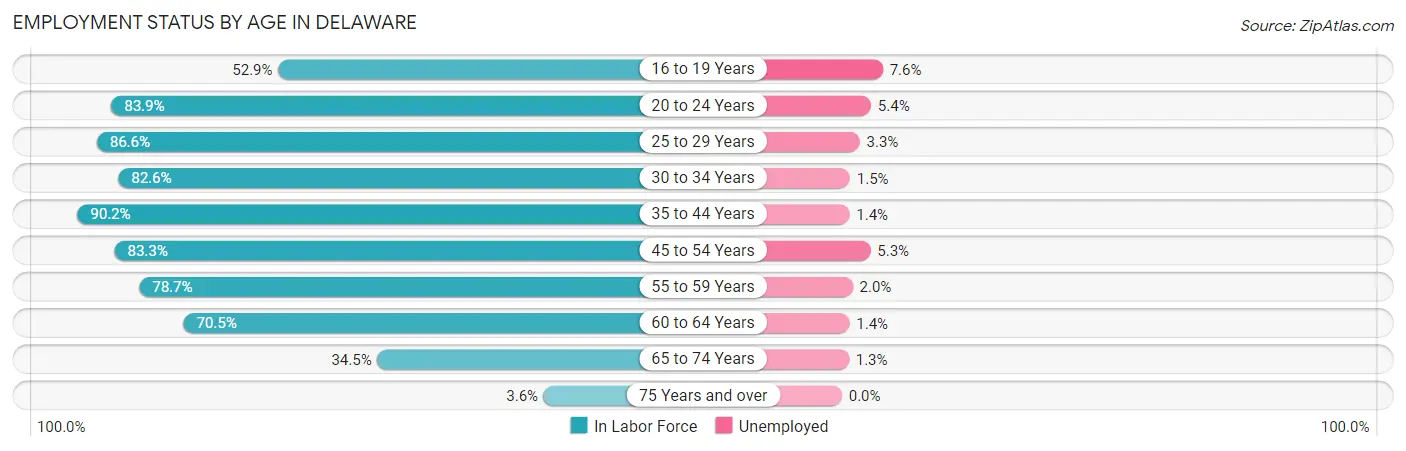
| Age Bracket | In Labor Force | Unemployed |
| 16 to 19 Years | 1,389 (52.9%) | 106 (7.6%) |
| 20 to 24 Years | 2,514 (83.9%) | 136 (5.4%) |
| 25 to 29 Years | 2,608 (86.6%) | 86 (3.3%) |
| 30 to 34 Years | 2,247 (82.6%) | 34 (1.5%) |
| 35 to 44 Years | 5,732 (90.2%) | 80 (1.4%) |
| 45 to 54 Years | 4,496 (83.3%) | 238 (5.3%) |
| 55 to 59 Years | 1,624 (78.7%) | 32 (2.0%) |
| 60 to 64 Years | 1,599 (70.5%) | 22 (1.4%) |
| 65 to 74 Years | 1,206 (34.5%) | 16 (1.3%) |
| 75 Years and over | 83 (3.6%) | 0 (0.0%) |
| Total | 23,509 (70.7%) | 752 (3.2%) |
Employment Status by Educational Attainment in Delaware
According to labor force statistics for Delaware, 83.9% of individuals (18,303) out of the total population between 25 and 64 years of age (21,815) are in the labor force, with 2.7% or 494 of them being unemployed. The group with the highest labor force participation rate are those with the educational attainment of bachelor's degree or higher, with 88.7% or 9,008 individuals in the labor force. Within the labor force, individuals with high school diploma education have the highest percentage of unemployment, with 4.3% or 166 of them being unemployed.
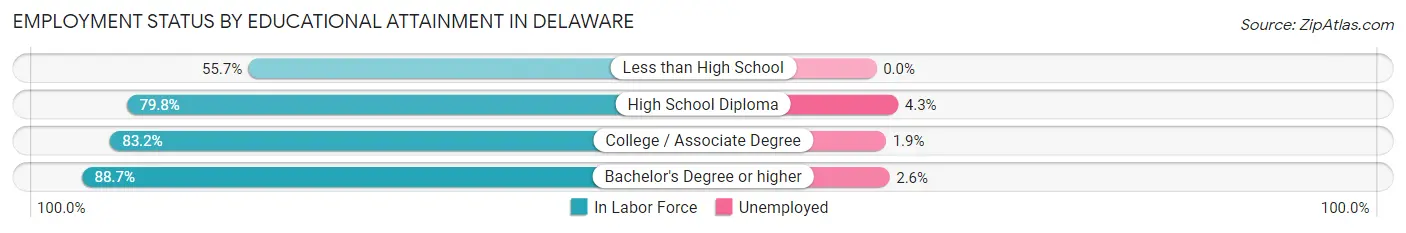
| Educational Attainment | In Labor Force | Unemployed |
| Less than High School | 480 (55.7%) | 0 (0.0%) |
| High School Diploma | 3,860 (79.8%) | 208 (4.3%) |
| College / Associate Degree | 4,959 (83.2%) | 113 (1.9%) |
| Bachelor's Degree or higher | 9,008 (88.7%) | 264 (2.6%) |
| Total | 18,303 (83.9%) | 589 (2.7%) |
Employment Occupations by Sex in Delaware
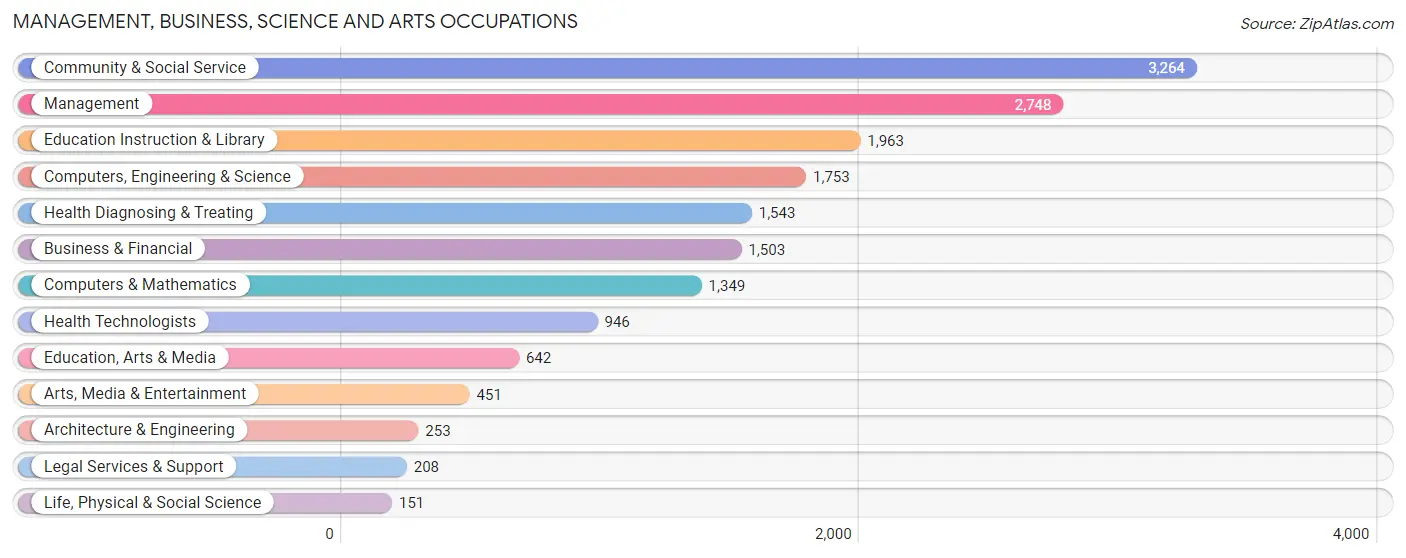
Management, Business, Science and Arts Occupations
The most common Management, Business, Science and Arts occupations in Delaware are Community & Social Service (3,264 | 14.4%), Management (2,748 | 12.1%), Education Instruction & Library (1,963 | 8.6%), Computers, Engineering & Science (1,753 | 7.7%), and Health Diagnosing & Treating (1,543 | 6.8%).
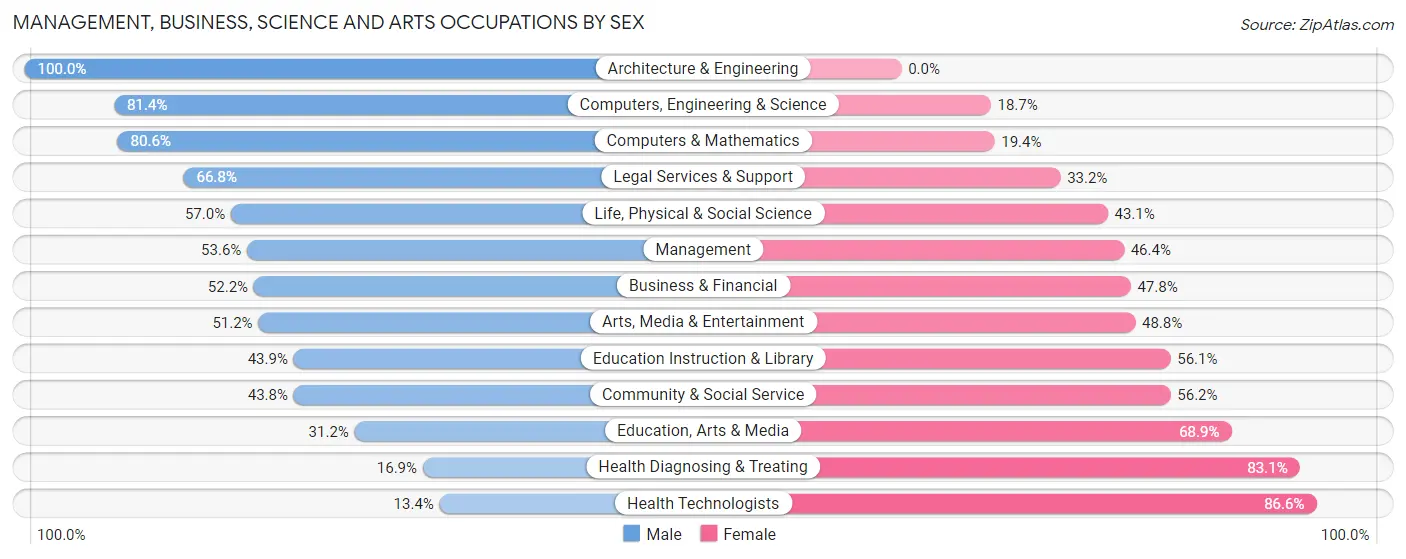
Management, Business, Science and Arts Occupations by Sex
Within the Management, Business, Science and Arts occupations in Delaware, the most male-oriented occupations are Architecture & Engineering (100.0%), Computers, Engineering & Science (81.4%), and Computers & Mathematics (80.6%), while the most female-oriented occupations are Health Technologists (86.6%), Health Diagnosing & Treating (83.1%), and Education, Arts & Media (68.9%).
| Occupation | Male | Female |
| Management | 1,472 (53.6%) | 1,276 (46.4%) |
| Business & Financial | 784 (52.2%) | 719 (47.8%) |
| Computers, Engineering & Science | 1,426 (81.4%) | 327 (18.6%) |
| Computers & Mathematics | 1,087 (80.6%) | 262 (19.4%) |
| Architecture & Engineering | 253 (100.0%) | 0 (0.0%) |
| Life, Physical & Social Science | 86 (57.0%) | 65 (43.0%) |
| Community & Social Service | 1,431 (43.8%) | 1,833 (56.2%) |
| Education, Arts & Media | 200 (31.1%) | 442 (68.9%) |
| Legal Services & Support | 139 (66.8%) | 69 (33.2%) |
| Education Instruction & Library | 861 (43.9%) | 1,102 (56.1%) |
| Arts, Media & Entertainment | 231 (51.2%) | 220 (48.8%) |
| Health Diagnosing & Treating | 261 (16.9%) | 1,282 (83.1%) |
| Health Technologists | 127 (13.4%) | 819 (86.6%) |
| Total (Category) | 5,374 (49.7%) | 5,437 (50.3%) |
| Total (Overall) | 12,203 (53.8%) | 10,495 (46.2%) |
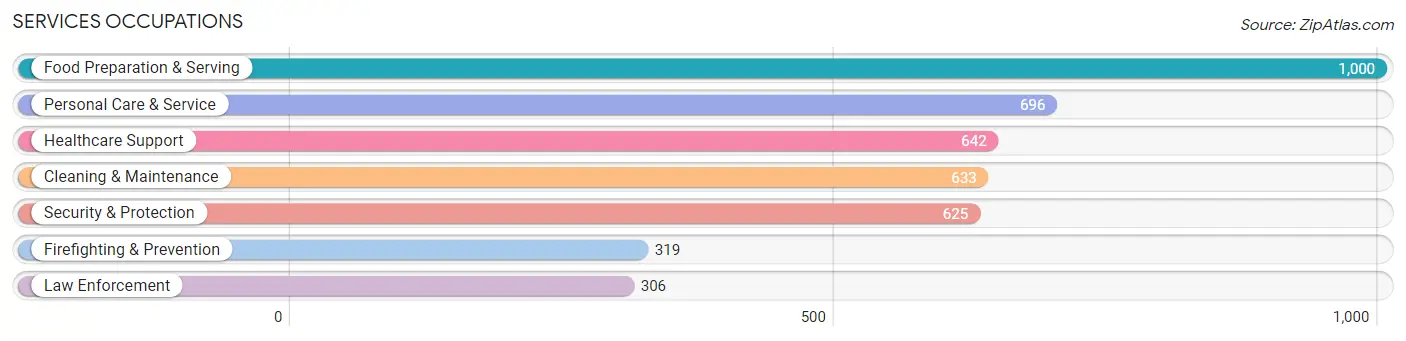
Services Occupations
The most common Services occupations in Delaware are Food Preparation & Serving (1,000 | 4.4%), Personal Care & Service (696 | 3.1%), Healthcare Support (642 | 2.8%), Cleaning & Maintenance (633 | 2.8%), and Security & Protection (625 | 2.8%).
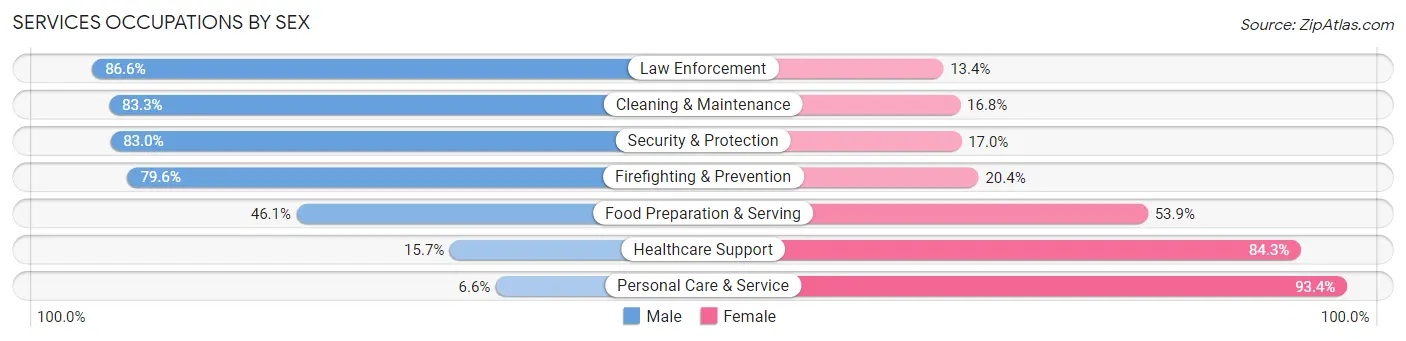
Services Occupations by Sex
Within the Services occupations in Delaware, the most male-oriented occupations are Law Enforcement (86.6%), Cleaning & Maintenance (83.3%), and Security & Protection (83.0%), while the most female-oriented occupations are Personal Care & Service (93.4%), Healthcare Support (84.3%), and Food Preparation & Serving (53.9%).
| Occupation | Male | Female |
| Healthcare Support | 101 (15.7%) | 541 (84.3%) |
| Security & Protection | 519 (83.0%) | 106 (17.0%) |
| Firefighting & Prevention | 254 (79.6%) | 65 (20.4%) |
| Law Enforcement | 265 (86.6%) | 41 (13.4%) |
| Food Preparation & Serving | 461 (46.1%) | 539 (53.9%) |
| Cleaning & Maintenance | 527 (83.3%) | 106 (16.8%) |
| Personal Care & Service | 46 (6.6%) | 650 (93.4%) |
| Total (Category) | 1,654 (46.0%) | 1,942 (54.0%) |
| Total (Overall) | 12,203 (53.8%) | 10,495 (46.2%) |
Sales and Office Occupations
The most common Sales and Office occupations in Delaware are Office & Administration (2,566 | 11.3%), and Sales & Related (1,808 | 8.0%).

Sales and Office Occupations by Sex
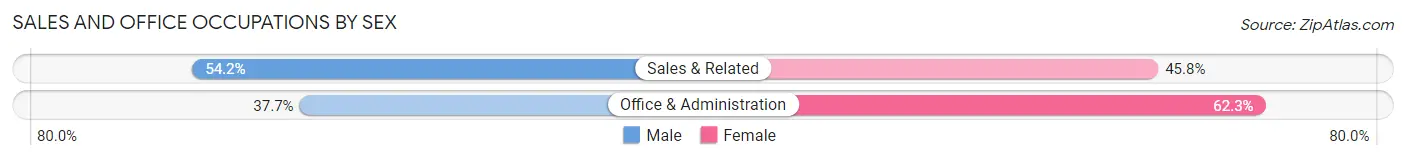
| Occupation | Male | Female |
| Sales & Related | 980 (54.2%) | 828 (45.8%) |
| Office & Administration | 968 (37.7%) | 1,598 (62.3%) |
| Total (Category) | 1,948 (44.5%) | 2,426 (55.5%) |
| Total (Overall) | 12,203 (53.8%) | 10,495 (46.2%) |
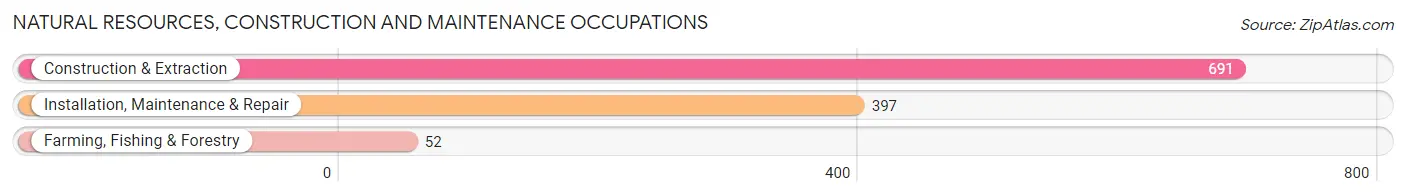
Natural Resources, Construction and Maintenance Occupations
The most common Natural Resources, Construction and Maintenance occupations in Delaware are Construction & Extraction (691 | 3.0%), Installation, Maintenance & Repair (397 | 1.8%), and Farming, Fishing & Forestry (52 | 0.2%).
Natural Resources, Construction and Maintenance Occupations by Sex
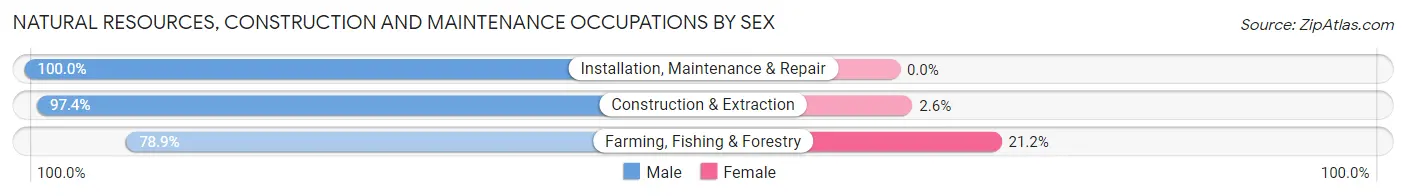
| Occupation | Male | Female |
| Farming, Fishing & Forestry | 41 (78.8%) | 11 (21.1%) |
| Construction & Extraction | 673 (97.4%) | 18 (2.6%) |
| Installation, Maintenance & Repair | 397 (100.0%) | 0 (0.0%) |
| Total (Category) | 1,111 (97.5%) | 29 (2.5%) |
| Total (Overall) | 12,203 (53.8%) | 10,495 (46.2%) |
Production, Transportation and Moving Occupations
The most common Production, Transportation and Moving occupations in Delaware are Production (1,170 | 5.1%), Material Moving (896 | 4.0%), and Transportation (711 | 3.1%).
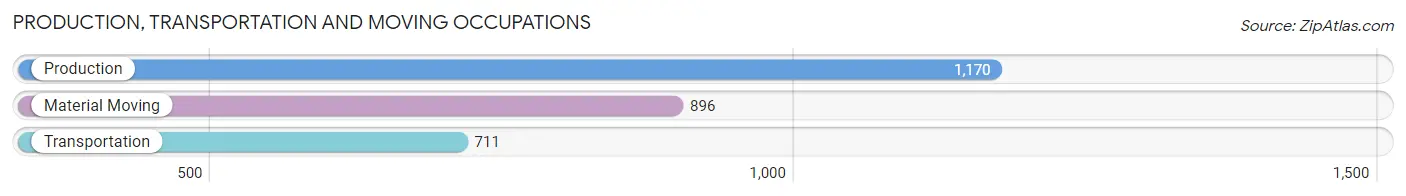
Production, Transportation and Moving Occupations by Sex
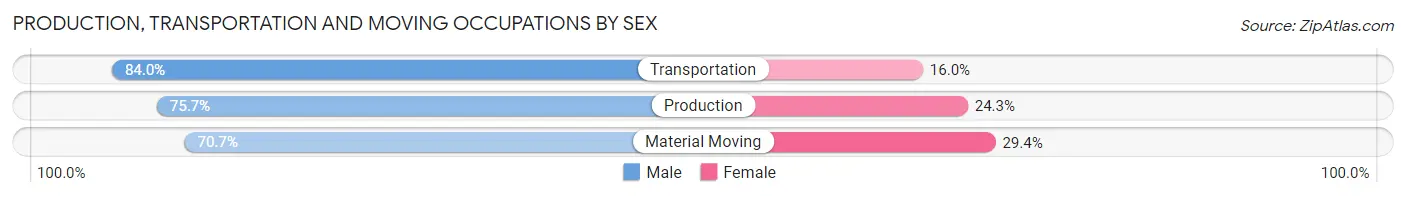
| Occupation | Male | Female |
| Production | 886 (75.7%) | 284 (24.3%) |
| Transportation | 597 (84.0%) | 114 (16.0%) |
| Material Moving | 633 (70.7%) | 263 (29.3%) |
| Total (Category) | 2,116 (76.2%) | 661 (23.8%) |
| Total (Overall) | 12,203 (53.8%) | 10,495 (46.2%) |
Employment Industries by Sex in Delaware
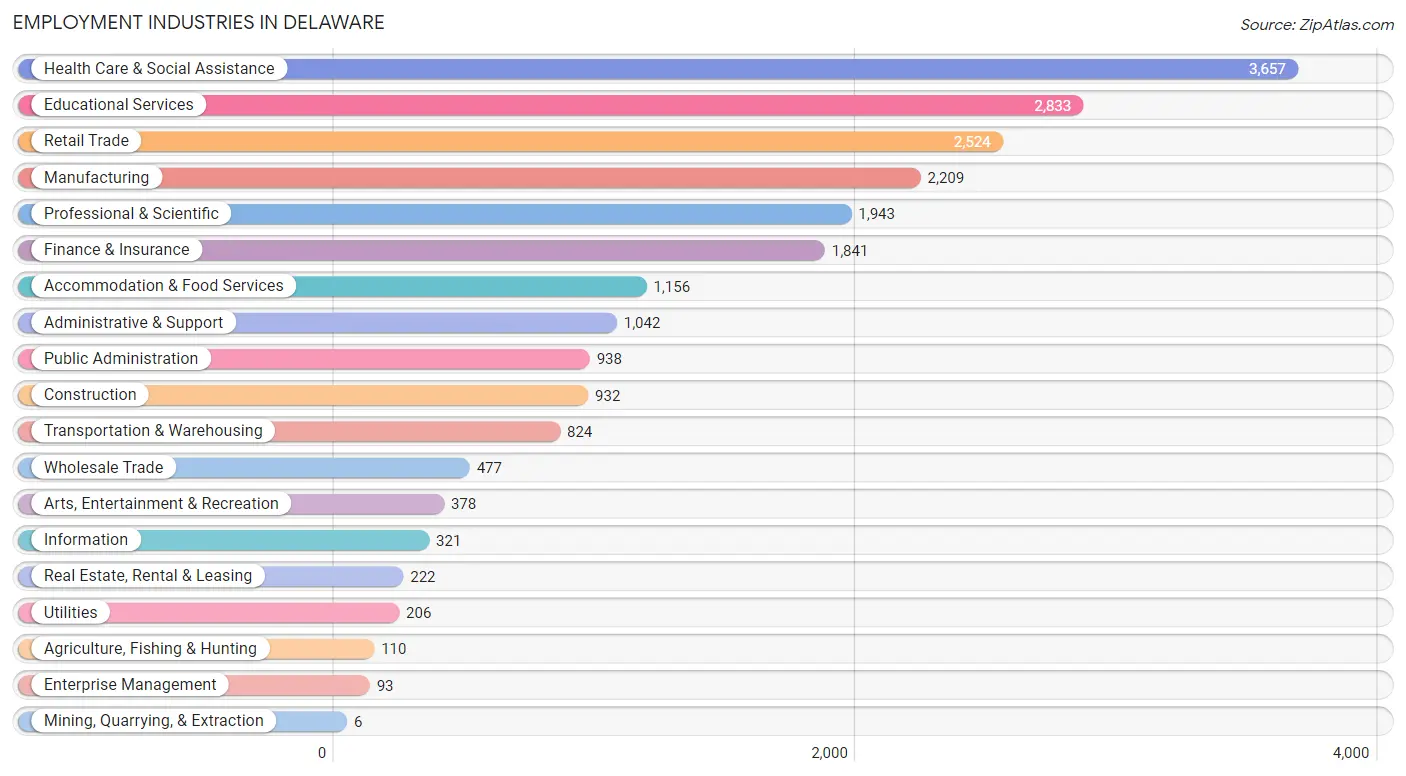
Employment Industries in Delaware
The major employment industries in Delaware include Health Care & Social Assistance (3,657 | 16.1%), Educational Services (2,833 | 12.5%), Retail Trade (2,524 | 11.1%), Manufacturing (2,209 | 9.7%), and Professional & Scientific (1,943 | 8.6%).
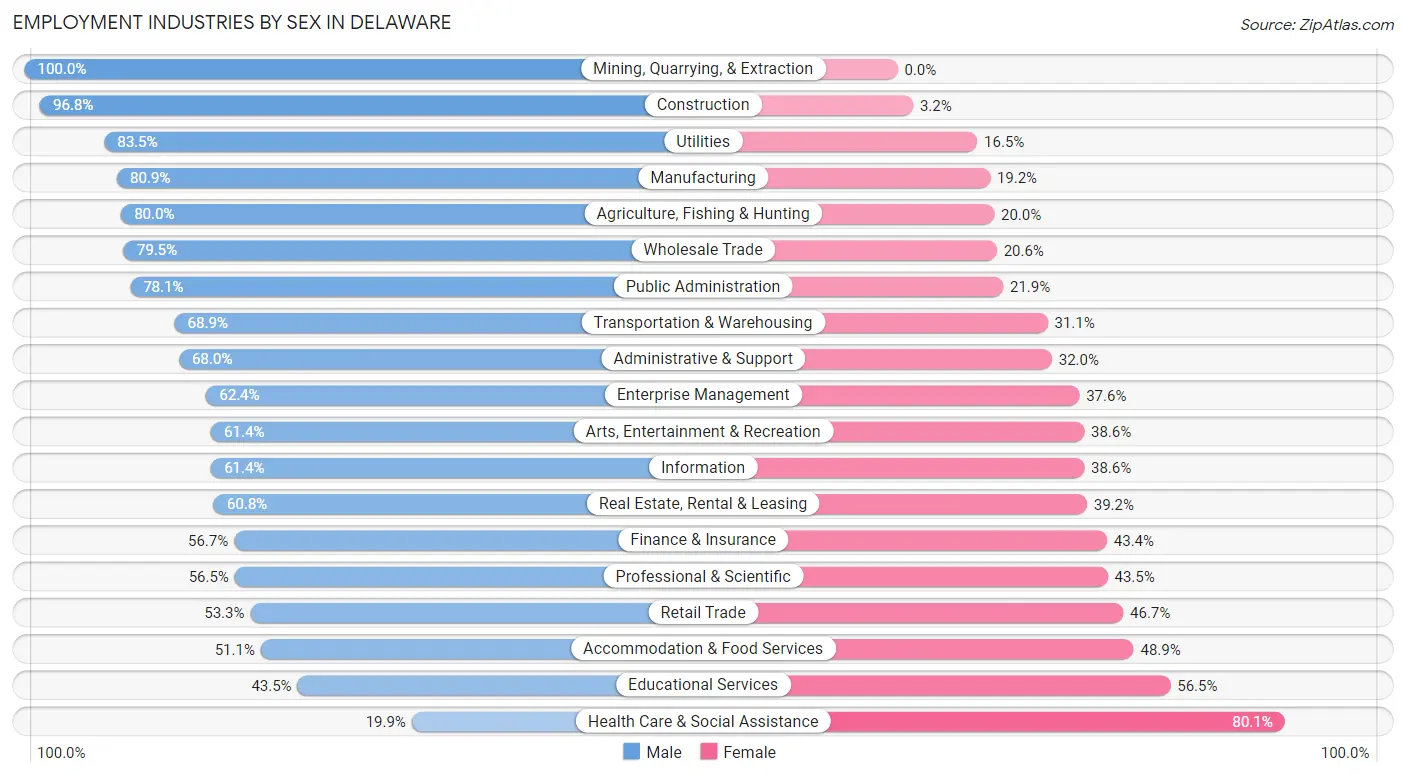
Employment Industries by Sex in Delaware
The Delaware industries that see more men than women are Mining, Quarrying, & Extraction (100.0%), Construction (96.8%), and Utilities (83.5%), whereas the industries that tend to have a higher number of women are Health Care & Social Assistance (80.1%), Educational Services (56.5%), and Accommodation & Food Services (48.9%).
| Industry | Male | Female |
| Agriculture, Fishing & Hunting | 88 (80.0%) | 22 (20.0%) |
| Mining, Quarrying, & Extraction | 6 (100.0%) | 0 (0.0%) |
| Construction | 902 (96.8%) | 30 (3.2%) |
| Manufacturing | 1,786 (80.8%) | 423 (19.2%) |
| Wholesale Trade | 379 (79.4%) | 98 (20.5%) |
| Retail Trade | 1,345 (53.3%) | 1,179 (46.7%) |
| Transportation & Warehousing | 568 (68.9%) | 256 (31.1%) |
| Utilities | 172 (83.5%) | 34 (16.5%) |
| Information | 197 (61.4%) | 124 (38.6%) |
| Finance & Insurance | 1,043 (56.7%) | 798 (43.3%) |
| Real Estate, Rental & Leasing | 135 (60.8%) | 87 (39.2%) |
| Professional & Scientific | 1,098 (56.5%) | 845 (43.5%) |
| Enterprise Management | 58 (62.4%) | 35 (37.6%) |
| Administrative & Support | 709 (68.0%) | 333 (32.0%) |
| Educational Services | 1,233 (43.5%) | 1,600 (56.5%) |
| Health Care & Social Assistance | 727 (19.9%) | 2,930 (80.1%) |
| Arts, Entertainment & Recreation | 232 (61.4%) | 146 (38.6%) |
| Accommodation & Food Services | 591 (51.1%) | 565 (48.9%) |
| Public Administration | 733 (78.1%) | 205 (21.9%) |
| Total | 12,203 (53.8%) | 10,495 (46.2%) |
Education in Delaware
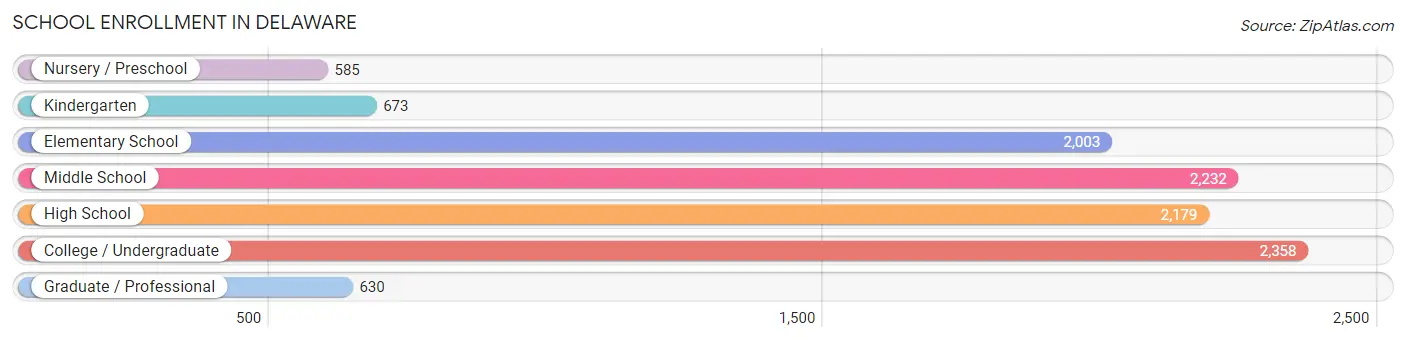
School Enrollment in Delaware
The most common levels of schooling among the 10,660 students in Delaware are college / undergraduate (2,358 | 22.1%), middle school (2,232 | 20.9%), and high school (2,179 | 20.4%).
| School Level | # Students | % Students |
| Nursery / Preschool | 585 | 5.5% |
| Kindergarten | 673 | 6.3% |
| Elementary School | 2,003 | 18.8% |
| Middle School | 2,232 | 20.9% |
| High School | 2,179 | 20.4% |
| College / Undergraduate | 2,358 | 22.1% |
| Graduate / Professional | 630 | 5.9% |
| Total | 10,660 | 100.0% |
School Enrollment by Age by Funding Source in Delaware
Out of a total of 10,660 students who are enrolled in schools in Delaware, 2,772 (26.0%) attend a private institution, while the remaining 7,888 (74.0%) are enrolled in public schools. The age group of 20 to 24 year olds has the highest likelihood of being enrolled in private schools, with 666 (63.8% in the age bracket) enrolled. Conversely, the age group of 15 to 17 year olds has the lowest likelihood of being enrolled in a private school, with 1,417 (94.9% in the age bracket) attending a public institution.
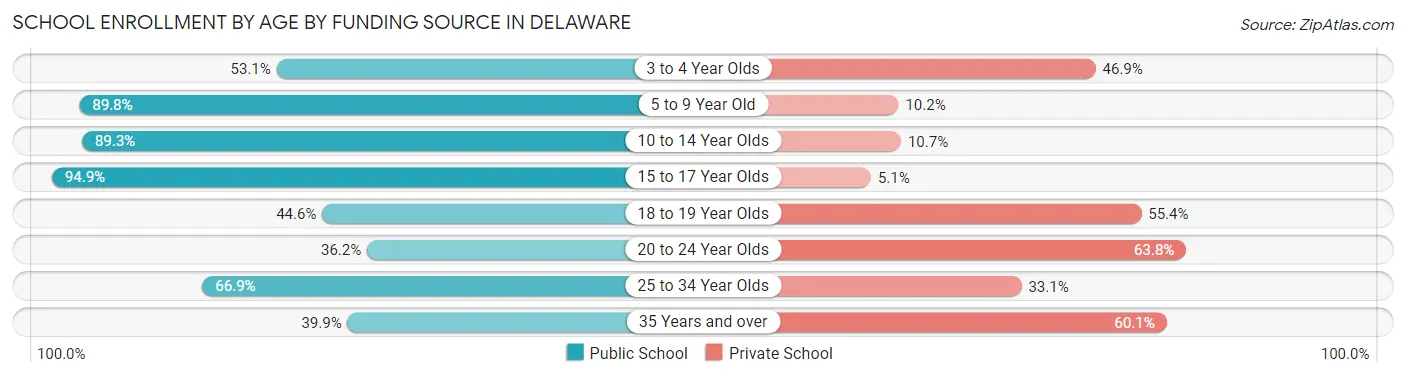
| Age Bracket | Public School | Private School |
| 3 to 4 Year Olds | 251 (53.1%) | 222 (46.9%) |
| 5 to 9 Year Old | 2,233 (89.8%) | 254 (10.2%) |
| 10 to 14 Year Olds | 2,458 (89.3%) | 294 (10.7%) |
| 15 to 17 Year Olds | 1,417 (94.9%) | 76 (5.1%) |
| 18 to 19 Year Olds | 618 (44.6%) | 769 (55.4%) |
| 20 to 24 Year Olds | 378 (36.2%) | 666 (63.8%) |
| 25 to 34 Year Olds | 309 (66.9%) | 153 (33.1%) |
| 35 Years and over | 224 (39.9%) | 338 (60.1%) |
| Total | 7,888 (74.0%) | 2,772 (26.0%) |
Educational Attainment by Field of Study in Delaware
Business (2,189 | 16.8%), education (2,107 | 16.1%), science & technology (1,377 | 10.5%), engineering (1,065 | 8.2%), and computers & mathematics (954 | 7.3%) are the most common fields of study among 13,069 individuals in Delaware who have obtained a bachelor's degree or higher.
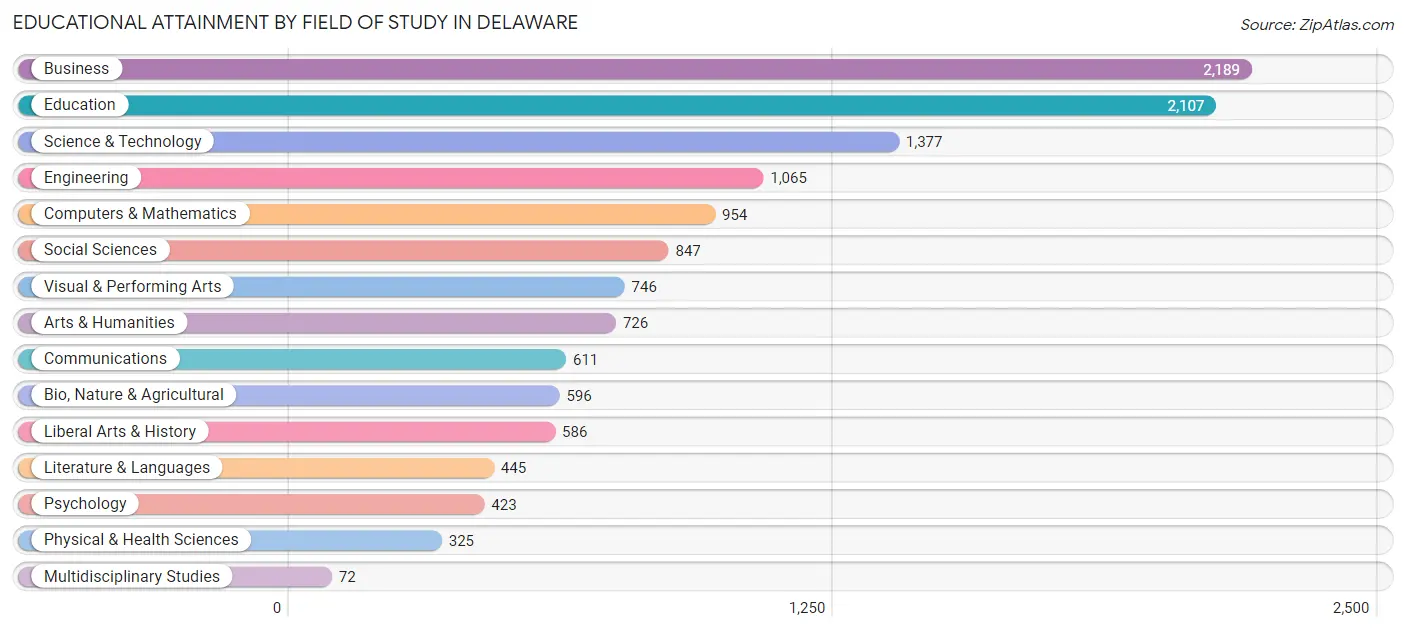
| Field of Study | # Graduates | % Graduates |
| Computers & Mathematics | 954 | 7.3% |
| Bio, Nature & Agricultural | 596 | 4.6% |
| Physical & Health Sciences | 325 | 2.5% |
| Psychology | 423 | 3.2% |
| Social Sciences | 847 | 6.5% |
| Engineering | 1,065 | 8.2% |
| Multidisciplinary Studies | 72 | 0.5% |
| Science & Technology | 1,377 | 10.5% |
| Business | 2,189 | 16.8% |
| Education | 2,107 | 16.1% |
| Literature & Languages | 445 | 3.4% |
| Liberal Arts & History | 586 | 4.5% |
| Visual & Performing Arts | 746 | 5.7% |
| Communications | 611 | 4.7% |
| Arts & Humanities | 726 | 5.6% |
| Total | 13,069 | 100.0% |
Transportation & Commute in Delaware
Vehicle Availability by Sex in Delaware
The most prevalent vehicle ownership categories in Delaware are males with 2 vehicles (6,195, accounting for 52.8%) and females with 2 vehicles (5,385, making up 63.0%).
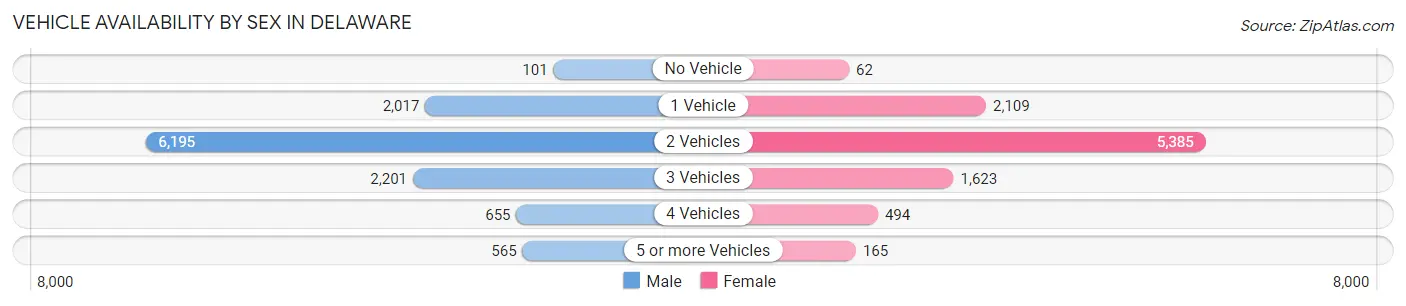
| Vehicles Available | Male | Female |
| No Vehicle | 101 (0.9%) | 62 (0.6%) |
| 1 Vehicle | 2,017 (17.2%) | 2,109 (21.4%) |
| 2 Vehicles | 6,195 (52.8%) | 5,385 (54.7%) |
| 3 Vehicles | 2,201 (18.8%) | 1,623 (16.5%) |
| 4 Vehicles | 655 (5.6%) | 494 (5.0%) |
| 5 or more Vehicles | 565 (4.8%) | 165 (1.7%) |
| Total | 11,734 (100.0%) | 9,838 (100.0%) |
Commute Time in Delaware
The most frequently occuring commute durations in Delaware are 30 to 34 minutes (2,891 commuters, 15.1%), 15 to 19 minutes (2,290 commuters, 12.0%), and 10 to 14 minutes (2,260 commuters, 11.8%).
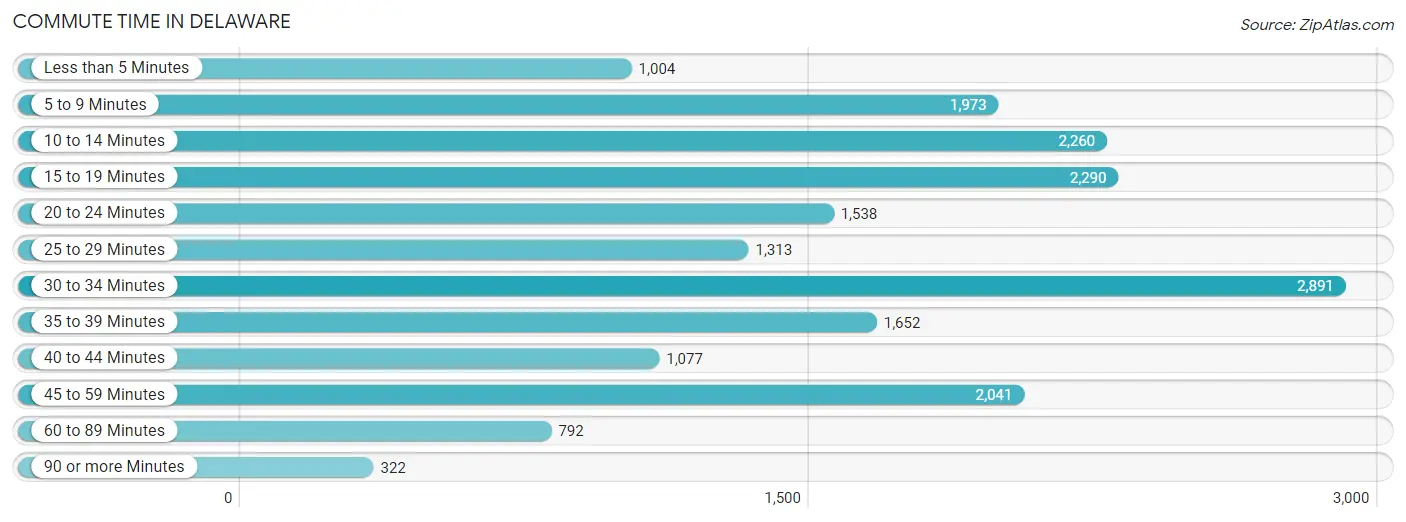
| Commute Time | # Commuters | % Commuters |
| Less than 5 Minutes | 1,004 | 5.2% |
| 5 to 9 Minutes | 1,973 | 10.3% |
| 10 to 14 Minutes | 2,260 | 11.8% |
| 15 to 19 Minutes | 2,290 | 12.0% |
| 20 to 24 Minutes | 1,538 | 8.0% |
| 25 to 29 Minutes | 1,313 | 6.9% |
| 30 to 34 Minutes | 2,891 | 15.1% |
| 35 to 39 Minutes | 1,652 | 8.6% |
| 40 to 44 Minutes | 1,077 | 5.6% |
| 45 to 59 Minutes | 2,041 | 10.7% |
| 60 to 89 Minutes | 792 | 4.1% |
| 90 or more Minutes | 322 | 1.7% |
Commute Time by Sex in Delaware
The most common commute times in Delaware are 30 to 34 minutes (1,621 commuters, 15.2%) for males and 10 to 14 minutes (1,296 commuters, 15.2%) for females.
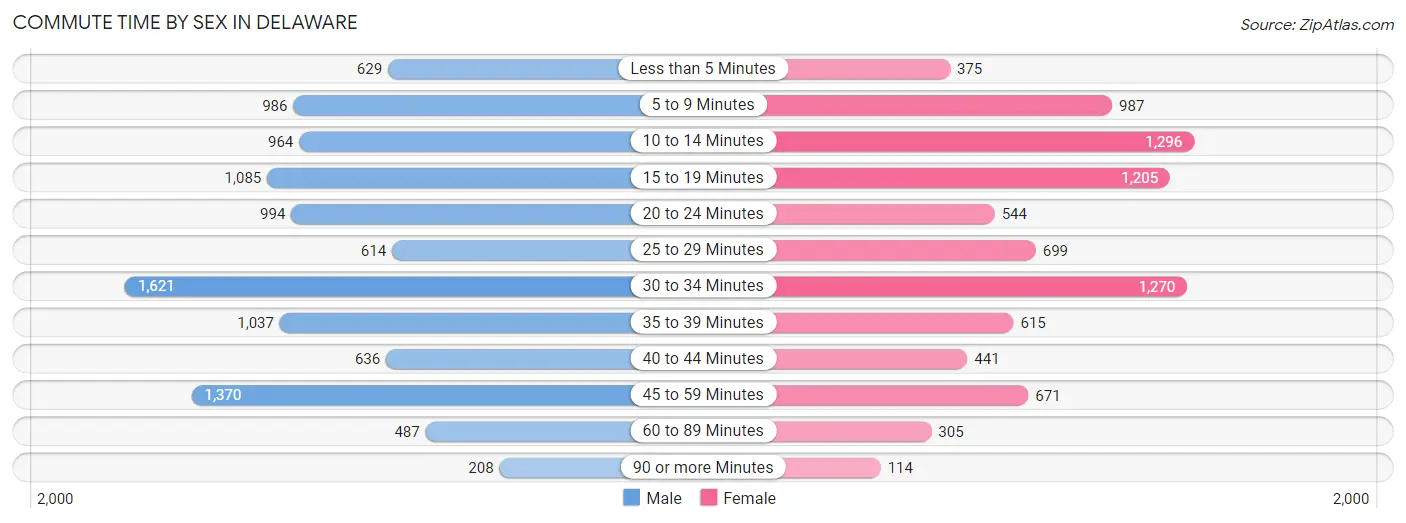
| Commute Time | Male | Female |
| Less than 5 Minutes | 629 (5.9%) | 375 (4.4%) |
| 5 to 9 Minutes | 986 (9.3%) | 987 (11.6%) |
| 10 to 14 Minutes | 964 (9.1%) | 1,296 (15.2%) |
| 15 to 19 Minutes | 1,085 (10.2%) | 1,205 (14.1%) |
| 20 to 24 Minutes | 994 (9.3%) | 544 (6.4%) |
| 25 to 29 Minutes | 614 (5.8%) | 699 (8.2%) |
| 30 to 34 Minutes | 1,621 (15.2%) | 1,270 (14.9%) |
| 35 to 39 Minutes | 1,037 (9.8%) | 615 (7.2%) |
| 40 to 44 Minutes | 636 (6.0%) | 441 (5.2%) |
| 45 to 59 Minutes | 1,370 (12.9%) | 671 (7.9%) |
| 60 to 89 Minutes | 487 (4.6%) | 305 (3.6%) |
| 90 or more Minutes | 208 (2.0%) | 114 (1.3%) |
Time of Departure to Work by Sex in Delaware
The most frequent times of departure to work in Delaware are 7:00 AM to 7:29 AM (1,554, 14.6%) for males and 7:00 AM to 7:29 AM (1,334, 15.7%) for females.
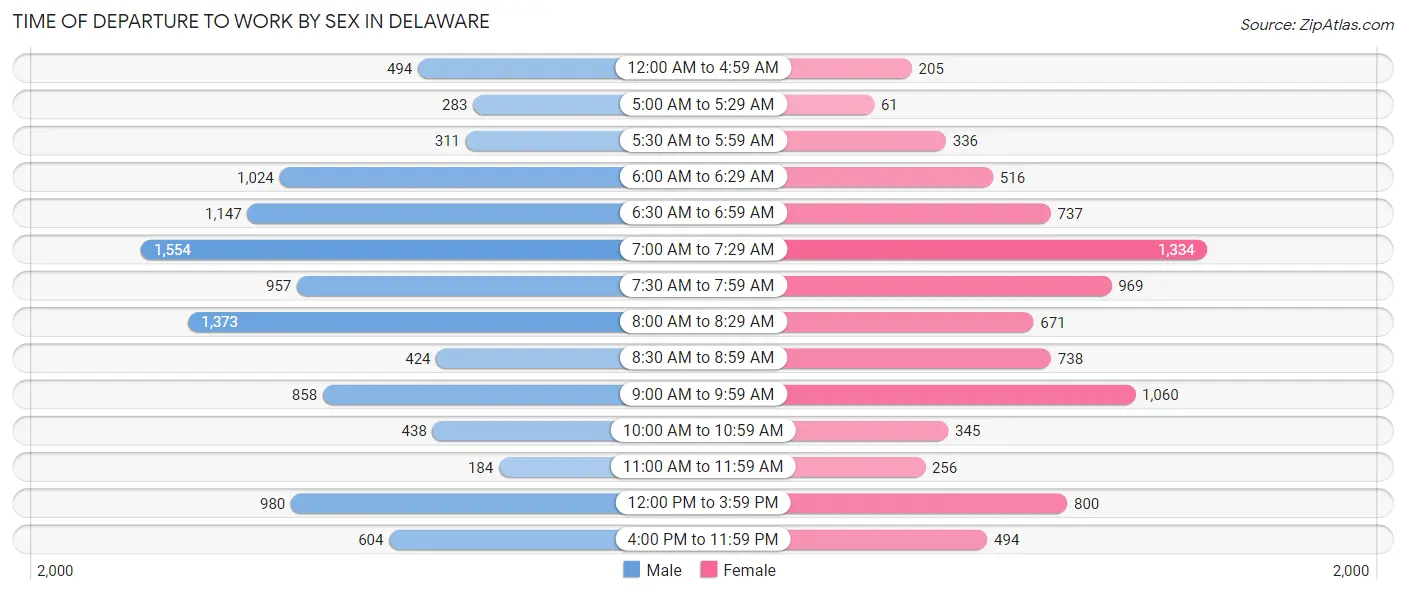
| Time of Departure | Male | Female |
| 12:00 AM to 4:59 AM | 494 (4.6%) | 205 (2.4%) |
| 5:00 AM to 5:29 AM | 283 (2.7%) | 61 (0.7%) |
| 5:30 AM to 5:59 AM | 311 (2.9%) | 336 (3.9%) |
| 6:00 AM to 6:29 AM | 1,024 (9.6%) | 516 (6.0%) |
| 6:30 AM to 6:59 AM | 1,147 (10.8%) | 737 (8.6%) |
| 7:00 AM to 7:29 AM | 1,554 (14.6%) | 1,334 (15.7%) |
| 7:30 AM to 7:59 AM | 957 (9.0%) | 969 (11.4%) |
| 8:00 AM to 8:29 AM | 1,373 (12.9%) | 671 (7.9%) |
| 8:30 AM to 8:59 AM | 424 (4.0%) | 738 (8.7%) |
| 9:00 AM to 9:59 AM | 858 (8.1%) | 1,060 (12.4%) |
| 10:00 AM to 10:59 AM | 438 (4.1%) | 345 (4.1%) |
| 11:00 AM to 11:59 AM | 184 (1.7%) | 256 (3.0%) |
| 12:00 PM to 3:59 PM | 980 (9.2%) | 800 (9.4%) |
| 4:00 PM to 11:59 PM | 604 (5.7%) | 494 (5.8%) |
| Total | 10,631 (100.0%) | 8,522 (100.0%) |
Housing Occupancy in Delaware
Occupancy by Ownership in Delaware
Of the total 16,026 dwellings in Delaware, owner-occupied units account for 10,010 (62.5%), while renter-occupied units make up 6,016 (37.5%).
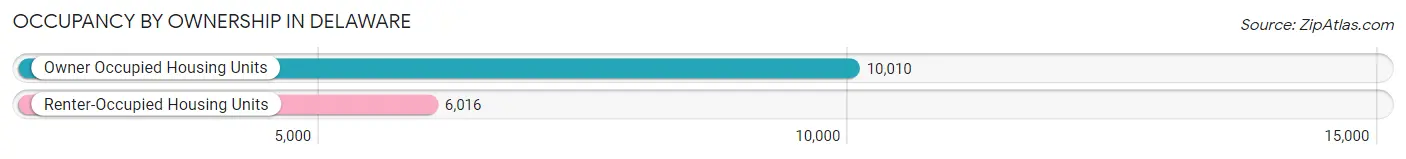
| Occupancy | # Housing Units | % Housing Units |
| Owner Occupied Housing Units | 10,010 | 62.5% |
| Renter-Occupied Housing Units | 6,016 | 37.5% |
| Total Occupied Housing Units | 16,026 | 100.0% |
Occupancy by Household Size in Delaware
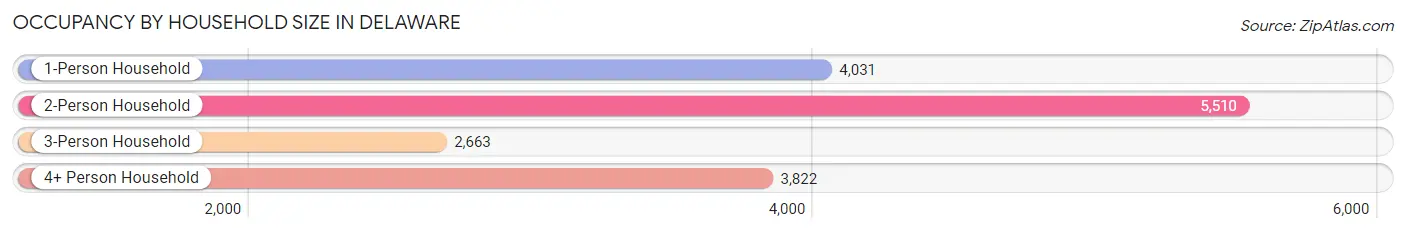
| Household Size | # Housing Units | % Housing Units |
| 1-Person Household | 4,031 | 25.2% |
| 2-Person Household | 5,510 | 34.4% |
| 3-Person Household | 2,663 | 16.6% |
| 4+ Person Household | 3,822 | 23.8% |
| Total Housing Units | 16,026 | 100.0% |
Occupancy by Ownership by Household Size in Delaware
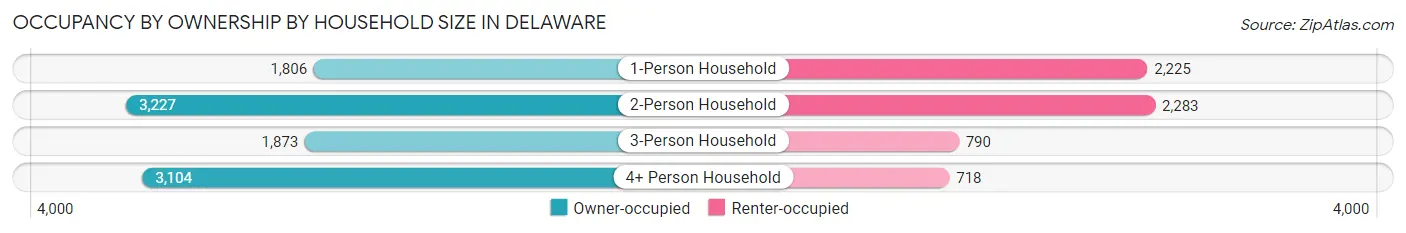
| Household Size | Owner-occupied | Renter-occupied |
| 1-Person Household | 1,806 (44.8%) | 2,225 (55.2%) |
| 2-Person Household | 3,227 (58.6%) | 2,283 (41.4%) |
| 3-Person Household | 1,873 (70.3%) | 790 (29.7%) |
| 4+ Person Household | 3,104 (81.2%) | 718 (18.8%) |
| Total Housing Units | 10,010 (62.5%) | 6,016 (37.5%) |
Occupancy by Educational Attainment in Delaware
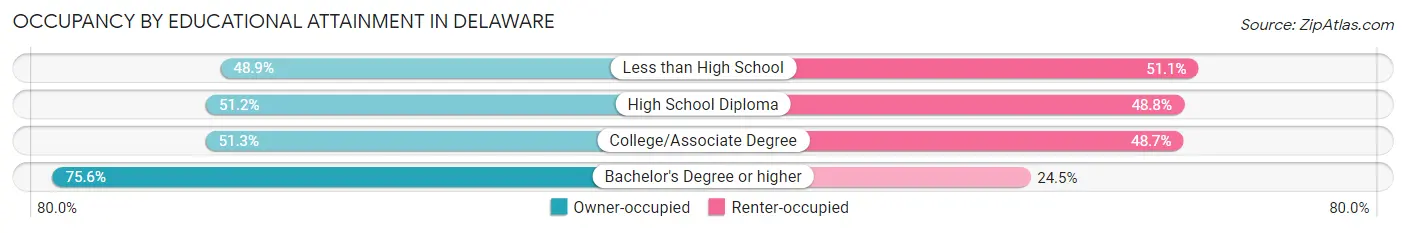
| Household Size | Owner-occupied | Renter-occupied |
| Less than High School | 314 (48.9%) | 328 (51.1%) |
| High School Diploma | 1,886 (51.2%) | 1,796 (48.8%) |
| College/Associate Degree | 2,178 (51.3%) | 2,069 (48.7%) |
| Bachelor's Degree or higher | 5,632 (75.5%) | 1,823 (24.4%) |
Occupancy by Age of Householder in Delaware
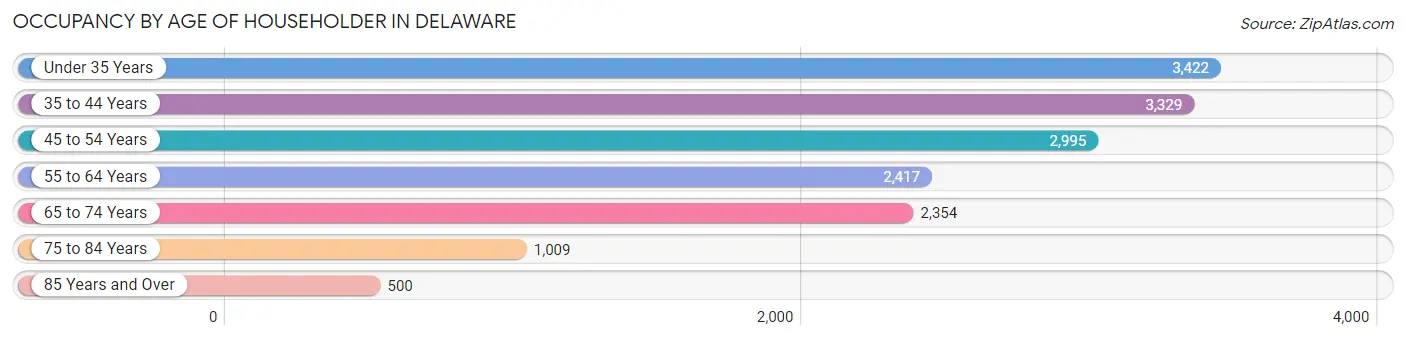
| Age Bracket | # Households | % Households |
| Under 35 Years | 3,422 | 21.3% |
| 35 to 44 Years | 3,329 | 20.8% |
| 45 to 54 Years | 2,995 | 18.7% |
| 55 to 64 Years | 2,417 | 15.1% |
| 65 to 74 Years | 2,354 | 14.7% |
| 75 to 84 Years | 1,009 | 6.3% |
| 85 Years and Over | 500 | 3.1% |
| Total | 16,026 | 100.0% |
Housing Finances in Delaware
Median Income by Occupancy in Delaware
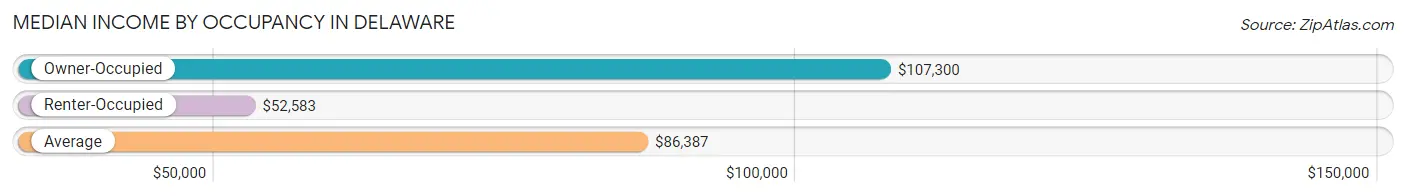
| Occupancy Type | # Households | Median Income |
| Owner-Occupied | 10,010 (62.5%) | $107,300 |
| Renter-Occupied | 6,016 (37.5%) | $52,583 |
| Average | 16,026 (100.0%) | $86,387 |
Occupancy by Householder Income Bracket in Delaware
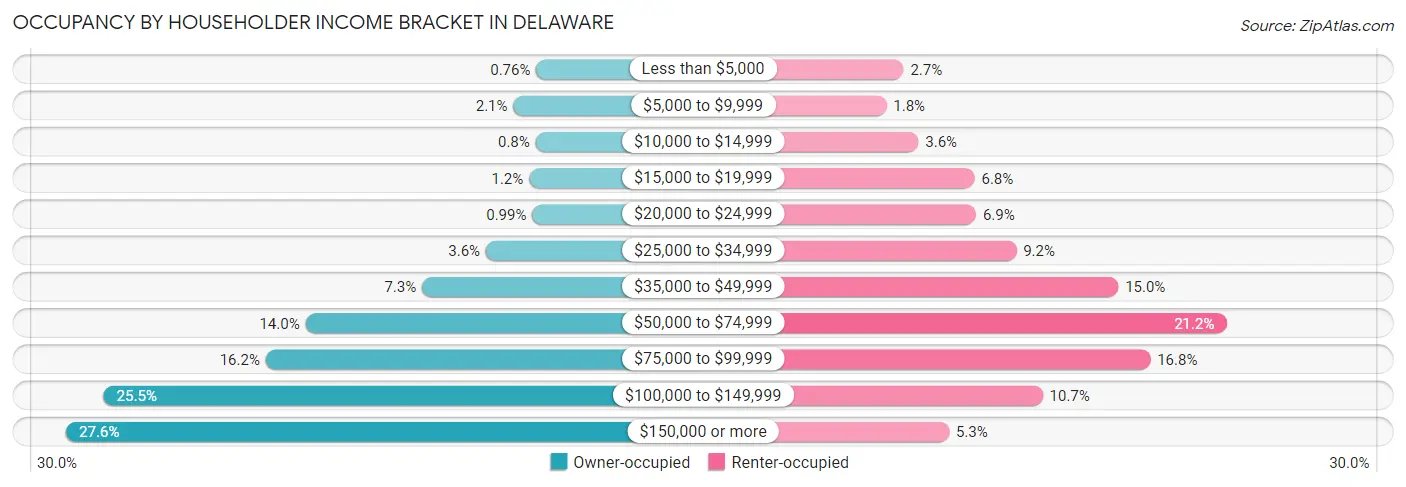
| Income Bracket | Owner-occupied | Renter-occupied |
| Less than $5,000 | 76 (0.8%) | 165 (2.7%) |
| $5,000 to $9,999 | 207 (2.1%) | 106 (1.8%) |
| $10,000 to $14,999 | 80 (0.8%) | 216 (3.6%) |
| $15,000 to $19,999 | 117 (1.2%) | 409 (6.8%) |
| $20,000 to $24,999 | 99 (1.0%) | 414 (6.9%) |
| $25,000 to $34,999 | 364 (3.6%) | 552 (9.2%) |
| $35,000 to $49,999 | 730 (7.3%) | 903 (15.0%) |
| $50,000 to $74,999 | 1,396 (14.0%) | 1,274 (21.2%) |
| $75,000 to $99,999 | 1,624 (16.2%) | 1,013 (16.8%) |
| $100,000 to $149,999 | 2,551 (25.5%) | 643 (10.7%) |
| $150,000 or more | 2,766 (27.6%) | 321 (5.3%) |
| Total | 10,010 (100.0%) | 6,016 (100.0%) |
Monthly Housing Cost Tiers in Delaware
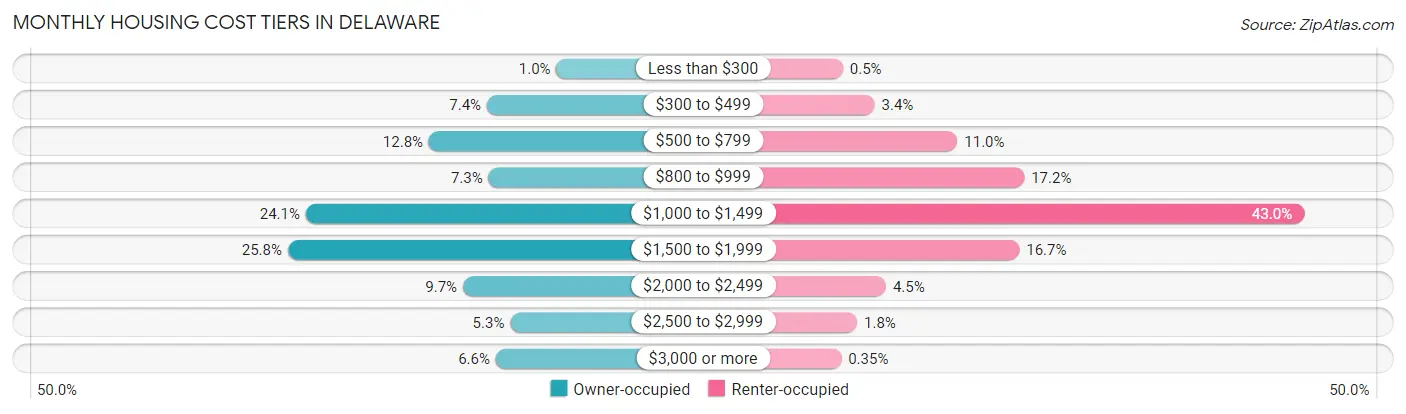
| Monthly Cost | Owner-occupied | Renter-occupied |
| Less than $300 | 104 (1.0%) | 30 (0.5%) |
| $300 to $499 | 745 (7.4%) | 206 (3.4%) |
| $500 to $799 | 1,279 (12.8%) | 664 (11.0%) |
| $800 to $999 | 730 (7.3%) | 1,035 (17.2%) |
| $1,000 to $1,499 | 2,413 (24.1%) | 2,584 (42.9%) |
| $1,500 to $1,999 | 2,580 (25.8%) | 1,007 (16.7%) |
| $2,000 to $2,499 | 966 (9.7%) | 269 (4.5%) |
| $2,500 to $2,999 | 530 (5.3%) | 109 (1.8%) |
| $3,000 or more | 663 (6.6%) | 21 (0.4%) |
| Total | 10,010 (100.0%) | 6,016 (100.0%) |
Physical Housing Characteristics in Delaware
Housing Structures in Delaware
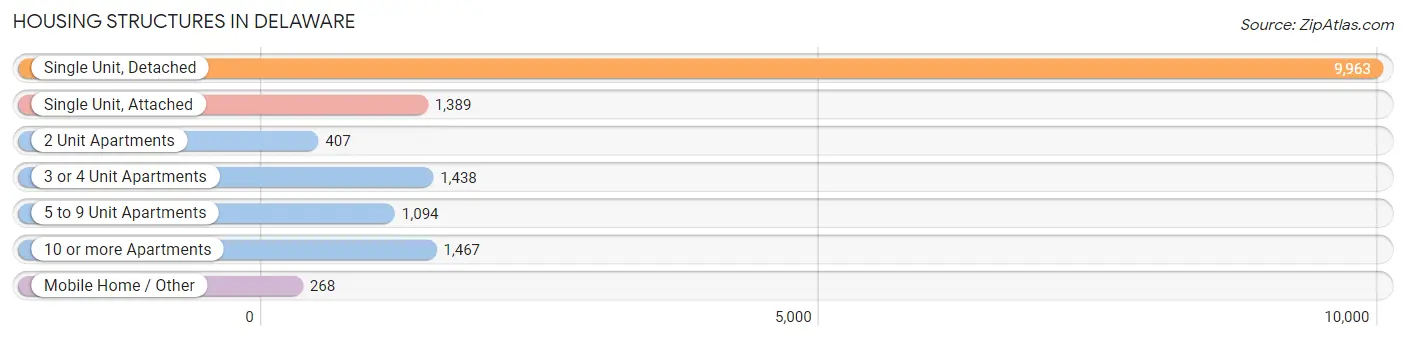
| Structure Type | # Housing Units | % Housing Units |
| Single Unit, Detached | 9,963 | 62.2% |
| Single Unit, Attached | 1,389 | 8.7% |
| 2 Unit Apartments | 407 | 2.5% |
| 3 or 4 Unit Apartments | 1,438 | 9.0% |
| 5 to 9 Unit Apartments | 1,094 | 6.8% |
| 10 or more Apartments | 1,467 | 9.1% |
| Mobile Home / Other | 268 | 1.7% |
| Total | 16,026 | 100.0% |
Housing Structures by Occupancy in Delaware
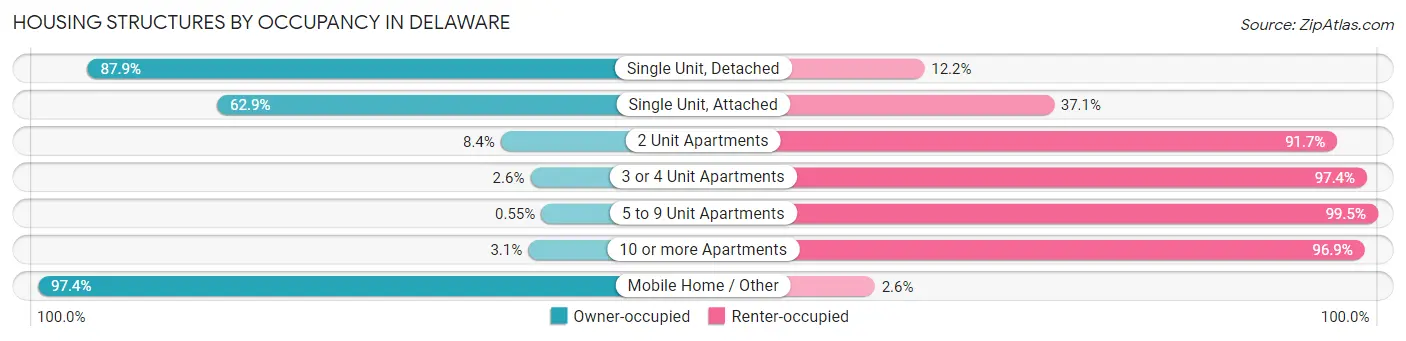
| Structure Type | Owner-occupied | Renter-occupied |
| Single Unit, Detached | 8,752 (87.8%) | 1,211 (12.1%) |
| Single Unit, Attached | 874 (62.9%) | 515 (37.1%) |
| 2 Unit Apartments | 34 (8.4%) | 373 (91.6%) |
| 3 or 4 Unit Apartments | 38 (2.6%) | 1,400 (97.4%) |
| 5 to 9 Unit Apartments | 6 (0.5%) | 1,088 (99.5%) |
| 10 or more Apartments | 45 (3.1%) | 1,422 (96.9%) |
| Mobile Home / Other | 261 (97.4%) | 7 (2.6%) |
| Total | 10,010 (62.5%) | 6,016 (37.5%) |
Housing Structures by Number of Rooms in Delaware
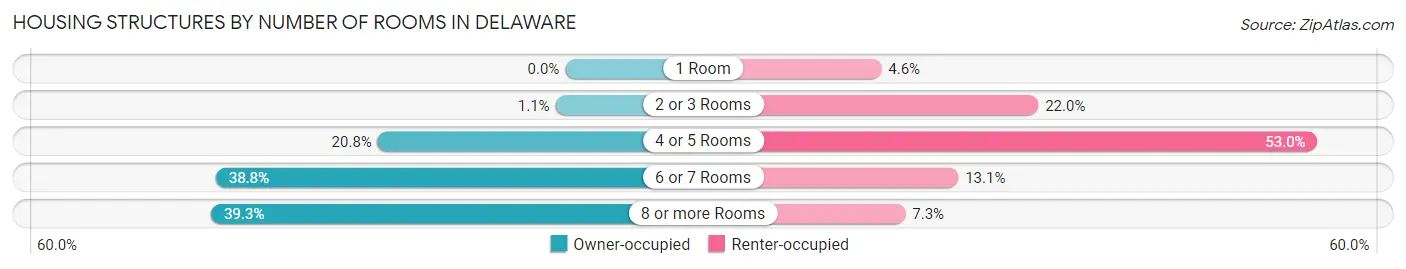
| Number of Rooms | Owner-occupied | Renter-occupied |
| 1 Room | 0 (0.0%) | 277 (4.6%) |
| 2 or 3 Rooms | 109 (1.1%) | 1,324 (22.0%) |
| 4 or 5 Rooms | 2,084 (20.8%) | 3,188 (53.0%) |
| 6 or 7 Rooms | 3,882 (38.8%) | 790 (13.1%) |
| 8 or more Rooms | 3,935 (39.3%) | 437 (7.3%) |
| Total | 10,010 (100.0%) | 6,016 (100.0%) |
Housing Structure by Heating Type in Delaware
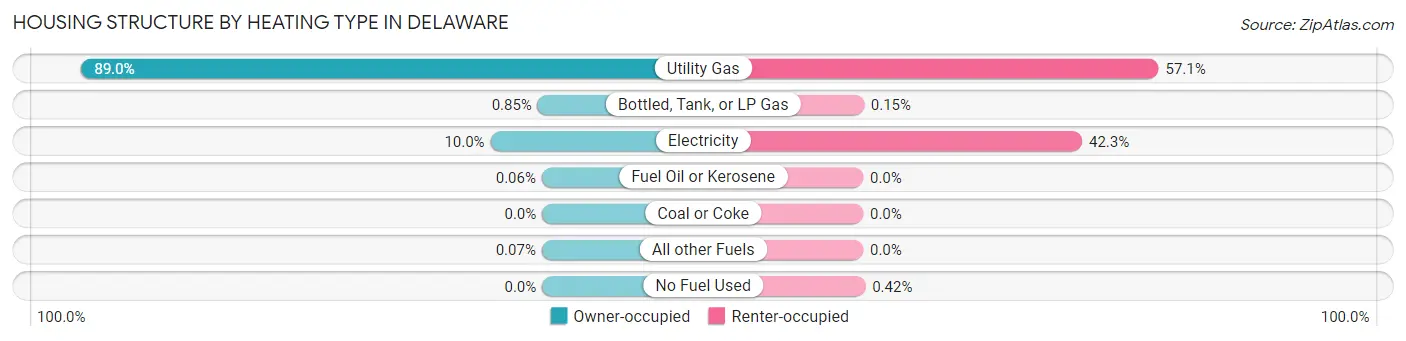
| Heating Type | Owner-occupied | Renter-occupied |
| Utility Gas | 8,913 (89.0%) | 3,436 (57.1%) |
| Bottled, Tank, or LP Gas | 85 (0.9%) | 9 (0.2%) |
| Electricity | 999 (10.0%) | 2,546 (42.3%) |
| Fuel Oil or Kerosene | 6 (0.1%) | 0 (0.0%) |
| Coal or Coke | 0 (0.0%) | 0 (0.0%) |
| All other Fuels | 7 (0.1%) | 0 (0.0%) |
| No Fuel Used | 0 (0.0%) | 25 (0.4%) |
| Total | 10,010 (100.0%) | 6,016 (100.0%) |
Household Vehicle Usage in Delaware
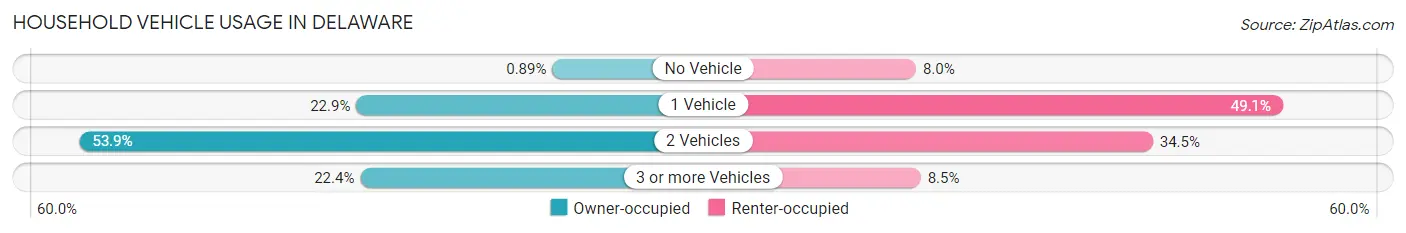
| Vehicles per Household | Owner-occupied | Renter-occupied |
| No Vehicle | 89 (0.9%) | 479 (8.0%) |
| 1 Vehicle | 2,287 (22.9%) | 2,951 (49.0%) |
| 2 Vehicles | 5,392 (53.9%) | 2,075 (34.5%) |
| 3 or more Vehicles | 2,242 (22.4%) | 511 (8.5%) |
| Total | 10,010 (100.0%) | 6,016 (100.0%) |
Real Estate & Mortgages in Delaware
Real Estate and Mortgage Overview in Delaware
| Characteristic | Without Mortgage | With Mortgage |
| Housing Units | 2,633 | 7,377 |
| Median Property Value | $229,600 | $261,500 |
| Median Household Income | $68,992 | $2,342 |
| Monthly Housing Costs | $666 | $663 |
| Real Estate Taxes | $3,503 | $119 |
Property Value by Mortgage Status in Delaware
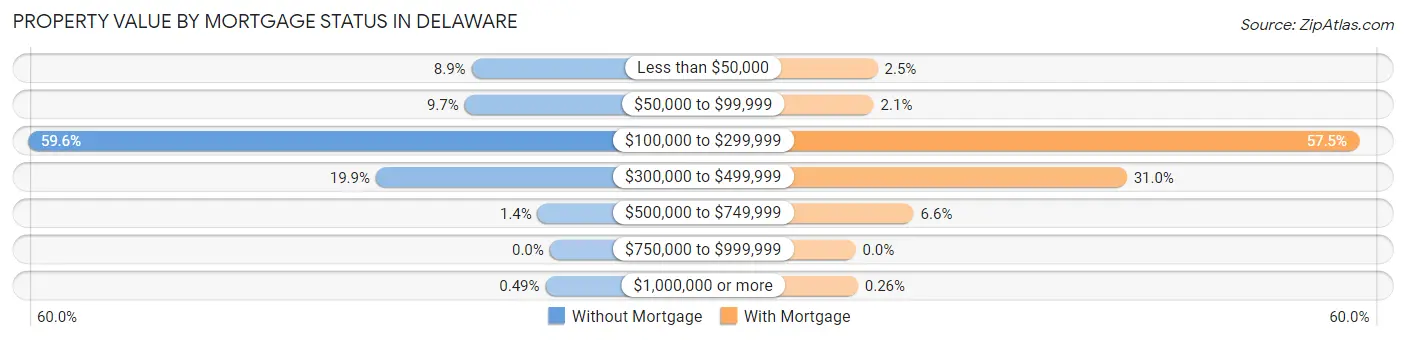
| Property Value | Without Mortgage | With Mortgage |
| Less than $50,000 | 235 (8.9%) | 186 (2.5%) |
| $50,000 to $99,999 | 256 (9.7%) | 153 (2.1%) |
| $100,000 to $299,999 | 1,570 (59.6%) | 4,243 (57.5%) |
| $300,000 to $499,999 | 523 (19.9%) | 2,286 (31.0%) |
| $500,000 to $749,999 | 36 (1.4%) | 490 (6.6%) |
| $750,000 to $999,999 | 0 (0.0%) | 0 (0.0%) |
| $1,000,000 or more | 13 (0.5%) | 19 (0.3%) |
| Total | 2,633 (100.0%) | 7,377 (100.0%) |
Household Income by Mortgage Status in Delaware
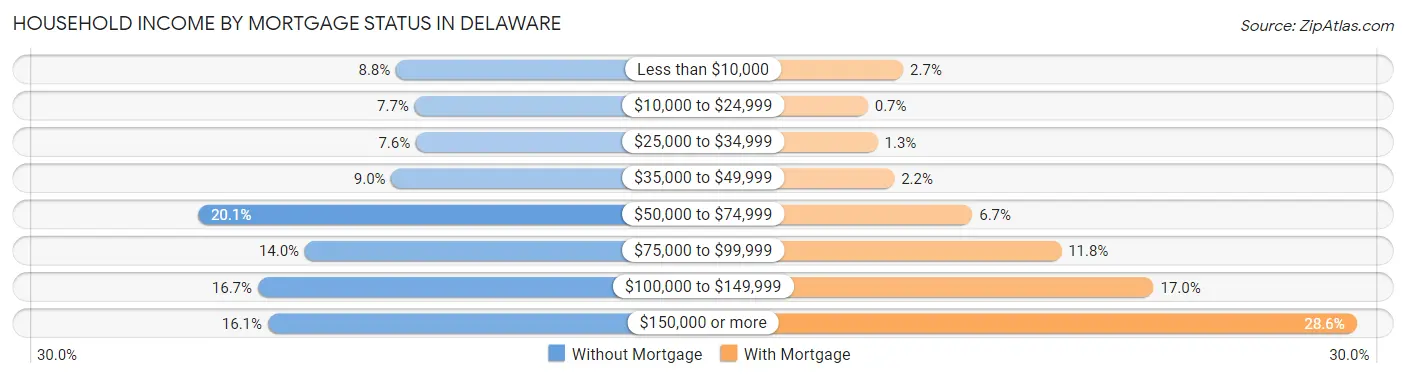
| Household Income | Without Mortgage | With Mortgage |
| Less than $10,000 | 231 (8.8%) | 201 (2.7%) |
| $10,000 to $24,999 | 203 (7.7%) | 52 (0.7%) |
| $25,000 to $34,999 | 201 (7.6%) | 93 (1.3%) |
| $35,000 to $49,999 | 238 (9.0%) | 163 (2.2%) |
| $50,000 to $74,999 | 529 (20.1%) | 492 (6.7%) |
| $75,000 to $99,999 | 368 (14.0%) | 867 (11.7%) |
| $100,000 to $149,999 | 439 (16.7%) | 1,256 (17.0%) |
| $150,000 or more | 424 (16.1%) | 2,112 (28.6%) |
| Total | 2,633 (100.0%) | 7,377 (100.0%) |
Property Value to Household Income Ratio in Delaware
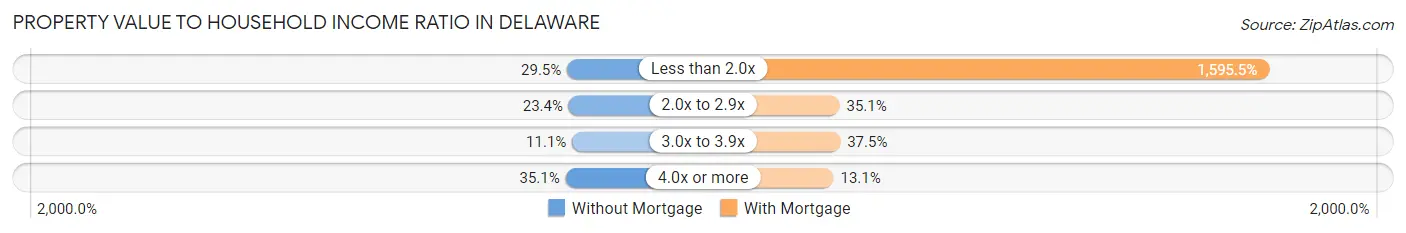
| Value-to-Income Ratio | Without Mortgage | With Mortgage |
| Less than 2.0x | 776 (29.5%) | 117,700 (1,595.5%) |
| 2.0x to 2.9x | 615 (23.4%) | 2,587 (35.1%) |
| 3.0x to 3.9x | 292 (11.1%) | 2,768 (37.5%) |
| 4.0x or more | 925 (35.1%) | 965 (13.1%) |
| Total | 2,633 (100.0%) | 7,377 (100.0%) |
Real Estate Taxes by Mortgage Status in Delaware
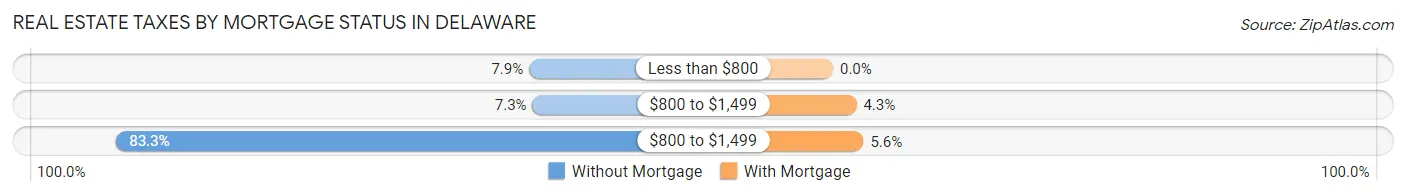
| Property Taxes | Without Mortgage | With Mortgage |
| Less than $800 | 207 (7.9%) | 0 (0.0%) |
| $800 to $1,499 | 191 (7.2%) | 316 (4.3%) |
| $800 to $1,499 | 2,192 (83.3%) | 410 (5.6%) |
| Total | 2,633 (100.0%) | 7,377 (100.0%) |
Health & Disability in Delaware
Health Insurance Coverage by Age in Delaware
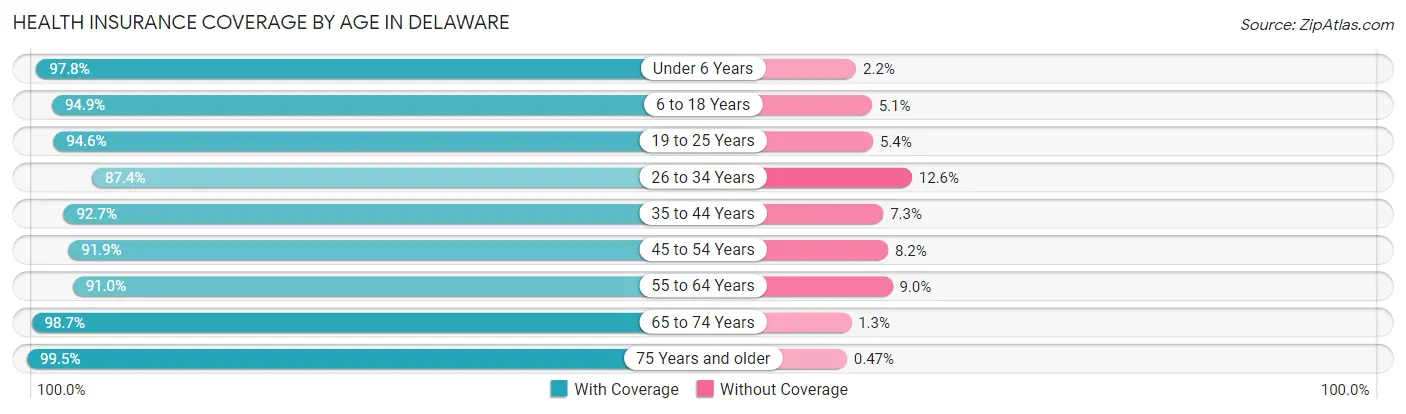
| Age Bracket | With Coverage | Without Coverage |
| Under 6 Years | 3,204 (97.8%) | 72 (2.2%) |
| 6 to 18 Years | 6,874 (94.9%) | 370 (5.1%) |
| 19 to 25 Years | 4,170 (94.6%) | 236 (5.4%) |
| 26 to 34 Years | 4,389 (87.4%) | 633 (12.6%) |
| 35 to 44 Years | 5,816 (92.7%) | 455 (7.3%) |
| 45 to 54 Years | 4,927 (91.8%) | 437 (8.2%) |
| 55 to 64 Years | 3,911 (91.0%) | 386 (9.0%) |
| 65 to 74 Years | 3,369 (98.7%) | 44 (1.3%) |
| 75 Years and older | 2,122 (99.5%) | 10 (0.5%) |
| Total | 38,782 (93.6%) | 2,643 (6.4%) |
Health Insurance Coverage by Citizenship Status in Delaware
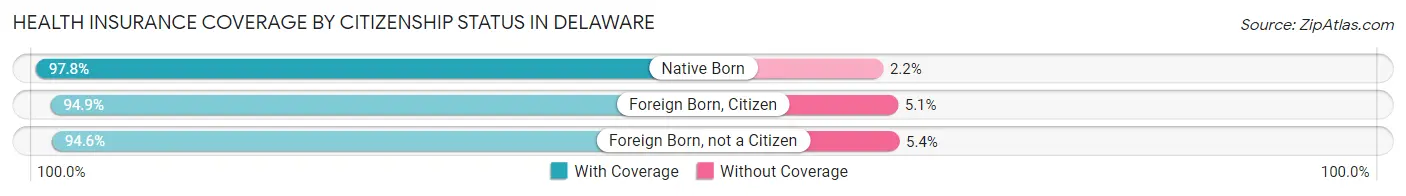
| Citizenship Status | With Coverage | Without Coverage |
| Native Born | 3,204 (97.8%) | 72 (2.2%) |
| Foreign Born, Citizen | 6,874 (94.9%) | 370 (5.1%) |
| Foreign Born, not a Citizen | 4,170 (94.6%) | 236 (5.4%) |
Health Insurance Coverage by Household Income in Delaware
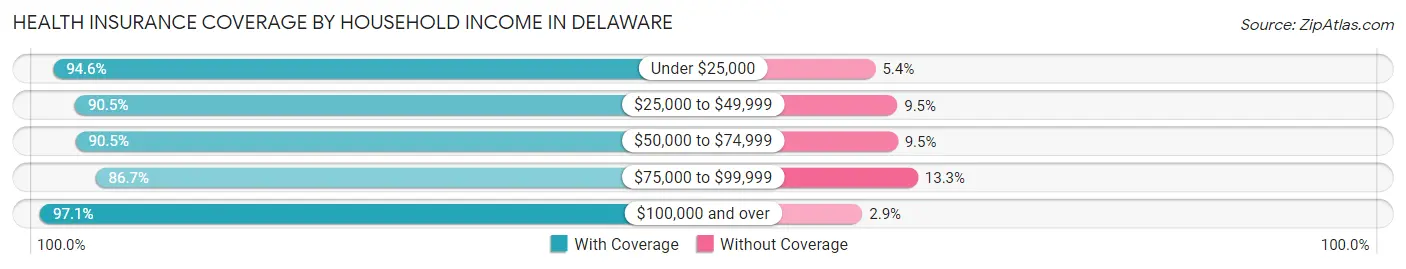
| Household Income | With Coverage | Without Coverage |
| Under $25,000 | 2,766 (94.6%) | 157 (5.4%) |
| $25,000 to $49,999 | 4,267 (90.5%) | 446 (9.5%) |
| $50,000 to $74,999 | 5,365 (90.5%) | 566 (9.5%) |
| $75,000 to $99,999 | 5,717 (86.7%) | 878 (13.3%) |
| $100,000 and over | 19,343 (97.1%) | 582 (2.9%) |
Public vs Private Health Insurance Coverage by Age in Delaware
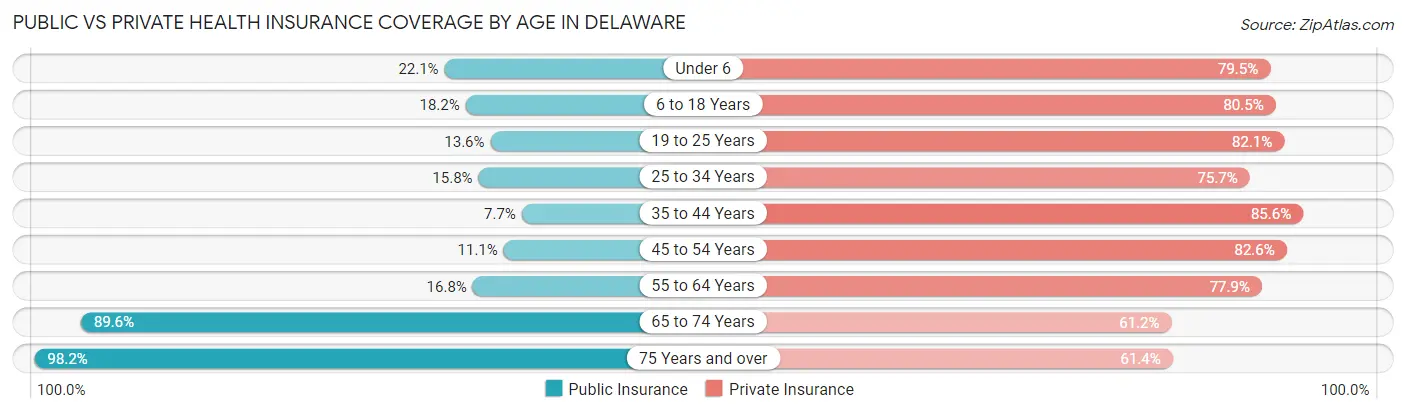
| Age Bracket | Public Insurance | Private Insurance |
| Under 6 | 723 (22.1%) | 2,604 (79.5%) |
| 6 to 18 Years | 1,315 (18.1%) | 5,831 (80.5%) |
| 19 to 25 Years | 597 (13.6%) | 3,617 (82.1%) |
| 25 to 34 Years | 792 (15.8%) | 3,801 (75.7%) |
| 35 to 44 Years | 485 (7.7%) | 5,368 (85.6%) |
| 45 to 54 Years | 595 (11.1%) | 4,428 (82.6%) |
| 55 to 64 Years | 723 (16.8%) | 3,349 (77.9%) |
| 65 to 74 Years | 3,057 (89.6%) | 2,087 (61.2%) |
| 75 Years and over | 2,093 (98.2%) | 1,309 (61.4%) |
| Total | 10,380 (25.1%) | 32,394 (78.2%) |
Disability Status by Sex by Age in Delaware
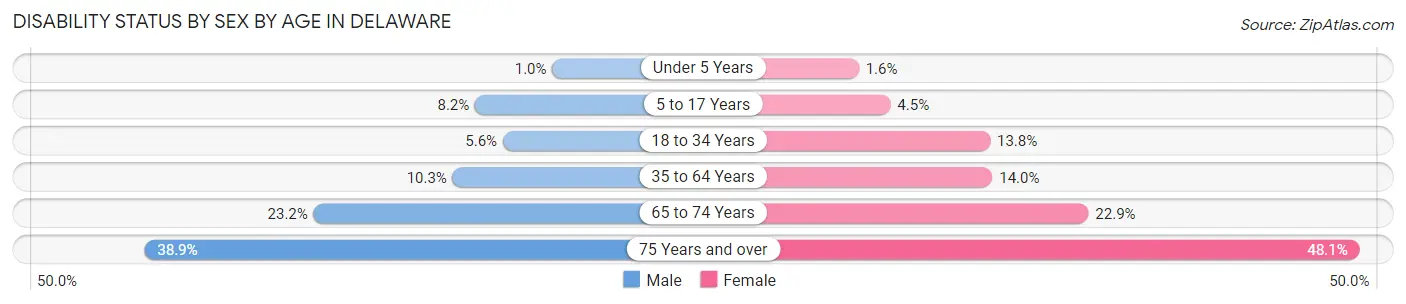
| Age Bracket | Male | Female |
| Under 5 Years | 13 (1.0%) | 22 (1.6%) |
| 5 to 17 Years | 276 (8.2%) | 166 (4.5%) |
| 18 to 34 Years | 301 (5.6%) | 669 (13.8%) |
| 35 to 64 Years | 846 (10.3%) | 1,075 (14.0%) |
| 65 to 74 Years | 382 (23.2%) | 404 (22.9%) |
| 75 Years and over | 320 (38.9%) | 629 (48.0%) |
Disability Class by Sex by Age in Delaware
Disability Class: Hearing Difficulty
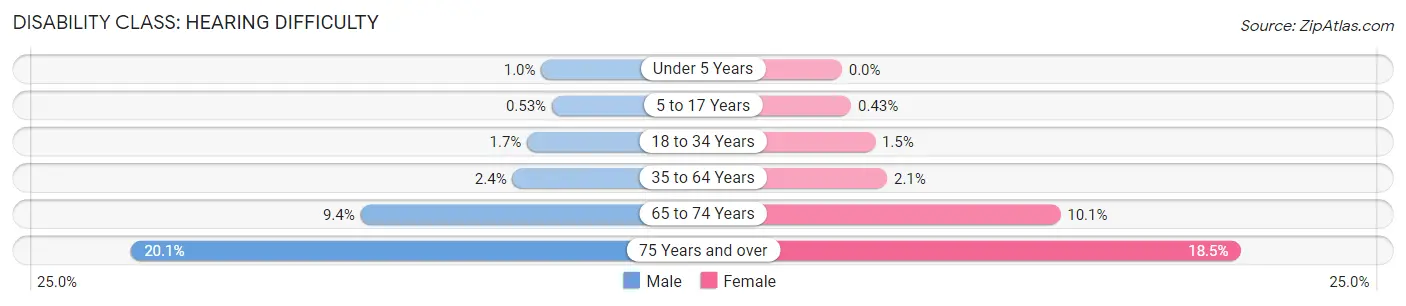
| Age Bracket | Male | Female |
| Under 5 Years | 13 (1.0%) | 0 (0.0%) |
| 5 to 17 Years | 18 (0.5%) | 16 (0.4%) |
| 18 to 34 Years | 90 (1.7%) | 75 (1.5%) |
| 35 to 64 Years | 194 (2.4%) | 162 (2.1%) |
| 65 to 74 Years | 155 (9.4%) | 179 (10.1%) |
| 75 Years and over | 165 (20.1%) | 242 (18.5%) |
Disability Class: Vision Difficulty
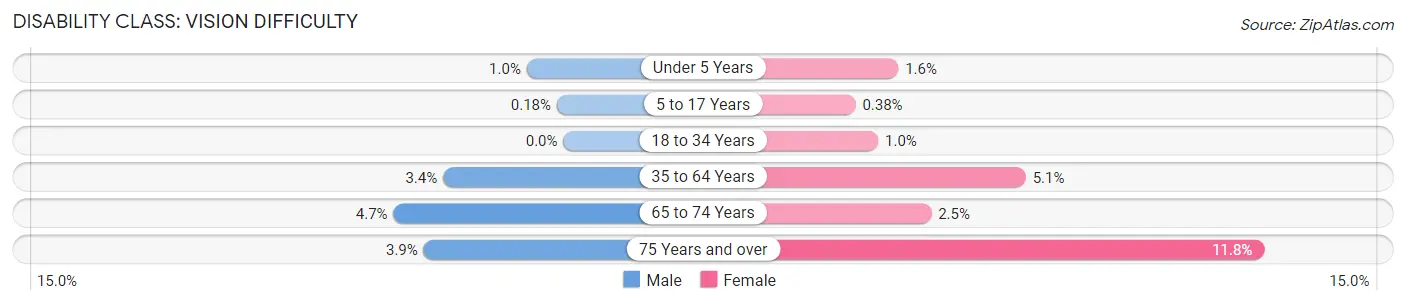
| Age Bracket | Male | Female |
| Under 5 Years | 13 (1.0%) | 22 (1.6%) |
| 5 to 17 Years | 6 (0.2%) | 14 (0.4%) |
| 18 to 34 Years | 0 (0.0%) | 49 (1.0%) |
| 35 to 64 Years | 276 (3.4%) | 394 (5.1%) |
| 65 to 74 Years | 78 (4.7%) | 44 (2.5%) |
| 75 Years and over | 32 (3.9%) | 154 (11.8%) |
Disability Class: Cognitive Difficulty
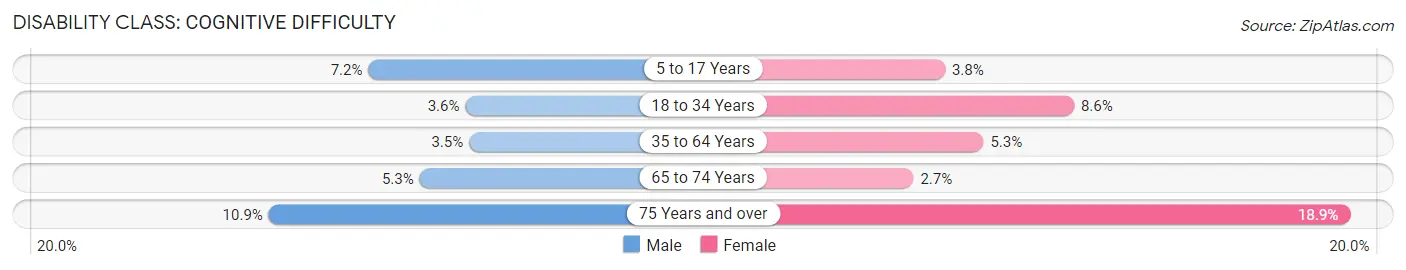
| Age Bracket | Male | Female |
| 5 to 17 Years | 244 (7.2%) | 141 (3.8%) |
| 18 to 34 Years | 195 (3.6%) | 419 (8.6%) |
| 35 to 64 Years | 288 (3.5%) | 405 (5.3%) |
| 65 to 74 Years | 88 (5.3%) | 47 (2.7%) |
| 75 Years and over | 90 (10.9%) | 247 (18.9%) |
Disability Class: Ambulatory Difficulty
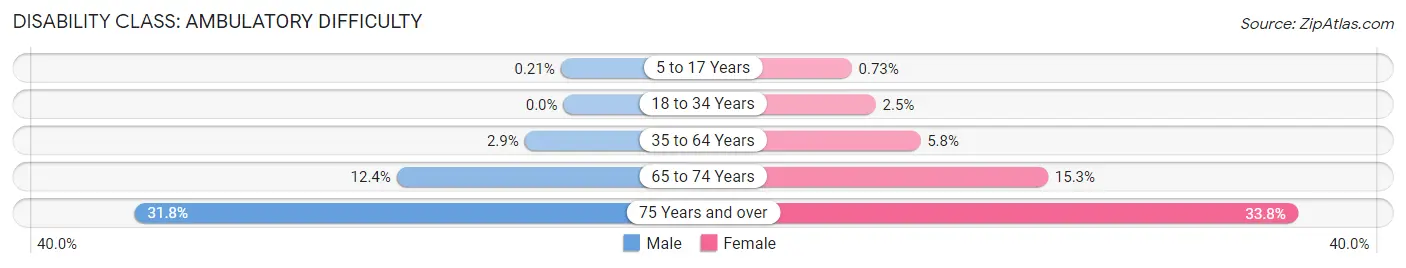
| Age Bracket | Male | Female |
| 5 to 17 Years | 7 (0.2%) | 27 (0.7%) |
| 18 to 34 Years | 0 (0.0%) | 122 (2.5%) |
| 35 to 64 Years | 237 (2.9%) | 448 (5.8%) |
| 65 to 74 Years | 204 (12.4%) | 270 (15.3%) |
| 75 Years and over | 262 (31.8%) | 443 (33.8%) |
Disability Class: Self-Care Difficulty
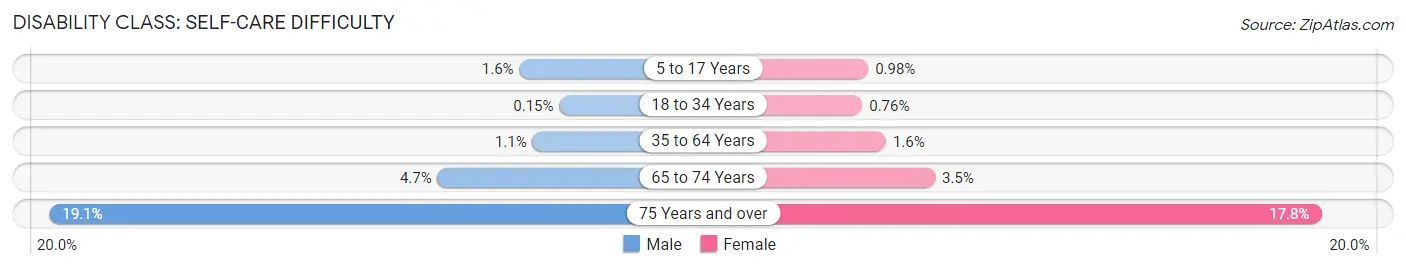
| Age Bracket | Male | Female |
| 5 to 17 Years | 55 (1.6%) | 36 (1.0%) |
| 18 to 34 Years | 8 (0.2%) | 37 (0.8%) |
| 35 to 64 Years | 94 (1.1%) | 126 (1.6%) |
| 65 to 74 Years | 77 (4.7%) | 61 (3.5%) |
| 75 Years and over | 157 (19.1%) | 233 (17.8%) |
Technology Access in Delaware
Computing Device Access in Delaware
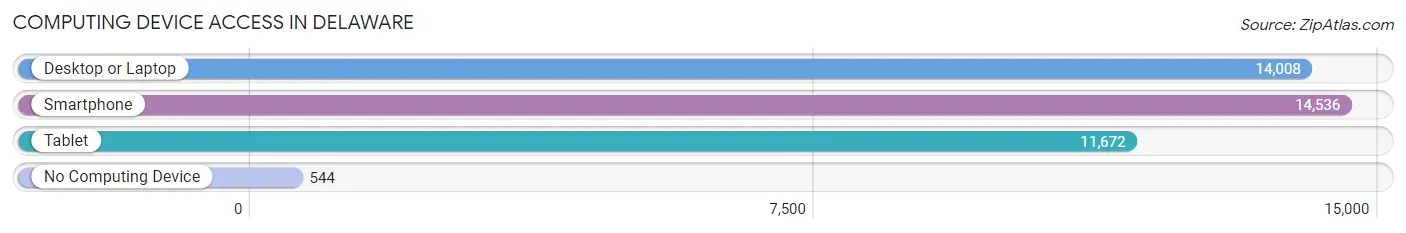
| Device Type | # Households | % Households |
| Desktop or Laptop | 14,008 | 87.4% |
| Smartphone | 14,536 | 90.7% |
| Tablet | 11,672 | 72.8% |
| No Computing Device | 544 | 3.4% |
| Total | 16,026 | 100.0% |
Internet Access in Delaware
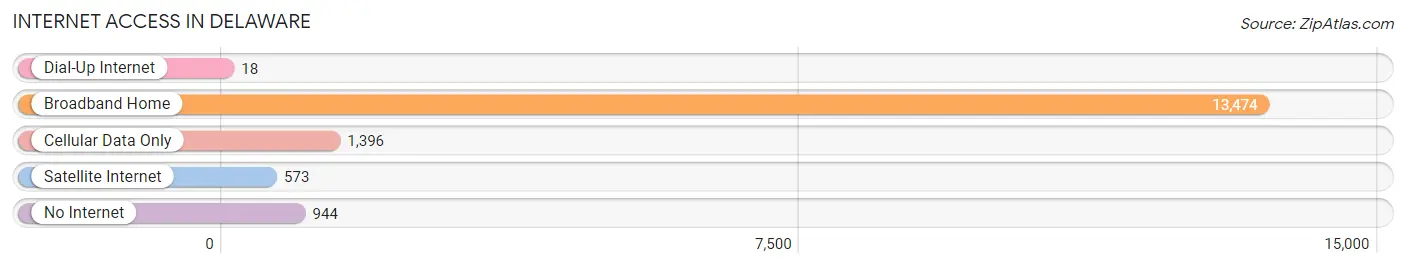
| Internet Type | # Households | % Households |
| Dial-Up Internet | 18 | 0.1% |
| Broadband Home | 13,474 | 84.1% |
| Cellular Data Only | 1,396 | 8.7% |
| Satellite Internet | 573 | 3.6% |
| No Internet | 944 | 5.9% |
| Total | 16,026 | 100.0% |
Delaware Summary
Delaware, Ohio is a city located in the central part of the state, about 25 miles north of Columbus. It is the county seat of Delaware County and is part of the Columbus metropolitan area. The city has a population of about 37,000 people and is known for its historic downtown area, which is home to many shops, restaurants, and other businesses.
History
Delaware was founded in 1808 by settlers from Connecticut, who named the city after the Delaware River. The city was incorporated in 1816 and quickly became a center of commerce and industry. The city was home to several mills, including a woolen mill, a paper mill, and a flour mill. The city also had a large number of tanneries, which produced leather goods.
In the mid-1800s, Delaware was a major stop on the Underground Railroad, with many escaped slaves passing through the city on their way to freedom. The city was also home to several abolitionist organizations, including the Delaware Anti-Slavery Society.
In the late 1800s, Delaware became a major railroad hub, with several lines passing through the city. The city was also home to several manufacturing companies, including the Delaware Carriage Company, which produced carriages and wagons.
Geography
Delaware is located in the central part of the state, about 25 miles north of Columbus. The city is situated on the banks of the Olentangy River, which flows through the city. The city is surrounded by rolling hills and farmland, and is home to several parks and nature preserves.
The city has a total area of 16.3 square miles, of which 16.2 square miles is land and 0.1 square miles is water. The city has a humid continental climate, with hot, humid summers and cold, snowy winters.
Economy
Delaware’s economy is largely based on manufacturing and services. The city is home to several large companies, including Honda of America Manufacturing, which produces automobiles and other products. The city is also home to several smaller companies, including several food processing plants and a number of technology companies.
The city is also home to several educational institutions, including Ohio Wesleyan University and the Delaware Area Career Center. The city is also home to several hospitals and medical centers, including Grady Memorial Hospital and the Ohio State University Wexner Medical Center.
Demographics
As of the 2010 census, Delaware had a population of 37,000 people. The city has a median household income of $50,000 and a median family income of $60,000. The city’s population is largely white (90.3%), with small percentages of African Americans (3.2%), Asians (2.2%), and Hispanics (2.1%).
The city is home to several religious denominations, including Christianity (63.2%), Judaism (2.2%), and Islam (1.2%). The city is also home to several non-religious organizations, including the Delaware County Historical Society and the Delaware County Arts Council.
Delaware is a vibrant and diverse city, with a rich history and a bright future. The city is home to several businesses, educational institutions, and cultural organizations, and is a great place to live, work, and play.
Common Questions
What is Per Capita Income in Delaware?
Per Capita income in Delaware is $38,895.
What is the Median Family Income in Delaware?
Median Family Income in Delaware is $101,121.
What is the Median Household income in Delaware?
Median Household Income in Delaware is $86,387.
What is Income or Wage Gap in Delaware?
Income or Wage Gap in Delaware is 33.9%.
Women in Delaware earn 66.1 cents for every dollar earned by a man.
What is Inequality or Gini Index in Delaware?
Inequality or Gini Index in Delaware is 0.39.
What is the Total Population of Delaware?
Total Population of Delaware is 41,926.
What is the Total Male Population of Delaware?
Total Male Population of Delaware is 20,926.
What is the Total Female Population of Delaware?
Total Female Population of Delaware is 21,000.
What is the Ratio of Males per 100 Females in Delaware?
There are 99.65 Males per 100 Females in Delaware.
What is the Ratio of Females per 100 Males in Delaware?
There are 100.35 Females per 100 Males in Delaware.
What is the Median Population Age in Delaware?
Median Population Age in Delaware is 36.6 Years.
What is the Average Family Size in Delaware
Average Family Size in Delaware is 3.0 People.
What is the Average Household Size in Delaware
Average Household Size in Delaware is 2.5 People.
How Large is the Labor Force in Delaware?
There are 23,509 People in the Labor Forcein in Delaware.
What is the Percentage of People in the Labor Force in Delaware?
70.7% of People are in the Labor Force in Delaware.
What is the Unemployment Rate in Delaware?
Unemployment Rate in Delaware is 3.2%.