Zip Codes with the Highest Percentage of Population Employed in Computer & Mathematics in Akron, OH
RELATED REPORTS & OPTIONS
Computer & Mathematics
Akron
Compare Zip Codes
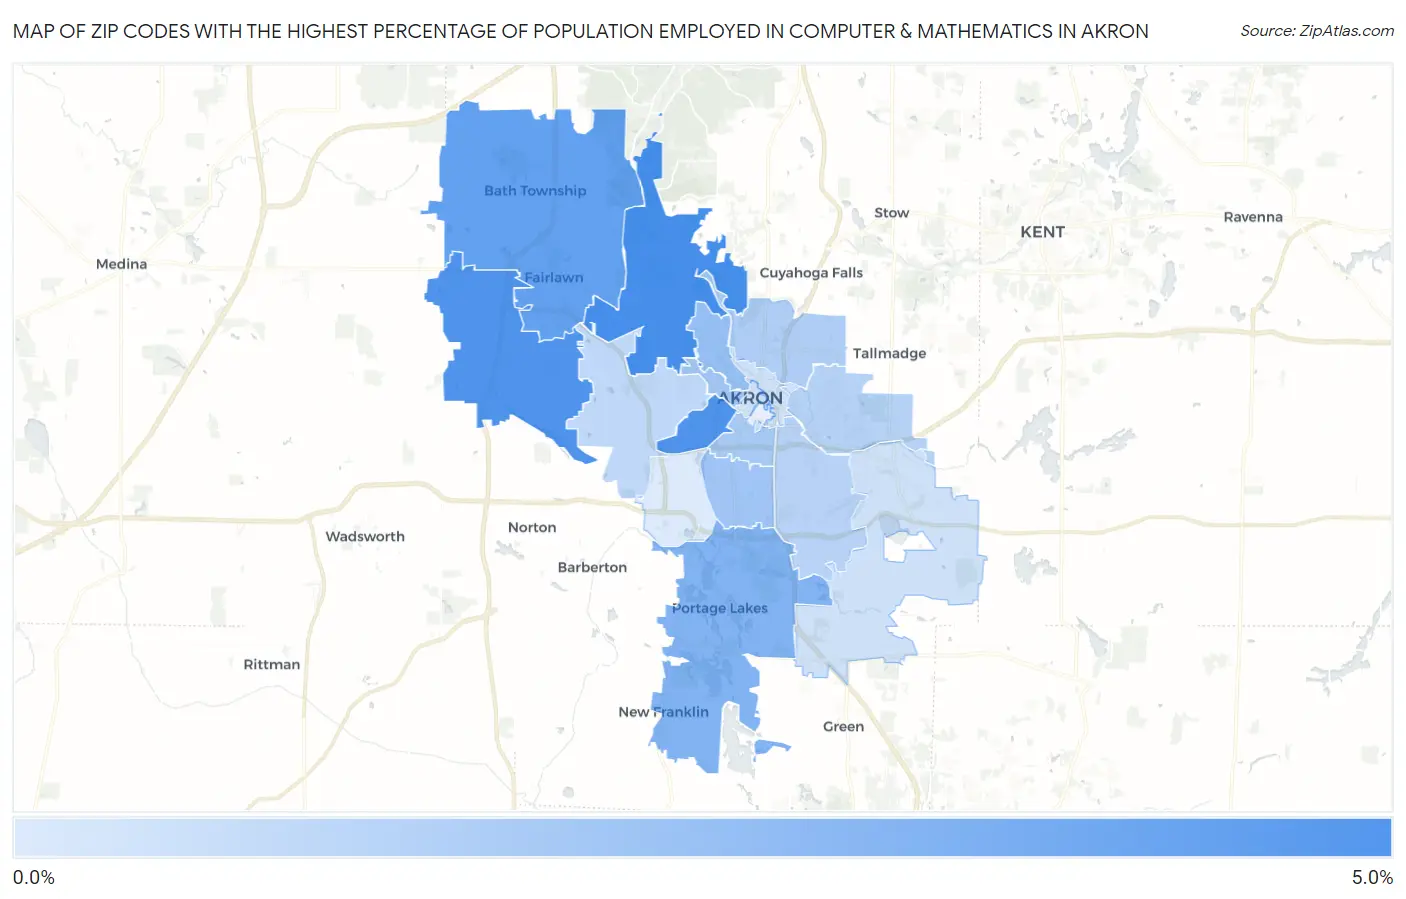
Map of Zip Codes with the Highest Percentage of Population Employed in Computer & Mathematics in Akron
0.69%
4.7%
Zip Codes with the Highest Percentage of Population Employed in Computer & Mathematics in Akron, OH
| Zip Code | % Employed | vs State | vs National | |
| 1. | 44313 | 4.7% | 3.0%(+1.69)#118 | 3.5%(+1.20)#3,762 |
| 2. | 44321 | 4.5% | 3.0%(+1.43)#132 | 3.5%(+0.944)#4,134 |
| 3. | 44307 | 4.5% | 3.0%(+1.42)#134 | 3.5%(+0.931)#4,163 |
| 4. | 44333 | 4.0% | 3.0%(+0.920)#164 | 3.5%(+0.429)#5,145 |
| 5. | 44319 | 3.1% | 3.0%(+0.097)#251 | 3.5%(-0.394)#7,325 |
| 6. | 44303 | 2.6% | 3.0%(-0.453)#323 | 3.5%(-0.944)#9,292 |
| 7. | 44301 | 2.3% | 3.0%(-0.726)#369 | 3.5%(-1.22)#10,412 |
| 8. | 44302 | 2.2% | 3.0%(-0.824)#383 | 3.5%(-1.32)#10,848 |
| 9. | 44311 | 2.1% | 3.0%(-0.923)#406 | 3.5%(-1.41)#11,305 |
| 10. | 44310 | 1.9% | 3.0%(-1.12)#444 | 3.5%(-1.61)#12,216 |
| 11. | 44305 | 1.7% | 3.0%(-1.30)#480 | 3.5%(-1.79)#13,061 |
| 12. | 44306 | 1.7% | 3.0%(-1.37)#498 | 3.5%(-1.86)#13,465 |
| 13. | 44320 | 1.5% | 3.0%(-1.55)#541 | 3.5%(-2.04)#14,498 |
| 14. | 44304 | 1.1% | 3.0%(-1.96)#645 | 3.5%(-2.45)#16,909 |
| 15. | 44312 | 1.0% | 3.0%(-2.00)#654 | 3.5%(-2.49)#17,154 |
| 16. | 44308 | 1.0% | 3.0%(-2.02)#660 | 3.5%(-2.51)#17,291 |
| 17. | 44314 | 0.69% | 3.0%(-2.34)#733 | 3.5%(-2.84)#19,326 |
1
Common Questions
What are the Top 10 Zip Codes with the Highest Percentage of Population Employed in Computer & Mathematics in Akron, OH?
Top 10 Zip Codes with the Highest Percentage of Population Employed in Computer & Mathematics in Akron, OH are:
What zip code has the Highest Percentage of Population Employed in Computer & Mathematics in Akron, OH?
44313 has the Highest Percentage of Population Employed in Computer & Mathematics in Akron, OH with 4.7%.
What is the Percentage of Population Employed in Computer & Mathematics in Akron, OH?
Percentage of Population Employed in Computer & Mathematics in Akron is 2.2%.
What is the Percentage of Population Employed in Computer & Mathematics in Ohio?
Percentage of Population Employed in Computer & Mathematics in Ohio is 3.0%.
What is the Percentage of Population Employed in Computer & Mathematics in the United States?
Percentage of Population Employed in Computer & Mathematics in the United States is 3.5%.