Zip Codes with the Highest Percentage of Population Employed in Computer & Mathematics in Ohio
RELATED REPORTS & OPTIONS
Computer & Mathematics
Ohio
Compare Zip Codes
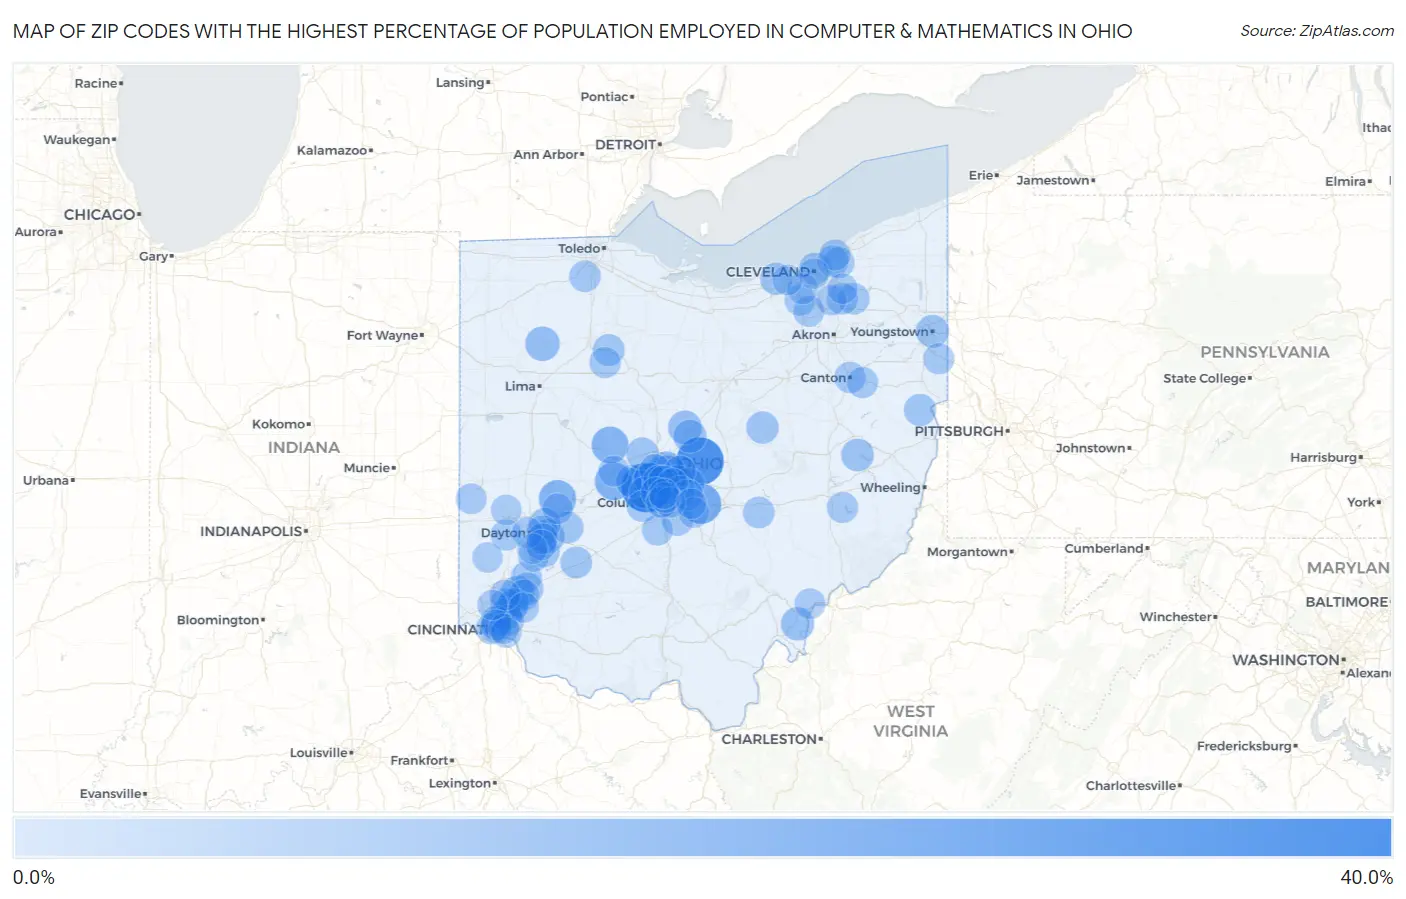
Map of Zip Codes with the Highest Percentage of Population Employed in Computer & Mathematics in Ohio
0.0%
40.0%
Zip Codes with the Highest Percentage of Population Employed in Computer & Mathematics in Ohio
| Zip Code | % Employed | vs State | vs National | |
| 1. | 43002 | 30.5% | 3.0%(+27.5)#1 | 3.5%(+27.0)#47 |
| 2. | 43013 | 27.8% | 3.0%(+24.7)#2 | 3.5%(+24.2)#63 |
| 3. | 43018 | 17.8% | 3.0%(+14.7)#3 | 3.5%(+14.3)#181 |
| 4. | 43240 | 16.0% | 3.0%(+12.9)#4 | 3.5%(+12.4)#220 |
| 5. | 43029 | 14.6% | 3.0%(+11.6)#5 | 3.5%(+11.1)#274 |
| 6. | 45349 | 14.2% | 3.0%(+11.1)#6 | 3.5%(+10.6)#295 |
| 7. | 43067 | 13.5% | 3.0%(+10.5)#7 | 3.5%(+10.0)#329 |
| 8. | 43016 | 11.4% | 3.0%(+8.34)#8 | 3.5%(+7.85)#509 |
| 9. | 43035 | 10.7% | 3.0%(+7.62)#9 | 3.5%(+7.13)#610 |
| 10. | 45848 | 10.4% | 3.0%(+7.38)#10 | 3.5%(+6.89)#646 |
| 11. | 45434 | 9.7% | 3.0%(+6.71)#11 | 3.5%(+6.22)#748 |
| 12. | 43321 | 9.5% | 3.0%(+6.49)#12 | 3.5%(+6.00)#790 |
| 13. | 45040 | 9.2% | 3.0%(+6.16)#13 | 3.5%(+5.67)#854 |
| 14. | 45772 | 9.0% | 3.0%(+5.95)#14 | 3.5%(+5.46)#903 |
| 15. | 43334 | 8.6% | 3.0%(+5.55)#15 | 3.5%(+5.06)#1,026 |
| 16. | 43064 | 8.4% | 3.0%(+5.39)#16 | 3.5%(+4.90)#1,074 |
| 17. | 44555 | 8.2% | 3.0%(+5.21)#17 | 3.5%(+4.72)#1,135 |
| 18. | 44699 | 8.0% | 3.0%(+4.99)#18 | 3.5%(+4.50)#1,199 |
| 19. | 43220 | 7.9% | 3.0%(+4.84)#19 | 3.5%(+4.35)#1,247 |
| 20. | 43061 | 7.8% | 3.0%(+4.80)#20 | 3.5%(+4.31)#1,268 |
| 21. | 43006 | 7.7% | 3.0%(+4.66)#21 | 3.5%(+4.17)#1,319 |
| 22. | 43017 | 7.6% | 3.0%(+4.57)#22 | 3.5%(+4.08)#1,349 |
| 23. | 44011 | 7.6% | 3.0%(+4.53)#23 | 3.5%(+4.04)#1,362 |
| 24. | 44114 | 7.5% | 3.0%(+4.49)#24 | 3.5%(+4.00)#1,378 |
| 25. | 43930 | 7.3% | 3.0%(+4.30)#25 | 3.5%(+3.81)#1,448 |
| 26. | 43026 | 7.3% | 3.0%(+4.28)#26 | 3.5%(+3.79)#1,459 |
| 27. | 45305 | 7.2% | 3.0%(+4.19)#27 | 3.5%(+3.70)#1,493 |
| 28. | 45065 | 7.2% | 3.0%(+4.13)#28 | 3.5%(+3.64)#1,535 |
| 29. | 45387 | 7.1% | 3.0%(+4.09)#29 | 3.5%(+3.60)#1,558 |
| 30. | 43081 | 7.1% | 3.0%(+4.07)#30 | 3.5%(+3.58)#1,573 |
| 31. | 45433 | 7.0% | 3.0%(+3.95)#31 | 3.5%(+3.46)#1,630 |
| 32. | 43065 | 7.0% | 3.0%(+3.94)#32 | 3.5%(+3.45)#1,634 |
| 33. | 45890 | 7.0% | 3.0%(+3.94)#33 | 3.5%(+3.45)#1,639 |
| 34. | 45164 | 6.9% | 3.0%(+3.90)#34 | 3.5%(+3.41)#1,662 |
| 35. | 43235 | 6.9% | 3.0%(+3.83)#35 | 3.5%(+3.34)#1,700 |
| 36. | 43054 | 6.8% | 3.0%(+3.79)#36 | 3.5%(+3.30)#1,728 |
| 37. | 45242 | 6.8% | 3.0%(+3.73)#37 | 3.5%(+3.24)#1,755 |
| 38. | 45241 | 6.7% | 3.0%(+3.70)#38 | 3.5%(+3.21)#1,771 |
| 39. | 43760 | 6.7% | 3.0%(+3.69)#39 | 3.5%(+3.20)#1,774 |
| 40. | 43125 | 6.7% | 3.0%(+3.69)#40 | 3.5%(+3.20)#1,778 |
| 41. | 43082 | 6.7% | 3.0%(+3.64)#41 | 3.5%(+3.15)#1,812 |
| 42. | 45431 | 6.6% | 3.0%(+3.60)#42 | 3.5%(+3.11)#1,837 |
| 43. | 43525 | 6.6% | 3.0%(+3.58)#43 | 3.5%(+3.09)#1,848 |
| 44. | 44202 | 6.5% | 3.0%(+3.48)#44 | 3.5%(+2.99)#1,919 |
| 45. | 43119 | 6.5% | 3.0%(+3.43)#45 | 3.5%(+2.94)#1,954 |
| 46. | 44087 | 6.4% | 3.0%(+3.40)#46 | 3.5%(+2.91)#1,979 |
| 47. | 43085 | 6.4% | 3.0%(+3.36)#47 | 3.5%(+2.87)#2,004 |
| 48. | 45236 | 6.3% | 3.0%(+3.29)#48 | 3.5%(+2.80)#2,053 |
| 49. | 44702 | 6.3% | 3.0%(+3.27)#49 | 3.5%(+2.78)#2,083 |
| 50. | 43230 | 6.2% | 3.0%(+3.19)#50 | 3.5%(+2.70)#2,131 |
| 51. | 43215 | 6.2% | 3.0%(+3.18)#51 | 3.5%(+2.69)#2,136 |
| 52. | 43004 | 6.2% | 3.0%(+3.16)#52 | 3.5%(+2.67)#2,152 |
| 53. | 44730 | 6.2% | 3.0%(+3.15)#53 | 3.5%(+2.66)#2,154 |
| 54. | 44136 | 6.2% | 3.0%(+3.14)#54 | 3.5%(+2.65)#2,160 |
| 55. | 44117 | 6.1% | 3.0%(+3.10)#55 | 3.5%(+2.61)#2,194 |
| 56. | 44143 | 6.1% | 3.0%(+3.06)#56 | 3.5%(+2.57)#2,230 |
| 57. | 45036 | 6.1% | 3.0%(+3.05)#57 | 3.5%(+2.56)#2,240 |
| 58. | 45345 | 6.1% | 3.0%(+3.03)#58 | 3.5%(+2.54)#2,263 |
| 59. | 45867 | 6.1% | 3.0%(+3.03)#59 | 3.5%(+2.54)#2,264 |
| 60. | 44132 | 6.0% | 3.0%(+2.99)#60 | 3.5%(+2.50)#2,290 |
| 61. | 44233 | 6.0% | 3.0%(+2.99)#61 | 3.5%(+2.50)#2,295 |
| 62. | 45039 | 6.0% | 3.0%(+2.95)#62 | 3.5%(+2.46)#2,326 |
| 63. | 43231 | 6.0% | 3.0%(+2.93)#63 | 3.5%(+2.44)#2,347 |
| 64. | 45249 | 6.0% | 3.0%(+2.93)#64 | 3.5%(+2.43)#2,348 |
| 65. | 43780 | 5.9% | 3.0%(+2.91)#65 | 3.5%(+2.41)#2,370 |
| 66. | 43116 | 5.9% | 3.0%(+2.90)#66 | 3.5%(+2.41)#2,372 |
| 67. | 44443 | 5.9% | 3.0%(+2.90)#67 | 3.5%(+2.41)#2,375 |
| 68. | 43221 | 5.8% | 3.0%(+2.81)#68 | 3.5%(+2.32)#2,456 |
| 69. | 45202 | 5.8% | 3.0%(+2.80)#69 | 3.5%(+2.31)#2,468 |
| 70. | 44130 | 5.7% | 3.0%(+2.70)#70 | 3.5%(+2.21)#2,553 |
| 71. | 45458 | 5.7% | 3.0%(+2.67)#71 | 3.5%(+2.18)#2,585 |
| 72. | 45229 | 5.7% | 3.0%(+2.63)#72 | 3.5%(+2.14)#2,625 |
| 73. | 45430 | 5.7% | 3.0%(+2.62)#73 | 3.5%(+2.13)#2,631 |
| 74. | 45203 | 5.6% | 3.0%(+2.61)#74 | 3.5%(+2.12)#2,640 |
| 75. | 45402 | 5.6% | 3.0%(+2.57)#75 | 3.5%(+2.08)#2,675 |
| 76. | 45346 | 5.6% | 3.0%(+2.54)#76 | 3.5%(+2.05)#2,702 |
| 77. | 43045 | 5.5% | 3.0%(+2.52)#77 | 3.5%(+2.03)#2,729 |
| 78. | 45227 | 5.5% | 3.0%(+2.49)#78 | 3.5%(+2.00)#2,752 |
| 79. | 45069 | 5.5% | 3.0%(+2.49)#79 | 3.5%(+2.00)#2,755 |
| 80. | 43147 | 5.5% | 3.0%(+2.48)#80 | 3.5%(+1.99)#2,764 |
| 81. | 43222 | 5.5% | 3.0%(+2.47)#81 | 3.5%(+1.98)#2,785 |
| 82. | 43205 | 5.5% | 3.0%(+2.47)#82 | 3.5%(+1.97)#2,786 |
| 83. | 45206 | 5.5% | 3.0%(+2.46)#83 | 3.5%(+1.97)#2,794 |
| 84. | 43201 | 5.5% | 3.0%(+2.45)#84 | 3.5%(+1.96)#2,802 |
| 85. | 45440 | 5.5% | 3.0%(+2.43)#85 | 3.5%(+1.94)#2,824 |
| 86. | 45319 | 5.4% | 3.0%(+2.39)#86 | 3.5%(+1.90)#2,875 |
| 87. | 44067 | 5.4% | 3.0%(+2.38)#87 | 3.5%(+1.89)#2,882 |
| 88. | 45742 | 5.4% | 3.0%(+2.34)#88 | 3.5%(+1.85)#2,914 |
| 89. | 45354 | 5.4% | 3.0%(+2.32)#89 | 3.5%(+1.83)#2,951 |
| 90. | 44113 | 5.3% | 3.0%(+2.29)#90 | 3.5%(+1.80)#2,973 |
| 91. | 45230 | 5.3% | 3.0%(+2.25)#91 | 3.5%(+1.76)#3,023 |
| 92. | 44145 | 5.3% | 3.0%(+2.23)#92 | 3.5%(+1.74)#3,047 |
| 93. | 43202 | 5.2% | 3.0%(+2.20)#93 | 3.5%(+1.71)#3,078 |
| 94. | 45459 | 5.1% | 3.0%(+2.11)#94 | 3.5%(+1.62)#3,183 |
| 95. | 45226 | 5.1% | 3.0%(+2.09)#95 | 3.5%(+1.60)#3,206 |
| 96. | 45218 | 5.1% | 3.0%(+2.08)#96 | 3.5%(+1.59)#3,212 |
| 97. | 44139 | 5.1% | 3.0%(+2.07)#97 | 3.5%(+1.58)#3,228 |
| 98. | 45070 | 5.1% | 3.0%(+2.05)#98 | 3.5%(+1.56)#3,247 |
| 99. | 45140 | 5.1% | 3.0%(+2.05)#99 | 3.5%(+1.56)#3,252 |
| 100. | 43068 | 5.1% | 3.0%(+2.04)#100 | 3.5%(+1.55)#3,265 |
Common Questions
What are the Top 10 Zip Codes with the Highest Percentage of Population Employed in Computer & Mathematics in Ohio?
Top 10 Zip Codes with the Highest Percentage of Population Employed in Computer & Mathematics in Ohio are:
What zip code has the Highest Percentage of Population Employed in Computer & Mathematics in Ohio?
43002 has the Highest Percentage of Population Employed in Computer & Mathematics in Ohio with 30.5%.
What is the Percentage of Population Employed in Computer & Mathematics in the State of Ohio?
Percentage of Population Employed in Computer & Mathematics in Ohio is 3.0%.
What is the Percentage of Population Employed in Computer & Mathematics in the United States?
Percentage of Population Employed in Computer & Mathematics in the United States is 3.5%.