Lafayette, OH Map & Demographics
Lafayette Map
Lafayette Overview
$42,877
PER CAPITA INCOME
$122,750
AVG FAMILY INCOME
$85,000
AVG HOUSEHOLD INCOME
50.5%
WAGE / INCOME GAP [ % ]
49.5¢/ $1
WAGE / INCOME GAP [ $ ]
0.28
INEQUALITY / GINI INDEX
133
TOTAL POPULATION
63
MALE POPULATION
70
FEMALE POPULATION
90.00
MALES / 100 FEMALES
111.11
FEMALES / 100 MALES
51.7
MEDIAN AGE
2.5
AVG FAMILY SIZE
2.5
AVG HOUSEHOLD SIZE
73
LABOR FORCE [ PEOPLE ]
58.4%
PERCENT IN LABOR FORCE
Lafayette Zip Codes
Lafayette Area Codes
Income in Lafayette
Income Overview in Lafayette
Per Capita Income in Lafayette is $42,877, while median incomes of families and households are $122,750 and $85,000 respectively.
| Characteristic | Number | Measure |
| Per Capita Income | 133 | $42,877 |
| Median Family Income | 35 | $122,750 |
| Mean Family Income | 35 | $116,223 |
| Median Household Income | 54 | $85,000 |
| Mean Household Income | 54 | $94,993 |
| Income Deficit | 35 | $0 |
| Wage / Income Gap (%) | 133 | 50.47% |
| Wage / Income Gap ($) | 133 | 49.53¢ per $1 |
| Gini / Inequality Index | 133 | 0.28 |
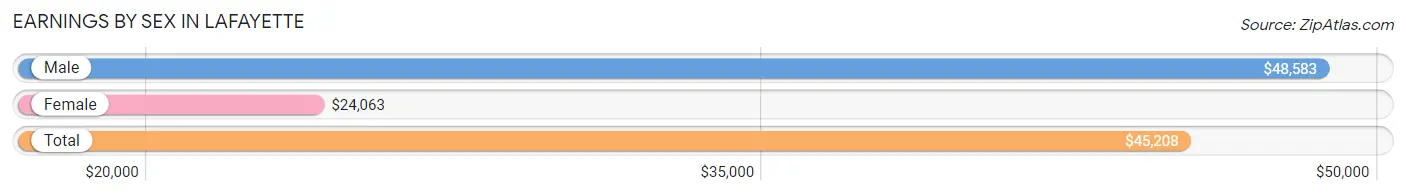
Earnings by Sex in Lafayette
Average Earnings in Lafayette are $45,208, $48,583 for men and $24,063 for women, a difference of 50.5%.
| Sex | Number | Average Earnings |
| Male | 49 (63.6%) | $48,583 |
| Female | 28 (36.4%) | $24,063 |
| Total | 77 (100.0%) | $45,208 |
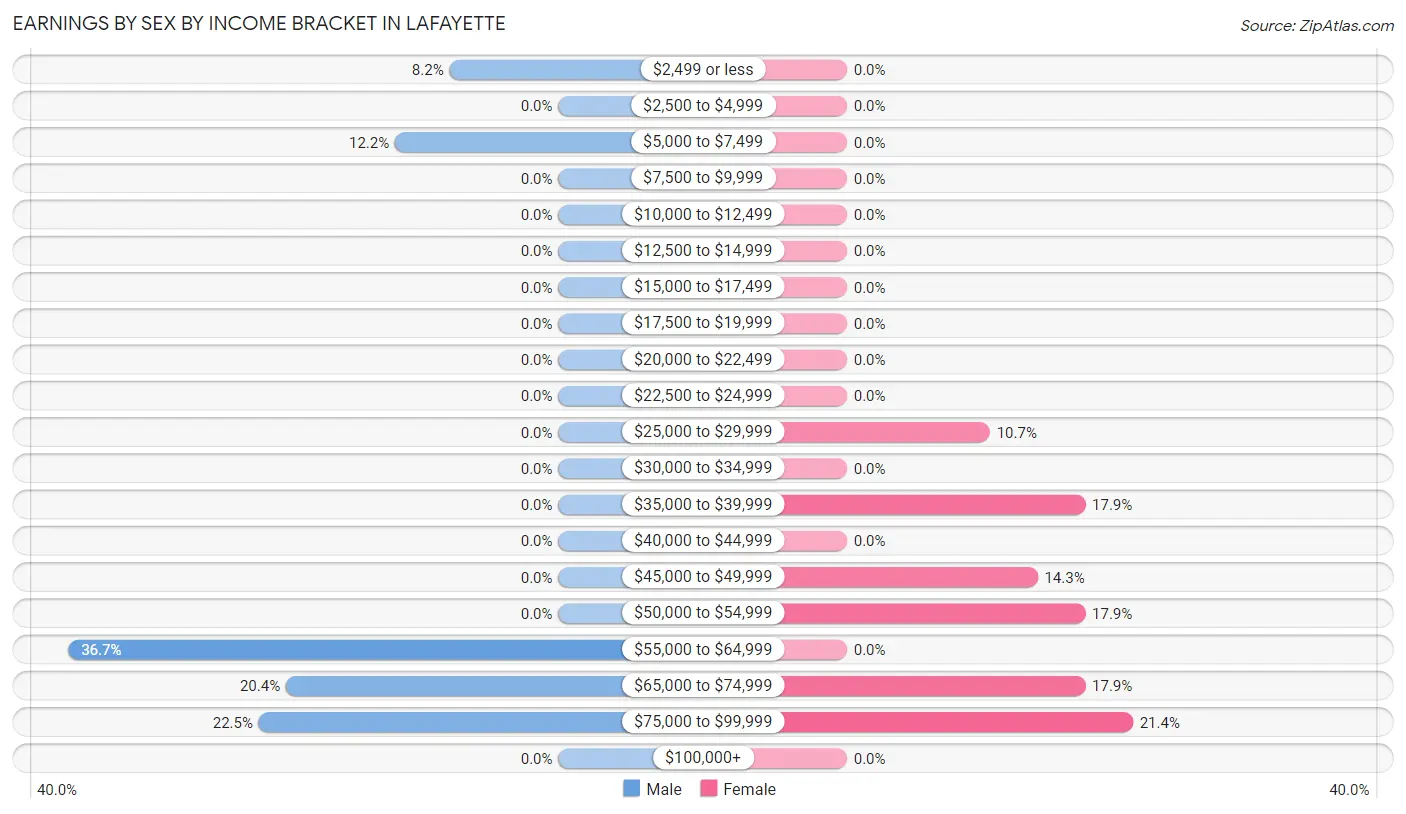
Earnings by Sex by Income Bracket in Lafayette
The most common earnings brackets in Lafayette are $55,000 to $64,999 for men (18 | 36.7%) and $75,000 to $99,999 for women (6 | 21.4%).
| Income | Male | Female |
| $2,499 or less | 4 (8.2%) | 0 (0.0%) |
| $2,500 to $4,999 | 0 (0.0%) | 0 (0.0%) |
| $5,000 to $7,499 | 6 (12.2%) | 0 (0.0%) |
| $7,500 to $9,999 | 0 (0.0%) | 0 (0.0%) |
| $10,000 to $12,499 | 0 (0.0%) | 0 (0.0%) |
| $12,500 to $14,999 | 0 (0.0%) | 0 (0.0%) |
| $15,000 to $17,499 | 0 (0.0%) | 0 (0.0%) |
| $17,500 to $19,999 | 0 (0.0%) | 0 (0.0%) |
| $20,000 to $22,499 | 0 (0.0%) | 0 (0.0%) |
| $22,500 to $24,999 | 0 (0.0%) | 0 (0.0%) |
| $25,000 to $29,999 | 0 (0.0%) | 3 (10.7%) |
| $30,000 to $34,999 | 0 (0.0%) | 0 (0.0%) |
| $35,000 to $39,999 | 0 (0.0%) | 5 (17.9%) |
| $40,000 to $44,999 | 0 (0.0%) | 0 (0.0%) |
| $45,000 to $49,999 | 0 (0.0%) | 4 (14.3%) |
| $50,000 to $54,999 | 0 (0.0%) | 5 (17.9%) |
| $55,000 to $64,999 | 18 (36.7%) | 0 (0.0%) |
| $65,000 to $74,999 | 10 (20.4%) | 5 (17.9%) |
| $75,000 to $99,999 | 11 (22.5%) | 6 (21.4%) |
| $100,000+ | 0 (0.0%) | 0 (0.0%) |
| Total | 49 (100.0%) | 28 (100.0%) |
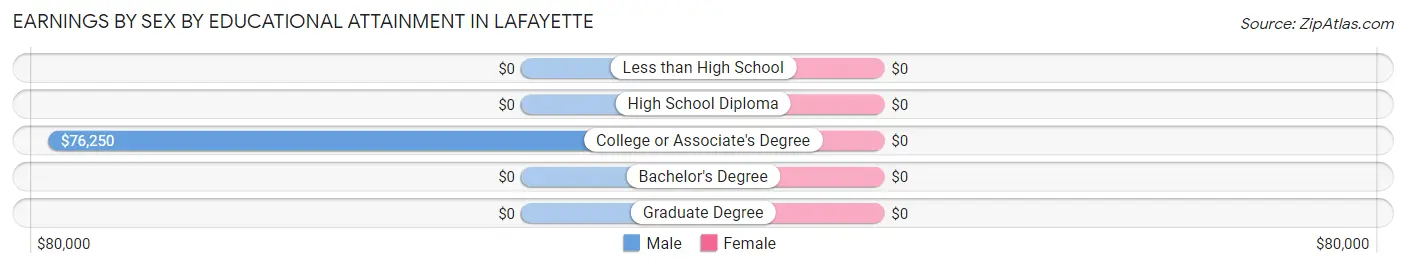
Earnings by Sex by Educational Attainment in Lafayette
| Educational Attainment | Male Income | Female Income |
| Less than High School | - | - |
| High School Diploma | - | - |
| College or Associate's Degree | $76,250 | $0 |
| Bachelor's Degree | - | - |
| Graduate Degree | - | - |
| Total | $59,904 | $51,750 |
Family Income in Lafayette
Family Income Brackets in Lafayette
According to the Lafayette family income data, there are 13 families falling into the $150,000 to $199,999 income range, which is the most common income bracket and makes up 37.1% of all families.
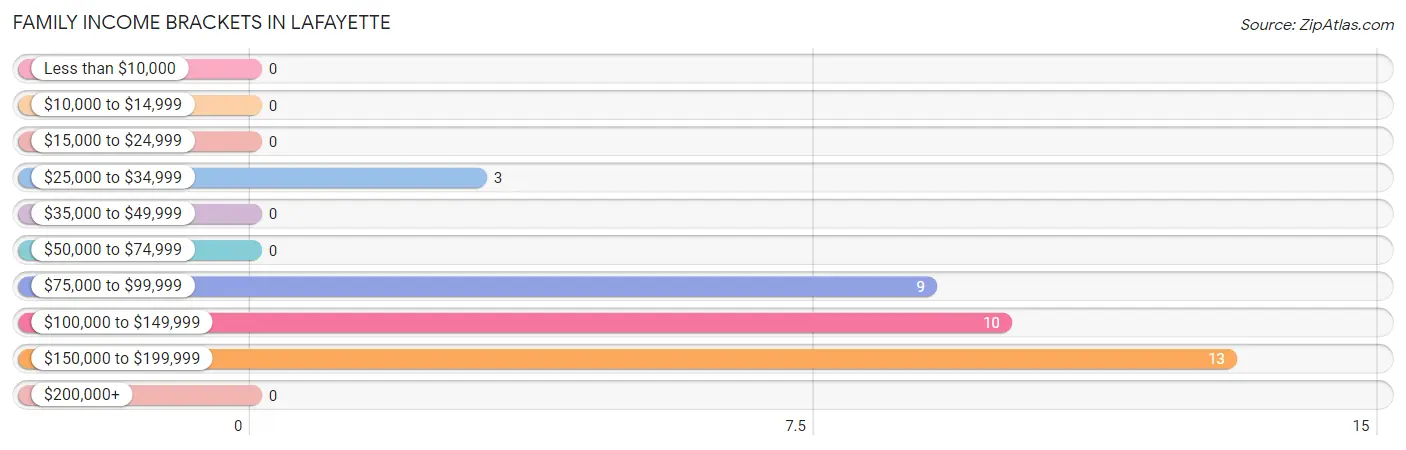
| Income Bracket | # Families | % Families |
| Less than $10,000 | 0 | 0.0% |
| $10,000 to $14,999 | 0 | 0.0% |
| $15,000 to $24,999 | 0 | 0.0% |
| $25,000 to $34,999 | 3 | 8.6% |
| $35,000 to $49,999 | 0 | 0.0% |
| $50,000 to $74,999 | 0 | 0.0% |
| $75,000 to $99,999 | 9 | 25.7% |
| $100,000 to $149,999 | 10 | 28.6% |
| $150,000 to $199,999 | 13 | 37.1% |
| $200,000+ | 0 | 0.0% |
Family Income by Famaliy Size in Lafayette
2-person families (20 | 57.1%) account for the highest median family income in Lafayette with $124,000 per family, while 2-person families (20 | 57.1%) have the highest median income of $62,000 per family member.
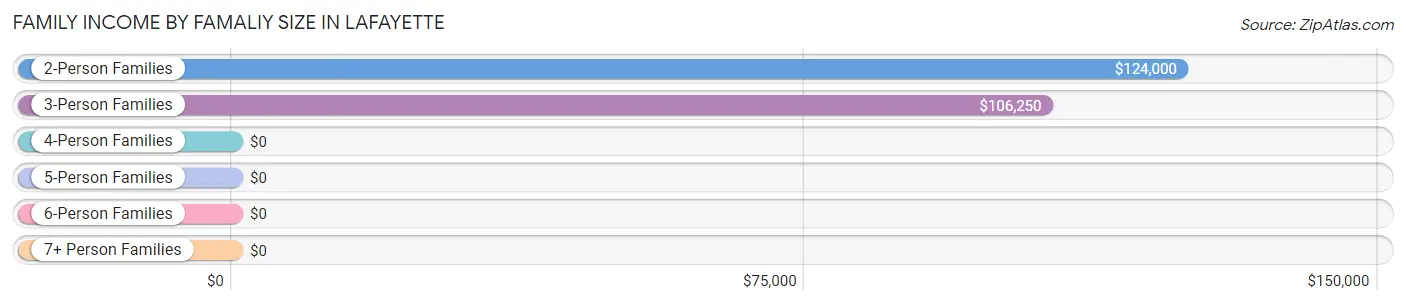
| Income Bracket | # Families | Median Income |
| 2-Person Families | 20 (57.1%) | $124,000 |
| 3-Person Families | 15 (42.9%) | $106,250 |
| 4-Person Families | 0 (0.0%) | $0 |
| 5-Person Families | 0 (0.0%) | $0 |
| 6-Person Families | 0 (0.0%) | $0 |
| 7+ Person Families | 0 (0.0%) | $0 |
| Total | 35 (100.0%) | $122,750 |
Family Income by Number of Earners in Lafayette
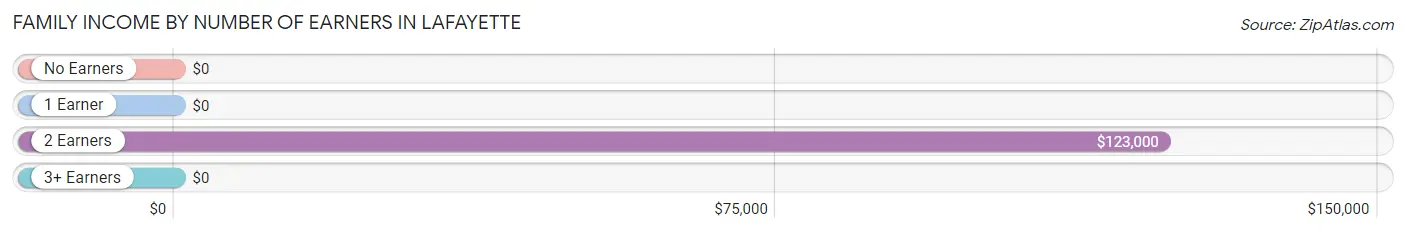
| Number of Earners | # Families | Median Income |
| No Earners | 5 (14.3%) | $0 |
| 1 Earner | 0 (0.0%) | $0 |
| 2 Earners | 30 (85.7%) | $123,000 |
| 3+ Earners | 0 (0.0%) | $0 |
| Total | 35 (100.0%) | $122,750 |
Household Income in Lafayette
Household Income Brackets in Lafayette
With 20 households falling in the category, the $75,000 to $99,999 income range is the most frequent in Lafayette, accounting for 37.0% of all households.
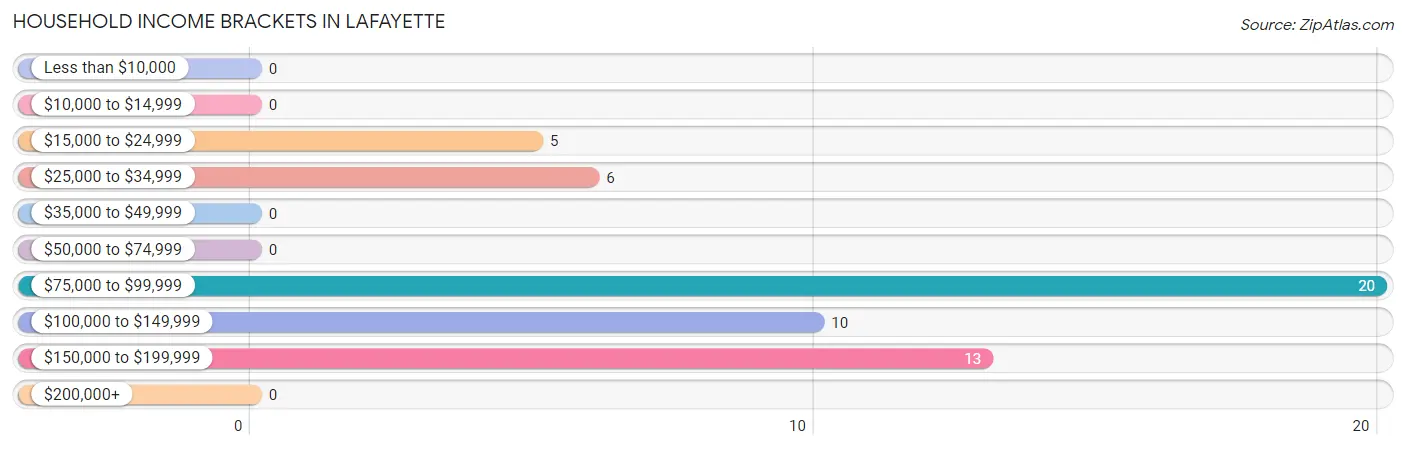
| Income Bracket | # Households | % Households |
| Less than $10,000 | 0 | 0.0% |
| $10,000 to $14,999 | 0 | 0.0% |
| $15,000 to $24,999 | 5 | 9.3% |
| $25,000 to $34,999 | 6 | 11.1% |
| $35,000 to $49,999 | 0 | 0.0% |
| $50,000 to $74,999 | 0 | 0.0% |
| $75,000 to $99,999 | 20 | 37.0% |
| $100,000 to $149,999 | 10 | 18.5% |
| $150,000 to $199,999 | 13 | 24.1% |
| $200,000+ | 0 | 0.0% |
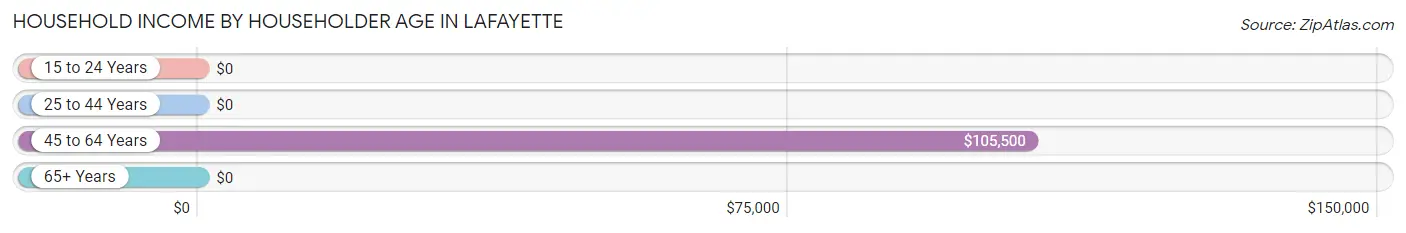
Household Income by Householder Age in Lafayette
The median household income in Lafayette is $85,000, with the highest median household income of $105,500 found in the 45 to 64 years age bracket for the primary householder. A total of 30 households (55.6%) fall into this category. Meanwhile, the 15 to 24 years age bracket for the primary householder has the lowest median household income of $0, with 3 households (5.6%) in this group.
| Income Bracket | # Households | Median Income |
| 15 to 24 Years | 3 (5.6%) | $0 |
| 25 to 44 Years | 10 (18.5%) | $0 |
| 45 to 64 Years | 30 (55.6%) | $105,500 |
| 65+ Years | 11 (20.4%) | $0 |
| Total | 54 (100.0%) | $85,000 |
Poverty in Lafayette
Income Below Poverty by Sex and Age in Lafayette
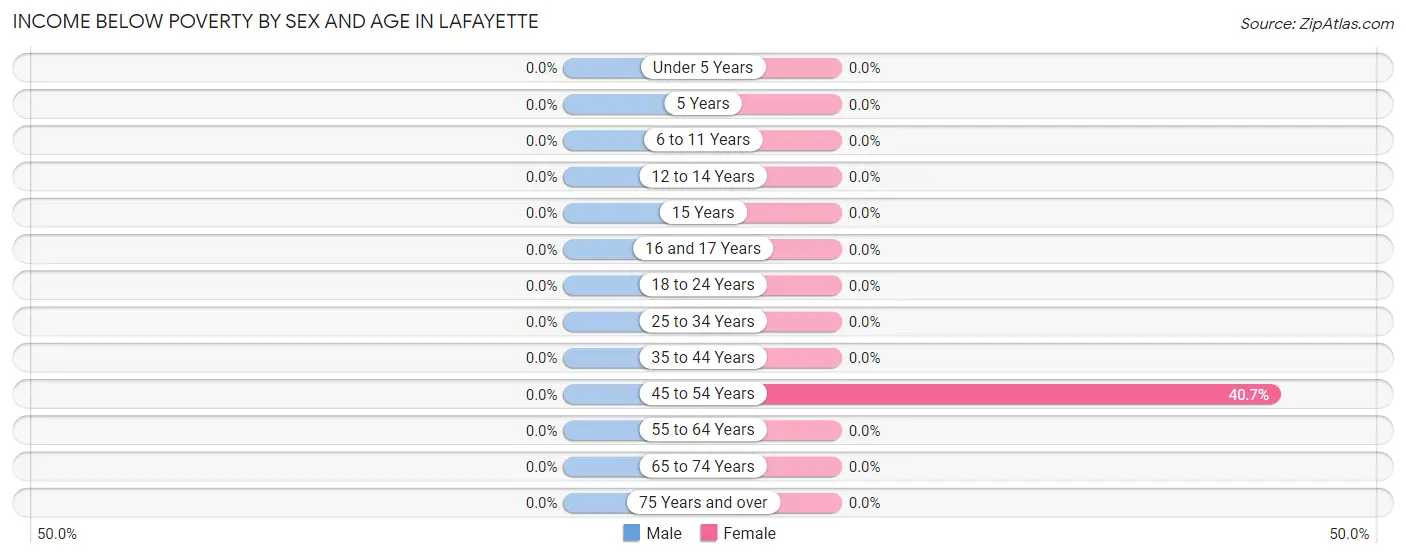
| Age Bracket | Male | Female |
| Under 5 Years | 0 (0.0%) | 0 (0.0%) |
| 5 Years | 0 (0.0%) | 0 (0.0%) |
| 6 to 11 Years | 0 (0.0%) | 0 (0.0%) |
| 12 to 14 Years | 0 (0.0%) | 0 (0.0%) |
| 15 Years | 0 (0.0%) | 0 (0.0%) |
| 16 and 17 Years | 0 (0.0%) | 0 (0.0%) |
| 18 to 24 Years | 0 (0.0%) | 0 (0.0%) |
| 25 to 34 Years | 0 (0.0%) | 0 (0.0%) |
| 35 to 44 Years | 0 (0.0%) | 0 (0.0%) |
| 45 to 54 Years | 0 (0.0%) | 11 (40.7%) |
| 55 to 64 Years | 0 (0.0%) | 0 (0.0%) |
| 65 to 74 Years | 0 (0.0%) | 0 (0.0%) |
| 75 Years and over | 0 (0.0%) | 0 (0.0%) |
| Total | 0 (0.0%) | 11 (15.7%) |
Income Above Poverty by Sex and Age in Lafayette
According to the poverty statistics in Lafayette, males aged 6 to 11 years and females aged under 5 years are the age groups that are most secure financially, with 100.0% of males and 100.0% of females in these age groups living above the poverty line.
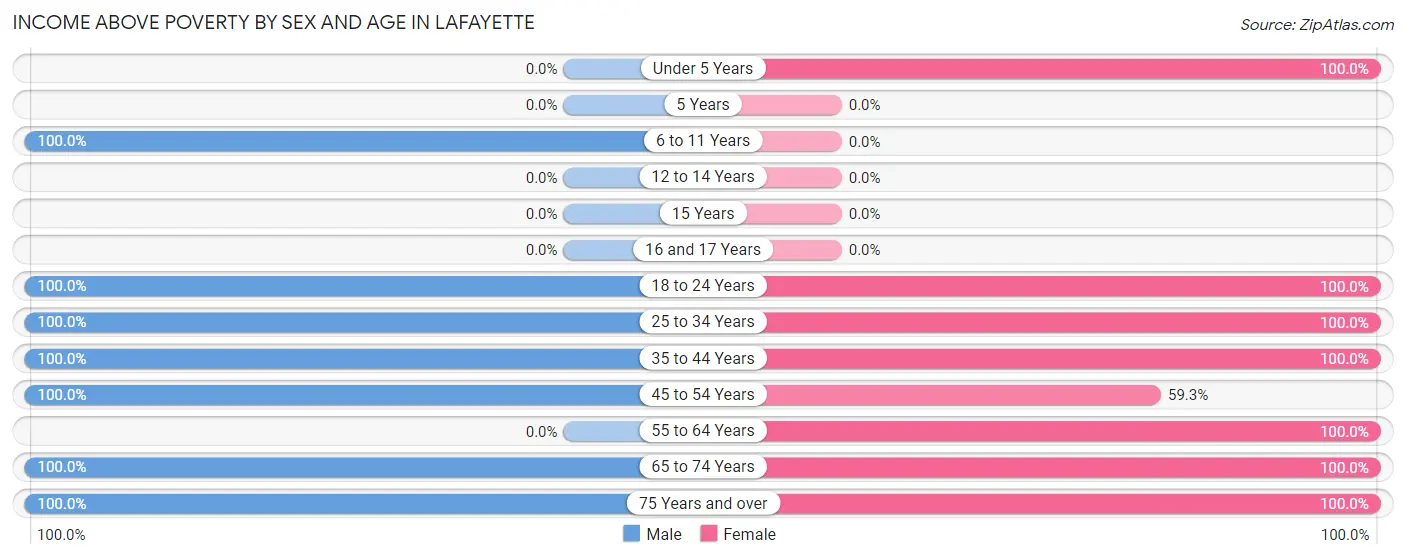
| Age Bracket | Male | Female |
| Under 5 Years | 0 (0.0%) | 4 (100.0%) |
| 5 Years | 0 (0.0%) | 0 (0.0%) |
| 6 to 11 Years | 4 (100.0%) | 0 (0.0%) |
| 12 to 14 Years | 0 (0.0%) | 0 (0.0%) |
| 15 Years | 0 (0.0%) | 0 (0.0%) |
| 16 and 17 Years | 0 (0.0%) | 0 (0.0%) |
| 18 to 24 Years | 6 (100.0%) | 3 (100.0%) |
| 25 to 34 Years | 4 (100.0%) | 5 (100.0%) |
| 35 to 44 Years | 5 (100.0%) | 5 (100.0%) |
| 45 to 54 Years | 30 (100.0%) | 16 (59.3%) |
| 55 to 64 Years | 0 (0.0%) | 3 (100.0%) |
| 65 to 74 Years | 8 (100.0%) | 16 (100.0%) |
| 75 Years and over | 6 (100.0%) | 7 (100.0%) |
| Total | 63 (100.0%) | 59 (84.3%) |
Income Below Poverty Among Married-Couple Families in Lafayette
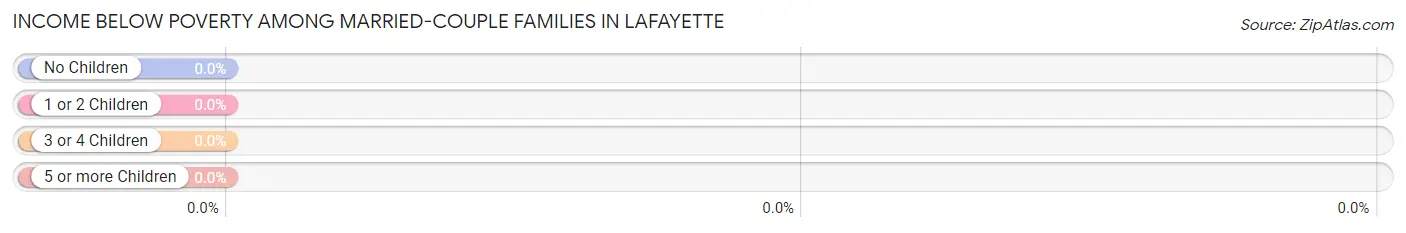
| Children | Above Poverty | Below Poverty |
| No Children | 25 (100.0%) | 0 (0.0%) |
| 1 or 2 Children | 10 (100.0%) | 0 (0.0%) |
| 3 or 4 Children | 0 (0.0%) | 0 (0.0%) |
| 5 or more Children | 0 (0.0%) | 0 (0.0%) |
| Total | 35 (100.0%) | 0 (0.0%) |
Income Below Poverty Among Single-Parent Households in Lafayette
| Children | Single Father | Single Mother |
| No Children | 0 (0.0%) | 0 (0.0%) |
| 1 or 2 Children | 0 (0.0%) | 0 (0.0%) |
| 3 or 4 Children | 0 (0.0%) | 0 (0.0%) |
| 5 or more Children | 0 (0.0%) | 0 (0.0%) |
| Total | 0 (0.0%) | 0 (0.0%) |
Income Below Poverty Among Married-Couple vs Single-Parent Households in Lafayette
| Children | Married-Couple Families | Single-Parent Households |
| No Children | 0 (0.0%) | 0 (0.0%) |
| 1 or 2 Children | 0 (0.0%) | 0 (0.0%) |
| 3 or 4 Children | 0 (0.0%) | 0 (0.0%) |
| 5 or more Children | 0 (0.0%) | 0 (0.0%) |
| Total | 0 (0.0%) | 0 (0.0%) |
Race in Lafayette
The most populous races in Lafayette are White / Caucasian (124 | 93.2%), Black / African American (5 | 3.8%), and Two or more Races (4 | 3.0%).
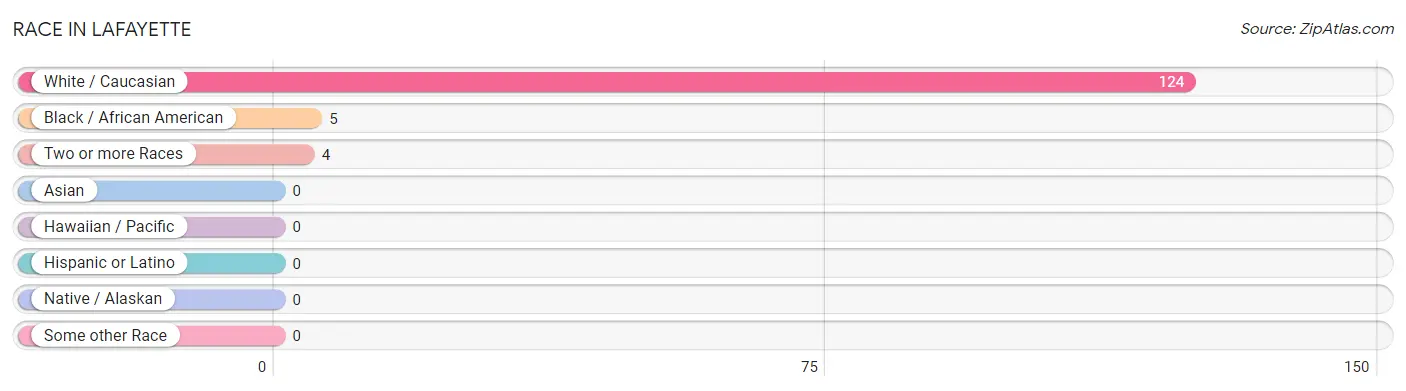
| Race | # Population | % Population |
| Asian | 0 | 0.0% |
| Black / African American | 5 | 3.8% |
| Hawaiian / Pacific | 0 | 0.0% |
| Hispanic or Latino | 0 | 0.0% |
| Native / Alaskan | 0 | 0.0% |
| White / Caucasian | 124 | 93.2% |
| Two or more Races | 4 | 3.0% |
| Some other Race | 0 | 0.0% |
| Total | 133 | 100.0% |
Ancestry in Lafayette
The most populous ancestries reported in Lafayette are American (38 | 28.6%), Irish (26 | 19.6%), German (21 | 15.8%), European (12 | 9.0%), and Welsh (12 | 9.0%), together accounting for 82.0% of all Lafayette residents.
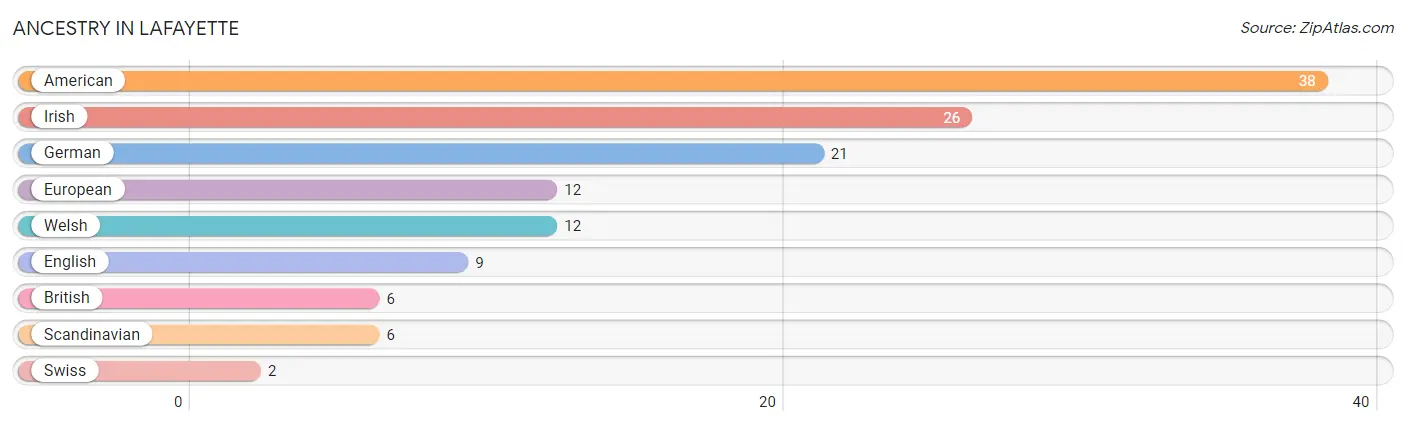
| Ancestry | # Population | % Population |
| American | 38 | 28.6% |
| British | 6 | 4.5% |
| English | 9 | 6.8% |
| European | 12 | 9.0% |
| German | 21 | 15.8% |
| Irish | 26 | 19.6% |
| Scandinavian | 6 | 4.5% |
| Swiss | 2 | 1.5% |
| Welsh | 12 | 9.0% | View All 9 Rows |
Immigrants in Lafayette

| Immigration Origin | # Population | % Population | View All 0 Rows |
Sex and Age in Lafayette
Sex and Age in Lafayette
The most populous age groups in Lafayette are 50 to 54 Years (30 | 47.6%) for men and 50 to 54 Years (17 | 24.3%) for women.
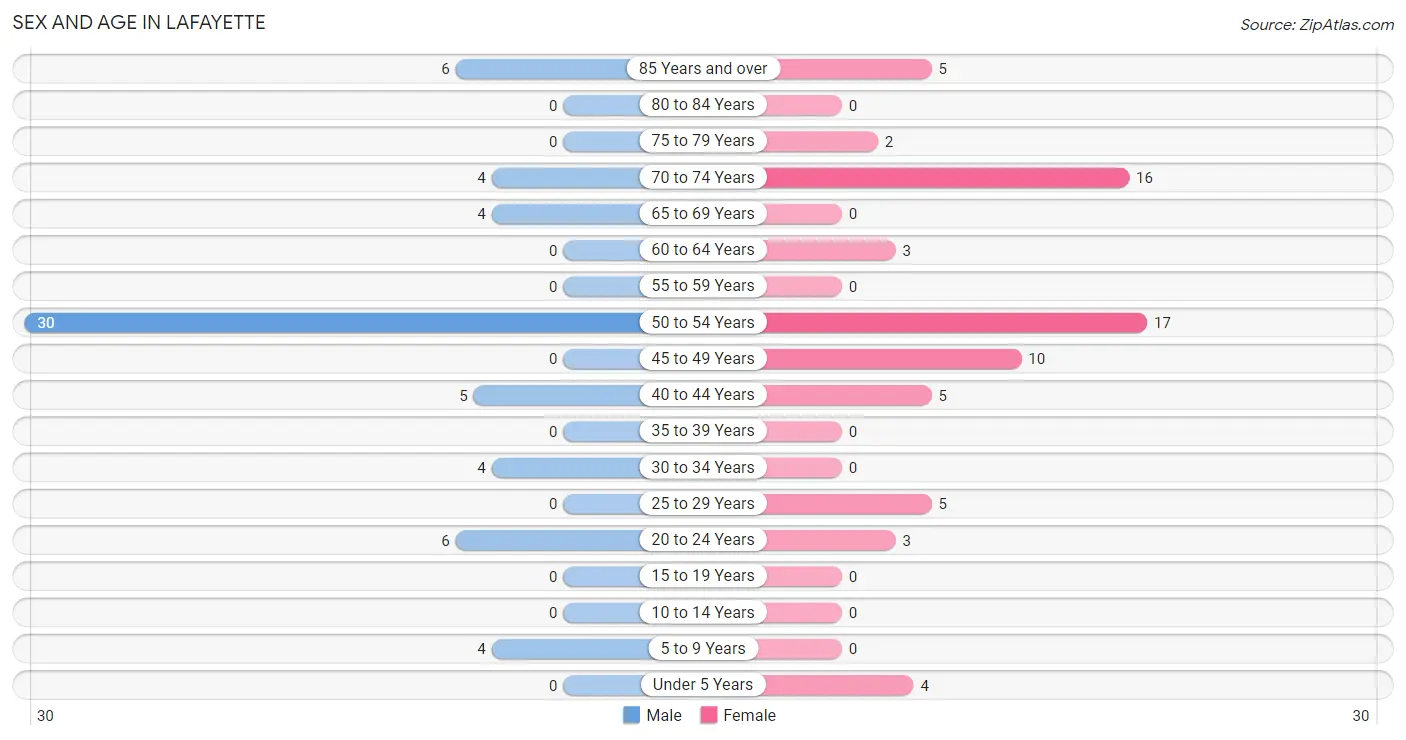
| Age Bracket | Male | Female |
| Under 5 Years | 0 (0.0%) | 4 (5.7%) |
| 5 to 9 Years | 4 (6.4%) | 0 (0.0%) |
| 10 to 14 Years | 0 (0.0%) | 0 (0.0%) |
| 15 to 19 Years | 0 (0.0%) | 0 (0.0%) |
| 20 to 24 Years | 6 (9.5%) | 3 (4.3%) |
| 25 to 29 Years | 0 (0.0%) | 5 (7.1%) |
| 30 to 34 Years | 4 (6.4%) | 0 (0.0%) |
| 35 to 39 Years | 0 (0.0%) | 0 (0.0%) |
| 40 to 44 Years | 5 (7.9%) | 5 (7.1%) |
| 45 to 49 Years | 0 (0.0%) | 10 (14.3%) |
| 50 to 54 Years | 30 (47.6%) | 17 (24.3%) |
| 55 to 59 Years | 0 (0.0%) | 0 (0.0%) |
| 60 to 64 Years | 0 (0.0%) | 3 (4.3%) |
| 65 to 69 Years | 4 (6.4%) | 0 (0.0%) |
| 70 to 74 Years | 4 (6.4%) | 16 (22.9%) |
| 75 to 79 Years | 0 (0.0%) | 2 (2.9%) |
| 80 to 84 Years | 0 (0.0%) | 0 (0.0%) |
| 85 Years and over | 6 (9.5%) | 5 (7.1%) |
| Total | 63 (100.0%) | 70 (100.0%) |
Families and Households in Lafayette
Median Family Size in Lafayette
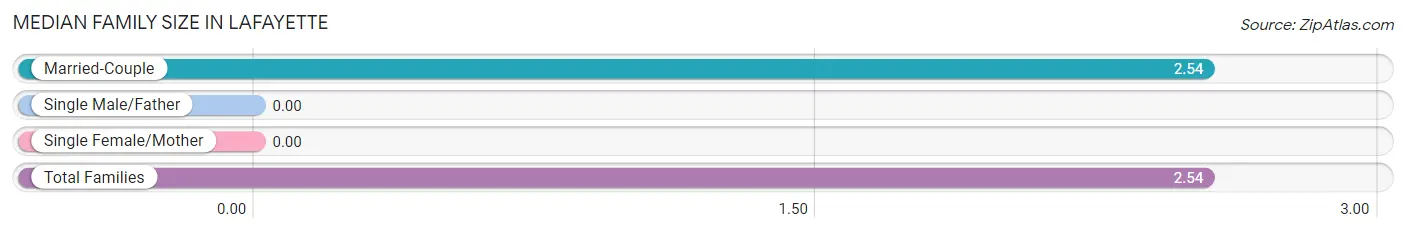
| Family Type | # Families | Family Size |
| Married-Couple | 35 (100.0%) | 2.54 |
| Single Male/Father | 0 (0.0%) | - |
| Single Female/Mother | 0 (0.0%) | - |
| Total Families | 35 (100.0%) | 2.54 |
Median Household Size in Lafayette
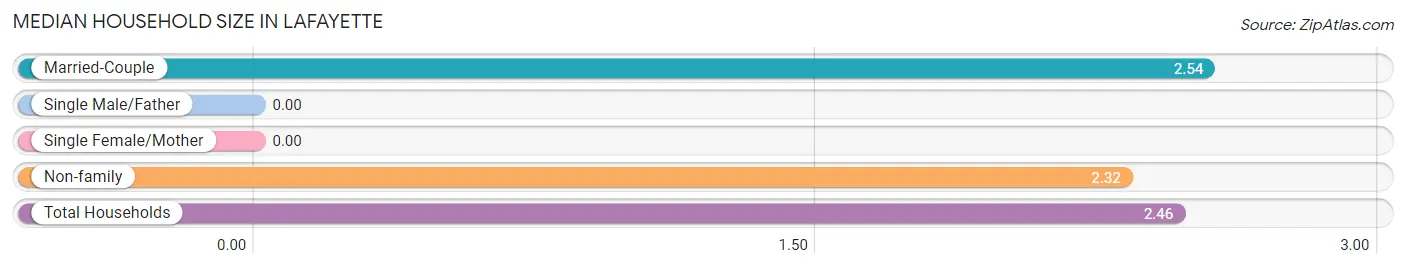
| Household Type | # Households | Household Size |
| Married-Couple | 35 (64.8%) | 2.54 |
| Single Male/Father | 0 (0.0%) | - |
| Single Female/Mother | 0 (0.0%) | - |
| Non-family | 19 (35.2%) | 2.32 |
| Total Households | 54 (100.0%) | 2.46 |
Household Size by Marriage Status in Lafayette
Out of a total of 54 households in Lafayette, 35 (64.8%) are family households, while 19 (35.2%) are nonfamily households. The most numerous type of family households are 2-person households, comprising 20, and the most common type of nonfamily households are 3-person households, comprising 11.
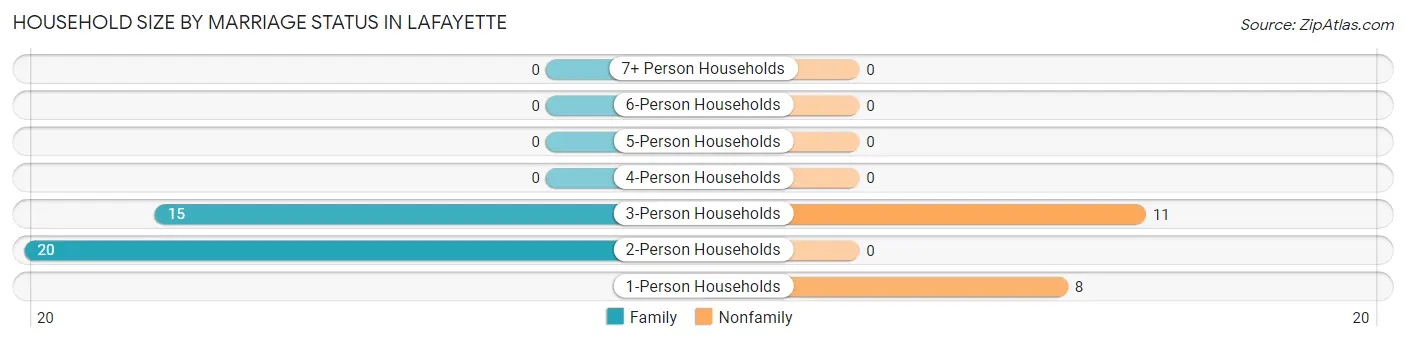
| Household Size | Family Households | Nonfamily Households |
| 1-Person Households | - | 8 (14.8%) |
| 2-Person Households | 20 (37.0%) | 0 (0.0%) |
| 3-Person Households | 15 (27.8%) | 11 (20.4%) |
| 4-Person Households | 0 (0.0%) | 0 (0.0%) |
| 5-Person Households | 0 (0.0%) | 0 (0.0%) |
| 6-Person Households | 0 (0.0%) | 0 (0.0%) |
| 7+ Person Households | 0 (0.0%) | 0 (0.0%) |
| Total | 35 (64.8%) | 19 (35.2%) |
Female Fertility in Lafayette
Fertility by Age in Lafayette
Average fertility rate in Lafayette is 172.0 births per 1,000 women. Women in the age bracket of 20 to 34 years have the highest fertility rate with 625.0 births per 1,000 women. Women in the age bracket of 20 to 34 years acount for 100.0% of all women with births.
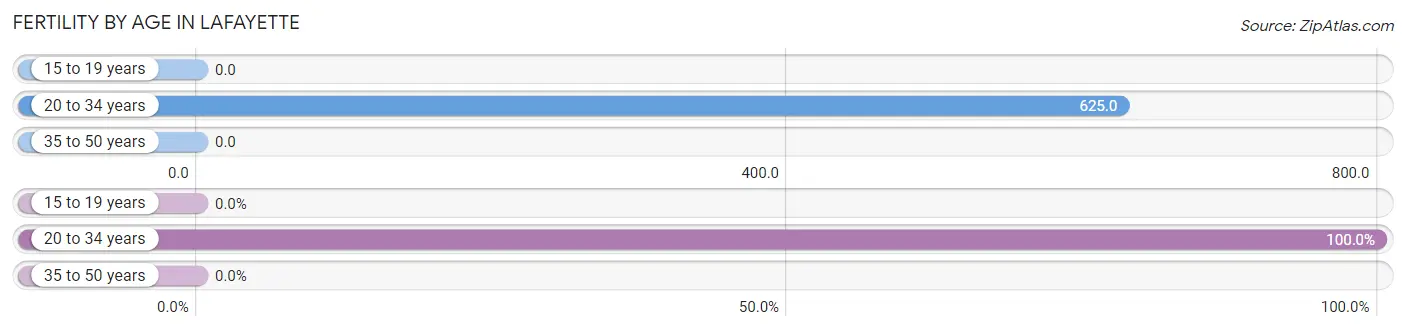
| Age Bracket | Women with Births | Births / 1,000 Women |
| 15 to 19 years | 0 (0.0%) | 0.0 |
| 20 to 34 years | 5 (100.0%) | 625.0 |
| 35 to 50 years | 0 (0.0%) | 0.0 |
| Total | 5 (100.0%) | 172.0 |
Fertility by Age by Marriage Status in Lafayette
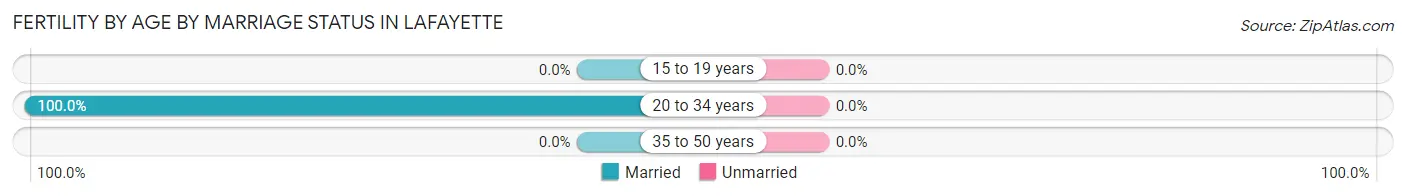
| Age Bracket | Married | Unmarried |
| 15 to 19 years | 0 (0.0%) | 0 (0.0%) |
| 20 to 34 years | 5 (100.0%) | 0 (0.0%) |
| 35 to 50 years | 0 (0.0%) | 0 (0.0%) |
| Total | 5 (100.0%) | 0 (0.0%) |
Fertility by Education in Lafayette
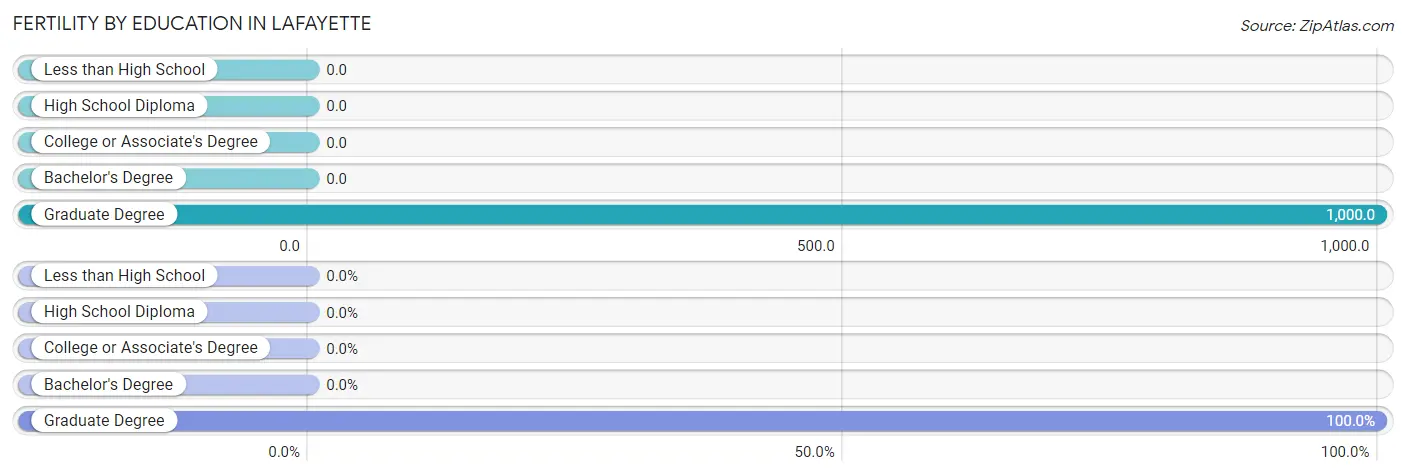
| Educational Attainment | Women with Births | Births / 1,000 Women |
| Less than High School | 0 (0.0%) | 0.0 |
| High School Diploma | 0 (0.0%) | 0.0 |
| College or Associate's Degree | 0 (0.0%) | 0.0 |
| Bachelor's Degree | 0 (0.0%) | 0.0 |
| Graduate Degree | 5 (100.0%) | 1,000.0 |
| Total | 5 (100.0%) | 172.0 |
Fertility by Education by Marriage Status in Lafayette
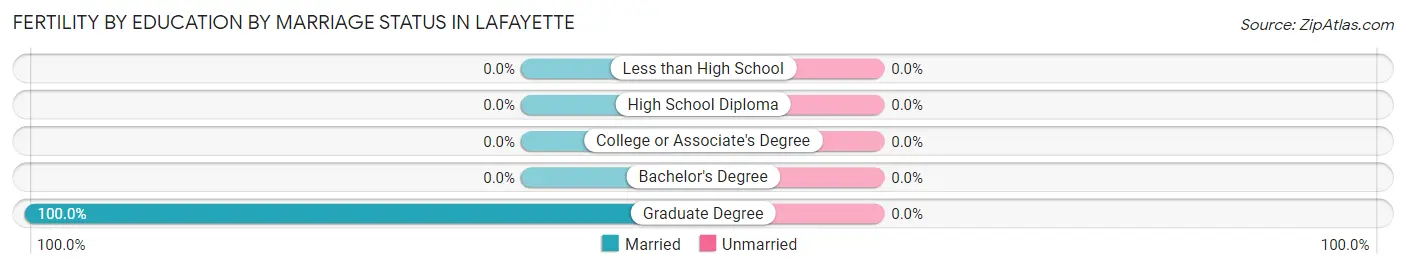
| Educational Attainment | Married | Unmarried |
| Less than High School | 0 (0.0%) | 0 (0.0%) |
| High School Diploma | 0 (0.0%) | 0 (0.0%) |
| College or Associate's Degree | 0 (0.0%) | 0 (0.0%) |
| Bachelor's Degree | 0 (0.0%) | 0 (0.0%) |
| Graduate Degree | 5 (100.0%) | 0 (0.0%) |
| Total | 5 (100.0%) | 0 (0.0%) |
Employment Characteristics in Lafayette
Employment by Class of Employer in Lafayette
Among the 73 employed individuals in Lafayette, private company employees (46 | 63.0%), local government employees (12 | 16.4%), and not-for-profit organizations (10 | 13.7%) make up the most common classes of employment.
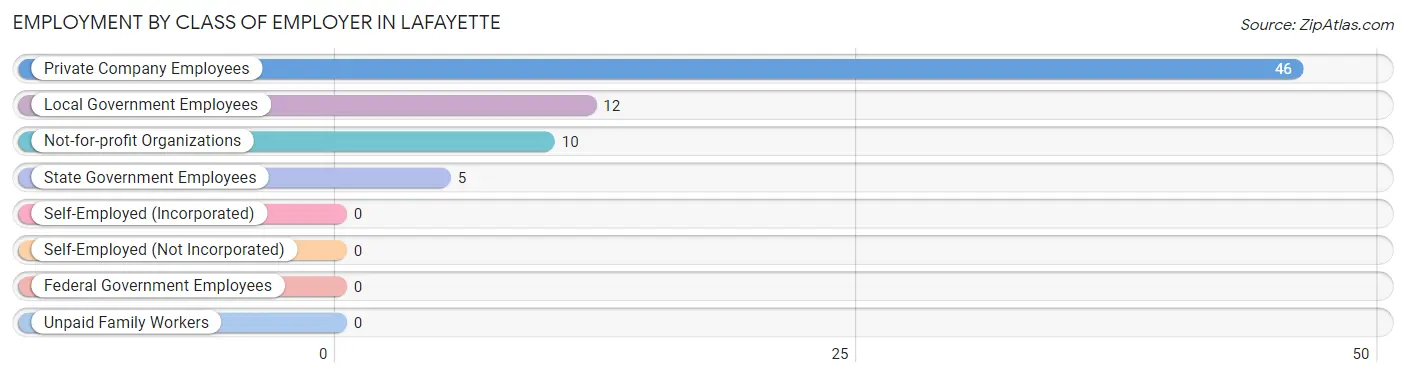
| Employer Class | # Employees | % Employees |
| Private Company Employees | 46 | 63.0% |
| Self-Employed (Incorporated) | 0 | 0.0% |
| Self-Employed (Not Incorporated) | 0 | 0.0% |
| Not-for-profit Organizations | 10 | 13.7% |
| Local Government Employees | 12 | 16.4% |
| State Government Employees | 5 | 6.9% |
| Federal Government Employees | 0 | 0.0% |
| Unpaid Family Workers | 0 | 0.0% |
| Total | 73 | 100.0% |
Employment Status by Age in Lafayette
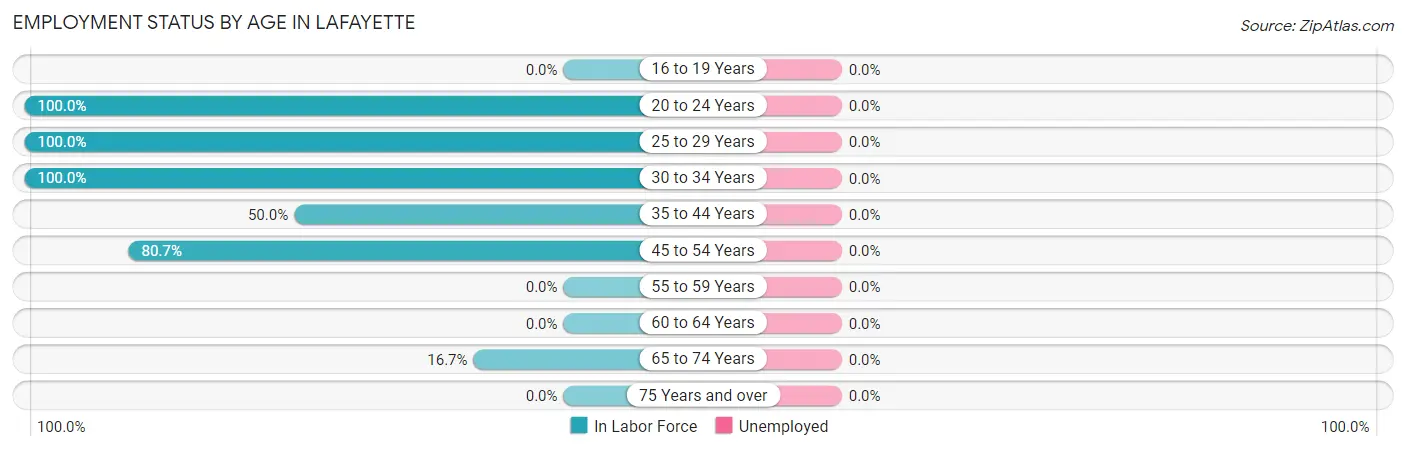
| Age Bracket | In Labor Force | Unemployed |
| 16 to 19 Years | 0 (0.0%) | 0 (0.0%) |
| 20 to 24 Years | 9 (100.0%) | 0 (0.0%) |
| 25 to 29 Years | 5 (100.0%) | 0 (0.0%) |
| 30 to 34 Years | 4 (100.0%) | 0 (0.0%) |
| 35 to 44 Years | 5 (50.0%) | 0 (0.0%) |
| 45 to 54 Years | 46 (80.7%) | 0 (0.0%) |
| 55 to 59 Years | 0 (0.0%) | 0 (0.0%) |
| 60 to 64 Years | 0 (0.0%) | 0 (0.0%) |
| 65 to 74 Years | 4 (16.7%) | 0 (0.0%) |
| 75 Years and over | 0 (0.0%) | 0 (0.0%) |
| Total | 73 (58.4%) | 0 (0.0%) |
Employment Status by Educational Attainment in Lafayette
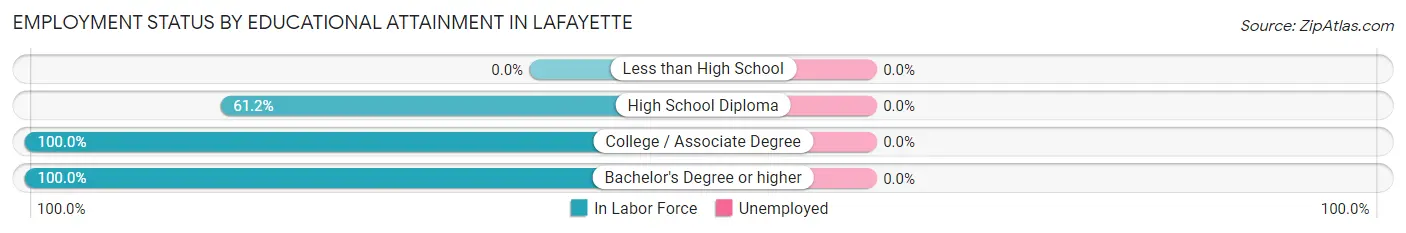
| Educational Attainment | In Labor Force | Unemployed |
| Less than High School | 0 (0.0%) | 0 (0.0%) |
| High School Diploma | 30 (61.2%) | 0 (0.0%) |
| College / Associate Degree | 21 (100.0%) | 0 (0.0%) |
| Bachelor's Degree or higher | 9 (100.0%) | 0 (0.0%) |
| Total | 60 (75.9%) | 0 (0.0%) |
Employment Occupations by Sex in Lafayette
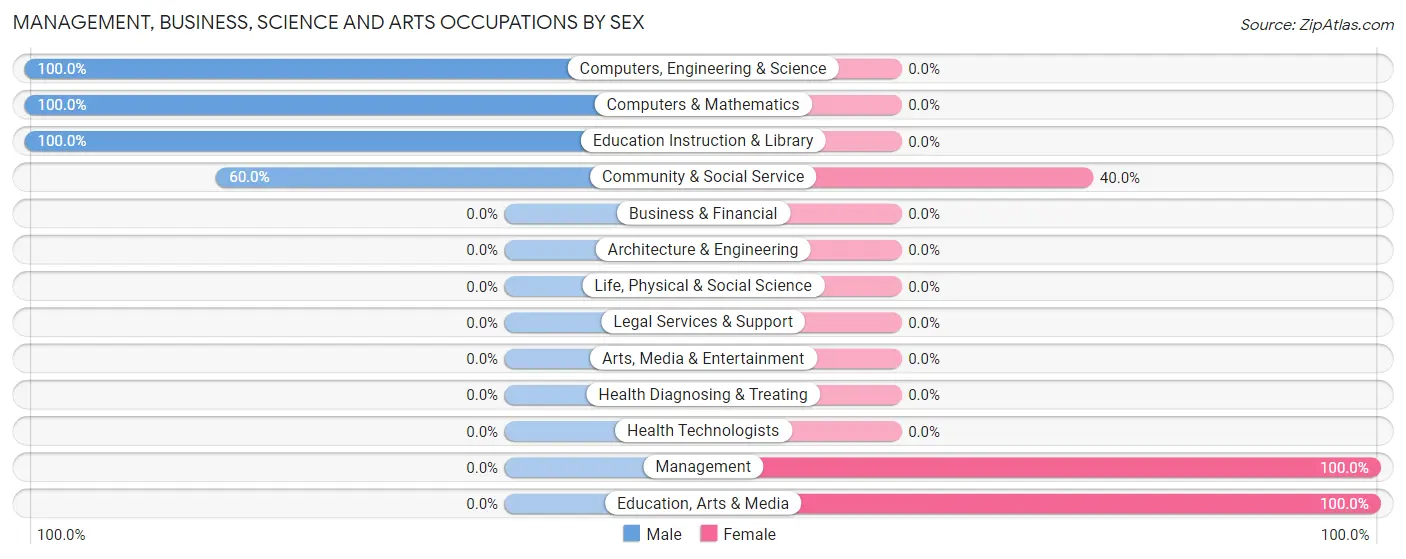
Management, Business, Science and Arts Occupations
The most common Management, Business, Science and Arts occupations in Lafayette are Management (11 | 15.1%), Community & Social Service (10 | 13.7%), Education Instruction & Library (6 | 8.2%), Computers, Engineering & Science (4 | 5.5%), and Computers & Mathematics (4 | 5.5%).
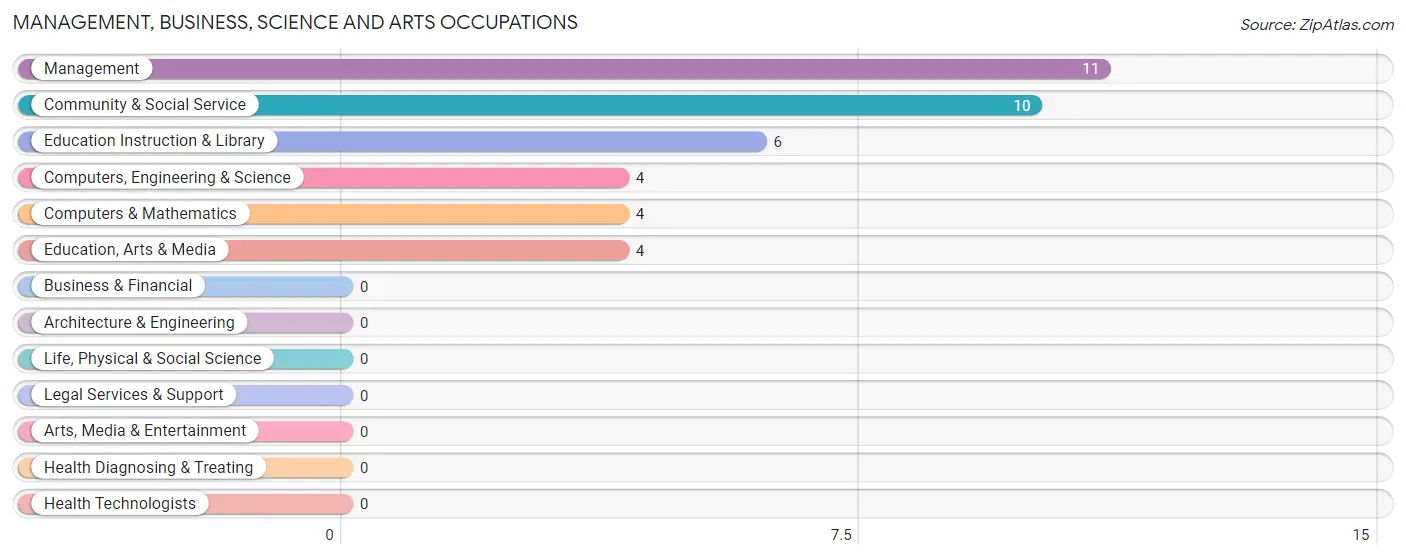
Management, Business, Science and Arts Occupations by Sex
Within the Management, Business, Science and Arts occupations in Lafayette, the most male-oriented occupations are Computers, Engineering & Science (100.0%), Computers & Mathematics (100.0%), and Education Instruction & Library (100.0%), while the most female-oriented occupations are Management (100.0%), Education, Arts & Media (100.0%), and Community & Social Service (40.0%).
| Occupation | Male | Female |
| Management | 0 (0.0%) | 11 (100.0%) |
| Business & Financial | 0 (0.0%) | 0 (0.0%) |
| Computers, Engineering & Science | 4 (100.0%) | 0 (0.0%) |
| Computers & Mathematics | 4 (100.0%) | 0 (0.0%) |
| Architecture & Engineering | 0 (0.0%) | 0 (0.0%) |
| Life, Physical & Social Science | 0 (0.0%) | 0 (0.0%) |
| Community & Social Service | 6 (60.0%) | 4 (40.0%) |
| Education, Arts & Media | 0 (0.0%) | 4 (100.0%) |
| Legal Services & Support | 0 (0.0%) | 0 (0.0%) |
| Education Instruction & Library | 6 (100.0%) | 0 (0.0%) |
| Arts, Media & Entertainment | 0 (0.0%) | 0 (0.0%) |
| Health Diagnosing & Treating | 0 (0.0%) | 0 (0.0%) |
| Health Technologists | 0 (0.0%) | 0 (0.0%) |
| Total (Category) | 10 (40.0%) | 15 (60.0%) |
| Total (Overall) | 45 (61.6%) | 28 (38.4%) |
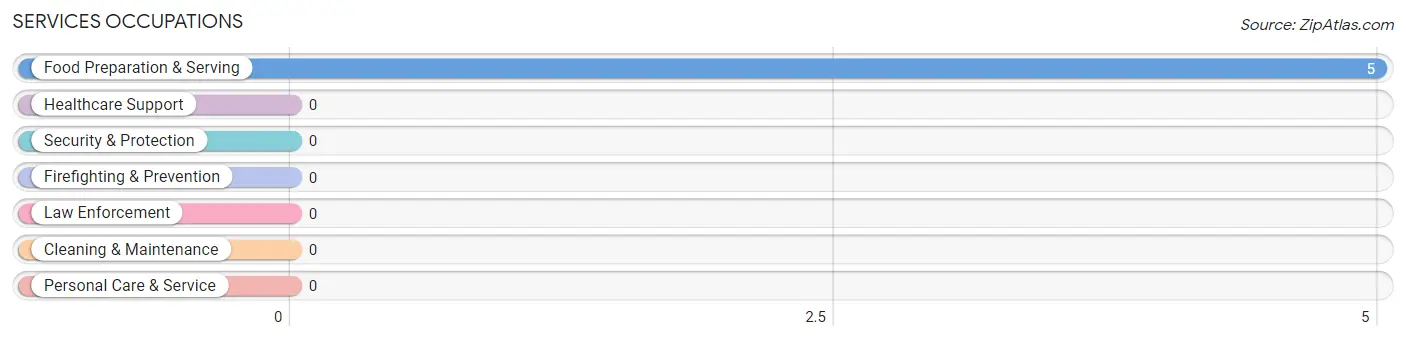
Services Occupations
The most common Services occupations in Lafayette are , and Food Preparation & Serving (5 | 6.9%).
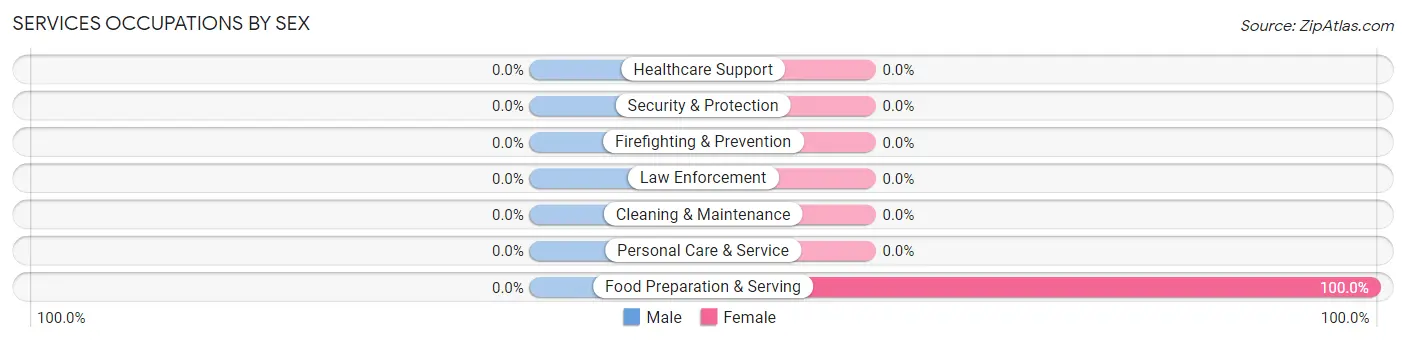
Services Occupations by Sex
| Occupation | Male | Female |
| Healthcare Support | 0 (0.0%) | 0 (0.0%) |
| Security & Protection | 0 (0.0%) | 0 (0.0%) |
| Firefighting & Prevention | 0 (0.0%) | 0 (0.0%) |
| Law Enforcement | 0 (0.0%) | 0 (0.0%) |
| Food Preparation & Serving | 0 (0.0%) | 5 (100.0%) |
| Cleaning & Maintenance | 0 (0.0%) | 0 (0.0%) |
| Personal Care & Service | 0 (0.0%) | 0 (0.0%) |
| Total (Category) | 0 (0.0%) | 5 (100.0%) |
| Total (Overall) | 45 (61.6%) | 28 (38.4%) |
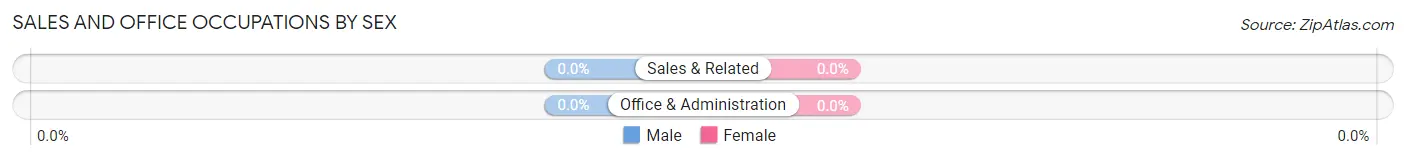
Sales and Office Occupations

Sales and Office Occupations by Sex
| Occupation | Male | Female |
| Sales & Related | 0 (0.0%) | 0 (0.0%) |
| Office & Administration | 0 (0.0%) | 0 (0.0%) |
| Total (Category) | 0 (0.0%) | 0 (0.0%) |
| Total (Overall) | 45 (61.6%) | 28 (38.4%) |
Natural Resources, Construction and Maintenance Occupations
The most common Natural Resources, Construction and Maintenance occupations in Lafayette are , and Construction & Extraction (17 | 23.3%).
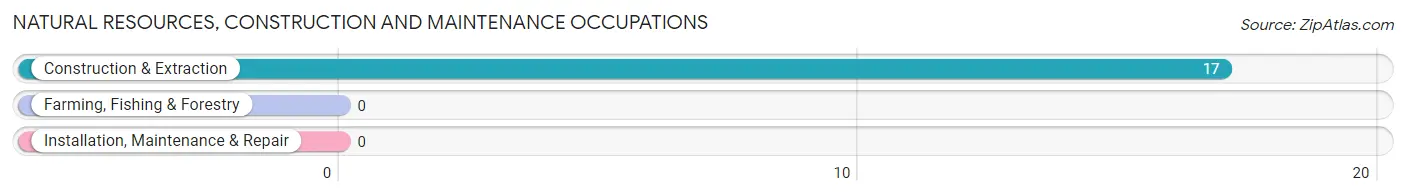
Natural Resources, Construction and Maintenance Occupations by Sex
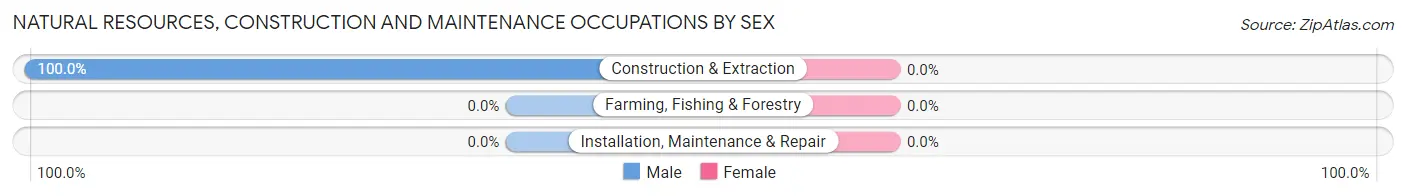
| Occupation | Male | Female |
| Farming, Fishing & Forestry | 0 (0.0%) | 0 (0.0%) |
| Construction & Extraction | 17 (100.0%) | 0 (0.0%) |
| Installation, Maintenance & Repair | 0 (0.0%) | 0 (0.0%) |
| Total (Category) | 17 (100.0%) | 0 (0.0%) |
| Total (Overall) | 45 (61.6%) | 28 (38.4%) |
Production, Transportation and Moving Occupations
The most common Production, Transportation and Moving occupations in Lafayette are Transportation (13 | 17.8%), Material Moving (8 | 11.0%), and Production (5 | 6.9%).
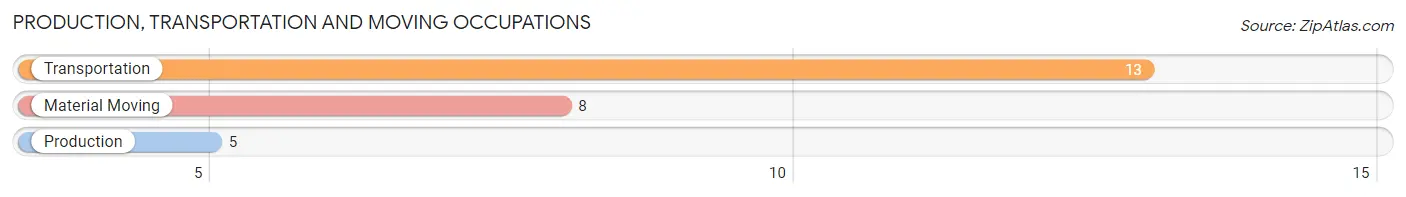
Production, Transportation and Moving Occupations by Sex
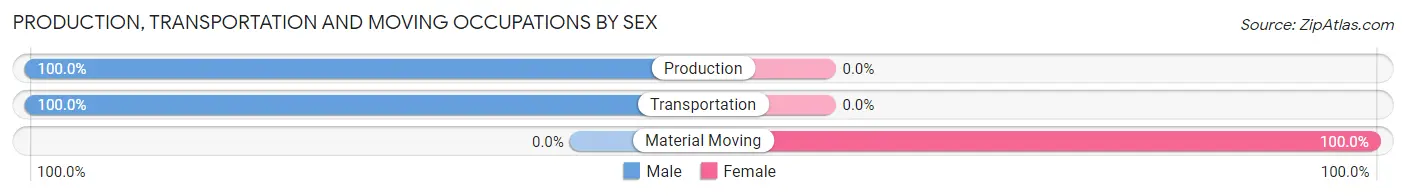
| Occupation | Male | Female |
| Production | 5 (100.0%) | 0 (0.0%) |
| Transportation | 13 (100.0%) | 0 (0.0%) |
| Material Moving | 0 (0.0%) | 8 (100.0%) |
| Total (Category) | 18 (69.2%) | 8 (30.8%) |
| Total (Overall) | 45 (61.6%) | 28 (38.4%) |
Employment Industries by Sex in Lafayette
Employment Industries in Lafayette
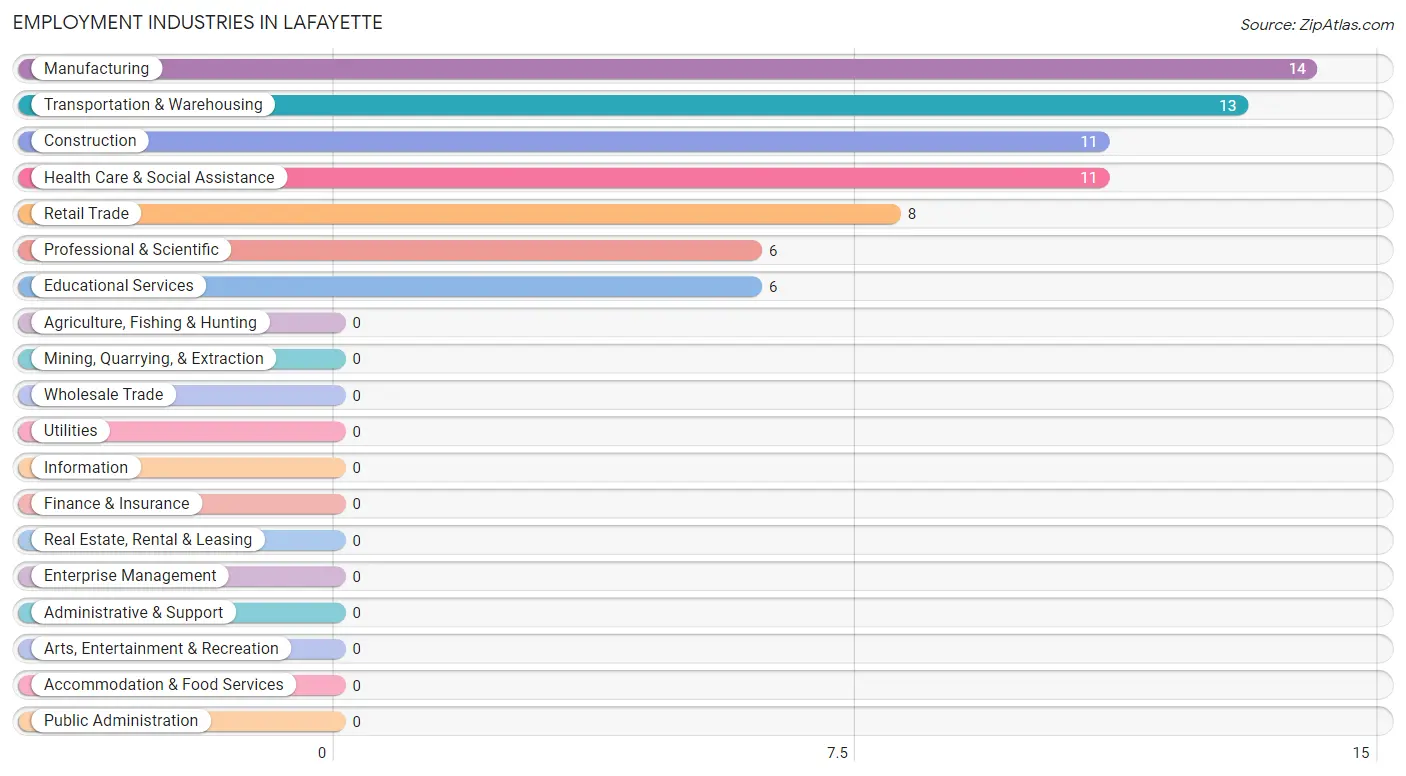
The major employment industries in Lafayette include Manufacturing (14 | 19.2%), Transportation & Warehousing (13 | 17.8%), Construction (11 | 15.1%), Health Care & Social Assistance (11 | 15.1%), and Retail Trade (8 | 11.0%).
Employment Industries by Sex in Lafayette
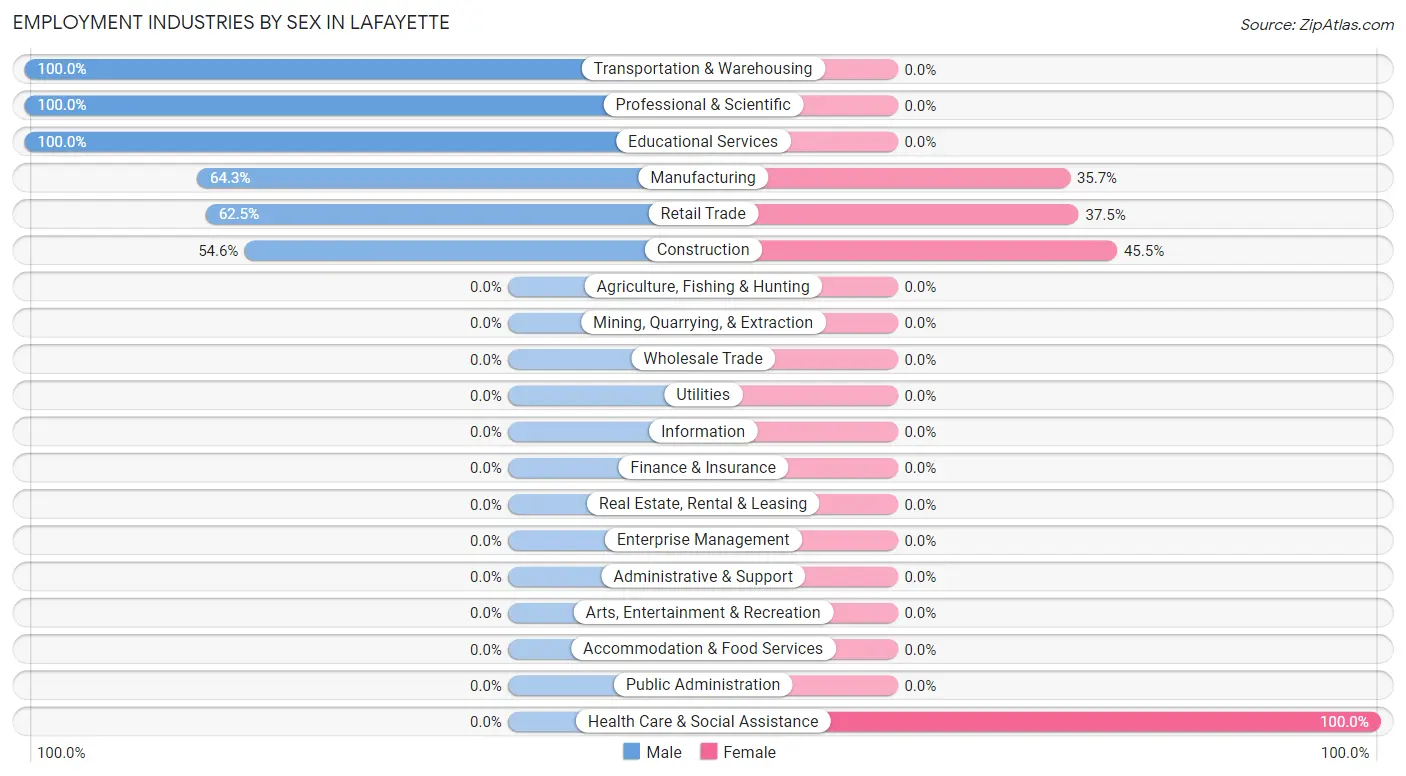
The Lafayette industries that see more men than women are Transportation & Warehousing (100.0%), Professional & Scientific (100.0%), and Educational Services (100.0%), whereas the industries that tend to have a higher number of women are Health Care & Social Assistance (100.0%), Construction (45.5%), and Retail Trade (37.5%).
| Industry | Male | Female |
| Agriculture, Fishing & Hunting | 0 (0.0%) | 0 (0.0%) |
| Mining, Quarrying, & Extraction | 0 (0.0%) | 0 (0.0%) |
| Construction | 6 (54.5%) | 5 (45.5%) |
| Manufacturing | 9 (64.3%) | 5 (35.7%) |
| Wholesale Trade | 0 (0.0%) | 0 (0.0%) |
| Retail Trade | 5 (62.5%) | 3 (37.5%) |
| Transportation & Warehousing | 13 (100.0%) | 0 (0.0%) |
| Utilities | 0 (0.0%) | 0 (0.0%) |
| Information | 0 (0.0%) | 0 (0.0%) |
| Finance & Insurance | 0 (0.0%) | 0 (0.0%) |
| Real Estate, Rental & Leasing | 0 (0.0%) | 0 (0.0%) |
| Professional & Scientific | 6 (100.0%) | 0 (0.0%) |
| Enterprise Management | 0 (0.0%) | 0 (0.0%) |
| Administrative & Support | 0 (0.0%) | 0 (0.0%) |
| Educational Services | 6 (100.0%) | 0 (0.0%) |
| Health Care & Social Assistance | 0 (0.0%) | 11 (100.0%) |
| Arts, Entertainment & Recreation | 0 (0.0%) | 0 (0.0%) |
| Accommodation & Food Services | 0 (0.0%) | 0 (0.0%) |
| Public Administration | 0 (0.0%) | 0 (0.0%) |
| Total | 45 (61.6%) | 28 (38.4%) |
Education in Lafayette
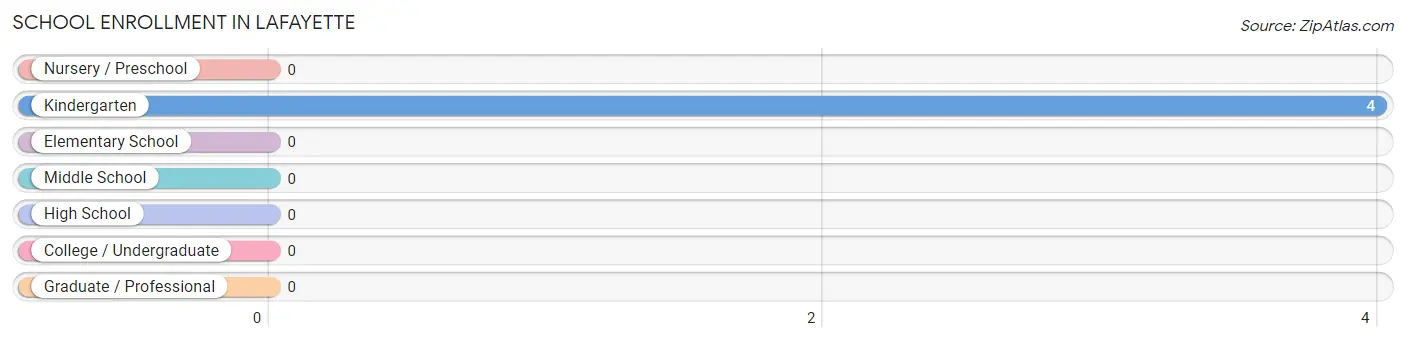
School Enrollment in Lafayette
| School Level | # Students | % Students |
| Nursery / Preschool | 0 | 0.0% |
| Kindergarten | 4 | 100.0% |
| Elementary School | 0 | 0.0% |
| Middle School | 0 | 0.0% |
| High School | 0 | 0.0% |
| College / Undergraduate | 0 | 0.0% |
| Graduate / Professional | 0 | 0.0% |
| Total | 4 | 100.0% |
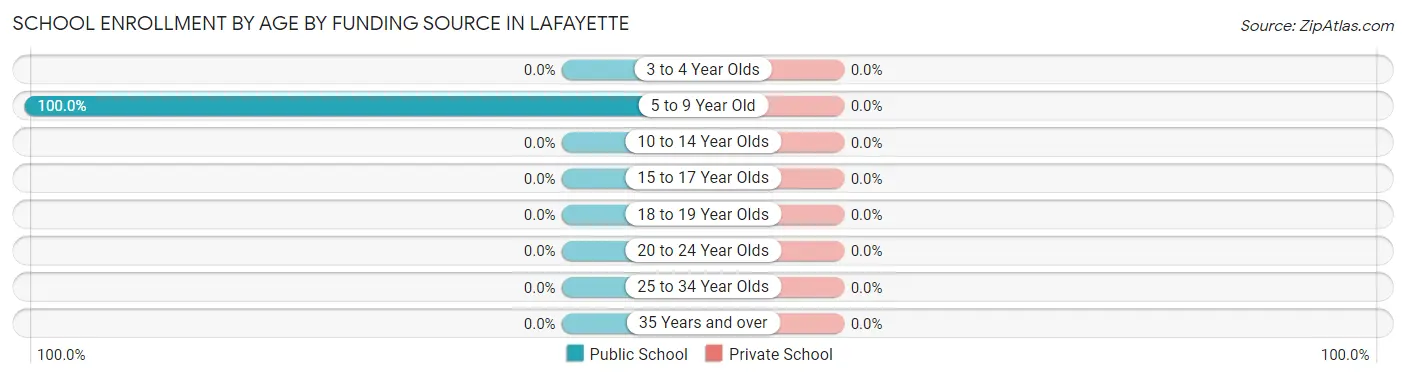
School Enrollment by Age by Funding Source in Lafayette
| Age Bracket | Public School | Private School |
| 3 to 4 Year Olds | 0 (0.0%) | 0 (0.0%) |
| 5 to 9 Year Old | 4 (100.0%) | 0 (0.0%) |
| 10 to 14 Year Olds | 0 (0.0%) | 0 (0.0%) |
| 15 to 17 Year Olds | 0 (0.0%) | 0 (0.0%) |
| 18 to 19 Year Olds | 0 (0.0%) | 0 (0.0%) |
| 20 to 24 Year Olds | 0 (0.0%) | 0 (0.0%) |
| 25 to 34 Year Olds | 0 (0.0%) | 0 (0.0%) |
| 35 Years and over | 0 (0.0%) | 0 (0.0%) |
| Total | 4 (100.0%) | 0 (0.0%) |
Educational Attainment by Field of Study in Lafayette
Arts & humanities (7 | 28.0%), bio, nature & agricultural (6 | 24.0%), computers & mathematics (4 | 16.0%), education (4 | 16.0%), and liberal arts & history (4 | 16.0%) are the most common fields of study among 25 individuals in Lafayette who have obtained a bachelor's degree or higher.
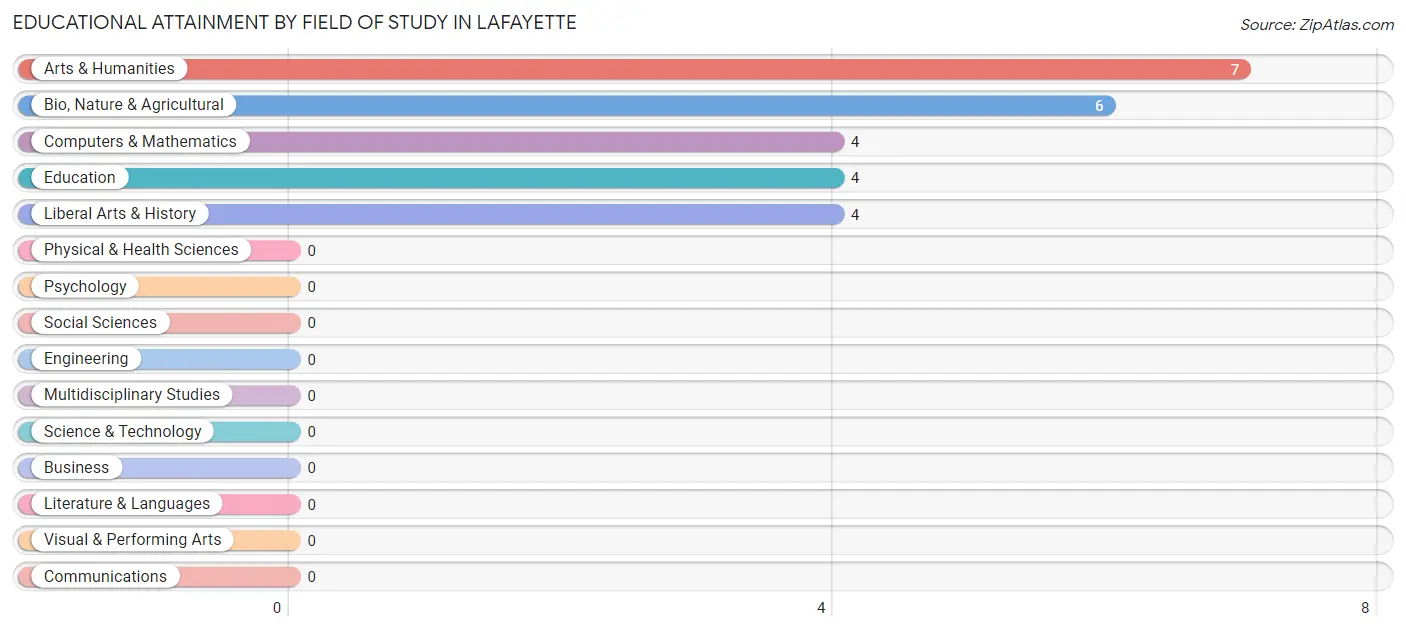
| Field of Study | # Graduates | % Graduates |
| Computers & Mathematics | 4 | 16.0% |
| Bio, Nature & Agricultural | 6 | 24.0% |
| Physical & Health Sciences | 0 | 0.0% |
| Psychology | 0 | 0.0% |
| Social Sciences | 0 | 0.0% |
| Engineering | 0 | 0.0% |
| Multidisciplinary Studies | 0 | 0.0% |
| Science & Technology | 0 | 0.0% |
| Business | 0 | 0.0% |
| Education | 4 | 16.0% |
| Literature & Languages | 0 | 0.0% |
| Liberal Arts & History | 4 | 16.0% |
| Visual & Performing Arts | 0 | 0.0% |
| Communications | 0 | 0.0% |
| Arts & Humanities | 7 | 28.0% |
| Total | 25 | 100.0% |
Transportation & Commute in Lafayette
Vehicle Availability by Sex in Lafayette
The most prevalent vehicle ownership categories in Lafayette are males with 3 vehicles (30, accounting for 66.7%) and females with 3 vehicles (5, making up 107.1%).
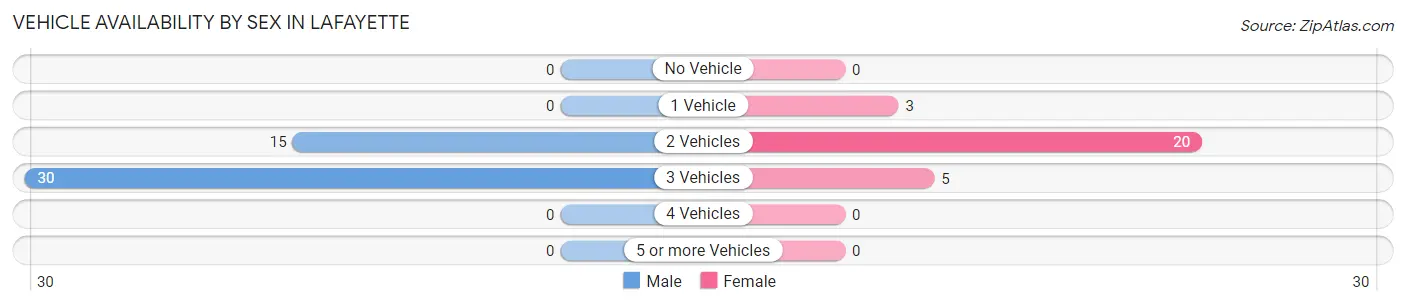
| Vehicles Available | Male | Female |
| No Vehicle | 0 (0.0%) | 0 (0.0%) |
| 1 Vehicle | 0 (0.0%) | 3 (10.7%) |
| 2 Vehicles | 15 (33.3%) | 20 (71.4%) |
| 3 Vehicles | 30 (66.7%) | 5 (17.9%) |
| 4 Vehicles | 0 (0.0%) | 0 (0.0%) |
| 5 or more Vehicles | 0 (0.0%) | 0 (0.0%) |
| Total | 45 (100.0%) | 28 (100.0%) |
Commute Time in Lafayette
The most frequently occuring commute durations in Lafayette are 5 to 9 minutes (15 commuters, 20.5%), 40 to 44 minutes (13 commuters, 17.8%), and 15 to 19 minutes (12 commuters, 16.4%).
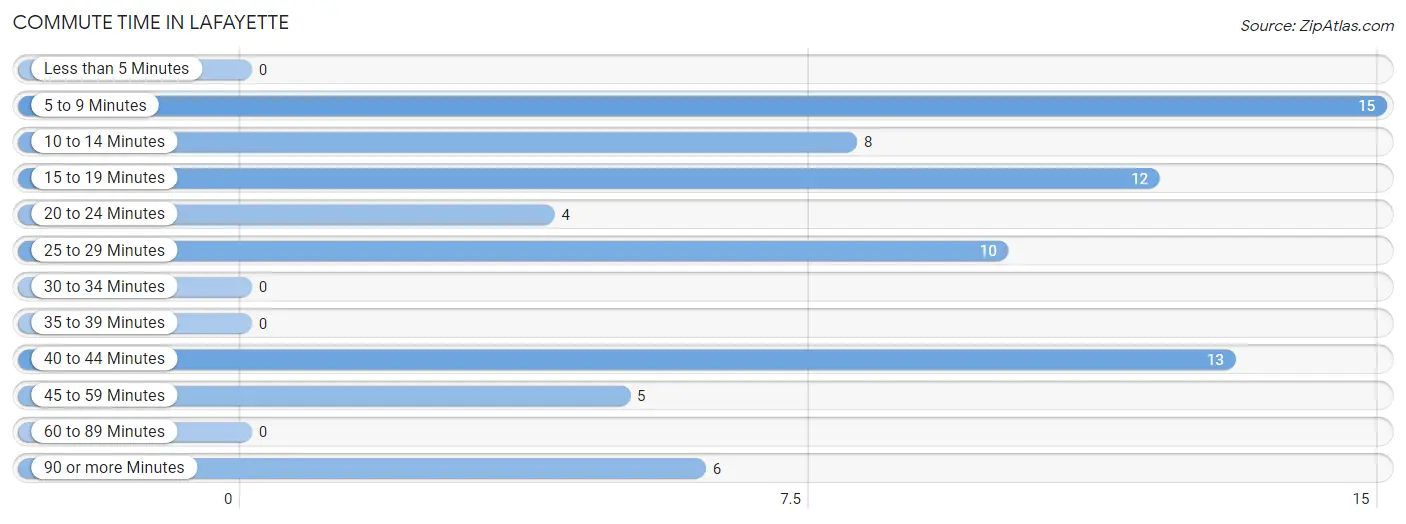
| Commute Time | # Commuters | % Commuters |
| Less than 5 Minutes | 0 | 0.0% |
| 5 to 9 Minutes | 15 | 20.5% |
| 10 to 14 Minutes | 8 | 11.0% |
| 15 to 19 Minutes | 12 | 16.4% |
| 20 to 24 Minutes | 4 | 5.5% |
| 25 to 29 Minutes | 10 | 13.7% |
| 30 to 34 Minutes | 0 | 0.0% |
| 35 to 39 Minutes | 0 | 0.0% |
| 40 to 44 Minutes | 13 | 17.8% |
| 45 to 59 Minutes | 5 | 6.9% |
| 60 to 89 Minutes | 0 | 0.0% |
| 90 or more Minutes | 6 | 8.2% |
Commute Time by Sex in Lafayette
The most common commute times in Lafayette are 40 to 44 minutes (13 commuters, 28.9%) for males and 5 to 9 minutes (9 commuters, 32.1%) for females.
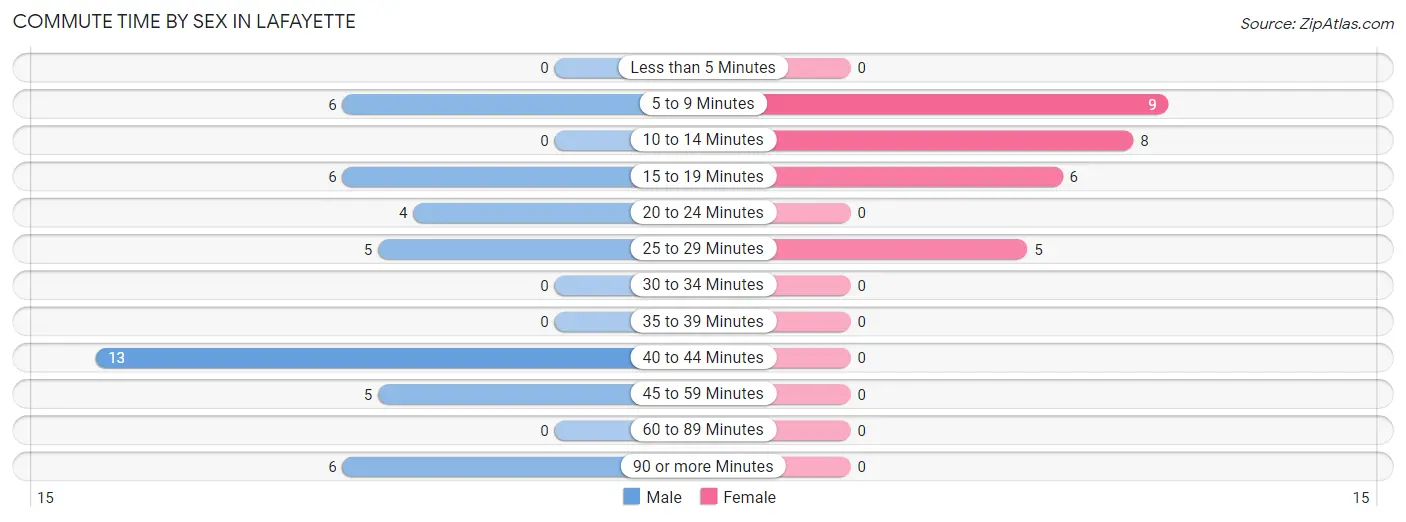
| Commute Time | Male | Female |
| Less than 5 Minutes | 0 (0.0%) | 0 (0.0%) |
| 5 to 9 Minutes | 6 (13.3%) | 9 (32.1%) |
| 10 to 14 Minutes | 0 (0.0%) | 8 (28.6%) |
| 15 to 19 Minutes | 6 (13.3%) | 6 (21.4%) |
| 20 to 24 Minutes | 4 (8.9%) | 0 (0.0%) |
| 25 to 29 Minutes | 5 (11.1%) | 5 (17.9%) |
| 30 to 34 Minutes | 0 (0.0%) | 0 (0.0%) |
| 35 to 39 Minutes | 0 (0.0%) | 0 (0.0%) |
| 40 to 44 Minutes | 13 (28.9%) | 0 (0.0%) |
| 45 to 59 Minutes | 5 (11.1%) | 0 (0.0%) |
| 60 to 89 Minutes | 0 (0.0%) | 0 (0.0%) |
| 90 or more Minutes | 6 (13.3%) | 0 (0.0%) |
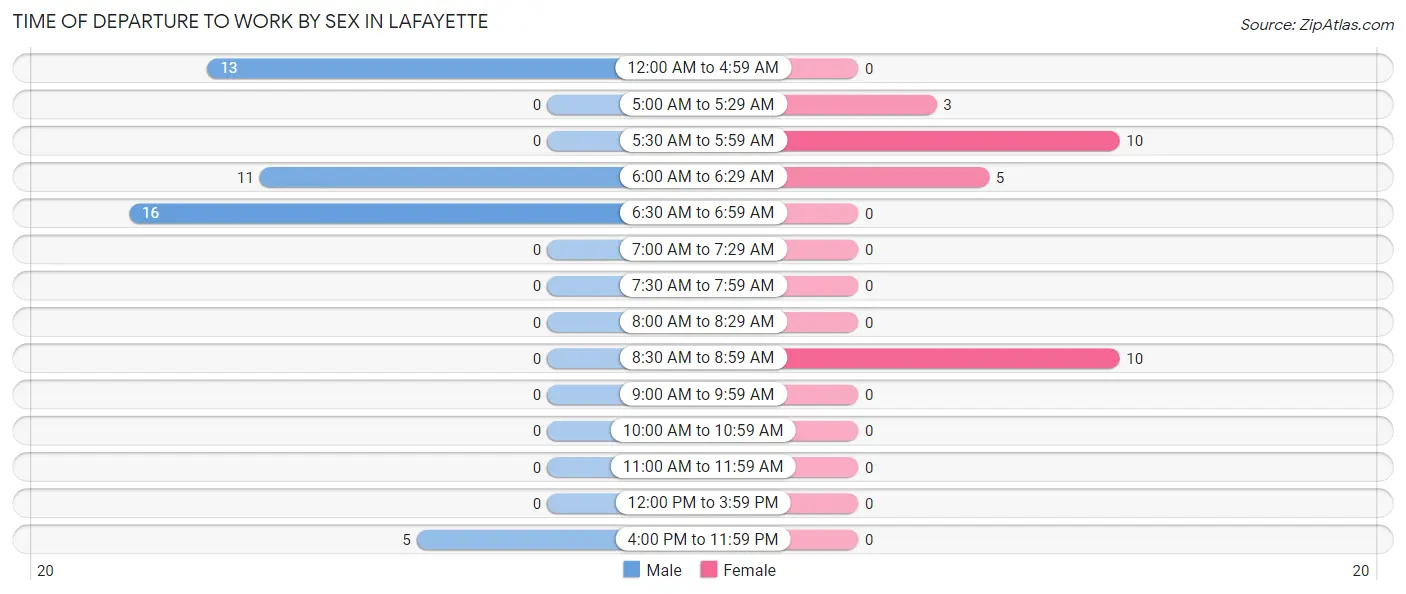
Time of Departure to Work by Sex in Lafayette
The most frequent times of departure to work in Lafayette are 6:30 AM to 6:59 AM (16, 35.6%) for males and 5:30 AM to 5:59 AM (10, 35.7%) for females.
| Time of Departure | Male | Female |
| 12:00 AM to 4:59 AM | 13 (28.9%) | 0 (0.0%) |
| 5:00 AM to 5:29 AM | 0 (0.0%) | 3 (10.7%) |
| 5:30 AM to 5:59 AM | 0 (0.0%) | 10 (35.7%) |
| 6:00 AM to 6:29 AM | 11 (24.4%) | 5 (17.9%) |
| 6:30 AM to 6:59 AM | 16 (35.6%) | 0 (0.0%) |
| 7:00 AM to 7:29 AM | 0 (0.0%) | 0 (0.0%) |
| 7:30 AM to 7:59 AM | 0 (0.0%) | 0 (0.0%) |
| 8:00 AM to 8:29 AM | 0 (0.0%) | 0 (0.0%) |
| 8:30 AM to 8:59 AM | 0 (0.0%) | 10 (35.7%) |
| 9:00 AM to 9:59 AM | 0 (0.0%) | 0 (0.0%) |
| 10:00 AM to 10:59 AM | 0 (0.0%) | 0 (0.0%) |
| 11:00 AM to 11:59 AM | 0 (0.0%) | 0 (0.0%) |
| 12:00 PM to 3:59 PM | 0 (0.0%) | 0 (0.0%) |
| 4:00 PM to 11:59 PM | 5 (11.1%) | 0 (0.0%) |
| Total | 45 (100.0%) | 28 (100.0%) |
Housing Occupancy in Lafayette
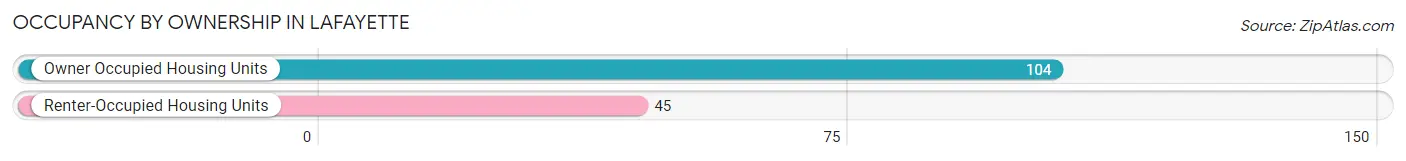
Occupancy by Ownership in Lafayette
Of the total 149 dwellings in Lafayette, owner-occupied units account for 104 (69.8%), while renter-occupied units make up 45 (30.2%).
| Occupancy | # Housing Units | % Housing Units |
| Owner Occupied Housing Units | 104 | 69.8% |
| Renter-Occupied Housing Units | 45 | 30.2% |
| Total Occupied Housing Units | 149 | 100.0% |
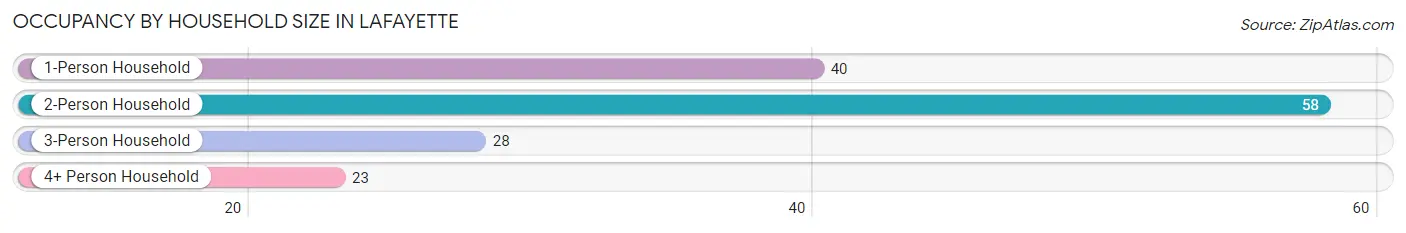
Occupancy by Household Size in Lafayette
| Household Size | # Housing Units | % Housing Units |
| 1-Person Household | 40 | 26.9% |
| 2-Person Household | 58 | 38.9% |
| 3-Person Household | 28 | 18.8% |
| 4+ Person Household | 23 | 15.4% |
| Total Housing Units | 149 | 100.0% |
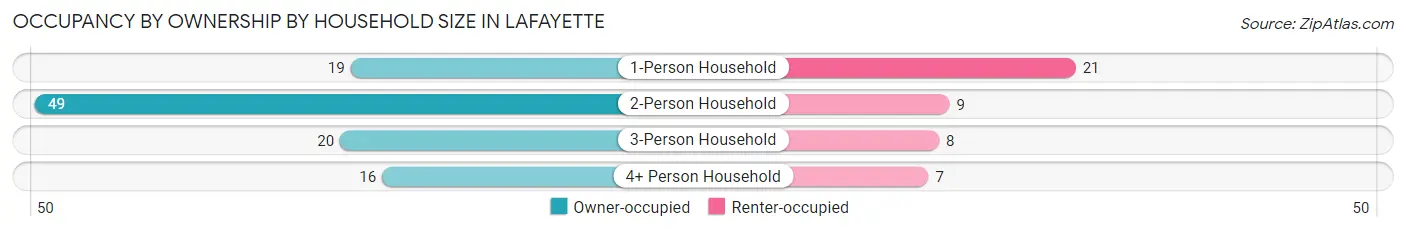
Occupancy by Ownership by Household Size in Lafayette
| Household Size | Owner-occupied | Renter-occupied |
| 1-Person Household | 19 (47.5%) | 21 (52.5%) |
| 2-Person Household | 49 (84.5%) | 9 (15.5%) |
| 3-Person Household | 20 (71.4%) | 8 (28.6%) |
| 4+ Person Household | 16 (69.6%) | 7 (30.4%) |
| Total Housing Units | 104 (69.8%) | 45 (30.2%) |
Occupancy by Educational Attainment in Lafayette
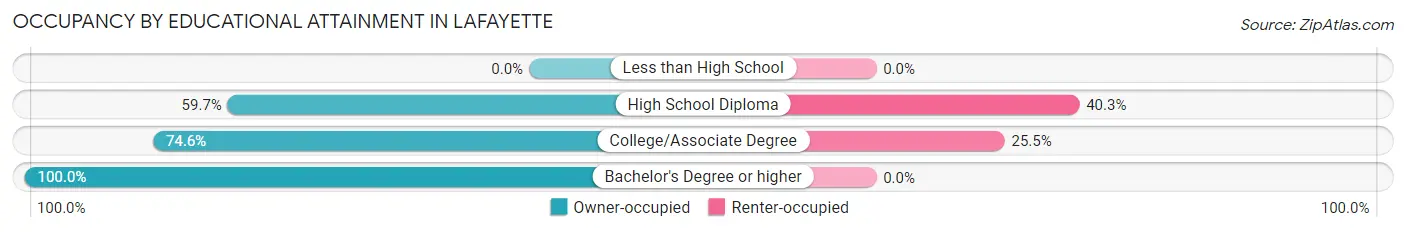
| Household Size | Owner-occupied | Renter-occupied |
| Less than High School | 0 (0.0%) | 0 (0.0%) |
| High School Diploma | 46 (59.7%) | 31 (40.3%) |
| College/Associate Degree | 41 (74.6%) | 14 (25.5%) |
| Bachelor's Degree or higher | 17 (100.0%) | 0 (0.0%) |
Occupancy by Age of Householder in Lafayette
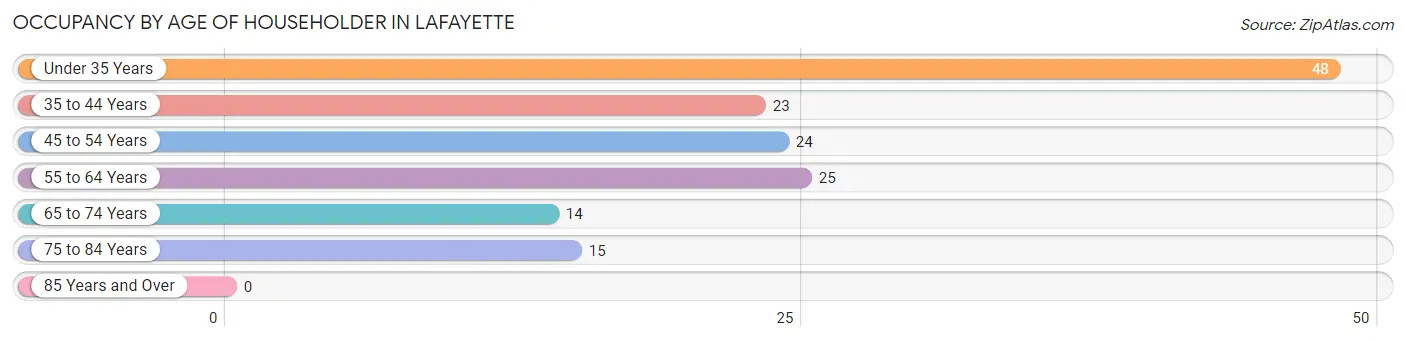
| Age Bracket | # Households | % Households |
| Under 35 Years | 48 | 32.2% |
| 35 to 44 Years | 23 | 15.4% |
| 45 to 54 Years | 24 | 16.1% |
| 55 to 64 Years | 25 | 16.8% |
| 65 to 74 Years | 14 | 9.4% |
| 75 to 84 Years | 15 | 10.1% |
| 85 Years and Over | 0 | 0.0% |
| Total | 149 | 100.0% |
Housing Finances in Lafayette
Median Income by Occupancy in Lafayette
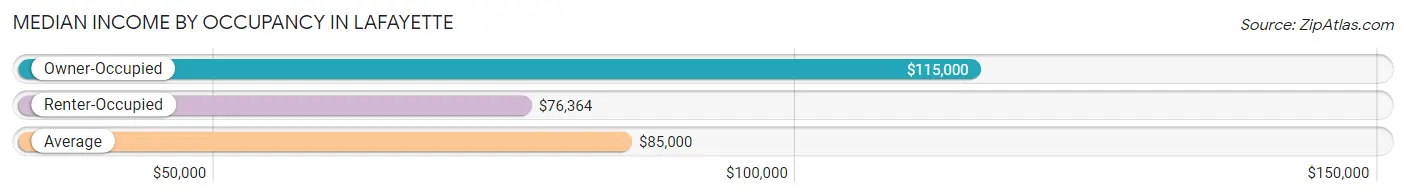
| Occupancy Type | # Households | Median Income |
| Owner-Occupied | 36 (66.7%) | $115,000 |
| Renter-Occupied | 18 (33.3%) | $76,364 |
| Average | 54 (100.0%) | $85,000 |
Occupancy by Householder Income Bracket in Lafayette
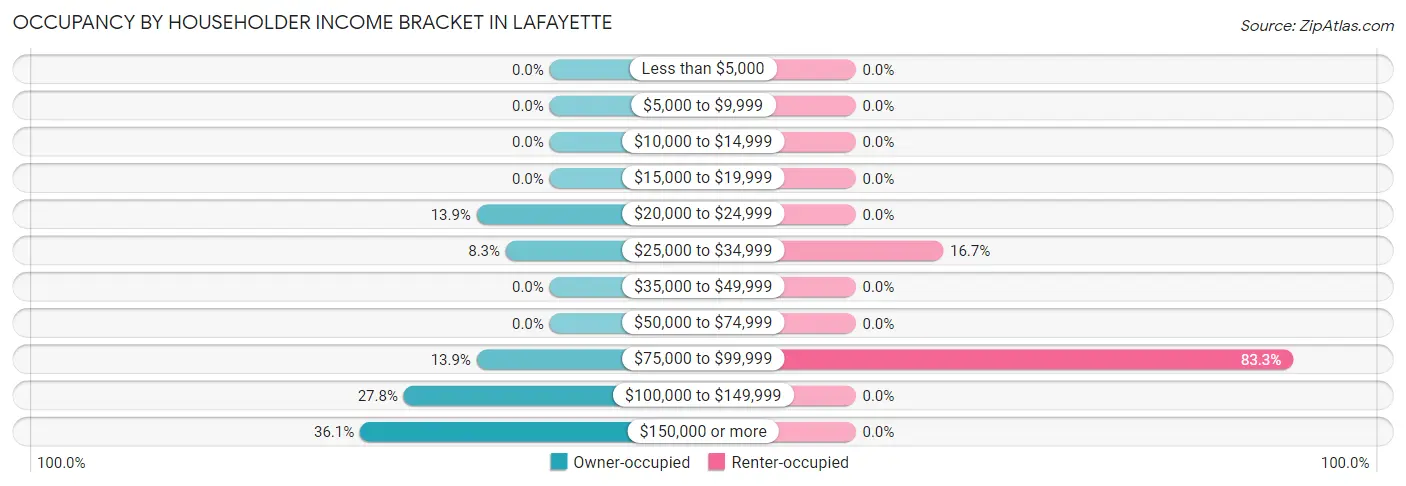
| Income Bracket | Owner-occupied | Renter-occupied |
| Less than $5,000 | 0 (0.0%) | 0 (0.0%) |
| $5,000 to $9,999 | 0 (0.0%) | 0 (0.0%) |
| $10,000 to $14,999 | 0 (0.0%) | 0 (0.0%) |
| $15,000 to $19,999 | 0 (0.0%) | 0 (0.0%) |
| $20,000 to $24,999 | 5 (13.9%) | 0 (0.0%) |
| $25,000 to $34,999 | 3 (8.3%) | 3 (16.7%) |
| $35,000 to $49,999 | 0 (0.0%) | 0 (0.0%) |
| $50,000 to $74,999 | 0 (0.0%) | 0 (0.0%) |
| $75,000 to $99,999 | 5 (13.9%) | 15 (83.3%) |
| $100,000 to $149,999 | 10 (27.8%) | 0 (0.0%) |
| $150,000 or more | 13 (36.1%) | 0 (0.0%) |
| Total | 36 (100.0%) | 18 (100.0%) |
Monthly Housing Cost Tiers in Lafayette
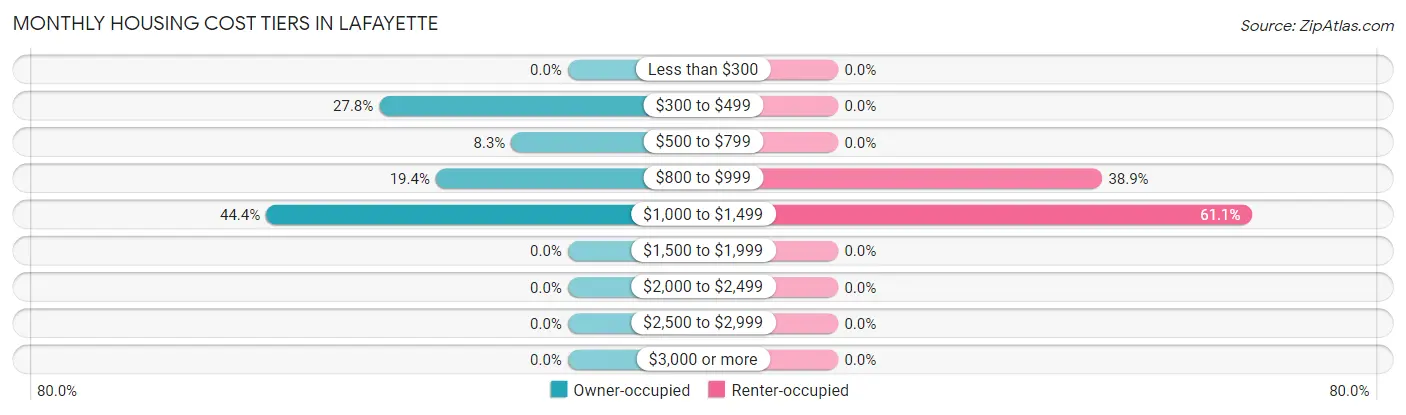
| Monthly Cost | Owner-occupied | Renter-occupied |
| Less than $300 | 0 (0.0%) | 0 (0.0%) |
| $300 to $499 | 10 (27.8%) | 0 (0.0%) |
| $500 to $799 | 3 (8.3%) | 0 (0.0%) |
| $800 to $999 | 7 (19.4%) | 7 (38.9%) |
| $1,000 to $1,499 | 16 (44.4%) | 11 (61.1%) |
| $1,500 to $1,999 | 0 (0.0%) | 0 (0.0%) |
| $2,000 to $2,499 | 0 (0.0%) | 0 (0.0%) |
| $2,500 to $2,999 | 0 (0.0%) | 0 (0.0%) |
| $3,000 or more | 0 (0.0%) | 0 (0.0%) |
| Total | 36 (100.0%) | 18 (100.0%) |
Physical Housing Characteristics in Lafayette
Housing Structures in Lafayette
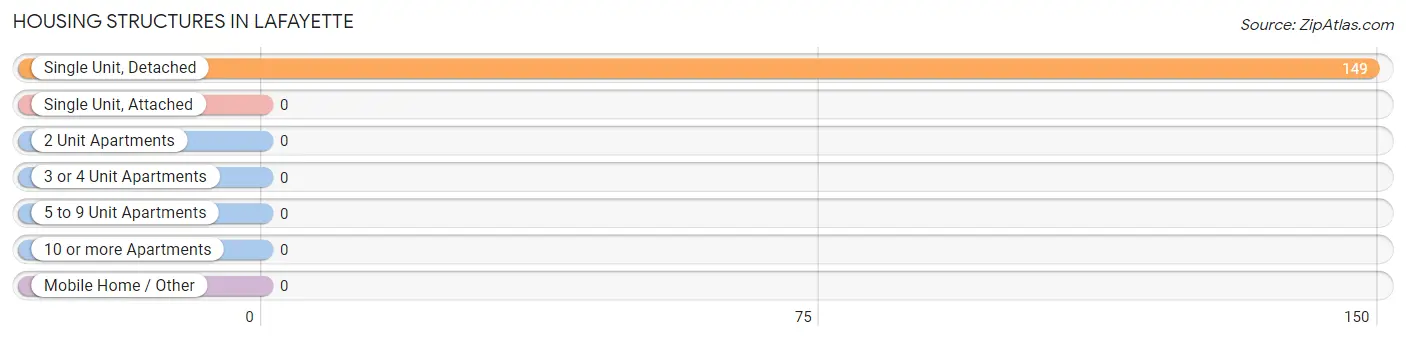
| Structure Type | # Housing Units | % Housing Units |
| Single Unit, Detached | 149 | 100.0% |
| Single Unit, Attached | 0 | 0.0% |
| 2 Unit Apartments | 0 | 0.0% |
| 3 or 4 Unit Apartments | 0 | 0.0% |
| 5 to 9 Unit Apartments | 0 | 0.0% |
| 10 or more Apartments | 0 | 0.0% |
| Mobile Home / Other | 0 | 0.0% |
| Total | 149 | 100.0% |
Housing Structures by Occupancy in Lafayette
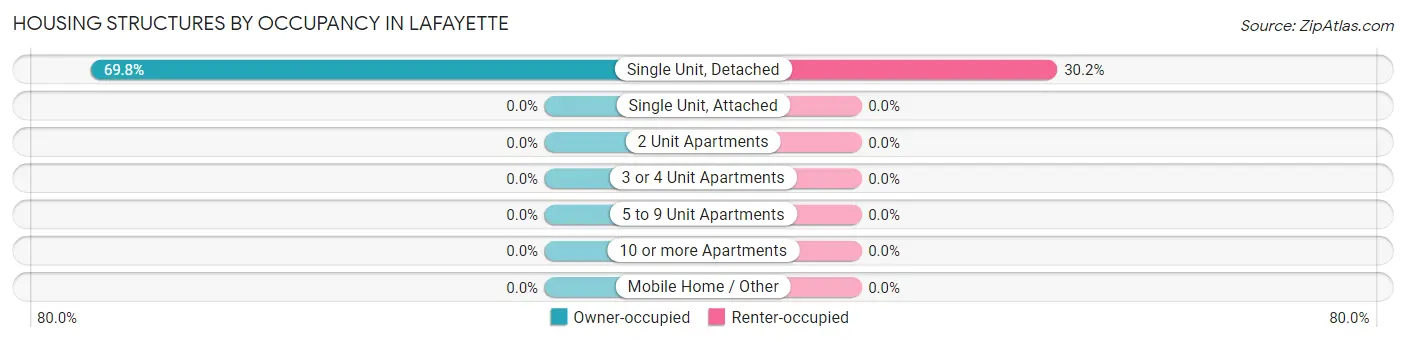
| Structure Type | Owner-occupied | Renter-occupied |
| Single Unit, Detached | 104 (69.8%) | 45 (30.2%) |
| Single Unit, Attached | 0 (0.0%) | 0 (0.0%) |
| 2 Unit Apartments | 0 (0.0%) | 0 (0.0%) |
| 3 or 4 Unit Apartments | 0 (0.0%) | 0 (0.0%) |
| 5 to 9 Unit Apartments | 0 (0.0%) | 0 (0.0%) |
| 10 or more Apartments | 0 (0.0%) | 0 (0.0%) |
| Mobile Home / Other | 0 (0.0%) | 0 (0.0%) |
| Total | 104 (69.8%) | 45 (30.2%) |
Housing Structures by Number of Rooms in Lafayette
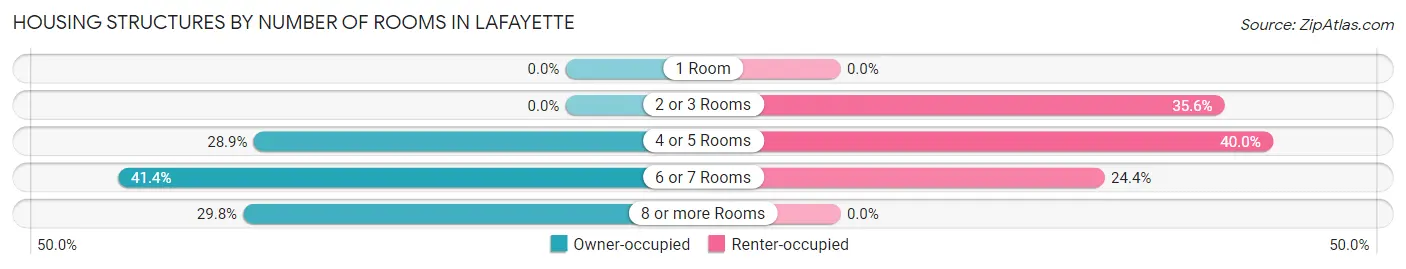
| Number of Rooms | Owner-occupied | Renter-occupied |
| 1 Room | 0 (0.0%) | 0 (0.0%) |
| 2 or 3 Rooms | 0 (0.0%) | 16 (35.6%) |
| 4 or 5 Rooms | 30 (28.8%) | 18 (40.0%) |
| 6 or 7 Rooms | 43 (41.3%) | 11 (24.4%) |
| 8 or more Rooms | 31 (29.8%) | 0 (0.0%) |
| Total | 104 (100.0%) | 45 (100.0%) |
Housing Structure by Heating Type in Lafayette
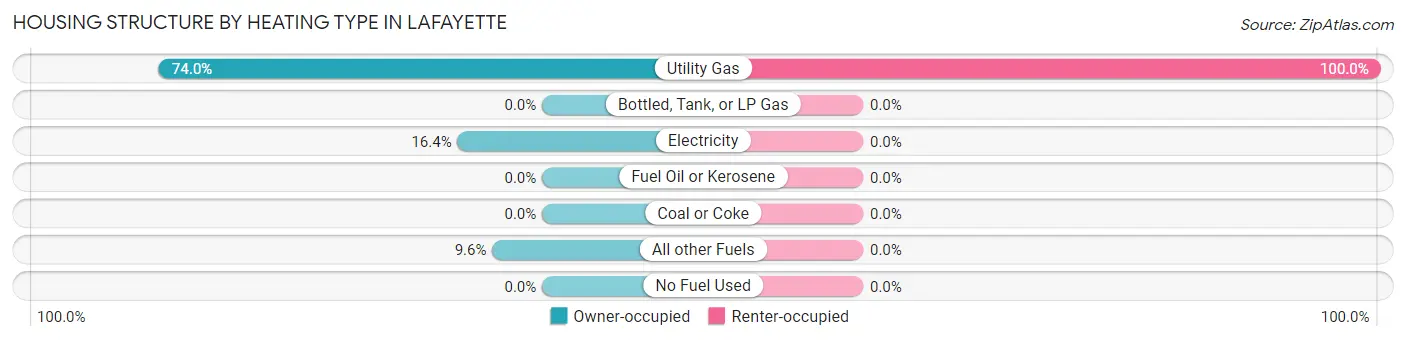
| Heating Type | Owner-occupied | Renter-occupied |
| Utility Gas | 77 (74.0%) | 45 (100.0%) |
| Bottled, Tank, or LP Gas | 0 (0.0%) | 0 (0.0%) |
| Electricity | 17 (16.4%) | 0 (0.0%) |
| Fuel Oil or Kerosene | 0 (0.0%) | 0 (0.0%) |
| Coal or Coke | 0 (0.0%) | 0 (0.0%) |
| All other Fuels | 10 (9.6%) | 0 (0.0%) |
| No Fuel Used | 0 (0.0%) | 0 (0.0%) |
| Total | 104 (100.0%) | 45 (100.0%) |
Household Vehicle Usage in Lafayette
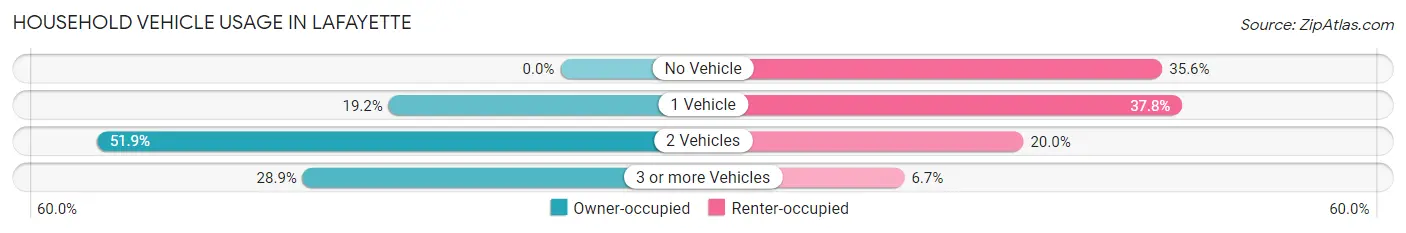
| Vehicles per Household | Owner-occupied | Renter-occupied |
| No Vehicle | 0 (0.0%) | 16 (35.6%) |
| 1 Vehicle | 20 (19.2%) | 17 (37.8%) |
| 2 Vehicles | 54 (51.9%) | 9 (20.0%) |
| 3 or more Vehicles | 30 (28.8%) | 3 (6.7%) |
| Total | 104 (100.0%) | 45 (100.0%) |
Real Estate & Mortgages in Lafayette
Real Estate and Mortgage Overview in Lafayette
| Characteristic | Without Mortgage | With Mortgage |
| Housing Units | 23 | 21 |
| Median Property Value | $127,500 | $176,100 |
| Median Household Income | $42,250 | $11 |
| Monthly Housing Costs | $510 | $0 |
| Real Estate Taxes | $1,859 | $0 |
Property Value by Mortgage Status in Lafayette
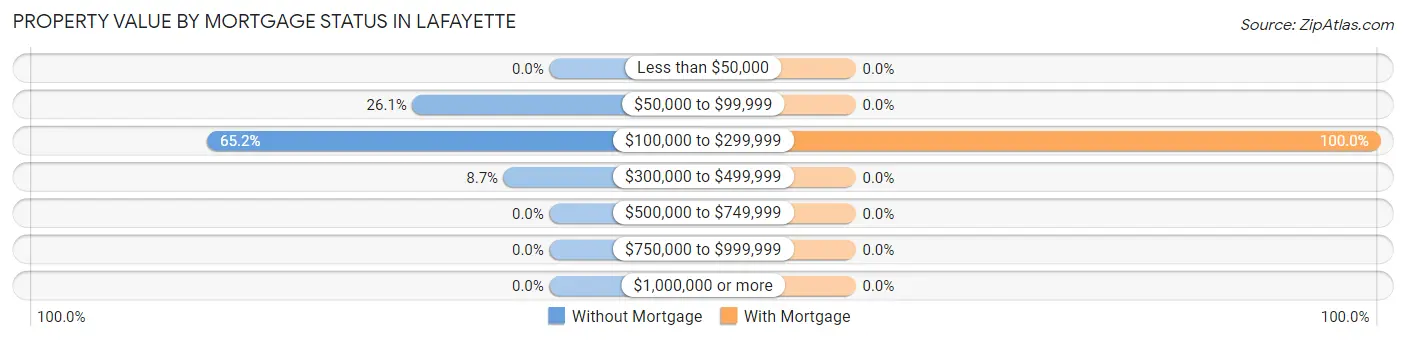
| Property Value | Without Mortgage | With Mortgage |
| Less than $50,000 | 0 (0.0%) | 0 (0.0%) |
| $50,000 to $99,999 | 6 (26.1%) | 0 (0.0%) |
| $100,000 to $299,999 | 15 (65.2%) | 21 (100.0%) |
| $300,000 to $499,999 | 2 (8.7%) | 0 (0.0%) |
| $500,000 to $749,999 | 0 (0.0%) | 0 (0.0%) |
| $750,000 to $999,999 | 0 (0.0%) | 0 (0.0%) |
| $1,000,000 or more | 0 (0.0%) | 0 (0.0%) |
| Total | 23 (100.0%) | 21 (100.0%) |
Household Income by Mortgage Status in Lafayette
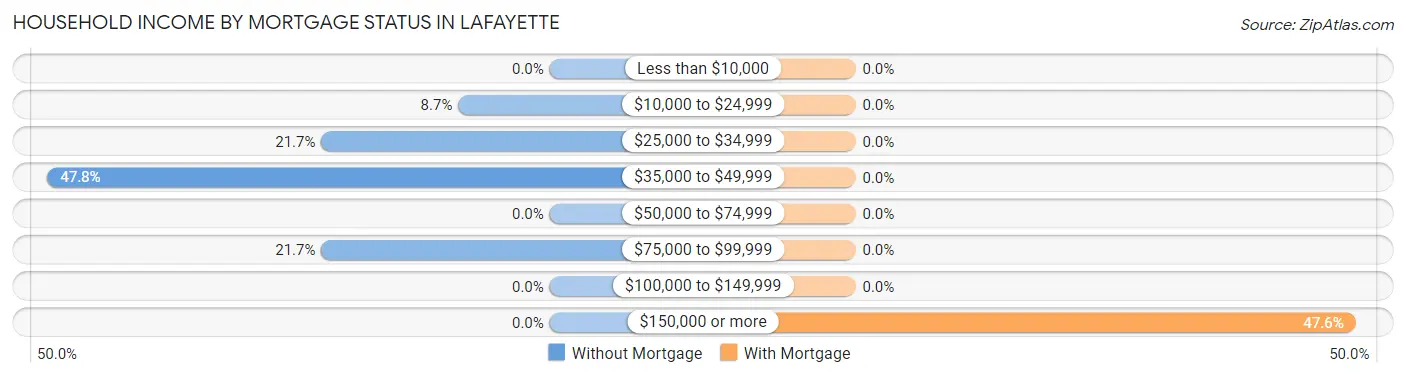
| Household Income | Without Mortgage | With Mortgage |
| Less than $10,000 | 0 (0.0%) | 0 (0.0%) |
| $10,000 to $24,999 | 2 (8.7%) | 0 (0.0%) |
| $25,000 to $34,999 | 5 (21.7%) | 0 (0.0%) |
| $35,000 to $49,999 | 11 (47.8%) | 0 (0.0%) |
| $50,000 to $74,999 | 0 (0.0%) | 0 (0.0%) |
| $75,000 to $99,999 | 5 (21.7%) | 0 (0.0%) |
| $100,000 to $149,999 | 0 (0.0%) | 0 (0.0%) |
| $150,000 or more | 0 (0.0%) | 10 (47.6%) |
| Total | 23 (100.0%) | 21 (100.0%) |
Property Value to Household Income Ratio in Lafayette
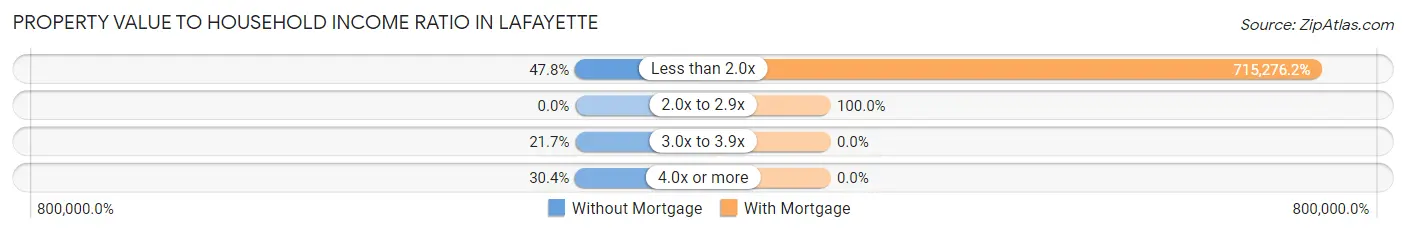
| Value-to-Income Ratio | Without Mortgage | With Mortgage |
| Less than 2.0x | 11 (47.8%) | 150,208 (715,276.2%) |
| 2.0x to 2.9x | 0 (0.0%) | 21 (100.0%) |
| 3.0x to 3.9x | 5 (21.7%) | 0 (0.0%) |
| 4.0x or more | 7 (30.4%) | 0 (0.0%) |
| Total | 23 (100.0%) | 21 (100.0%) |
Real Estate Taxes by Mortgage Status in Lafayette
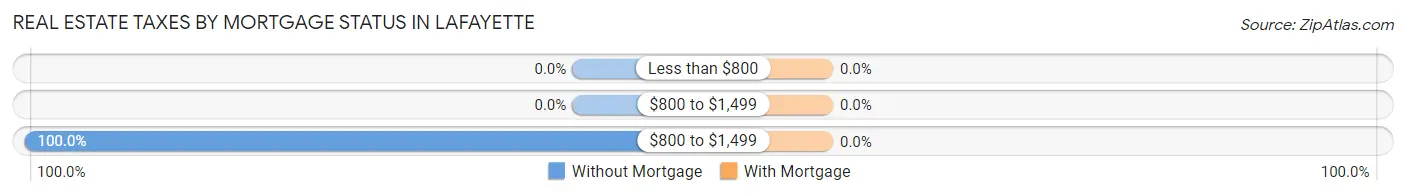
| Property Taxes | Without Mortgage | With Mortgage |
| Less than $800 | 0 (0.0%) | 0 (0.0%) |
| $800 to $1,499 | 0 (0.0%) | 0 (0.0%) |
| $800 to $1,499 | 23 (100.0%) | 0 (0.0%) |
| Total | 23 (100.0%) | 21 (100.0%) |
Health & Disability in Lafayette
Health Insurance Coverage by Age in Lafayette
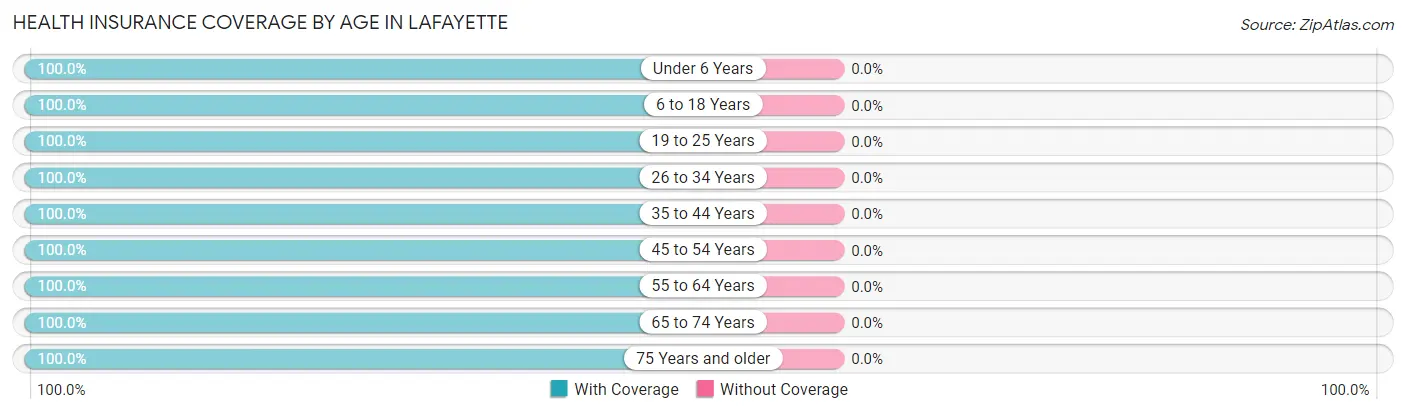
| Age Bracket | With Coverage | Without Coverage |
| Under 6 Years | 4 (100.0%) | 0 (0.0%) |
| 6 to 18 Years | 4 (100.0%) | 0 (0.0%) |
| 19 to 25 Years | 9 (100.0%) | 0 (0.0%) |
| 26 to 34 Years | 9 (100.0%) | 0 (0.0%) |
| 35 to 44 Years | 10 (100.0%) | 0 (0.0%) |
| 45 to 54 Years | 57 (100.0%) | 0 (0.0%) |
| 55 to 64 Years | 3 (100.0%) | 0 (0.0%) |
| 65 to 74 Years | 24 (100.0%) | 0 (0.0%) |
| 75 Years and older | 13 (100.0%) | 0 (0.0%) |
| Total | 133 (100.0%) | 0 (0.0%) |
Health Insurance Coverage by Citizenship Status in Lafayette
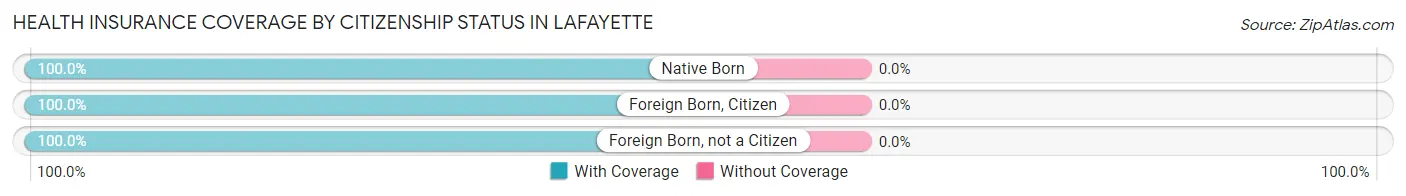
| Citizenship Status | With Coverage | Without Coverage |
| Native Born | 4 (100.0%) | 0 (0.0%) |
| Foreign Born, Citizen | 4 (100.0%) | 0 (0.0%) |
| Foreign Born, not a Citizen | 9 (100.0%) | 0 (0.0%) |
Health Insurance Coverage by Household Income in Lafayette
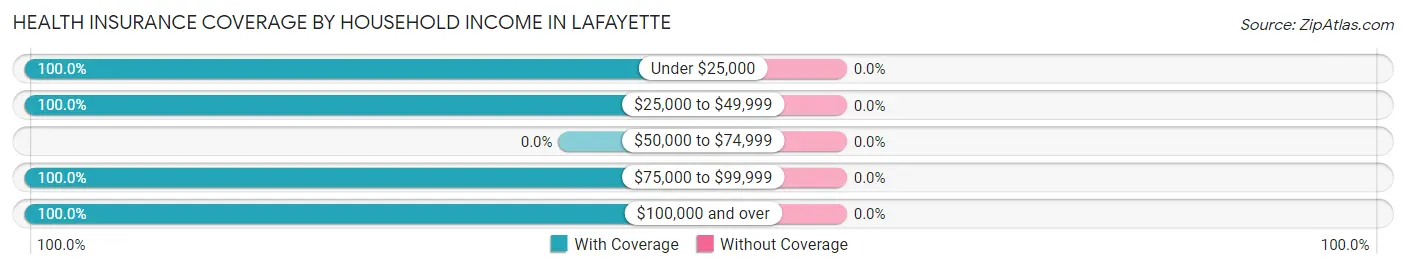
| Household Income | With Coverage | Without Coverage |
| Under $25,000 | 5 (100.0%) | 0 (0.0%) |
| $25,000 to $49,999 | 10 (100.0%) | 0 (0.0%) |
| $50,000 to $74,999 | 0 (0.0%) | 0 (0.0%) |
| $75,000 to $99,999 | 61 (100.0%) | 0 (0.0%) |
| $100,000 and over | 57 (100.0%) | 0 (0.0%) |
Public vs Private Health Insurance Coverage by Age in Lafayette
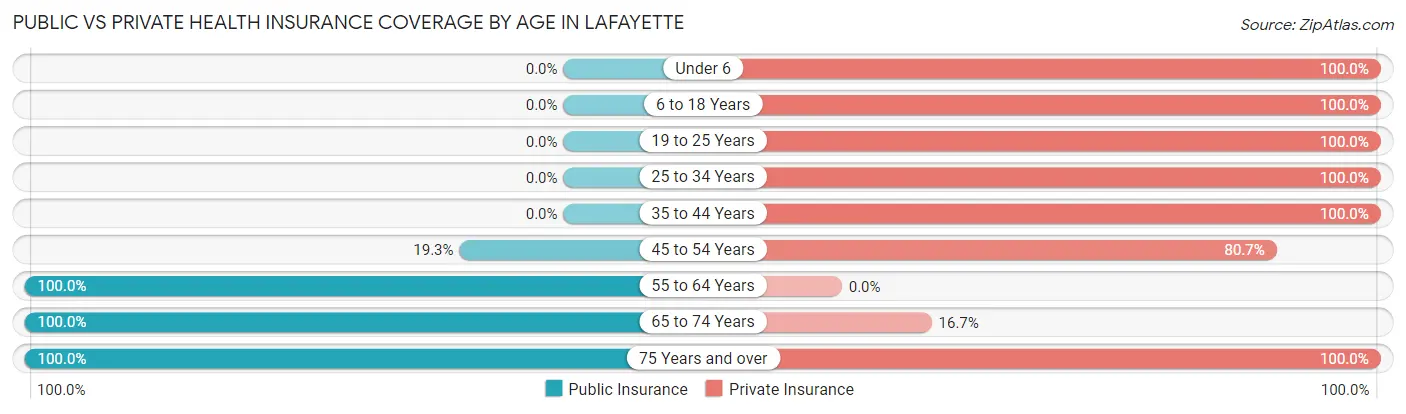
| Age Bracket | Public Insurance | Private Insurance |
| Under 6 | 0 (0.0%) | 4 (100.0%) |
| 6 to 18 Years | 0 (0.0%) | 4 (100.0%) |
| 19 to 25 Years | 0 (0.0%) | 9 (100.0%) |
| 25 to 34 Years | 0 (0.0%) | 9 (100.0%) |
| 35 to 44 Years | 0 (0.0%) | 10 (100.0%) |
| 45 to 54 Years | 11 (19.3%) | 46 (80.7%) |
| 55 to 64 Years | 3 (100.0%) | 0 (0.0%) |
| 65 to 74 Years | 24 (100.0%) | 4 (16.7%) |
| 75 Years and over | 13 (100.0%) | 13 (100.0%) |
| Total | 51 (38.4%) | 99 (74.4%) |
Disability Status by Sex by Age in Lafayette
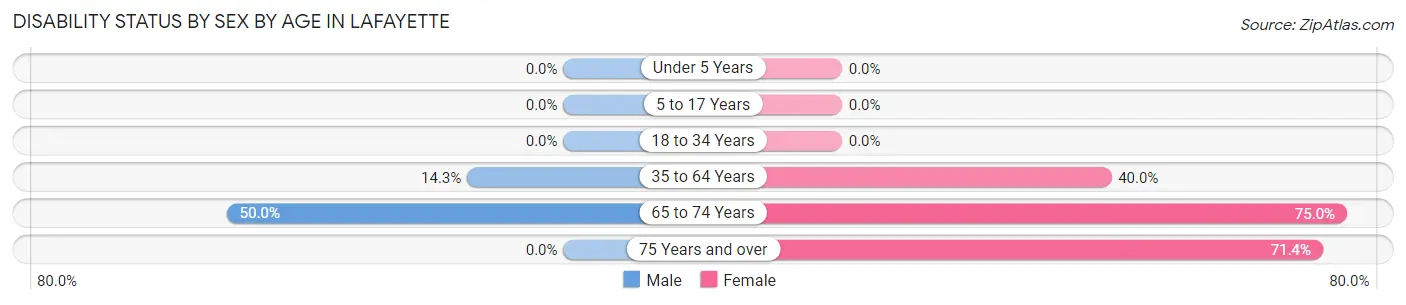
| Age Bracket | Male | Female |
| Under 5 Years | 0 (0.0%) | 0 (0.0%) |
| 5 to 17 Years | 0 (0.0%) | 0 (0.0%) |
| 18 to 34 Years | 0 (0.0%) | 0 (0.0%) |
| 35 to 64 Years | 5 (14.3%) | 14 (40.0%) |
| 65 to 74 Years | 4 (50.0%) | 12 (75.0%) |
| 75 Years and over | 0 (0.0%) | 5 (71.4%) |
Disability Class by Sex by Age in Lafayette
Disability Class: Hearing Difficulty
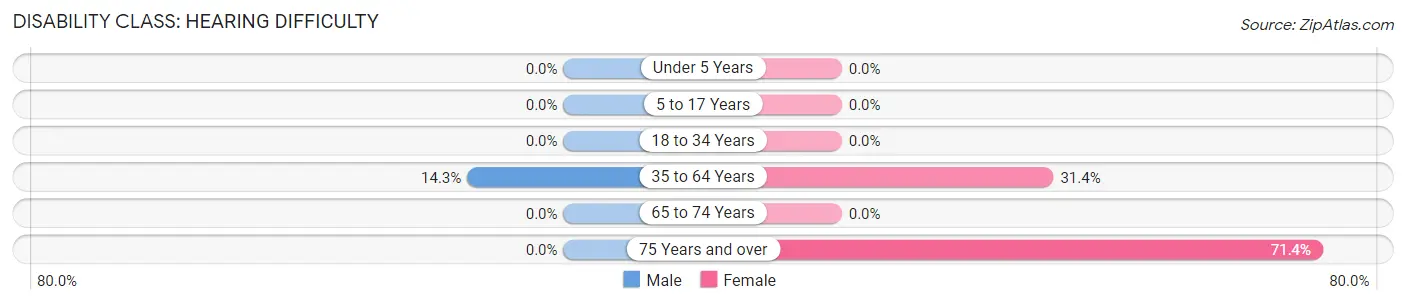
| Age Bracket | Male | Female |
| Under 5 Years | 0 (0.0%) | 0 (0.0%) |
| 5 to 17 Years | 0 (0.0%) | 0 (0.0%) |
| 18 to 34 Years | 0 (0.0%) | 0 (0.0%) |
| 35 to 64 Years | 5 (14.3%) | 11 (31.4%) |
| 65 to 74 Years | 0 (0.0%) | 0 (0.0%) |
| 75 Years and over | 0 (0.0%) | 5 (71.4%) |
Disability Class: Vision Difficulty
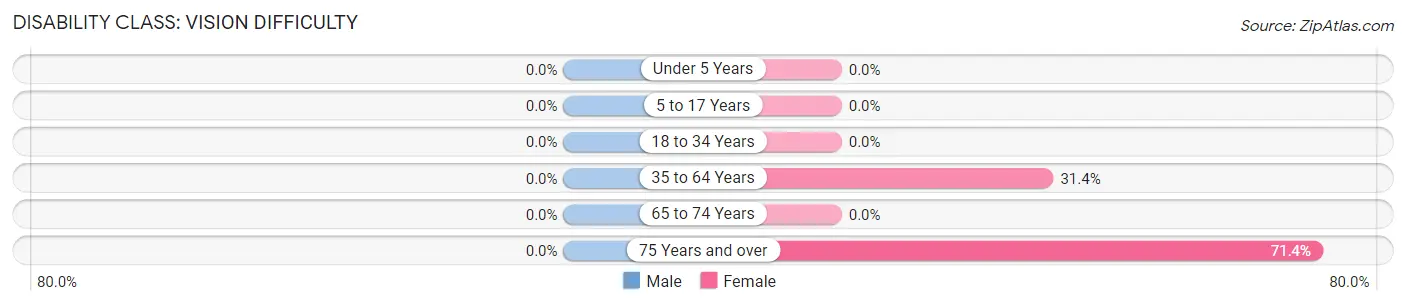
| Age Bracket | Male | Female |
| Under 5 Years | 0 (0.0%) | 0 (0.0%) |
| 5 to 17 Years | 0 (0.0%) | 0 (0.0%) |
| 18 to 34 Years | 0 (0.0%) | 0 (0.0%) |
| 35 to 64 Years | 0 (0.0%) | 11 (31.4%) |
| 65 to 74 Years | 0 (0.0%) | 0 (0.0%) |
| 75 Years and over | 0 (0.0%) | 5 (71.4%) |
Disability Class: Cognitive Difficulty
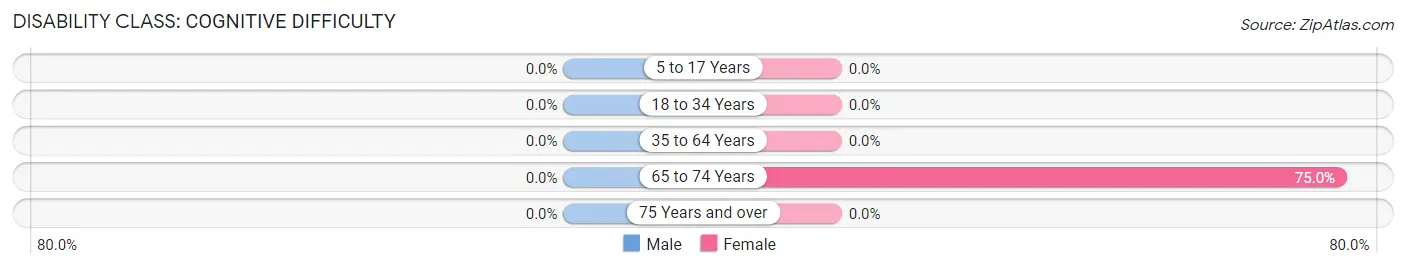
| Age Bracket | Male | Female |
| 5 to 17 Years | 0 (0.0%) | 0 (0.0%) |
| 18 to 34 Years | 0 (0.0%) | 0 (0.0%) |
| 35 to 64 Years | 0 (0.0%) | 0 (0.0%) |
| 65 to 74 Years | 0 (0.0%) | 12 (75.0%) |
| 75 Years and over | 0 (0.0%) | 0 (0.0%) |
Disability Class: Ambulatory Difficulty
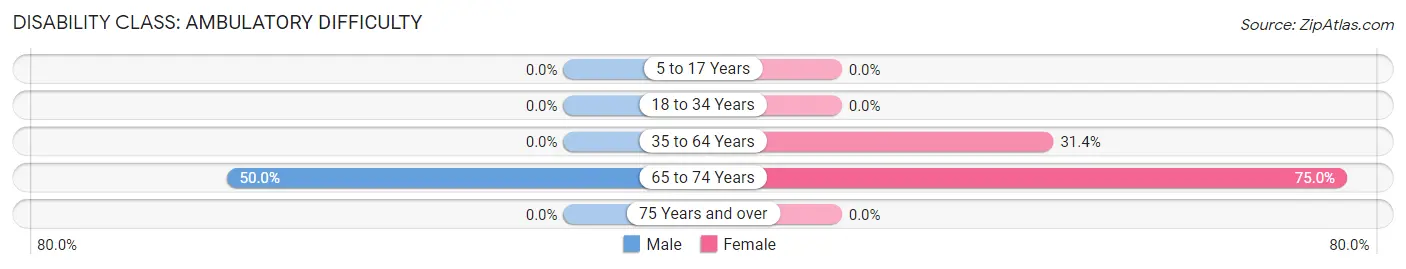
| Age Bracket | Male | Female |
| 5 to 17 Years | 0 (0.0%) | 0 (0.0%) |
| 18 to 34 Years | 0 (0.0%) | 0 (0.0%) |
| 35 to 64 Years | 0 (0.0%) | 11 (31.4%) |
| 65 to 74 Years | 4 (50.0%) | 12 (75.0%) |
| 75 Years and over | 0 (0.0%) | 0 (0.0%) |
Disability Class: Self-Care Difficulty
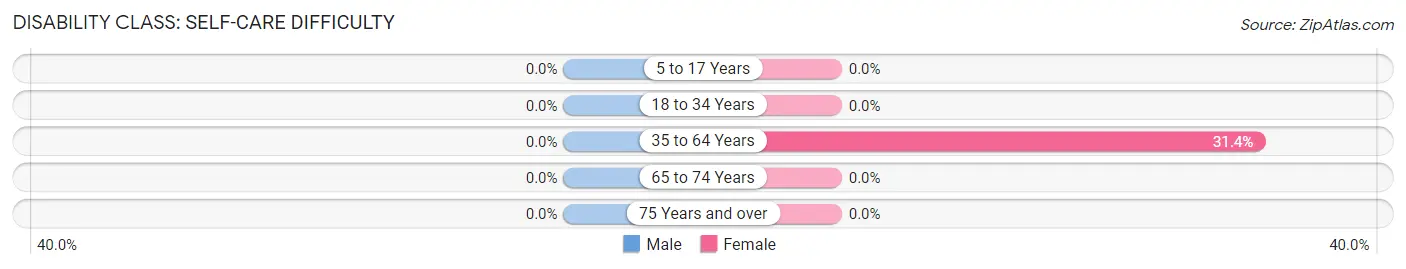
| Age Bracket | Male | Female |
| 5 to 17 Years | 0 (0.0%) | 0 (0.0%) |
| 18 to 34 Years | 0 (0.0%) | 0 (0.0%) |
| 35 to 64 Years | 0 (0.0%) | 11 (31.4%) |
| 65 to 74 Years | 0 (0.0%) | 0 (0.0%) |
| 75 Years and over | 0 (0.0%) | 0 (0.0%) |
Technology Access in Lafayette
Computing Device Access in Lafayette
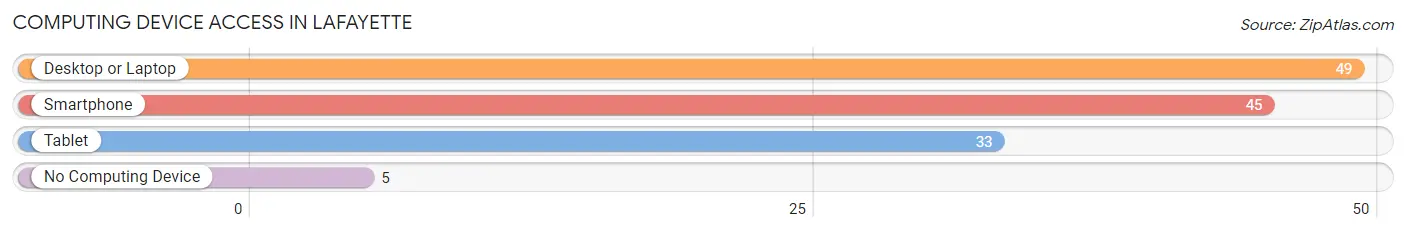
| Device Type | # Households | % Households |
| Desktop or Laptop | 49 | 90.7% |
| Smartphone | 45 | 83.3% |
| Tablet | 33 | 61.1% |
| No Computing Device | 5 | 9.3% |
| Total | 54 | 100.0% |
Internet Access in Lafayette
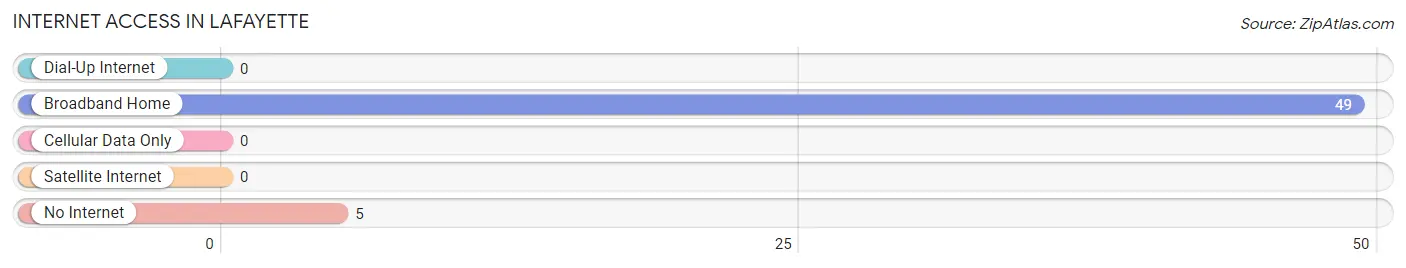
| Internet Type | # Households | % Households |
| Dial-Up Internet | 0 | 0.0% |
| Broadband Home | 49 | 90.7% |
| Cellular Data Only | 0 | 0.0% |
| Satellite Internet | 0 | 0.0% |
| No Internet | 5 | 9.3% |
| Total | 54 | 100.0% |
Lafayette Summary
Lafayette is a small village located in the southeastern corner of Ohio, in the county of Coshocton. It is situated on the banks of the Tuscarawas River, and is surrounded by rolling hills and lush farmland. The village has a population of approximately 1,000 people, and is home to a variety of businesses, including a grocery store, a hardware store, a bank, and a few restaurants.
History
Lafayette was founded in 1817 by a group of settlers from Pennsylvania. The village was named after the Marquis de Lafayette, a French military officer who fought alongside the American colonists during the Revolutionary War. The village was originally a farming community, and the settlers grew a variety of crops, including corn, wheat, and oats.
In the late 19th century, the village began to grow and develop. The railroad arrived in 1881, and the village was connected to the larger cities of Coshocton and Zanesville. This allowed the village to become a trading center for the surrounding area. The village also became a popular tourist destination, as it was located near the scenic Tuscarawas River.
Geography
Lafayette is located in the southeastern corner of Ohio, in the county of Coshocton. The village is situated on the banks of the Tuscarawas River, and is surrounded by rolling hills and lush farmland. The village is located approximately 30 miles from the larger cities of Coshocton and Zanesville.
The climate in Lafayette is generally mild, with hot summers and cold winters. The average temperature in the summer is around 75 degrees Fahrenheit, and the average temperature in the winter is around 30 degrees Fahrenheit. The village receives an average of 40 inches of precipitation per year.
Economy
The economy of Lafayette is largely based on agriculture. The village is surrounded by fertile farmland, and the local farmers grow a variety of crops, including corn, wheat, and oats. The village also has a few small businesses, including a grocery store, a hardware store, a bank, and a few restaurants.
Demographics
As of the 2010 census, the population of Lafayette was 1,000 people. The village is predominantly white, with approximately 95% of the population identifying as Caucasian. The median household income in the village is $37,000, and the median age is 40 years old.
Conclusion
Lafayette is a small village located in the southeastern corner of Ohio, in the county of Coshocton. The village has a population of approximately 1,000 people, and is home to a variety of businesses, including a grocery store, a hardware store, a bank, and a few restaurants. The economy of Lafayette is largely based on agriculture, and the village is surrounded by fertile farmland. The village is predominantly white, with approximately 95% of the population identifying as Caucasian. The median household income in the village is $37,000, and the median age is 40 years old.
Common Questions
What is Per Capita Income in Lafayette?
Per Capita income in Lafayette is $42,877.
What is the Median Family Income in Lafayette?
Median Family Income in Lafayette is $122,750.
What is the Median Household income in Lafayette?
Median Household Income in Lafayette is $85,000.
What is Income or Wage Gap in Lafayette?
Income or Wage Gap in Lafayette is 50.5%.
Women in Lafayette earn 49.5 cents for every dollar earned by a man.
What is Inequality or Gini Index in Lafayette?
Inequality or Gini Index in Lafayette is 0.28.
What is the Total Population of Lafayette?
Total Population of Lafayette is 133.
What is the Total Male Population of Lafayette?
Total Male Population of Lafayette is 63.
What is the Total Female Population of Lafayette?
Total Female Population of Lafayette is 70.
What is the Ratio of Males per 100 Females in Lafayette?
There are 90.00 Males per 100 Females in Lafayette.
What is the Ratio of Females per 100 Males in Lafayette?
There are 111.11 Females per 100 Males in Lafayette.
What is the Median Population Age in Lafayette?
Median Population Age in Lafayette is 51.7 Years.
What is the Average Family Size in Lafayette
Average Family Size in Lafayette is 2.5 People.
What is the Average Household Size in Lafayette
Average Household Size in Lafayette is 2.5 People.
How Large is the Labor Force in Lafayette?
There are 73 People in the Labor Forcein in Lafayette.
What is the Percentage of People in the Labor Force in Lafayette?
58.4% of People are in the Labor Force in Lafayette.