Blue Jay, OH Map & Demographics
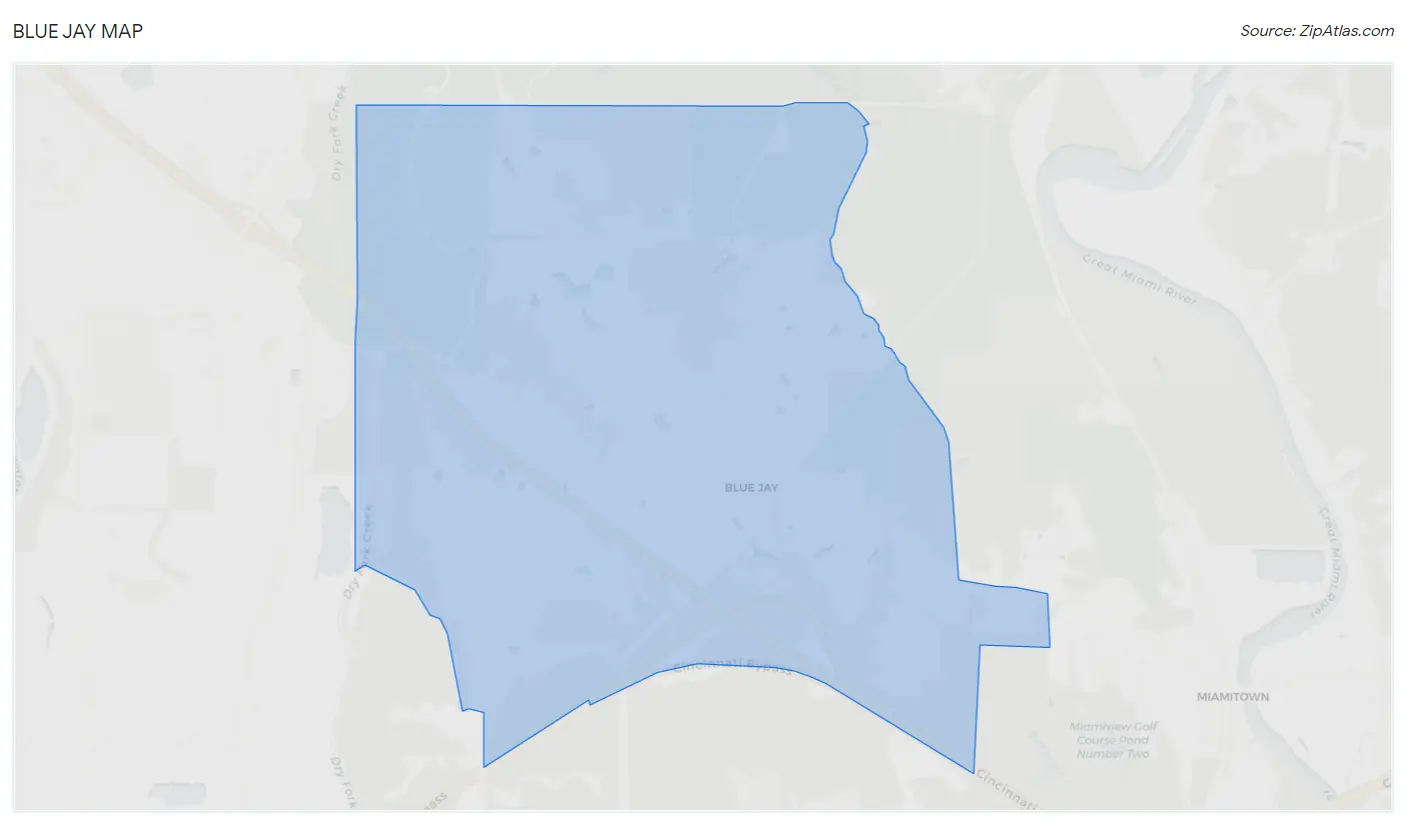
Blue Jay Map
Blue Jay Overview
$35,941
PER CAPITA INCOME
$111,952
AVG FAMILY INCOME
$110,714
AVG HOUSEHOLD INCOME
46.7%
WAGE / INCOME GAP [ % ]
53.3¢/ $1
WAGE / INCOME GAP [ $ ]
0.31
INEQUALITY / GINI INDEX
1,815
TOTAL POPULATION
905
MALE POPULATION
910
FEMALE POPULATION
99.45
MALES / 100 FEMALES
100.55
FEMALES / 100 MALES
38.2
MEDIAN AGE
3.3
AVG FAMILY SIZE
2.8
AVG HOUSEHOLD SIZE
812
LABOR FORCE [ PEOPLE ]
64.0%
PERCENT IN LABOR FORCE
Income in Blue Jay
Income Overview in Blue Jay
Per Capita Income in Blue Jay is $35,941, while median incomes of families and households are $111,952 and $110,714 respectively.
| Characteristic | Number | Measure |
| Per Capita Income | 1,815 | $35,941 |
| Median Family Income | 504 | $111,952 |
| Mean Family Income | 504 | $115,058 |
| Median Household Income | 640 | $110,714 |
| Mean Household Income | 640 | $103,760 |
| Income Deficit | 504 | $0 |
| Wage / Income Gap (%) | 1,815 | 46.75% |
| Wage / Income Gap ($) | 1,815 | 53.25¢ per $1 |
| Gini / Inequality Index | 1,815 | 0.31 |
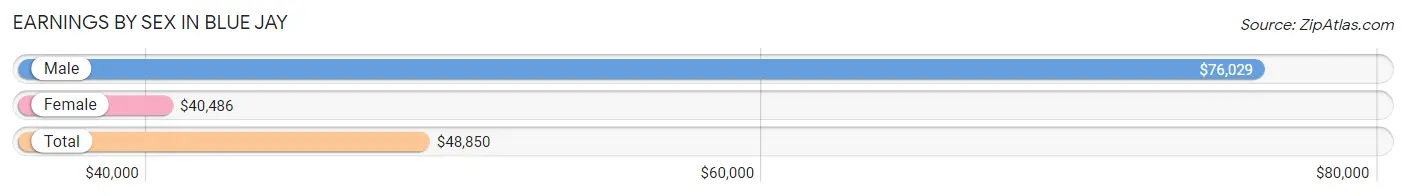
Earnings by Sex in Blue Jay
Average Earnings in Blue Jay are $48,850, $76,029 for men and $40,486 for women, a difference of 46.8%.
| Sex | Number | Average Earnings |
| Male | 376 (42.9%) | $76,029 |
| Female | 501 (57.1%) | $40,486 |
| Total | 877 (100.0%) | $48,850 |
Earnings by Sex by Income Bracket in Blue Jay
The most common earnings brackets in Blue Jay are $75,000 to $99,999 for men (160 | 42.5%) and $25,000 to $29,999 for women (105 | 21.0%).
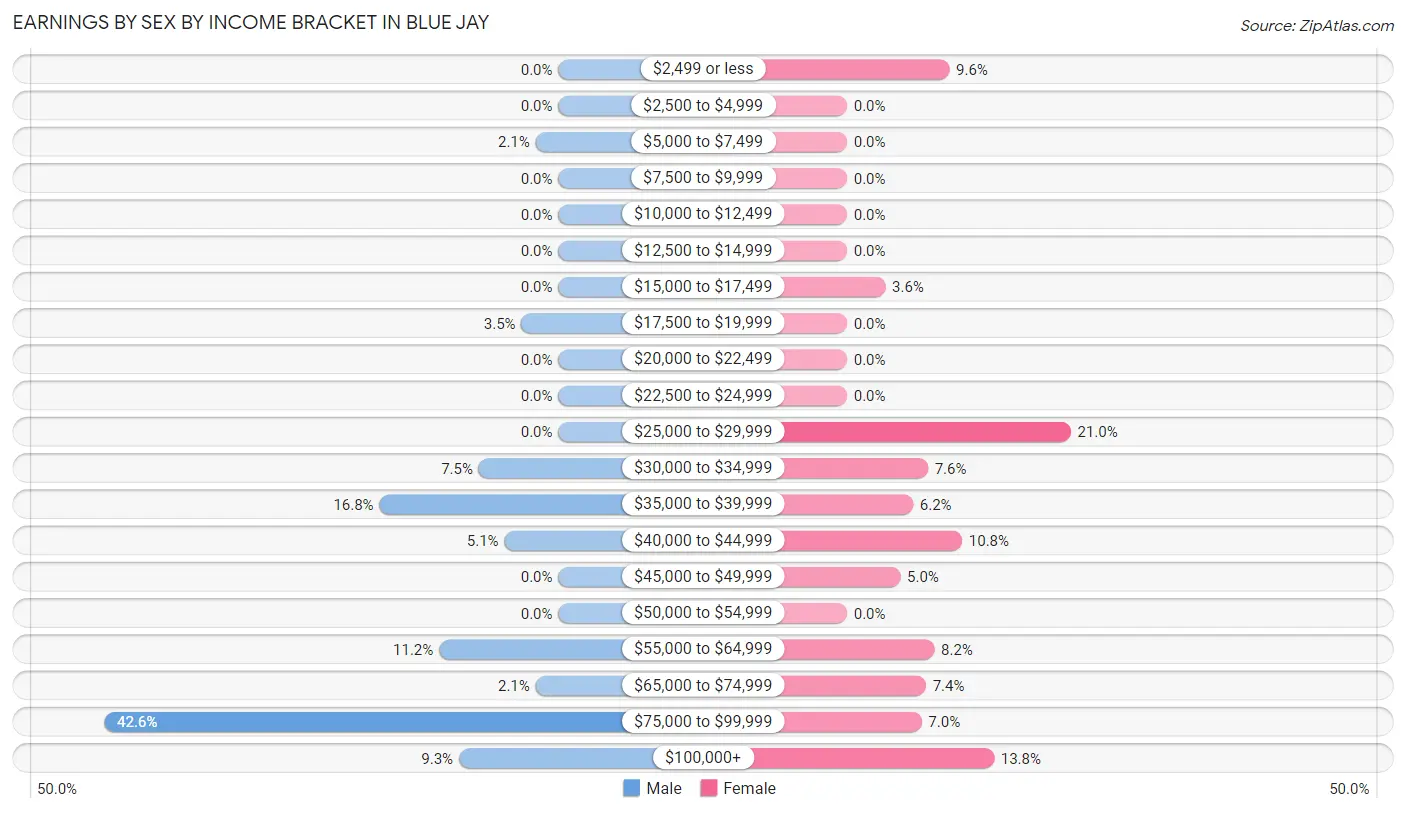
| Income | Male | Female |
| $2,499 or less | 0 (0.0%) | 48 (9.6%) |
| $2,500 to $4,999 | 0 (0.0%) | 0 (0.0%) |
| $5,000 to $7,499 | 8 (2.1%) | 0 (0.0%) |
| $7,500 to $9,999 | 0 (0.0%) | 0 (0.0%) |
| $10,000 to $12,499 | 0 (0.0%) | 0 (0.0%) |
| $12,500 to $14,999 | 0 (0.0%) | 0 (0.0%) |
| $15,000 to $17,499 | 0 (0.0%) | 18 (3.6%) |
| $17,500 to $19,999 | 13 (3.5%) | 0 (0.0%) |
| $20,000 to $22,499 | 0 (0.0%) | 0 (0.0%) |
| $22,500 to $24,999 | 0 (0.0%) | 0 (0.0%) |
| $25,000 to $29,999 | 0 (0.0%) | 105 (21.0%) |
| $30,000 to $34,999 | 28 (7.4%) | 38 (7.6%) |
| $35,000 to $39,999 | 63 (16.8%) | 31 (6.2%) |
| $40,000 to $44,999 | 19 (5.1%) | 54 (10.8%) |
| $45,000 to $49,999 | 0 (0.0%) | 25 (5.0%) |
| $50,000 to $54,999 | 0 (0.0%) | 0 (0.0%) |
| $55,000 to $64,999 | 42 (11.2%) | 41 (8.2%) |
| $65,000 to $74,999 | 8 (2.1%) | 37 (7.4%) |
| $75,000 to $99,999 | 160 (42.5%) | 35 (7.0%) |
| $100,000+ | 35 (9.3%) | 69 (13.8%) |
| Total | 376 (100.0%) | 501 (100.0%) |
Earnings by Sex by Educational Attainment in Blue Jay
Average earnings in Blue Jay are $76,029 for men and $41,273 for women, a difference of 45.7%. Men with an educational attainment of high school diploma enjoy the highest average annual earnings of $85,100, while those with bachelor's degree education earn the least with $78,676. Women with an educational attainment of graduate degree earn the most with the average annual earnings of $102,898, while those with high school diploma education have the smallest earnings of $26,226.
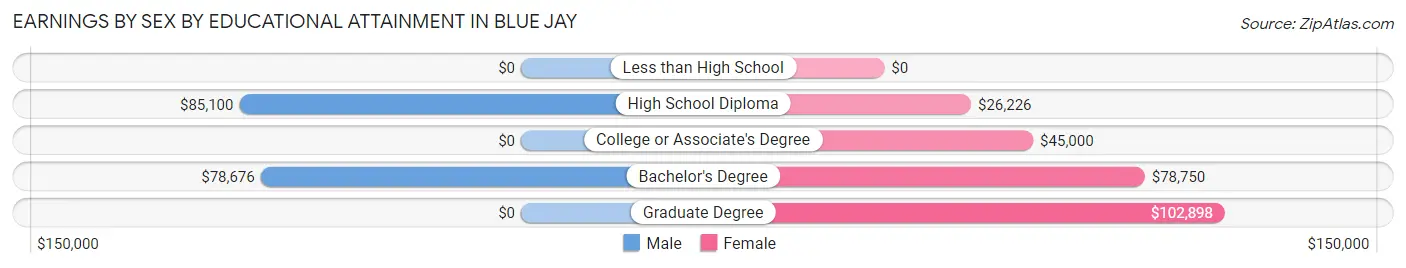
| Educational Attainment | Male Income | Female Income |
| Less than High School | - | - |
| High School Diploma | $85,100 | $26,226 |
| College or Associate's Degree | - | - |
| Bachelor's Degree | $78,676 | $78,750 |
| Graduate Degree | - | - |
| Total | $76,029 | $41,273 |
Family Income in Blue Jay
Family Income Brackets in Blue Jay
According to the Blue Jay family income data, there are 248 families falling into the $100,000 to $149,999 income range, which is the most common income bracket and makes up 49.2% of all families.
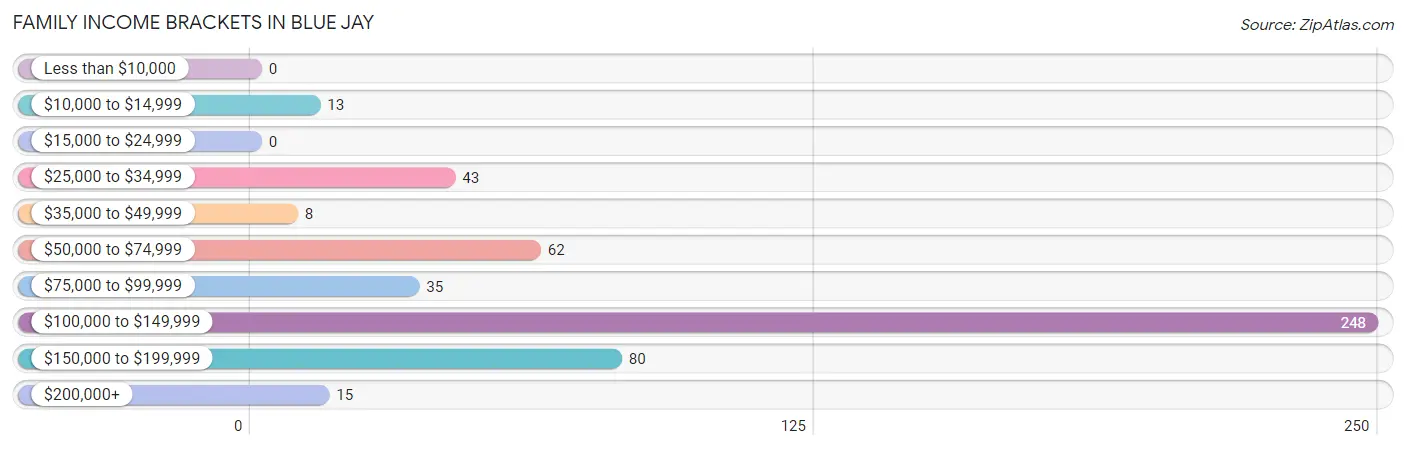
| Income Bracket | # Families | % Families |
| Less than $10,000 | 0 | 0.0% |
| $10,000 to $14,999 | 13 | 2.6% |
| $15,000 to $24,999 | 0 | 0.0% |
| $25,000 to $34,999 | 43 | 8.5% |
| $35,000 to $49,999 | 8 | 1.6% |
| $50,000 to $74,999 | 62 | 12.3% |
| $75,000 to $99,999 | 35 | 6.9% |
| $100,000 to $149,999 | 248 | 49.2% |
| $150,000 to $199,999 | 80 | 15.9% |
| $200,000+ | 15 | 3.0% |
Family Income by Famaliy Size in Blue Jay
3-person families (91 | 18.1%) account for the highest median family income in Blue Jay with $130,917 per family, while 3-person families (91 | 18.1%) have the highest median income of $43,639 per family member.
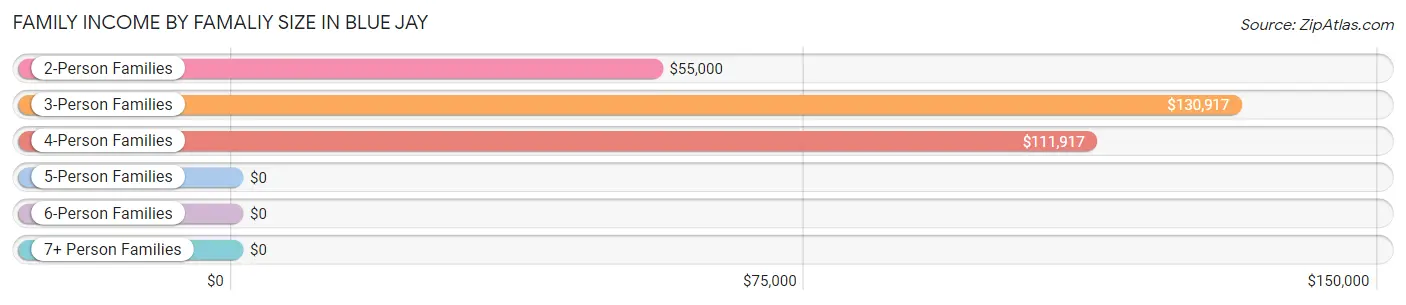
| Income Bracket | # Families | Median Income |
| 2-Person Families | 166 (32.9%) | $55,000 |
| 3-Person Families | 91 (18.1%) | $130,917 |
| 4-Person Families | 185 (36.7%) | $111,917 |
| 5-Person Families | 62 (12.3%) | $0 |
| 6-Person Families | 0 (0.0%) | $0 |
| 7+ Person Families | 0 (0.0%) | $0 |
| Total | 504 (100.0%) | $111,952 |
Family Income by Number of Earners in Blue Jay
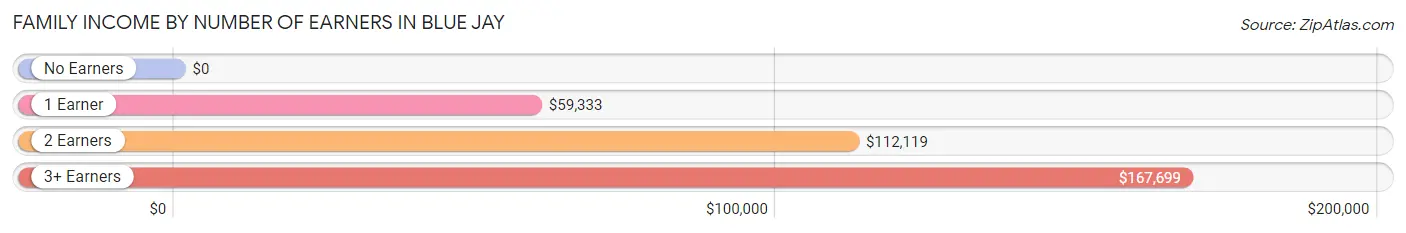
| Number of Earners | # Families | Median Income |
| No Earners | 113 (22.4%) | $0 |
| 1 Earner | 66 (13.1%) | $59,333 |
| 2 Earners | 228 (45.2%) | $112,119 |
| 3+ Earners | 97 (19.3%) | $167,699 |
| Total | 504 (100.0%) | $111,952 |
Household Income in Blue Jay
Household Income Brackets in Blue Jay
With 264 households falling in the category, the $100,000 to $149,999 income range is the most frequent in Blue Jay, accounting for 41.2% of all households.
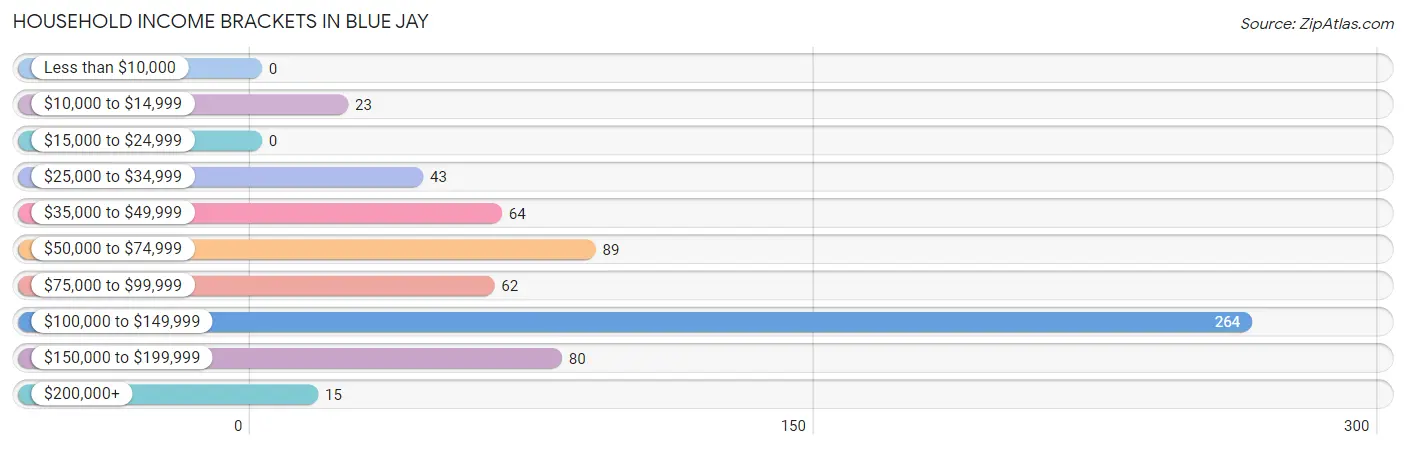
| Income Bracket | # Households | % Households |
| Less than $10,000 | 0 | 0.0% |
| $10,000 to $14,999 | 23 | 3.6% |
| $15,000 to $24,999 | 0 | 0.0% |
| $25,000 to $34,999 | 43 | 6.7% |
| $35,000 to $49,999 | 64 | 10.0% |
| $50,000 to $74,999 | 89 | 13.9% |
| $75,000 to $99,999 | 62 | 9.7% |
| $100,000 to $149,999 | 264 | 41.3% |
| $150,000 to $199,999 | 80 | 12.5% |
| $200,000+ | 15 | 2.3% |
Household Income by Householder Age in Blue Jay
The median household income in Blue Jay is $110,714, with the highest median household income of $130,667 found in the 45 to 64 years age bracket for the primary householder. A total of 188 households (29.4%) fall into this category.
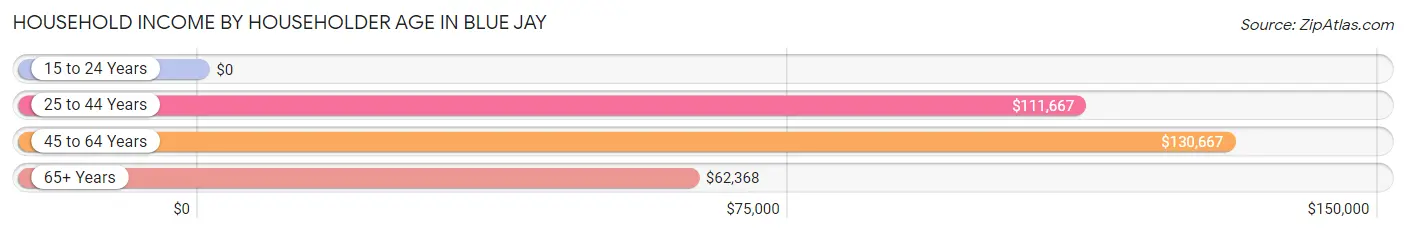
| Income Bracket | # Households | Median Income |
| 15 to 24 Years | 0 (0.0%) | $0 |
| 25 to 44 Years | 248 (38.8%) | $111,667 |
| 45 to 64 Years | 188 (29.4%) | $130,667 |
| 65+ Years | 204 (31.9%) | $62,368 |
| Total | 640 (100.0%) | $110,714 |
Poverty in Blue Jay
Income Below Poverty by Sex and Age in Blue Jay
With 2.5% poverty level for males and 4.6% for females among the residents of Blue Jay, 55 to 64 year old males and 55 to 64 year old females are the most vulnerable to poverty, with 13 males (12.4%) and 42 females (35.3%) in their respective age groups living below the poverty level.
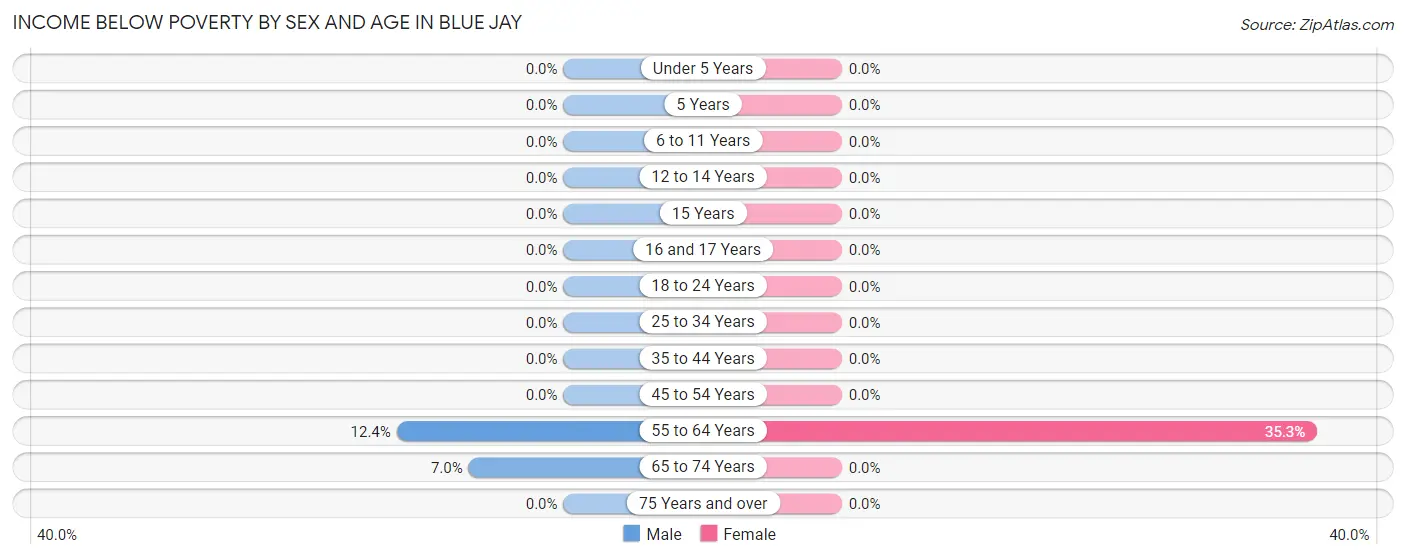
| Age Bracket | Male | Female |
| Under 5 Years | 0 (0.0%) | 0 (0.0%) |
| 5 Years | 0 (0.0%) | 0 (0.0%) |
| 6 to 11 Years | 0 (0.0%) | 0 (0.0%) |
| 12 to 14 Years | 0 (0.0%) | 0 (0.0%) |
| 15 Years | 0 (0.0%) | 0 (0.0%) |
| 16 and 17 Years | 0 (0.0%) | 0 (0.0%) |
| 18 to 24 Years | 0 (0.0%) | 0 (0.0%) |
| 25 to 34 Years | 0 (0.0%) | 0 (0.0%) |
| 35 to 44 Years | 0 (0.0%) | 0 (0.0%) |
| 45 to 54 Years | 0 (0.0%) | 0 (0.0%) |
| 55 to 64 Years | 13 (12.4%) | 42 (35.3%) |
| 65 to 74 Years | 10 (7.0%) | 0 (0.0%) |
| 75 Years and over | 0 (0.0%) | 0 (0.0%) |
| Total | 23 (2.5%) | 42 (4.6%) |
Income Above Poverty by Sex and Age in Blue Jay
According to the poverty statistics in Blue Jay, males aged under 5 years and females aged under 5 years are the age groups that are most secure financially, with 100.0% of males and 100.0% of females in these age groups living above the poverty line.
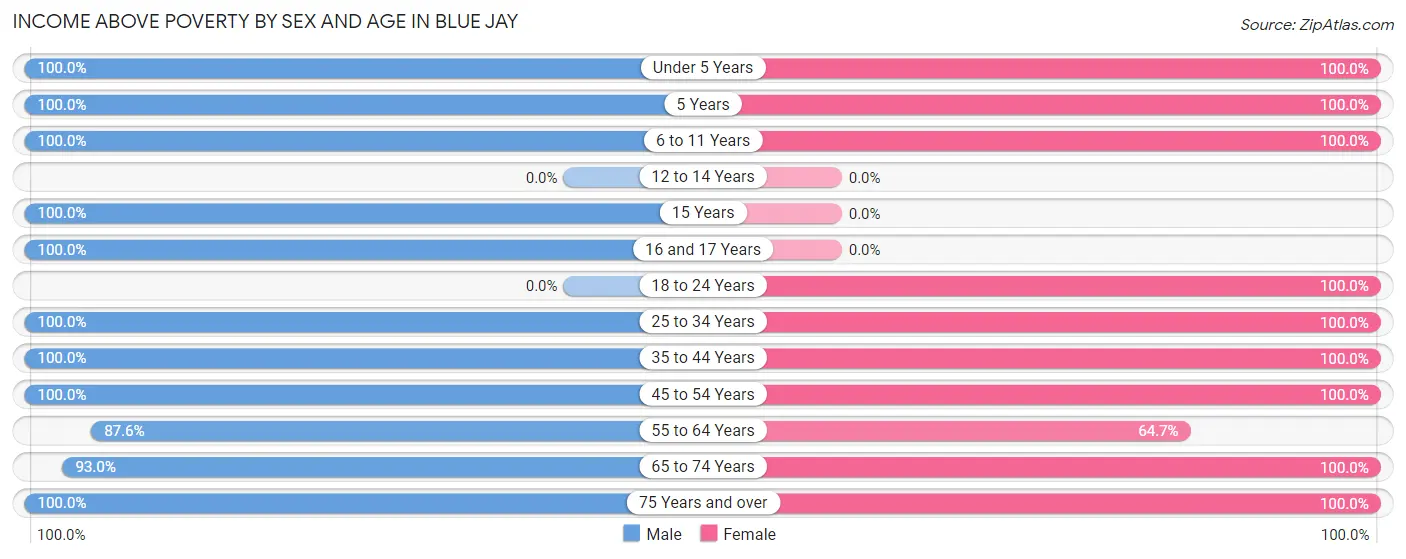
| Age Bracket | Male | Female |
| Under 5 Years | 214 (100.0%) | 173 (100.0%) |
| 5 Years | 10 (100.0%) | 17 (100.0%) |
| 6 to 11 Years | 87 (100.0%) | 41 (100.0%) |
| 12 to 14 Years | 0 (0.0%) | 0 (0.0%) |
| 15 Years | 5 (100.0%) | 0 (0.0%) |
| 16 and 17 Years | 10 (100.0%) | 0 (0.0%) |
| 18 to 24 Years | 0 (0.0%) | 34 (100.0%) |
| 25 to 34 Years | 53 (100.0%) | 208 (100.0%) |
| 35 to 44 Years | 193 (100.0%) | 83 (100.0%) |
| 45 to 54 Years | 34 (100.0%) | 107 (100.0%) |
| 55 to 64 Years | 92 (87.6%) | 77 (64.7%) |
| 65 to 74 Years | 132 (93.0%) | 76 (100.0%) |
| 75 Years and over | 52 (100.0%) | 52 (100.0%) |
| Total | 882 (97.5%) | 868 (95.4%) |
Income Below Poverty Among Married-Couple Families in Blue Jay
The poverty statistics for married-couple families in Blue Jay show that 3.1% or 13 of the total 424 families live below the poverty line. Families with no children have the highest poverty rate of 6.4%, comprising of 13 families. On the other hand, families with 1 or 2 children have the lowest poverty rate of 0.0%, which includes 0 families.
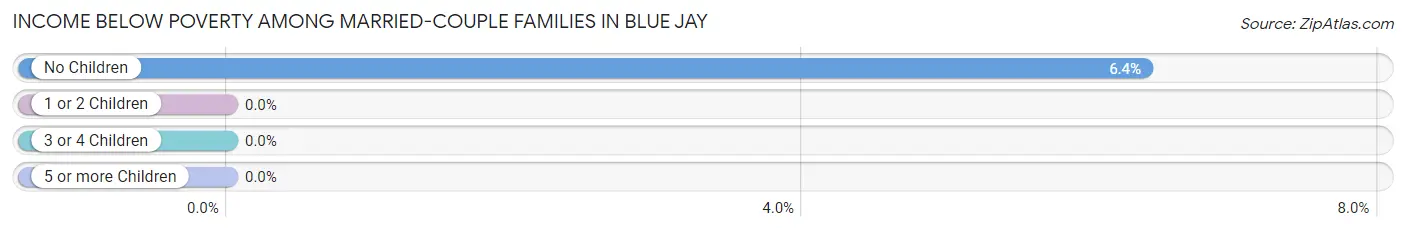
| Children | Above Poverty | Below Poverty |
| No Children | 191 (93.6%) | 13 (6.4%) |
| 1 or 2 Children | 158 (100.0%) | 0 (0.0%) |
| 3 or 4 Children | 62 (100.0%) | 0 (0.0%) |
| 5 or more Children | 0 (0.0%) | 0 (0.0%) |
| Total | 411 (96.9%) | 13 (3.1%) |
Income Below Poverty Among Single-Parent Households in Blue Jay
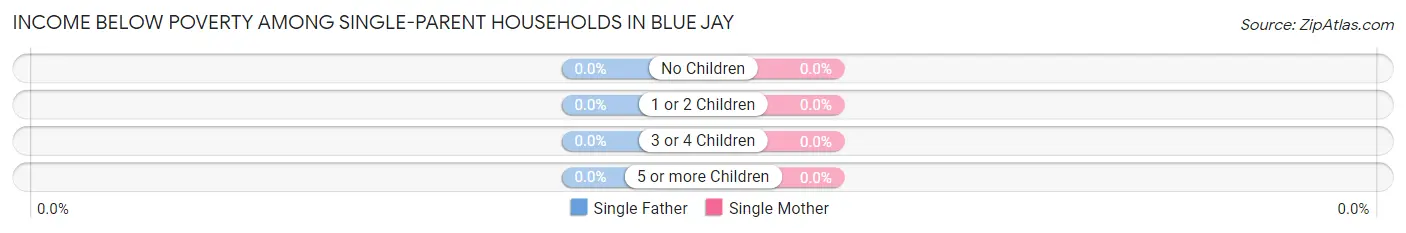
| Children | Single Father | Single Mother |
| No Children | 0 (0.0%) | 0 (0.0%) |
| 1 or 2 Children | 0 (0.0%) | 0 (0.0%) |
| 3 or 4 Children | 0 (0.0%) | 0 (0.0%) |
| 5 or more Children | 0 (0.0%) | 0 (0.0%) |
| Total | 0 (0.0%) | 0 (0.0%) |
Income Below Poverty Among Married-Couple vs Single-Parent Households in Blue Jay
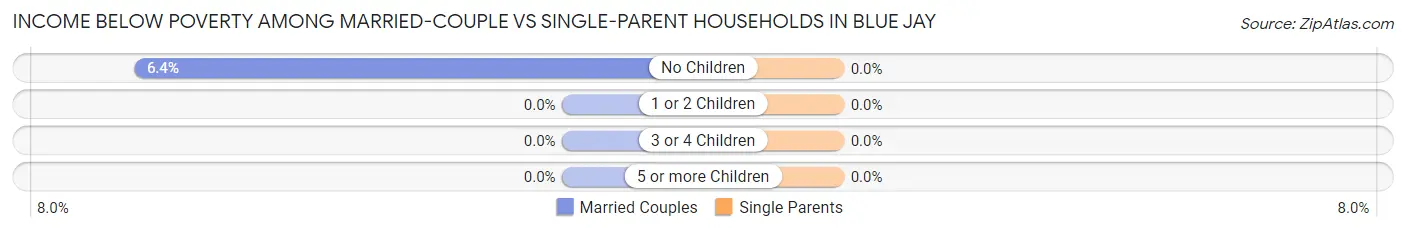
| Children | Married-Couple Families | Single-Parent Households |
| No Children | 13 (6.4%) | 0 (0.0%) |
| 1 or 2 Children | 0 (0.0%) | 0 (0.0%) |
| 3 or 4 Children | 0 (0.0%) | 0 (0.0%) |
| 5 or more Children | 0 (0.0%) | 0 (0.0%) |
| Total | 13 (3.1%) | 0 (0.0%) |
Race in Blue Jay
The most populous races in Blue Jay are White / Caucasian (1,704 | 93.9%), Black / African American (63 | 3.5%), and Two or more Races (48 | 2.6%).
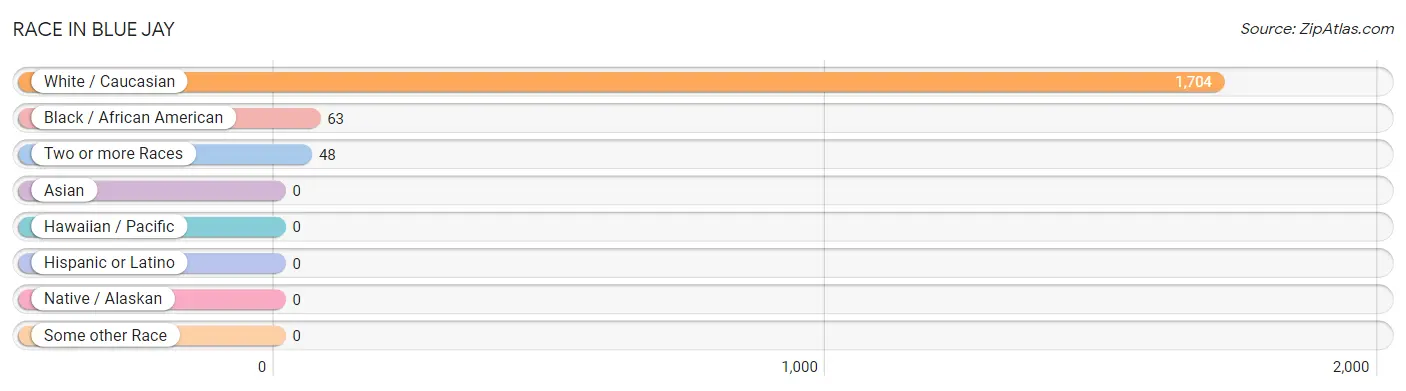
| Race | # Population | % Population |
| Asian | 0 | 0.0% |
| Black / African American | 63 | 3.5% |
| Hawaiian / Pacific | 0 | 0.0% |
| Hispanic or Latino | 0 | 0.0% |
| Native / Alaskan | 0 | 0.0% |
| White / Caucasian | 1,704 | 93.9% |
| Two or more Races | 48 | 2.6% |
| Some other Race | 0 | 0.0% |
| Total | 1,815 | 100.0% |
Ancestry in Blue Jay
The most populous ancestries reported in Blue Jay are German (468 | 25.8%), English (362 | 19.9%), Italian (338 | 18.6%), Irish (292 | 16.1%), and American (139 | 7.7%), together accounting for 88.1% of all Blue Jay residents.
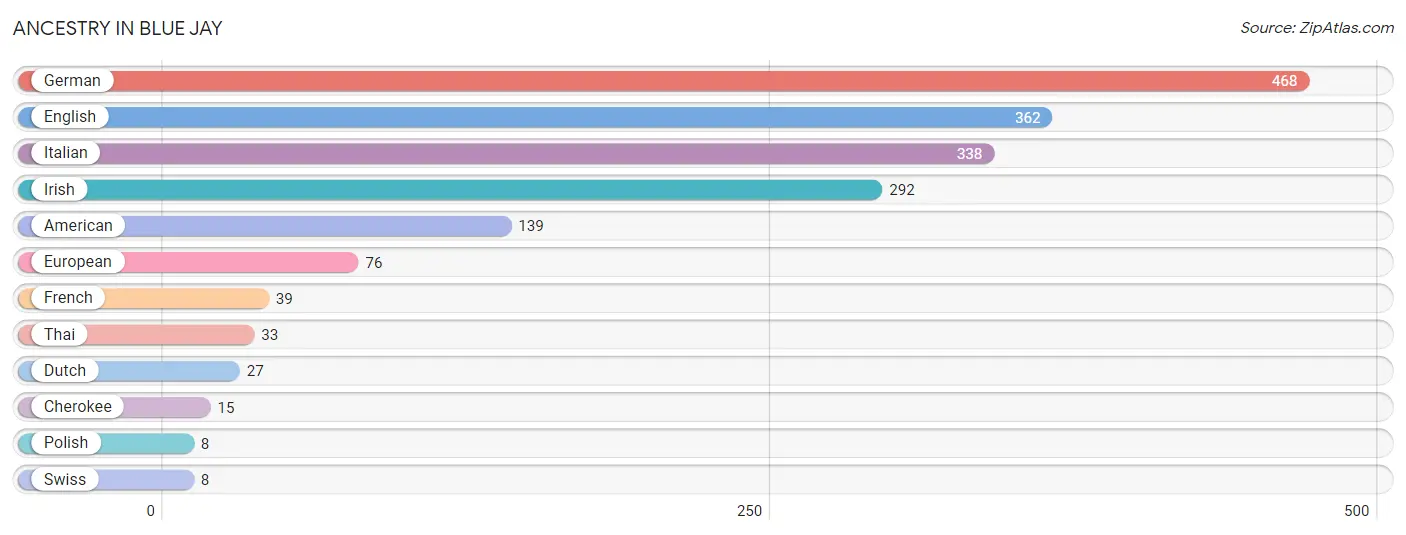
| Ancestry | # Population | % Population |
| American | 139 | 7.7% |
| Cherokee | 15 | 0.8% |
| Dutch | 27 | 1.5% |
| English | 362 | 19.9% |
| European | 76 | 4.2% |
| French | 39 | 2.1% |
| German | 468 | 25.8% |
| Irish | 292 | 16.1% |
| Italian | 338 | 18.6% |
| Polish | 8 | 0.4% |
| Swiss | 8 | 0.4% |
| Thai | 33 | 1.8% | View All 12 Rows |
Immigrants in Blue Jay

| Immigration Origin | # Population | % Population | View All 0 Rows |
Sex and Age in Blue Jay
Sex and Age in Blue Jay
The most populous age groups in Blue Jay are Under 5 Years (214 | 23.6%) for men and Under 5 Years (173 | 19.0%) for women.
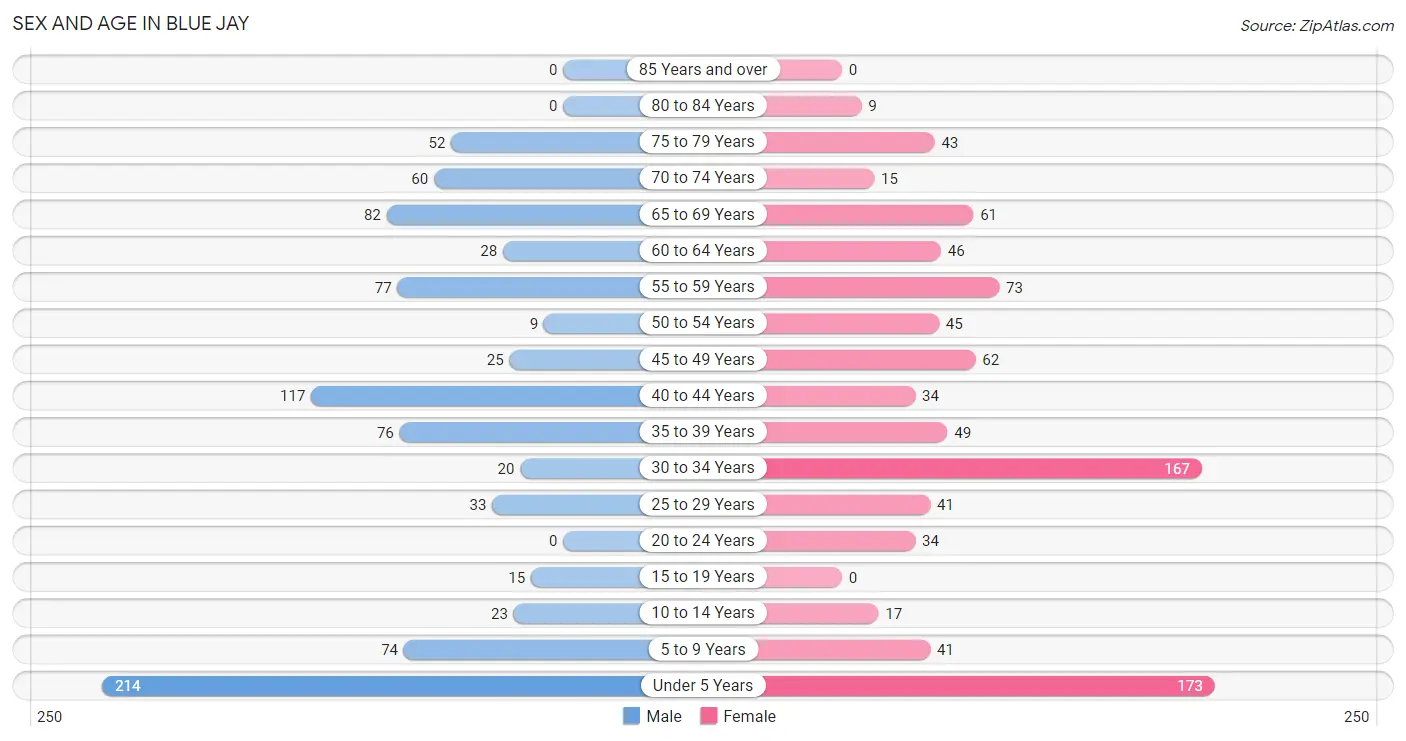
| Age Bracket | Male | Female |
| Under 5 Years | 214 (23.6%) | 173 (19.0%) |
| 5 to 9 Years | 74 (8.2%) | 41 (4.5%) |
| 10 to 14 Years | 23 (2.5%) | 17 (1.9%) |
| 15 to 19 Years | 15 (1.7%) | 0 (0.0%) |
| 20 to 24 Years | 0 (0.0%) | 34 (3.7%) |
| 25 to 29 Years | 33 (3.6%) | 41 (4.5%) |
| 30 to 34 Years | 20 (2.2%) | 167 (18.3%) |
| 35 to 39 Years | 76 (8.4%) | 49 (5.4%) |
| 40 to 44 Years | 117 (12.9%) | 34 (3.7%) |
| 45 to 49 Years | 25 (2.8%) | 62 (6.8%) |
| 50 to 54 Years | 9 (1.0%) | 45 (5.0%) |
| 55 to 59 Years | 77 (8.5%) | 73 (8.0%) |
| 60 to 64 Years | 28 (3.1%) | 46 (5.1%) |
| 65 to 69 Years | 82 (9.1%) | 61 (6.7%) |
| 70 to 74 Years | 60 (6.6%) | 15 (1.7%) |
| 75 to 79 Years | 52 (5.8%) | 43 (4.7%) |
| 80 to 84 Years | 0 (0.0%) | 9 (1.0%) |
| 85 Years and over | 0 (0.0%) | 0 (0.0%) |
| Total | 905 (100.0%) | 910 (100.0%) |
Families and Households in Blue Jay
Median Family Size in Blue Jay
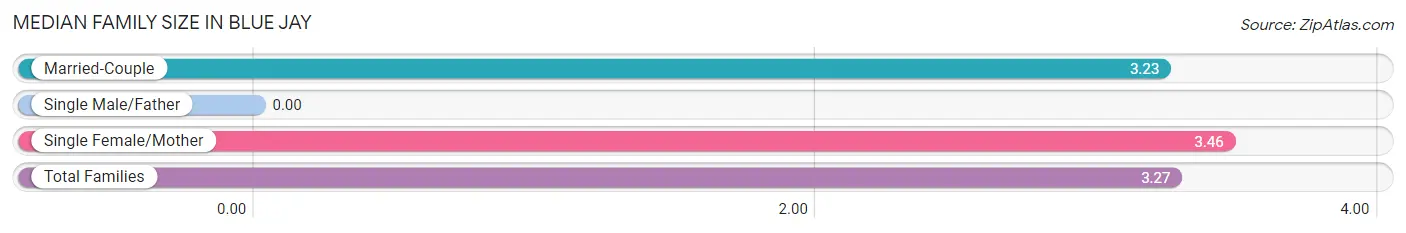
| Family Type | # Families | Family Size |
| Married-Couple | 424 (84.1%) | 3.23 |
| Single Male/Father | 0 (0.0%) | - |
| Single Female/Mother | 80 (15.9%) | 3.46 |
| Total Families | 504 (100.0%) | 3.27 |
Median Household Size in Blue Jay
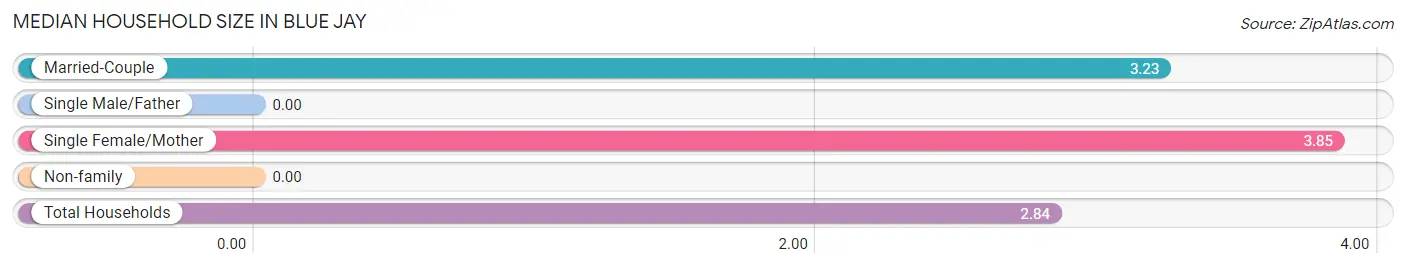
| Household Type | # Households | Household Size |
| Married-Couple | 424 (66.2%) | 3.23 |
| Single Male/Father | 0 (0.0%) | - |
| Single Female/Mother | 80 (12.5%) | 3.85 |
| Non-family | 136 (21.2%) | - |
| Total Households | 640 (100.0%) | 2.84 |
Household Size by Marriage Status in Blue Jay
Out of a total of 640 households in Blue Jay, 504 (78.7%) are family households, while 136 (21.2%) are nonfamily households. The most numerous type of family households are 4-person households, comprising 173, and the most common type of nonfamily households are 1-person households, comprising 136.
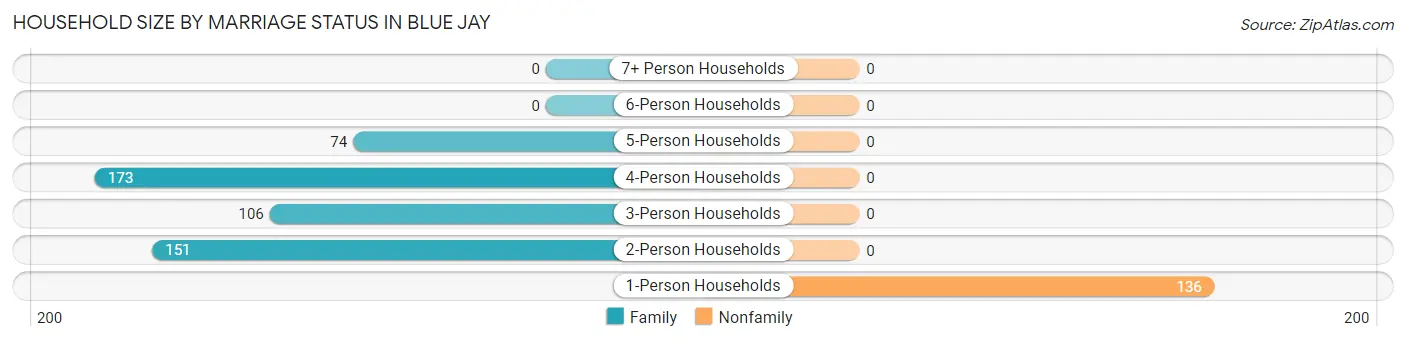
| Household Size | Family Households | Nonfamily Households |
| 1-Person Households | - | 136 (21.2%) |
| 2-Person Households | 151 (23.6%) | 0 (0.0%) |
| 3-Person Households | 106 (16.6%) | 0 (0.0%) |
| 4-Person Households | 173 (27.0%) | 0 (0.0%) |
| 5-Person Households | 74 (11.6%) | 0 (0.0%) |
| 6-Person Households | 0 (0.0%) | 0 (0.0%) |
| 7+ Person Households | 0 (0.0%) | 0 (0.0%) |
| Total | 504 (78.7%) | 136 (21.2%) |
Female Fertility in Blue Jay
Fertility by Age in Blue Jay
Average fertility rate in Blue Jay is 49.0 births per 1,000 women. Women in the age bracket of 20 to 34 years have the highest fertility rate with 79.0 births per 1,000 women. Women in the age bracket of 20 to 34 years acount for 100.0% of all women with births.
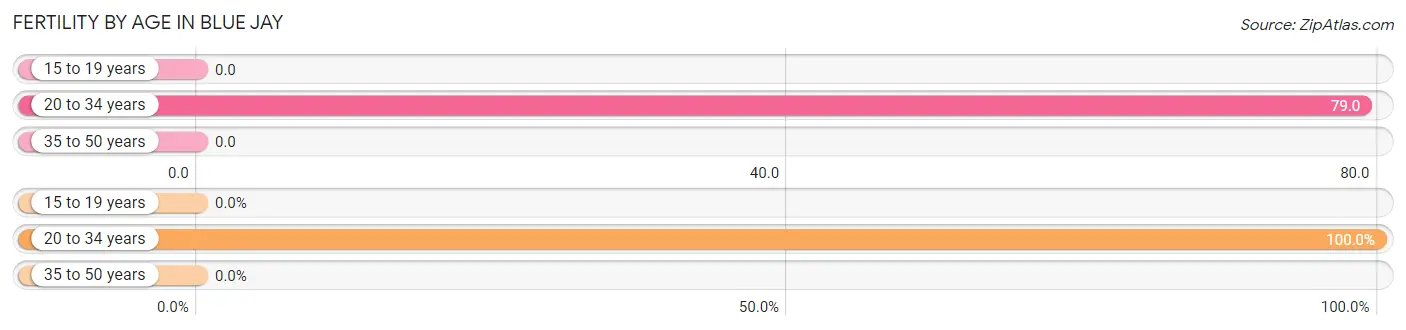
| Age Bracket | Women with Births | Births / 1,000 Women |
| 15 to 19 years | 0 (0.0%) | 0.0 |
| 20 to 34 years | 19 (100.0%) | 79.0 |
| 35 to 50 years | 0 (0.0%) | 0.0 |
| Total | 19 (100.0%) | 49.0 |
Fertility by Age by Marriage Status in Blue Jay
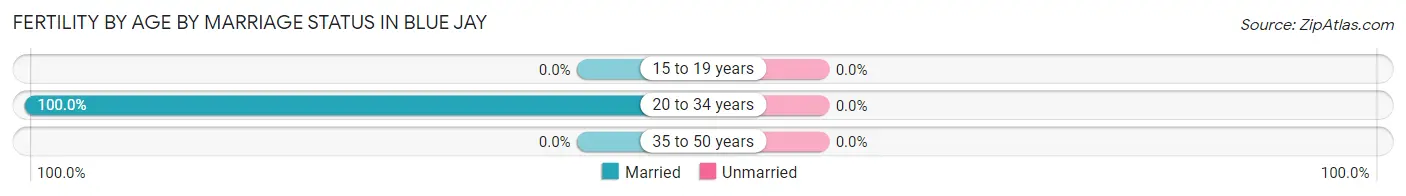
| Age Bracket | Married | Unmarried |
| 15 to 19 years | 0 (0.0%) | 0 (0.0%) |
| 20 to 34 years | 19 (100.0%) | 0 (0.0%) |
| 35 to 50 years | 0 (0.0%) | 0 (0.0%) |
| Total | 19 (100.0%) | 0 (0.0%) |
Fertility by Education in Blue Jay
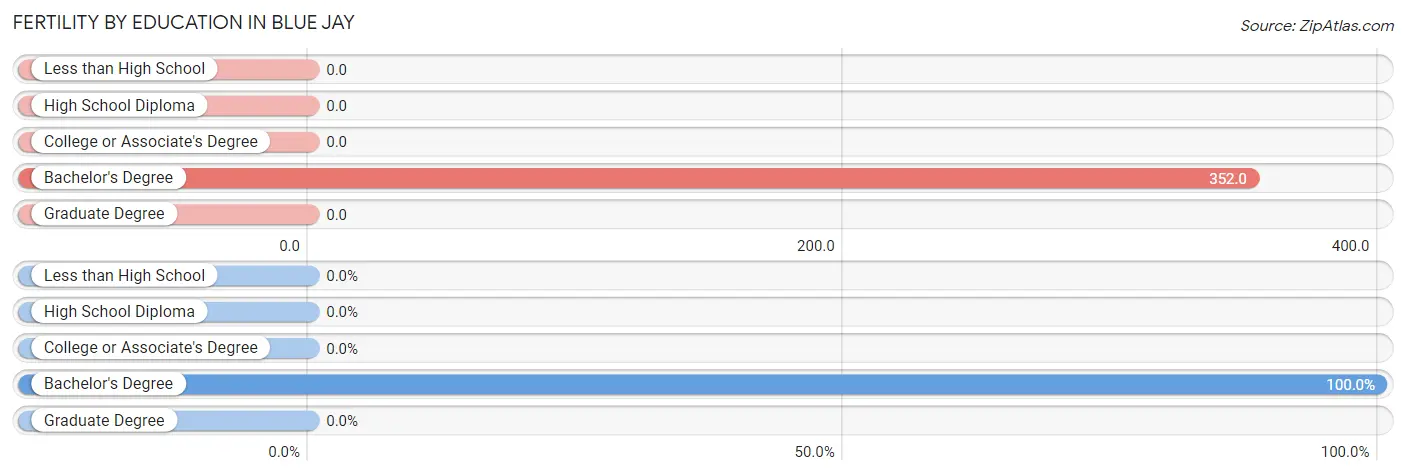
| Educational Attainment | Women with Births | Births / 1,000 Women |
| Less than High School | 0 (0.0%) | 0.0 |
| High School Diploma | 0 (0.0%) | 0.0 |
| College or Associate's Degree | 0 (0.0%) | 0.0 |
| Bachelor's Degree | 19 (100.0%) | 352.0 |
| Graduate Degree | 0 (0.0%) | 0.0 |
| Total | 19 (100.0%) | 49.0 |
Fertility by Education by Marriage Status in Blue Jay
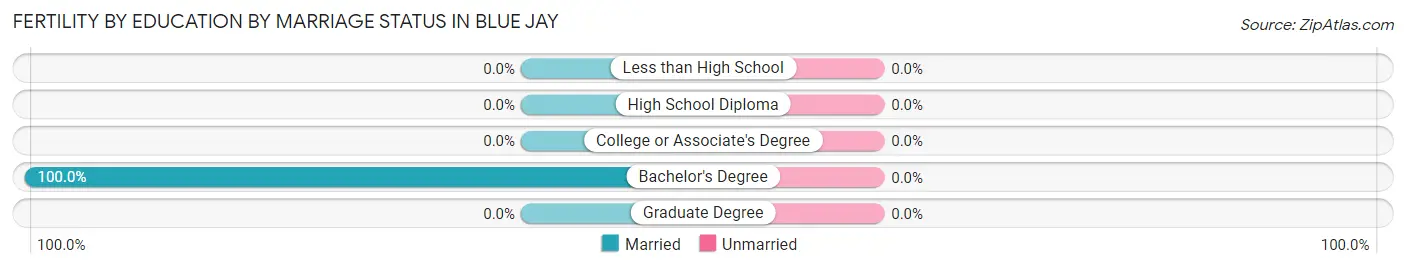
| Educational Attainment | Married | Unmarried |
| Less than High School | 0 (0.0%) | 0 (0.0%) |
| High School Diploma | 0 (0.0%) | 0 (0.0%) |
| College or Associate's Degree | 0 (0.0%) | 0 (0.0%) |
| Bachelor's Degree | 19 (100.0%) | 0 (0.0%) |
| Graduate Degree | 0 (0.0%) | 0 (0.0%) |
| Total | 19 (100.0%) | 0 (0.0%) |
Employment Characteristics in Blue Jay
Employment by Class of Employer in Blue Jay
Among the 811 employed individuals in Blue Jay, private company employees (555 | 68.4%), not-for-profit organizations (171 | 21.1%), and federal government employees (42 | 5.2%) make up the most common classes of employment.
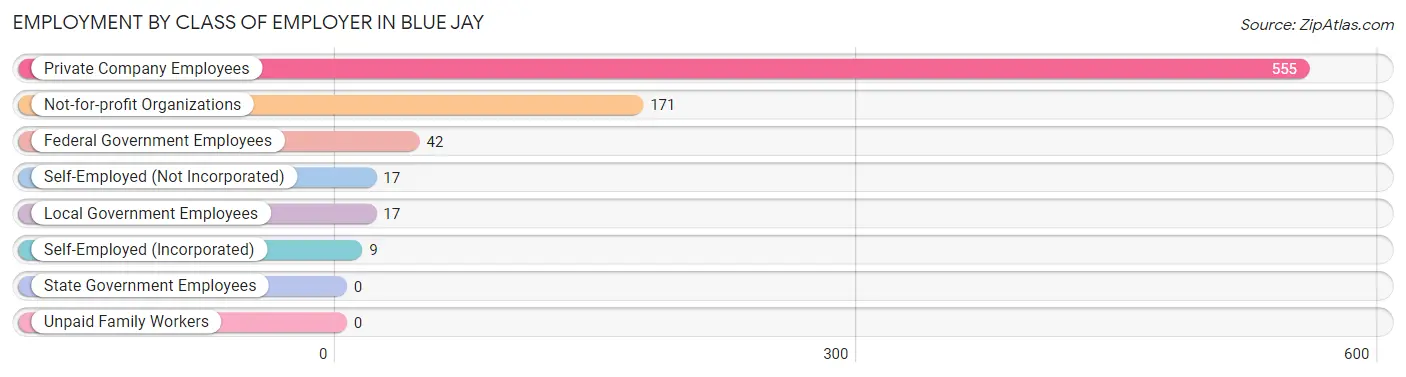
| Employer Class | # Employees | % Employees |
| Private Company Employees | 555 | 68.4% |
| Self-Employed (Incorporated) | 9 | 1.1% |
| Self-Employed (Not Incorporated) | 17 | 2.1% |
| Not-for-profit Organizations | 171 | 21.1% |
| Local Government Employees | 17 | 2.1% |
| State Government Employees | 0 | 0.0% |
| Federal Government Employees | 42 | 5.2% |
| Unpaid Family Workers | 0 | 0.0% |
| Total | 811 | 100.0% |
Employment Status by Age in Blue Jay
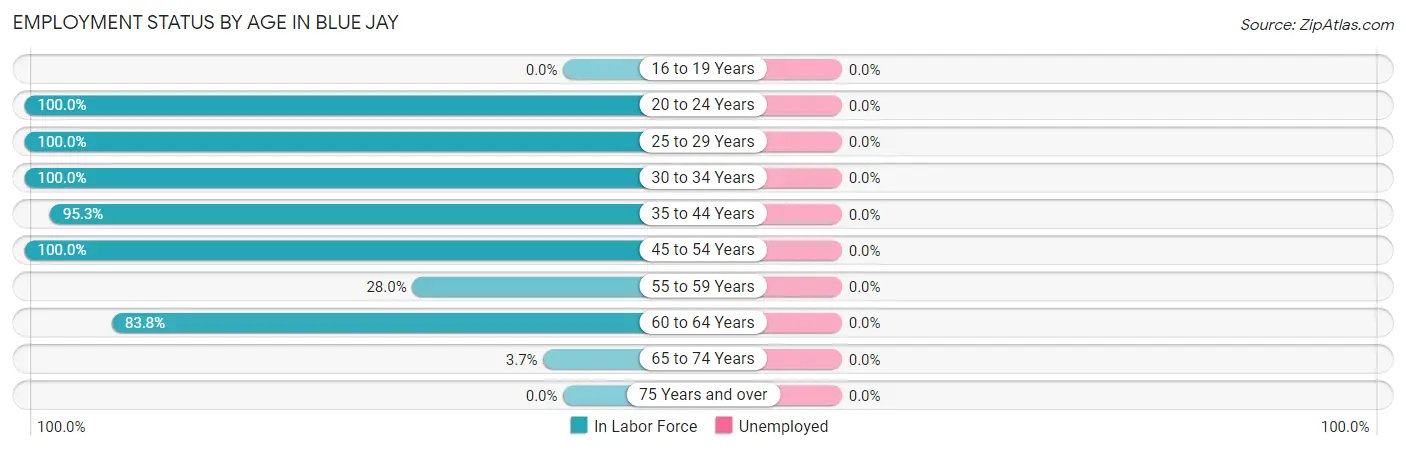
| Age Bracket | In Labor Force | Unemployed |
| 16 to 19 Years | 0 (0.0%) | 0 (0.0%) |
| 20 to 24 Years | 34 (100.0%) | 0 (0.0%) |
| 25 to 29 Years | 74 (100.0%) | 0 (0.0%) |
| 30 to 34 Years | 187 (100.0%) | 0 (0.0%) |
| 35 to 44 Years | 263 (95.3%) | 0 (0.0%) |
| 45 to 54 Years | 141 (100.0%) | 0 (0.0%) |
| 55 to 59 Years | 42 (28.0%) | 0 (0.0%) |
| 60 to 64 Years | 62 (83.8%) | 0 (0.0%) |
| 65 to 74 Years | 8 (3.7%) | 0 (0.0%) |
| 75 Years and over | 0 (0.0%) | 0 (0.0%) |
| Total | 812 (64.0%) | 0 (0.0%) |
Employment Status by Educational Attainment in Blue Jay
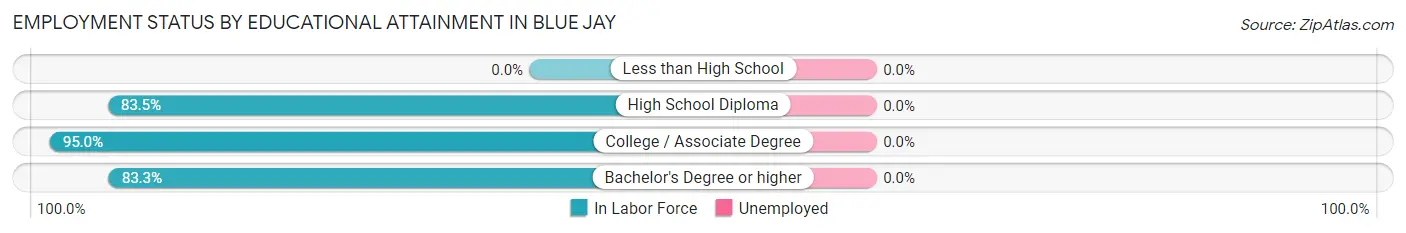
| Educational Attainment | In Labor Force | Unemployed |
| Less than High School | 0 (0.0%) | 0 (0.0%) |
| High School Diploma | 318 (83.5%) | 0 (0.0%) |
| College / Associate Degree | 226 (95.0%) | 0 (0.0%) |
| Bachelor's Degree or higher | 225 (83.3%) | 0 (0.0%) |
| Total | 769 (85.3%) | 0 (0.0%) |
Employment Occupations by Sex in Blue Jay
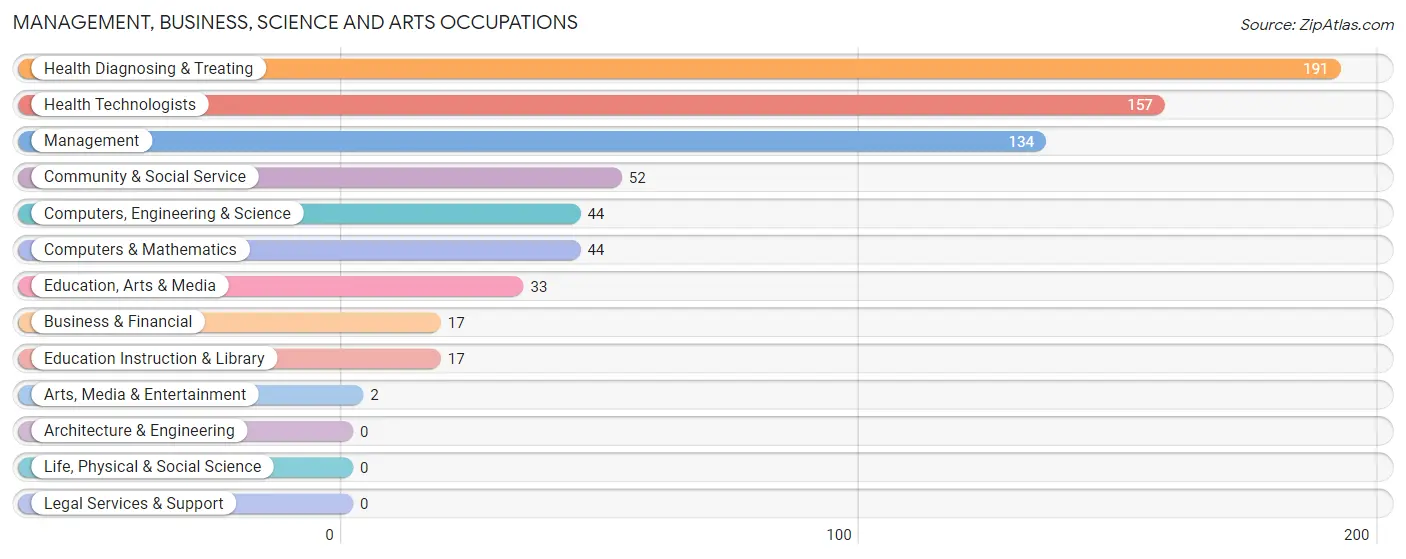
Management, Business, Science and Arts Occupations
The most common Management, Business, Science and Arts occupations in Blue Jay are Health Diagnosing & Treating (191 | 23.5%), Health Technologists (157 | 19.4%), Management (134 | 16.5%), Community & Social Service (52 | 6.4%), and Computers, Engineering & Science (44 | 5.4%).
Management, Business, Science and Arts Occupations by Sex
Within the Management, Business, Science and Arts occupations in Blue Jay, the most male-oriented occupations are Business & Financial (100.0%), Education Instruction & Library (100.0%), and Computers, Engineering & Science (75.0%), while the most female-oriented occupations are Education, Arts & Media (100.0%), Arts, Media & Entertainment (100.0%), and Health Diagnosing & Treating (100.0%).
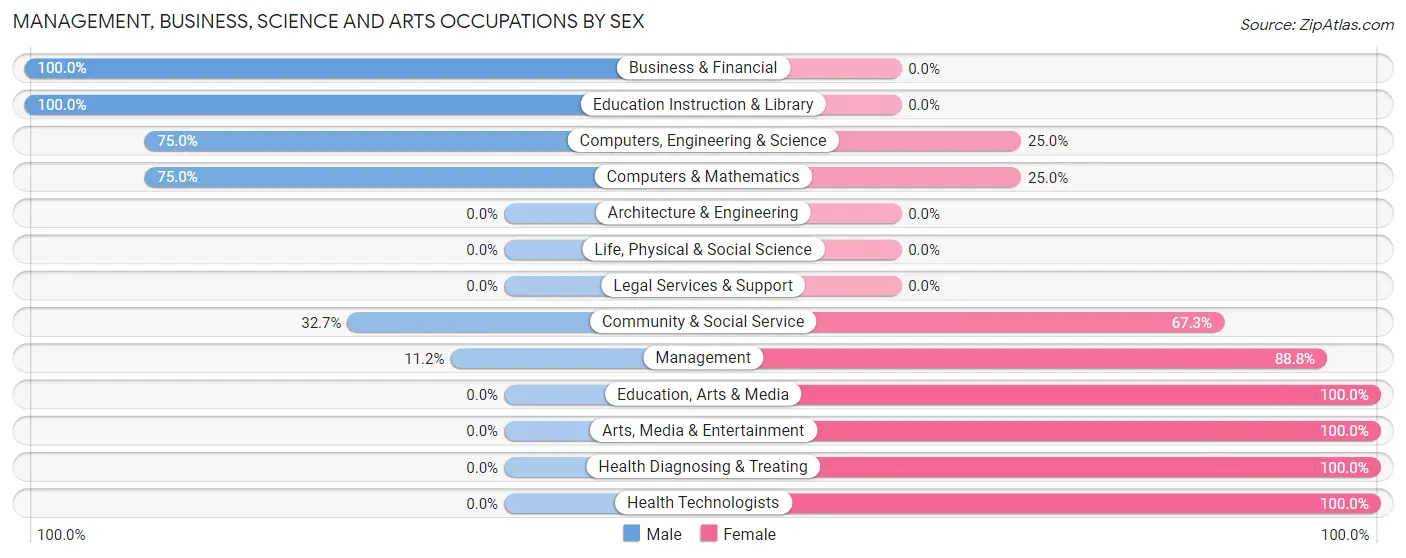
| Occupation | Male | Female |
| Management | 15 (11.2%) | 119 (88.8%) |
| Business & Financial | 17 (100.0%) | 0 (0.0%) |
| Computers, Engineering & Science | 33 (75.0%) | 11 (25.0%) |
| Computers & Mathematics | 33 (75.0%) | 11 (25.0%) |
| Architecture & Engineering | 0 (0.0%) | 0 (0.0%) |
| Life, Physical & Social Science | 0 (0.0%) | 0 (0.0%) |
| Community & Social Service | 17 (32.7%) | 35 (67.3%) |
| Education, Arts & Media | 0 (0.0%) | 33 (100.0%) |
| Legal Services & Support | 0 (0.0%) | 0 (0.0%) |
| Education Instruction & Library | 17 (100.0%) | 0 (0.0%) |
| Arts, Media & Entertainment | 0 (0.0%) | 2 (100.0%) |
| Health Diagnosing & Treating | 0 (0.0%) | 191 (100.0%) |
| Health Technologists | 0 (0.0%) | 157 (100.0%) |
| Total (Category) | 82 (18.7%) | 356 (81.3%) |
| Total (Overall) | 310 (38.2%) | 501 (61.8%) |
Services Occupations
The most common Services occupations in Blue Jay are Personal Care & Service (18 | 2.2%), and Healthcare Support (11 | 1.4%).
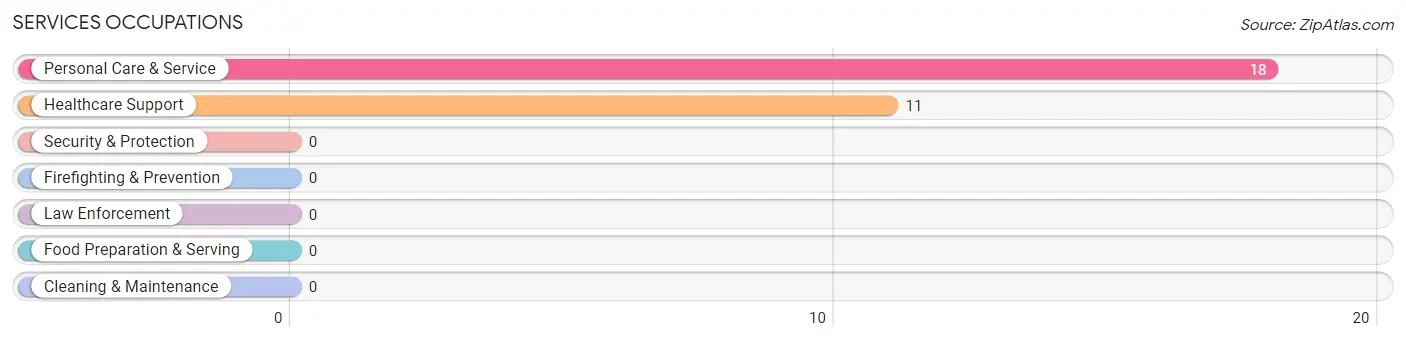
Services Occupations by Sex
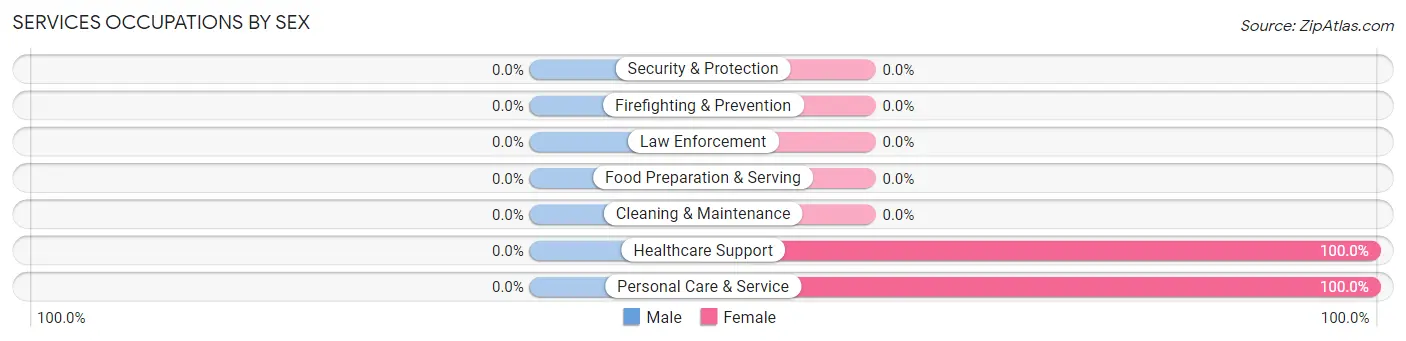
| Occupation | Male | Female |
| Healthcare Support | 0 (0.0%) | 11 (100.0%) |
| Security & Protection | 0 (0.0%) | 0 (0.0%) |
| Firefighting & Prevention | 0 (0.0%) | 0 (0.0%) |
| Law Enforcement | 0 (0.0%) | 0 (0.0%) |
| Food Preparation & Serving | 0 (0.0%) | 0 (0.0%) |
| Cleaning & Maintenance | 0 (0.0%) | 0 (0.0%) |
| Personal Care & Service | 0 (0.0%) | 18 (100.0%) |
| Total (Category) | 0 (0.0%) | 29 (100.0%) |
| Total (Overall) | 310 (38.2%) | 501 (61.8%) |
Sales and Office Occupations
The most common Sales and Office occupations in Blue Jay are Office & Administration (152 | 18.7%), and Sales & Related (28 | 3.5%).
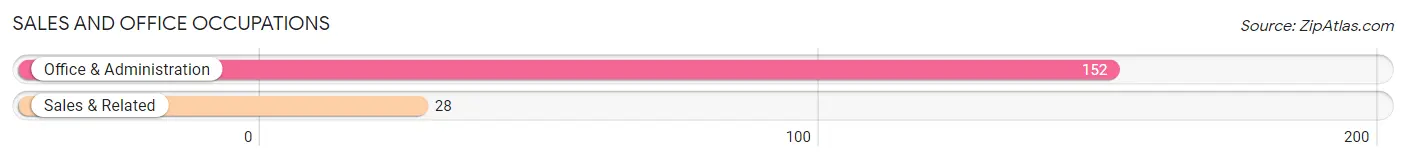
Sales and Office Occupations by Sex
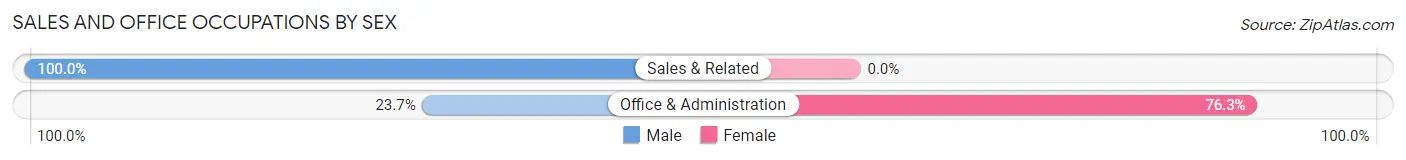
| Occupation | Male | Female |
| Sales & Related | 28 (100.0%) | 0 (0.0%) |
| Office & Administration | 36 (23.7%) | 116 (76.3%) |
| Total (Category) | 64 (35.6%) | 116 (64.4%) |
| Total (Overall) | 310 (38.2%) | 501 (61.8%) |
Natural Resources, Construction and Maintenance Occupations
Natural Resources, Construction and Maintenance Occupations by Sex
| Occupation | Male | Female |
| Farming, Fishing & Forestry | 0 (0.0%) | 0 (0.0%) |
| Construction & Extraction | 0 (0.0%) | 0 (0.0%) |
| Installation, Maintenance & Repair | 0 (0.0%) | 0 (0.0%) |
| Total (Category) | 0 (0.0%) | 0 (0.0%) |
| Total (Overall) | 310 (38.2%) | 501 (61.8%) |
Production, Transportation and Moving Occupations
The most common Production, Transportation and Moving occupations in Blue Jay are Production (147 | 18.1%), and Transportation (17 | 2.1%).
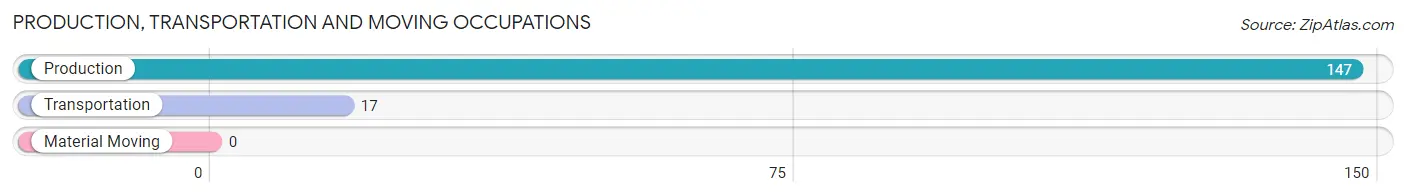
Production, Transportation and Moving Occupations by Sex
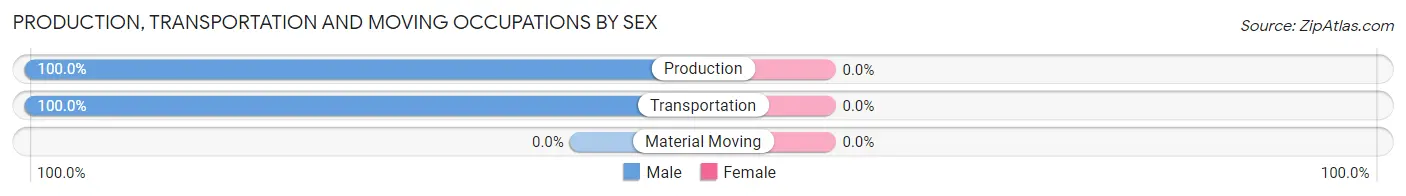
| Occupation | Male | Female |
| Production | 147 (100.0%) | 0 (0.0%) |
| Transportation | 17 (100.0%) | 0 (0.0%) |
| Material Moving | 0 (0.0%) | 0 (0.0%) |
| Total (Category) | 164 (100.0%) | 0 (0.0%) |
| Total (Overall) | 310 (38.2%) | 501 (61.8%) |
Employment Industries by Sex in Blue Jay
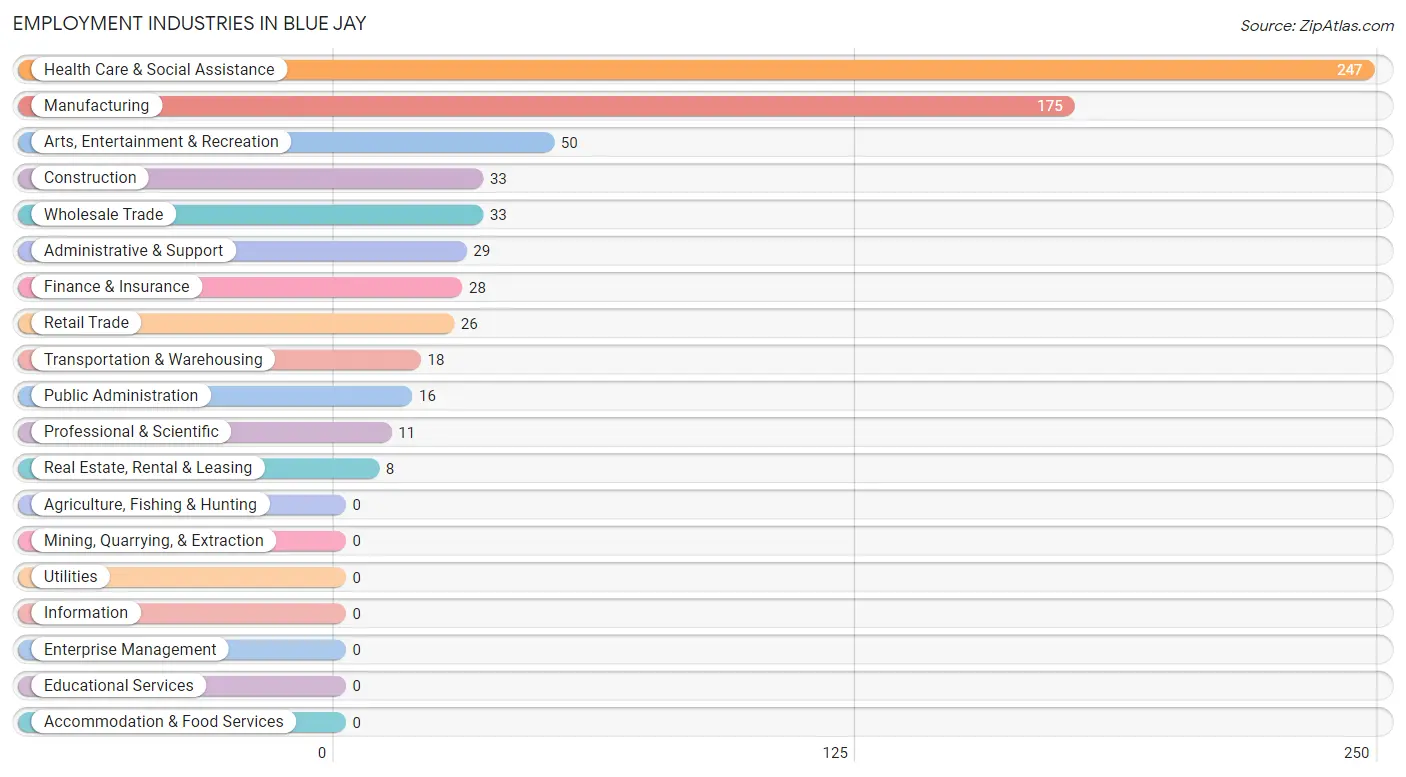
Employment Industries in Blue Jay
The major employment industries in Blue Jay include Health Care & Social Assistance (247 | 30.5%), Manufacturing (175 | 21.6%), Arts, Entertainment & Recreation (50 | 6.2%), Construction (33 | 4.1%), and Wholesale Trade (33 | 4.1%).
Employment Industries by Sex in Blue Jay
The Blue Jay industries that see more men than women are Transportation & Warehousing (100.0%), Real Estate, Rental & Leasing (100.0%), and Arts, Entertainment & Recreation (100.0%), whereas the industries that tend to have a higher number of women are Professional & Scientific (100.0%), Health Care & Social Assistance (100.0%), and Public Administration (100.0%).
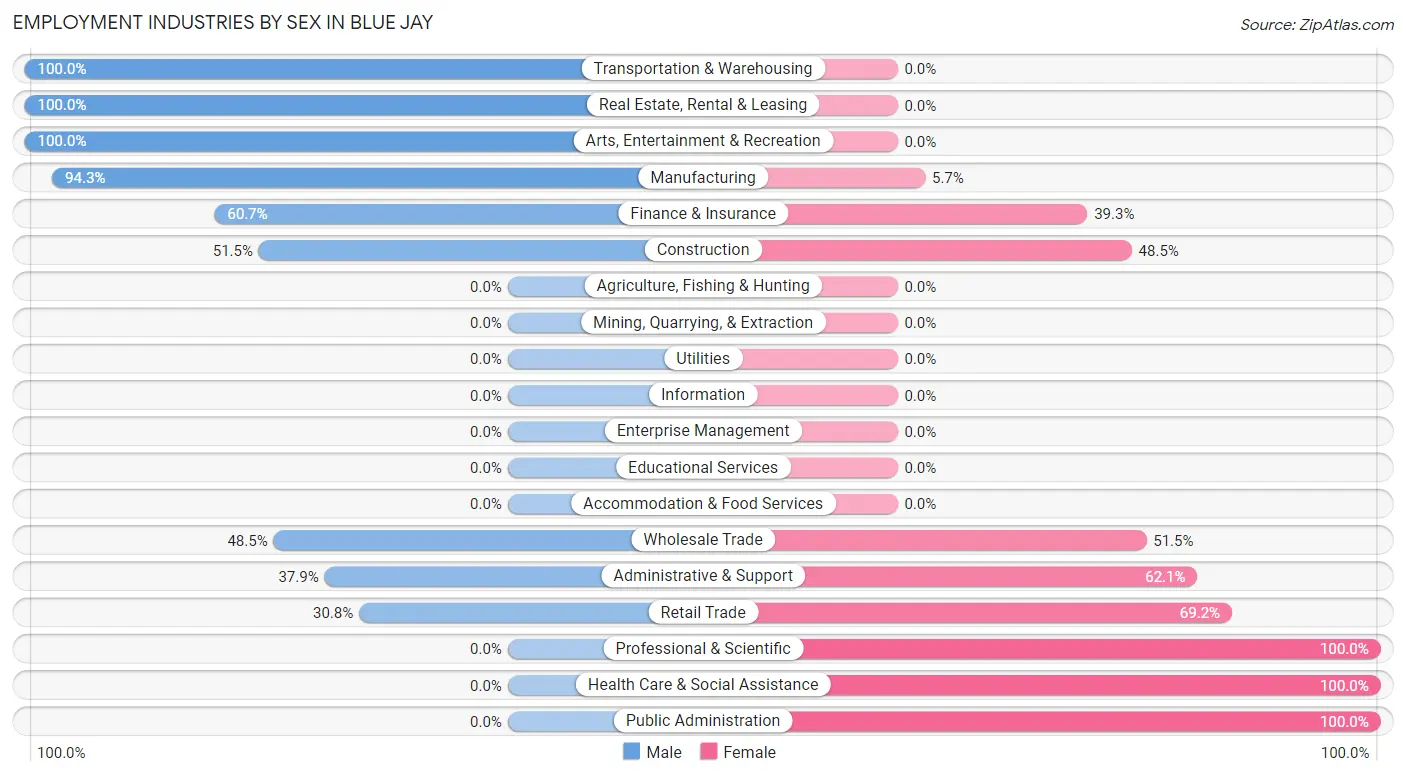
| Industry | Male | Female |
| Agriculture, Fishing & Hunting | 0 (0.0%) | 0 (0.0%) |
| Mining, Quarrying, & Extraction | 0 (0.0%) | 0 (0.0%) |
| Construction | 17 (51.5%) | 16 (48.5%) |
| Manufacturing | 165 (94.3%) | 10 (5.7%) |
| Wholesale Trade | 16 (48.5%) | 17 (51.5%) |
| Retail Trade | 8 (30.8%) | 18 (69.2%) |
| Transportation & Warehousing | 18 (100.0%) | 0 (0.0%) |
| Utilities | 0 (0.0%) | 0 (0.0%) |
| Information | 0 (0.0%) | 0 (0.0%) |
| Finance & Insurance | 17 (60.7%) | 11 (39.3%) |
| Real Estate, Rental & Leasing | 8 (100.0%) | 0 (0.0%) |
| Professional & Scientific | 0 (0.0%) | 11 (100.0%) |
| Enterprise Management | 0 (0.0%) | 0 (0.0%) |
| Administrative & Support | 11 (37.9%) | 18 (62.1%) |
| Educational Services | 0 (0.0%) | 0 (0.0%) |
| Health Care & Social Assistance | 0 (0.0%) | 247 (100.0%) |
| Arts, Entertainment & Recreation | 50 (100.0%) | 0 (0.0%) |
| Accommodation & Food Services | 0 (0.0%) | 0 (0.0%) |
| Public Administration | 0 (0.0%) | 16 (100.0%) |
| Total | 310 (38.2%) | 501 (61.8%) |
Education in Blue Jay
School Enrollment in Blue Jay
The most common levels of schooling among the 298 students in Blue Jay are elementary school (123 | 41.3%), nursery / preschool (57 | 19.1%), and college / undergraduate (54 | 18.1%).
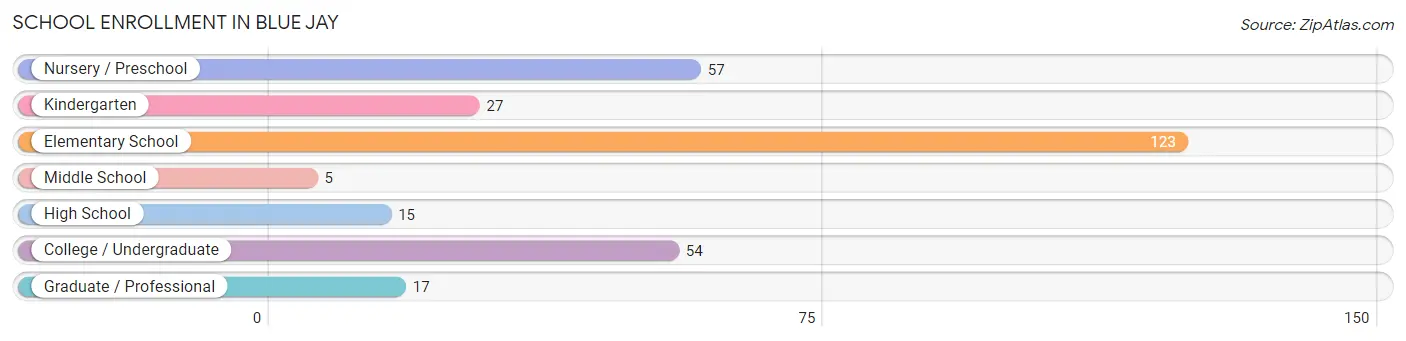
| School Level | # Students | % Students |
| Nursery / Preschool | 57 | 19.1% |
| Kindergarten | 27 | 9.1% |
| Elementary School | 123 | 41.3% |
| Middle School | 5 | 1.7% |
| High School | 15 | 5.0% |
| College / Undergraduate | 54 | 18.1% |
| Graduate / Professional | 17 | 5.7% |
| Total | 298 | 100.0% |
School Enrollment by Age by Funding Source in Blue Jay
Out of a total of 298 students who are enrolled in schools in Blue Jay, 123 (41.3%) attend a private institution, while the remaining 175 (58.7%) are enrolled in public schools. The age group of 3 to 4 year olds has the highest likelihood of being enrolled in private schools, with 57 (100.0% in the age bracket) enrolled. Conversely, the age group of 20 to 24 year olds has the lowest likelihood of being enrolled in a private school, with 34 (100.0% in the age bracket) attending a public institution.
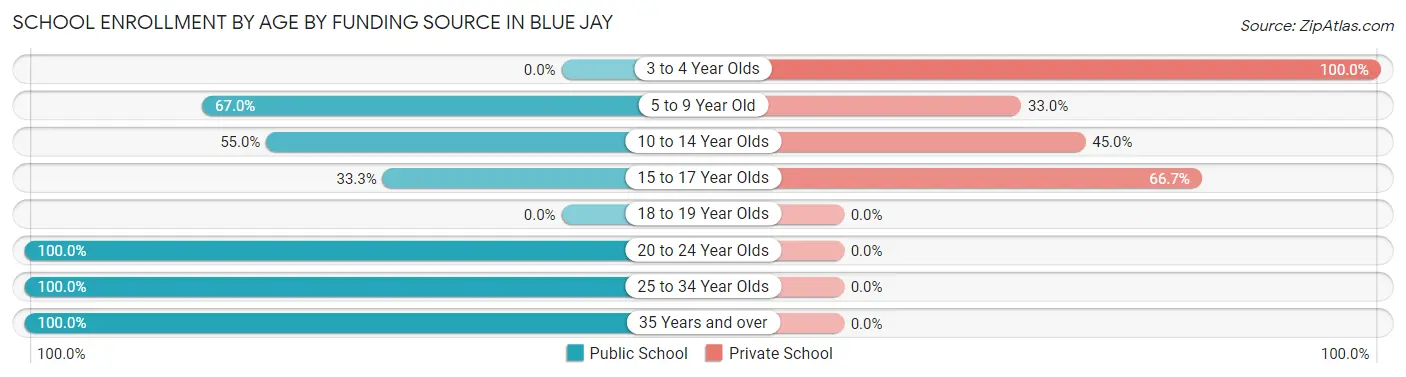
| Age Bracket | Public School | Private School |
| 3 to 4 Year Olds | 0 (0.0%) | 57 (100.0%) |
| 5 to 9 Year Old | 77 (67.0%) | 38 (33.0%) |
| 10 to 14 Year Olds | 22 (55.0%) | 18 (45.0%) |
| 15 to 17 Year Olds | 5 (33.3%) | 10 (66.7%) |
| 18 to 19 Year Olds | 0 (0.0%) | 0 (0.0%) |
| 20 to 24 Year Olds | 34 (100.0%) | 0 (0.0%) |
| 25 to 34 Year Olds | 20 (100.0%) | 0 (0.0%) |
| 35 Years and over | 17 (100.0%) | 0 (0.0%) |
| Total | 175 (58.7%) | 123 (41.3%) |
Educational Attainment by Field of Study in Blue Jay
Arts & humanities (102 | 31.7%), business (86 | 26.7%), bio, nature & agricultural (44 | 13.7%), science & technology (37 | 11.5%), and social sciences (17 | 5.3%) are the most common fields of study among 322 individuals in Blue Jay who have obtained a bachelor's degree or higher.
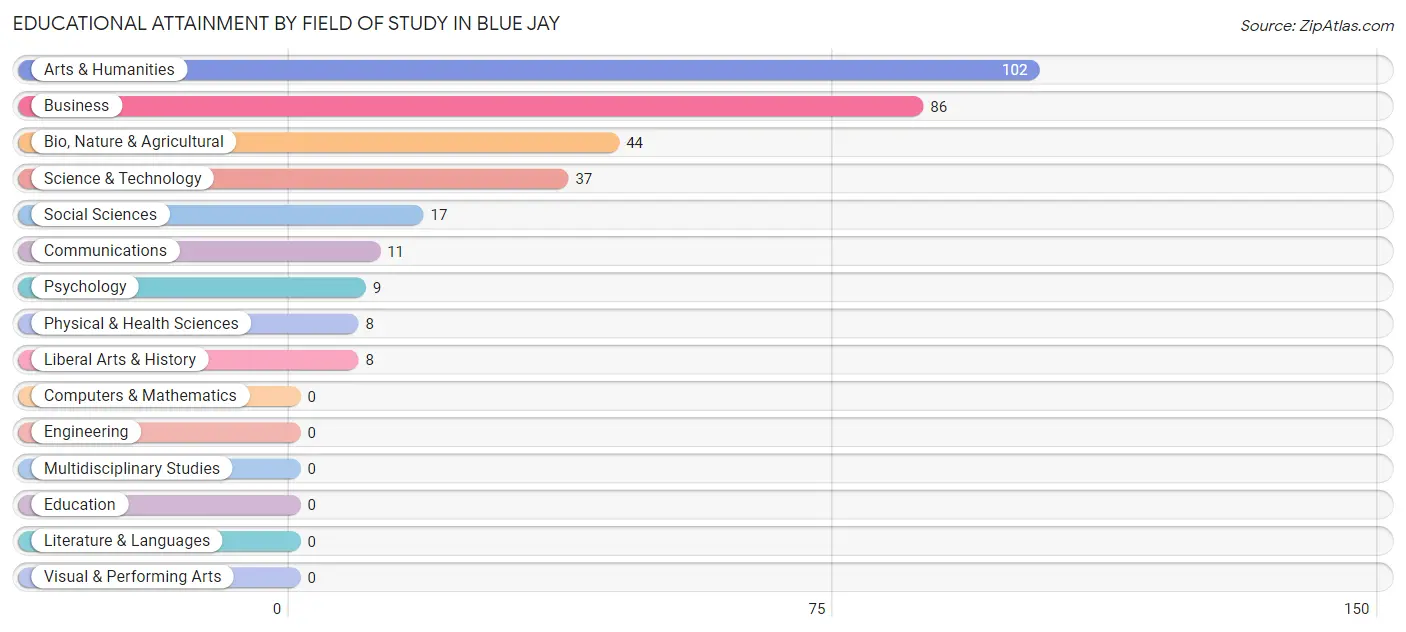
| Field of Study | # Graduates | % Graduates |
| Computers & Mathematics | 0 | 0.0% |
| Bio, Nature & Agricultural | 44 | 13.7% |
| Physical & Health Sciences | 8 | 2.5% |
| Psychology | 9 | 2.8% |
| Social Sciences | 17 | 5.3% |
| Engineering | 0 | 0.0% |
| Multidisciplinary Studies | 0 | 0.0% |
| Science & Technology | 37 | 11.5% |
| Business | 86 | 26.7% |
| Education | 0 | 0.0% |
| Literature & Languages | 0 | 0.0% |
| Liberal Arts & History | 8 | 2.5% |
| Visual & Performing Arts | 0 | 0.0% |
| Communications | 11 | 3.4% |
| Arts & Humanities | 102 | 31.7% |
| Total | 322 | 100.0% |
Transportation & Commute in Blue Jay
Vehicle Availability by Sex in Blue Jay
The most prevalent vehicle ownership categories in Blue Jay are males with 2 vehicles (208, accounting for 67.1%) and females with 2 vehicles (225, making up 41.5%).
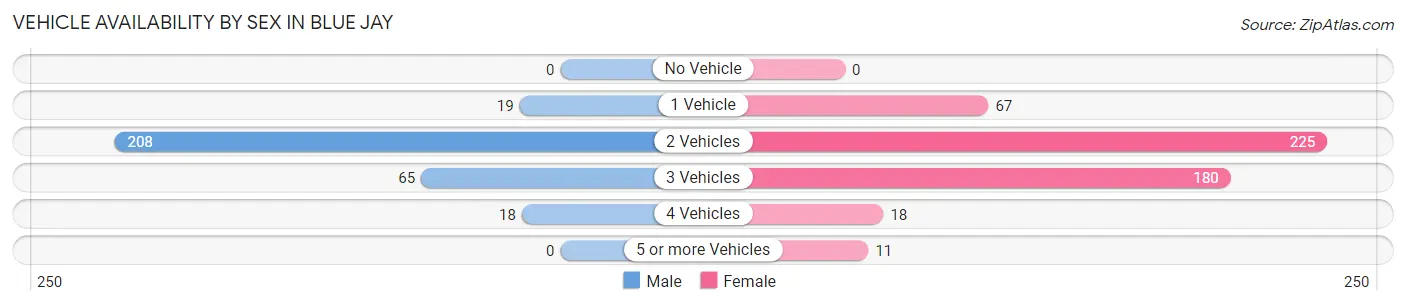
| Vehicles Available | Male | Female |
| No Vehicle | 0 (0.0%) | 0 (0.0%) |
| 1 Vehicle | 19 (6.1%) | 67 (13.4%) |
| 2 Vehicles | 208 (67.1%) | 225 (44.9%) |
| 3 Vehicles | 65 (21.0%) | 180 (35.9%) |
| 4 Vehicles | 18 (5.8%) | 18 (3.6%) |
| 5 or more Vehicles | 0 (0.0%) | 11 (2.2%) |
| Total | 310 (100.0%) | 501 (100.0%) |
Commute Time in Blue Jay
The most frequently occuring commute durations in Blue Jay are 30 to 34 minutes (176 commuters, 23.7%), 5 to 9 minutes (131 commuters, 17.6%), and 60 to 89 minutes (124 commuters, 16.7%).
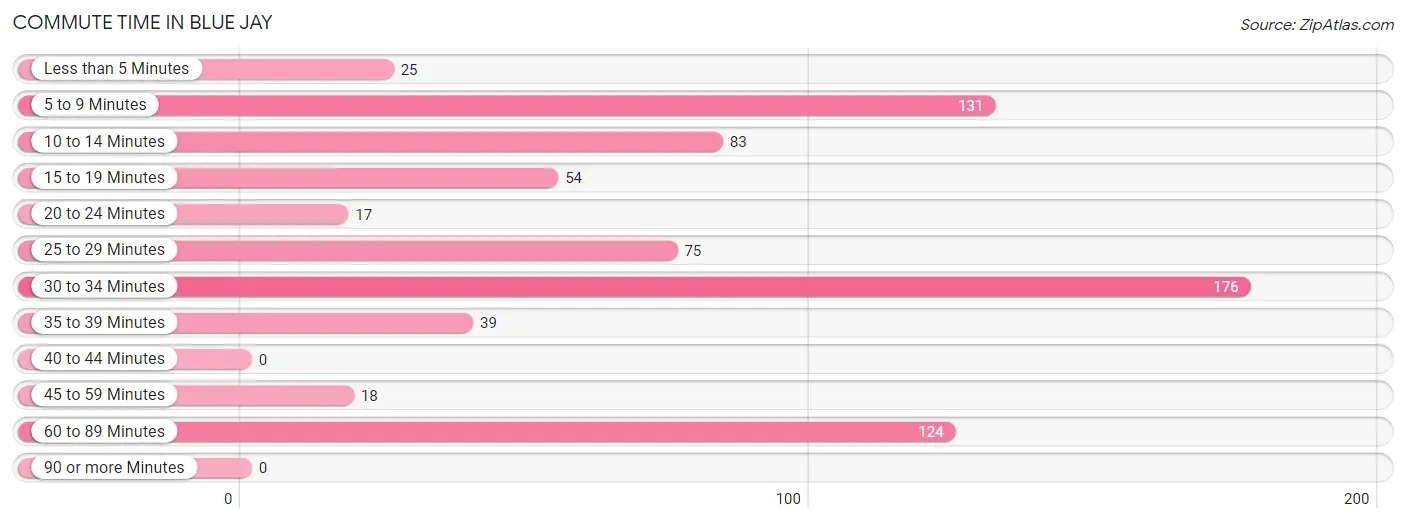
| Commute Time | # Commuters | % Commuters |
| Less than 5 Minutes | 25 | 3.4% |
| 5 to 9 Minutes | 131 | 17.6% |
| 10 to 14 Minutes | 83 | 11.2% |
| 15 to 19 Minutes | 54 | 7.3% |
| 20 to 24 Minutes | 17 | 2.3% |
| 25 to 29 Minutes | 75 | 10.1% |
| 30 to 34 Minutes | 176 | 23.7% |
| 35 to 39 Minutes | 39 | 5.3% |
| 40 to 44 Minutes | 0 | 0.0% |
| 45 to 59 Minutes | 18 | 2.4% |
| 60 to 89 Minutes | 124 | 16.7% |
| 90 or more Minutes | 0 | 0.0% |
Commute Time by Sex in Blue Jay
The most common commute times in Blue Jay are 5 to 9 minutes (117 commuters, 41.5%) for males and 30 to 34 minutes (140 commuters, 30.4%) for females.
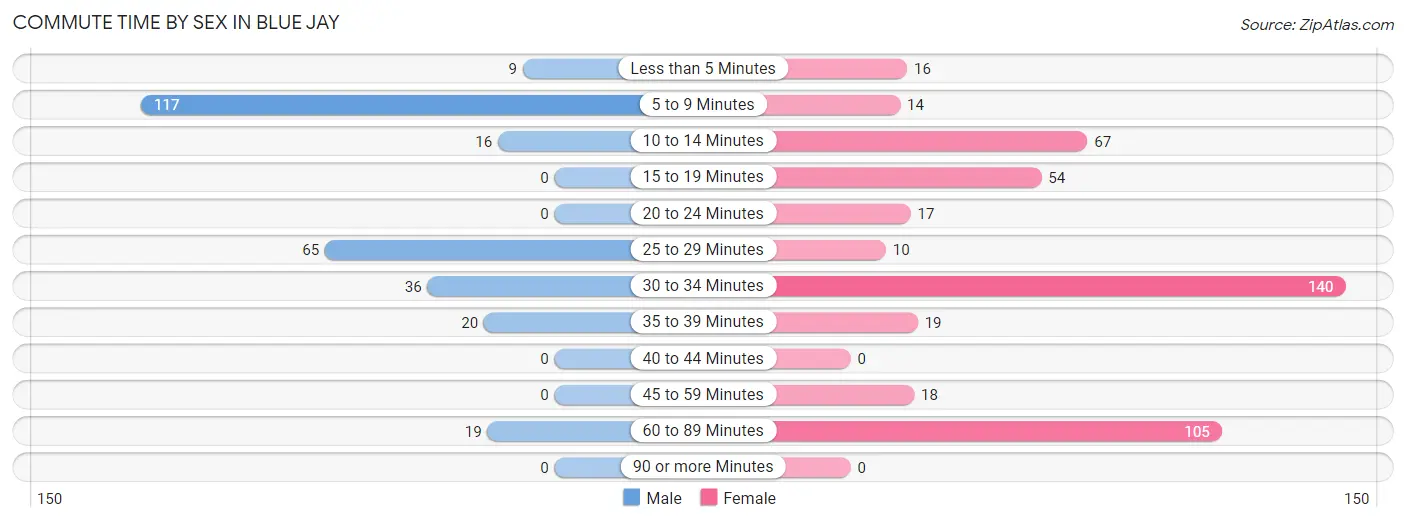
| Commute Time | Male | Female |
| Less than 5 Minutes | 9 (3.2%) | 16 (3.5%) |
| 5 to 9 Minutes | 117 (41.5%) | 14 (3.0%) |
| 10 to 14 Minutes | 16 (5.7%) | 67 (14.6%) |
| 15 to 19 Minutes | 0 (0.0%) | 54 (11.7%) |
| 20 to 24 Minutes | 0 (0.0%) | 17 (3.7%) |
| 25 to 29 Minutes | 65 (23.1%) | 10 (2.2%) |
| 30 to 34 Minutes | 36 (12.8%) | 140 (30.4%) |
| 35 to 39 Minutes | 20 (7.1%) | 19 (4.1%) |
| 40 to 44 Minutes | 0 (0.0%) | 0 (0.0%) |
| 45 to 59 Minutes | 0 (0.0%) | 18 (3.9%) |
| 60 to 89 Minutes | 19 (6.7%) | 105 (22.8%) |
| 90 or more Minutes | 0 (0.0%) | 0 (0.0%) |
Time of Departure to Work by Sex in Blue Jay
The most frequent times of departure to work in Blue Jay are 7:00 AM to 7:29 AM (100, 35.5%) for males and 8:00 AM to 8:29 AM (107, 23.3%) for females.
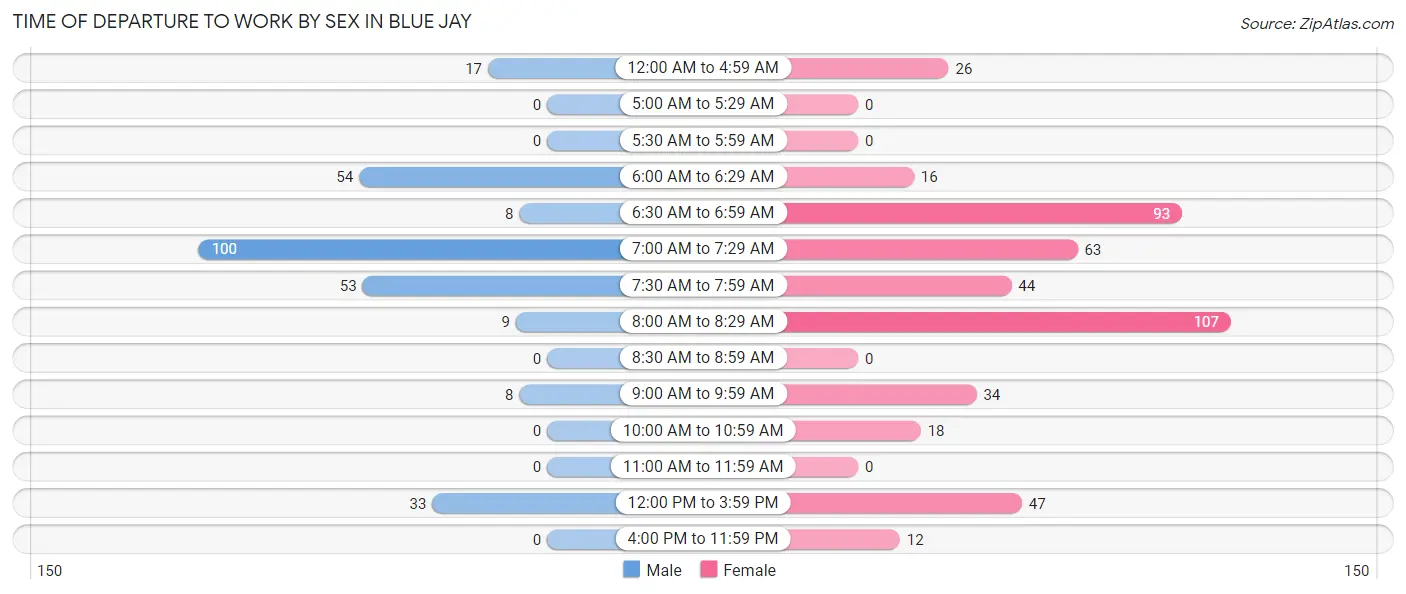
| Time of Departure | Male | Female |
| 12:00 AM to 4:59 AM | 17 (6.0%) | 26 (5.7%) |
| 5:00 AM to 5:29 AM | 0 (0.0%) | 0 (0.0%) |
| 5:30 AM to 5:59 AM | 0 (0.0%) | 0 (0.0%) |
| 6:00 AM to 6:29 AM | 54 (19.2%) | 16 (3.5%) |
| 6:30 AM to 6:59 AM | 8 (2.8%) | 93 (20.2%) |
| 7:00 AM to 7:29 AM | 100 (35.5%) | 63 (13.7%) |
| 7:30 AM to 7:59 AM | 53 (18.8%) | 44 (9.6%) |
| 8:00 AM to 8:29 AM | 9 (3.2%) | 107 (23.3%) |
| 8:30 AM to 8:59 AM | 0 (0.0%) | 0 (0.0%) |
| 9:00 AM to 9:59 AM | 8 (2.8%) | 34 (7.4%) |
| 10:00 AM to 10:59 AM | 0 (0.0%) | 18 (3.9%) |
| 11:00 AM to 11:59 AM | 0 (0.0%) | 0 (0.0%) |
| 12:00 PM to 3:59 PM | 33 (11.7%) | 47 (10.2%) |
| 4:00 PM to 11:59 PM | 0 (0.0%) | 12 (2.6%) |
| Total | 282 (100.0%) | 460 (100.0%) |
Housing Occupancy in Blue Jay
Occupancy by Ownership in Blue Jay
Of the total 640 dwellings in Blue Jay, owner-occupied units account for 572 (89.4%), while renter-occupied units make up 68 (10.6%).
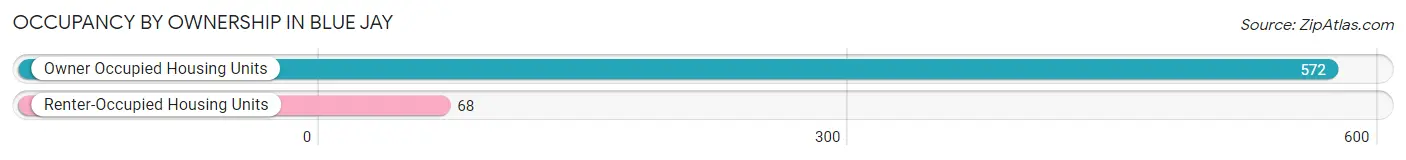
| Occupancy | # Housing Units | % Housing Units |
| Owner Occupied Housing Units | 572 | 89.4% |
| Renter-Occupied Housing Units | 68 | 10.6% |
| Total Occupied Housing Units | 640 | 100.0% |
Occupancy by Household Size in Blue Jay
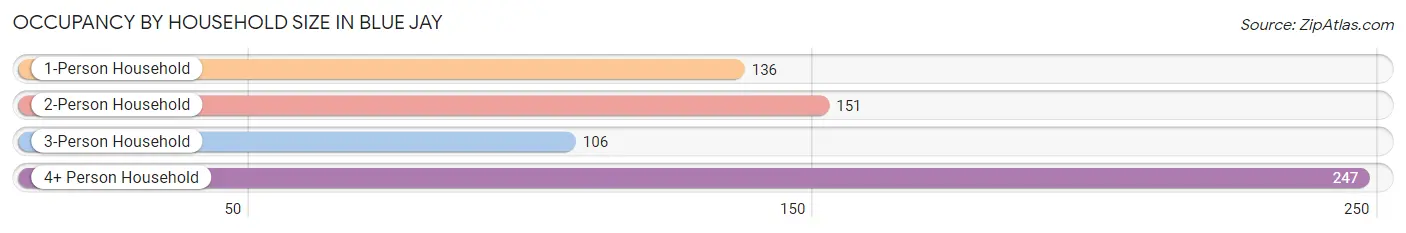
| Household Size | # Housing Units | % Housing Units |
| 1-Person Household | 136 | 21.2% |
| 2-Person Household | 151 | 23.6% |
| 3-Person Household | 106 | 16.6% |
| 4+ Person Household | 247 | 38.6% |
| Total Housing Units | 640 | 100.0% |
Occupancy by Ownership by Household Size in Blue Jay
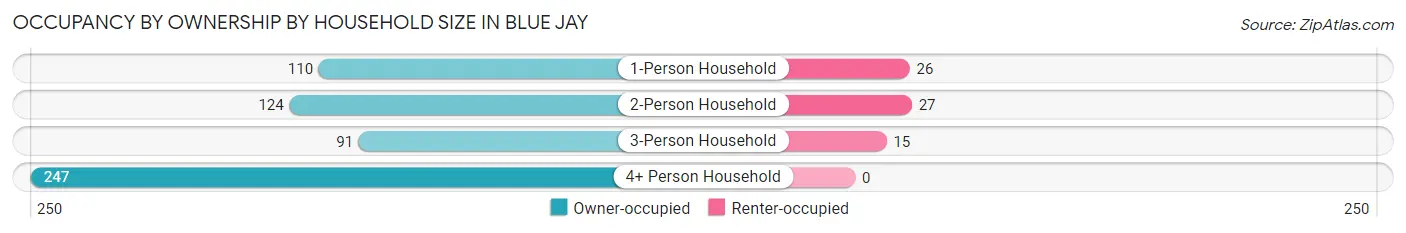
| Household Size | Owner-occupied | Renter-occupied |
| 1-Person Household | 110 (80.9%) | 26 (19.1%) |
| 2-Person Household | 124 (82.1%) | 27 (17.9%) |
| 3-Person Household | 91 (85.9%) | 15 (14.1%) |
| 4+ Person Household | 247 (100.0%) | 0 (0.0%) |
| Total Housing Units | 572 (89.4%) | 68 (10.6%) |
Occupancy by Educational Attainment in Blue Jay
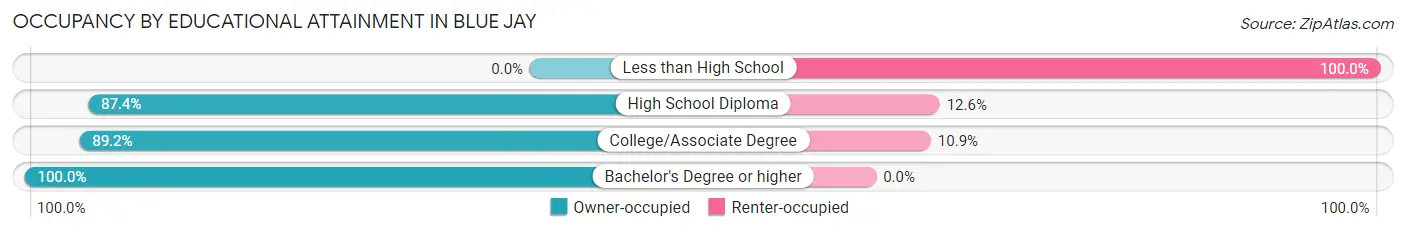
| Household Size | Owner-occupied | Renter-occupied |
| Less than High School | 0 (0.0%) | 23 (100.0%) |
| High School Diploma | 215 (87.4%) | 31 (12.6%) |
| College/Associate Degree | 115 (89.1%) | 14 (10.8%) |
| Bachelor's Degree or higher | 242 (100.0%) | 0 (0.0%) |
Occupancy by Age of Householder in Blue Jay
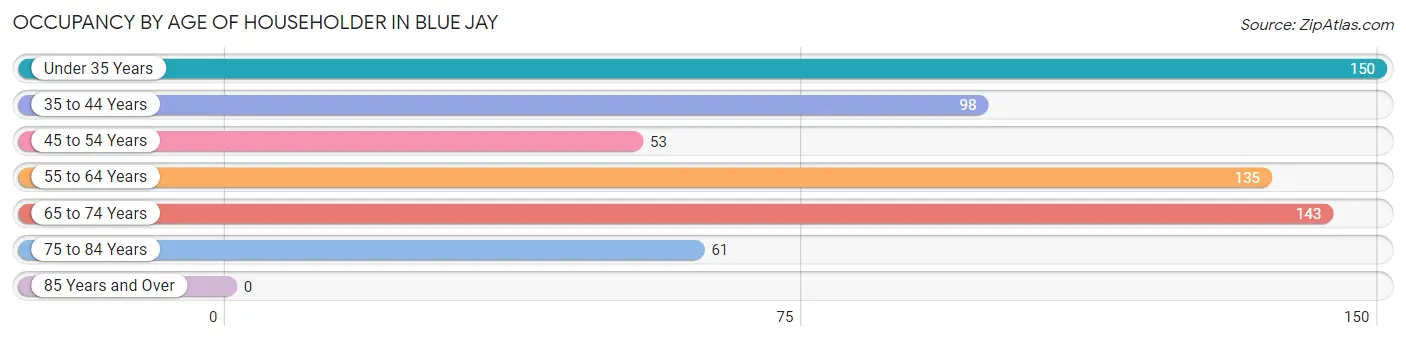
| Age Bracket | # Households | % Households |
| Under 35 Years | 150 | 23.4% |
| 35 to 44 Years | 98 | 15.3% |
| 45 to 54 Years | 53 | 8.3% |
| 55 to 64 Years | 135 | 21.1% |
| 65 to 74 Years | 143 | 22.3% |
| 75 to 84 Years | 61 | 9.5% |
| 85 Years and Over | 0 | 0.0% |
| Total | 640 | 100.0% |
Housing Finances in Blue Jay
Median Income by Occupancy in Blue Jay
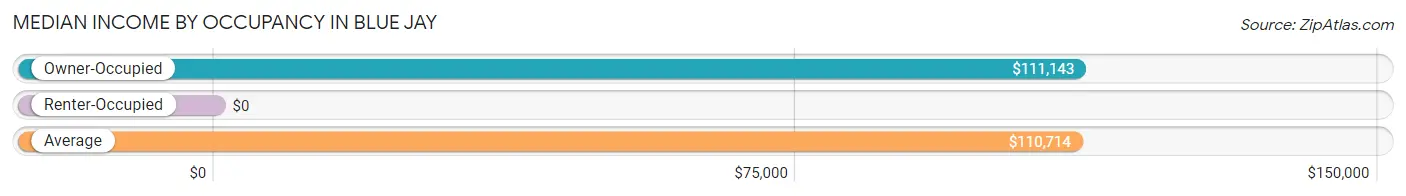
| Occupancy Type | # Households | Median Income |
| Owner-Occupied | 572 (89.4%) | $111,143 |
| Renter-Occupied | 68 (10.6%) | $0 |
| Average | 640 (100.0%) | $110,714 |
Occupancy by Householder Income Bracket in Blue Jay
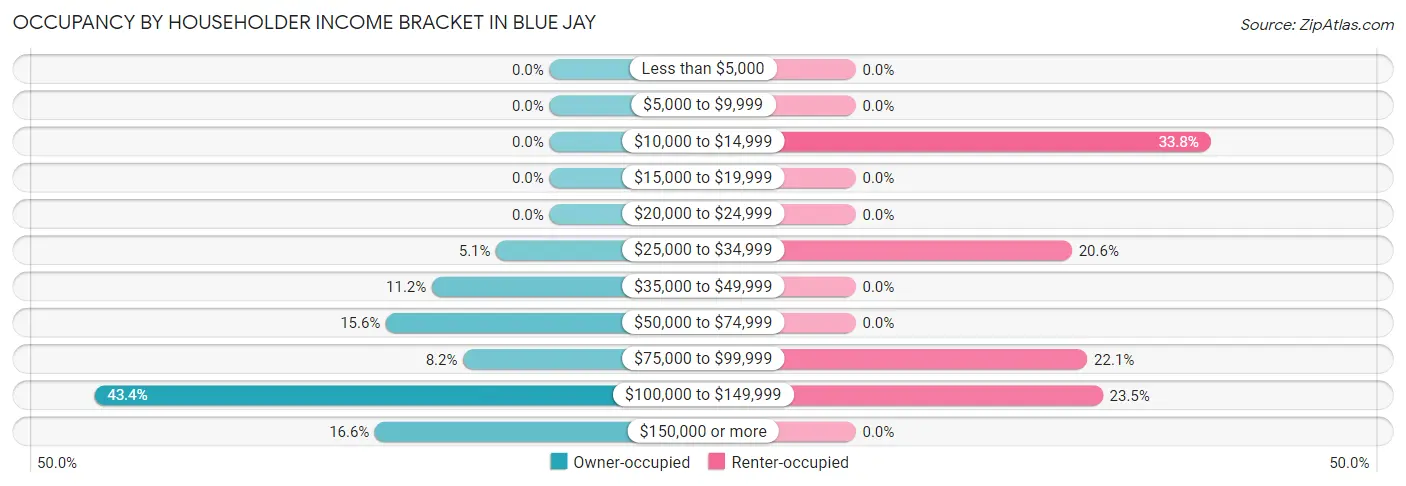
| Income Bracket | Owner-occupied | Renter-occupied |
| Less than $5,000 | 0 (0.0%) | 0 (0.0%) |
| $5,000 to $9,999 | 0 (0.0%) | 0 (0.0%) |
| $10,000 to $14,999 | 0 (0.0%) | 23 (33.8%) |
| $15,000 to $19,999 | 0 (0.0%) | 0 (0.0%) |
| $20,000 to $24,999 | 0 (0.0%) | 0 (0.0%) |
| $25,000 to $34,999 | 29 (5.1%) | 14 (20.6%) |
| $35,000 to $49,999 | 64 (11.2%) | 0 (0.0%) |
| $50,000 to $74,999 | 89 (15.6%) | 0 (0.0%) |
| $75,000 to $99,999 | 47 (8.2%) | 15 (22.1%) |
| $100,000 to $149,999 | 248 (43.4%) | 16 (23.5%) |
| $150,000 or more | 95 (16.6%) | 0 (0.0%) |
| Total | 572 (100.0%) | 68 (100.0%) |
Monthly Housing Cost Tiers in Blue Jay
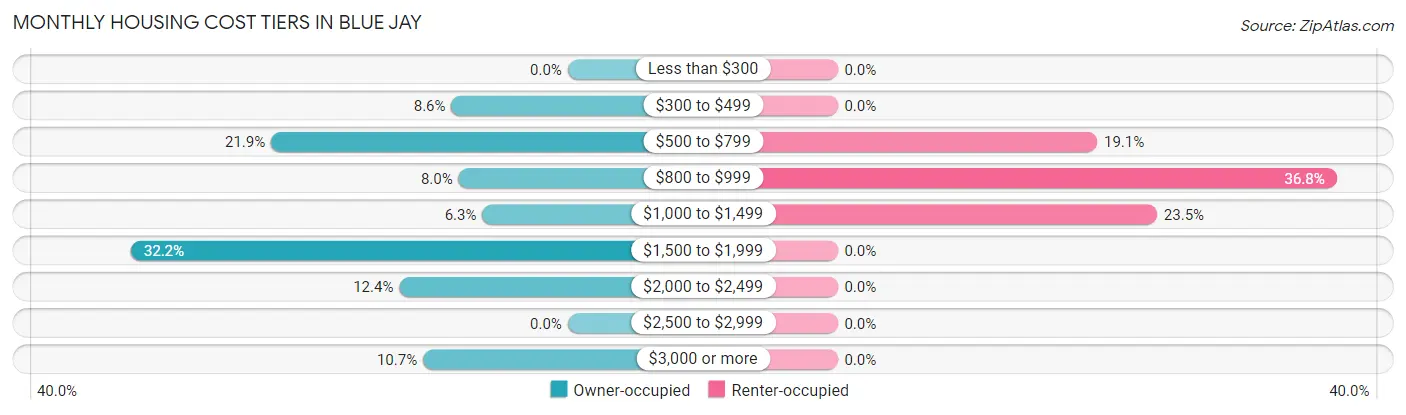
| Monthly Cost | Owner-occupied | Renter-occupied |
| Less than $300 | 0 (0.0%) | 0 (0.0%) |
| $300 to $499 | 49 (8.6%) | 0 (0.0%) |
| $500 to $799 | 125 (21.8%) | 13 (19.1%) |
| $800 to $999 | 46 (8.0%) | 25 (36.8%) |
| $1,000 to $1,499 | 36 (6.3%) | 16 (23.5%) |
| $1,500 to $1,999 | 184 (32.2%) | 0 (0.0%) |
| $2,000 to $2,499 | 71 (12.4%) | 0 (0.0%) |
| $2,500 to $2,999 | 0 (0.0%) | 0 (0.0%) |
| $3,000 or more | 61 (10.7%) | 0 (0.0%) |
| Total | 572 (100.0%) | 68 (100.0%) |
Physical Housing Characteristics in Blue Jay
Housing Structures in Blue Jay
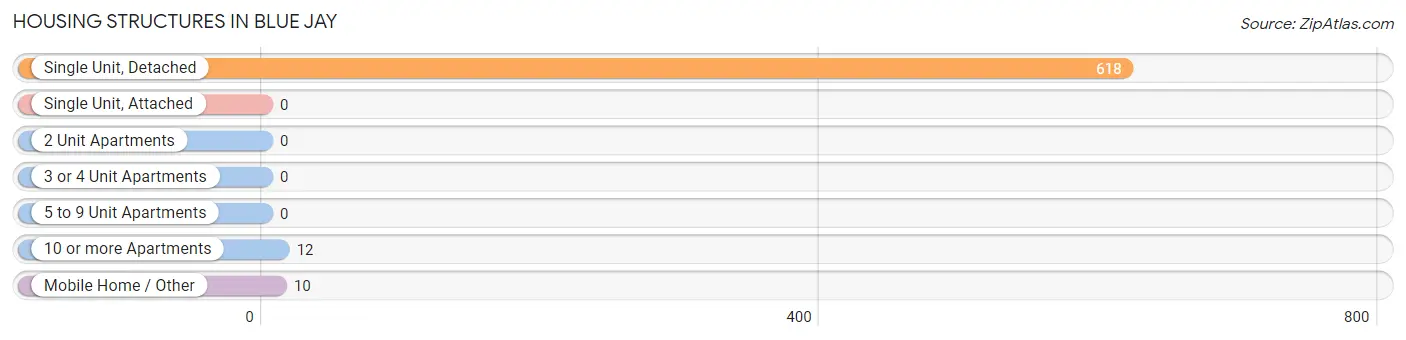
| Structure Type | # Housing Units | % Housing Units |
| Single Unit, Detached | 618 | 96.6% |
| Single Unit, Attached | 0 | 0.0% |
| 2 Unit Apartments | 0 | 0.0% |
| 3 or 4 Unit Apartments | 0 | 0.0% |
| 5 to 9 Unit Apartments | 0 | 0.0% |
| 10 or more Apartments | 12 | 1.9% |
| Mobile Home / Other | 10 | 1.6% |
| Total | 640 | 100.0% |
Housing Structures by Occupancy in Blue Jay
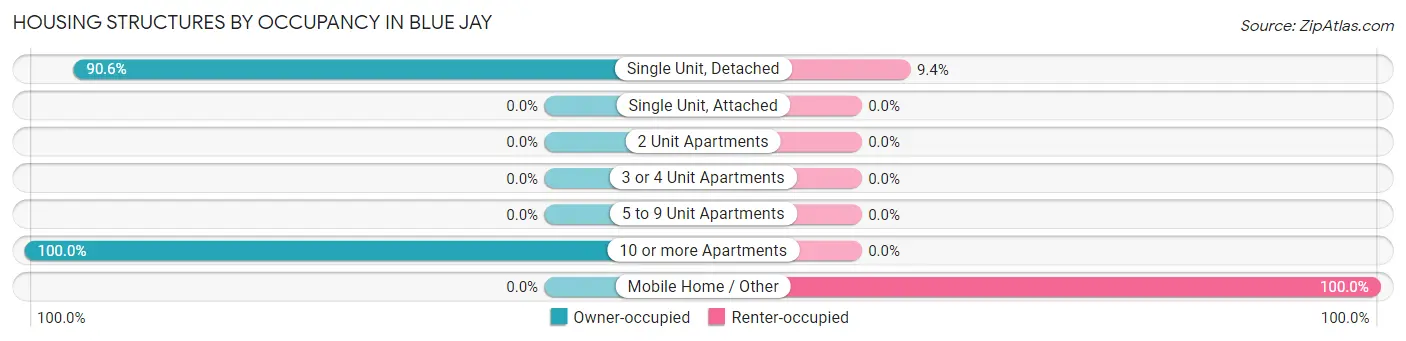
| Structure Type | Owner-occupied | Renter-occupied |
| Single Unit, Detached | 560 (90.6%) | 58 (9.4%) |
| Single Unit, Attached | 0 (0.0%) | 0 (0.0%) |
| 2 Unit Apartments | 0 (0.0%) | 0 (0.0%) |
| 3 or 4 Unit Apartments | 0 (0.0%) | 0 (0.0%) |
| 5 to 9 Unit Apartments | 0 (0.0%) | 0 (0.0%) |
| 10 or more Apartments | 12 (100.0%) | 0 (0.0%) |
| Mobile Home / Other | 0 (0.0%) | 10 (100.0%) |
| Total | 572 (89.4%) | 68 (10.6%) |
Housing Structures by Number of Rooms in Blue Jay
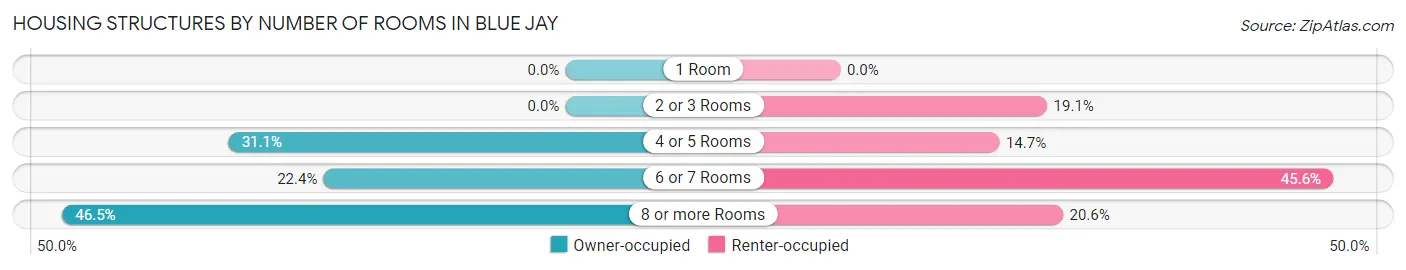
| Number of Rooms | Owner-occupied | Renter-occupied |
| 1 Room | 0 (0.0%) | 0 (0.0%) |
| 2 or 3 Rooms | 0 (0.0%) | 13 (19.1%) |
| 4 or 5 Rooms | 178 (31.1%) | 10 (14.7%) |
| 6 or 7 Rooms | 128 (22.4%) | 31 (45.6%) |
| 8 or more Rooms | 266 (46.5%) | 14 (20.6%) |
| Total | 572 (100.0%) | 68 (100.0%) |
Housing Structure by Heating Type in Blue Jay
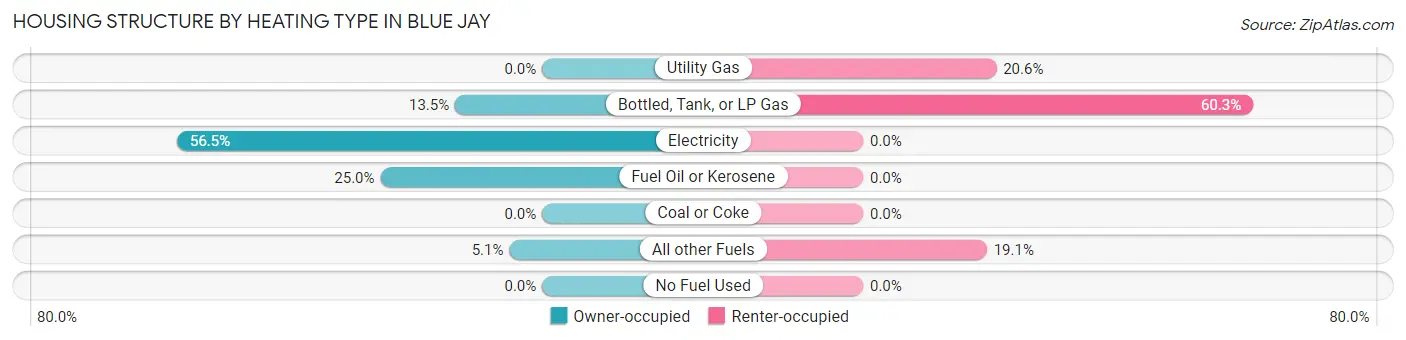
| Heating Type | Owner-occupied | Renter-occupied |
| Utility Gas | 0 (0.0%) | 14 (20.6%) |
| Bottled, Tank, or LP Gas | 77 (13.5%) | 41 (60.3%) |
| Electricity | 323 (56.5%) | 0 (0.0%) |
| Fuel Oil or Kerosene | 143 (25.0%) | 0 (0.0%) |
| Coal or Coke | 0 (0.0%) | 0 (0.0%) |
| All other Fuels | 29 (5.1%) | 13 (19.1%) |
| No Fuel Used | 0 (0.0%) | 0 (0.0%) |
| Total | 572 (100.0%) | 68 (100.0%) |
Household Vehicle Usage in Blue Jay
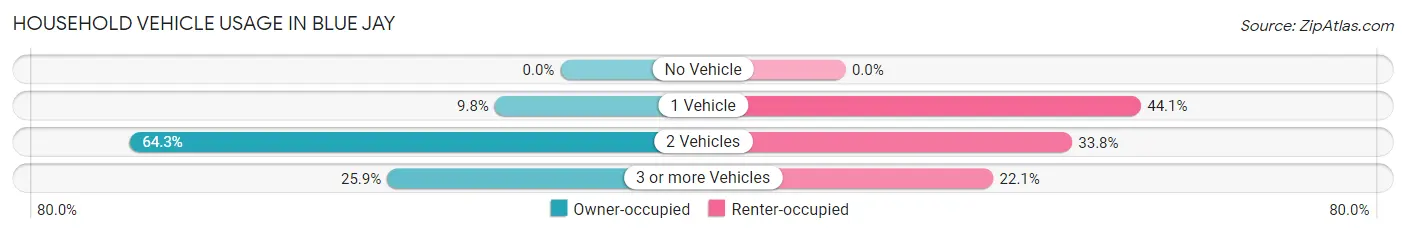
| Vehicles per Household | Owner-occupied | Renter-occupied |
| No Vehicle | 0 (0.0%) | 0 (0.0%) |
| 1 Vehicle | 56 (9.8%) | 30 (44.1%) |
| 2 Vehicles | 368 (64.3%) | 23 (33.8%) |
| 3 or more Vehicles | 148 (25.9%) | 15 (22.1%) |
| Total | 572 (100.0%) | 68 (100.0%) |
Real Estate & Mortgages in Blue Jay
Real Estate and Mortgage Overview in Blue Jay
| Characteristic | Without Mortgage | With Mortgage |
| Housing Units | 208 | 364 |
| Median Property Value | $170,600 | $267,600 |
| Median Household Income | $66,600 | $89 |
| Monthly Housing Costs | $669 | $61 |
| Real Estate Taxes | $4,381 | $0 |
Property Value by Mortgage Status in Blue Jay
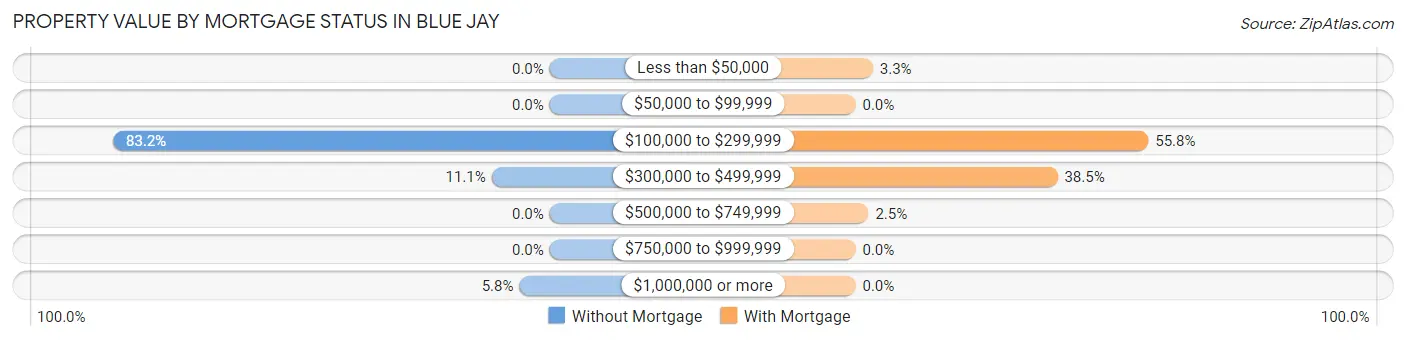
| Property Value | Without Mortgage | With Mortgage |
| Less than $50,000 | 0 (0.0%) | 12 (3.3%) |
| $50,000 to $99,999 | 0 (0.0%) | 0 (0.0%) |
| $100,000 to $299,999 | 173 (83.2%) | 203 (55.8%) |
| $300,000 to $499,999 | 23 (11.1%) | 140 (38.5%) |
| $500,000 to $749,999 | 0 (0.0%) | 9 (2.5%) |
| $750,000 to $999,999 | 0 (0.0%) | 0 (0.0%) |
| $1,000,000 or more | 12 (5.8%) | 0 (0.0%) |
| Total | 208 (100.0%) | 364 (100.0%) |
Household Income by Mortgage Status in Blue Jay
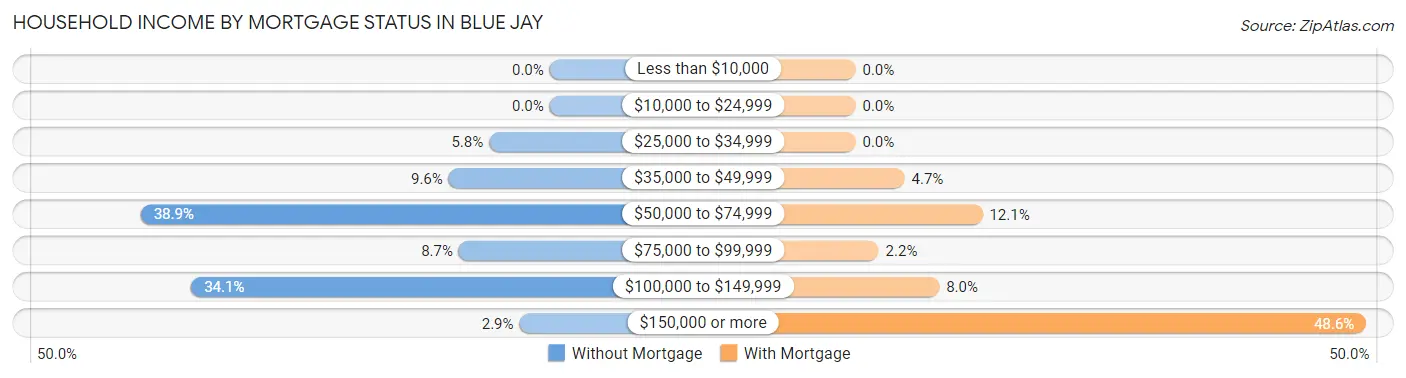
| Household Income | Without Mortgage | With Mortgage |
| Less than $10,000 | 0 (0.0%) | 0 (0.0%) |
| $10,000 to $24,999 | 0 (0.0%) | 0 (0.0%) |
| $25,000 to $34,999 | 12 (5.8%) | 0 (0.0%) |
| $35,000 to $49,999 | 20 (9.6%) | 17 (4.7%) |
| $50,000 to $74,999 | 81 (38.9%) | 44 (12.1%) |
| $75,000 to $99,999 | 18 (8.6%) | 8 (2.2%) |
| $100,000 to $149,999 | 71 (34.1%) | 29 (8.0%) |
| $150,000 or more | 6 (2.9%) | 177 (48.6%) |
| Total | 208 (100.0%) | 364 (100.0%) |
Property Value to Household Income Ratio in Blue Jay
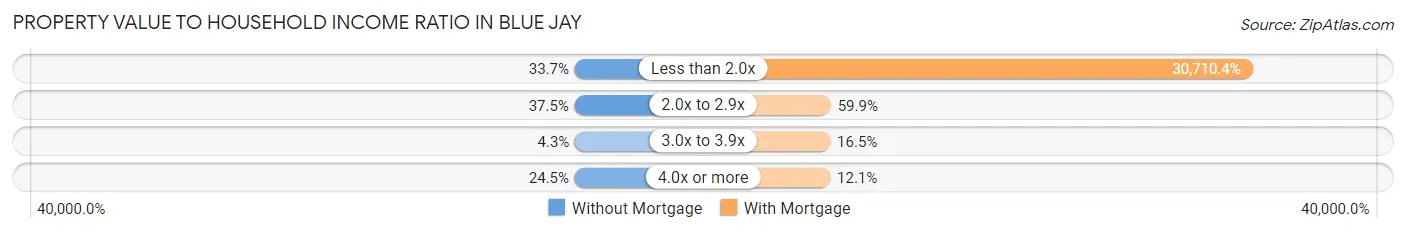
| Value-to-Income Ratio | Without Mortgage | With Mortgage |
| Less than 2.0x | 70 (33.7%) | 111,786 (30,710.4%) |
| 2.0x to 2.9x | 78 (37.5%) | 218 (59.9%) |
| 3.0x to 3.9x | 9 (4.3%) | 60 (16.5%) |
| 4.0x or more | 51 (24.5%) | 44 (12.1%) |
| Total | 208 (100.0%) | 364 (100.0%) |
Real Estate Taxes by Mortgage Status in Blue Jay
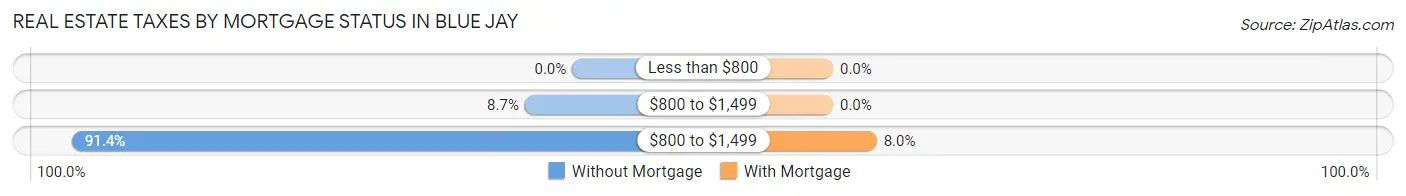
| Property Taxes | Without Mortgage | With Mortgage |
| Less than $800 | 0 (0.0%) | 0 (0.0%) |
| $800 to $1,499 | 18 (8.6%) | 0 (0.0%) |
| $800 to $1,499 | 190 (91.3%) | 29 (8.0%) |
| Total | 208 (100.0%) | 364 (100.0%) |
Health & Disability in Blue Jay
Health Insurance Coverage by Age in Blue Jay
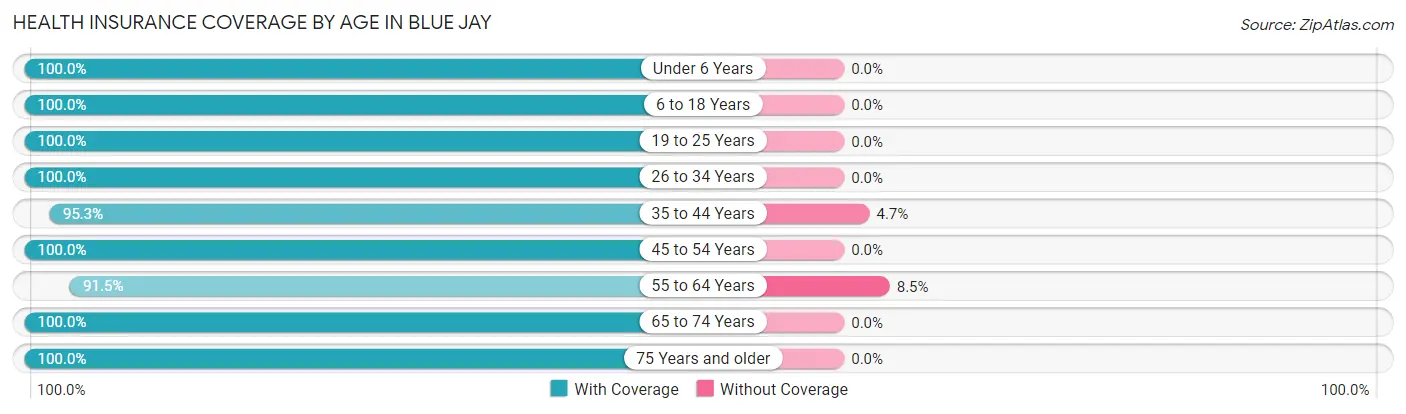
| Age Bracket | With Coverage | Without Coverage |
| Under 6 Years | 414 (100.0%) | 0 (0.0%) |
| 6 to 18 Years | 143 (100.0%) | 0 (0.0%) |
| 19 to 25 Years | 34 (100.0%) | 0 (0.0%) |
| 26 to 34 Years | 261 (100.0%) | 0 (0.0%) |
| 35 to 44 Years | 263 (95.3%) | 13 (4.7%) |
| 45 to 54 Years | 141 (100.0%) | 0 (0.0%) |
| 55 to 64 Years | 205 (91.5%) | 19 (8.5%) |
| 65 to 74 Years | 218 (100.0%) | 0 (0.0%) |
| 75 Years and older | 104 (100.0%) | 0 (0.0%) |
| Total | 1,783 (98.2%) | 32 (1.8%) |
Health Insurance Coverage by Citizenship Status in Blue Jay
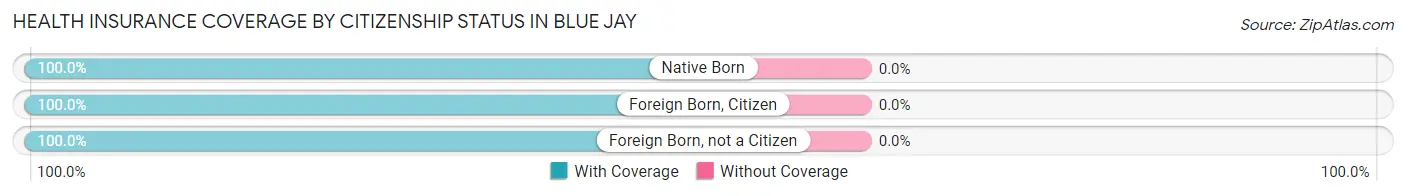
| Citizenship Status | With Coverage | Without Coverage |
| Native Born | 414 (100.0%) | 0 (0.0%) |
| Foreign Born, Citizen | 143 (100.0%) | 0 (0.0%) |
| Foreign Born, not a Citizen | 34 (100.0%) | 0 (0.0%) |
Health Insurance Coverage by Household Income in Blue Jay
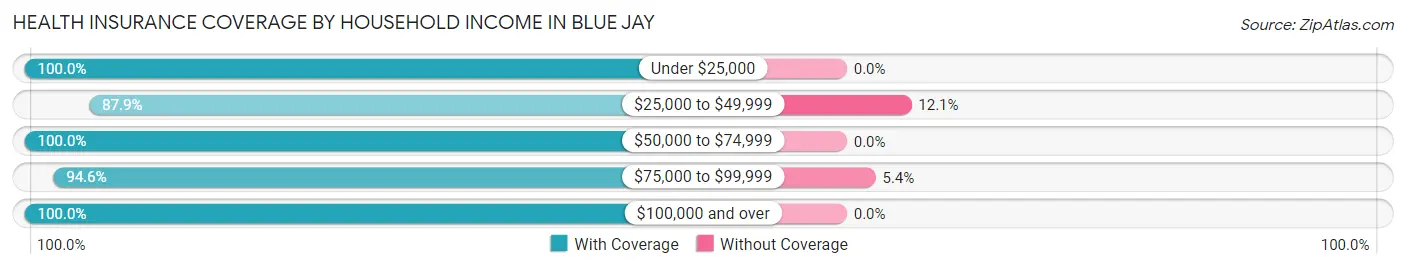
| Household Income | With Coverage | Without Coverage |
| Under $25,000 | 65 (100.0%) | 0 (0.0%) |
| $25,000 to $49,999 | 138 (87.9%) | 19 (12.1%) |
| $50,000 to $74,999 | 122 (100.0%) | 0 (0.0%) |
| $75,000 to $99,999 | 228 (94.6%) | 13 (5.4%) |
| $100,000 and over | 1,230 (100.0%) | 0 (0.0%) |
Public vs Private Health Insurance Coverage by Age in Blue Jay
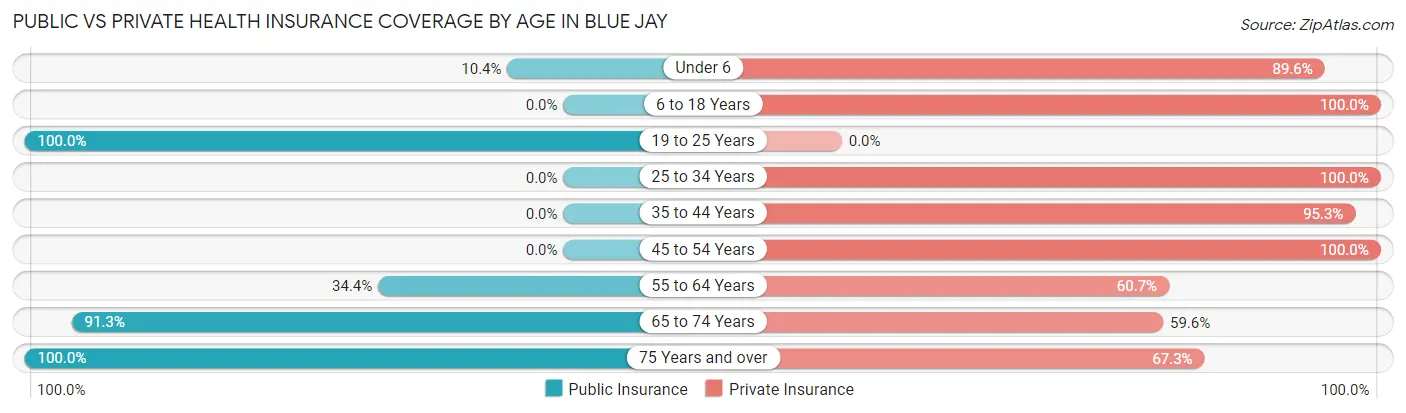
| Age Bracket | Public Insurance | Private Insurance |
| Under 6 | 43 (10.4%) | 371 (89.6%) |
| 6 to 18 Years | 0 (0.0%) | 143 (100.0%) |
| 19 to 25 Years | 34 (100.0%) | 0 (0.0%) |
| 25 to 34 Years | 0 (0.0%) | 261 (100.0%) |
| 35 to 44 Years | 0 (0.0%) | 263 (95.3%) |
| 45 to 54 Years | 0 (0.0%) | 141 (100.0%) |
| 55 to 64 Years | 77 (34.4%) | 136 (60.7%) |
| 65 to 74 Years | 199 (91.3%) | 130 (59.6%) |
| 75 Years and over | 104 (100.0%) | 70 (67.3%) |
| Total | 457 (25.2%) | 1,515 (83.5%) |
Disability Status by Sex by Age in Blue Jay
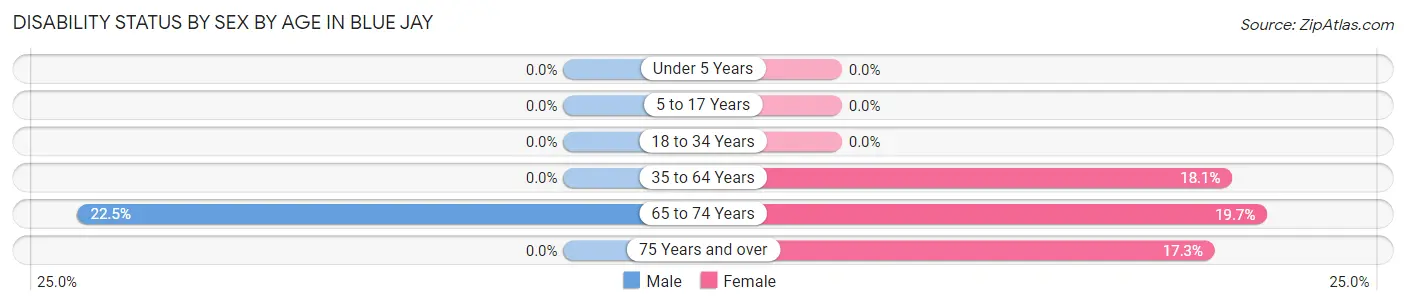
| Age Bracket | Male | Female |
| Under 5 Years | 0 (0.0%) | 0 (0.0%) |
| 5 to 17 Years | 0 (0.0%) | 0 (0.0%) |
| 18 to 34 Years | 0 (0.0%) | 0 (0.0%) |
| 35 to 64 Years | 0 (0.0%) | 56 (18.1%) |
| 65 to 74 Years | 32 (22.5%) | 15 (19.7%) |
| 75 Years and over | 0 (0.0%) | 9 (17.3%) |
Disability Class by Sex by Age in Blue Jay
Disability Class: Hearing Difficulty
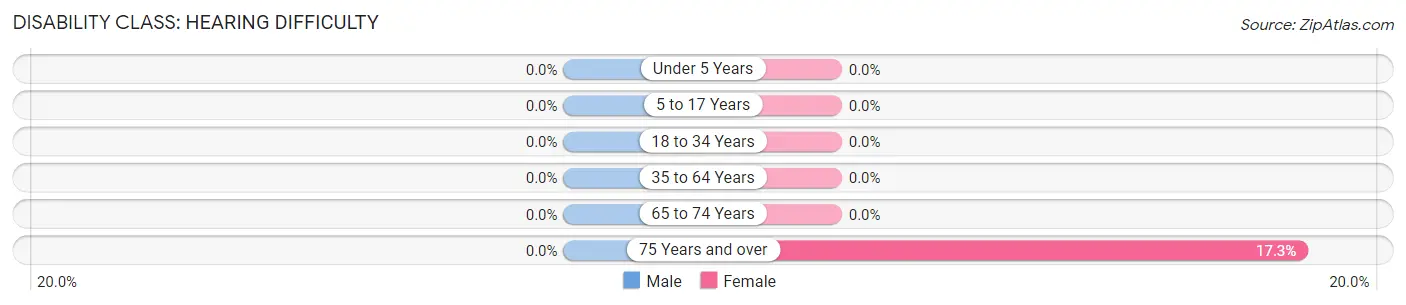
| Age Bracket | Male | Female |
| Under 5 Years | 0 (0.0%) | 0 (0.0%) |
| 5 to 17 Years | 0 (0.0%) | 0 (0.0%) |
| 18 to 34 Years | 0 (0.0%) | 0 (0.0%) |
| 35 to 64 Years | 0 (0.0%) | 0 (0.0%) |
| 65 to 74 Years | 0 (0.0%) | 0 (0.0%) |
| 75 Years and over | 0 (0.0%) | 9 (17.3%) |
Disability Class: Vision Difficulty
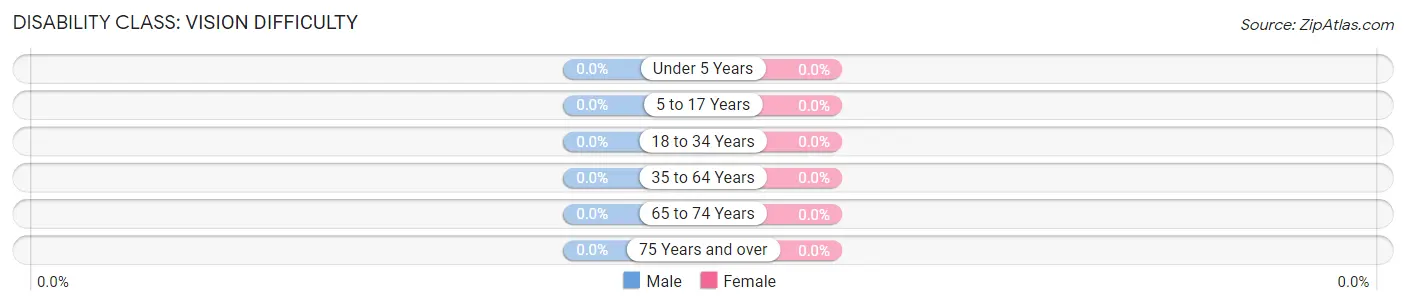
| Age Bracket | Male | Female |
| Under 5 Years | 0 (0.0%) | 0 (0.0%) |
| 5 to 17 Years | 0 (0.0%) | 0 (0.0%) |
| 18 to 34 Years | 0 (0.0%) | 0 (0.0%) |
| 35 to 64 Years | 0 (0.0%) | 0 (0.0%) |
| 65 to 74 Years | 0 (0.0%) | 0 (0.0%) |
| 75 Years and over | 0 (0.0%) | 0 (0.0%) |
Disability Class: Cognitive Difficulty
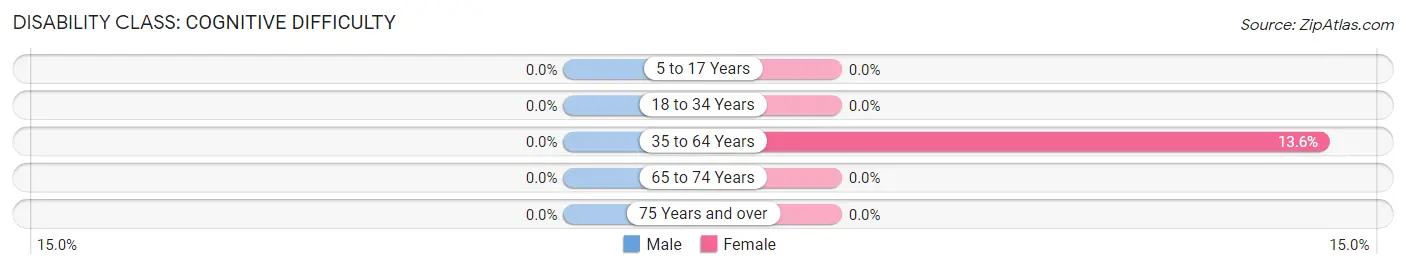
| Age Bracket | Male | Female |
| 5 to 17 Years | 0 (0.0%) | 0 (0.0%) |
| 18 to 34 Years | 0 (0.0%) | 0 (0.0%) |
| 35 to 64 Years | 0 (0.0%) | 42 (13.6%) |
| 65 to 74 Years | 0 (0.0%) | 0 (0.0%) |
| 75 Years and over | 0 (0.0%) | 0 (0.0%) |
Disability Class: Ambulatory Difficulty
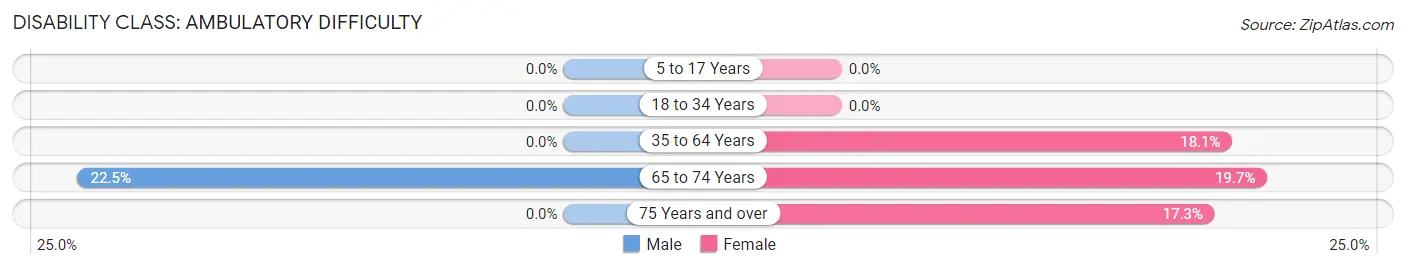
| Age Bracket | Male | Female |
| 5 to 17 Years | 0 (0.0%) | 0 (0.0%) |
| 18 to 34 Years | 0 (0.0%) | 0 (0.0%) |
| 35 to 64 Years | 0 (0.0%) | 56 (18.1%) |
| 65 to 74 Years | 32 (22.5%) | 15 (19.7%) |
| 75 Years and over | 0 (0.0%) | 9 (17.3%) |
Disability Class: Self-Care Difficulty
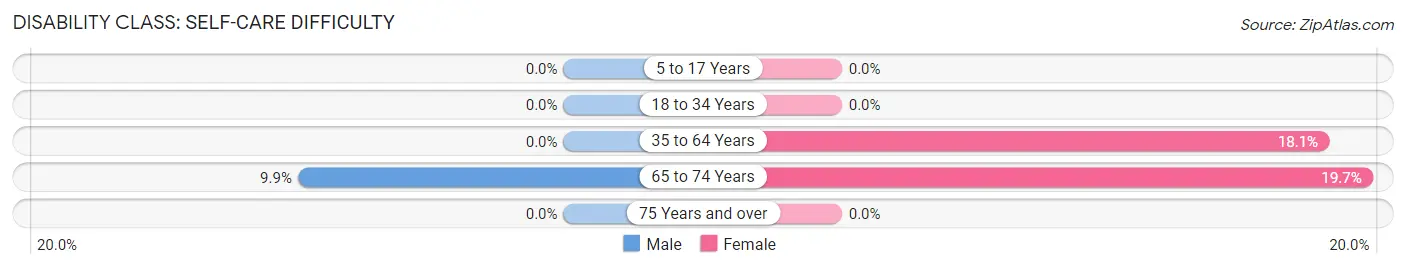
| Age Bracket | Male | Female |
| 5 to 17 Years | 0 (0.0%) | 0 (0.0%) |
| 18 to 34 Years | 0 (0.0%) | 0 (0.0%) |
| 35 to 64 Years | 0 (0.0%) | 56 (18.1%) |
| 65 to 74 Years | 14 (9.9%) | 15 (19.7%) |
| 75 Years and over | 0 (0.0%) | 0 (0.0%) |
Technology Access in Blue Jay
Computing Device Access in Blue Jay
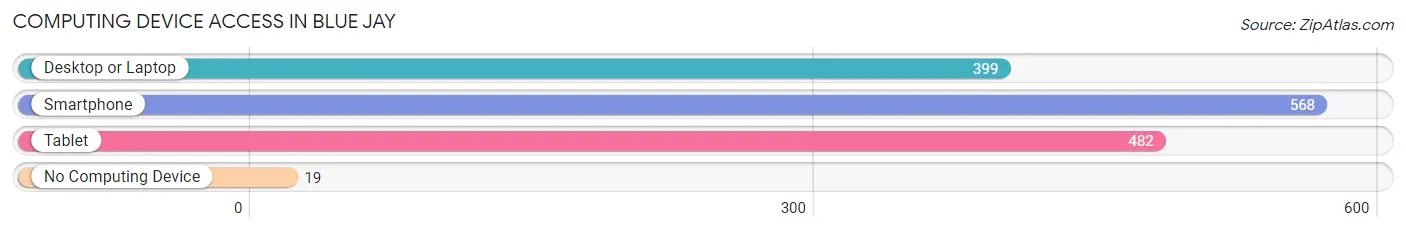
| Device Type | # Households | % Households |
| Desktop or Laptop | 399 | 62.3% |
| Smartphone | 568 | 88.7% |
| Tablet | 482 | 75.3% |
| No Computing Device | 19 | 3.0% |
| Total | 640 | 100.0% |
Internet Access in Blue Jay
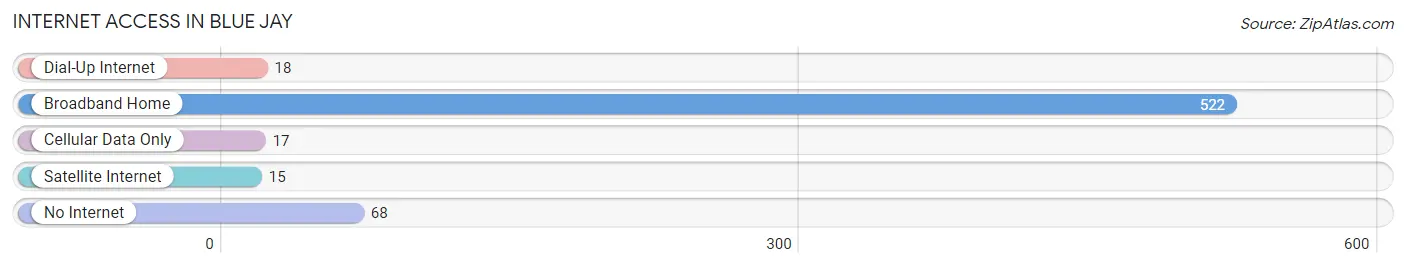
| Internet Type | # Households | % Households |
| Dial-Up Internet | 18 | 2.8% |
| Broadband Home | 522 | 81.6% |
| Cellular Data Only | 17 | 2.7% |
| Satellite Internet | 15 | 2.3% |
| No Internet | 68 | 10.6% |
| Total | 640 | 100.0% |
Blue Jay Summary
History
Blue Jay, Ohio is a small village located in the southeastern corner of the state, in the Appalachian foothills. It was founded in 1820 by a group of settlers from Pennsylvania, who were looking for a place to settle and start a new life. The village was named after the blue jay, a species of bird that is native to the area.
The first settlers in Blue Jay were mostly farmers, and the village quickly grew to become a thriving agricultural community. The village was home to a variety of crops, including corn, wheat, oats, and hay. The village also had a number of small businesses, including a general store, a blacksmith, and a sawmill.
In the late 19th century, the village began to experience a period of growth and prosperity. The railroad arrived in 1883, connecting Blue Jay to the larger cities of Cincinnati and Columbus. This allowed the village to become a hub for trade and commerce, and the population began to grow.
By the early 20th century, Blue Jay had become a popular tourist destination. The village was home to a number of resorts and hotels, as well as a variety of recreational activities. The village was also home to a number of churches, schools, and other civic organizations.
Geography
Blue Jay is located in the southeastern corner of Ohio, in the Appalachian foothills. The village is situated on the banks of the Little Miami River, and is surrounded by rolling hills and forests. The village is located approximately 30 miles east of Cincinnati, and is part of the Cincinnati metropolitan area.
The village has a total area of 0.6 square miles, all of which is land. The village is located at an elevation of 890 feet above sea level. The climate in Blue Jay is humid continental, with hot summers and cold winters.
Economy
The economy of Blue Jay is largely based on agriculture and tourism. The village is home to a number of farms, which produce a variety of crops, including corn, wheat, oats, and hay. The village is also home to a number of small businesses, including a general store, a blacksmith, and a sawmill.
The village is also a popular tourist destination, and is home to a number of resorts and hotels. The village is also home to a number of recreational activities, including fishing, hunting, and hiking.
Demographics
As of the 2010 census, the population of Blue Jay was 1,093. The village has a population density of 1,743 people per square mile. The median age in Blue Jay is 43.7 years, and the median household income is $41,250. The village is predominantly white, with 92.3% of the population identifying as white. The village also has a small Hispanic population, with 4.2% of the population identifying as Hispanic or Latino.
Common Questions
What is Per Capita Income in Blue Jay?
Per Capita income in Blue Jay is $35,941.
What is the Median Family Income in Blue Jay?
Median Family Income in Blue Jay is $111,952.
What is the Median Household income in Blue Jay?
Median Household Income in Blue Jay is $110,714.
What is Income or Wage Gap in Blue Jay?
Income or Wage Gap in Blue Jay is 46.7%.
Women in Blue Jay earn 53.3 cents for every dollar earned by a man.
What is Inequality or Gini Index in Blue Jay?
Inequality or Gini Index in Blue Jay is 0.31.
What is the Total Population of Blue Jay?
Total Population of Blue Jay is 1,815.
What is the Total Male Population of Blue Jay?
Total Male Population of Blue Jay is 905.
What is the Total Female Population of Blue Jay?
Total Female Population of Blue Jay is 910.
What is the Ratio of Males per 100 Females in Blue Jay?
There are 99.45 Males per 100 Females in Blue Jay.
What is the Ratio of Females per 100 Males in Blue Jay?
There are 100.55 Females per 100 Males in Blue Jay.
What is the Median Population Age in Blue Jay?
Median Population Age in Blue Jay is 38.2 Years.
What is the Average Family Size in Blue Jay
Average Family Size in Blue Jay is 3.3 People.
What is the Average Household Size in Blue Jay
Average Household Size in Blue Jay is 2.8 People.
How Large is the Labor Force in Blue Jay?
There are 812 People in the Labor Forcein in Blue Jay.
What is the Percentage of People in the Labor Force in Blue Jay?
64.0% of People are in the Labor Force in Blue Jay.