Landen, OH Map & Demographics
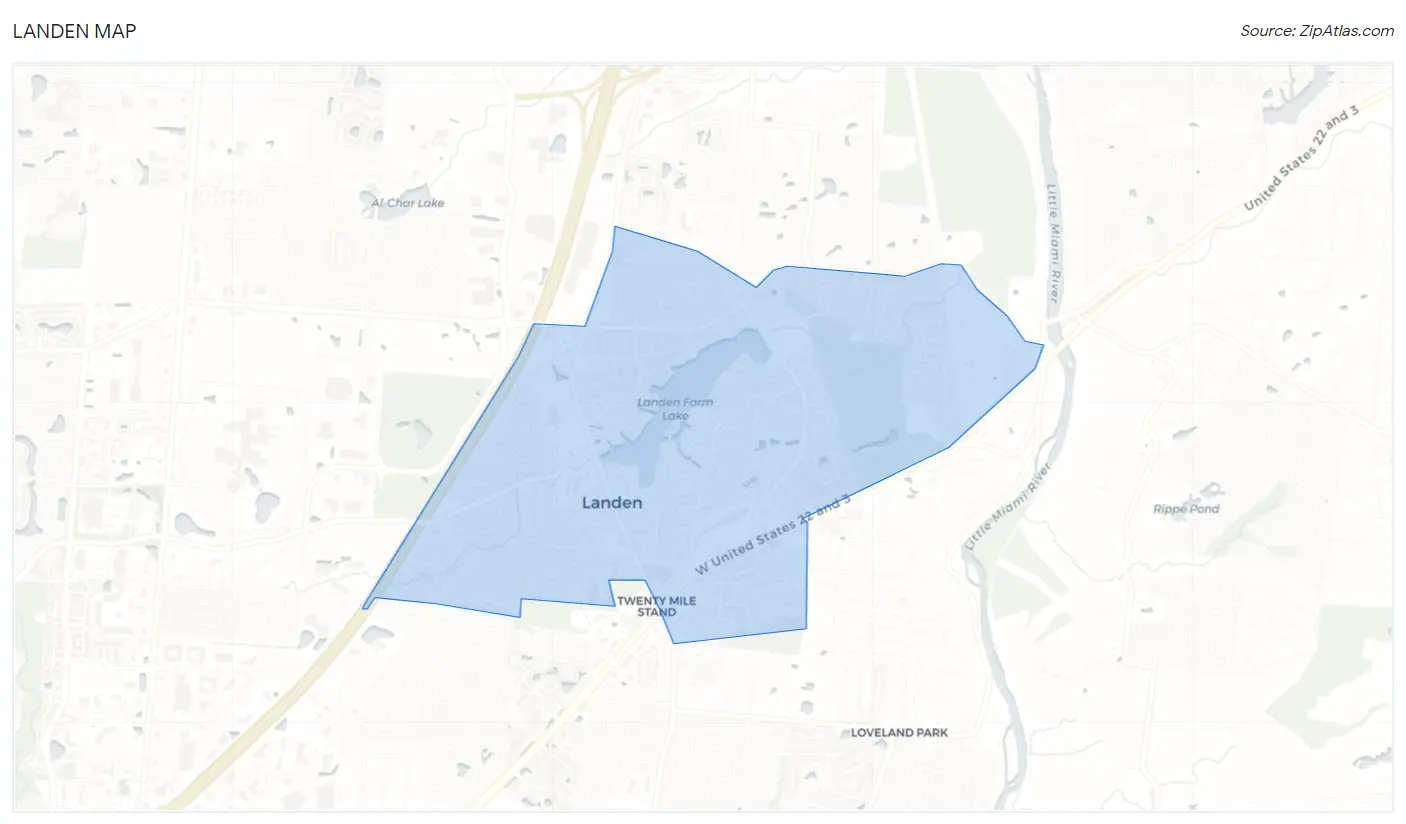
Landen Map
Landen Overview
$48,370
PER CAPITA INCOME
$119,518
AVG FAMILY INCOME
$104,245
AVG HOUSEHOLD INCOME
40.7%
WAGE / INCOME GAP [ % ]
59.3¢/ $1
WAGE / INCOME GAP [ $ ]
0.32
INEQUALITY / GINI INDEX
8,149
TOTAL POPULATION
3,891
MALE POPULATION
4,258
FEMALE POPULATION
91.38
MALES / 100 FEMALES
109.43
FEMALES / 100 MALES
40.8
MEDIAN AGE
3.0
AVG FAMILY SIZE
2.5
AVG HOUSEHOLD SIZE
4,632
LABOR FORCE [ PEOPLE ]
72.0%
PERCENT IN LABOR FORCE
0.9%
UNEMPLOYMENT RATE
Income in Landen
Income Overview in Landen
Per Capita Income in Landen is $48,370, while median incomes of families and households are $119,518 and $104,245 respectively.
| Characteristic | Number | Measure |
| Per Capita Income | 8,149 | $48,370 |
| Median Family Income | 2,375 | $119,518 |
| Mean Family Income | 2,375 | $136,217 |
| Median Household Income | 3,242 | $104,245 |
| Mean Household Income | 3,242 | $120,896 |
| Income Deficit | 2,375 | $0 |
| Wage / Income Gap (%) | 8,149 | 40.72% |
| Wage / Income Gap ($) | 8,149 | 59.28¢ per $1 |
| Gini / Inequality Index | 8,149 | 0.32 |
Earnings by Sex in Landen
Average Earnings in Landen are $62,613, $70,898 for men and $42,027 for women, a difference of 40.7%.
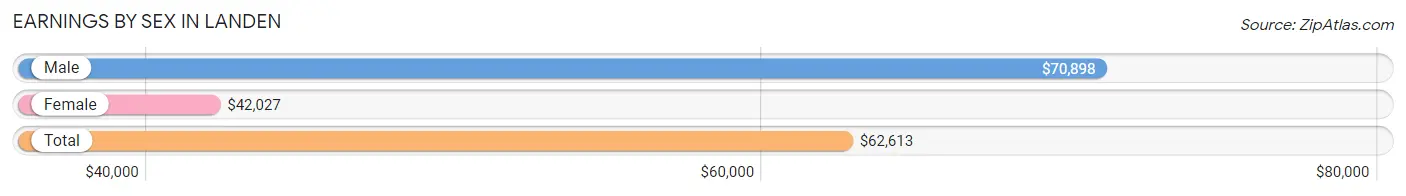
| Sex | Number | Average Earnings |
| Male | 2,465 (51.8%) | $70,898 |
| Female | 2,292 (48.2%) | $42,027 |
| Total | 4,757 (100.0%) | $62,613 |
Earnings by Sex by Income Bracket in Landen
The most common earnings brackets in Landen are $100,000+ for men (687 | 27.9%) and $75,000 to $99,999 for women (429 | 18.7%).
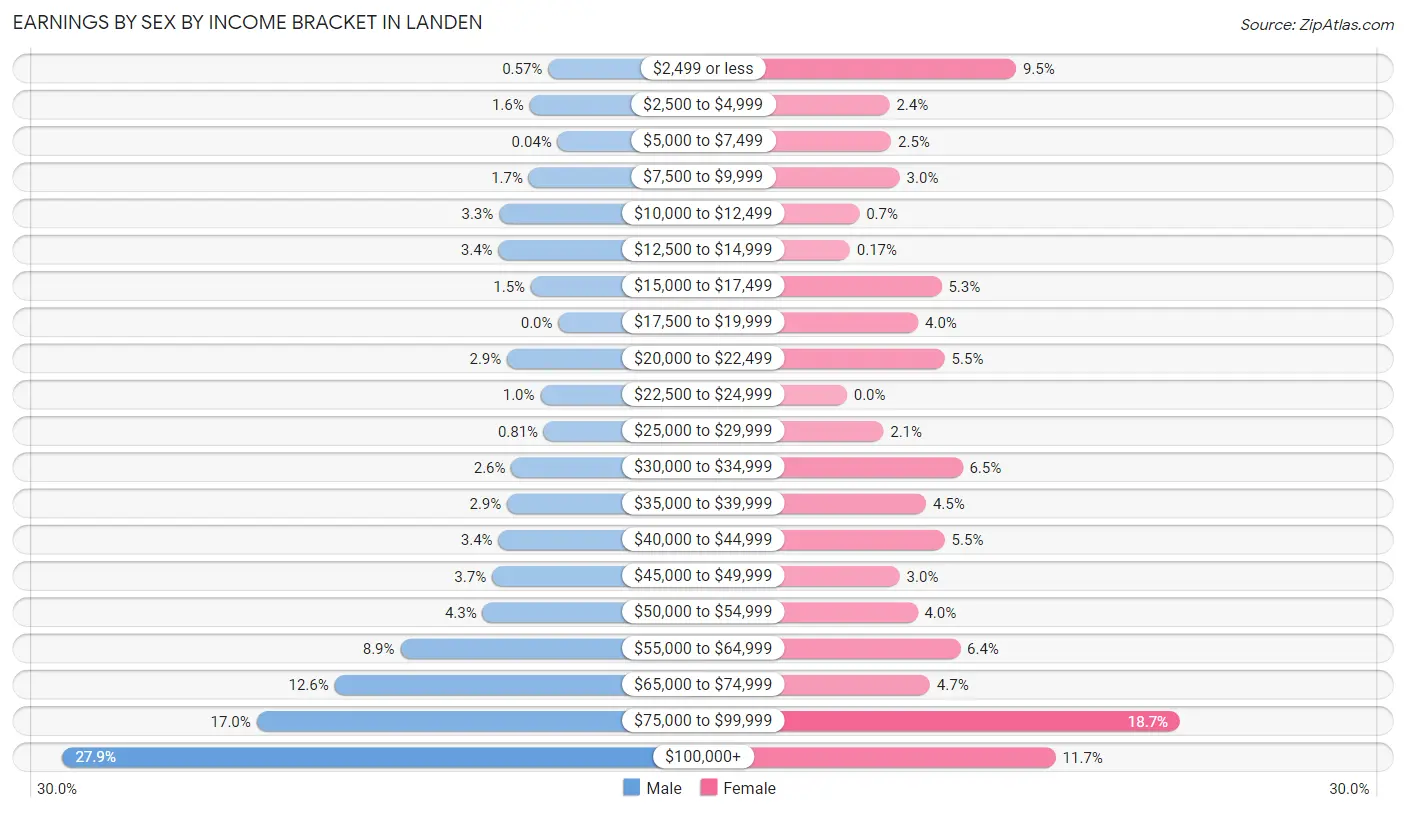
| Income | Male | Female |
| $2,499 or less | 14 (0.6%) | 218 (9.5%) |
| $2,500 to $4,999 | 40 (1.6%) | 55 (2.4%) |
| $5,000 to $7,499 | 1 (0.0%) | 57 (2.5%) |
| $7,500 to $9,999 | 41 (1.7%) | 68 (3.0%) |
| $10,000 to $12,499 | 82 (3.3%) | 16 (0.7%) |
| $12,500 to $14,999 | 83 (3.4%) | 4 (0.2%) |
| $15,000 to $17,499 | 38 (1.5%) | 122 (5.3%) |
| $17,500 to $19,999 | 0 (0.0%) | 92 (4.0%) |
| $20,000 to $22,499 | 71 (2.9%) | 126 (5.5%) |
| $22,500 to $24,999 | 25 (1.0%) | 0 (0.0%) |
| $25,000 to $29,999 | 20 (0.8%) | 47 (2.1%) |
| $30,000 to $34,999 | 65 (2.6%) | 149 (6.5%) |
| $35,000 to $39,999 | 71 (2.9%) | 102 (4.4%) |
| $40,000 to $44,999 | 83 (3.4%) | 126 (5.5%) |
| $45,000 to $49,999 | 92 (3.7%) | 68 (3.0%) |
| $50,000 to $54,999 | 105 (4.3%) | 91 (4.0%) |
| $55,000 to $64,999 | 219 (8.9%) | 146 (6.4%) |
| $65,000 to $74,999 | 310 (12.6%) | 107 (4.7%) |
| $75,000 to $99,999 | 418 (17.0%) | 429 (18.7%) |
| $100,000+ | 687 (27.9%) | 269 (11.7%) |
| Total | 2,465 (100.0%) | 2,292 (100.0%) |
Earnings by Sex by Educational Attainment in Landen
Average earnings in Landen are $72,085 for men and $50,728 for women, a difference of 29.6%. Men with an educational attainment of bachelor's degree enjoy the highest average annual earnings of $94,342, while those with college or associate's degree education earn the least with $59,213. Women with an educational attainment of graduate degree earn the most with the average annual earnings of $67,051, while those with college or associate's degree education have the smallest earnings of $40,669.
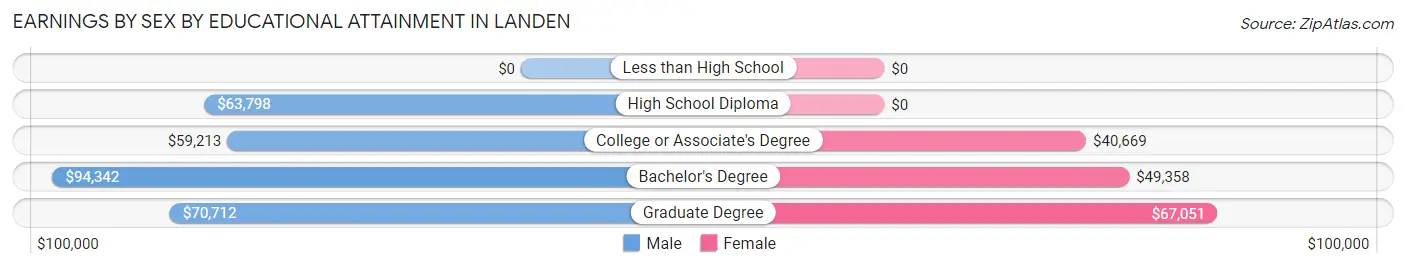
| Educational Attainment | Male Income | Female Income |
| Less than High School | - | - |
| High School Diploma | $63,798 | $0 |
| College or Associate's Degree | $59,213 | $40,669 |
| Bachelor's Degree | $94,342 | $49,358 |
| Graduate Degree | $70,712 | $67,051 |
| Total | $72,085 | $50,728 |
Family Income in Landen
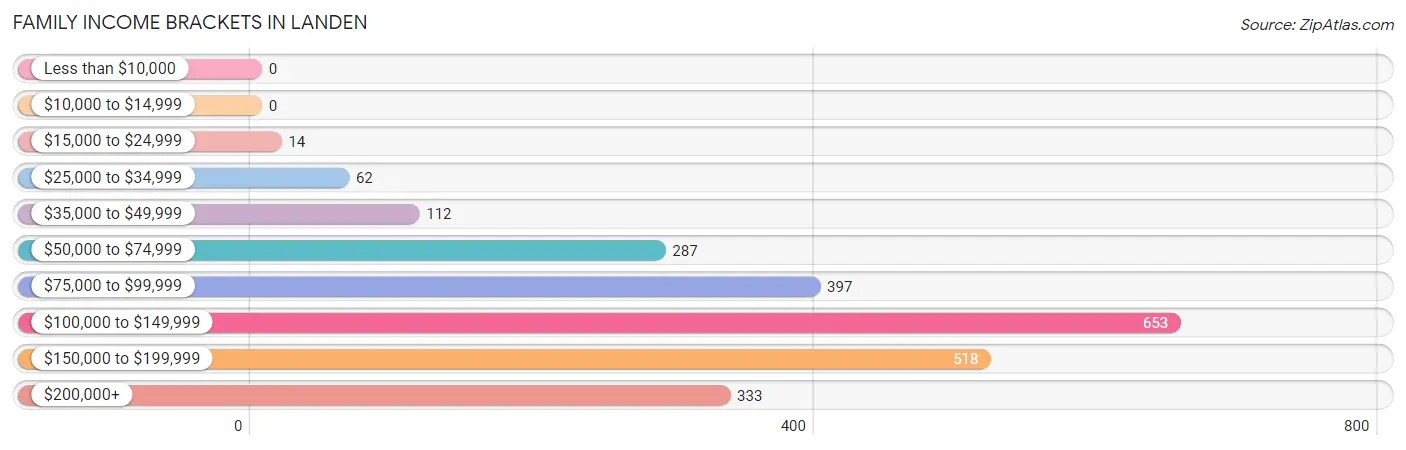
Family Income Brackets in Landen
According to the Landen family income data, there are 653 families falling into the $100,000 to $149,999 income range, which is the most common income bracket and makes up 27.5% of all families.
| Income Bracket | # Families | % Families |
| Less than $10,000 | 0 | 0.0% |
| $10,000 to $14,999 | 0 | 0.0% |
| $15,000 to $24,999 | 14 | 0.6% |
| $25,000 to $34,999 | 62 | 2.6% |
| $35,000 to $49,999 | 112 | 4.7% |
| $50,000 to $74,999 | 287 | 12.1% |
| $75,000 to $99,999 | 397 | 16.7% |
| $100,000 to $149,999 | 653 | 27.5% |
| $150,000 to $199,999 | 518 | 21.8% |
| $200,000+ | 333 | 14.0% |
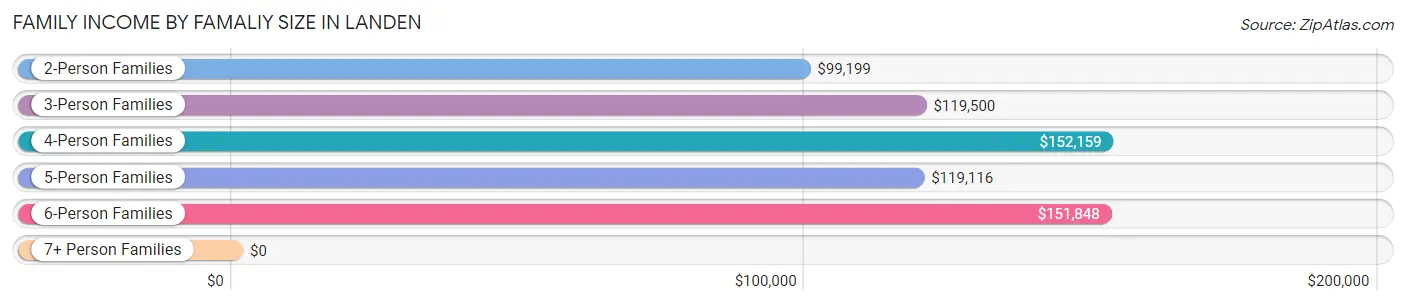
Family Income by Famaliy Size in Landen
4-person families (447 | 18.8%) account for the highest median family income in Landen with $152,159 per family, while 2-person families (1,188 | 50.0%) have the highest median income of $49,600 per family member.
| Income Bracket | # Families | Median Income |
| 2-Person Families | 1,188 (50.0%) | $99,199 |
| 3-Person Families | 460 (19.4%) | $119,500 |
| 4-Person Families | 447 (18.8%) | $152,159 |
| 5-Person Families | 199 (8.4%) | $119,116 |
| 6-Person Families | 56 (2.4%) | $151,848 |
| 7+ Person Families | 25 (1.1%) | $0 |
| Total | 2,375 (100.0%) | $119,518 |
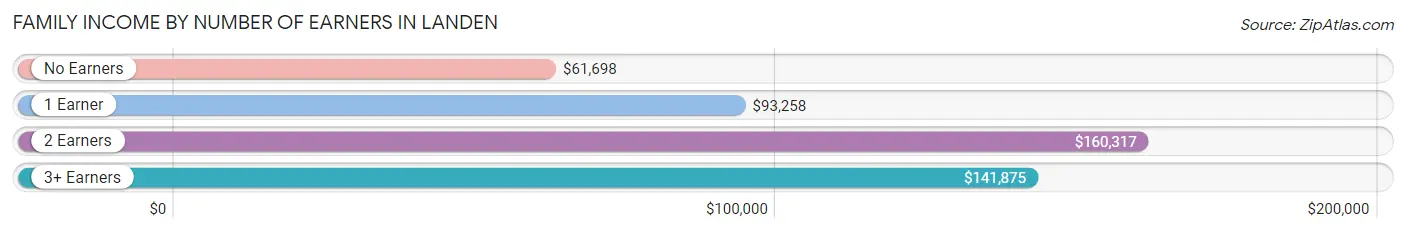
Family Income by Number of Earners in Landen
The median family income in Landen is $119,518, with families comprising 2 earners (1,063) having the highest median family income of $160,317, while families with no earners (298) have the lowest median family income of $61,698, accounting for 44.8% and 12.6% of families, respectively.
| Number of Earners | # Families | Median Income |
| No Earners | 298 (12.6%) | $61,698 |
| 1 Earner | 686 (28.9%) | $93,258 |
| 2 Earners | 1,063 (44.8%) | $160,317 |
| 3+ Earners | 328 (13.8%) | $141,875 |
| Total | 2,375 (100.0%) | $119,518 |
Household Income in Landen
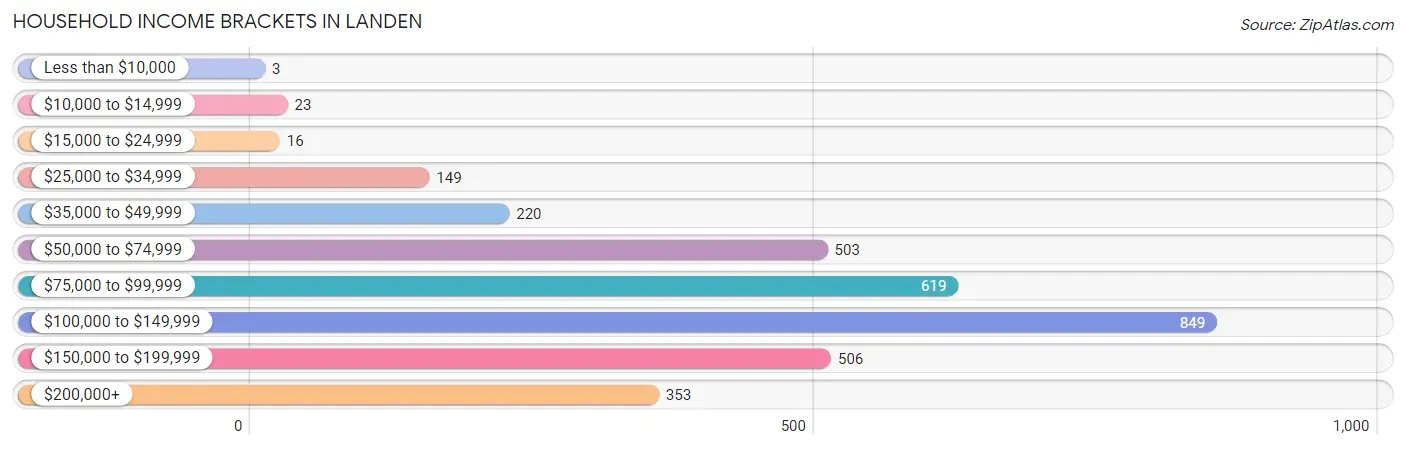
Household Income Brackets in Landen
With 849 households falling in the category, the $100,000 to $149,999 income range is the most frequent in Landen, accounting for 26.2% of all households. In contrast, only 3 households (0.1%) fall into the less than $10,000 income bracket, making it the least populous group.
| Income Bracket | # Households | % Households |
| Less than $10,000 | 3 | 0.1% |
| $10,000 to $14,999 | 23 | 0.7% |
| $15,000 to $24,999 | 16 | 0.5% |
| $25,000 to $34,999 | 149 | 4.6% |
| $35,000 to $49,999 | 220 | 6.8% |
| $50,000 to $74,999 | 503 | 15.5% |
| $75,000 to $99,999 | 619 | 19.1% |
| $100,000 to $149,999 | 849 | 26.2% |
| $150,000 to $199,999 | 506 | 15.6% |
| $200,000+ | 353 | 10.9% |
Household Income by Householder Age in Landen
The median household income in Landen is $104,245, with the highest median household income of $121,579 found in the 45 to 64 years age bracket for the primary householder. A total of 1,138 households (35.1%) fall into this category. Meanwhile, the 15 to 24 years age bracket for the primary householder has the lowest median household income of $0, with 40 households (1.2%) in this group.
| Income Bracket | # Households | Median Income |
| 15 to 24 Years | 40 (1.2%) | $0 |
| 25 to 44 Years | 1,185 (36.5%) | $109,196 |
| 45 to 64 Years | 1,138 (35.1%) | $121,579 |
| 65+ Years | 879 (27.1%) | $64,803 |
| Total | 3,242 (100.0%) | $104,245 |
Poverty in Landen
Income Below Poverty by Sex and Age in Landen
With 1.2% poverty level for males and 4.0% for females among the residents of Landen, 6 to 11 year old males and 18 to 24 year old females are the most vulnerable to poverty, with 16 males (4.5%) and 52 females (22.2%) in their respective age groups living below the poverty level.
| Age Bracket | Male | Female |
| Under 5 Years | 0 (0.0%) | 0 (0.0%) |
| 5 Years | 0 (0.0%) | 0 (0.0%) |
| 6 to 11 Years | 16 (4.5%) | 53 (14.4%) |
| 12 to 14 Years | 6 (3.5%) | 0 (0.0%) |
| 15 Years | 0 (0.0%) | 0 (0.0%) |
| 16 and 17 Years | 0 (0.0%) | 0 (0.0%) |
| 18 to 24 Years | 0 (0.0%) | 52 (22.2%) |
| 25 to 34 Years | 0 (0.0%) | 11 (1.8%) |
| 35 to 44 Years | 11 (2.0%) | 15 (3.3%) |
| 45 to 54 Years | 0 (0.0%) | 0 (0.0%) |
| 55 to 64 Years | 3 (0.5%) | 37 (6.5%) |
| 65 to 74 Years | 11 (2.4%) | 0 (0.0%) |
| 75 Years and over | 0 (0.0%) | 2 (0.6%) |
| Total | 47 (1.2%) | 170 (4.0%) |
Income Above Poverty by Sex and Age in Landen
According to the poverty statistics in Landen, males aged under 5 years and females aged under 5 years are the age groups that are most secure financially, with 100.0% of males and 100.0% of females in these age groups living above the poverty line.
| Age Bracket | Male | Female |
| Under 5 Years | 192 (100.0%) | 304 (100.0%) |
| 5 Years | 14 (100.0%) | 23 (100.0%) |
| 6 to 11 Years | 338 (95.5%) | 316 (85.6%) |
| 12 to 14 Years | 165 (96.5%) | 156 (100.0%) |
| 15 Years | 83 (100.0%) | 49 (100.0%) |
| 16 and 17 Years | 55 (100.0%) | 185 (100.0%) |
| 18 to 24 Years | 178 (100.0%) | 182 (77.8%) |
| 25 to 34 Years | 544 (100.0%) | 582 (98.2%) |
| 35 to 44 Years | 546 (98.0%) | 436 (96.7%) |
| 45 to 54 Years | 458 (100.0%) | 587 (100.0%) |
| 55 to 64 Years | 598 (99.5%) | 537 (93.5%) |
| 65 to 74 Years | 445 (97.6%) | 394 (100.0%) |
| 75 Years and over | 228 (100.0%) | 337 (99.4%) |
| Total | 3,844 (98.8%) | 4,088 (96.0%) |
Income Below Poverty Among Married-Couple Families in Landen
The poverty statistics for married-couple families in Landen show that 0.5% or 11 of the total 2,052 families live below the poverty line. Families with 3 or 4 children have the highest poverty rate of 7.1%, comprising of 11 families. On the other hand, families with no children have the lowest poverty rate of 0.0%, which includes 0 families.
| Children | Above Poverty | Below Poverty |
| No Children | 1,153 (100.0%) | 0 (0.0%) |
| 1 or 2 Children | 736 (100.0%) | 0 (0.0%) |
| 3 or 4 Children | 144 (92.9%) | 11 (7.1%) |
| 5 or more Children | 8 (100.0%) | 0 (0.0%) |
| Total | 2,041 (99.5%) | 11 (0.5%) |
Income Below Poverty Among Single-Parent Households in Landen
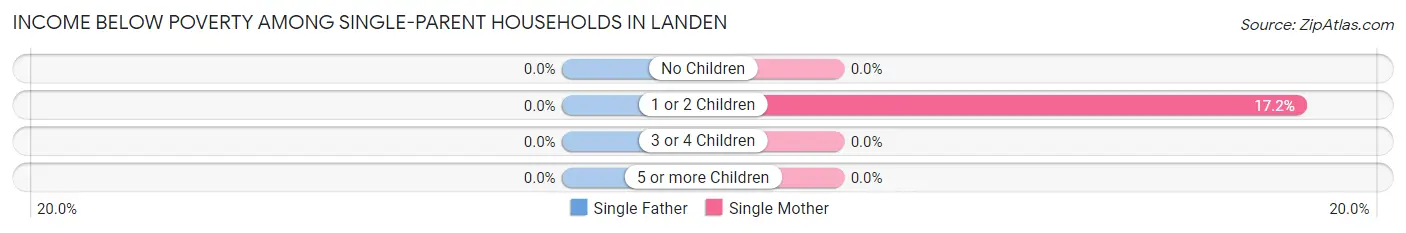
| Children | Single Father | Single Mother |
| No Children | 0 (0.0%) | 0 (0.0%) |
| 1 or 2 Children | 0 (0.0%) | 15 (17.2%) |
| 3 or 4 Children | 0 (0.0%) | 0 (0.0%) |
| 5 or more Children | 0 (0.0%) | 0 (0.0%) |
| Total | 0 (0.0%) | 15 (12.1%) |
Income Below Poverty Among Married-Couple vs Single-Parent Households in Landen
The poverty data for Landen shows that 11 of the married-couple family households (0.5%) and 15 of the single-parent households (4.6%) are living below the poverty level. Within the married-couple family households, those with 3 or 4 children have the highest poverty rate, with 11 households (7.1%) falling below the poverty line. Among the single-parent households, those with 1 or 2 children have the highest poverty rate, with 15 household (6.7%) living below poverty.
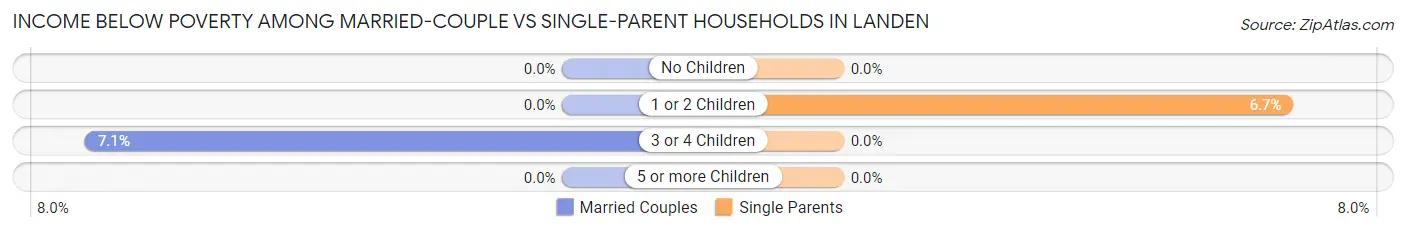
| Children | Married-Couple Families | Single-Parent Households |
| No Children | 0 (0.0%) | 0 (0.0%) |
| 1 or 2 Children | 0 (0.0%) | 15 (6.7%) |
| 3 or 4 Children | 11 (7.1%) | 0 (0.0%) |
| 5 or more Children | 0 (0.0%) | 0 (0.0%) |
| Total | 11 (0.5%) | 15 (4.6%) |
Race in Landen
The most populous races in Landen are White / Caucasian (7,021 | 86.2%), Hispanic or Latino (416 | 5.1%), and Asian (330 | 4.1%).
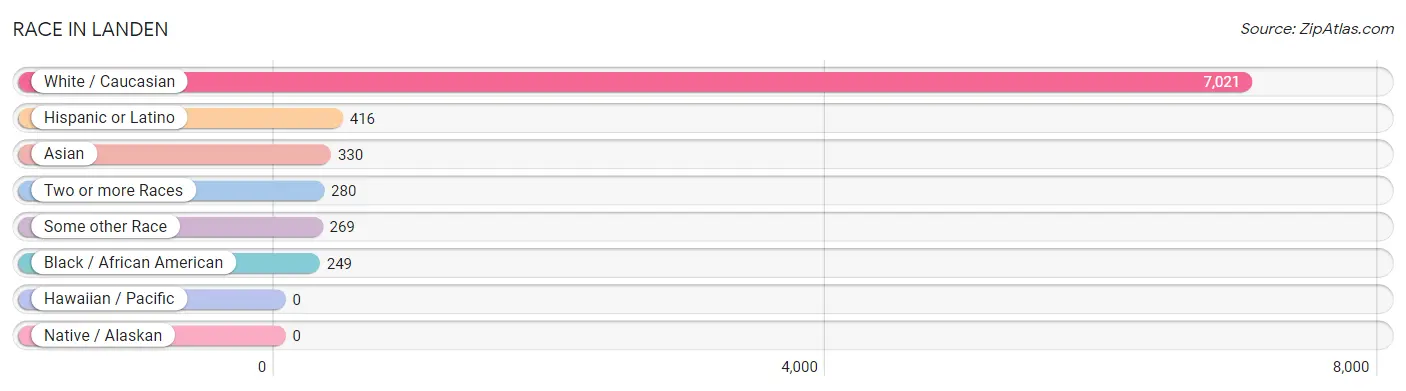
| Race | # Population | % Population |
| Asian | 330 | 4.1% |
| Black / African American | 249 | 3.1% |
| Hawaiian / Pacific | 0 | 0.0% |
| Hispanic or Latino | 416 | 5.1% |
| Native / Alaskan | 0 | 0.0% |
| White / Caucasian | 7,021 | 86.2% |
| Two or more Races | 280 | 3.4% |
| Some other Race | 269 | 3.3% |
| Total | 8,149 | 100.0% |
Ancestry in Landen
The most populous ancestries reported in Landen are German (2,123 | 26.1%), Irish (1,744 | 21.4%), English (1,124 | 13.8%), Mexican (408 | 5.0%), and Italian (403 | 5.0%), together accounting for 71.2% of all Landen residents.
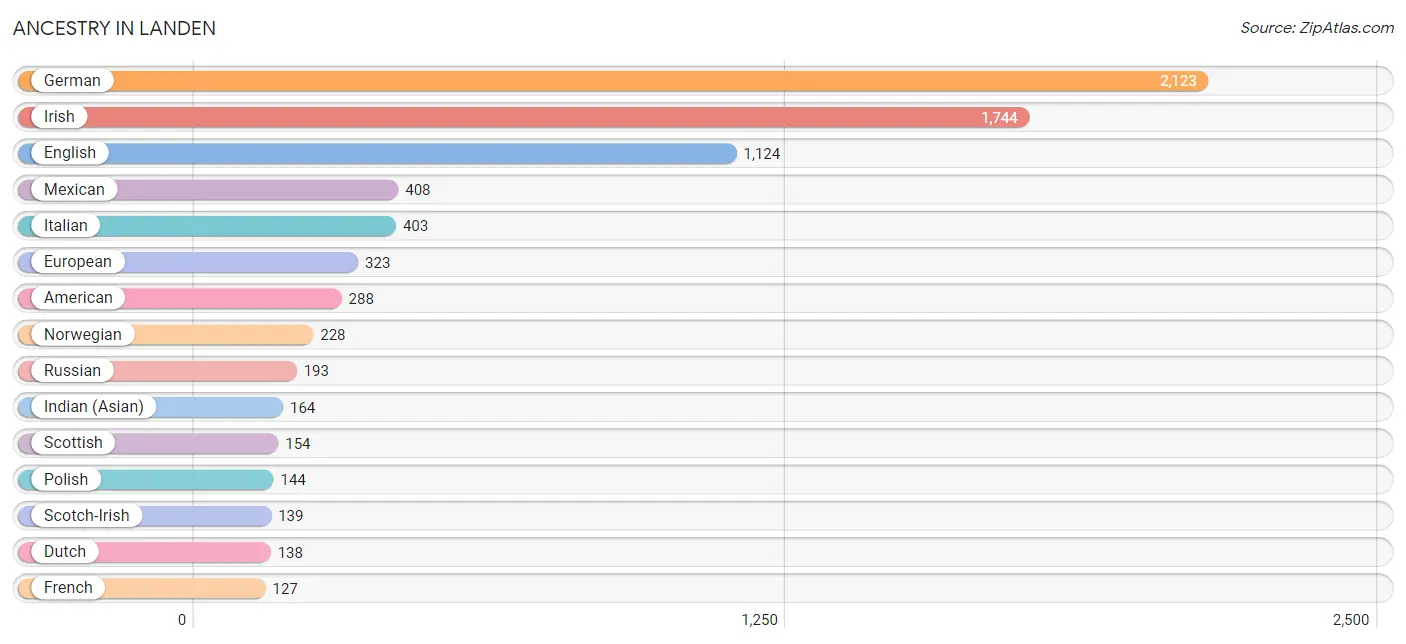
| Ancestry | # Population | % Population |
| Alsatian | 18 | 0.2% |
| American | 288 | 3.5% |
| Arab | 32 | 0.4% |
| Austrian | 20 | 0.3% |
| Bahamian | 24 | 0.3% |
| Bhutanese | 114 | 1.4% |
| British | 59 | 0.7% |
| Central American | 8 | 0.1% |
| Cherokee | 3 | 0.0% |
| Croatian | 21 | 0.3% |
| Czech | 70 | 0.9% |
| Czechoslovakian | 31 | 0.4% |
| Dutch | 138 | 1.7% |
| Eastern European | 49 | 0.6% |
| English | 1,124 | 13.8% |
| Ethiopian | 89 | 1.1% |
| European | 323 | 4.0% |
| Finnish | 18 | 0.2% |
| French | 127 | 1.6% |
| German | 2,123 | 26.1% |
| Greek | 33 | 0.4% |
| Hungarian | 87 | 1.1% |
| Indian (Asian) | 164 | 2.0% |
| Irish | 1,744 | 21.4% |
| Italian | 403 | 5.0% |
| Korean | 28 | 0.3% |
| Lithuanian | 58 | 0.7% |
| Mexican | 408 | 5.0% |
| Norwegian | 228 | 2.8% |
| Panamanian | 8 | 0.1% |
| Polish | 144 | 1.8% |
| Russian | 193 | 2.4% |
| Scandinavian | 14 | 0.2% |
| Scotch-Irish | 139 | 1.7% |
| Scottish | 154 | 1.9% |
| Slavic | 14 | 0.2% |
| Slovak | 94 | 1.1% |
| South African | 2 | 0.0% |
| Sri Lankan | 28 | 0.3% |
| Subsaharan African | 91 | 1.1% |
| Swiss | 54 | 0.7% |
| Thai | 114 | 1.4% |
| Trinidadian and Tobagonian | 11 | 0.1% |
| Ukrainian | 32 | 0.4% |
| Welsh | 114 | 1.4% |
| Yugoslavian | 80 | 1.0% | View All 46 Rows |
Immigrants in Landen
The most numerous immigrant groups reported in Landen came from Asia (222 | 2.7%), Latin America (212 | 2.6%), Europe (202 | 2.5%), Central America (191 | 2.3%), and Mexico (183 | 2.2%), together accounting for 12.4% of all Landen residents.
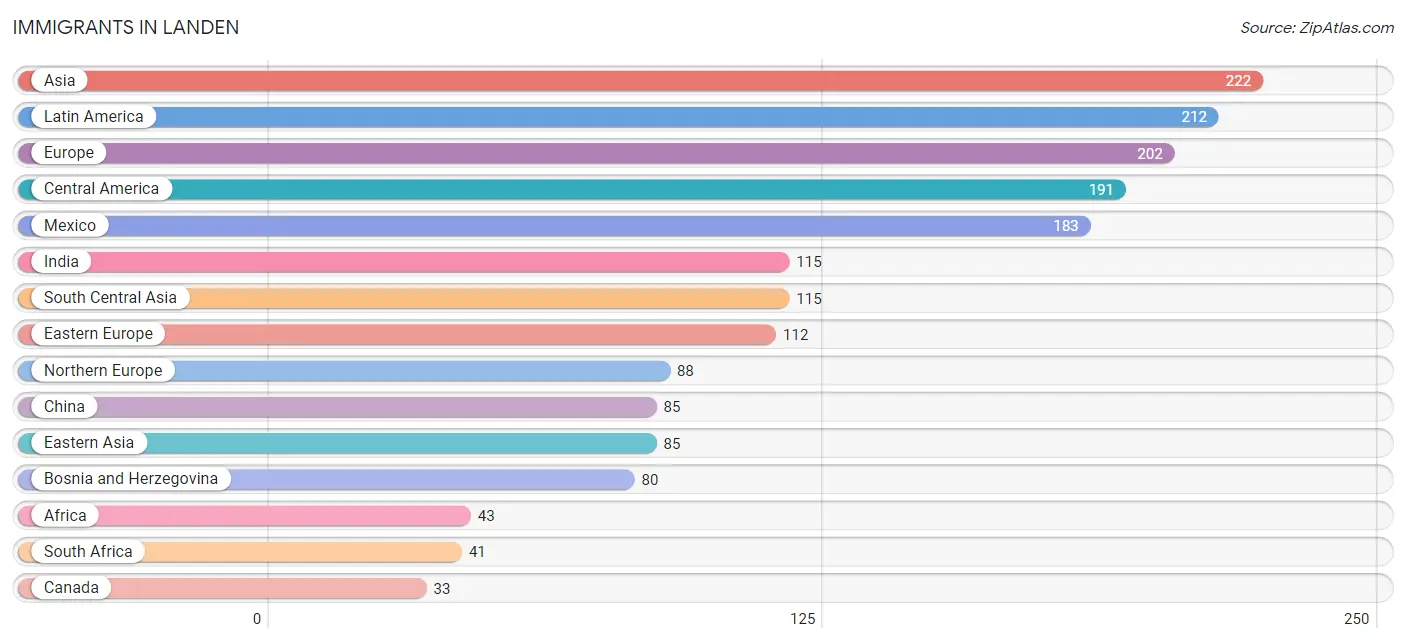
| Immigration Origin | # Population | % Population |
| Africa | 43 | 0.5% |
| Asia | 222 | 2.7% |
| Bahamas | 10 | 0.1% |
| Bosnia and Herzegovina | 80 | 1.0% |
| Canada | 33 | 0.4% |
| Caribbean | 21 | 0.3% |
| Central America | 191 | 2.3% |
| China | 85 | 1.0% |
| Eastern Africa | 2 | 0.0% |
| Eastern Asia | 85 | 1.0% |
| Eastern Europe | 112 | 1.4% |
| Europe | 202 | 2.5% |
| Germany | 2 | 0.0% |
| India | 115 | 1.4% |
| Latin America | 212 | 2.6% |
| Mexico | 183 | 2.2% |
| Northern Europe | 88 | 1.1% |
| Panama | 8 | 0.1% |
| Philippines | 10 | 0.1% |
| Scotland | 6 | 0.1% |
| South Africa | 41 | 0.5% |
| South Central Asia | 115 | 1.4% |
| South Eastern Asia | 22 | 0.3% |
| Trinidad and Tobago | 11 | 0.1% |
| Ukraine | 32 | 0.4% |
| Vietnam | 12 | 0.2% |
| Western Europe | 2 | 0.0% |
| Zimbabwe | 2 | 0.0% | View All 28 Rows |
Sex and Age in Landen
Sex and Age in Landen
The most populous age groups in Landen are 55 to 59 Years (363 | 9.3%) for men and 60 to 64 Years (349 | 8.2%) for women.
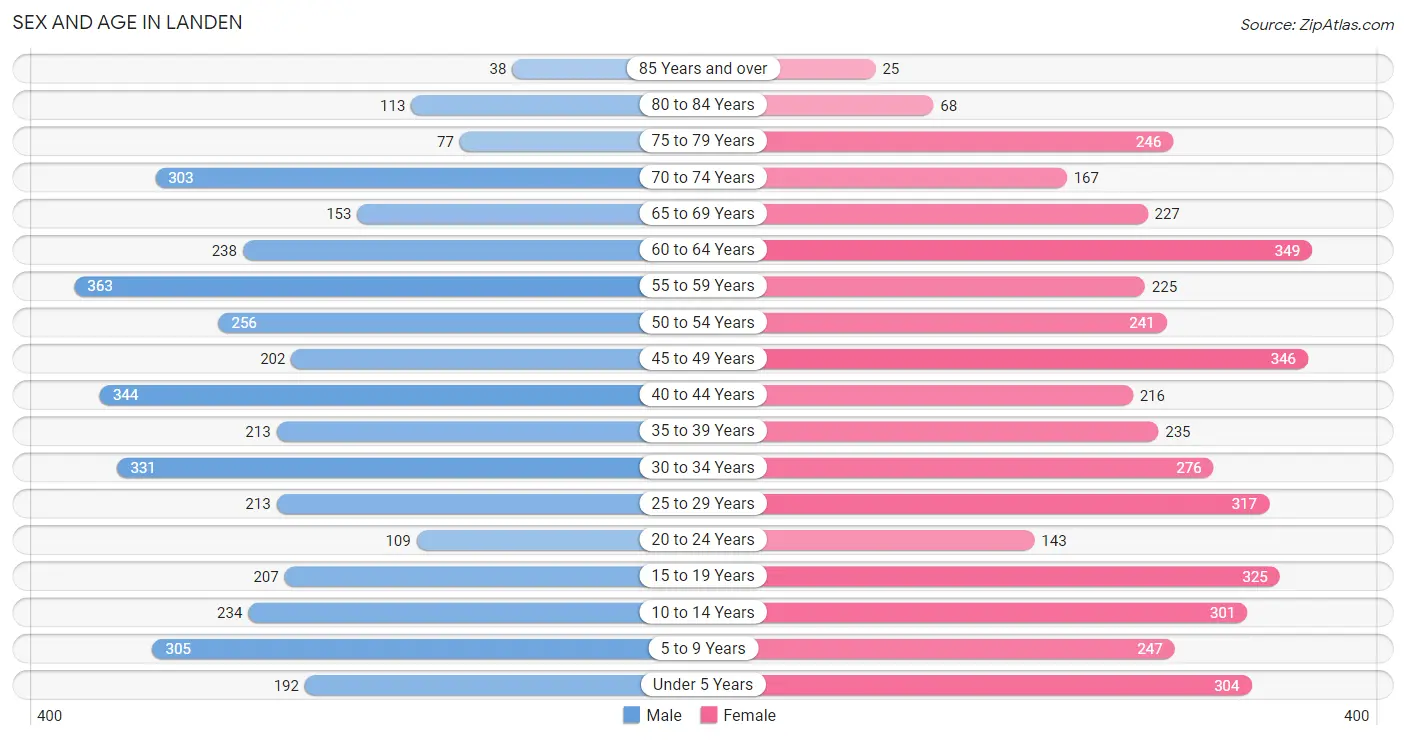
| Age Bracket | Male | Female |
| Under 5 Years | 192 (4.9%) | 304 (7.1%) |
| 5 to 9 Years | 305 (7.8%) | 247 (5.8%) |
| 10 to 14 Years | 234 (6.0%) | 301 (7.1%) |
| 15 to 19 Years | 207 (5.3%) | 325 (7.6%) |
| 20 to 24 Years | 109 (2.8%) | 143 (3.4%) |
| 25 to 29 Years | 213 (5.5%) | 317 (7.4%) |
| 30 to 34 Years | 331 (8.5%) | 276 (6.5%) |
| 35 to 39 Years | 213 (5.5%) | 235 (5.5%) |
| 40 to 44 Years | 344 (8.8%) | 216 (5.1%) |
| 45 to 49 Years | 202 (5.2%) | 346 (8.1%) |
| 50 to 54 Years | 256 (6.6%) | 241 (5.7%) |
| 55 to 59 Years | 363 (9.3%) | 225 (5.3%) |
| 60 to 64 Years | 238 (6.1%) | 349 (8.2%) |
| 65 to 69 Years | 153 (3.9%) | 227 (5.3%) |
| 70 to 74 Years | 303 (7.8%) | 167 (3.9%) |
| 75 to 79 Years | 77 (2.0%) | 246 (5.8%) |
| 80 to 84 Years | 113 (2.9%) | 68 (1.6%) |
| 85 Years and over | 38 (1.0%) | 25 (0.6%) |
| Total | 3,891 (100.0%) | 4,258 (100.0%) |
Families and Households in Landen
Median Family Size in Landen
The median family size in Landen is 2.96 persons per family, with married-couple families (2,052 | 86.4%) accounting for the largest median family size of 3.08 persons per family. On the other hand, single male/father families (199 | 8.4%) represent the smallest median family size with 2.07 persons per family.
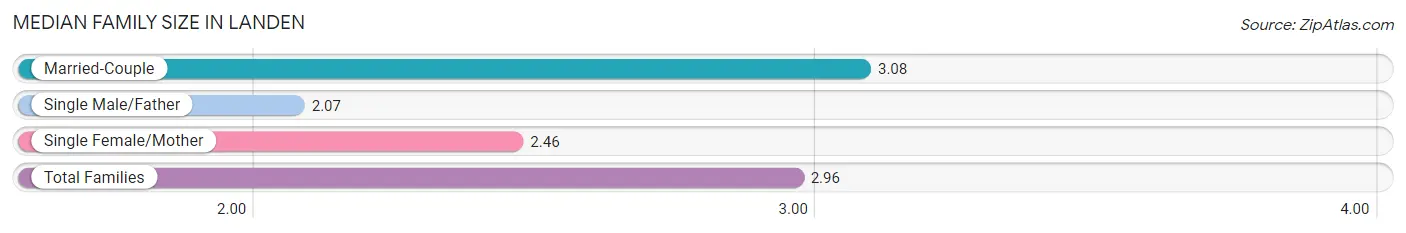
| Family Type | # Families | Family Size |
| Married-Couple | 2,052 (86.4%) | 3.08 |
| Single Male/Father | 199 (8.4%) | 2.07 |
| Single Female/Mother | 124 (5.2%) | 2.46 |
| Total Families | 2,375 (100.0%) | 2.96 |
Median Household Size in Landen
The median household size in Landen is 2.51 persons per household, with married-couple households (2,052 | 63.3%) accounting for the largest median household size of 3.08 persons per household. non-family households (867 | 26.7%) represent the smallest median household size with 1.12 persons per household.
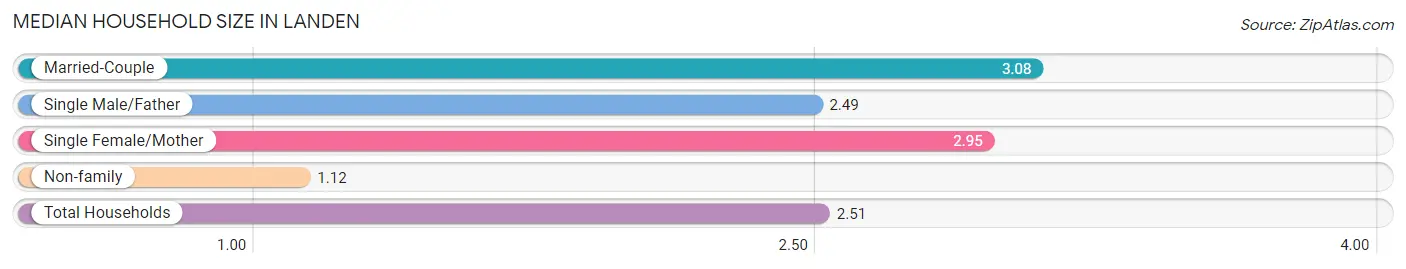
| Household Type | # Households | Household Size |
| Married-Couple | 2,052 (63.3%) | 3.08 |
| Single Male/Father | 199 (6.1%) | 2.49 |
| Single Female/Mother | 124 (3.8%) | 2.95 |
| Non-family | 867 (26.7%) | 1.12 |
| Total Households | 3,242 (100.0%) | 2.51 |
Household Size by Marriage Status in Landen
Out of a total of 3,242 households in Landen, 2,375 (73.3%) are family households, while 867 (26.7%) are nonfamily households. The most numerous type of family households are 2-person households, comprising 1,111, and the most common type of nonfamily households are 1-person households, comprising 809.
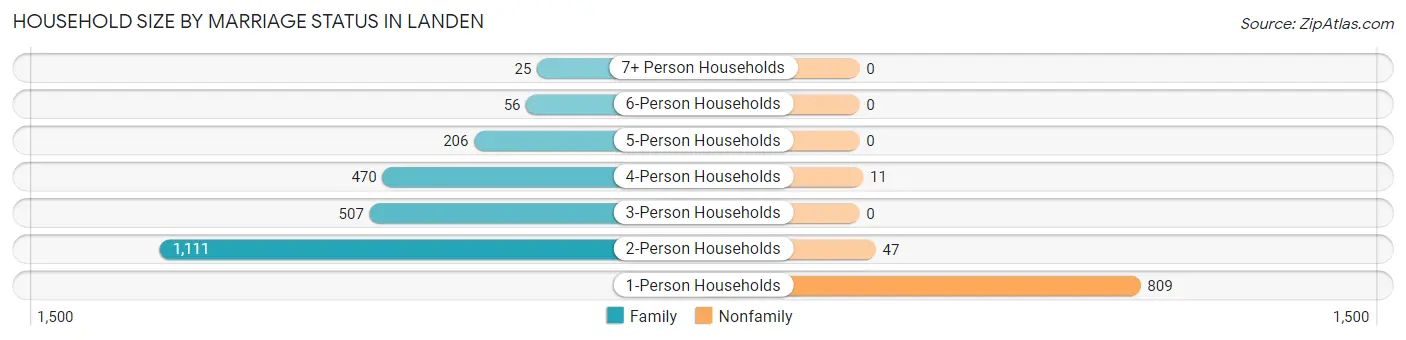
| Household Size | Family Households | Nonfamily Households |
| 1-Person Households | - | 809 (24.9%) |
| 2-Person Households | 1,111 (34.3%) | 47 (1.5%) |
| 3-Person Households | 507 (15.6%) | 0 (0.0%) |
| 4-Person Households | 470 (14.5%) | 11 (0.3%) |
| 5-Person Households | 206 (6.4%) | 0 (0.0%) |
| 6-Person Households | 56 (1.7%) | 0 (0.0%) |
| 7+ Person Households | 25 (0.8%) | 0 (0.0%) |
| Total | 2,375 (73.3%) | 867 (26.7%) |
Female Fertility in Landen
Fertility by Age in Landen
Average fertility rate in Landen is 61.0 births per 1,000 women. Women in the age bracket of 20 to 34 years have the highest fertility rate with 155.0 births per 1,000 women. Women in the age bracket of 20 to 34 years acount for 100.0% of all women with births.
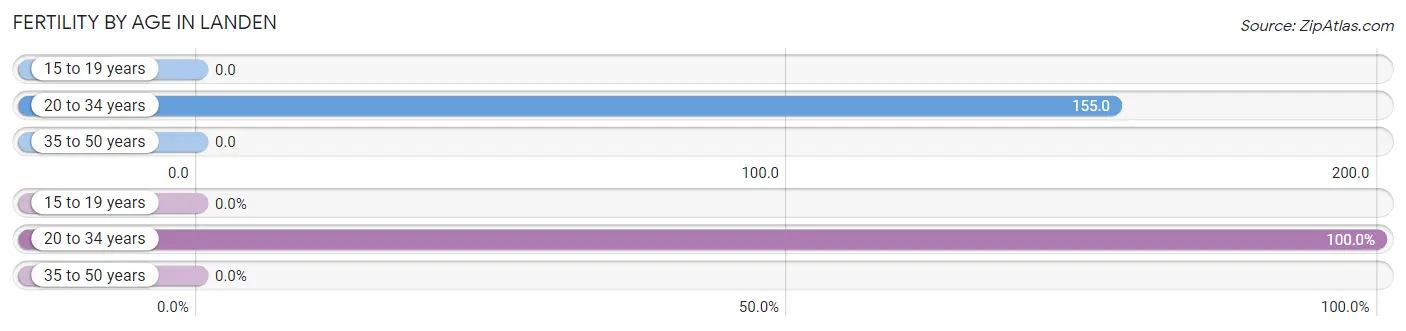
| Age Bracket | Women with Births | Births / 1,000 Women |
| 15 to 19 years | 0 (0.0%) | 0.0 |
| 20 to 34 years | 114 (100.0%) | 155.0 |
| 35 to 50 years | 0 (0.0%) | 0.0 |
| Total | 114 (100.0%) | 61.0 |
Fertility by Age by Marriage Status in Landen
72.8% of women with births (114) in Landen are married. The highest percentage of unmarried women with births falls into 20 to 34 years age bracket with 27.2% of them unmarried at the time of birth, while the lowest percentage of unmarried women with births belong to 20 to 34 years age bracket with 27.2% of them unmarried.
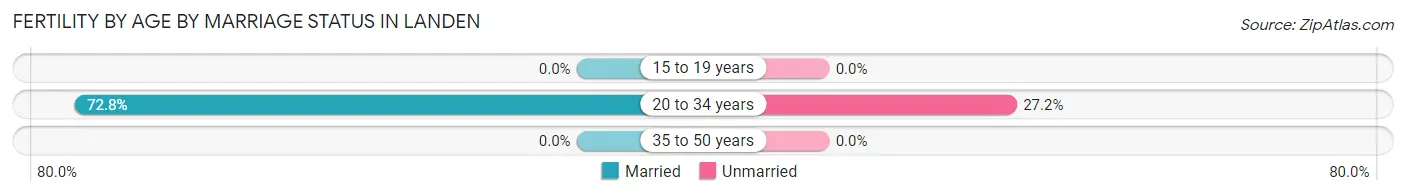
| Age Bracket | Married | Unmarried |
| 15 to 19 years | 0 (0.0%) | 0 (0.0%) |
| 20 to 34 years | 83 (72.8%) | 31 (27.2%) |
| 35 to 50 years | 0 (0.0%) | 0 (0.0%) |
| Total | 83 (72.8%) | 31 (27.2%) |
Fertility by Education in Landen
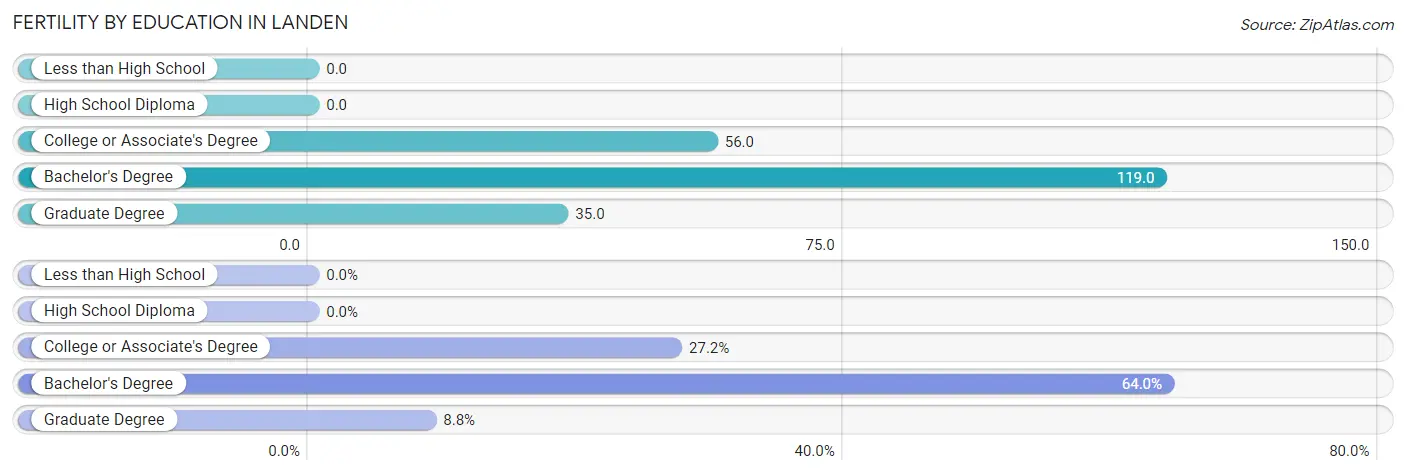
| Educational Attainment | Women with Births | Births / 1,000 Women |
| Less than High School | 0 (0.0%) | 0.0 |
| High School Diploma | 0 (0.0%) | 0.0 |
| College or Associate's Degree | 31 (27.2%) | 56.0 |
| Bachelor's Degree | 73 (64.0%) | 119.0 |
| Graduate Degree | 10 (8.8%) | 35.0 |
| Total | 114 (100.0%) | 61.0 |
Fertility by Education by Marriage Status in Landen
27.2% of women with births in Landen are unmarried. Women with the educational attainment of bachelor's degree are most likely to be married with 100.0% of them married at childbirth, while women with the educational attainment of college or associate's degree are least likely to be married with 100.0% of them unmarried at childbirth.
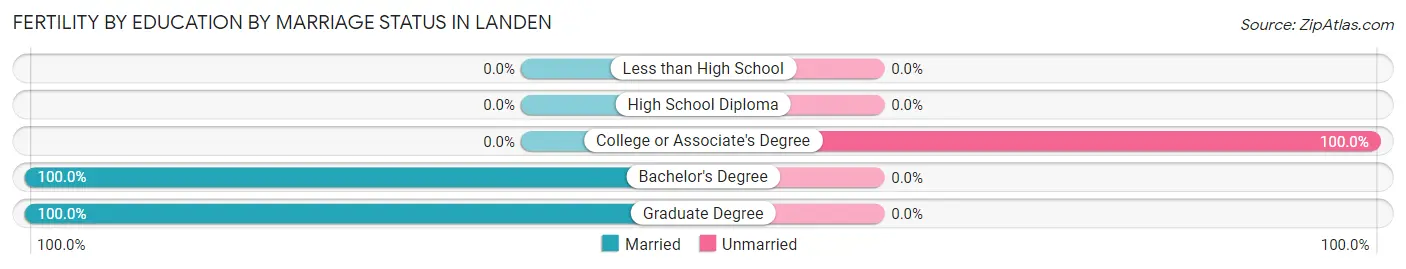
| Educational Attainment | Married | Unmarried |
| Less than High School | 0 (0.0%) | 0 (0.0%) |
| High School Diploma | 0 (0.0%) | 0 (0.0%) |
| College or Associate's Degree | 0 (0.0%) | 31 (100.0%) |
| Bachelor's Degree | 73 (100.0%) | 0 (0.0%) |
| Graduate Degree | 10 (100.0%) | 0 (0.0%) |
| Total | 83 (72.8%) | 31 (27.2%) |
Employment Characteristics in Landen
Employment by Class of Employer in Landen
Among the 4,528 employed individuals in Landen, private company employees (3,188 | 70.4%), not-for-profit organizations (424 | 9.4%), and local government employees (346 | 7.6%) make up the most common classes of employment.
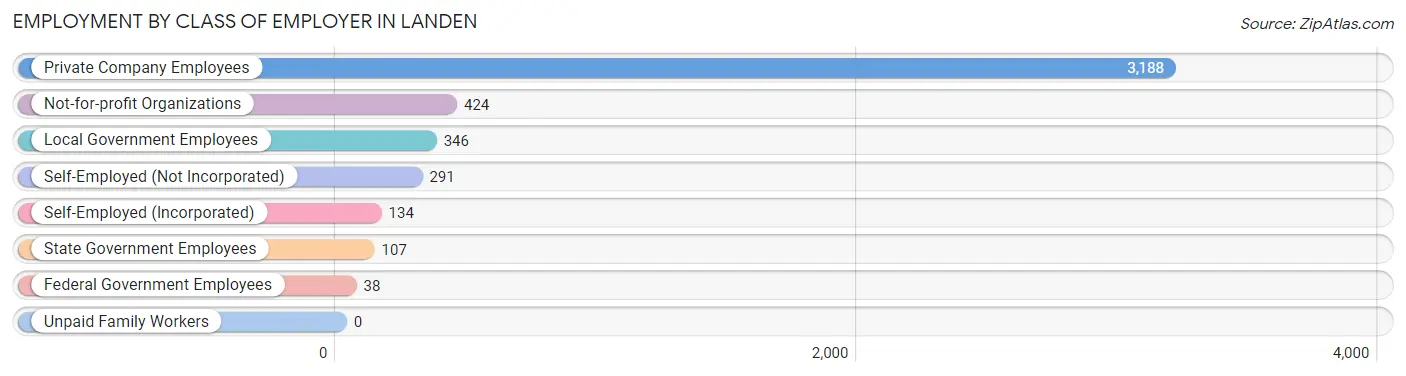
| Employer Class | # Employees | % Employees |
| Private Company Employees | 3,188 | 70.4% |
| Self-Employed (Incorporated) | 134 | 3.0% |
| Self-Employed (Not Incorporated) | 291 | 6.4% |
| Not-for-profit Organizations | 424 | 9.4% |
| Local Government Employees | 346 | 7.6% |
| State Government Employees | 107 | 2.4% |
| Federal Government Employees | 38 | 0.8% |
| Unpaid Family Workers | 0 | 0.0% |
| Total | 4,528 | 100.0% |
Employment Status by Age in Landen
According to the labor force statistics for Landen, out of the total population over 16 years of age (6,434), 72.0% or 4,632 individuals are in the labor force, with 0.9% or 42 of them unemployed. The age group with the highest labor force participation rate is 30 to 34 years, with 97.4% or 591 individuals in the labor force. Within the labor force, the 25 to 29 years age range has the highest percentage of unemployed individuals, with 4.6% or 23 of them being unemployed.
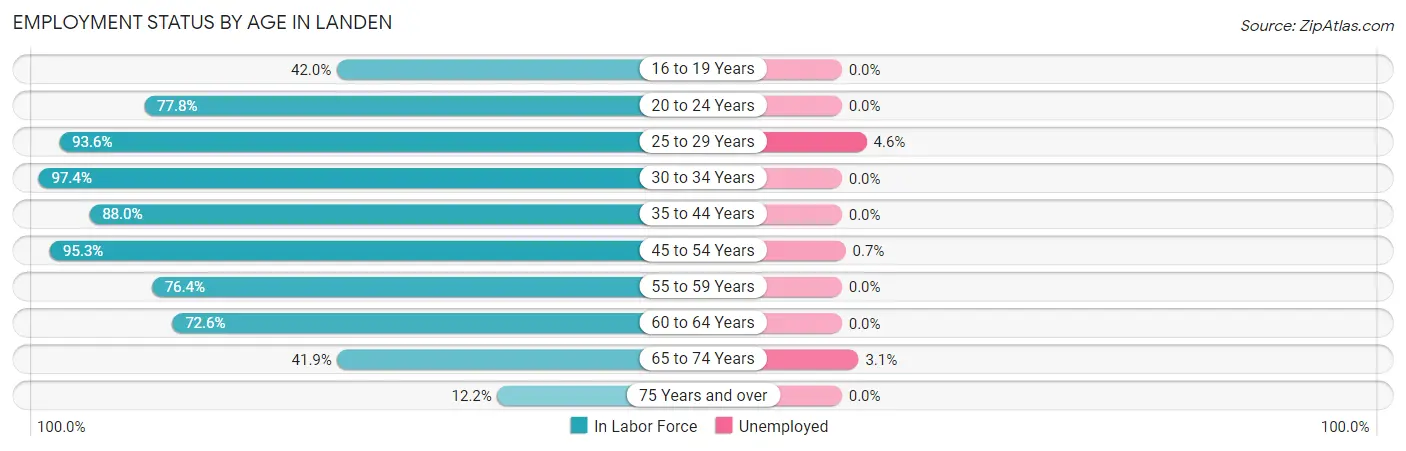
| Age Bracket | In Labor Force | Unemployed |
| 16 to 19 Years | 168 (42.0%) | 0 (0.0%) |
| 20 to 24 Years | 196 (77.8%) | 0 (0.0%) |
| 25 to 29 Years | 496 (93.6%) | 23 (4.6%) |
| 30 to 34 Years | 591 (97.4%) | 0 (0.0%) |
| 35 to 44 Years | 887 (88.0%) | 0 (0.0%) |
| 45 to 54 Years | 996 (95.3%) | 7 (0.7%) |
| 55 to 59 Years | 449 (76.4%) | 0 (0.0%) |
| 60 to 64 Years | 426 (72.6%) | 0 (0.0%) |
| 65 to 74 Years | 356 (41.9%) | 11 (3.1%) |
| 75 Years and over | 69 (12.2%) | 0 (0.0%) |
| Total | 4,632 (72.0%) | 42 (0.9%) |
Employment Status by Educational Attainment in Landen
According to labor force statistics for Landen, 88.1% of individuals (3,846) out of the total population between 25 and 64 years of age (4,365) are in the labor force, with 0.8% or 31 of them being unemployed. The group with the highest labor force participation rate are those with the educational attainment of high school diploma, with 95.1% or 520 individuals in the labor force. Within the labor force, individuals with bachelor's degree or higher education have the highest percentage of unemployment, with 1.2% or 30 of them being unemployed.
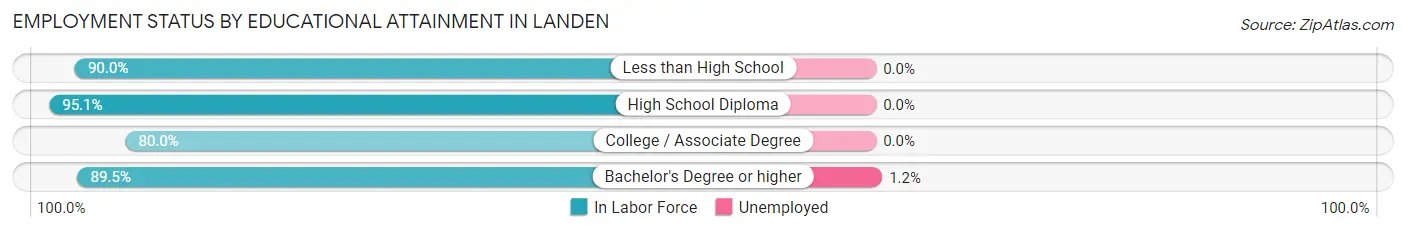
| Educational Attainment | In Labor Force | Unemployed |
| Less than High School | 54 (90.0%) | 0 (0.0%) |
| High School Diploma | 520 (95.1%) | 0 (0.0%) |
| College / Associate Degree | 781 (80.0%) | 0 (0.0%) |
| Bachelor's Degree or higher | 2,490 (89.5%) | 33 (1.2%) |
| Total | 3,846 (88.1%) | 35 (0.8%) |
Employment Occupations by Sex in Landen
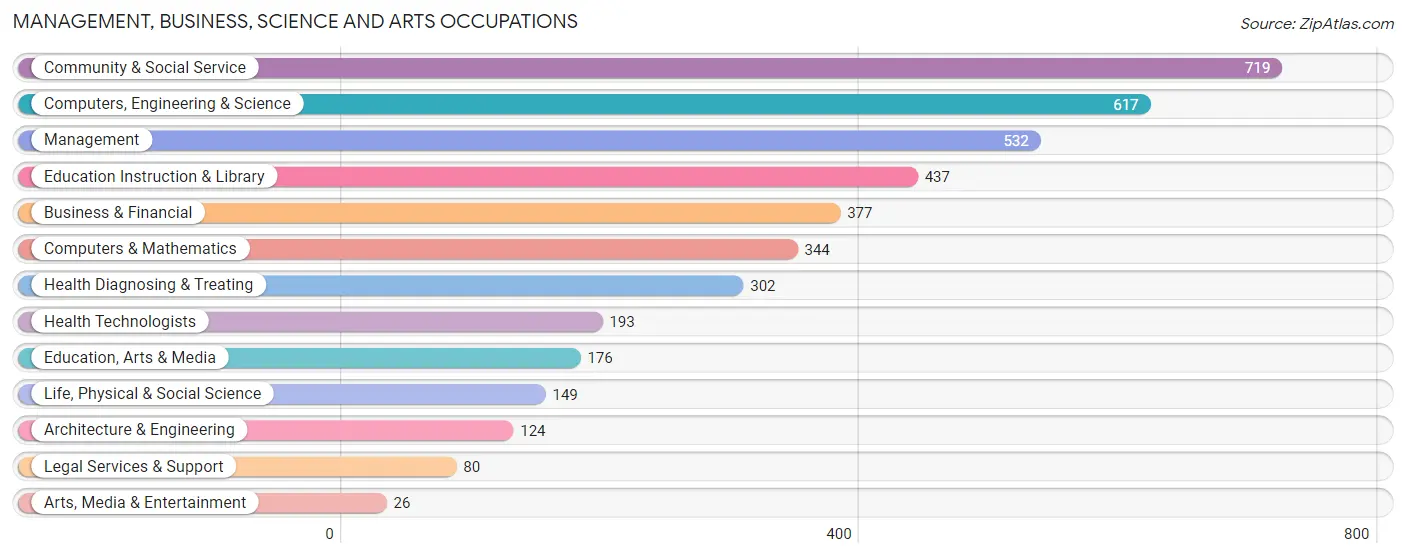
Management, Business, Science and Arts Occupations
The most common Management, Business, Science and Arts occupations in Landen are Community & Social Service (719 | 15.7%), Computers, Engineering & Science (617 | 13.4%), Management (532 | 11.6%), Education Instruction & Library (437 | 9.5%), and Business & Financial (377 | 8.2%).
Management, Business, Science and Arts Occupations by Sex
Within the Management, Business, Science and Arts occupations in Landen, the most male-oriented occupations are Architecture & Engineering (100.0%), Arts, Media & Entertainment (100.0%), and Computers & Mathematics (93.9%), while the most female-oriented occupations are Health Technologists (90.2%), Legal Services & Support (85.0%), and Education, Arts & Media (73.9%).
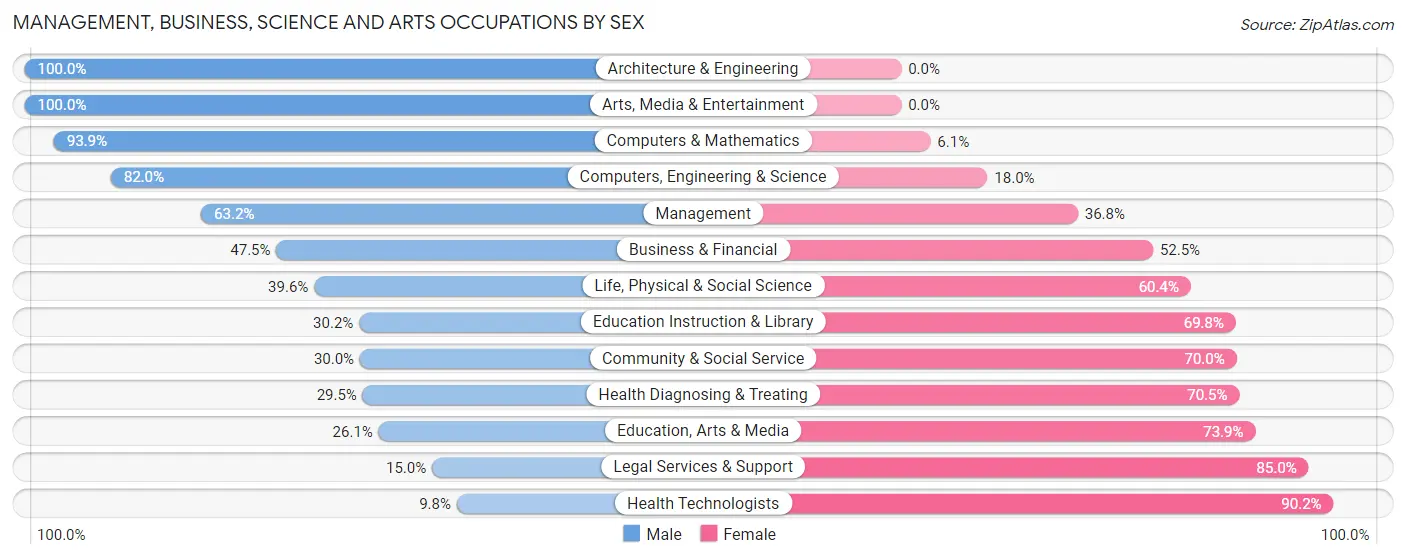
| Occupation | Male | Female |
| Management | 336 (63.2%) | 196 (36.8%) |
| Business & Financial | 179 (47.5%) | 198 (52.5%) |
| Computers, Engineering & Science | 506 (82.0%) | 111 (18.0%) |
| Computers & Mathematics | 323 (93.9%) | 21 (6.1%) |
| Architecture & Engineering | 124 (100.0%) | 0 (0.0%) |
| Life, Physical & Social Science | 59 (39.6%) | 90 (60.4%) |
| Community & Social Service | 216 (30.0%) | 503 (70.0%) |
| Education, Arts & Media | 46 (26.1%) | 130 (73.9%) |
| Legal Services & Support | 12 (15.0%) | 68 (85.0%) |
| Education Instruction & Library | 132 (30.2%) | 305 (69.8%) |
| Arts, Media & Entertainment | 26 (100.0%) | 0 (0.0%) |
| Health Diagnosing & Treating | 89 (29.5%) | 213 (70.5%) |
| Health Technologists | 19 (9.8%) | 174 (90.2%) |
| Total (Category) | 1,326 (52.1%) | 1,221 (47.9%) |
| Total (Overall) | 2,413 (52.5%) | 2,180 (47.5%) |
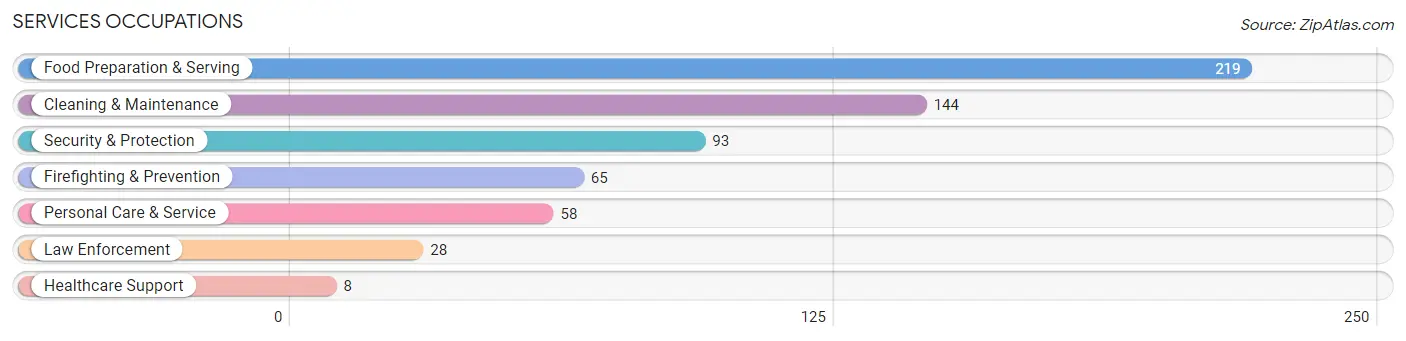
Services Occupations
The most common Services occupations in Landen are Food Preparation & Serving (219 | 4.8%), Cleaning & Maintenance (144 | 3.1%), Security & Protection (93 | 2.0%), Firefighting & Prevention (65 | 1.4%), and Personal Care & Service (58 | 1.3%).
Services Occupations by Sex
Within the Services occupations in Landen, the most male-oriented occupations are Healthcare Support (100.0%), Security & Protection (100.0%), and Firefighting & Prevention (100.0%), while the most female-oriented occupations are Food Preparation & Serving (68.5%), Personal Care & Service (55.2%), and Cleaning & Maintenance (36.8%).
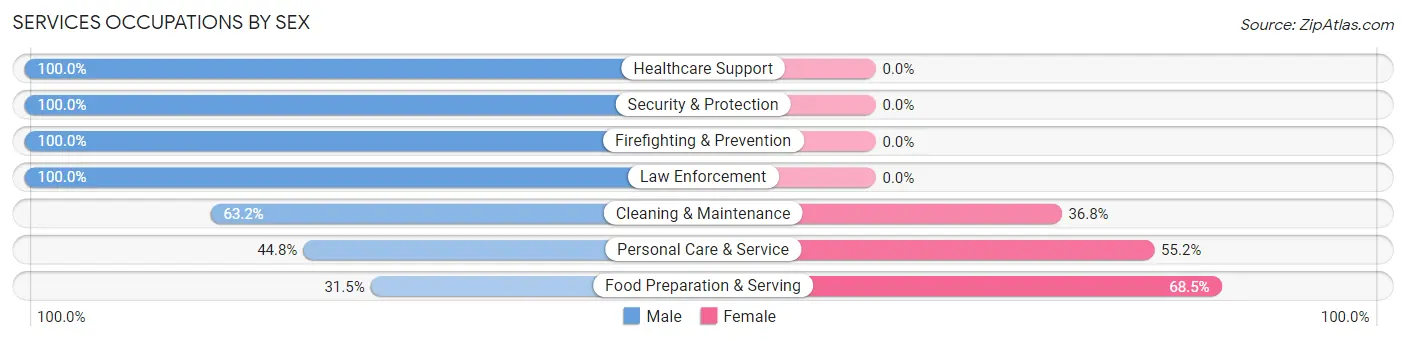
| Occupation | Male | Female |
| Healthcare Support | 8 (100.0%) | 0 (0.0%) |
| Security & Protection | 93 (100.0%) | 0 (0.0%) |
| Firefighting & Prevention | 65 (100.0%) | 0 (0.0%) |
| Law Enforcement | 28 (100.0%) | 0 (0.0%) |
| Food Preparation & Serving | 69 (31.5%) | 150 (68.5%) |
| Cleaning & Maintenance | 91 (63.2%) | 53 (36.8%) |
| Personal Care & Service | 26 (44.8%) | 32 (55.2%) |
| Total (Category) | 287 (55.0%) | 235 (45.0%) |
| Total (Overall) | 2,413 (52.5%) | 2,180 (47.5%) |
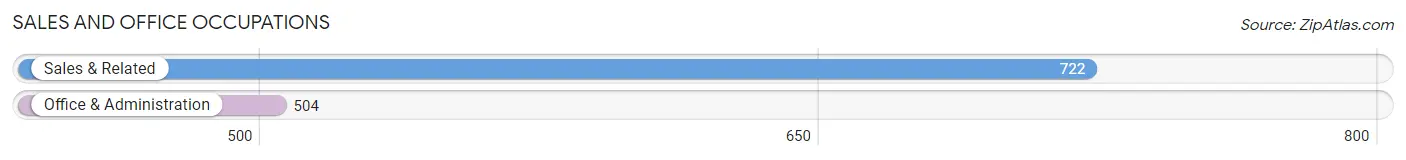
Sales and Office Occupations
The most common Sales and Office occupations in Landen are Sales & Related (722 | 15.7%), and Office & Administration (504 | 11.0%).
Sales and Office Occupations by Sex
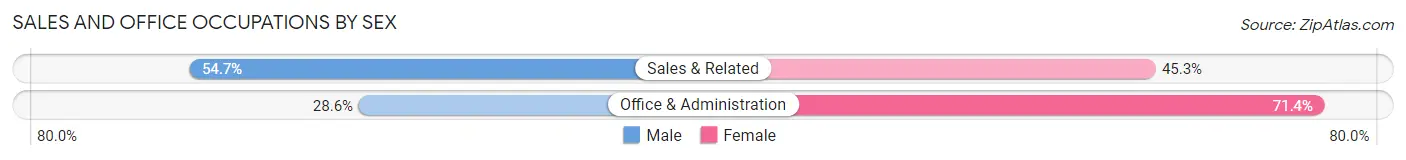
| Occupation | Male | Female |
| Sales & Related | 395 (54.7%) | 327 (45.3%) |
| Office & Administration | 144 (28.6%) | 360 (71.4%) |
| Total (Category) | 539 (44.0%) | 687 (56.0%) |
| Total (Overall) | 2,413 (52.5%) | 2,180 (47.5%) |
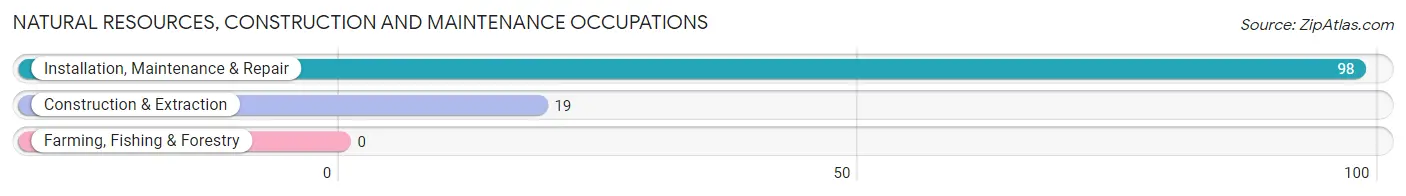
Natural Resources, Construction and Maintenance Occupations
The most common Natural Resources, Construction and Maintenance occupations in Landen are Installation, Maintenance & Repair (98 | 2.1%), and Construction & Extraction (19 | 0.4%).
Natural Resources, Construction and Maintenance Occupations by Sex
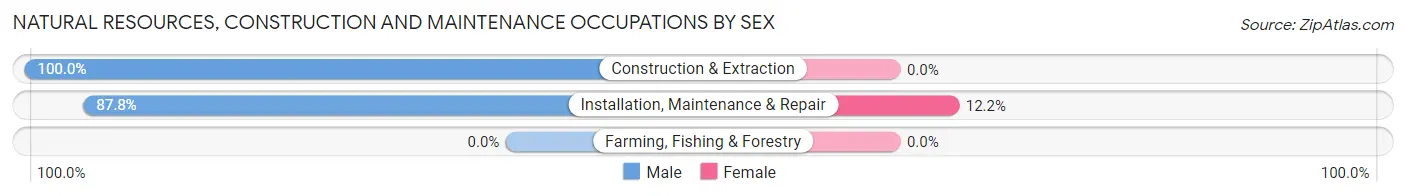
| Occupation | Male | Female |
| Farming, Fishing & Forestry | 0 (0.0%) | 0 (0.0%) |
| Construction & Extraction | 19 (100.0%) | 0 (0.0%) |
| Installation, Maintenance & Repair | 86 (87.8%) | 12 (12.2%) |
| Total (Category) | 105 (89.7%) | 12 (10.3%) |
| Total (Overall) | 2,413 (52.5%) | 2,180 (47.5%) |
Production, Transportation and Moving Occupations
The most common Production, Transportation and Moving occupations in Landen are Production (103 | 2.2%), Material Moving (61 | 1.3%), and Transportation (17 | 0.4%).
Production, Transportation and Moving Occupations by Sex
| Occupation | Male | Female |
| Production | 85 (82.5%) | 18 (17.5%) |
| Transportation | 17 (100.0%) | 0 (0.0%) |
| Material Moving | 54 (88.5%) | 7 (11.5%) |
| Total (Category) | 156 (86.2%) | 25 (13.8%) |
| Total (Overall) | 2,413 (52.5%) | 2,180 (47.5%) |
Employment Industries by Sex in Landen
Employment Industries in Landen
The major employment industries in Landen include Professional & Scientific (686 | 14.9%), Manufacturing (671 | 14.6%), Health Care & Social Assistance (591 | 12.9%), Educational Services (544 | 11.8%), and Retail Trade (417 | 9.1%).
Employment Industries by Sex in Landen
The Landen industries that see more men than women are Construction (100.0%), Utilities (100.0%), and Wholesale Trade (90.4%), whereas the industries that tend to have a higher number of women are Agriculture, Fishing & Hunting (100.0%), Arts, Entertainment & Recreation (74.3%), and Accommodation & Food Services (72.0%).
| Industry | Male | Female |
| Agriculture, Fishing & Hunting | 0 (0.0%) | 23 (100.0%) |
| Mining, Quarrying, & Extraction | 0 (0.0%) | 0 (0.0%) |
| Construction | 96 (100.0%) | 0 (0.0%) |
| Manufacturing | 438 (65.3%) | 233 (34.7%) |
| Wholesale Trade | 141 (90.4%) | 15 (9.6%) |
| Retail Trade | 249 (59.7%) | 168 (40.3%) |
| Transportation & Warehousing | 64 (59.3%) | 44 (40.7%) |
| Utilities | 21 (100.0%) | 0 (0.0%) |
| Information | 25 (55.6%) | 20 (44.4%) |
| Finance & Insurance | 176 (54.5%) | 147 (45.5%) |
| Real Estate, Rental & Leasing | 23 (44.2%) | 29 (55.8%) |
| Professional & Scientific | 421 (61.4%) | 265 (38.6%) |
| Enterprise Management | 0 (0.0%) | 0 (0.0%) |
| Administrative & Support | 76 (88.4%) | 10 (11.6%) |
| Educational Services | 211 (38.8%) | 333 (61.2%) |
| Health Care & Social Assistance | 174 (29.4%) | 417 (70.6%) |
| Arts, Entertainment & Recreation | 29 (25.7%) | 84 (74.3%) |
| Accommodation & Food Services | 104 (28.0%) | 268 (72.0%) |
| Public Administration | 87 (73.1%) | 32 (26.9%) |
| Total | 2,413 (52.5%) | 2,180 (47.5%) |
Education in Landen
School Enrollment in Landen
The most common levels of schooling among the 1,857 students in Landen are high school (449 | 24.2%), elementary school (432 | 23.3%), and middle school (423 | 22.8%).
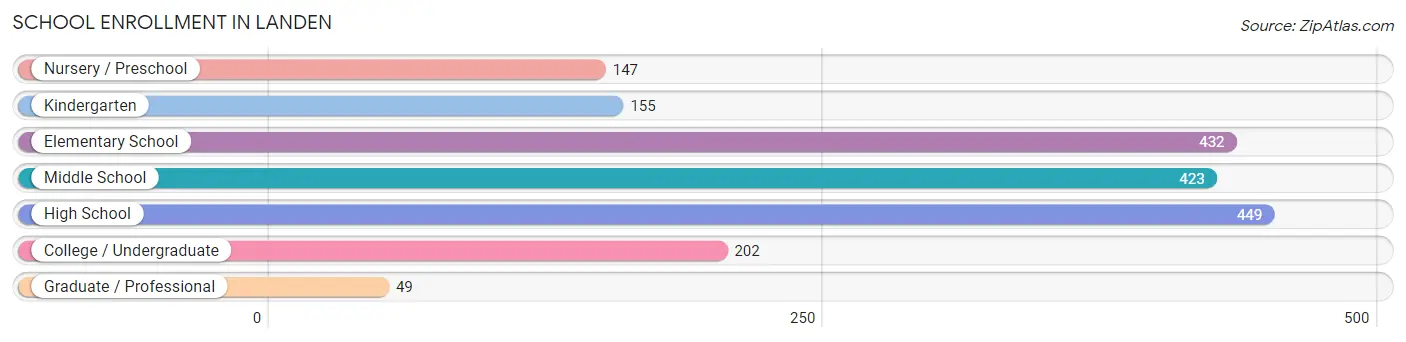
| School Level | # Students | % Students |
| Nursery / Preschool | 147 | 7.9% |
| Kindergarten | 155 | 8.4% |
| Elementary School | 432 | 23.3% |
| Middle School | 423 | 22.8% |
| High School | 449 | 24.2% |
| College / Undergraduate | 202 | 10.9% |
| Graduate / Professional | 49 | 2.6% |
| Total | 1,857 | 100.0% |
School Enrollment by Age by Funding Source in Landen
Out of a total of 1,857 students who are enrolled in schools in Landen, 219 (11.8%) attend a private institution, while the remaining 1,638 (88.2%) are enrolled in public schools. The age group of 3 to 4 year olds has the highest likelihood of being enrolled in private schools, with 52 (41.9% in the age bracket) enrolled. Conversely, the age group of 15 to 17 year olds has the lowest likelihood of being enrolled in a private school, with 372 (100.0% in the age bracket) attending a public institution.
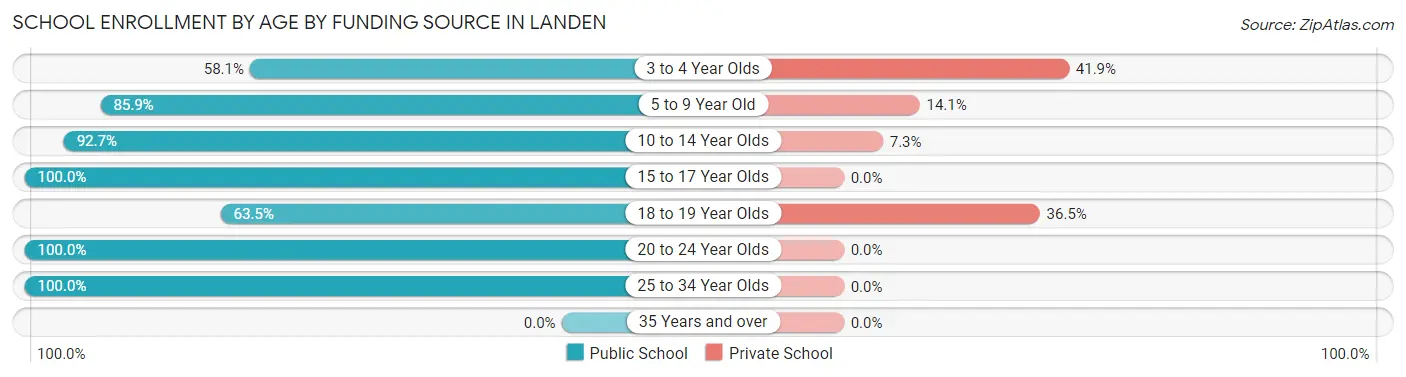
| Age Bracket | Public School | Private School |
| 3 to 4 Year Olds | 72 (58.1%) | 52 (41.9%) |
| 5 to 9 Year Old | 474 (85.9%) | 78 (14.1%) |
| 10 to 14 Year Olds | 496 (92.7%) | 39 (7.3%) |
| 15 to 17 Year Olds | 372 (100.0%) | 0 (0.0%) |
| 18 to 19 Year Olds | 87 (63.5%) | 50 (36.5%) |
| 20 to 24 Year Olds | 101 (100.0%) | 0 (0.0%) |
| 25 to 34 Year Olds | 36 (100.0%) | 0 (0.0%) |
| 35 Years and over | 0 (0.0%) | 0 (0.0%) |
| Total | 1,638 (88.2%) | 219 (11.8%) |
Educational Attainment by Field of Study in Landen
Business (821 | 22.1%), engineering (365 | 9.8%), science & technology (360 | 9.7%), education (359 | 9.7%), and bio, nature & agricultural (358 | 9.6%) are the most common fields of study among 3,721 individuals in Landen who have obtained a bachelor's degree or higher.
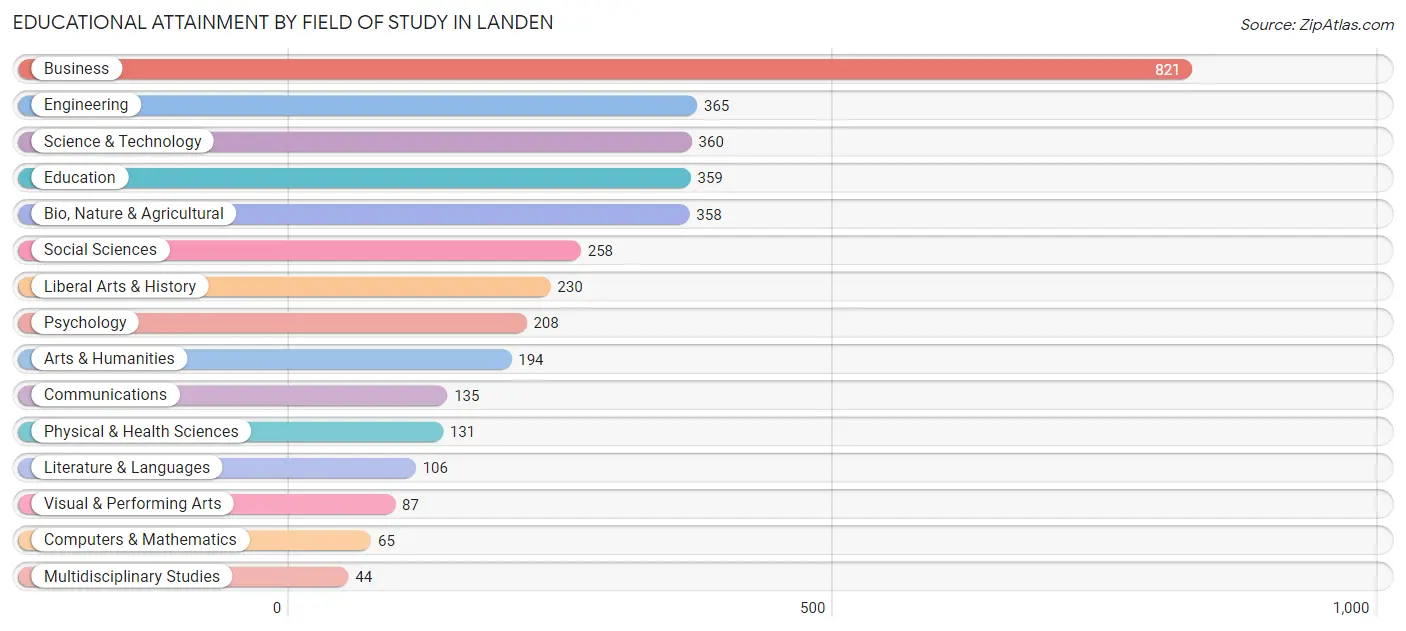
| Field of Study | # Graduates | % Graduates |
| Computers & Mathematics | 65 | 1.8% |
| Bio, Nature & Agricultural | 358 | 9.6% |
| Physical & Health Sciences | 131 | 3.5% |
| Psychology | 208 | 5.6% |
| Social Sciences | 258 | 6.9% |
| Engineering | 365 | 9.8% |
| Multidisciplinary Studies | 44 | 1.2% |
| Science & Technology | 360 | 9.7% |
| Business | 821 | 22.1% |
| Education | 359 | 9.7% |
| Literature & Languages | 106 | 2.9% |
| Liberal Arts & History | 230 | 6.2% |
| Visual & Performing Arts | 87 | 2.3% |
| Communications | 135 | 3.6% |
| Arts & Humanities | 194 | 5.2% |
| Total | 3,721 | 100.0% |
Transportation & Commute in Landen
Vehicle Availability by Sex in Landen
The most prevalent vehicle ownership categories in Landen are males with 2 vehicles (1,083, accounting for 44.9%) and females with 2 vehicles (924, making up 51.2%).
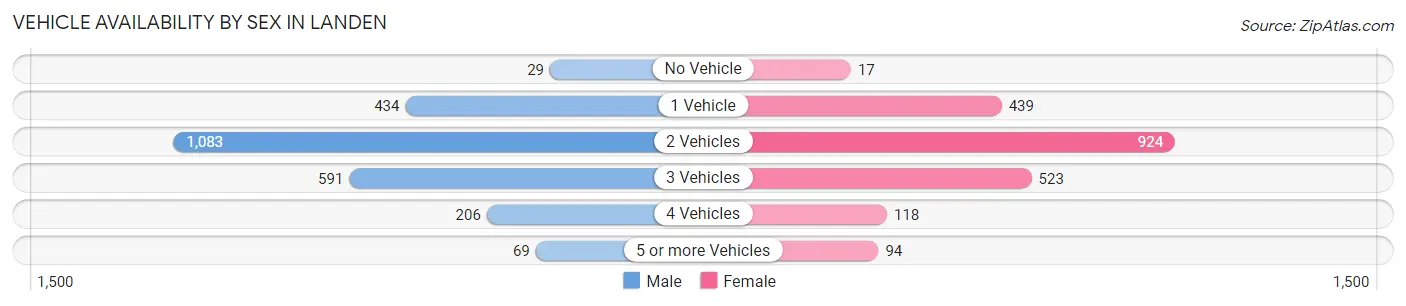
| Vehicles Available | Male | Female |
| No Vehicle | 29 (1.2%) | 17 (0.8%) |
| 1 Vehicle | 434 (18.0%) | 439 (20.8%) |
| 2 Vehicles | 1,083 (44.9%) | 924 (43.7%) |
| 3 Vehicles | 591 (24.5%) | 523 (24.7%) |
| 4 Vehicles | 206 (8.5%) | 118 (5.6%) |
| 5 or more Vehicles | 69 (2.9%) | 94 (4.4%) |
| Total | 2,412 (100.0%) | 2,115 (100.0%) |
Commute Time in Landen
The most frequently occuring commute durations in Landen are 30 to 34 minutes (608 commuters, 15.9%), 5 to 9 minutes (560 commuters, 14.7%), and 20 to 24 minutes (501 commuters, 13.1%).
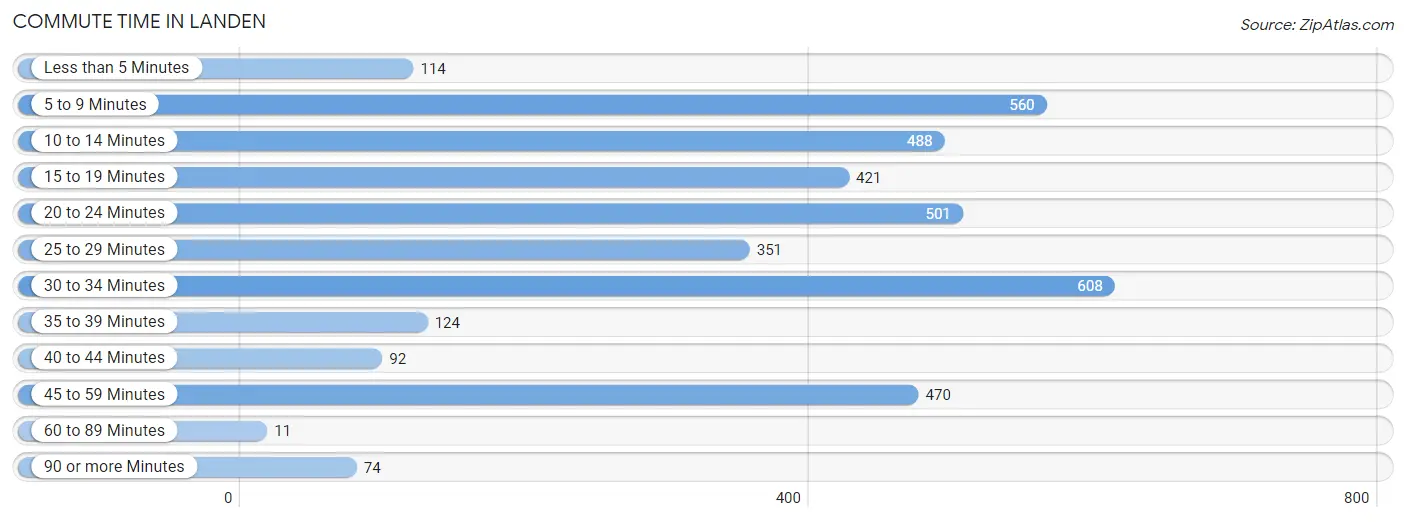
| Commute Time | # Commuters | % Commuters |
| Less than 5 Minutes | 114 | 3.0% |
| 5 to 9 Minutes | 560 | 14.7% |
| 10 to 14 Minutes | 488 | 12.8% |
| 15 to 19 Minutes | 421 | 11.0% |
| 20 to 24 Minutes | 501 | 13.1% |
| 25 to 29 Minutes | 351 | 9.2% |
| 30 to 34 Minutes | 608 | 15.9% |
| 35 to 39 Minutes | 124 | 3.3% |
| 40 to 44 Minutes | 92 | 2.4% |
| 45 to 59 Minutes | 470 | 12.3% |
| 60 to 89 Minutes | 11 | 0.3% |
| 90 or more Minutes | 74 | 1.9% |
Commute Time by Sex in Landen
The most common commute times in Landen are 20 to 24 minutes (370 commuters, 18.4%) for males and 5 to 9 minutes (289 commuters, 16.0%) for females.
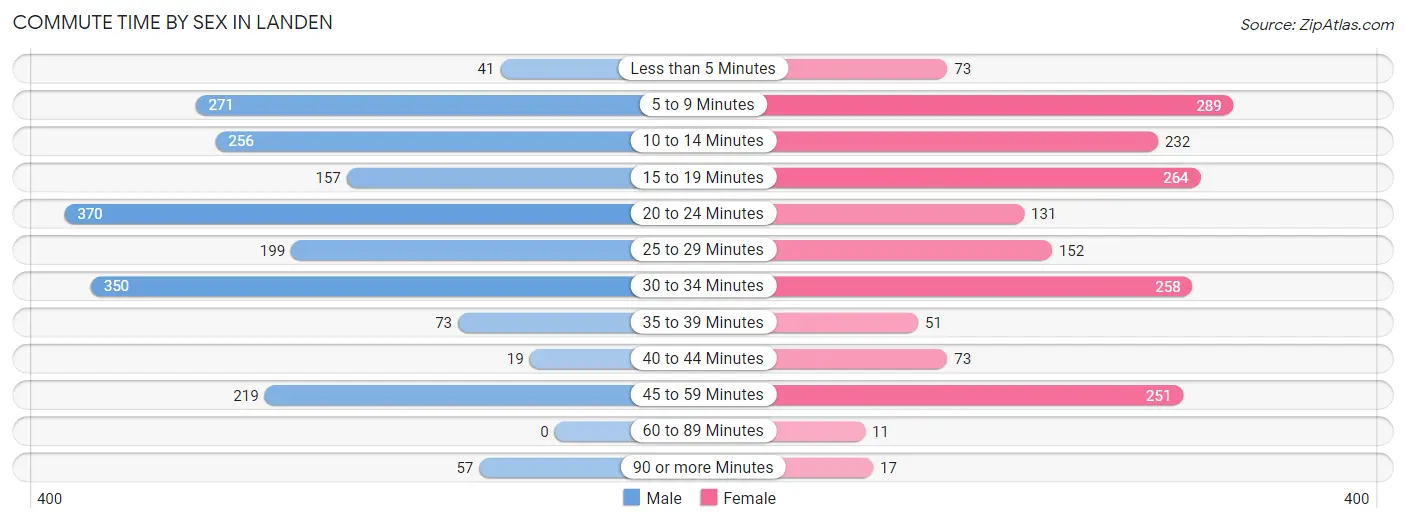
| Commute Time | Male | Female |
| Less than 5 Minutes | 41 (2.0%) | 73 (4.1%) |
| 5 to 9 Minutes | 271 (13.5%) | 289 (16.0%) |
| 10 to 14 Minutes | 256 (12.7%) | 232 (12.9%) |
| 15 to 19 Minutes | 157 (7.8%) | 264 (14.6%) |
| 20 to 24 Minutes | 370 (18.4%) | 131 (7.3%) |
| 25 to 29 Minutes | 199 (9.9%) | 152 (8.4%) |
| 30 to 34 Minutes | 350 (17.4%) | 258 (14.3%) |
| 35 to 39 Minutes | 73 (3.6%) | 51 (2.8%) |
| 40 to 44 Minutes | 19 (0.9%) | 73 (4.1%) |
| 45 to 59 Minutes | 219 (10.9%) | 251 (13.9%) |
| 60 to 89 Minutes | 0 (0.0%) | 11 (0.6%) |
| 90 or more Minutes | 57 (2.8%) | 17 (0.9%) |
Time of Departure to Work by Sex in Landen
The most frequent times of departure to work in Landen are 8:00 AM to 8:29 AM (364, 18.1%) for males and 7:30 AM to 7:59 AM (331, 18.4%) for females.
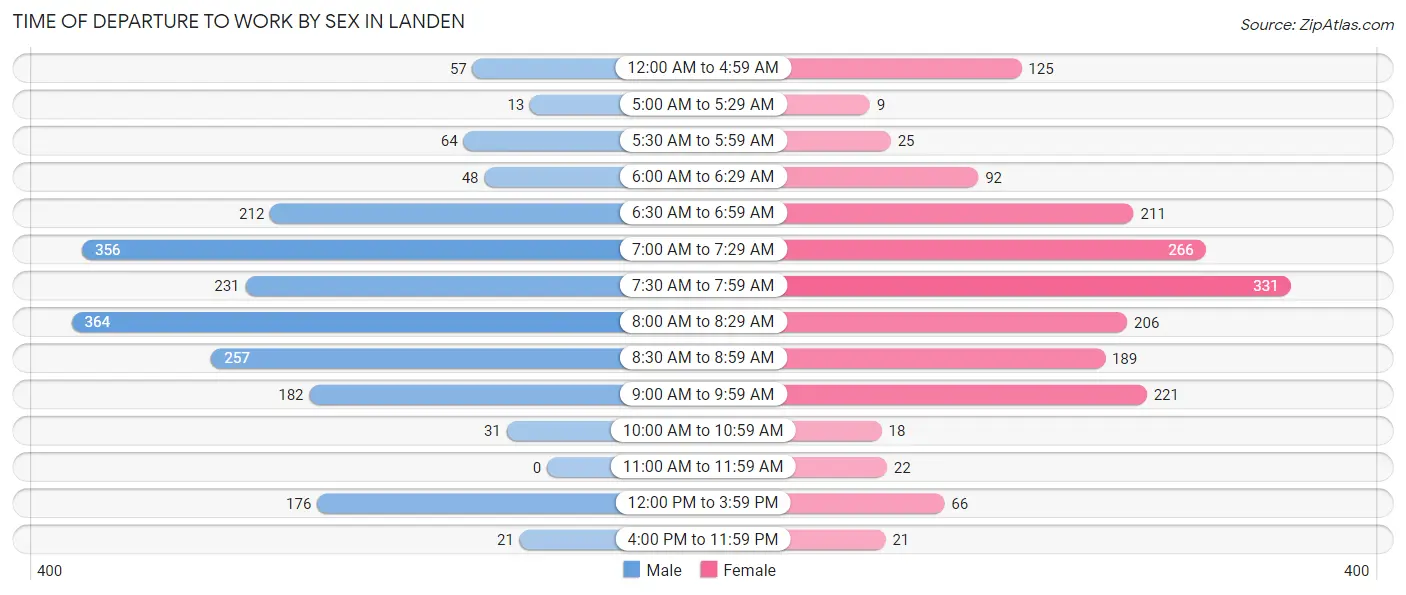
| Time of Departure | Male | Female |
| 12:00 AM to 4:59 AM | 57 (2.8%) | 125 (6.9%) |
| 5:00 AM to 5:29 AM | 13 (0.6%) | 9 (0.5%) |
| 5:30 AM to 5:59 AM | 64 (3.2%) | 25 (1.4%) |
| 6:00 AM to 6:29 AM | 48 (2.4%) | 92 (5.1%) |
| 6:30 AM to 6:59 AM | 212 (10.5%) | 211 (11.7%) |
| 7:00 AM to 7:29 AM | 356 (17.7%) | 266 (14.8%) |
| 7:30 AM to 7:59 AM | 231 (11.5%) | 331 (18.4%) |
| 8:00 AM to 8:29 AM | 364 (18.1%) | 206 (11.4%) |
| 8:30 AM to 8:59 AM | 257 (12.8%) | 189 (10.5%) |
| 9:00 AM to 9:59 AM | 182 (9.0%) | 221 (12.3%) |
| 10:00 AM to 10:59 AM | 31 (1.5%) | 18 (1.0%) |
| 11:00 AM to 11:59 AM | 0 (0.0%) | 22 (1.2%) |
| 12:00 PM to 3:59 PM | 176 (8.7%) | 66 (3.7%) |
| 4:00 PM to 11:59 PM | 21 (1.0%) | 21 (1.2%) |
| Total | 2,012 (100.0%) | 1,802 (100.0%) |
Housing Occupancy in Landen
Occupancy by Ownership in Landen
Of the total 3,242 dwellings in Landen, owner-occupied units account for 2,833 (87.4%), while renter-occupied units make up 409 (12.6%).
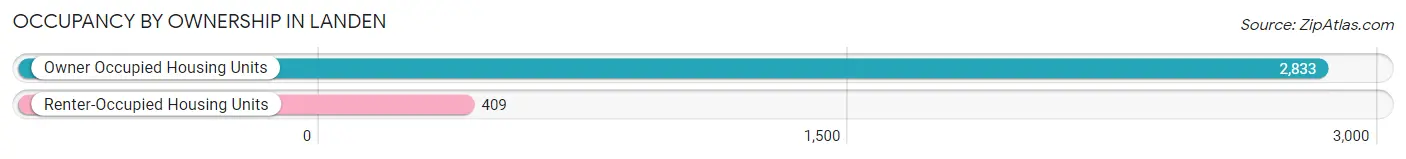
| Occupancy | # Housing Units | % Housing Units |
| Owner Occupied Housing Units | 2,833 | 87.4% |
| Renter-Occupied Housing Units | 409 | 12.6% |
| Total Occupied Housing Units | 3,242 | 100.0% |
Occupancy by Household Size in Landen
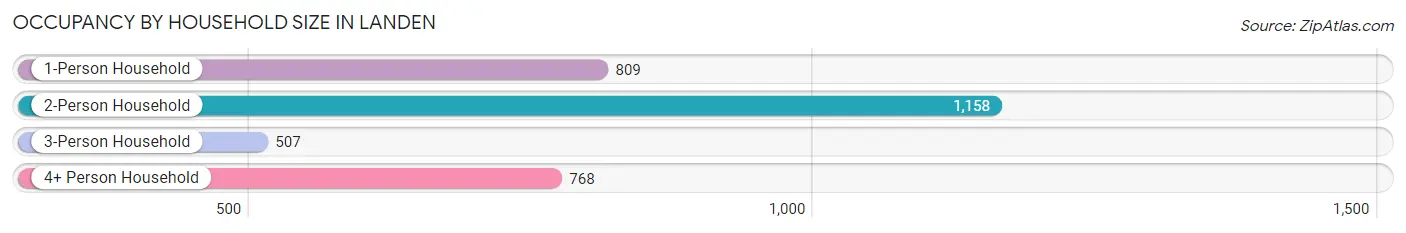
| Household Size | # Housing Units | % Housing Units |
| 1-Person Household | 809 | 24.9% |
| 2-Person Household | 1,158 | 35.7% |
| 3-Person Household | 507 | 15.6% |
| 4+ Person Household | 768 | 23.7% |
| Total Housing Units | 3,242 | 100.0% |
Occupancy by Ownership by Household Size in Landen
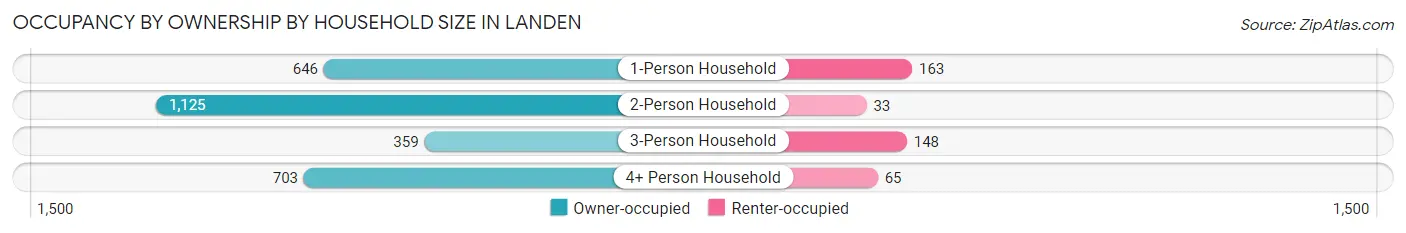
| Household Size | Owner-occupied | Renter-occupied |
| 1-Person Household | 646 (79.8%) | 163 (20.2%) |
| 2-Person Household | 1,125 (97.2%) | 33 (2.9%) |
| 3-Person Household | 359 (70.8%) | 148 (29.2%) |
| 4+ Person Household | 703 (91.5%) | 65 (8.5%) |
| Total Housing Units | 2,833 (87.4%) | 409 (12.6%) |
Occupancy by Educational Attainment in Landen
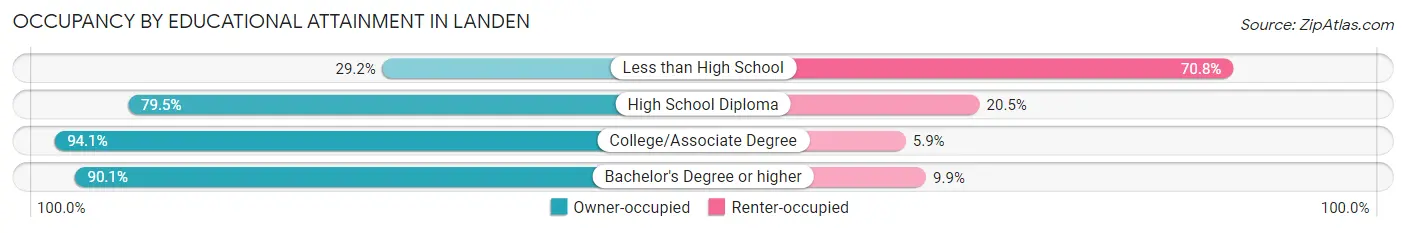
| Household Size | Owner-occupied | Renter-occupied |
| Less than High School | 19 (29.2%) | 46 (70.8%) |
| High School Diploma | 519 (79.5%) | 134 (20.5%) |
| College/Associate Degree | 496 (94.1%) | 31 (5.9%) |
| Bachelor's Degree or higher | 1,799 (90.1%) | 198 (9.9%) |
Occupancy by Age of Householder in Landen
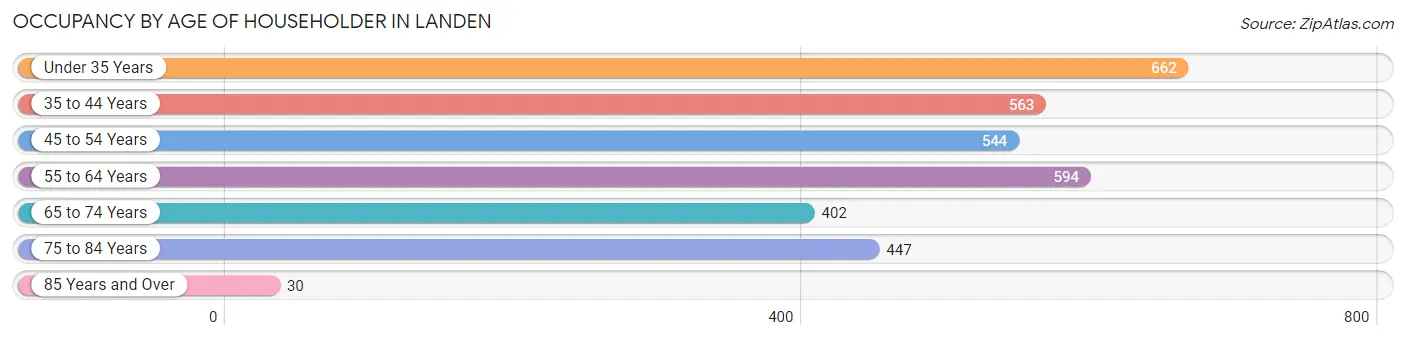
| Age Bracket | # Households | % Households |
| Under 35 Years | 662 | 20.4% |
| 35 to 44 Years | 563 | 17.4% |
| 45 to 54 Years | 544 | 16.8% |
| 55 to 64 Years | 594 | 18.3% |
| 65 to 74 Years | 402 | 12.4% |
| 75 to 84 Years | 447 | 13.8% |
| 85 Years and Over | 30 | 0.9% |
| Total | 3,242 | 100.0% |
Housing Finances in Landen
Median Income by Occupancy in Landen
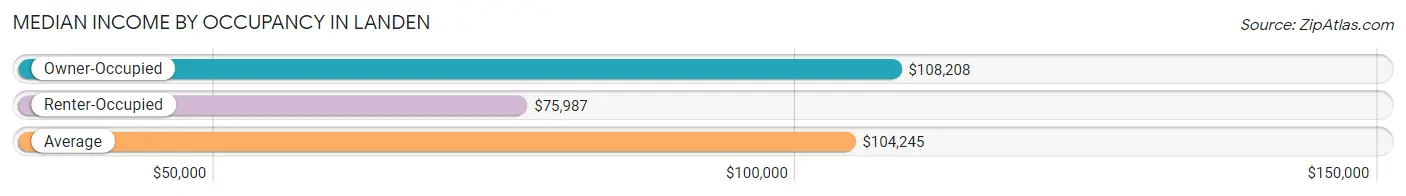
| Occupancy Type | # Households | Median Income |
| Owner-Occupied | 2,833 (87.4%) | $108,208 |
| Renter-Occupied | 409 (12.6%) | $75,987 |
| Average | 3,242 (100.0%) | $104,245 |
Occupancy by Householder Income Bracket in Landen
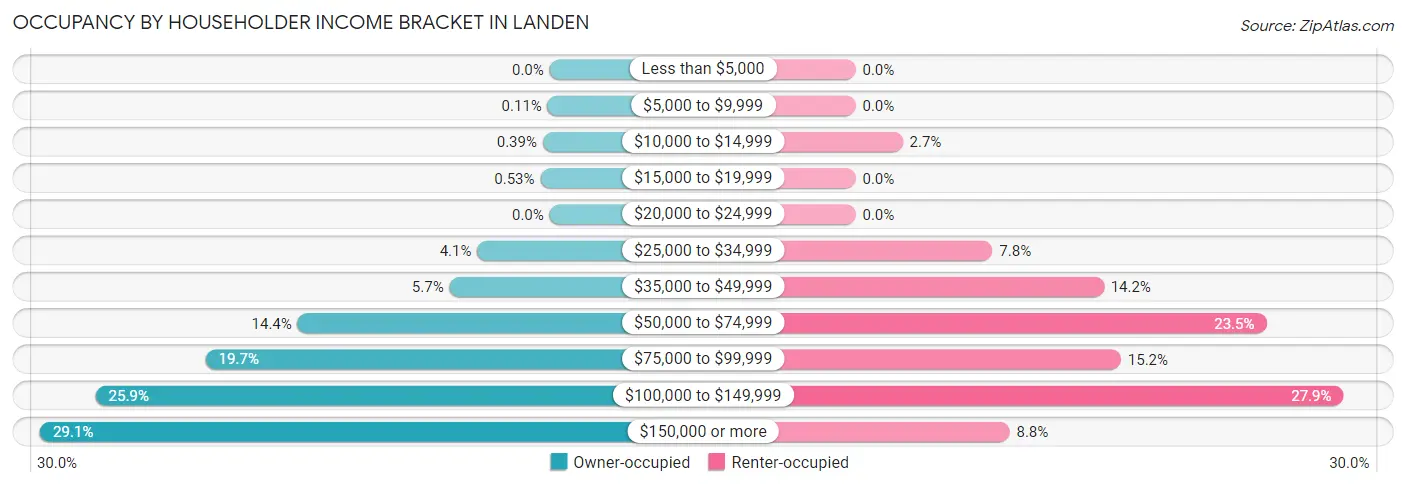
| Income Bracket | Owner-occupied | Renter-occupied |
| Less than $5,000 | 0 (0.0%) | 0 (0.0%) |
| $5,000 to $9,999 | 3 (0.1%) | 0 (0.0%) |
| $10,000 to $14,999 | 11 (0.4%) | 11 (2.7%) |
| $15,000 to $19,999 | 15 (0.5%) | 0 (0.0%) |
| $20,000 to $24,999 | 0 (0.0%) | 0 (0.0%) |
| $25,000 to $34,999 | 117 (4.1%) | 32 (7.8%) |
| $35,000 to $49,999 | 162 (5.7%) | 58 (14.2%) |
| $50,000 to $74,999 | 408 (14.4%) | 96 (23.5%) |
| $75,000 to $99,999 | 557 (19.7%) | 62 (15.2%) |
| $100,000 to $149,999 | 735 (25.9%) | 114 (27.9%) |
| $150,000 or more | 825 (29.1%) | 36 (8.8%) |
| Total | 2,833 (100.0%) | 409 (100.0%) |
Monthly Housing Cost Tiers in Landen
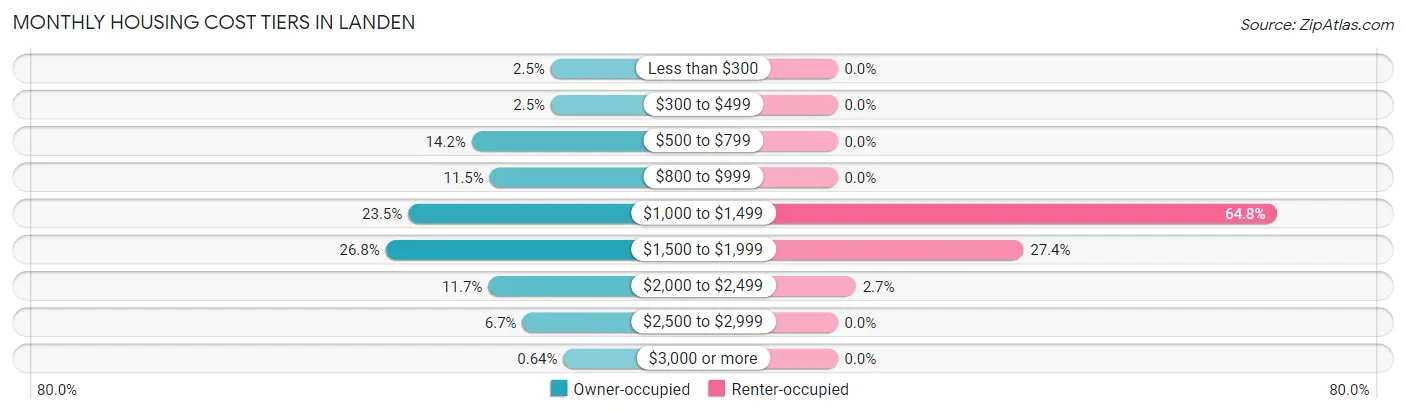
| Monthly Cost | Owner-occupied | Renter-occupied |
| Less than $300 | 71 (2.5%) | 0 (0.0%) |
| $300 to $499 | 70 (2.5%) | 0 (0.0%) |
| $500 to $799 | 401 (14.1%) | 0 (0.0%) |
| $800 to $999 | 326 (11.5%) | 0 (0.0%) |
| $1,000 to $1,499 | 666 (23.5%) | 265 (64.8%) |
| $1,500 to $1,999 | 760 (26.8%) | 112 (27.4%) |
| $2,000 to $2,499 | 332 (11.7%) | 11 (2.7%) |
| $2,500 to $2,999 | 189 (6.7%) | 0 (0.0%) |
| $3,000 or more | 18 (0.6%) | 0 (0.0%) |
| Total | 2,833 (100.0%) | 409 (100.0%) |
Physical Housing Characteristics in Landen
Housing Structures in Landen
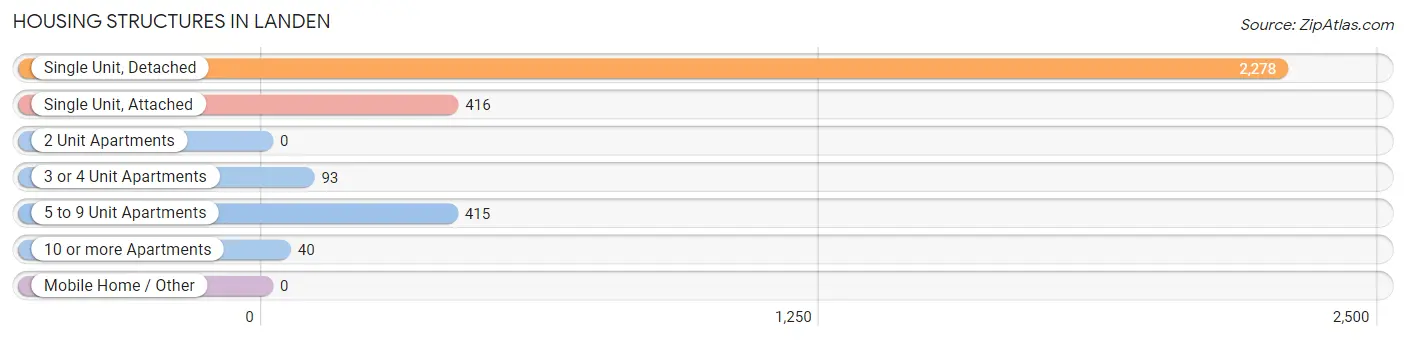
| Structure Type | # Housing Units | % Housing Units |
| Single Unit, Detached | 2,278 | 70.3% |
| Single Unit, Attached | 416 | 12.8% |
| 2 Unit Apartments | 0 | 0.0% |
| 3 or 4 Unit Apartments | 93 | 2.9% |
| 5 to 9 Unit Apartments | 415 | 12.8% |
| 10 or more Apartments | 40 | 1.2% |
| Mobile Home / Other | 0 | 0.0% |
| Total | 3,242 | 100.0% |
Housing Structures by Occupancy in Landen
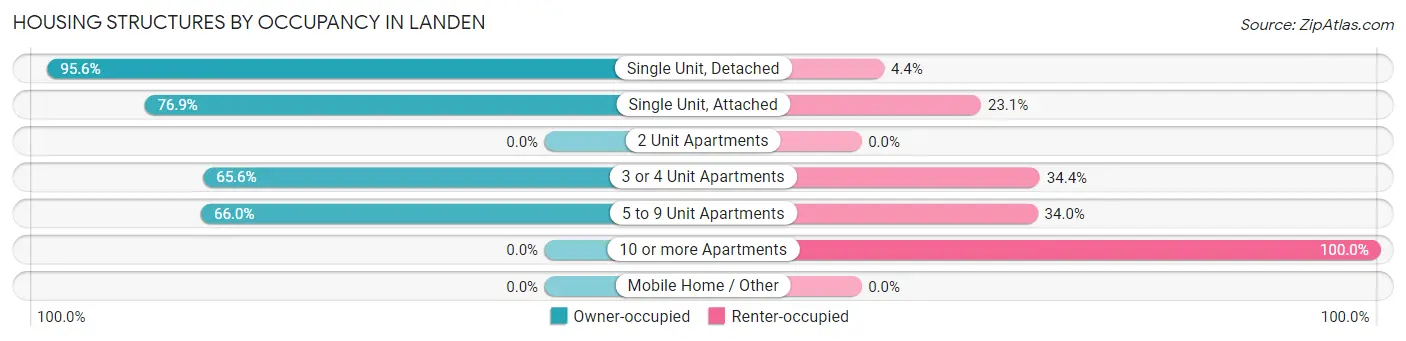
| Structure Type | Owner-occupied | Renter-occupied |
| Single Unit, Detached | 2,178 (95.6%) | 100 (4.4%) |
| Single Unit, Attached | 320 (76.9%) | 96 (23.1%) |
| 2 Unit Apartments | 0 (0.0%) | 0 (0.0%) |
| 3 or 4 Unit Apartments | 61 (65.6%) | 32 (34.4%) |
| 5 to 9 Unit Apartments | 274 (66.0%) | 141 (34.0%) |
| 10 or more Apartments | 0 (0.0%) | 40 (100.0%) |
| Mobile Home / Other | 0 (0.0%) | 0 (0.0%) |
| Total | 2,833 (87.4%) | 409 (12.6%) |
Housing Structures by Number of Rooms in Landen
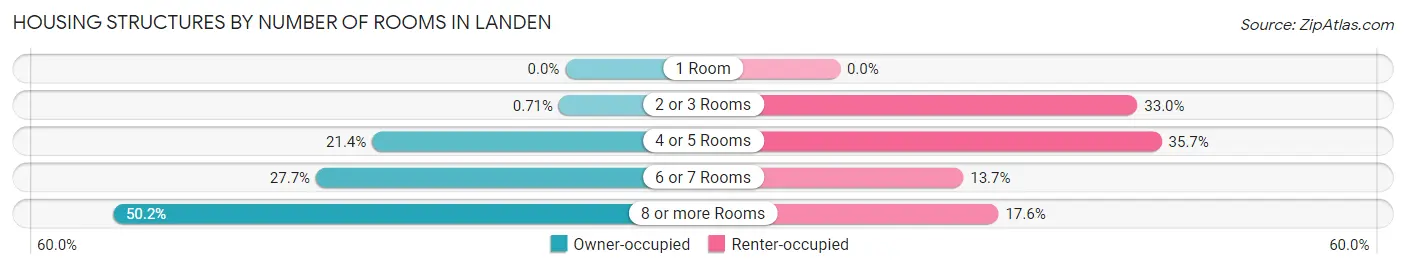
| Number of Rooms | Owner-occupied | Renter-occupied |
| 1 Room | 0 (0.0%) | 0 (0.0%) |
| 2 or 3 Rooms | 20 (0.7%) | 135 (33.0%) |
| 4 or 5 Rooms | 607 (21.4%) | 146 (35.7%) |
| 6 or 7 Rooms | 784 (27.7%) | 56 (13.7%) |
| 8 or more Rooms | 1,422 (50.2%) | 72 (17.6%) |
| Total | 2,833 (100.0%) | 409 (100.0%) |
Housing Structure by Heating Type in Landen
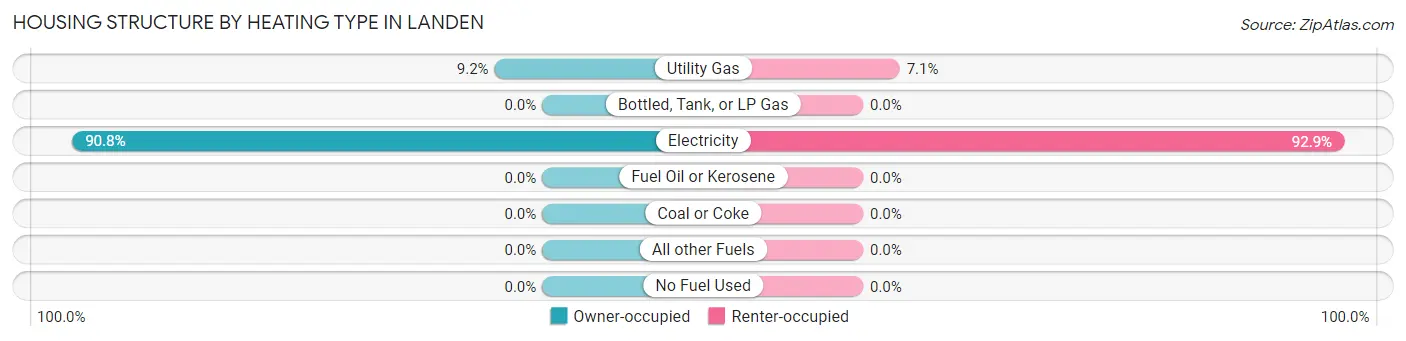
| Heating Type | Owner-occupied | Renter-occupied |
| Utility Gas | 261 (9.2%) | 29 (7.1%) |
| Bottled, Tank, or LP Gas | 0 (0.0%) | 0 (0.0%) |
| Electricity | 2,572 (90.8%) | 380 (92.9%) |
| Fuel Oil or Kerosene | 0 (0.0%) | 0 (0.0%) |
| Coal or Coke | 0 (0.0%) | 0 (0.0%) |
| All other Fuels | 0 (0.0%) | 0 (0.0%) |
| No Fuel Used | 0 (0.0%) | 0 (0.0%) |
| Total | 2,833 (100.0%) | 409 (100.0%) |
Household Vehicle Usage in Landen
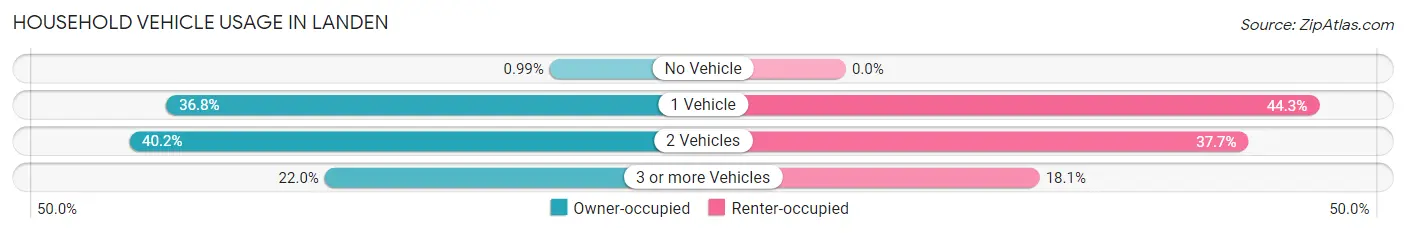
| Vehicles per Household | Owner-occupied | Renter-occupied |
| No Vehicle | 28 (1.0%) | 0 (0.0%) |
| 1 Vehicle | 1,042 (36.8%) | 181 (44.3%) |
| 2 Vehicles | 1,140 (40.2%) | 154 (37.7%) |
| 3 or more Vehicles | 623 (22.0%) | 74 (18.1%) |
| Total | 2,833 (100.0%) | 409 (100.0%) |
Real Estate & Mortgages in Landen
Real Estate and Mortgage Overview in Landen
| Characteristic | Without Mortgage | With Mortgage |
| Housing Units | 716 | 2,117 |
| Median Property Value | $260,900 | $259,700 |
| Median Household Income | $98,365 | $661 |
| Monthly Housing Costs | $710 | $18 |
| Real Estate Taxes | $3,665 | $24 |
Property Value by Mortgage Status in Landen
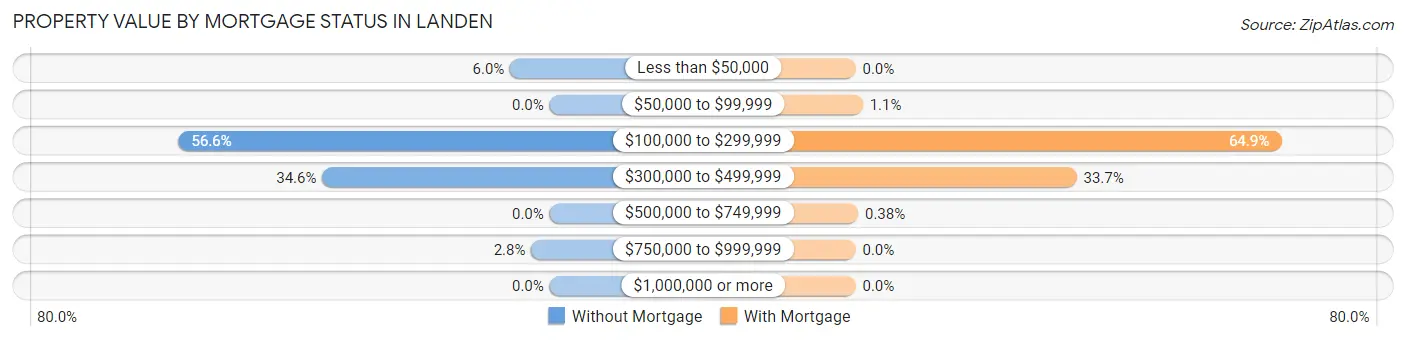
| Property Value | Without Mortgage | With Mortgage |
| Less than $50,000 | 43 (6.0%) | 0 (0.0%) |
| $50,000 to $99,999 | 0 (0.0%) | 23 (1.1%) |
| $100,000 to $299,999 | 405 (56.6%) | 1,373 (64.9%) |
| $300,000 to $499,999 | 248 (34.6%) | 713 (33.7%) |
| $500,000 to $749,999 | 0 (0.0%) | 8 (0.4%) |
| $750,000 to $999,999 | 20 (2.8%) | 0 (0.0%) |
| $1,000,000 or more | 0 (0.0%) | 0 (0.0%) |
| Total | 716 (100.0%) | 2,117 (100.0%) |
Household Income by Mortgage Status in Landen
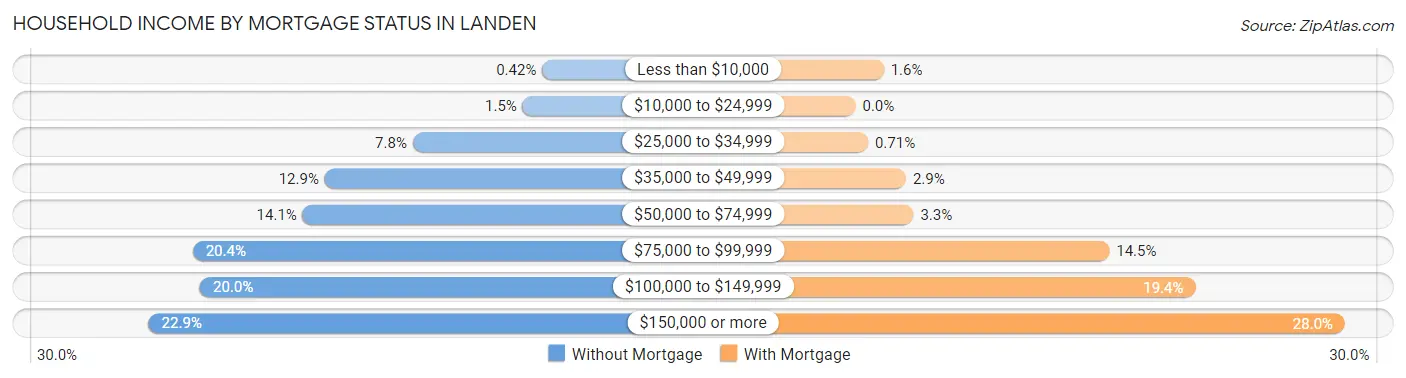
| Household Income | Without Mortgage | With Mortgage |
| Less than $10,000 | 3 (0.4%) | 34 (1.6%) |
| $10,000 to $24,999 | 11 (1.5%) | 0 (0.0%) |
| $25,000 to $34,999 | 56 (7.8%) | 15 (0.7%) |
| $35,000 to $49,999 | 92 (12.9%) | 61 (2.9%) |
| $50,000 to $74,999 | 101 (14.1%) | 70 (3.3%) |
| $75,000 to $99,999 | 146 (20.4%) | 307 (14.5%) |
| $100,000 to $149,999 | 143 (20.0%) | 411 (19.4%) |
| $150,000 or more | 164 (22.9%) | 592 (28.0%) |
| Total | 716 (100.0%) | 2,117 (100.0%) |
Property Value to Household Income Ratio in Landen
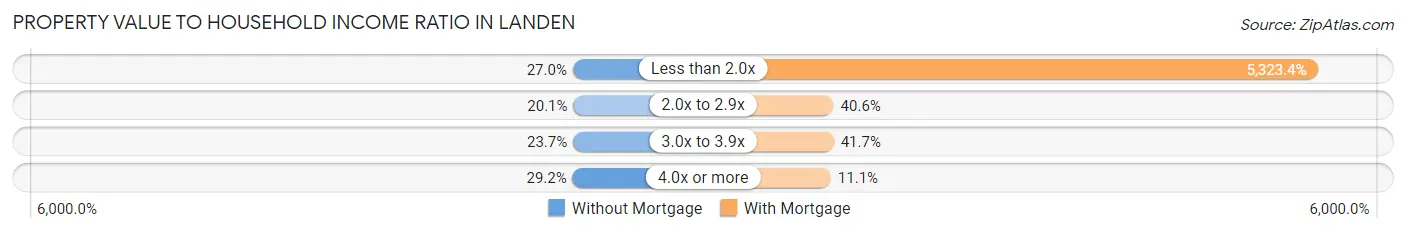
| Value-to-Income Ratio | Without Mortgage | With Mortgage |
| Less than 2.0x | 193 (27.0%) | 112,697 (5,323.4%) |
| 2.0x to 2.9x | 144 (20.1%) | 859 (40.6%) |
| 3.0x to 3.9x | 170 (23.7%) | 883 (41.7%) |
| 4.0x or more | 209 (29.2%) | 234 (11.1%) |
| Total | 716 (100.0%) | 2,117 (100.0%) |
Real Estate Taxes by Mortgage Status in Landen
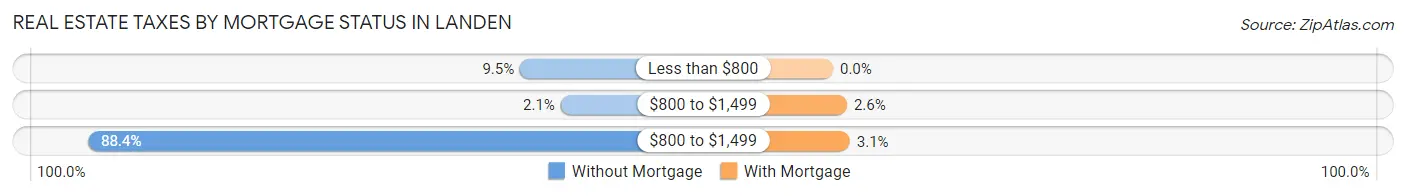
| Property Taxes | Without Mortgage | With Mortgage |
| Less than $800 | 68 (9.5%) | 0 (0.0%) |
| $800 to $1,499 | 15 (2.1%) | 54 (2.5%) |
| $800 to $1,499 | 633 (88.4%) | 65 (3.1%) |
| Total | 716 (100.0%) | 2,117 (100.0%) |
Health & Disability in Landen
Health Insurance Coverage by Age in Landen
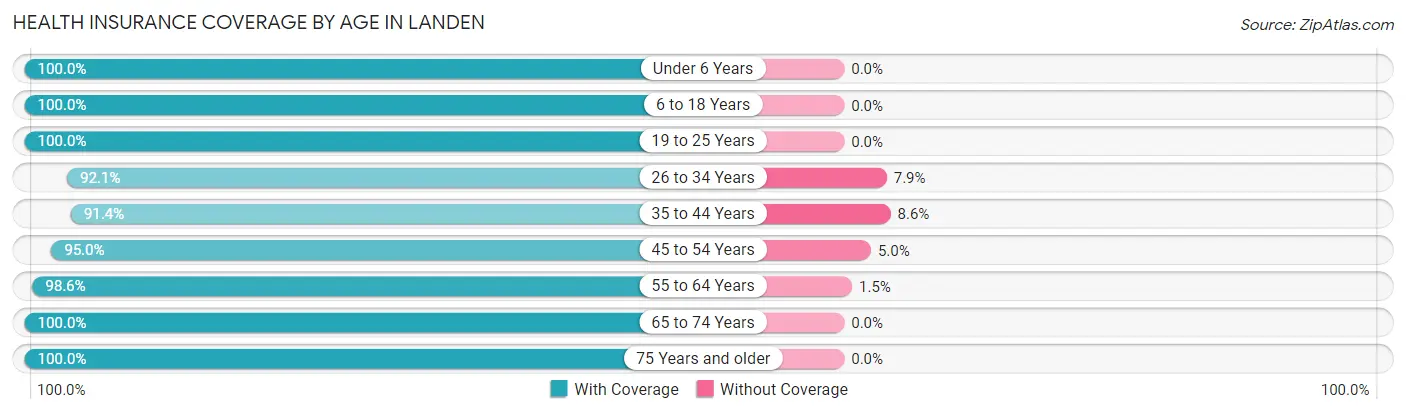
| Age Bracket | With Coverage | Without Coverage |
| Under 6 Years | 533 (100.0%) | 0 (0.0%) |
| 6 to 18 Years | 1,445 (100.0%) | 0 (0.0%) |
| 19 to 25 Years | 478 (100.0%) | 0 (0.0%) |
| 26 to 34 Years | 965 (92.1%) | 83 (7.9%) |
| 35 to 44 Years | 921 (91.4%) | 87 (8.6%) |
| 45 to 54 Years | 993 (95.0%) | 52 (5.0%) |
| 55 to 64 Years | 1,158 (98.6%) | 17 (1.5%) |
| 65 to 74 Years | 850 (100.0%) | 0 (0.0%) |
| 75 Years and older | 567 (100.0%) | 0 (0.0%) |
| Total | 7,910 (97.1%) | 239 (2.9%) |
Health Insurance Coverage by Citizenship Status in Landen
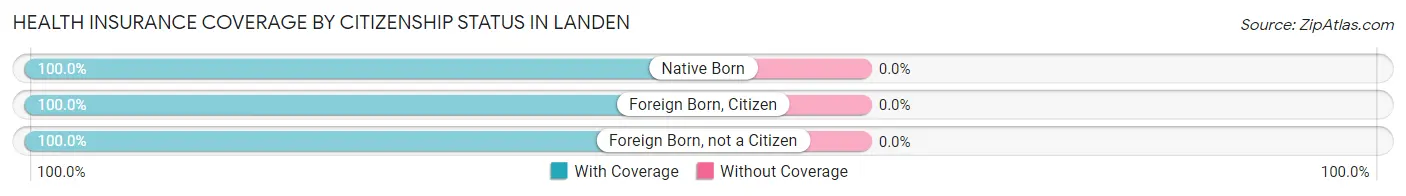
| Citizenship Status | With Coverage | Without Coverage |
| Native Born | 533 (100.0%) | 0 (0.0%) |
| Foreign Born, Citizen | 1,445 (100.0%) | 0 (0.0%) |
| Foreign Born, not a Citizen | 478 (100.0%) | 0 (0.0%) |
Health Insurance Coverage by Household Income in Landen
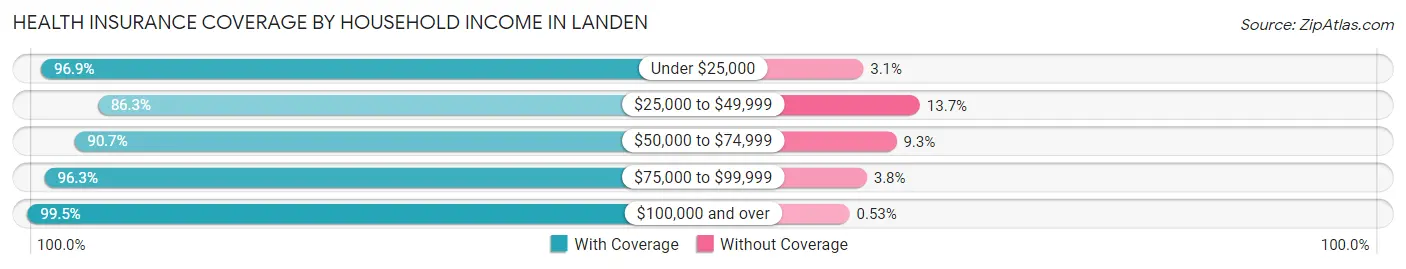
| Household Income | With Coverage | Without Coverage |
| Under $25,000 | 94 (96.9%) | 3 (3.1%) |
| $25,000 to $49,999 | 548 (86.3%) | 87 (13.7%) |
| $50,000 to $74,999 | 672 (90.7%) | 69 (9.3%) |
| $75,000 to $99,999 | 1,335 (96.3%) | 52 (3.7%) |
| $100,000 and over | 5,257 (99.5%) | 28 (0.5%) |
Public vs Private Health Insurance Coverage by Age in Landen
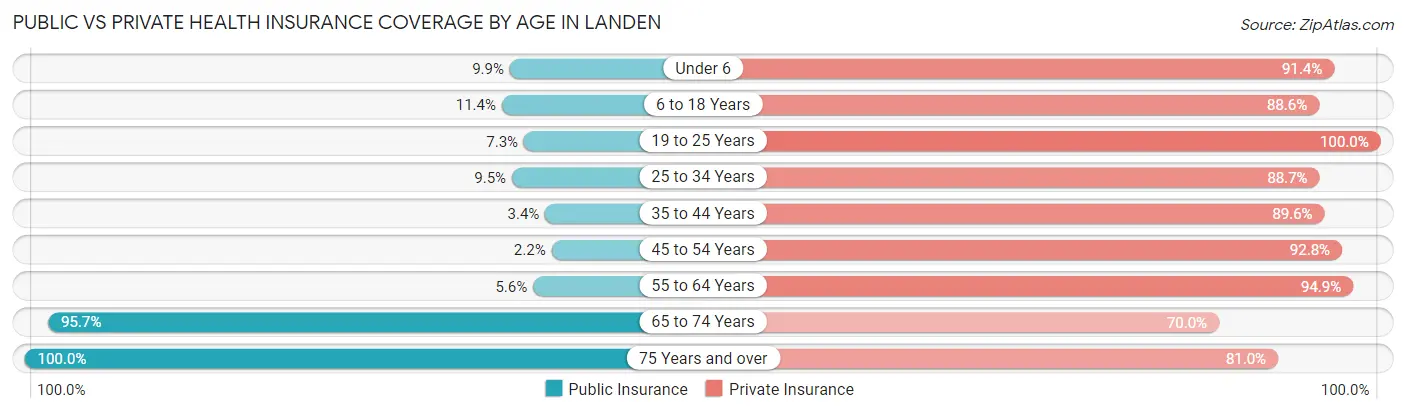
| Age Bracket | Public Insurance | Private Insurance |
| Under 6 | 53 (9.9%) | 487 (91.4%) |
| 6 to 18 Years | 165 (11.4%) | 1,280 (88.6%) |
| 19 to 25 Years | 35 (7.3%) | 478 (100.0%) |
| 25 to 34 Years | 100 (9.5%) | 929 (88.6%) |
| 35 to 44 Years | 34 (3.4%) | 903 (89.6%) |
| 45 to 54 Years | 23 (2.2%) | 970 (92.8%) |
| 55 to 64 Years | 66 (5.6%) | 1,115 (94.9%) |
| 65 to 74 Years | 813 (95.7%) | 595 (70.0%) |
| 75 Years and over | 567 (100.0%) | 459 (80.9%) |
| Total | 1,856 (22.8%) | 7,216 (88.5%) |
Disability Status by Sex by Age in Landen

| Age Bracket | Male | Female |
| Under 5 Years | 0 (0.0%) | 0 (0.0%) |
| 5 to 17 Years | 150 (22.2%) | 55 (7.0%) |
| 18 to 34 Years | 21 (2.9%) | 0 (0.0%) |
| 35 to 64 Years | 35 (2.2%) | 200 (12.4%) |
| 65 to 74 Years | 182 (39.9%) | 41 (10.4%) |
| 75 Years and over | 163 (71.5%) | 273 (80.5%) |
Disability Class by Sex by Age in Landen
Disability Class: Hearing Difficulty
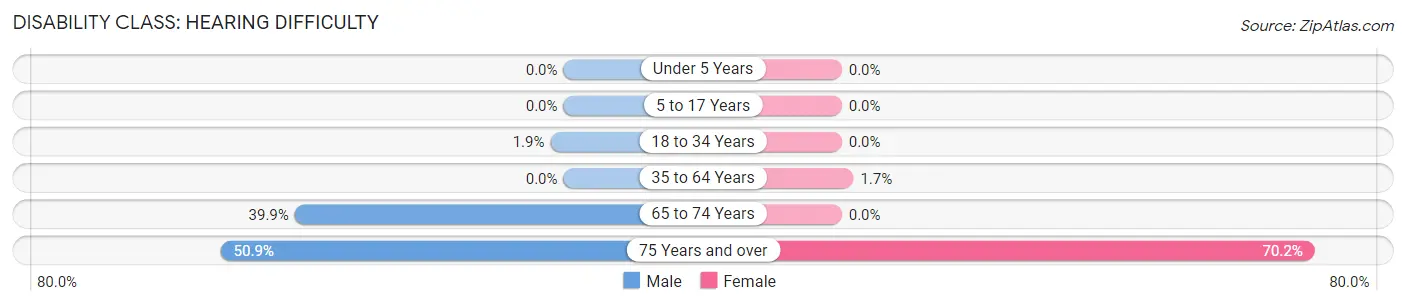
| Age Bracket | Male | Female |
| Under 5 Years | 0 (0.0%) | 0 (0.0%) |
| 5 to 17 Years | 0 (0.0%) | 0 (0.0%) |
| 18 to 34 Years | 14 (1.9%) | 0 (0.0%) |
| 35 to 64 Years | 0 (0.0%) | 28 (1.7%) |
| 65 to 74 Years | 182 (39.9%) | 0 (0.0%) |
| 75 Years and over | 116 (50.9%) | 238 (70.2%) |
Disability Class: Vision Difficulty
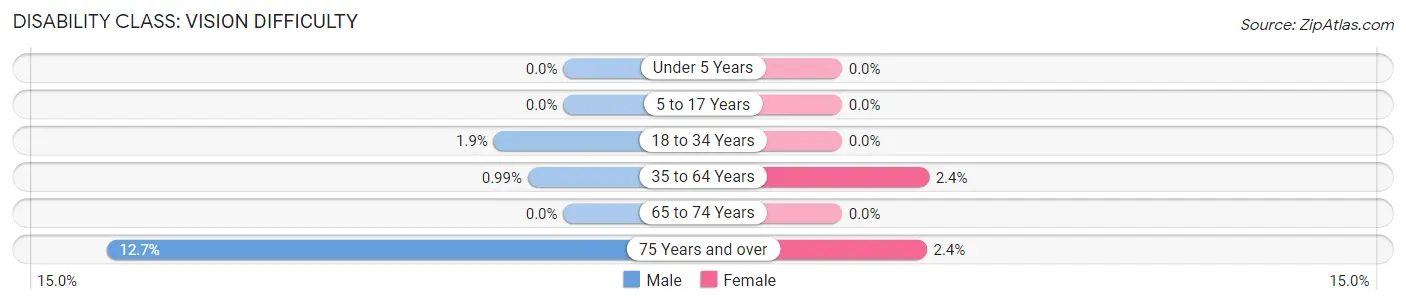
| Age Bracket | Male | Female |
| Under 5 Years | 0 (0.0%) | 0 (0.0%) |
| 5 to 17 Years | 0 (0.0%) | 0 (0.0%) |
| 18 to 34 Years | 14 (1.9%) | 0 (0.0%) |
| 35 to 64 Years | 16 (1.0%) | 39 (2.4%) |
| 65 to 74 Years | 0 (0.0%) | 0 (0.0%) |
| 75 Years and over | 29 (12.7%) | 8 (2.4%) |
Disability Class: Cognitive Difficulty
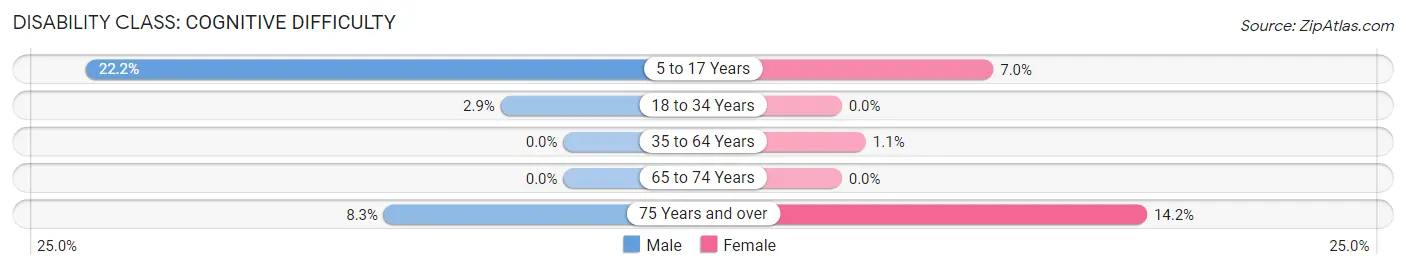
| Age Bracket | Male | Female |
| 5 to 17 Years | 150 (22.2%) | 55 (7.0%) |
| 18 to 34 Years | 21 (2.9%) | 0 (0.0%) |
| 35 to 64 Years | 0 (0.0%) | 18 (1.1%) |
| 65 to 74 Years | 0 (0.0%) | 0 (0.0%) |
| 75 Years and over | 19 (8.3%) | 48 (14.2%) |
Disability Class: Ambulatory Difficulty
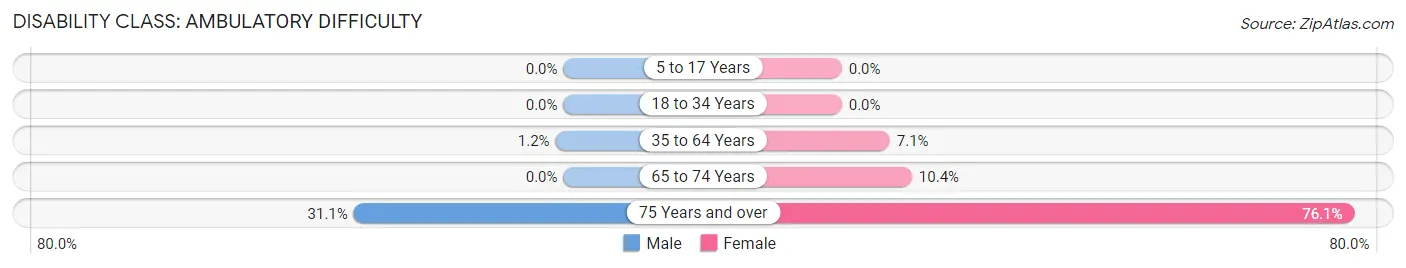
| Age Bracket | Male | Female |
| 5 to 17 Years | 0 (0.0%) | 0 (0.0%) |
| 18 to 34 Years | 0 (0.0%) | 0 (0.0%) |
| 35 to 64 Years | 19 (1.2%) | 115 (7.1%) |
| 65 to 74 Years | 0 (0.0%) | 41 (10.4%) |
| 75 Years and over | 71 (31.1%) | 258 (76.1%) |
Disability Class: Self-Care Difficulty
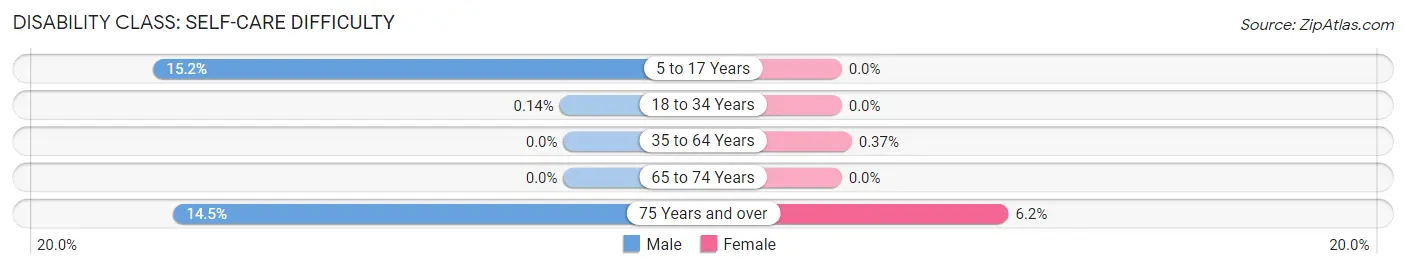
| Age Bracket | Male | Female |
| 5 to 17 Years | 103 (15.2%) | 0 (0.0%) |
| 18 to 34 Years | 1 (0.1%) | 0 (0.0%) |
| 35 to 64 Years | 0 (0.0%) | 6 (0.4%) |
| 65 to 74 Years | 0 (0.0%) | 0 (0.0%) |
| 75 Years and over | 33 (14.5%) | 21 (6.2%) |
Technology Access in Landen
Computing Device Access in Landen
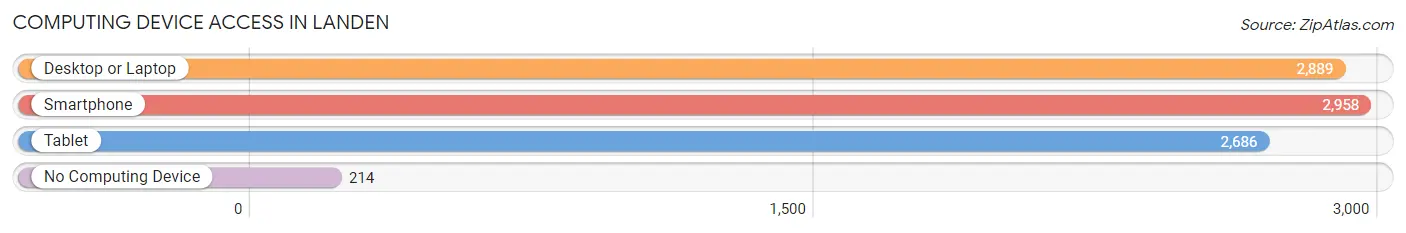
| Device Type | # Households | % Households |
| Desktop or Laptop | 2,889 | 89.1% |
| Smartphone | 2,958 | 91.2% |
| Tablet | 2,686 | 82.9% |
| No Computing Device | 214 | 6.6% |
| Total | 3,242 | 100.0% |
Internet Access in Landen
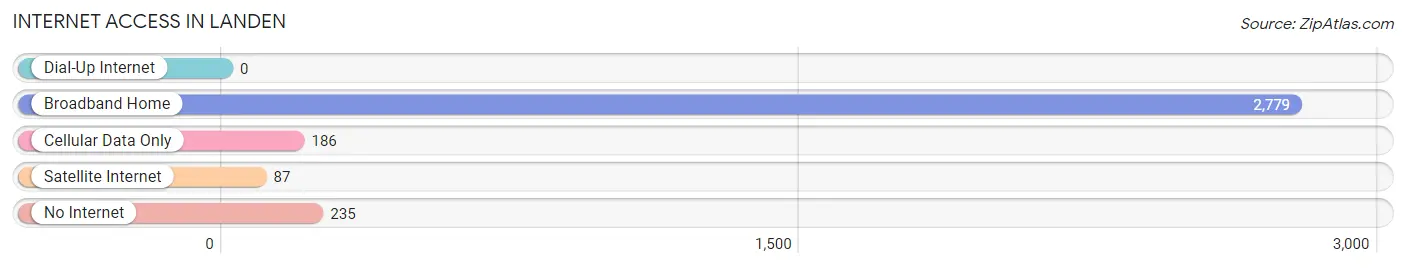
| Internet Type | # Households | % Households |
| Dial-Up Internet | 0 | 0.0% |
| Broadband Home | 2,779 | 85.7% |
| Cellular Data Only | 186 | 5.7% |
| Satellite Internet | 87 | 2.7% |
| No Internet | 235 | 7.2% |
| Total | 3,242 | 100.0% |
Landen Summary
Landen is a small unincorporated community located in the southeastern corner of Warren County, Ohio. It is situated along the Little Miami River, approximately 25 miles northeast of Cincinnati. The community is part of the Cincinnati Metropolitan Statistical Area and is home to approximately 1,500 people.
History
The area that is now Landen was first settled in the late 1700s by a group of German immigrants. The community was originally known as “New Germany” and was part of the Symmes Purchase. The name was changed to Landen in 1817, after a local landowner, John Landen. The community was officially incorporated in 1834.
In the early 1900s, Landen was a thriving agricultural community. The area was known for its production of corn, wheat, and hay. The community also had several small businesses, including a general store, a blacksmith shop, and a grist mill.
Geography
Landen is located in the southeastern corner of Warren County, Ohio. It is situated along the Little Miami River, approximately 25 miles northeast of Cincinnati. The community is part of the Cincinnati Metropolitan Statistical Area and is home to approximately 1,500 people.
The terrain of Landen is mostly flat, with some rolling hills. The area is heavily forested, with a mix of deciduous and coniferous trees. The climate is humid continental, with hot summers and cold winters.
Economy
The economy of Landen is largely based on agriculture. The area is known for its production of corn, wheat, and hay. There are also several small businesses in the community, including a general store, a blacksmith shop, and a grist mill.
In recent years, Landen has seen an influx of new businesses, including a winery, a brewery, and a distillery. The community also has several restaurants, cafes, and shops.
Demographics
As of the 2010 census, the population of Landen was 1,500. The racial makeup of the community was 97.3% White, 0.7% African American, 0.3% Native American, 0.3% Asian, and 1.3% from other races. The median household income was $50,000, and the median age was 40.
Landen is a small, close-knit community. The people of Landen are friendly and welcoming, and the community is known for its strong sense of community spirit. The area is also home to several churches, including the Landen United Methodist Church and the Landen Presbyterian Church.
Common Questions
What is Per Capita Income in Landen?
Per Capita income in Landen is $48,370.
What is the Median Family Income in Landen?
Median Family Income in Landen is $119,518.
What is the Median Household income in Landen?
Median Household Income in Landen is $104,245.
What is Income or Wage Gap in Landen?
Income or Wage Gap in Landen is 40.7%.
Women in Landen earn 59.3 cents for every dollar earned by a man.
What is Inequality or Gini Index in Landen?
Inequality or Gini Index in Landen is 0.32.
What is the Total Population of Landen?
Total Population of Landen is 8,149.
What is the Total Male Population of Landen?
Total Male Population of Landen is 3,891.
What is the Total Female Population of Landen?
Total Female Population of Landen is 4,258.
What is the Ratio of Males per 100 Females in Landen?
There are 91.38 Males per 100 Females in Landen.
What is the Ratio of Females per 100 Males in Landen?
There are 109.43 Females per 100 Males in Landen.
What is the Median Population Age in Landen?
Median Population Age in Landen is 40.8 Years.
What is the Average Family Size in Landen
Average Family Size in Landen is 3.0 People.
What is the Average Household Size in Landen
Average Household Size in Landen is 2.5 People.
How Large is the Labor Force in Landen?
There are 4,632 People in the Labor Forcein in Landen.
What is the Percentage of People in the Labor Force in Landen?
72.0% of People are in the Labor Force in Landen.
What is the Unemployment Rate in Landen?
Unemployment Rate in Landen is 0.9%.