Austinburg, OH Map & Demographics
Austinburg Map
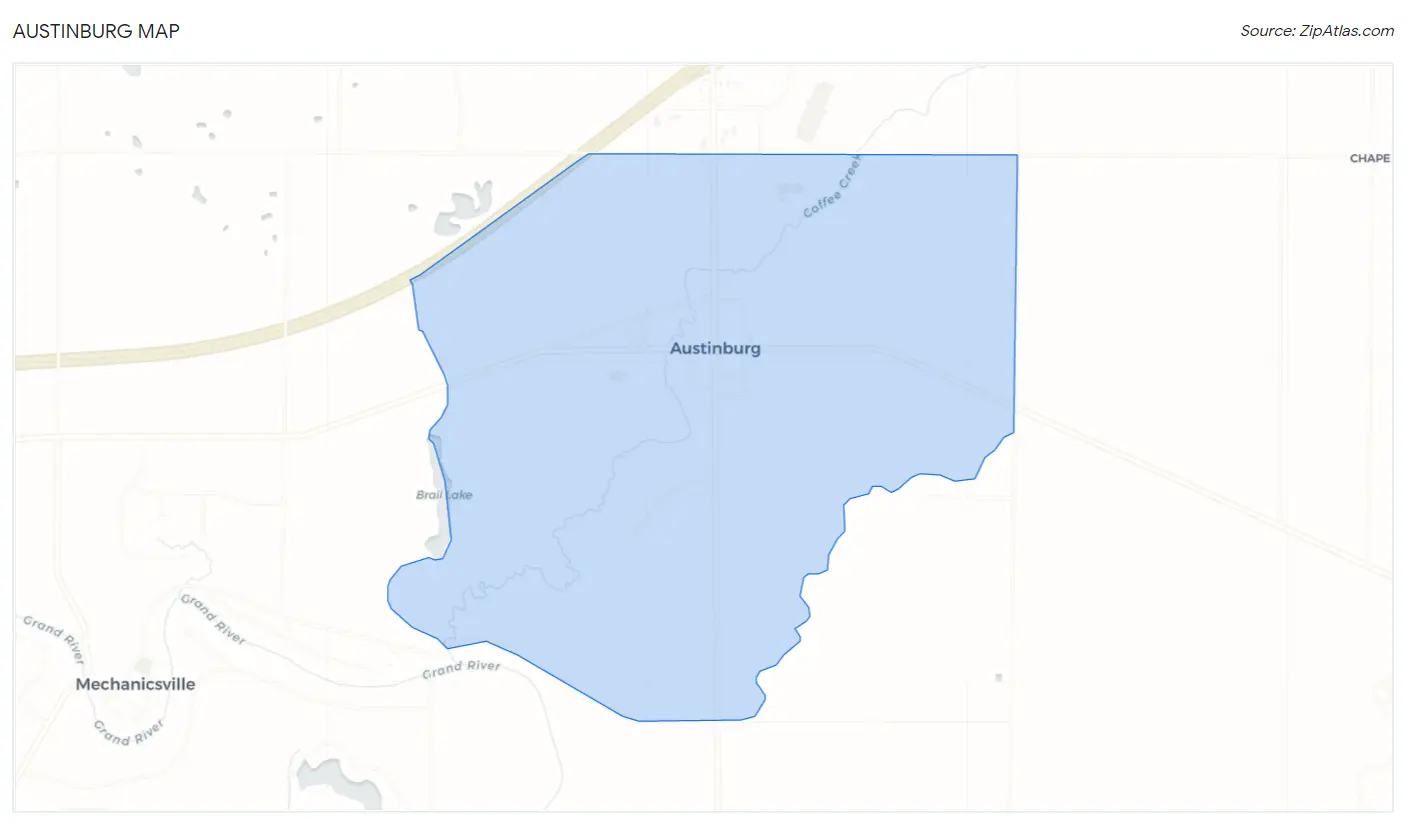
Austinburg Overview
$26,146
PER CAPITA INCOME
0.45
INEQUALITY / GINI INDEX
472
TOTAL POPULATION
260
MALE POPULATION
212
FEMALE POPULATION
122.64
MALES / 100 FEMALES
81.54
FEMALES / 100 MALES
68.2
MEDIAN AGE
2.4
AVG FAMILY SIZE
2.0
AVG HOUSEHOLD SIZE
111
LABOR FORCE [ PEOPLE ]
23.8%
PERCENT IN LABOR FORCE
48.6%
UNEMPLOYMENT RATE
Austinburg Zip Codes
Austinburg Area Codes
Income in Austinburg
Income Overview in Austinburg
| Characteristic | Number | Measure |
| Per Capita Income | 472 | $26,146 |
| Median Family Income | 88 | $0 |
| Mean Family Income | 88 | $48,510 |
| Median Household Income | 168 | $0 |
| Mean Household Income | 168 | $59,074 |
| Income Deficit | 88 | $0 |
| Wage / Income Gap (%) | 472 | 0.00% |
| Wage / Income Gap ($) | 472 | 100.00¢ per $1 |
| Gini / Inequality Index | 472 | 0.45 |
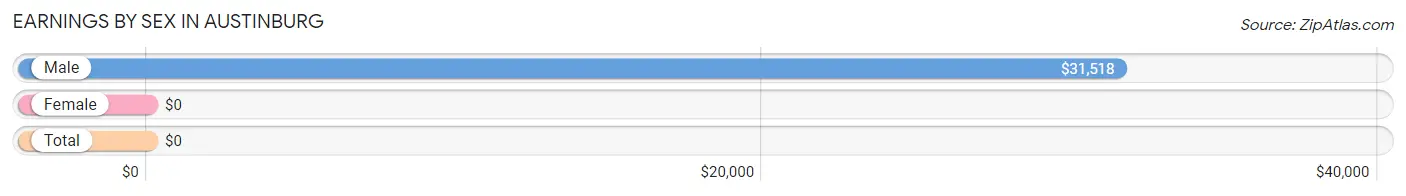
Earnings by Sex in Austinburg
| Sex | Number | Average Earnings |
| Male | 47 (40.9%) | $31,518 |
| Female | 68 (59.1%) | $0 |
| Total | 115 (100.0%) | $0 |
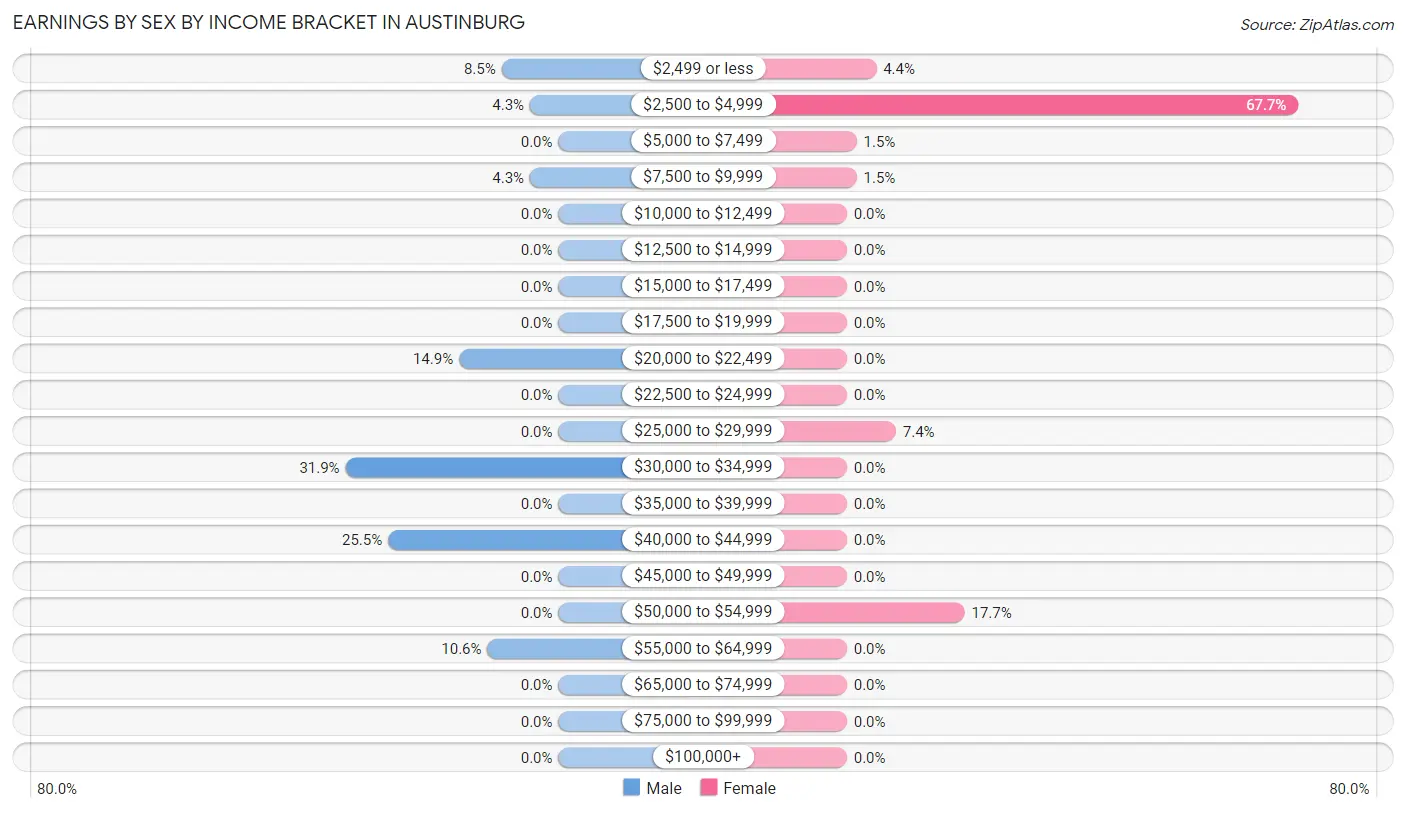
Earnings by Sex by Income Bracket in Austinburg
The most common earnings brackets in Austinburg are $30,000 to $34,999 for men (15 | 31.9%) and $2,500 to $4,999 for women (46 | 67.6%).
| Income | Male | Female |
| $2,499 or less | 4 (8.5%) | 3 (4.4%) |
| $2,500 to $4,999 | 2 (4.3%) | 46 (67.6%) |
| $5,000 to $7,499 | 0 (0.0%) | 1 (1.5%) |
| $7,500 to $9,999 | 2 (4.3%) | 1 (1.5%) |
| $10,000 to $12,499 | 0 (0.0%) | 0 (0.0%) |
| $12,500 to $14,999 | 0 (0.0%) | 0 (0.0%) |
| $15,000 to $17,499 | 0 (0.0%) | 0 (0.0%) |
| $17,500 to $19,999 | 0 (0.0%) | 0 (0.0%) |
| $20,000 to $22,499 | 7 (14.9%) | 0 (0.0%) |
| $22,500 to $24,999 | 0 (0.0%) | 0 (0.0%) |
| $25,000 to $29,999 | 0 (0.0%) | 5 (7.3%) |
| $30,000 to $34,999 | 15 (31.9%) | 0 (0.0%) |
| $35,000 to $39,999 | 0 (0.0%) | 0 (0.0%) |
| $40,000 to $44,999 | 12 (25.5%) | 0 (0.0%) |
| $45,000 to $49,999 | 0 (0.0%) | 0 (0.0%) |
| $50,000 to $54,999 | 0 (0.0%) | 12 (17.6%) |
| $55,000 to $64,999 | 5 (10.6%) | 0 (0.0%) |
| $65,000 to $74,999 | 0 (0.0%) | 0 (0.0%) |
| $75,000 to $99,999 | 0 (0.0%) | 0 (0.0%) |
| $100,000+ | 0 (0.0%) | 0 (0.0%) |
| Total | 47 (100.0%) | 68 (100.0%) |
Earnings by Sex by Educational Attainment in Austinburg
| Educational Attainment | Male Income | Female Income |
| Less than High School | - | - |
| High School Diploma | - | - |
| College or Associate's Degree | - | - |
| Bachelor's Degree | - | - |
| Graduate Degree | - | - |
| Total | $40,313 | $0 |
Family Income in Austinburg
Family Income Brackets in Austinburg
According to the Austinburg family income data, there are 35 families falling into the $35,000 to $49,999 income range, which is the most common income bracket and makes up 39.8% of all families.
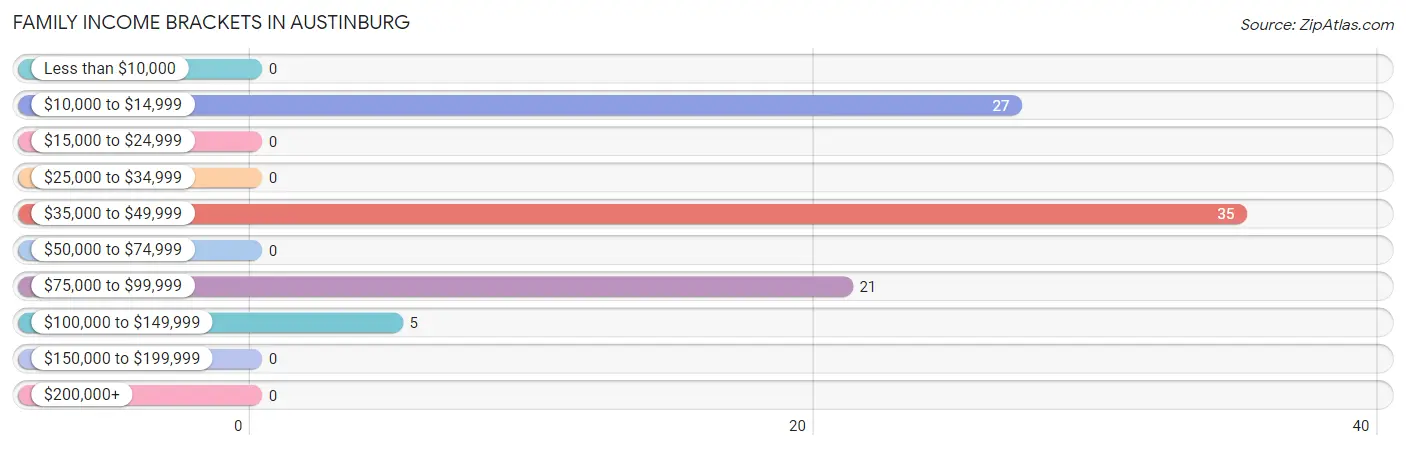
| Income Bracket | # Families | % Families |
| Less than $10,000 | 0 | 0.0% |
| $10,000 to $14,999 | 27 | 30.7% |
| $15,000 to $24,999 | 0 | 0.0% |
| $25,000 to $34,999 | 0 | 0.0% |
| $35,000 to $49,999 | 35 | 39.8% |
| $50,000 to $74,999 | 0 | 0.0% |
| $75,000 to $99,999 | 21 | 23.9% |
| $100,000 to $149,999 | 5 | 5.7% |
| $150,000 to $199,999 | 0 | 0.0% |
| $200,000+ | 0 | 0.0% |
Family Income by Famaliy Size in Austinburg
| Income Bracket | # Families | Median Income |
| 2-Person Families | 83 (94.3%) | $0 |
| 3-Person Families | 0 (0.0%) | $0 |
| 4-Person Families | 5 (5.7%) | $0 |
| 5-Person Families | 0 (0.0%) | $0 |
| 6-Person Families | 0 (0.0%) | $0 |
| 7+ Person Families | 0 (0.0%) | $0 |
| Total | 88 (100.0%) | $0 |
Family Income by Number of Earners in Austinburg
| Number of Earners | # Families | Median Income |
| No Earners | 71 (80.7%) | $0 |
| 1 Earner | 0 (0.0%) | $0 |
| 2 Earners | 12 (13.6%) | $0 |
| 3+ Earners | 5 (5.7%) | $0 |
| Total | 88 (100.0%) | $0 |
Household Income in Austinburg
Household Income Brackets in Austinburg
With 58 households falling in the category, the $75,000 to $99,999 income range is the most frequent in Austinburg, accounting for 34.5% of all households.
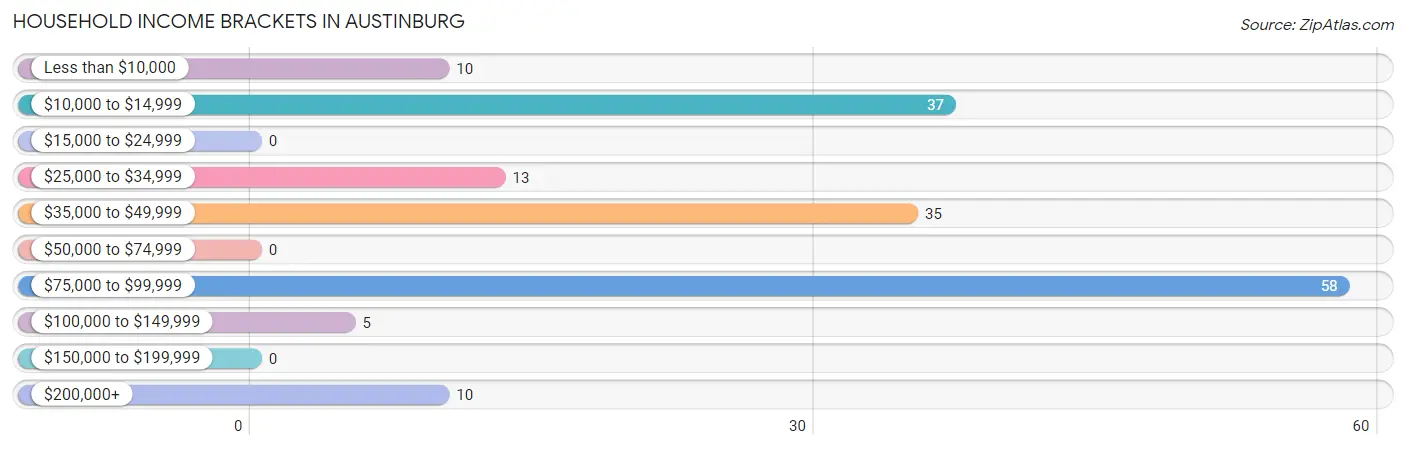
| Income Bracket | # Households | % Households |
| Less than $10,000 | 10 | 6.0% |
| $10,000 to $14,999 | 37 | 22.0% |
| $15,000 to $24,999 | 0 | 0.0% |
| $25,000 to $34,999 | 13 | 7.7% |
| $35,000 to $49,999 | 35 | 20.8% |
| $50,000 to $74,999 | 0 | 0.0% |
| $75,000 to $99,999 | 58 | 34.5% |
| $100,000 to $149,999 | 5 | 3.0% |
| $150,000 to $199,999 | 0 | 0.0% |
| $200,000+ | 10 | 6.0% |
Household Income by Householder Age in Austinburg
| Income Bracket | # Households | Median Income |
| 15 to 24 Years | 0 (0.0%) | $0 |
| 25 to 44 Years | 17 (10.1%) | $0 |
| 45 to 64 Years | 0 (0.0%) | $0 |
| 65+ Years | 151 (89.9%) | $0 |
| Total | 168 (100.0%) | $0 |
Poverty in Austinburg
Income Below Poverty by Sex and Age in Austinburg
With 13.2% poverty level for males and 33.6% for females among the residents of Austinburg, 75 year old and over males and 65 to 74 year old females are the most vulnerable to poverty, with 27 males (75.0%) and 10 females (100.0%) in their respective age groups living below the poverty level.
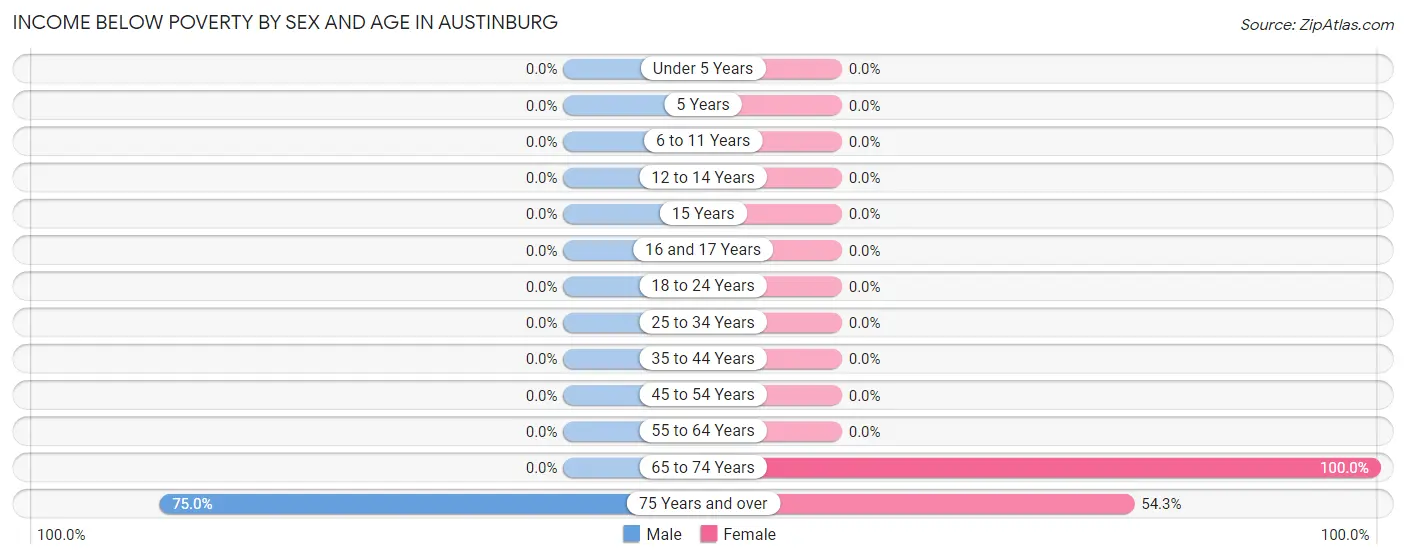
| Age Bracket | Male | Female |
| Under 5 Years | 0 (0.0%) | 0 (0.0%) |
| 5 Years | 0 (0.0%) | 0 (0.0%) |
| 6 to 11 Years | 0 (0.0%) | 0 (0.0%) |
| 12 to 14 Years | 0 (0.0%) | 0 (0.0%) |
| 15 Years | 0 (0.0%) | 0 (0.0%) |
| 16 and 17 Years | 0 (0.0%) | 0 (0.0%) |
| 18 to 24 Years | 0 (0.0%) | 0 (0.0%) |
| 25 to 34 Years | 0 (0.0%) | 0 (0.0%) |
| 35 to 44 Years | 0 (0.0%) | 0 (0.0%) |
| 45 to 54 Years | 0 (0.0%) | 0 (0.0%) |
| 55 to 64 Years | 0 (0.0%) | 0 (0.0%) |
| 65 to 74 Years | 0 (0.0%) | 10 (100.0%) |
| 75 Years and over | 27 (75.0%) | 38 (54.3%) |
| Total | 27 (13.2%) | 48 (33.6%) |
Income Above Poverty by Sex and Age in Austinburg
According to the poverty statistics in Austinburg, males aged 12 to 14 years and females aged 25 to 34 years are the age groups that are most secure financially, with 100.0% of males and 100.0% of females in these age groups living above the poverty line.
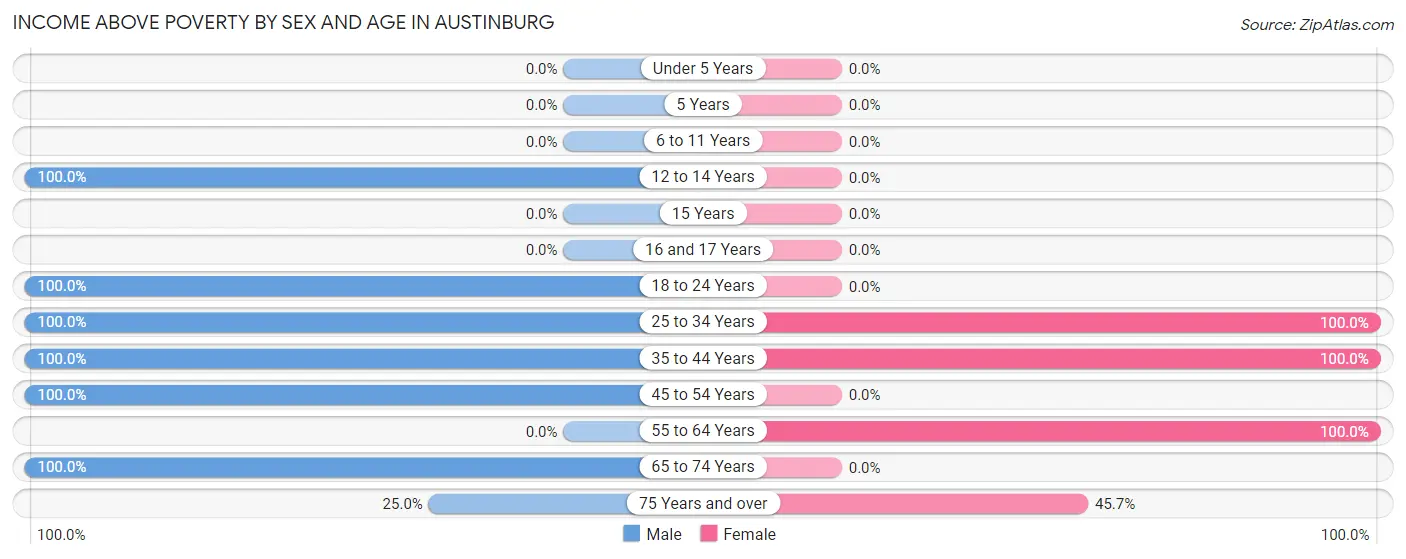
| Age Bracket | Male | Female |
| Under 5 Years | 0 (0.0%) | 0 (0.0%) |
| 5 Years | 0 (0.0%) | 0 (0.0%) |
| 6 to 11 Years | 0 (0.0%) | 0 (0.0%) |
| 12 to 14 Years | 6 (100.0%) | 0 (0.0%) |
| 15 Years | 0 (0.0%) | 0 (0.0%) |
| 16 and 17 Years | 0 (0.0%) | 0 (0.0%) |
| 18 to 24 Years | 7 (100.0%) | 0 (0.0%) |
| 25 to 34 Years | 12 (100.0%) | 12 (100.0%) |
| 35 to 44 Years | 19 (100.0%) | 5 (100.0%) |
| 45 to 54 Years | 53 (100.0%) | 0 (0.0%) |
| 55 to 64 Years | 0 (0.0%) | 46 (100.0%) |
| 65 to 74 Years | 72 (100.0%) | 0 (0.0%) |
| 75 Years and over | 9 (25.0%) | 32 (45.7%) |
| Total | 178 (86.8%) | 95 (66.4%) |
Income Below Poverty Among Married-Couple Families in Austinburg
The poverty statistics for married-couple families in Austinburg show that 50.9% or 27 of the total 53 families live below the poverty line. Families with no children have the highest poverty rate of 56.2%, comprising of 27 families. On the other hand, families with 1 or 2 children have the lowest poverty rate of 0.0%, which includes 0 families.
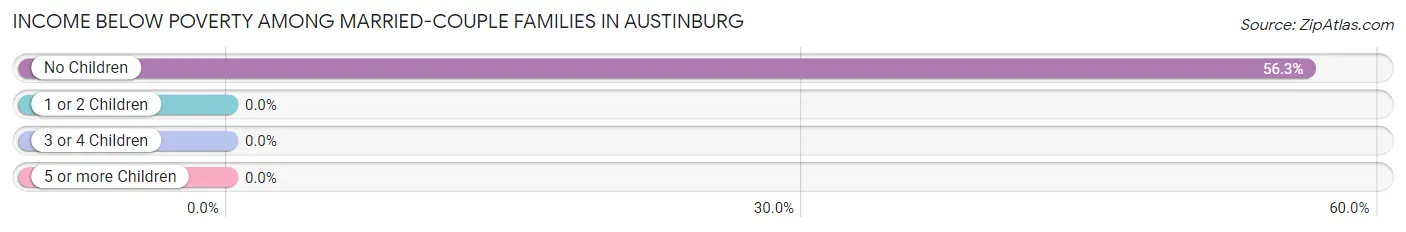
| Children | Above Poverty | Below Poverty |
| No Children | 21 (43.8%) | 27 (56.2%) |
| 1 or 2 Children | 5 (100.0%) | 0 (0.0%) |
| 3 or 4 Children | 0 (0.0%) | 0 (0.0%) |
| 5 or more Children | 0 (0.0%) | 0 (0.0%) |
| Total | 26 (49.1%) | 27 (50.9%) |
Income Below Poverty Among Single-Parent Households in Austinburg
| Children | Single Father | Single Mother |
| No Children | 0 (0.0%) | 0 (0.0%) |
| 1 or 2 Children | 0 (0.0%) | 0 (0.0%) |
| 3 or 4 Children | 0 (0.0%) | 0 (0.0%) |
| 5 or more Children | 0 (0.0%) | 0 (0.0%) |
| Total | 0 (0.0%) | 0 (0.0%) |
Income Below Poverty Among Married-Couple vs Single-Parent Households in Austinburg
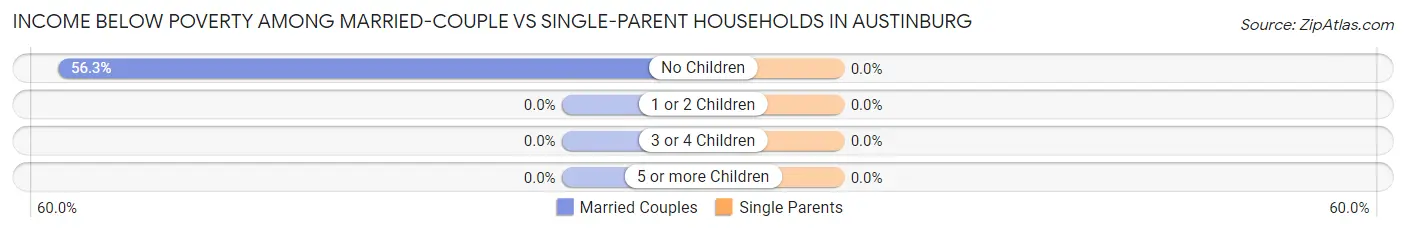
| Children | Married-Couple Families | Single-Parent Households |
| No Children | 27 (56.2%) | 0 (0.0%) |
| 1 or 2 Children | 0 (0.0%) | 0 (0.0%) |
| 3 or 4 Children | 0 (0.0%) | 0 (0.0%) |
| 5 or more Children | 0 (0.0%) | 0 (0.0%) |
| Total | 27 (50.9%) | 0 (0.0%) |
Race in Austinburg
The most populous races in Austinburg are White / Caucasian (458 | 97.0%), Black / African American (13 | 2.8%), and Hispanic or Latino (6 | 1.3%).
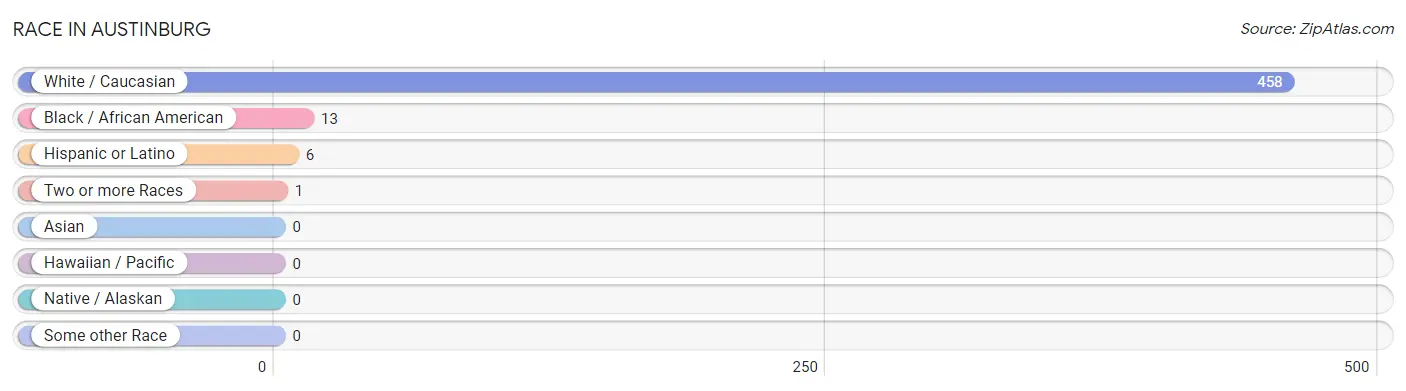
| Race | # Population | % Population |
| Asian | 0 | 0.0% |
| Black / African American | 13 | 2.8% |
| Hawaiian / Pacific | 0 | 0.0% |
| Hispanic or Latino | 6 | 1.3% |
| Native / Alaskan | 0 | 0.0% |
| White / Caucasian | 458 | 97.0% |
| Two or more Races | 1 | 0.2% |
| Some other Race | 0 | 0.0% |
| Total | 472 | 100.0% |
Ancestry in Austinburg
The most populous ancestries reported in Austinburg are Irish (127 | 26.9%), English (120 | 25.4%), American (96 | 20.3%), German (91 | 19.3%), and Polish (46 | 9.8%), together accounting for 101.7% of all Austinburg residents.
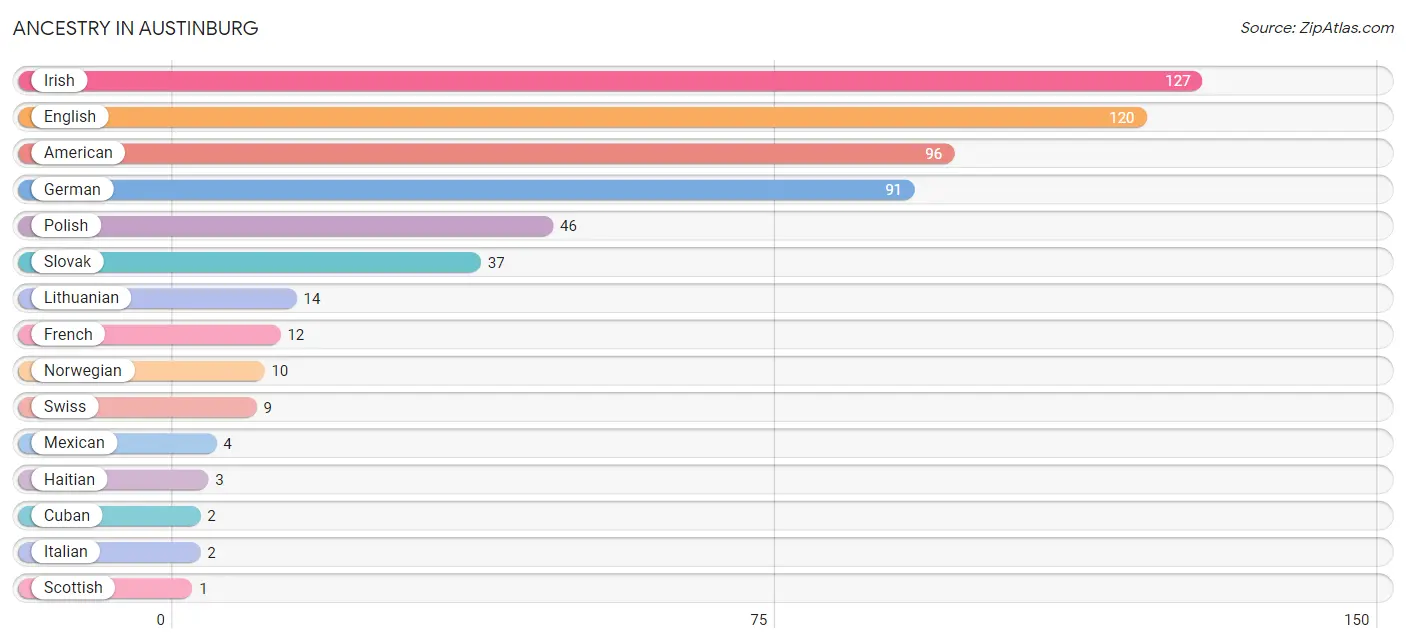
| Ancestry | # Population | % Population |
| American | 96 | 20.3% |
| Cuban | 2 | 0.4% |
| English | 120 | 25.4% |
| French | 12 | 2.5% |
| German | 91 | 19.3% |
| Haitian | 3 | 0.6% |
| Irish | 127 | 26.9% |
| Italian | 2 | 0.4% |
| Lithuanian | 14 | 3.0% |
| Mexican | 4 | 0.9% |
| Norwegian | 10 | 2.1% |
| Polish | 46 | 9.8% |
| Scottish | 1 | 0.2% |
| Slovak | 37 | 7.8% |
| South African | 1 | 0.2% |
| Subsaharan African | 1 | 0.2% |
| Swiss | 9 | 1.9% |
| Trinidadian and Tobagonian | 1 | 0.2% | View All 18 Rows |
Immigrants in Austinburg
The most numerous immigrant groups reported in Austinburg came from Europe (6 | 1.3%), Germany (6 | 1.3%), Western Europe (6 | 1.3%), Africa (1 | 0.2%), and Caribbean (1 | 0.2%), together accounting for 4.2% of all Austinburg residents.
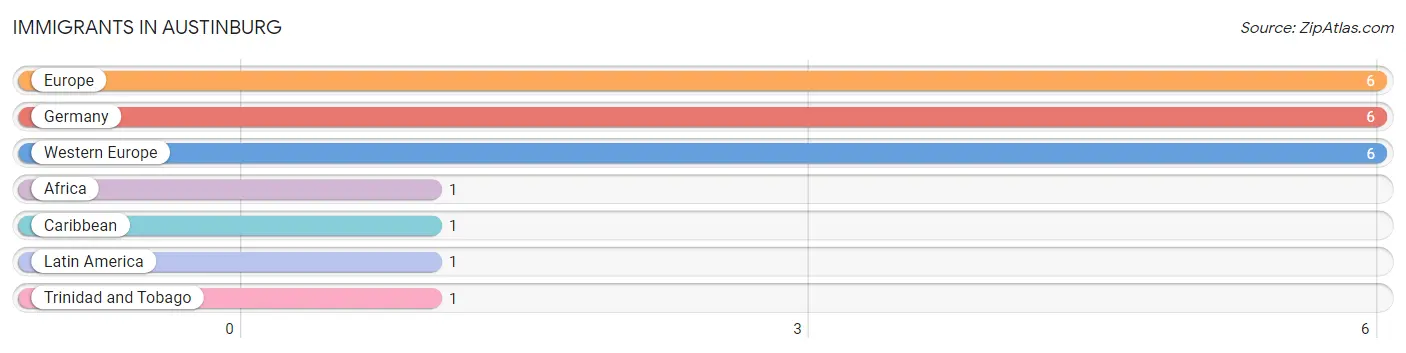
| Immigration Origin | # Population | % Population |
| Africa | 1 | 0.2% |
| Caribbean | 1 | 0.2% |
| Europe | 6 | 1.3% |
| Germany | 6 | 1.3% |
| Latin America | 1 | 0.2% |
| Trinidad and Tobago | 1 | 0.2% |
| Western Europe | 6 | 1.3% | View All 7 Rows |
Sex and Age in Austinburg
Sex and Age in Austinburg
The most populous age groups in Austinburg are 85 Years and over (59 | 22.7%) for men and 75 to 79 Years (68 | 32.1%) for women.
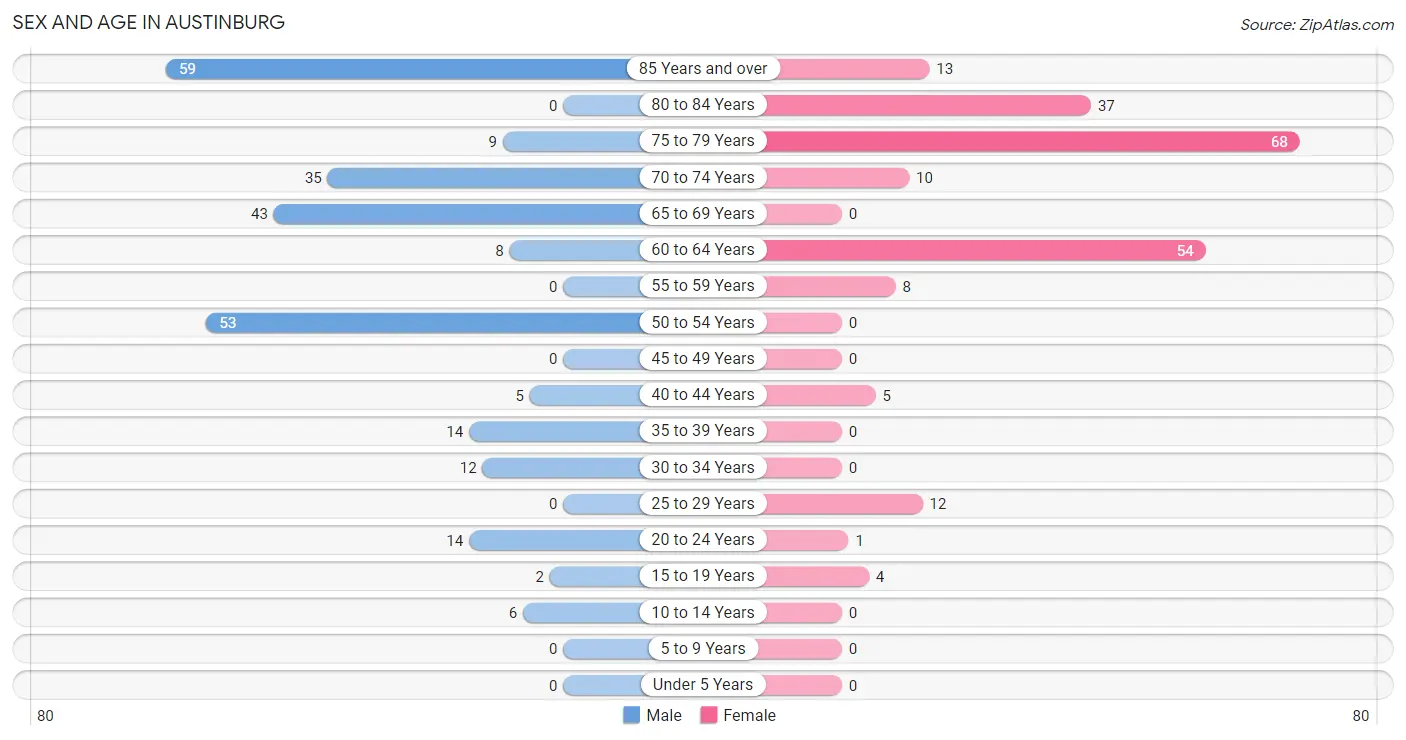
| Age Bracket | Male | Female |
| Under 5 Years | 0 (0.0%) | 0 (0.0%) |
| 5 to 9 Years | 0 (0.0%) | 0 (0.0%) |
| 10 to 14 Years | 6 (2.3%) | 0 (0.0%) |
| 15 to 19 Years | 2 (0.8%) | 4 (1.9%) |
| 20 to 24 Years | 14 (5.4%) | 1 (0.5%) |
| 25 to 29 Years | 0 (0.0%) | 12 (5.7%) |
| 30 to 34 Years | 12 (4.6%) | 0 (0.0%) |
| 35 to 39 Years | 14 (5.4%) | 0 (0.0%) |
| 40 to 44 Years | 5 (1.9%) | 5 (2.4%) |
| 45 to 49 Years | 0 (0.0%) | 0 (0.0%) |
| 50 to 54 Years | 53 (20.4%) | 0 (0.0%) |
| 55 to 59 Years | 0 (0.0%) | 8 (3.8%) |
| 60 to 64 Years | 8 (3.1%) | 54 (25.5%) |
| 65 to 69 Years | 43 (16.5%) | 0 (0.0%) |
| 70 to 74 Years | 35 (13.5%) | 10 (4.7%) |
| 75 to 79 Years | 9 (3.5%) | 68 (32.1%) |
| 80 to 84 Years | 0 (0.0%) | 37 (17.4%) |
| 85 Years and over | 59 (22.7%) | 13 (6.1%) |
| Total | 260 (100.0%) | 212 (100.0%) |
Families and Households in Austinburg
Median Family Size in Austinburg
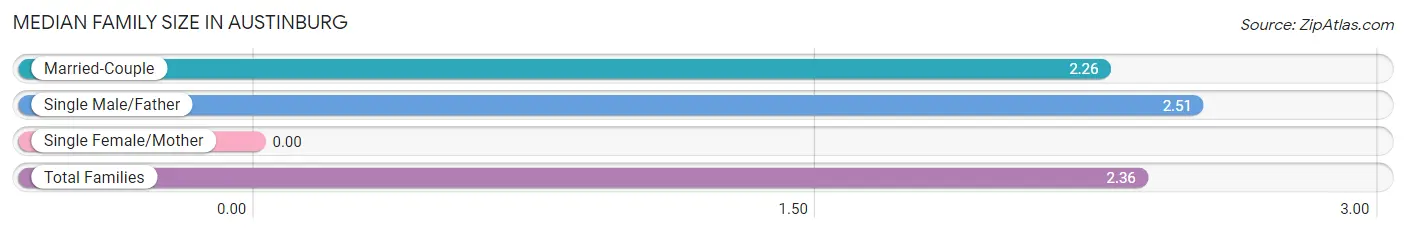
| Family Type | # Families | Family Size |
| Married-Couple | 53 (60.2%) | 2.26 |
| Single Male/Father | 35 (39.8%) | 2.51 |
| Single Female/Mother | 0 (0.0%) | - |
| Total Families | 88 (100.0%) | 2.36 |
Median Household Size in Austinburg
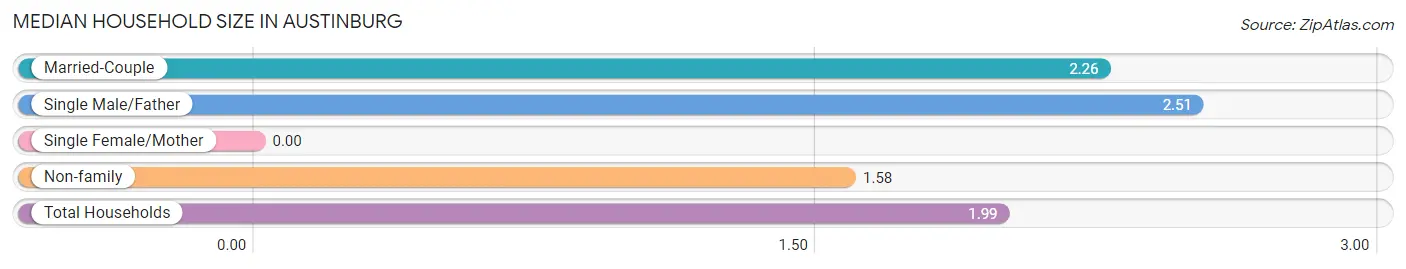
| Household Type | # Households | Household Size |
| Married-Couple | 53 (31.6%) | 2.26 |
| Single Male/Father | 35 (20.8%) | 2.51 |
| Single Female/Mother | 0 (0.0%) | - |
| Non-family | 80 (47.6%) | 1.58 |
| Total Households | 168 (100.0%) | 1.99 |
Household Size by Marriage Status in Austinburg
Out of a total of 168 households in Austinburg, 88 (52.4%) are family households, while 80 (47.6%) are nonfamily households. The most numerous type of family households are 2-person households, comprising 83, and the most common type of nonfamily households are 1-person households, comprising 43.
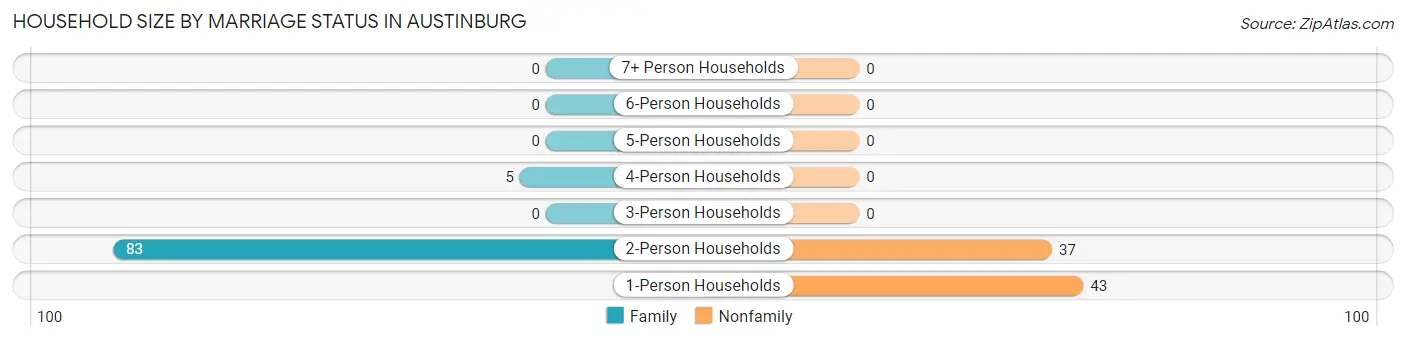
| Household Size | Family Households | Nonfamily Households |
| 1-Person Households | - | 43 (25.6%) |
| 2-Person Households | 83 (49.4%) | 37 (22.0%) |
| 3-Person Households | 0 (0.0%) | 0 (0.0%) |
| 4-Person Households | 5 (3.0%) | 0 (0.0%) |
| 5-Person Households | 0 (0.0%) | 0 (0.0%) |
| 6-Person Households | 0 (0.0%) | 0 (0.0%) |
| 7+ Person Households | 0 (0.0%) | 0 (0.0%) |
| Total | 88 (52.4%) | 80 (47.6%) |
Female Fertility in Austinburg
Fertility by Age in Austinburg
| Age Bracket | Women with Births | Births / 1,000 Women |
| 15 to 19 years | 0 (0.0%) | 0.0 |
| 20 to 34 years | 0 (0.0%) | 0.0 |
| 35 to 50 years | 0 (0.0%) | 0.0 |
| Total | 0 (0.0%) | 0.0 |
Fertility by Age by Marriage Status in Austinburg
| Age Bracket | Married | Unmarried |
| 15 to 19 years | 0 (0.0%) | 0 (0.0%) |
| 20 to 34 years | 0 (0.0%) | 0 (0.0%) |
| 35 to 50 years | 0 (0.0%) | 0 (0.0%) |
| Total | 0 (0.0%) | 0 (0.0%) |
Fertility by Education in Austinburg
| Educational Attainment | Women with Births | Births / 1,000 Women |
| Less than High School | 0 (0.0%) | 0.0 |
| High School Diploma | 0 (0.0%) | 0.0 |
| College or Associate's Degree | 0 (0.0%) | 0.0 |
| Bachelor's Degree | 0 (0.0%) | 0.0 |
| Graduate Degree | 0 (0.0%) | 0.0 |
| Total | 0 (0.0%) | 0.0 |
Fertility by Education by Marriage Status in Austinburg
| Educational Attainment | Married | Unmarried |
| Less than High School | 0 (0.0%) | 0 (0.0%) |
| High School Diploma | 0 (0.0%) | 0 (0.0%) |
| College or Associate's Degree | 0 (0.0%) | 0 (0.0%) |
| Bachelor's Degree | 0 (0.0%) | 0 (0.0%) |
| Graduate Degree | 0 (0.0%) | 0 (0.0%) |
| Total | 0 (0.0%) | 0 (0.0%) |
Employment Characteristics in Austinburg
Employment by Class of Employer in Austinburg
Among the 57 employed individuals in Austinburg, not-for-profit organizations (27 | 47.4%), private company employees (18 | 31.6%), and local government employees (12 | 21.0%) make up the most common classes of employment.
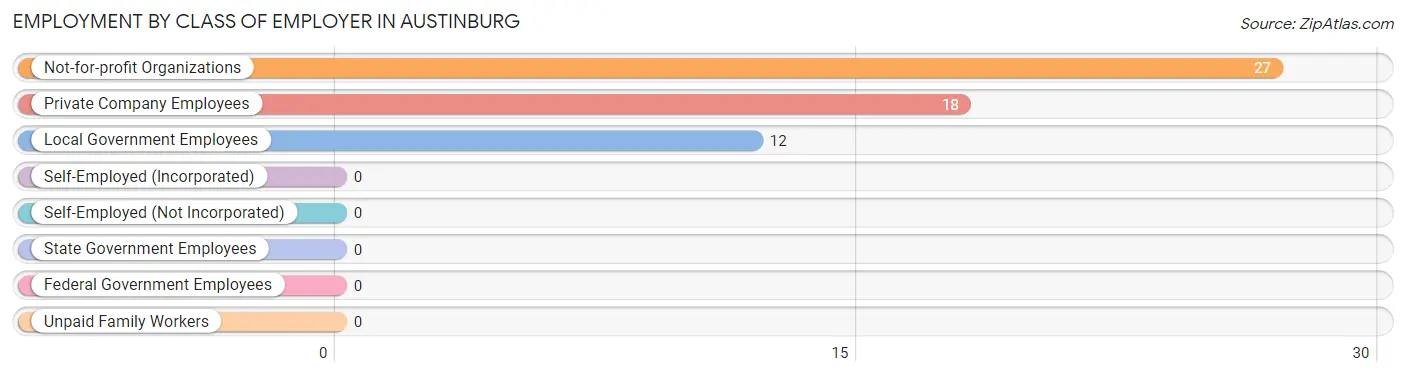
| Employer Class | # Employees | % Employees |
| Private Company Employees | 18 | 31.6% |
| Self-Employed (Incorporated) | 0 | 0.0% |
| Self-Employed (Not Incorporated) | 0 | 0.0% |
| Not-for-profit Organizations | 27 | 47.4% |
| Local Government Employees | 12 | 21.0% |
| State Government Employees | 0 | 0.0% |
| Federal Government Employees | 0 | 0.0% |
| Unpaid Family Workers | 0 | 0.0% |
| Total | 57 | 100.0% |
Employment Status by Age in Austinburg
According to the labor force statistics for Austinburg, out of the total population over 16 years of age (466), 23.8% or 111 individuals are in the labor force, with 48.6% or 54 of them unemployed. The age group with the highest labor force participation rate is 25 to 29 years, with 100.0% or 12 individuals in the labor force. Within the labor force, the 45 to 54 years age range has the highest percentage of unemployed individuals, with 100.0% or 53 of them being unemployed.
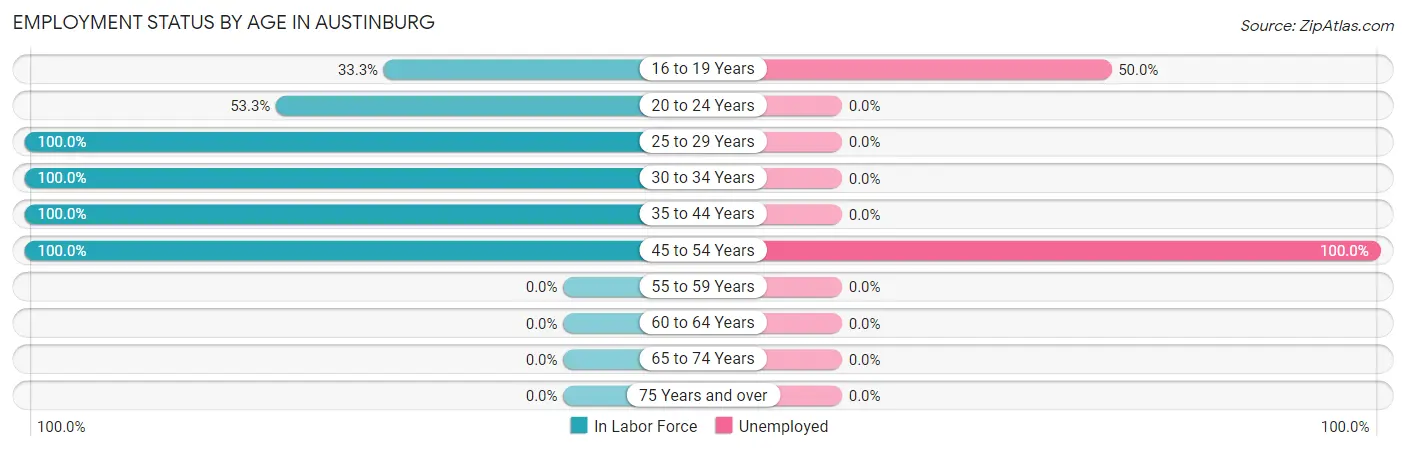
| Age Bracket | In Labor Force | Unemployed |
| 16 to 19 Years | 2 (33.3%) | 1 (50.0%) |
| 20 to 24 Years | 8 (53.3%) | 0 (0.0%) |
| 25 to 29 Years | 12 (100.0%) | 0 (0.0%) |
| 30 to 34 Years | 12 (100.0%) | 0 (0.0%) |
| 35 to 44 Years | 24 (100.0%) | 0 (0.0%) |
| 45 to 54 Years | 53 (100.0%) | 53 (100.0%) |
| 55 to 59 Years | 0 (0.0%) | 0 (0.0%) |
| 60 to 64 Years | 0 (0.0%) | 0 (0.0%) |
| 65 to 74 Years | 0 (0.0%) | 0 (0.0%) |
| 75 Years and over | 0 (0.0%) | 0 (0.0%) |
| Total | 111 (23.8%) | 54 (48.6%) |
Employment Status by Educational Attainment in Austinburg
According to labor force statistics for Austinburg, 59.1% of individuals (101) out of the total population between 25 and 64 years of age (171) are in the labor force, with 52.5% or 53 of them being unemployed. The group with the highest labor force participation rate are those with the educational attainment of college / associate degree, with 100.0% or 53 individuals in the labor force. Within the labor force, individuals with college / associate degree education have the highest percentage of unemployment, with 100.0% or 53 of them being unemployed.
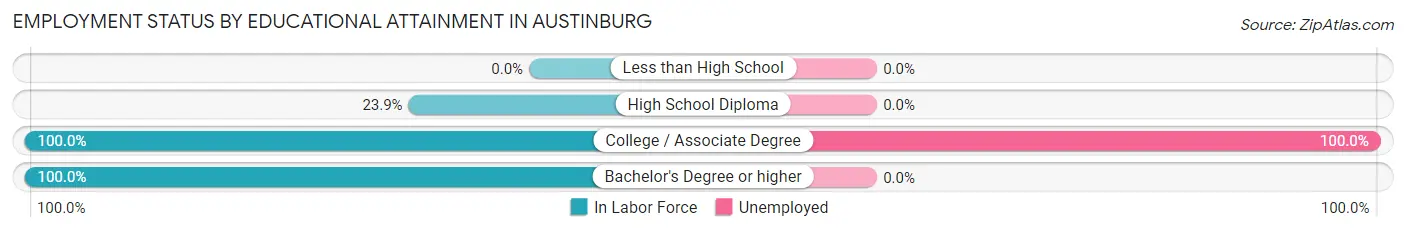
| Educational Attainment | In Labor Force | Unemployed |
| Less than High School | 0 (0.0%) | 0 (0.0%) |
| High School Diploma | 22 (23.9%) | 0 (0.0%) |
| College / Associate Degree | 53 (100.0%) | 53 (100.0%) |
| Bachelor's Degree or higher | 26 (100.0%) | 0 (0.0%) |
| Total | 101 (59.1%) | 90 (52.5%) |
Employment Occupations by Sex in Austinburg
Management, Business, Science and Arts Occupations
The most common Management, Business, Science and Arts occupations in Austinburg are Community & Social Service (14 | 24.6%), Education, Arts & Media (14 | 24.6%), Computers, Engineering & Science (12 | 21.0%), and Computers & Mathematics (12 | 21.0%).
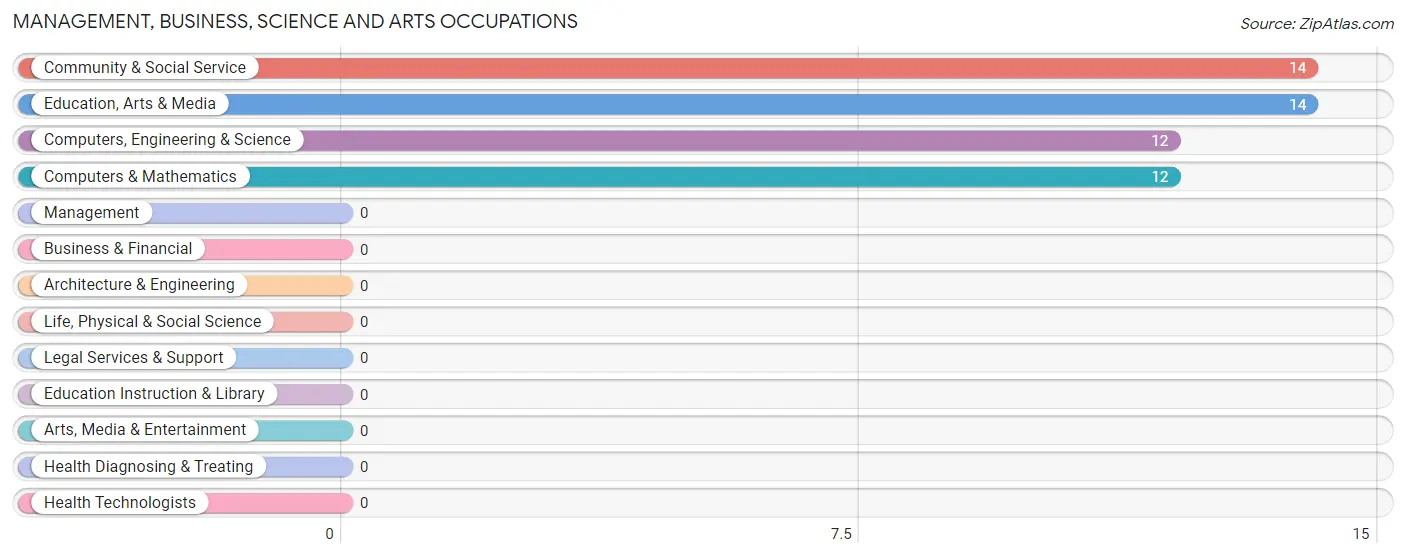
Management, Business, Science and Arts Occupations by Sex
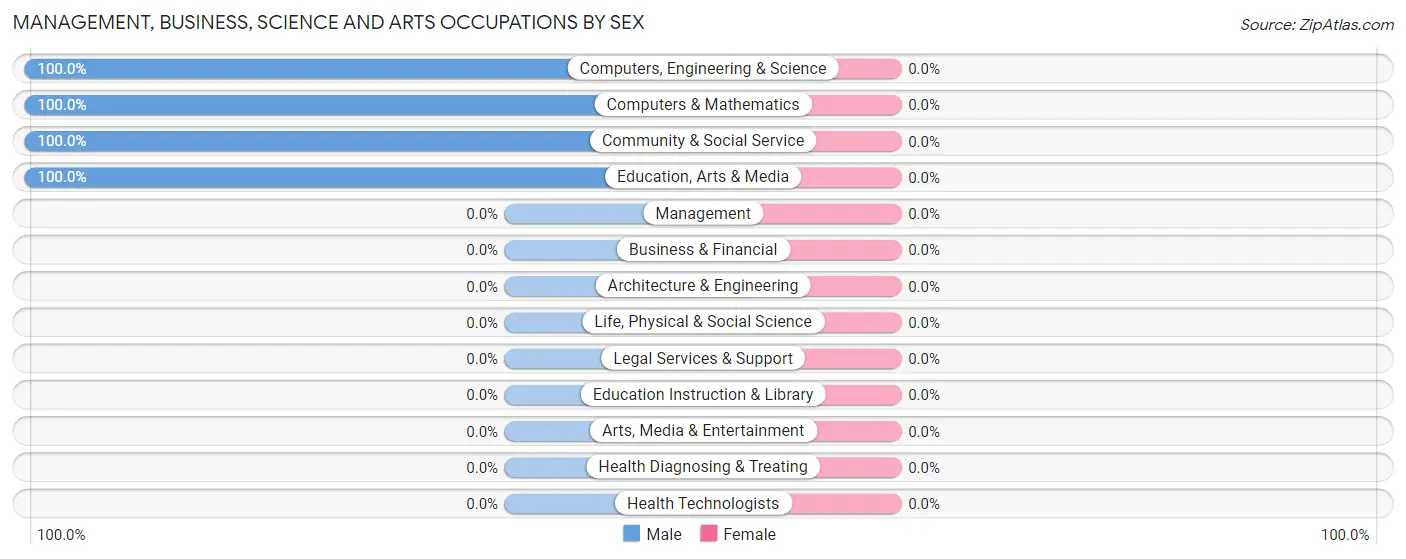
| Occupation | Male | Female |
| Management | 0 (0.0%) | 0 (0.0%) |
| Business & Financial | 0 (0.0%) | 0 (0.0%) |
| Computers, Engineering & Science | 12 (100.0%) | 0 (0.0%) |
| Computers & Mathematics | 12 (100.0%) | 0 (0.0%) |
| Architecture & Engineering | 0 (0.0%) | 0 (0.0%) |
| Life, Physical & Social Science | 0 (0.0%) | 0 (0.0%) |
| Community & Social Service | 14 (100.0%) | 0 (0.0%) |
| Education, Arts & Media | 14 (100.0%) | 0 (0.0%) |
| Legal Services & Support | 0 (0.0%) | 0 (0.0%) |
| Education Instruction & Library | 0 (0.0%) | 0 (0.0%) |
| Arts, Media & Entertainment | 0 (0.0%) | 0 (0.0%) |
| Health Diagnosing & Treating | 0 (0.0%) | 0 (0.0%) |
| Health Technologists | 0 (0.0%) | 0 (0.0%) |
| Total (Category) | 26 (100.0%) | 0 (0.0%) |
| Total (Overall) | 39 (68.4%) | 18 (31.6%) |
Services Occupations
The most common Services occupations in Austinburg are Security & Protection (1 | 1.8%), and Firefighting & Prevention (1 | 1.8%).
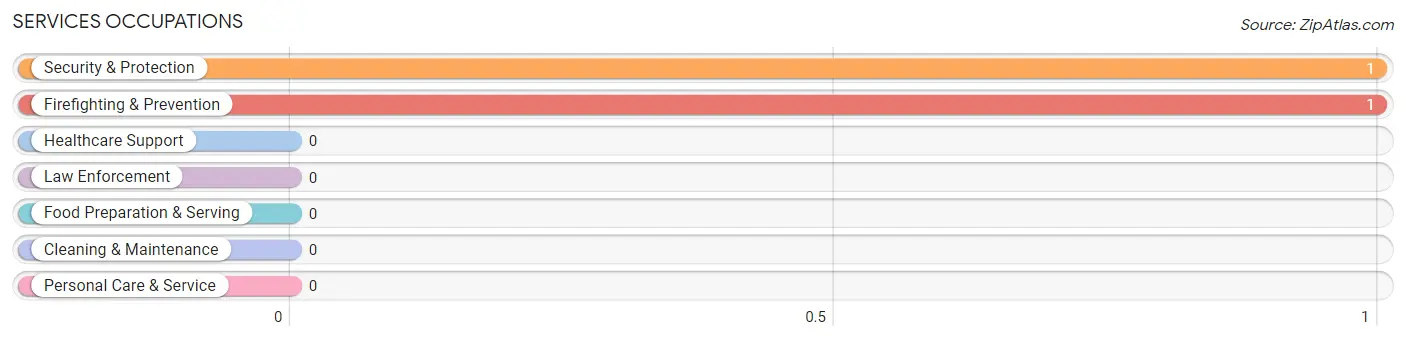
Services Occupations by Sex
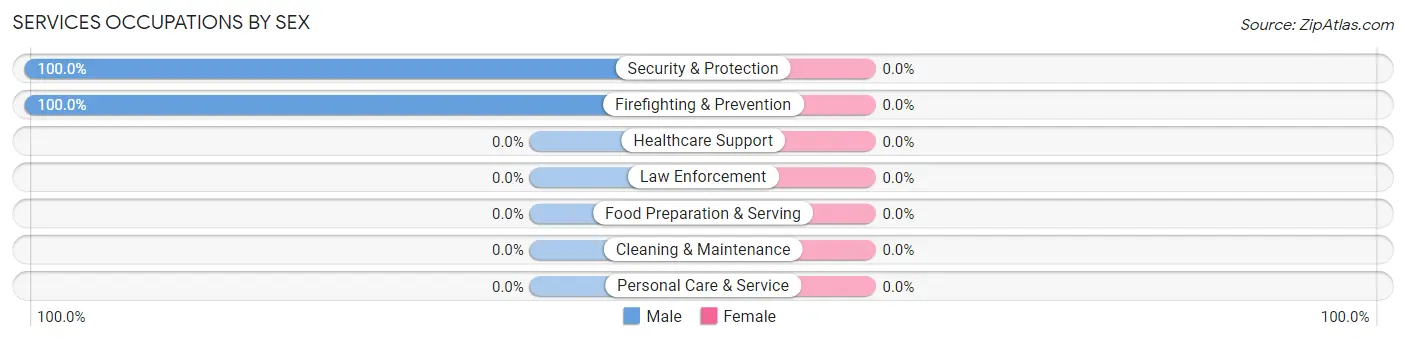
| Occupation | Male | Female |
| Healthcare Support | 0 (0.0%) | 0 (0.0%) |
| Security & Protection | 1 (100.0%) | 0 (0.0%) |
| Firefighting & Prevention | 1 (100.0%) | 0 (0.0%) |
| Law Enforcement | 0 (0.0%) | 0 (0.0%) |
| Food Preparation & Serving | 0 (0.0%) | 0 (0.0%) |
| Cleaning & Maintenance | 0 (0.0%) | 0 (0.0%) |
| Personal Care & Service | 0 (0.0%) | 0 (0.0%) |
| Total (Category) | 1 (100.0%) | 0 (0.0%) |
| Total (Overall) | 39 (68.4%) | 18 (31.6%) |
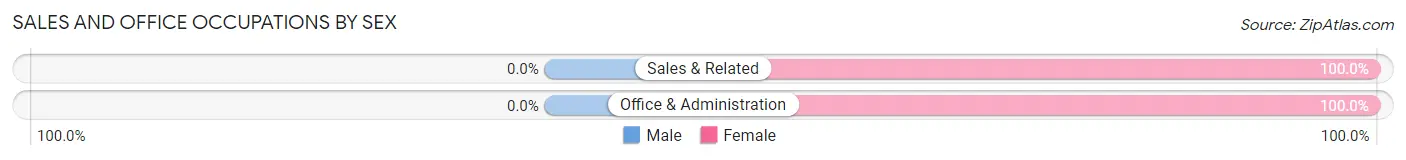
Sales and Office Occupations
The most common Sales and Office occupations in Austinburg are Office & Administration (17 | 29.8%), and Sales & Related (1 | 1.8%).

Sales and Office Occupations by Sex
| Occupation | Male | Female |
| Sales & Related | 0 (0.0%) | 1 (100.0%) |
| Office & Administration | 0 (0.0%) | 17 (100.0%) |
| Total (Category) | 0 (0.0%) | 18 (100.0%) |
| Total (Overall) | 39 (68.4%) | 18 (31.6%) |
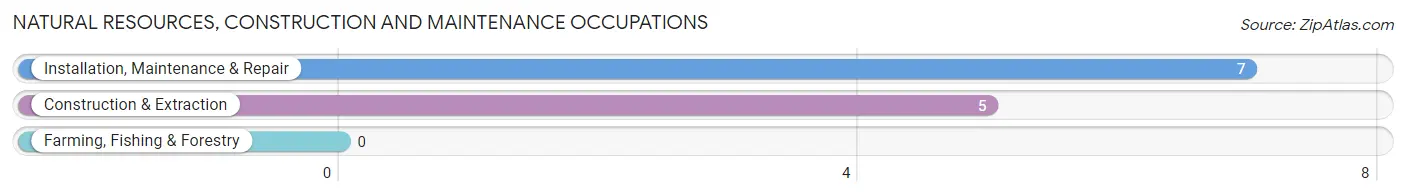
Natural Resources, Construction and Maintenance Occupations
The most common Natural Resources, Construction and Maintenance occupations in Austinburg are Installation, Maintenance & Repair (7 | 12.3%), and Construction & Extraction (5 | 8.8%).
Natural Resources, Construction and Maintenance Occupations by Sex
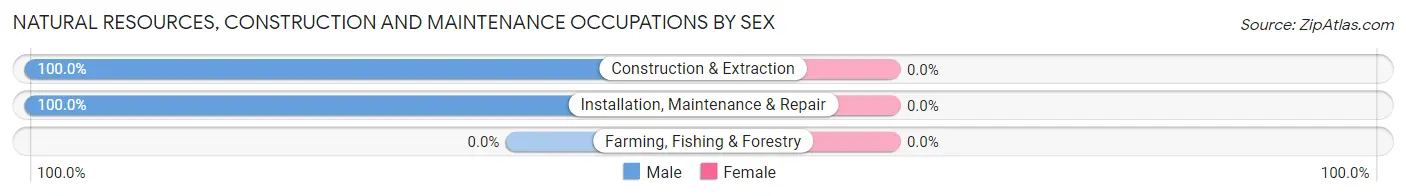
| Occupation | Male | Female |
| Farming, Fishing & Forestry | 0 (0.0%) | 0 (0.0%) |
| Construction & Extraction | 5 (100.0%) | 0 (0.0%) |
| Installation, Maintenance & Repair | 7 (100.0%) | 0 (0.0%) |
| Total (Category) | 12 (100.0%) | 0 (0.0%) |
| Total (Overall) | 39 (68.4%) | 18 (31.6%) |
Production, Transportation and Moving Occupations
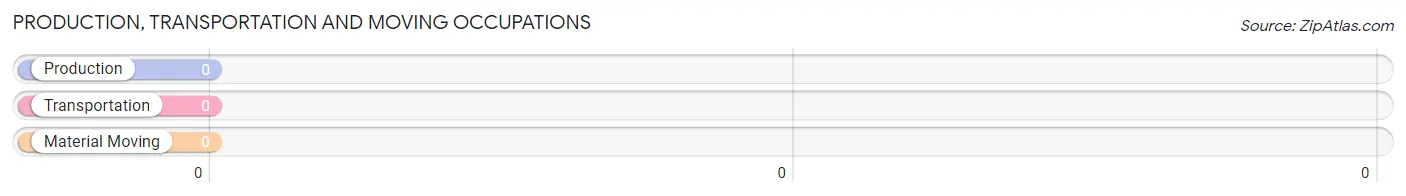
Production, Transportation and Moving Occupations by Sex
| Occupation | Male | Female |
| Production | 0 (0.0%) | 0 (0.0%) |
| Transportation | 0 (0.0%) | 0 (0.0%) |
| Material Moving | 0 (0.0%) | 0 (0.0%) |
| Total (Category) | 0 (0.0%) | 0 (0.0%) |
| Total (Overall) | 39 (68.4%) | 18 (31.6%) |
Employment Industries by Sex in Austinburg
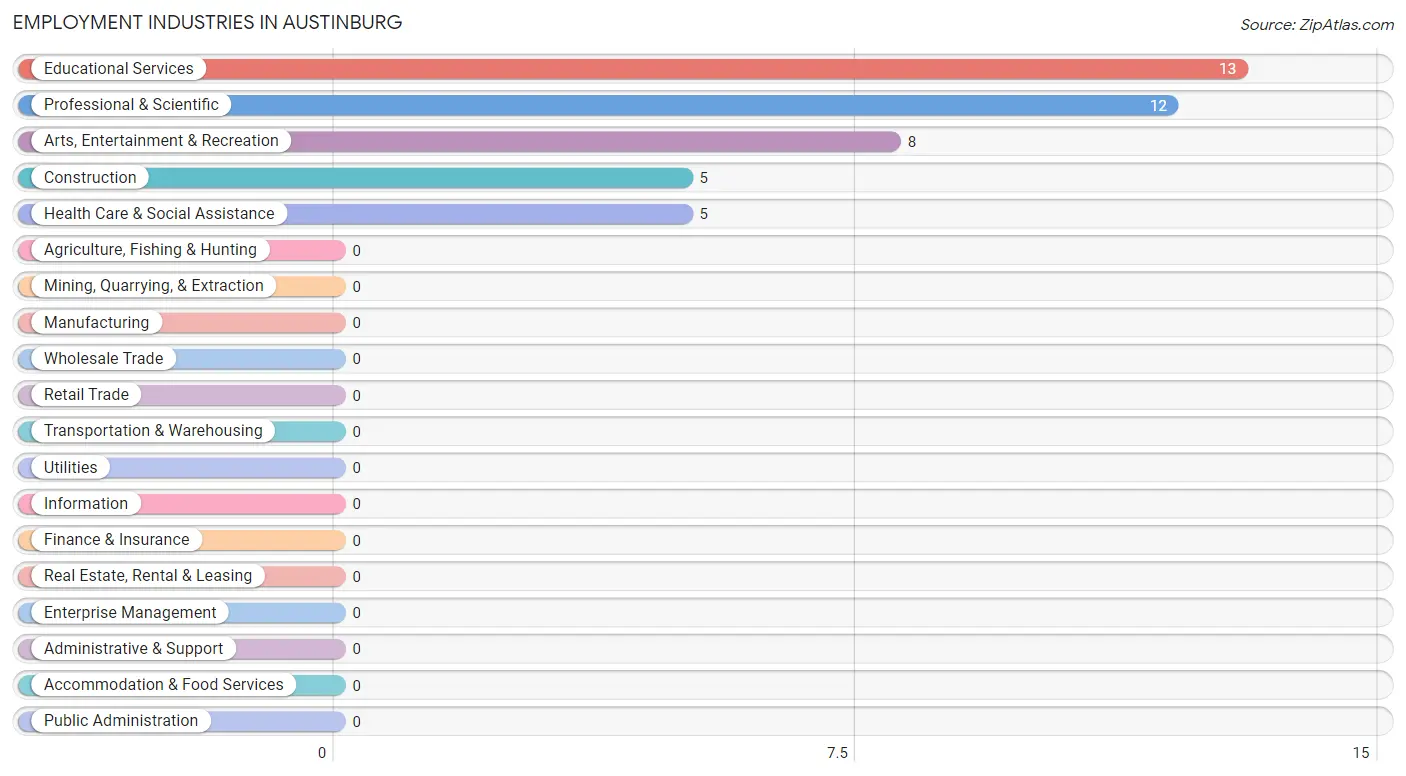
Employment Industries in Austinburg
The major employment industries in Austinburg include Educational Services (13 | 22.8%), Professional & Scientific (12 | 21.0%), Arts, Entertainment & Recreation (8 | 14.0%), Construction (5 | 8.8%), and Health Care & Social Assistance (5 | 8.8%).
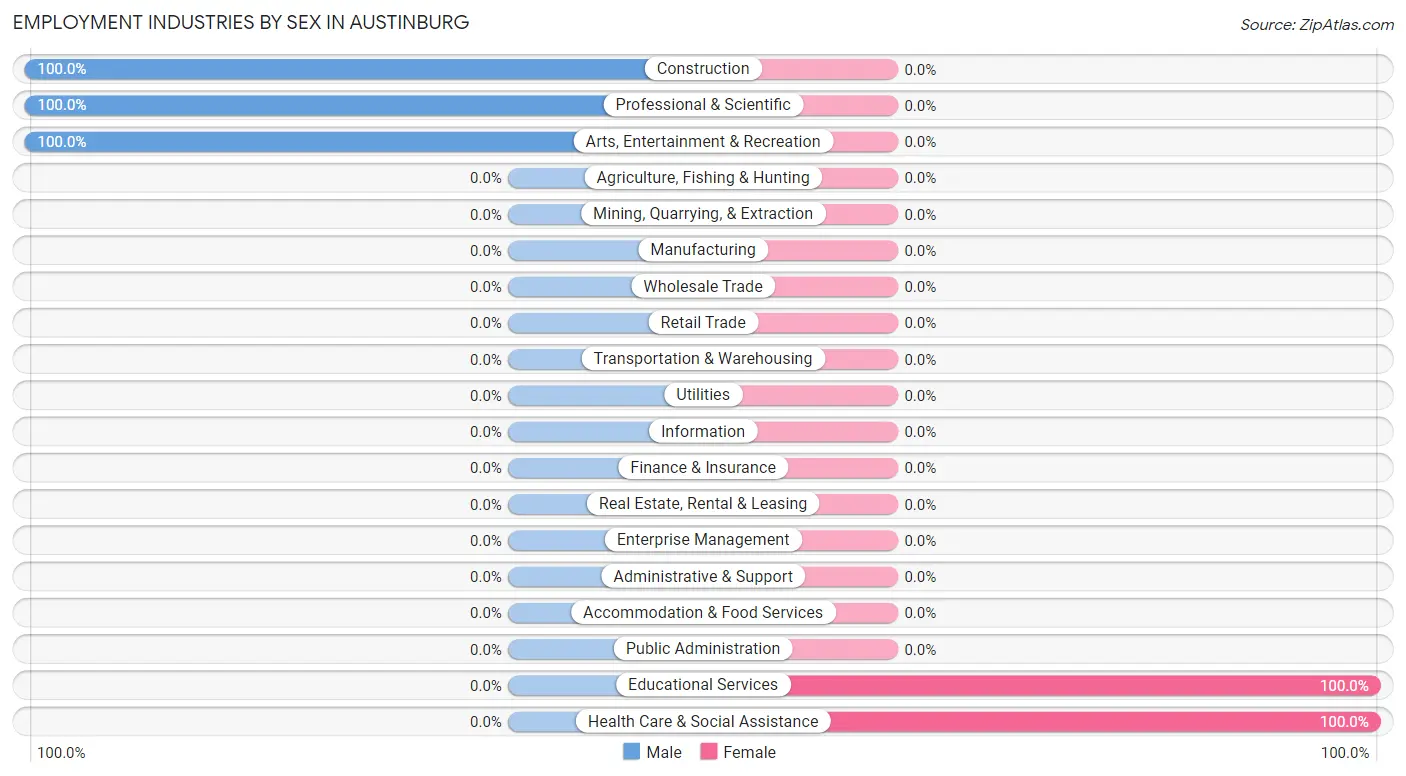
Employment Industries by Sex in Austinburg
The Austinburg industries that see more men than women are Construction (100.0%), Professional & Scientific (100.0%), and Arts, Entertainment & Recreation (100.0%), whereas the industries that tend to have a higher number of women are Educational Services (100.0%), and Health Care & Social Assistance (100.0%).
| Industry | Male | Female |
| Agriculture, Fishing & Hunting | 0 (0.0%) | 0 (0.0%) |
| Mining, Quarrying, & Extraction | 0 (0.0%) | 0 (0.0%) |
| Construction | 5 (100.0%) | 0 (0.0%) |
| Manufacturing | 0 (0.0%) | 0 (0.0%) |
| Wholesale Trade | 0 (0.0%) | 0 (0.0%) |
| Retail Trade | 0 (0.0%) | 0 (0.0%) |
| Transportation & Warehousing | 0 (0.0%) | 0 (0.0%) |
| Utilities | 0 (0.0%) | 0 (0.0%) |
| Information | 0 (0.0%) | 0 (0.0%) |
| Finance & Insurance | 0 (0.0%) | 0 (0.0%) |
| Real Estate, Rental & Leasing | 0 (0.0%) | 0 (0.0%) |
| Professional & Scientific | 12 (100.0%) | 0 (0.0%) |
| Enterprise Management | 0 (0.0%) | 0 (0.0%) |
| Administrative & Support | 0 (0.0%) | 0 (0.0%) |
| Educational Services | 0 (0.0%) | 13 (100.0%) |
| Health Care & Social Assistance | 0 (0.0%) | 5 (100.0%) |
| Arts, Entertainment & Recreation | 8 (100.0%) | 0 (0.0%) |
| Accommodation & Food Services | 0 (0.0%) | 0 (0.0%) |
| Public Administration | 0 (0.0%) | 0 (0.0%) |
| Total | 39 (68.4%) | 18 (31.6%) |
Education in Austinburg
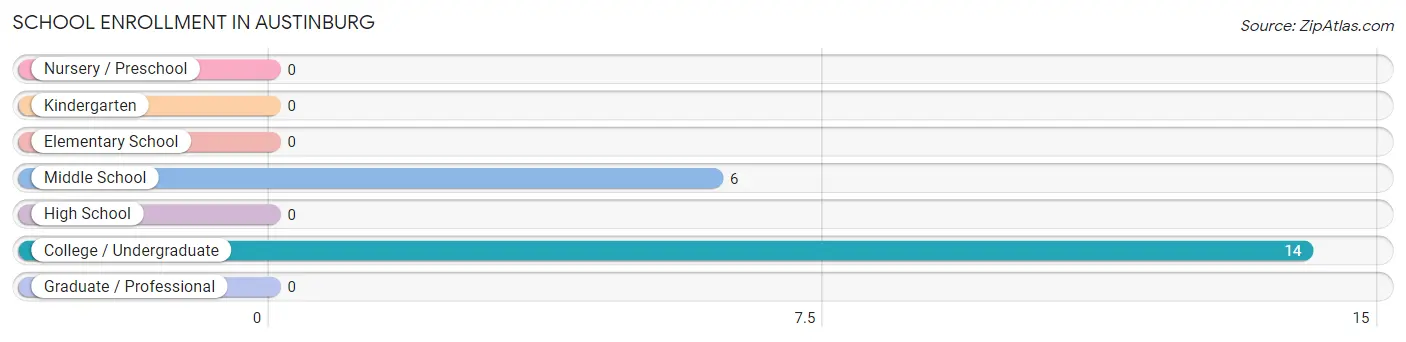
School Enrollment in Austinburg
The most common levels of schooling among the 20 students in Austinburg are college / undergraduate (14 | 70.0%), and middle school (6 | 30.0%).
| School Level | # Students | % Students |
| Nursery / Preschool | 0 | 0.0% |
| Kindergarten | 0 | 0.0% |
| Elementary School | 0 | 0.0% |
| Middle School | 6 | 30.0% |
| High School | 0 | 0.0% |
| College / Undergraduate | 14 | 70.0% |
| Graduate / Professional | 0 | 0.0% |
| Total | 20 | 100.0% |
School Enrollment by Age by Funding Source in Austinburg
Out of a total of 20 students who are enrolled in schools in Austinburg, 4 (20.0%) attend a private institution, while the remaining 16 (80.0%) are enrolled in public schools. The age group of 20 to 24 year olds has the highest likelihood of being enrolled in private schools, with 3 (37.5% in the age bracket) enrolled. Conversely, the age group of 10 to 14 year olds has the lowest likelihood of being enrolled in a private school, with 6 (100.0% in the age bracket) attending a public institution.
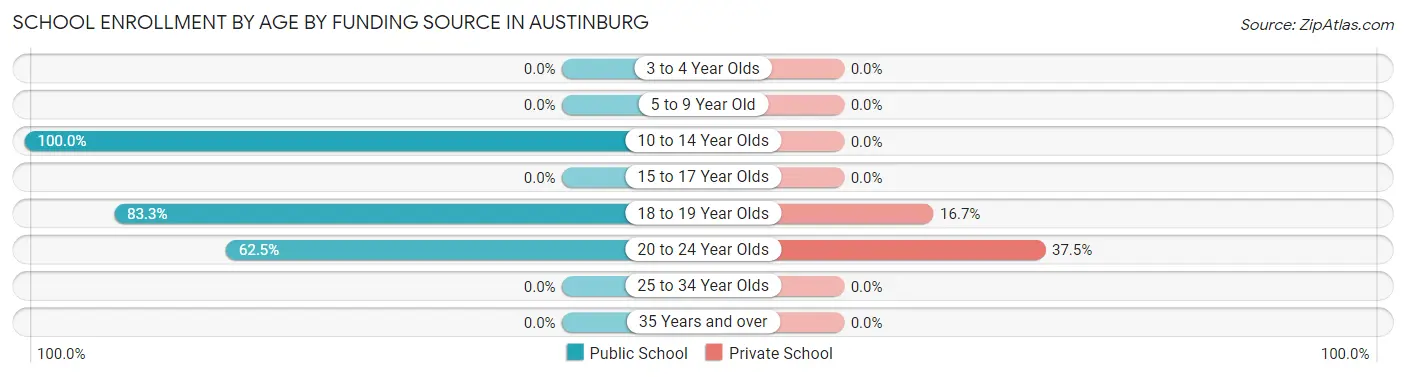
| Age Bracket | Public School | Private School |
| 3 to 4 Year Olds | 0 (0.0%) | 0 (0.0%) |
| 5 to 9 Year Old | 0 (0.0%) | 0 (0.0%) |
| 10 to 14 Year Olds | 6 (100.0%) | 0 (0.0%) |
| 15 to 17 Year Olds | 0 (0.0%) | 0 (0.0%) |
| 18 to 19 Year Olds | 5 (83.3%) | 1 (16.7%) |
| 20 to 24 Year Olds | 5 (62.5%) | 3 (37.5%) |
| 25 to 34 Year Olds | 0 (0.0%) | 0 (0.0%) |
| 35 Years and over | 0 (0.0%) | 0 (0.0%) |
| Total | 16 (80.0%) | 4 (20.0%) |
Educational Attainment by Field of Study in Austinburg
Business (53 | 39.9%), education (27 | 20.3%), liberal arts & history (26 | 19.6%), social sciences (12 | 9.0%), and arts & humanities (9 | 6.8%) are the most common fields of study among 133 individuals in Austinburg who have obtained a bachelor's degree or higher.
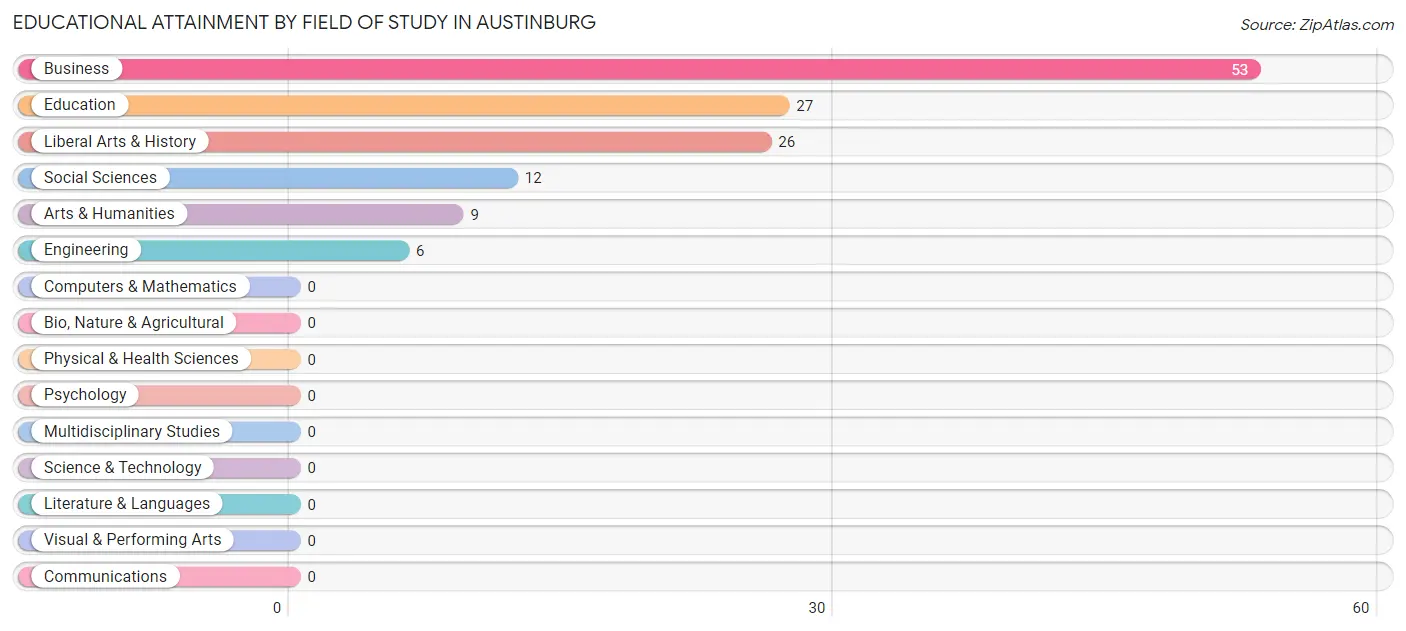
| Field of Study | # Graduates | % Graduates |
| Computers & Mathematics | 0 | 0.0% |
| Bio, Nature & Agricultural | 0 | 0.0% |
| Physical & Health Sciences | 0 | 0.0% |
| Psychology | 0 | 0.0% |
| Social Sciences | 12 | 9.0% |
| Engineering | 6 | 4.5% |
| Multidisciplinary Studies | 0 | 0.0% |
| Science & Technology | 0 | 0.0% |
| Business | 53 | 39.9% |
| Education | 27 | 20.3% |
| Literature & Languages | 0 | 0.0% |
| Liberal Arts & History | 26 | 19.6% |
| Visual & Performing Arts | 0 | 0.0% |
| Communications | 0 | 0.0% |
| Arts & Humanities | 9 | 6.8% |
| Total | 133 | 100.0% |
Transportation & Commute in Austinburg
Vehicle Availability by Sex in Austinburg
The most prevalent vehicle ownership categories in Austinburg are males with 2 vehicles (12, accounting for 50.0%) and females with 2 vehicles (12, making up 70.6%).
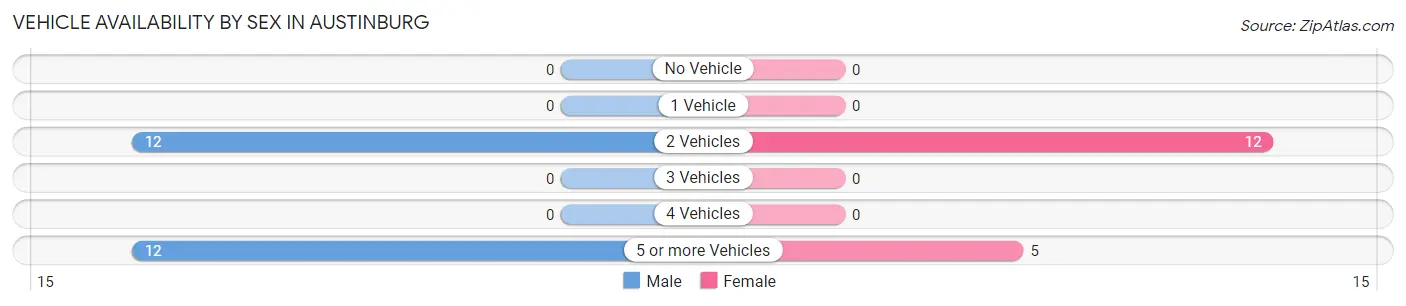
| Vehicles Available | Male | Female |
| No Vehicle | 0 (0.0%) | 0 (0.0%) |
| 1 Vehicle | 0 (0.0%) | 0 (0.0%) |
| 2 Vehicles | 12 (50.0%) | 12 (70.6%) |
| 3 Vehicles | 0 (0.0%) | 0 (0.0%) |
| 4 Vehicles | 0 (0.0%) | 0 (0.0%) |
| 5 or more Vehicles | 12 (50.0%) | 5 (29.4%) |
| Total | 24 (100.0%) | 17 (100.0%) |
Commute Time in Austinburg
The most frequently occuring commute durations in Austinburg are 10 to 14 minutes (17 commuters, 30.4%), less than 5 minutes (14 commuters, 25.0%), and 60 to 89 minutes (12 commuters, 21.4%).
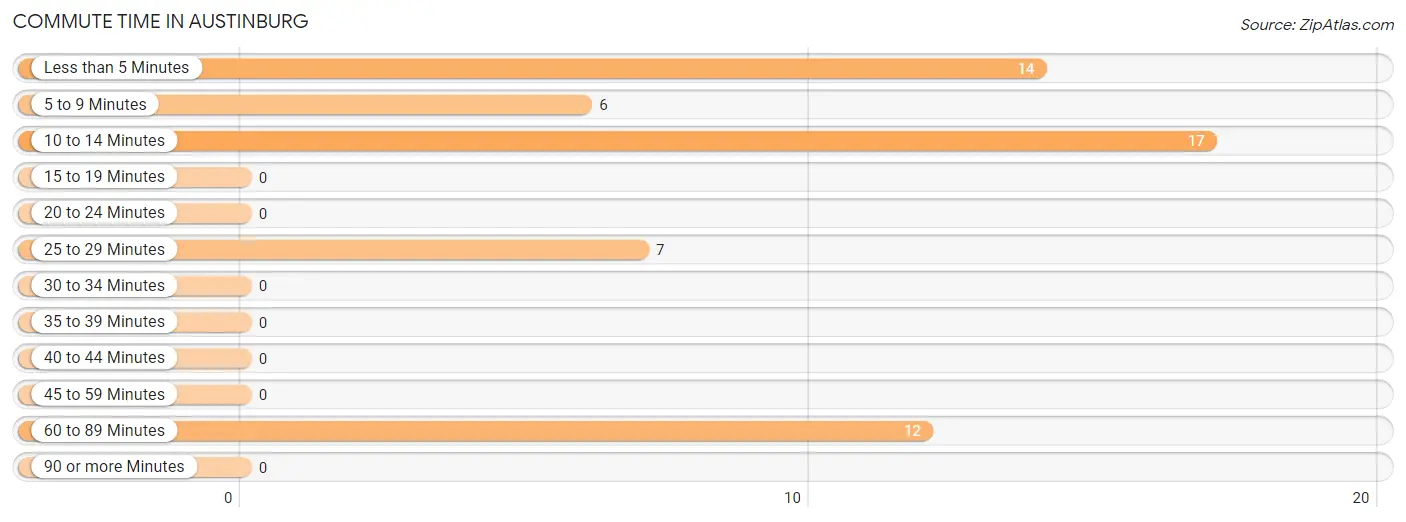
| Commute Time | # Commuters | % Commuters |
| Less than 5 Minutes | 14 | 25.0% |
| 5 to 9 Minutes | 6 | 10.7% |
| 10 to 14 Minutes | 17 | 30.4% |
| 15 to 19 Minutes | 0 | 0.0% |
| 20 to 24 Minutes | 0 | 0.0% |
| 25 to 29 Minutes | 7 | 12.5% |
| 30 to 34 Minutes | 0 | 0.0% |
| 35 to 39 Minutes | 0 | 0.0% |
| 40 to 44 Minutes | 0 | 0.0% |
| 45 to 59 Minutes | 0 | 0.0% |
| 60 to 89 Minutes | 12 | 21.4% |
| 90 or more Minutes | 0 | 0.0% |
Commute Time by Sex in Austinburg
The most common commute times in Austinburg are less than 5 minutes (14 commuters, 36.8%) for males and 10 to 14 minutes (17 commuters, 94.4%) for females.
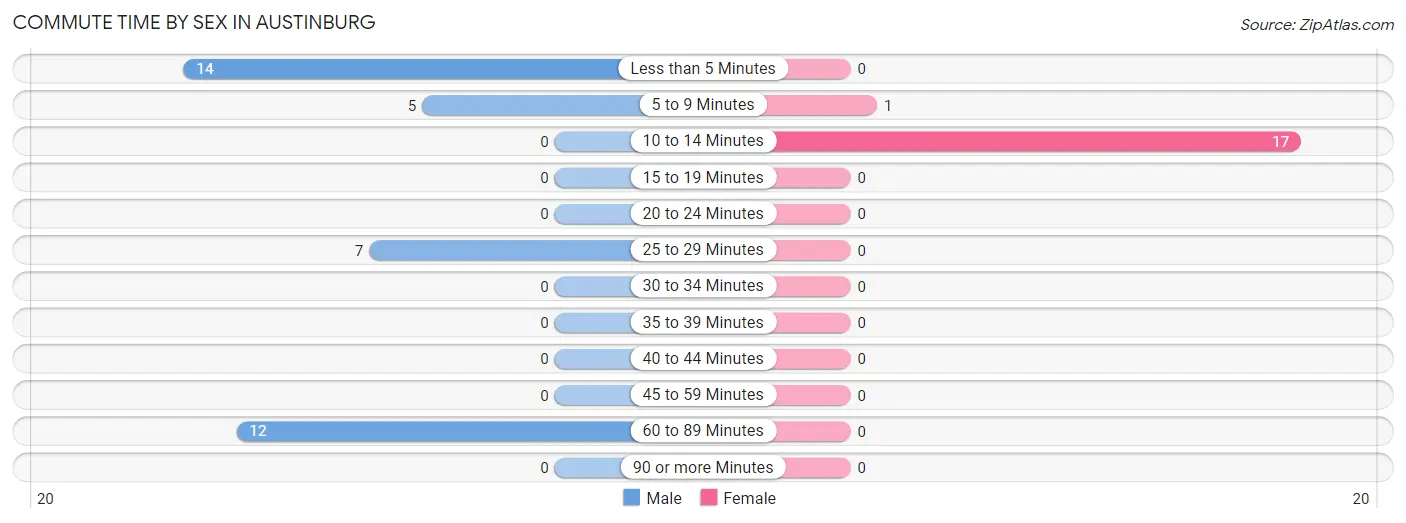
| Commute Time | Male | Female |
| Less than 5 Minutes | 14 (36.8%) | 0 (0.0%) |
| 5 to 9 Minutes | 5 (13.2%) | 1 (5.6%) |
| 10 to 14 Minutes | 0 (0.0%) | 17 (94.4%) |
| 15 to 19 Minutes | 0 (0.0%) | 0 (0.0%) |
| 20 to 24 Minutes | 0 (0.0%) | 0 (0.0%) |
| 25 to 29 Minutes | 7 (18.4%) | 0 (0.0%) |
| 30 to 34 Minutes | 0 (0.0%) | 0 (0.0%) |
| 35 to 39 Minutes | 0 (0.0%) | 0 (0.0%) |
| 40 to 44 Minutes | 0 (0.0%) | 0 (0.0%) |
| 45 to 59 Minutes | 0 (0.0%) | 0 (0.0%) |
| 60 to 89 Minutes | 12 (31.6%) | 0 (0.0%) |
| 90 or more Minutes | 0 (0.0%) | 0 (0.0%) |
Time of Departure to Work by Sex in Austinburg
The most frequent times of departure to work in Austinburg are 6:30 AM to 6:59 AM (17, 44.7%) for males and 7:30 AM to 7:59 AM (12, 66.7%) for females.
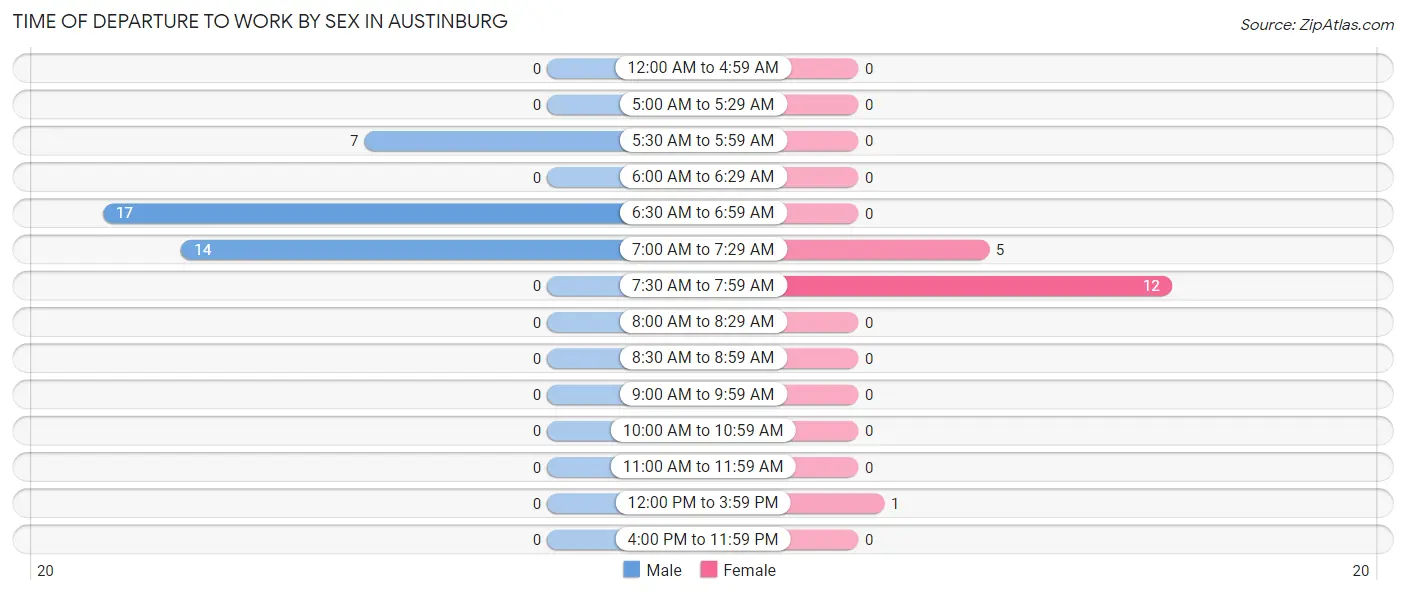
| Time of Departure | Male | Female |
| 12:00 AM to 4:59 AM | 0 (0.0%) | 0 (0.0%) |
| 5:00 AM to 5:29 AM | 0 (0.0%) | 0 (0.0%) |
| 5:30 AM to 5:59 AM | 7 (18.4%) | 0 (0.0%) |
| 6:00 AM to 6:29 AM | 0 (0.0%) | 0 (0.0%) |
| 6:30 AM to 6:59 AM | 17 (44.7%) | 0 (0.0%) |
| 7:00 AM to 7:29 AM | 14 (36.8%) | 5 (27.8%) |
| 7:30 AM to 7:59 AM | 0 (0.0%) | 12 (66.7%) |
| 8:00 AM to 8:29 AM | 0 (0.0%) | 0 (0.0%) |
| 8:30 AM to 8:59 AM | 0 (0.0%) | 0 (0.0%) |
| 9:00 AM to 9:59 AM | 0 (0.0%) | 0 (0.0%) |
| 10:00 AM to 10:59 AM | 0 (0.0%) | 0 (0.0%) |
| 11:00 AM to 11:59 AM | 0 (0.0%) | 0 (0.0%) |
| 12:00 PM to 3:59 PM | 0 (0.0%) | 1 (5.6%) |
| 4:00 PM to 11:59 PM | 0 (0.0%) | 0 (0.0%) |
| Total | 38 (100.0%) | 18 (100.0%) |
Housing Occupancy in Austinburg
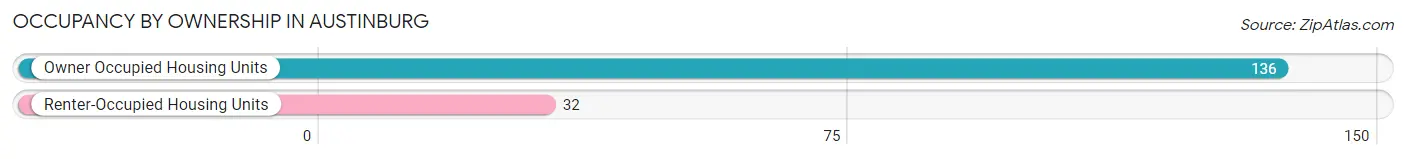
Occupancy by Ownership in Austinburg
Of the total 168 dwellings in Austinburg, owner-occupied units account for 136 (80.9%), while renter-occupied units make up 32 (19.1%).
| Occupancy | # Housing Units | % Housing Units |
| Owner Occupied Housing Units | 136 | 80.9% |
| Renter-Occupied Housing Units | 32 | 19.1% |
| Total Occupied Housing Units | 168 | 100.0% |
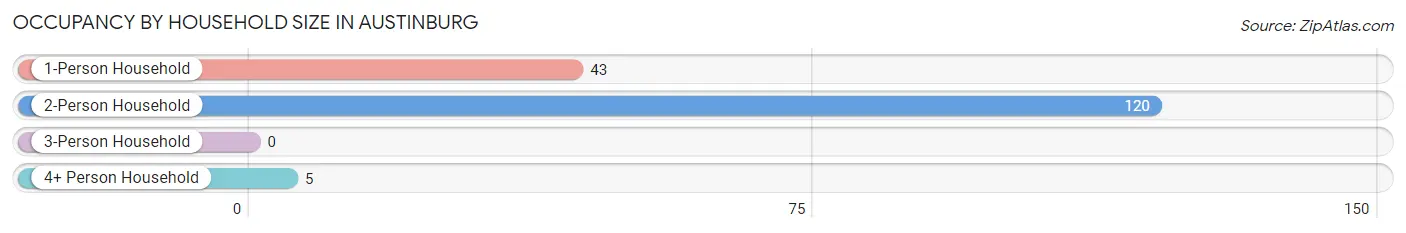
Occupancy by Household Size in Austinburg
| Household Size | # Housing Units | % Housing Units |
| 1-Person Household | 43 | 25.6% |
| 2-Person Household | 120 | 71.4% |
| 3-Person Household | 0 | 0.0% |
| 4+ Person Household | 5 | 3.0% |
| Total Housing Units | 168 | 100.0% |
Occupancy by Ownership by Household Size in Austinburg
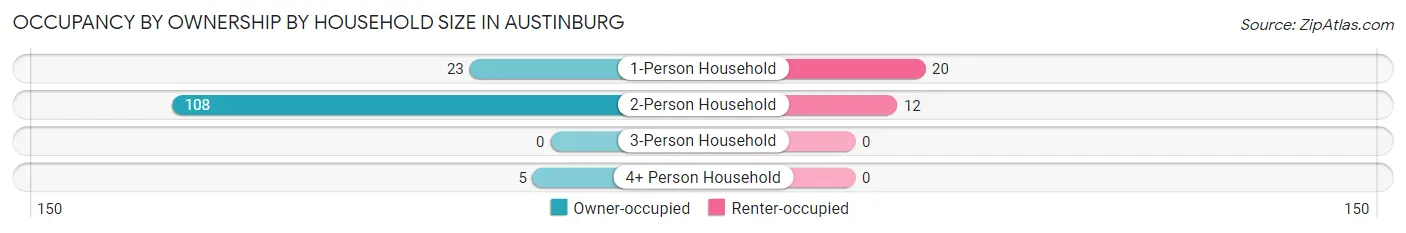
| Household Size | Owner-occupied | Renter-occupied |
| 1-Person Household | 23 (53.5%) | 20 (46.5%) |
| 2-Person Household | 108 (90.0%) | 12 (10.0%) |
| 3-Person Household | 0 (0.0%) | 0 (0.0%) |
| 4+ Person Household | 5 (100.0%) | 0 (0.0%) |
| Total Housing Units | 136 (80.9%) | 32 (19.1%) |
Occupancy by Educational Attainment in Austinburg
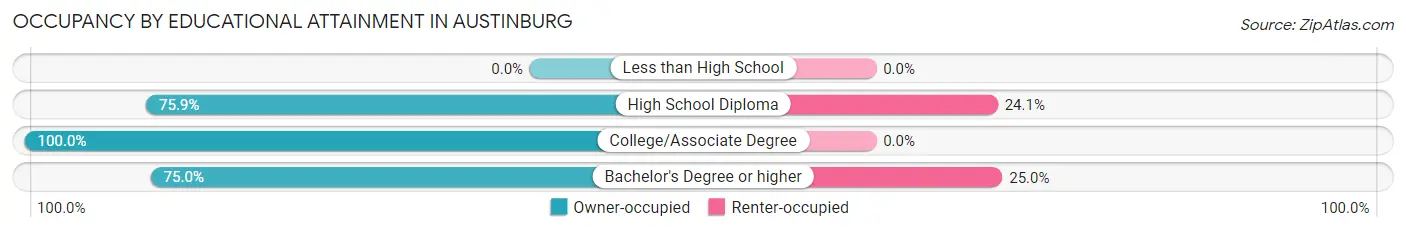
| Household Size | Owner-occupied | Renter-occupied |
| Less than High School | 0 (0.0%) | 0 (0.0%) |
| High School Diploma | 63 (75.9%) | 20 (24.1%) |
| College/Associate Degree | 37 (100.0%) | 0 (0.0%) |
| Bachelor's Degree or higher | 36 (75.0%) | 12 (25.0%) |
Occupancy by Age of Householder in Austinburg
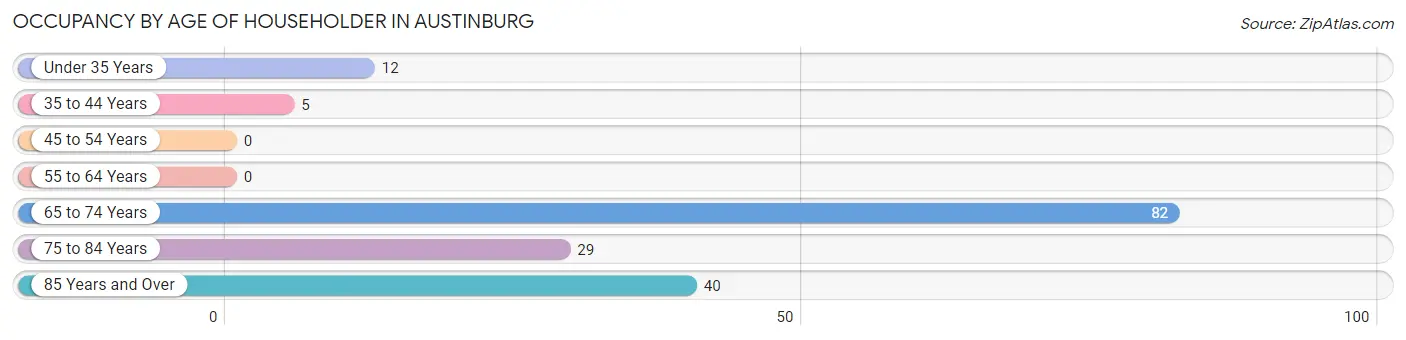
| Age Bracket | # Households | % Households |
| Under 35 Years | 12 | 7.1% |
| 35 to 44 Years | 5 | 3.0% |
| 45 to 54 Years | 0 | 0.0% |
| 55 to 64 Years | 0 | 0.0% |
| 65 to 74 Years | 82 | 48.8% |
| 75 to 84 Years | 29 | 17.3% |
| 85 Years and Over | 40 | 23.8% |
| Total | 168 | 100.0% |
Housing Finances in Austinburg
Median Income by Occupancy in Austinburg
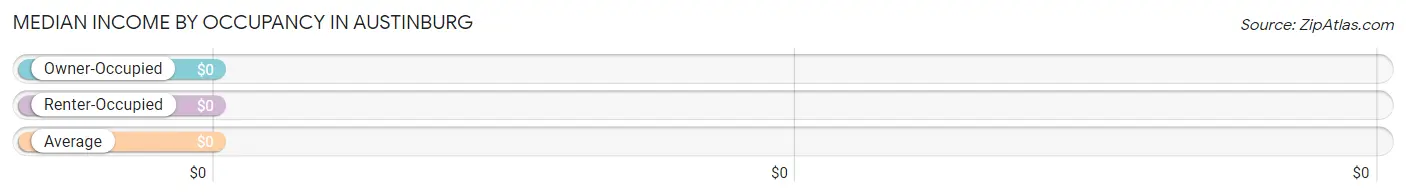
| Occupancy Type | # Households | Median Income |
| Owner-Occupied | 136 (80.9%) | $0 |
| Renter-Occupied | 32 (19.1%) | $0 |
| Average | 168 (100.0%) | $0 |
Occupancy by Householder Income Bracket in Austinburg
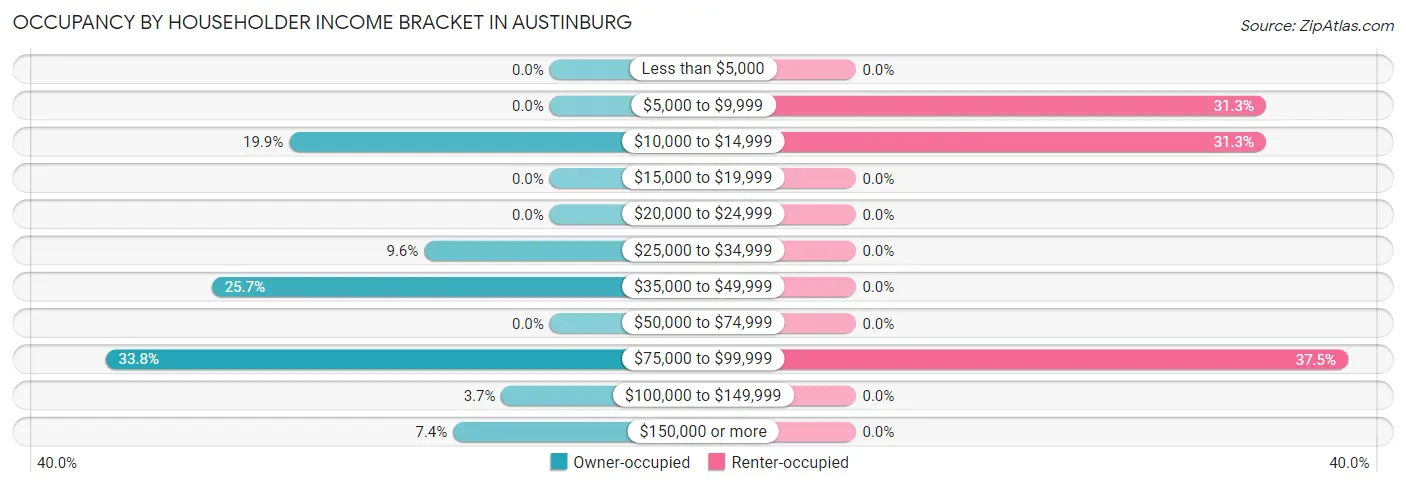
| Income Bracket | Owner-occupied | Renter-occupied |
| Less than $5,000 | 0 (0.0%) | 0 (0.0%) |
| $5,000 to $9,999 | 0 (0.0%) | 10 (31.2%) |
| $10,000 to $14,999 | 27 (19.9%) | 10 (31.2%) |
| $15,000 to $19,999 | 0 (0.0%) | 0 (0.0%) |
| $20,000 to $24,999 | 0 (0.0%) | 0 (0.0%) |
| $25,000 to $34,999 | 13 (9.6%) | 0 (0.0%) |
| $35,000 to $49,999 | 35 (25.7%) | 0 (0.0%) |
| $50,000 to $74,999 | 0 (0.0%) | 0 (0.0%) |
| $75,000 to $99,999 | 46 (33.8%) | 12 (37.5%) |
| $100,000 to $149,999 | 5 (3.7%) | 0 (0.0%) |
| $150,000 or more | 10 (7.3%) | 0 (0.0%) |
| Total | 136 (100.0%) | 32 (100.0%) |
Monthly Housing Cost Tiers in Austinburg
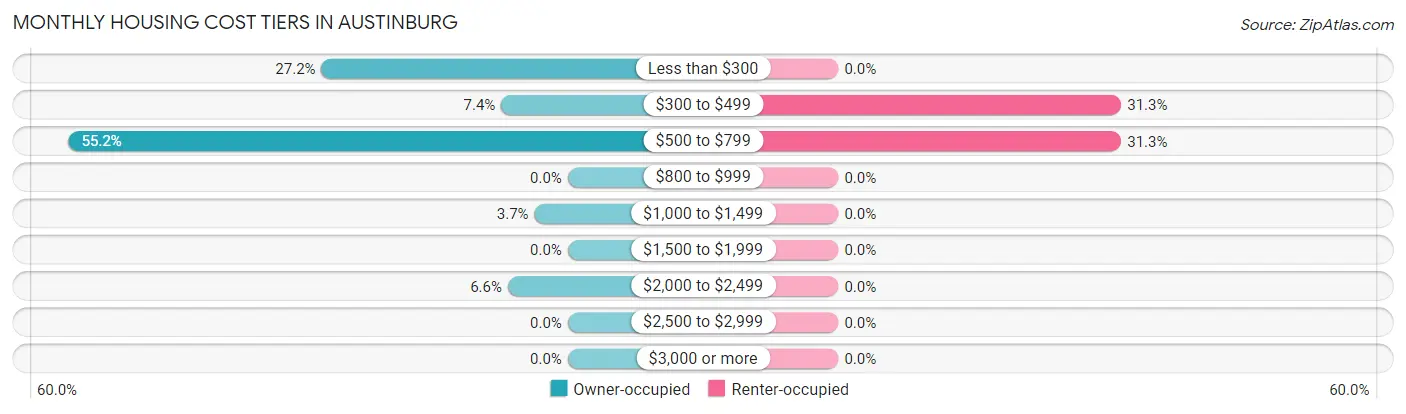
| Monthly Cost | Owner-occupied | Renter-occupied |
| Less than $300 | 37 (27.2%) | 0 (0.0%) |
| $300 to $499 | 10 (7.3%) | 10 (31.2%) |
| $500 to $799 | 75 (55.1%) | 10 (31.2%) |
| $800 to $999 | 0 (0.0%) | 0 (0.0%) |
| $1,000 to $1,499 | 5 (3.7%) | 0 (0.0%) |
| $1,500 to $1,999 | 0 (0.0%) | 0 (0.0%) |
| $2,000 to $2,499 | 9 (6.6%) | 0 (0.0%) |
| $2,500 to $2,999 | 0 (0.0%) | 0 (0.0%) |
| $3,000 or more | 0 (0.0%) | 0 (0.0%) |
| Total | 136 (100.0%) | 32 (100.0%) |
Physical Housing Characteristics in Austinburg
Housing Structures in Austinburg
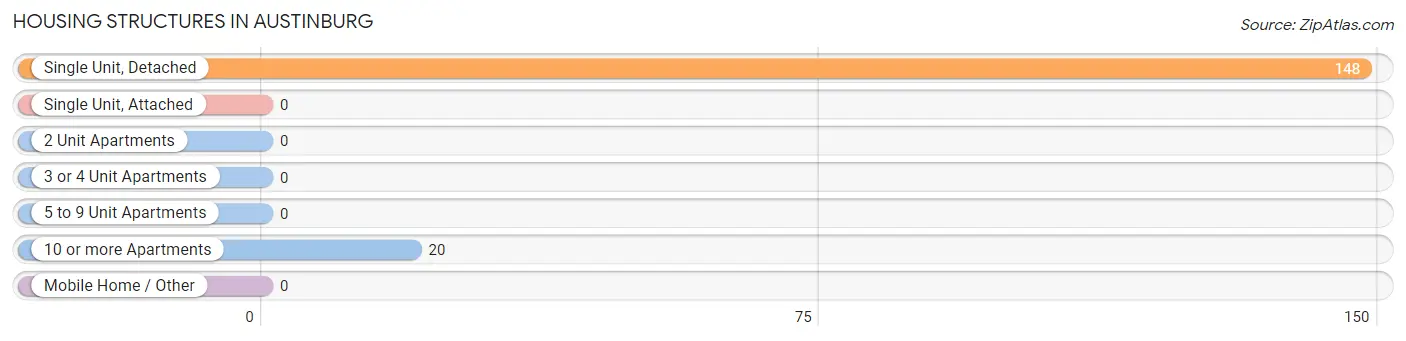
| Structure Type | # Housing Units | % Housing Units |
| Single Unit, Detached | 148 | 88.1% |
| Single Unit, Attached | 0 | 0.0% |
| 2 Unit Apartments | 0 | 0.0% |
| 3 or 4 Unit Apartments | 0 | 0.0% |
| 5 to 9 Unit Apartments | 0 | 0.0% |
| 10 or more Apartments | 20 | 11.9% |
| Mobile Home / Other | 0 | 0.0% |
| Total | 168 | 100.0% |
Housing Structures by Occupancy in Austinburg
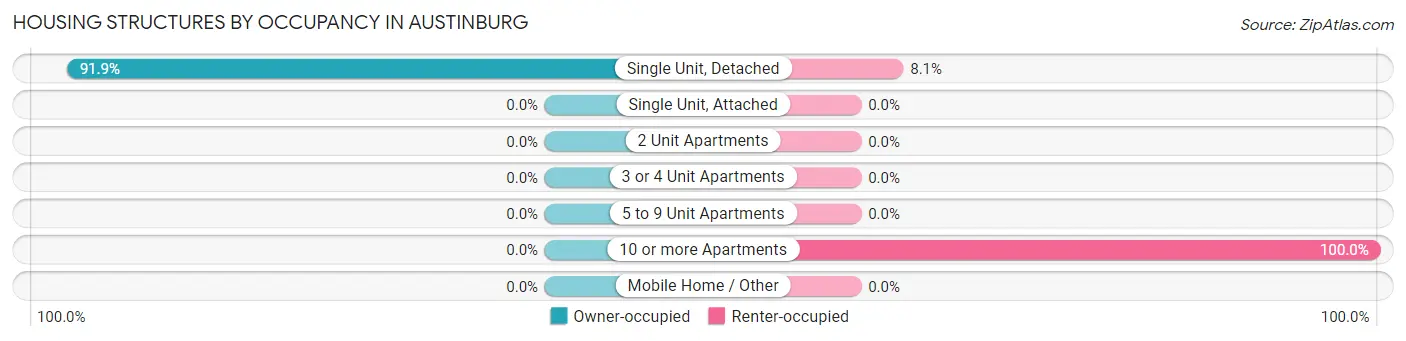
| Structure Type | Owner-occupied | Renter-occupied |
| Single Unit, Detached | 136 (91.9%) | 12 (8.1%) |
| Single Unit, Attached | 0 (0.0%) | 0 (0.0%) |
| 2 Unit Apartments | 0 (0.0%) | 0 (0.0%) |
| 3 or 4 Unit Apartments | 0 (0.0%) | 0 (0.0%) |
| 5 to 9 Unit Apartments | 0 (0.0%) | 0 (0.0%) |
| 10 or more Apartments | 0 (0.0%) | 20 (100.0%) |
| Mobile Home / Other | 0 (0.0%) | 0 (0.0%) |
| Total | 136 (80.9%) | 32 (19.1%) |
Housing Structures by Number of Rooms in Austinburg
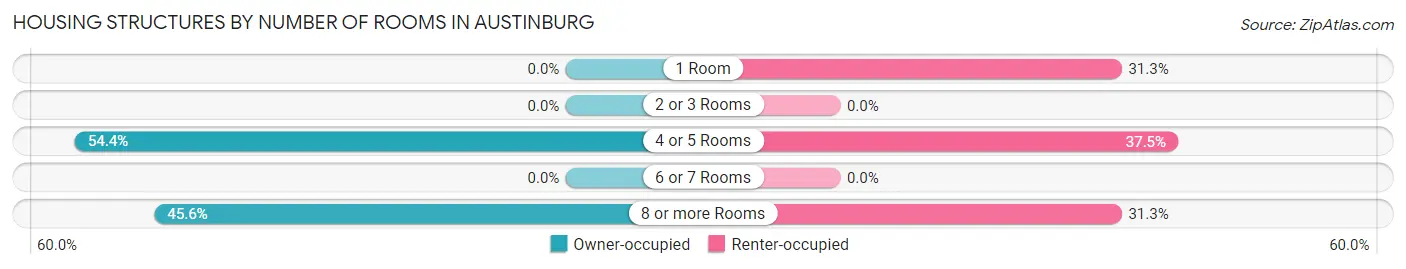
| Number of Rooms | Owner-occupied | Renter-occupied |
| 1 Room | 0 (0.0%) | 10 (31.2%) |
| 2 or 3 Rooms | 0 (0.0%) | 0 (0.0%) |
| 4 or 5 Rooms | 74 (54.4%) | 12 (37.5%) |
| 6 or 7 Rooms | 0 (0.0%) | 0 (0.0%) |
| 8 or more Rooms | 62 (45.6%) | 10 (31.2%) |
| Total | 136 (100.0%) | 32 (100.0%) |
Housing Structure by Heating Type in Austinburg
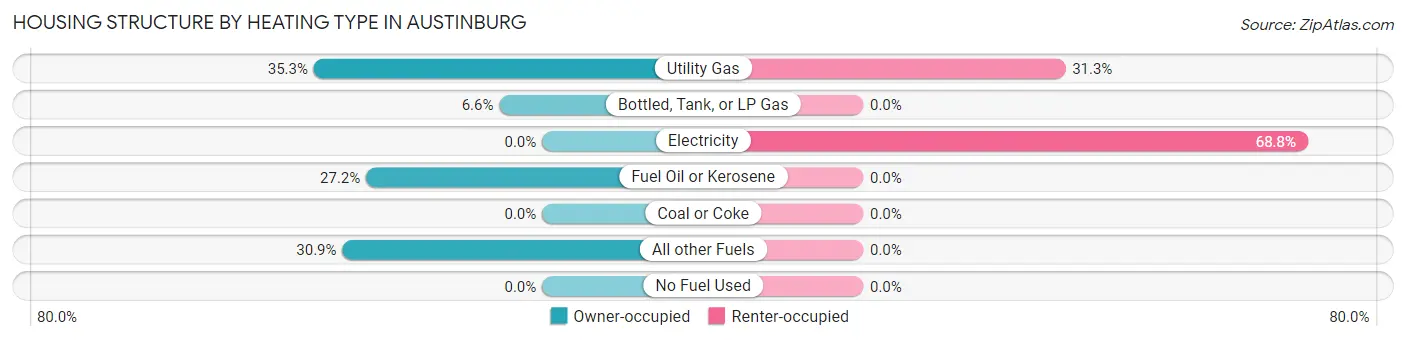
| Heating Type | Owner-occupied | Renter-occupied |
| Utility Gas | 48 (35.3%) | 10 (31.2%) |
| Bottled, Tank, or LP Gas | 9 (6.6%) | 0 (0.0%) |
| Electricity | 0 (0.0%) | 22 (68.8%) |
| Fuel Oil or Kerosene | 37 (27.2%) | 0 (0.0%) |
| Coal or Coke | 0 (0.0%) | 0 (0.0%) |
| All other Fuels | 42 (30.9%) | 0 (0.0%) |
| No Fuel Used | 0 (0.0%) | 0 (0.0%) |
| Total | 136 (100.0%) | 32 (100.0%) |
Household Vehicle Usage in Austinburg
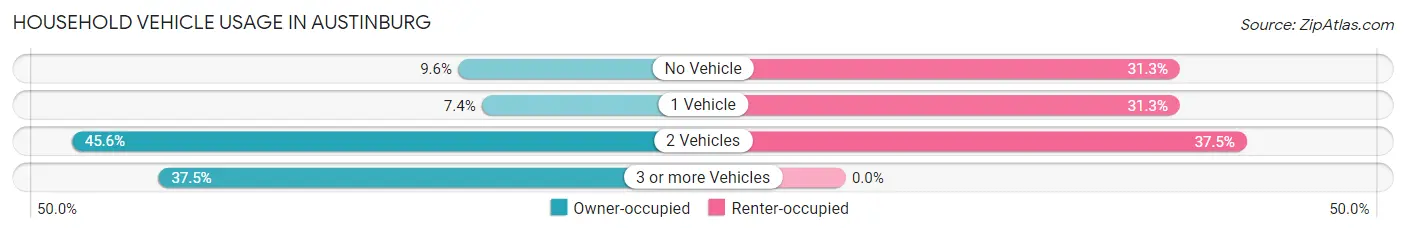
| Vehicles per Household | Owner-occupied | Renter-occupied |
| No Vehicle | 13 (9.6%) | 10 (31.2%) |
| 1 Vehicle | 10 (7.3%) | 10 (31.2%) |
| 2 Vehicles | 62 (45.6%) | 12 (37.5%) |
| 3 or more Vehicles | 51 (37.5%) | 0 (0.0%) |
| Total | 136 (100.0%) | 32 (100.0%) |
Real Estate & Mortgages in Austinburg
Real Estate and Mortgage Overview in Austinburg
| Characteristic | Without Mortgage | With Mortgage |
| Housing Units | 122 | 14 |
| Median Property Value | - | - |
| Median Household Income | - | - |
| Monthly Housing Costs | $529 | $0 |
| Real Estate Taxes | $2,244 | $0 |
Property Value by Mortgage Status in Austinburg
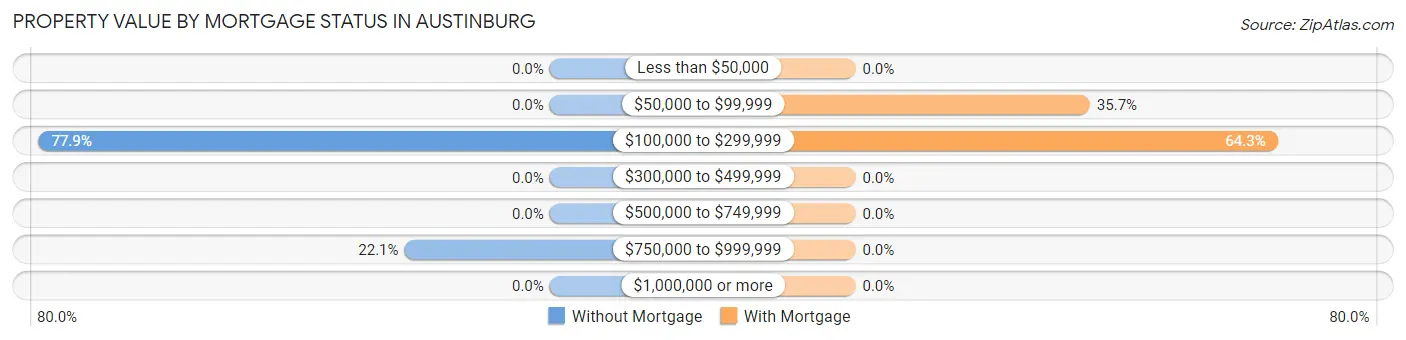
| Property Value | Without Mortgage | With Mortgage |
| Less than $50,000 | 0 (0.0%) | 0 (0.0%) |
| $50,000 to $99,999 | 0 (0.0%) | 5 (35.7%) |
| $100,000 to $299,999 | 95 (77.9%) | 9 (64.3%) |
| $300,000 to $499,999 | 0 (0.0%) | 0 (0.0%) |
| $500,000 to $749,999 | 0 (0.0%) | 0 (0.0%) |
| $750,000 to $999,999 | 27 (22.1%) | 0 (0.0%) |
| $1,000,000 or more | 0 (0.0%) | 0 (0.0%) |
| Total | 122 (100.0%) | 14 (100.0%) |
Household Income by Mortgage Status in Austinburg
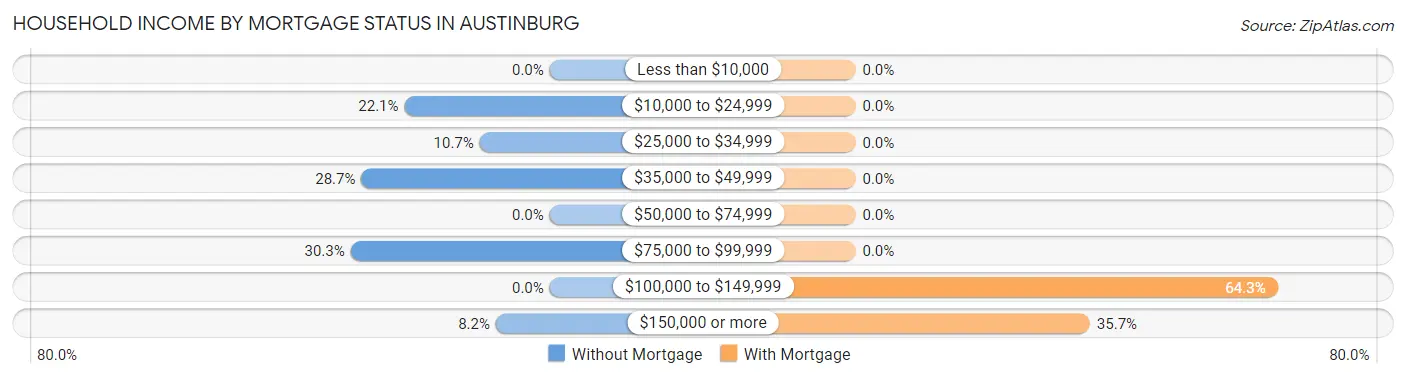
| Household Income | Without Mortgage | With Mortgage |
| Less than $10,000 | 0 (0.0%) | 0 (0.0%) |
| $10,000 to $24,999 | 27 (22.1%) | 0 (0.0%) |
| $25,000 to $34,999 | 13 (10.7%) | 0 (0.0%) |
| $35,000 to $49,999 | 35 (28.7%) | 0 (0.0%) |
| $50,000 to $74,999 | 0 (0.0%) | 0 (0.0%) |
| $75,000 to $99,999 | 37 (30.3%) | 0 (0.0%) |
| $100,000 to $149,999 | 0 (0.0%) | 9 (64.3%) |
| $150,000 or more | 10 (8.2%) | 5 (35.7%) |
| Total | 122 (100.0%) | 14 (100.0%) |
Property Value to Household Income Ratio in Austinburg
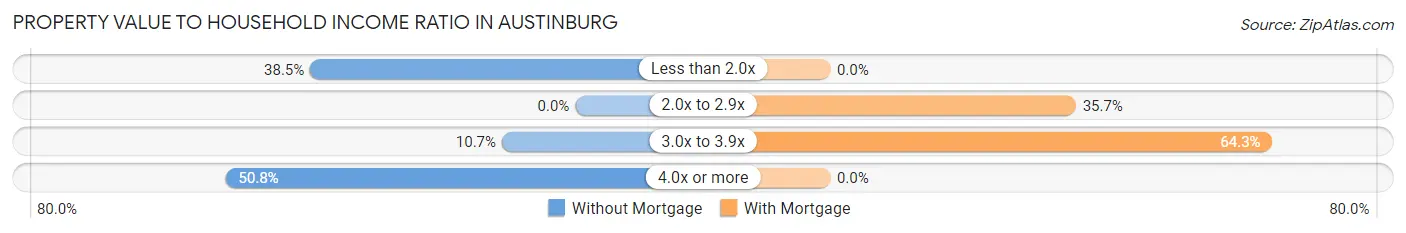
| Value-to-Income Ratio | Without Mortgage | With Mortgage |
| Less than 2.0x | 47 (38.5%) | 0 (0.0%) |
| 2.0x to 2.9x | 0 (0.0%) | 5 (35.7%) |
| 3.0x to 3.9x | 13 (10.7%) | 9 (64.3%) |
| 4.0x or more | 62 (50.8%) | 0 (0.0%) |
| Total | 122 (100.0%) | 14 (100.0%) |
Real Estate Taxes by Mortgage Status in Austinburg
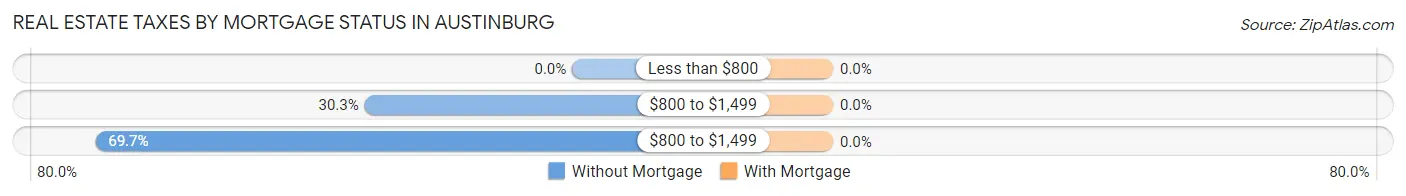
| Property Taxes | Without Mortgage | With Mortgage |
| Less than $800 | 0 (0.0%) | 0 (0.0%) |
| $800 to $1,499 | 37 (30.3%) | 0 (0.0%) |
| $800 to $1,499 | 85 (69.7%) | 0 (0.0%) |
| Total | 122 (100.0%) | 14 (100.0%) |
Health & Disability in Austinburg
Health Insurance Coverage by Age in Austinburg
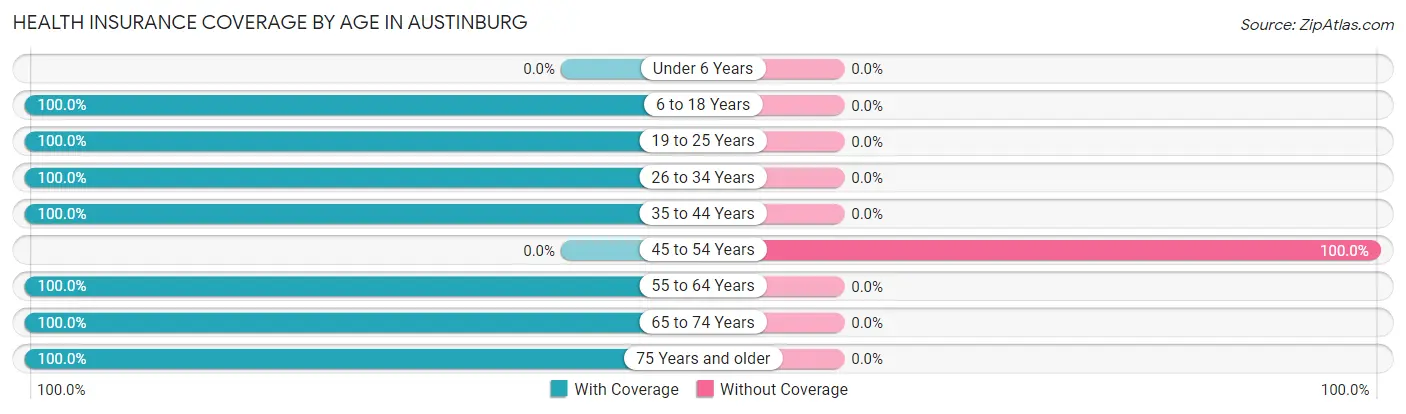
| Age Bracket | With Coverage | Without Coverage |
| Under 6 Years | 0 (0.0%) | 0 (0.0%) |
| 6 to 18 Years | 7 (100.0%) | 0 (0.0%) |
| 19 to 25 Years | 20 (100.0%) | 0 (0.0%) |
| 26 to 34 Years | 24 (100.0%) | 0 (0.0%) |
| 35 to 44 Years | 24 (100.0%) | 0 (0.0%) |
| 45 to 54 Years | 0 (0.0%) | 53 (100.0%) |
| 55 to 64 Years | 46 (100.0%) | 0 (0.0%) |
| 65 to 74 Years | 82 (100.0%) | 0 (0.0%) |
| 75 Years and older | 106 (100.0%) | 0 (0.0%) |
| Total | 309 (85.4%) | 53 (14.6%) |
Health Insurance Coverage by Citizenship Status in Austinburg
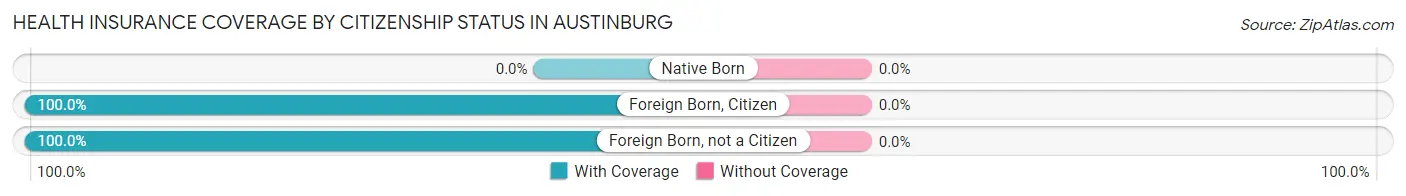
| Citizenship Status | With Coverage | Without Coverage |
| Native Born | 0 (0.0%) | 0 (0.0%) |
| Foreign Born, Citizen | 7 (100.0%) | 0 (0.0%) |
| Foreign Born, not a Citizen | 20 (100.0%) | 0 (0.0%) |
Health Insurance Coverage by Household Income in Austinburg
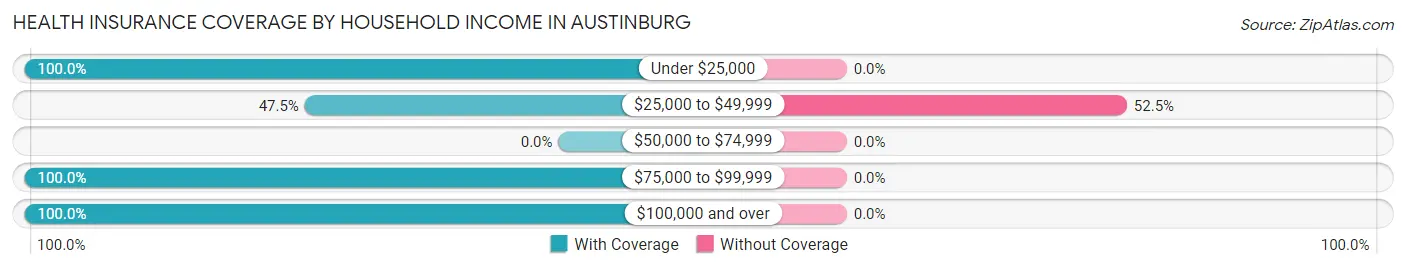
| Household Income | With Coverage | Without Coverage |
| Under $25,000 | 75 (100.0%) | 0 (0.0%) |
| $25,000 to $49,999 | 48 (47.5%) | 53 (52.5%) |
| $50,000 to $74,999 | 0 (0.0%) | 0 (0.0%) |
| $75,000 to $99,999 | 125 (100.0%) | 0 (0.0%) |
| $100,000 and over | 33 (100.0%) | 0 (0.0%) |
Public vs Private Health Insurance Coverage by Age in Austinburg
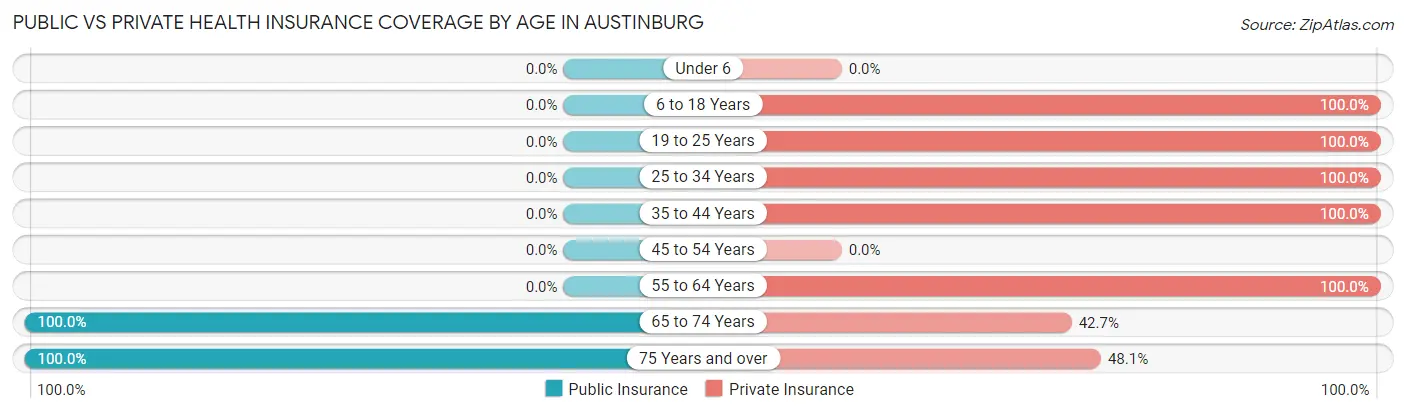
| Age Bracket | Public Insurance | Private Insurance |
| Under 6 | 0 (0.0%) | 0 (0.0%) |
| 6 to 18 Years | 0 (0.0%) | 7 (100.0%) |
| 19 to 25 Years | 0 (0.0%) | 20 (100.0%) |
| 25 to 34 Years | 0 (0.0%) | 24 (100.0%) |
| 35 to 44 Years | 0 (0.0%) | 24 (100.0%) |
| 45 to 54 Years | 0 (0.0%) | 0 (0.0%) |
| 55 to 64 Years | 0 (0.0%) | 46 (100.0%) |
| 65 to 74 Years | 82 (100.0%) | 35 (42.7%) |
| 75 Years and over | 106 (100.0%) | 51 (48.1%) |
| Total | 188 (51.9%) | 207 (57.2%) |
Disability Status by Sex by Age in Austinburg
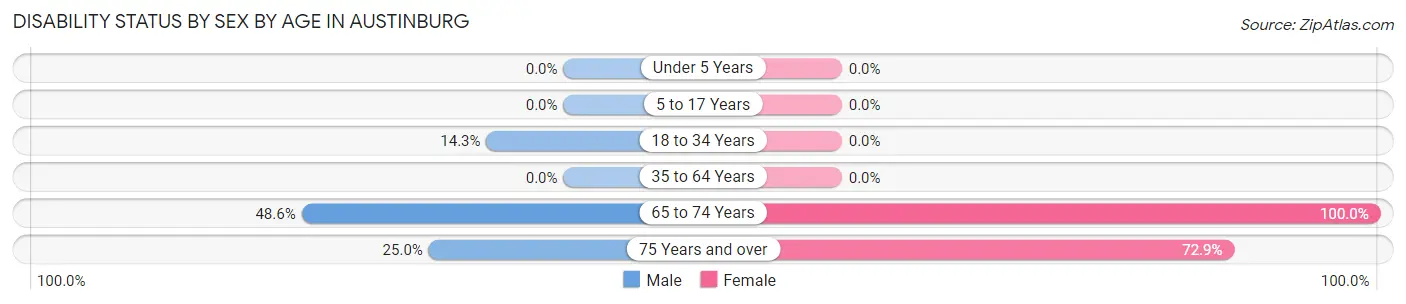
| Age Bracket | Male | Female |
| Under 5 Years | 0 (0.0%) | 0 (0.0%) |
| 5 to 17 Years | 0 (0.0%) | 0 (0.0%) |
| 18 to 34 Years | 4 (14.3%) | 0 (0.0%) |
| 35 to 64 Years | 0 (0.0%) | 0 (0.0%) |
| 65 to 74 Years | 35 (48.6%) | 10 (100.0%) |
| 75 Years and over | 9 (25.0%) | 51 (72.9%) |
Disability Class by Sex by Age in Austinburg
Disability Class: Hearing Difficulty
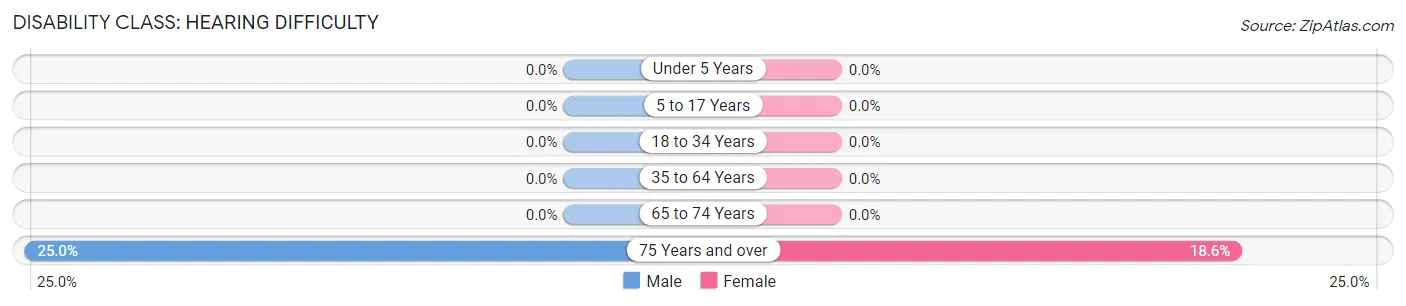
| Age Bracket | Male | Female |
| Under 5 Years | 0 (0.0%) | 0 (0.0%) |
| 5 to 17 Years | 0 (0.0%) | 0 (0.0%) |
| 18 to 34 Years | 0 (0.0%) | 0 (0.0%) |
| 35 to 64 Years | 0 (0.0%) | 0 (0.0%) |
| 65 to 74 Years | 0 (0.0%) | 0 (0.0%) |
| 75 Years and over | 9 (25.0%) | 13 (18.6%) |
Disability Class: Vision Difficulty
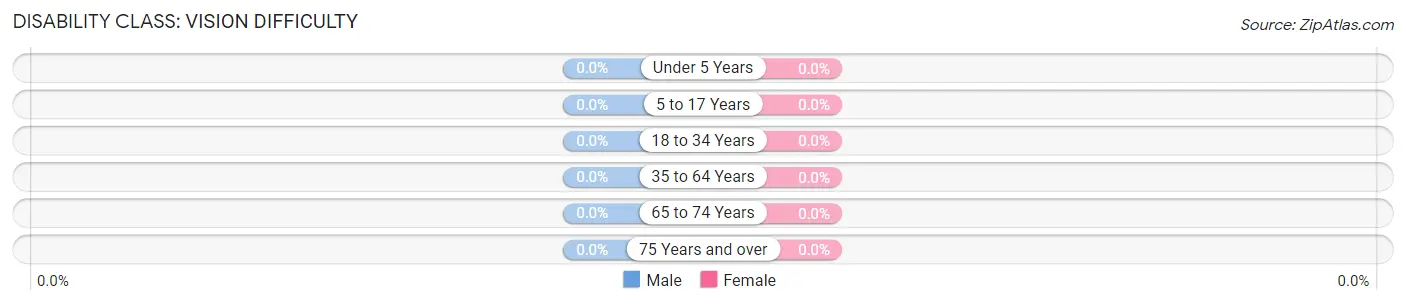
| Age Bracket | Male | Female |
| Under 5 Years | 0 (0.0%) | 0 (0.0%) |
| 5 to 17 Years | 0 (0.0%) | 0 (0.0%) |
| 18 to 34 Years | 0 (0.0%) | 0 (0.0%) |
| 35 to 64 Years | 0 (0.0%) | 0 (0.0%) |
| 65 to 74 Years | 0 (0.0%) | 0 (0.0%) |
| 75 Years and over | 0 (0.0%) | 0 (0.0%) |
Disability Class: Cognitive Difficulty
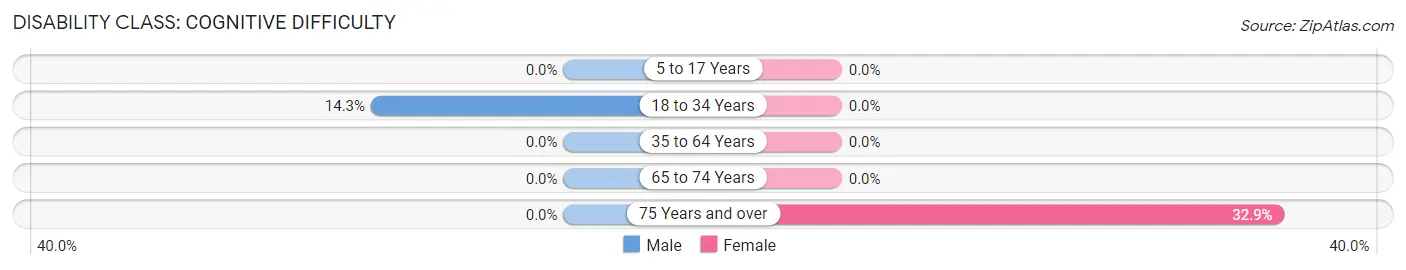
| Age Bracket | Male | Female |
| 5 to 17 Years | 0 (0.0%) | 0 (0.0%) |
| 18 to 34 Years | 4 (14.3%) | 0 (0.0%) |
| 35 to 64 Years | 0 (0.0%) | 0 (0.0%) |
| 65 to 74 Years | 0 (0.0%) | 0 (0.0%) |
| 75 Years and over | 0 (0.0%) | 23 (32.9%) |
Disability Class: Ambulatory Difficulty
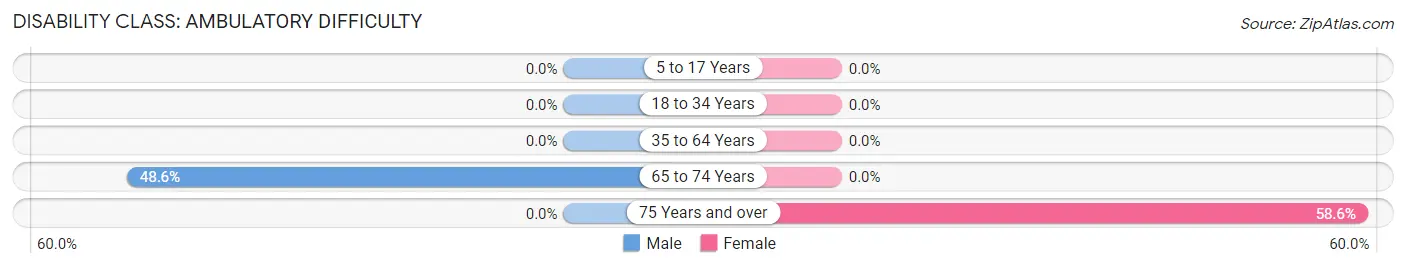
| Age Bracket | Male | Female |
| 5 to 17 Years | 0 (0.0%) | 0 (0.0%) |
| 18 to 34 Years | 0 (0.0%) | 0 (0.0%) |
| 35 to 64 Years | 0 (0.0%) | 0 (0.0%) |
| 65 to 74 Years | 35 (48.6%) | 0 (0.0%) |
| 75 Years and over | 0 (0.0%) | 41 (58.6%) |
Disability Class: Self-Care Difficulty
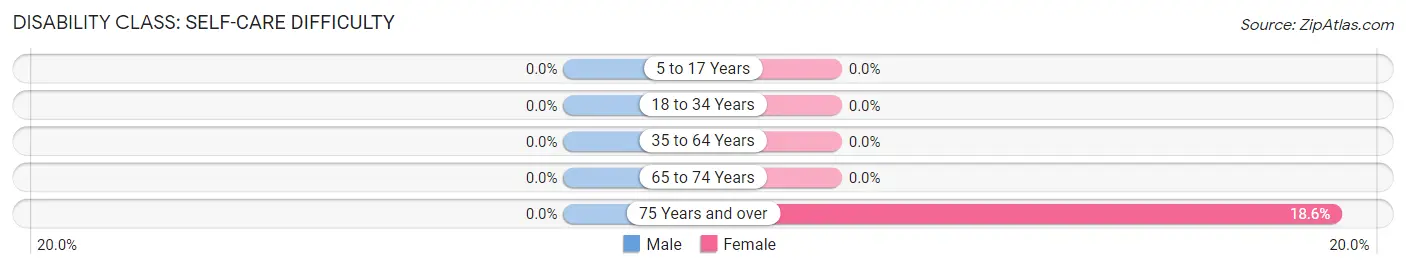
| Age Bracket | Male | Female |
| 5 to 17 Years | 0 (0.0%) | 0 (0.0%) |
| 18 to 34 Years | 0 (0.0%) | 0 (0.0%) |
| 35 to 64 Years | 0 (0.0%) | 0 (0.0%) |
| 65 to 74 Years | 0 (0.0%) | 0 (0.0%) |
| 75 Years and over | 0 (0.0%) | 13 (18.6%) |
Technology Access in Austinburg
Computing Device Access in Austinburg
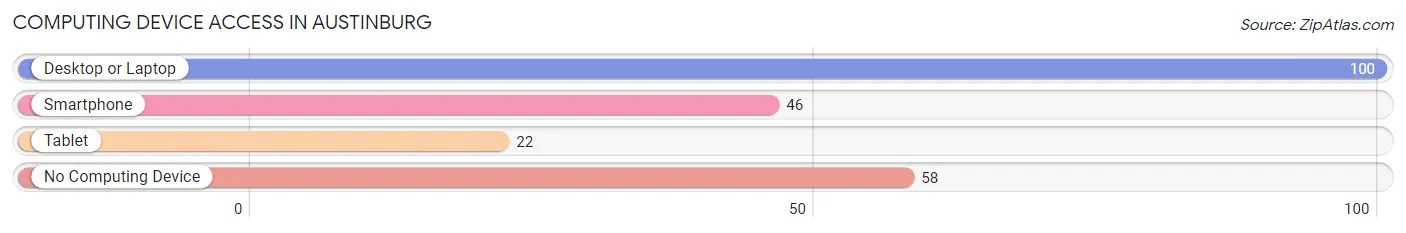
| Device Type | # Households | % Households |
| Desktop or Laptop | 100 | 59.5% |
| Smartphone | 46 | 27.4% |
| Tablet | 22 | 13.1% |
| No Computing Device | 58 | 34.5% |
| Total | 168 | 100.0% |
Internet Access in Austinburg
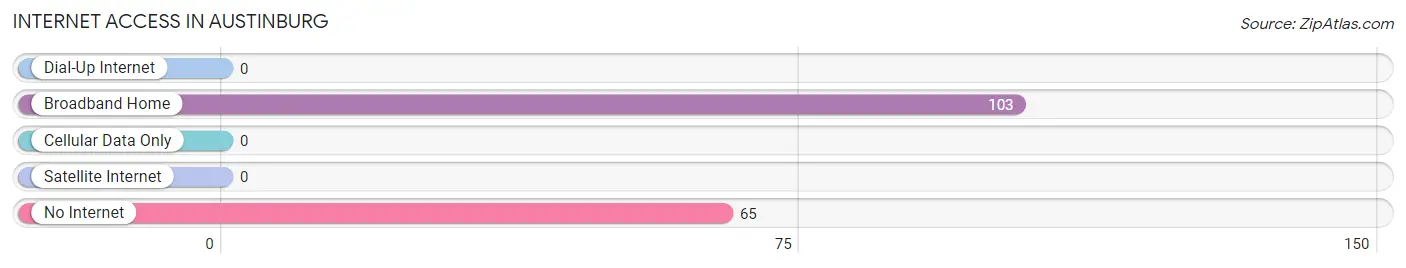
| Internet Type | # Households | % Households |
| Dial-Up Internet | 0 | 0.0% |
| Broadband Home | 103 | 61.3% |
| Cellular Data Only | 0 | 0.0% |
| Satellite Internet | 0 | 0.0% |
| No Internet | 65 | 38.7% |
| Total | 168 | 100.0% |
Austinburg Summary
Introduction
Austinburg is a small village located in Ashtabula County, Ohio. It is situated on the banks of the Grand River and is part of the Ashtabula-Geneva-Austinburg Metropolitan Statistical Area. The village has a population of 1,845 as of the 2010 census. It is a rural community with a strong agricultural base and a growing tourism industry.
History
The area that is now Austinburg was first settled in 1802 by a group of settlers from Connecticut. The village was named after the first settler, Austin Smith. The village was incorporated in 1837 and has remained a small rural community ever since.
The village was an important stop on the Underground Railroad, with many of the local residents helping to hide and transport escaped slaves. The village was also home to a number of prominent abolitionists, including the Reverend John Rankin, who was a leader in the anti-slavery movement.
Geography
Austinburg is located in northeastern Ohio, in Ashtabula County. It is situated on the banks of the Grand River, which flows through the village. The village is located approximately 30 miles east of Cleveland and 40 miles west of Erie, Pennsylvania.
The village is located in a rural area, with the majority of the land being used for agricultural purposes. The village is surrounded by rolling hills and wooded areas, with the Grand River providing a scenic backdrop.
Economy
The economy of Austinburg is largely based on agriculture. The village is home to a number of farms, which produce a variety of crops, including corn, soybeans, wheat, and hay. The village also has a number of small businesses, including restaurants, retail stores, and service providers.
The village is also home to a number of tourist attractions, including the Grand River Valley Railroad, which offers scenic train rides through the countryside. The village also has a number of wineries, which attract visitors from all over the region.
Demographics
As of the 2010 census, the population of Austinburg was 1,845. The population is predominantly white (96.2%), with a small percentage of African Americans (1.2%) and Hispanics (1.3%). The median household income is $41,944, and the median home value is $117,400.
Conclusion
Austinburg is a small village located in Ashtabula County, Ohio. It is a rural community with a strong agricultural base and a growing tourism industry. The village has a population of 1,845 as of the 2010 census, and is predominantly white. The economy of Austinburg is largely based on agriculture, with a number of small businesses and tourist attractions.
Common Questions
What is Per Capita Income in Austinburg?
Per Capita income in Austinburg is $26,146.
What is Inequality or Gini Index in Austinburg?
Inequality or Gini Index in Austinburg is 0.45.
What is the Total Population of Austinburg?
Total Population of Austinburg is 472.
What is the Total Male Population of Austinburg?
Total Male Population of Austinburg is 260.
What is the Total Female Population of Austinburg?
Total Female Population of Austinburg is 212.
What is the Ratio of Males per 100 Females in Austinburg?
There are 122.64 Males per 100 Females in Austinburg.
What is the Ratio of Females per 100 Males in Austinburg?
There are 81.54 Females per 100 Males in Austinburg.
What is the Median Population Age in Austinburg?
Median Population Age in Austinburg is 68.2 Years.
What is the Average Family Size in Austinburg
Average Family Size in Austinburg is 2.4 People.
What is the Average Household Size in Austinburg
Average Household Size in Austinburg is 2.0 People.
How Large is the Labor Force in Austinburg?
There are 111 People in the Labor Forcein in Austinburg.
What is the Percentage of People in the Labor Force in Austinburg?
23.8% of People are in the Labor Force in Austinburg.
What is the Unemployment Rate in Austinburg?
Unemployment Rate in Austinburg is 48.6%.