Northfield, OH Map & Demographics
Northfield Map
Northfield Overview
$31,137
PER CAPITA INCOME
$77,415
AVG FAMILY INCOME
$68,342
AVG HOUSEHOLD INCOME
22.4%
WAGE / INCOME GAP [ % ]
77.6¢/ $1
WAGE / INCOME GAP [ $ ]
0.36
INEQUALITY / GINI INDEX
3,546
TOTAL POPULATION
1,662
MALE POPULATION
1,884
FEMALE POPULATION
88.22
MALES / 100 FEMALES
113.36
FEMALES / 100 MALES
38.9
MEDIAN AGE
3.0
AVG FAMILY SIZE
2.4
AVG HOUSEHOLD SIZE
1,985
LABOR FORCE [ PEOPLE ]
70.3%
PERCENT IN LABOR FORCE
3.4%
UNEMPLOYMENT RATE
Northfield Zip Codes
Income in Northfield
Income Overview in Northfield
Per Capita Income in Northfield is $31,137, while median incomes of families and households are $77,415 and $68,342 respectively.
| Characteristic | Number | Measure |
| Per Capita Income | 3,546 | $31,137 |
| Median Family Income | 973 | $77,415 |
| Mean Family Income | 973 | $90,001 |
| Median Household Income | 1,477 | $68,342 |
| Mean Household Income | 1,477 | $75,754 |
| Income Deficit | 973 | $0 |
| Wage / Income Gap (%) | 3,546 | 22.42% |
| Wage / Income Gap ($) | 3,546 | 77.58¢ per $1 |
| Gini / Inequality Index | 3,546 | 0.36 |
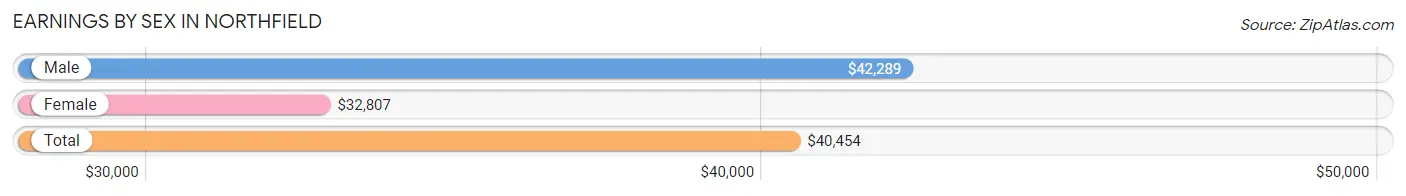
Earnings by Sex in Northfield
Average Earnings in Northfield are $40,454, $42,289 for men and $32,807 for women, a difference of 22.4%.
| Sex | Number | Average Earnings |
| Male | 1,042 (52.5%) | $42,289 |
| Female | 942 (47.5%) | $32,807 |
| Total | 1,984 (100.0%) | $40,454 |
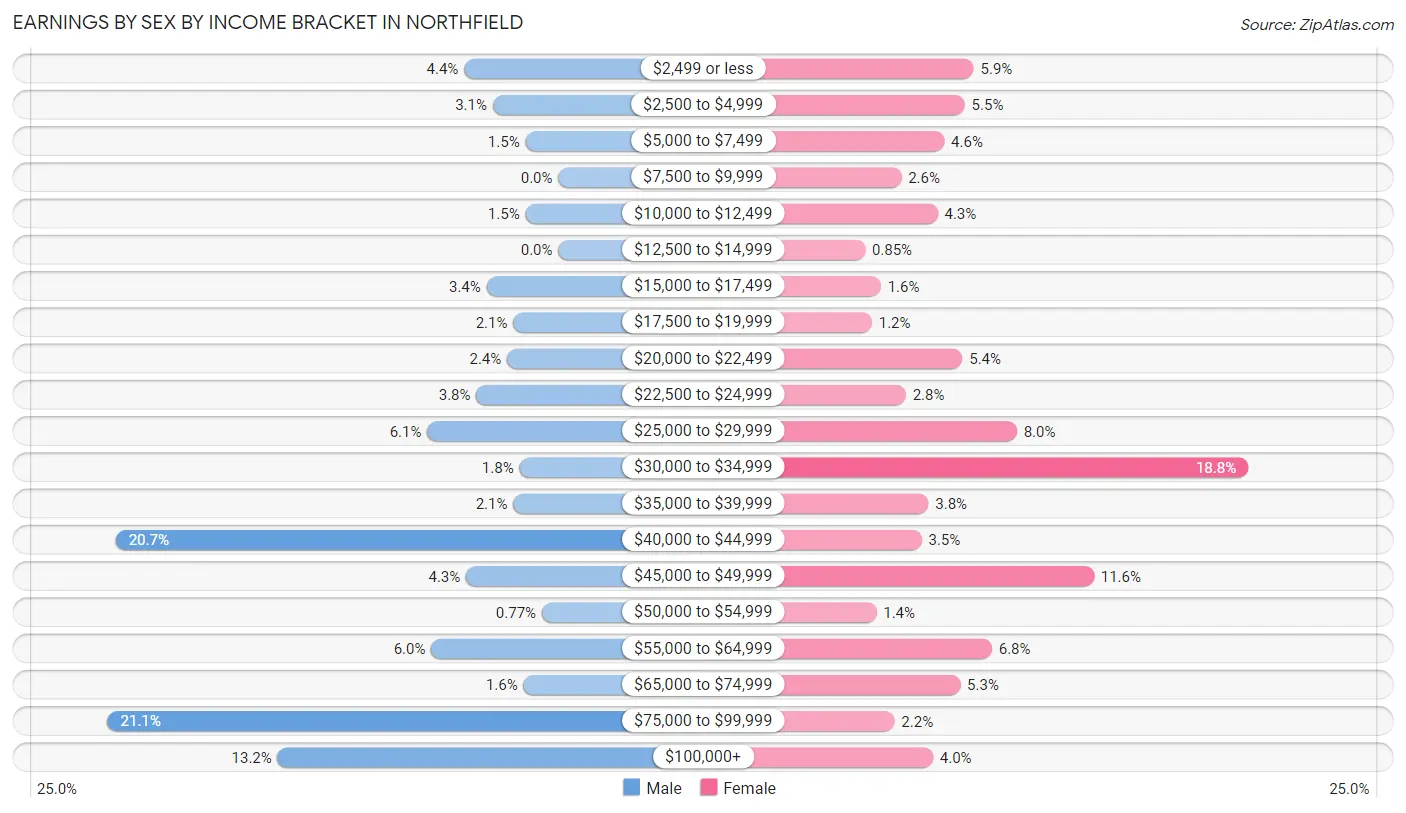
Earnings by Sex by Income Bracket in Northfield
The most common earnings brackets in Northfield are $75,000 to $99,999 for men (220 | 21.1%) and $30,000 to $34,999 for women (177 | 18.8%).
| Income | Male | Female |
| $2,499 or less | 46 (4.4%) | 56 (5.9%) |
| $2,500 to $4,999 | 32 (3.1%) | 52 (5.5%) |
| $5,000 to $7,499 | 16 (1.5%) | 43 (4.6%) |
| $7,500 to $9,999 | 0 (0.0%) | 24 (2.5%) |
| $10,000 to $12,499 | 16 (1.5%) | 40 (4.3%) |
| $12,500 to $14,999 | 0 (0.0%) | 8 (0.9%) |
| $15,000 to $17,499 | 35 (3.4%) | 15 (1.6%) |
| $17,500 to $19,999 | 22 (2.1%) | 11 (1.2%) |
| $20,000 to $22,499 | 25 (2.4%) | 51 (5.4%) |
| $22,500 to $24,999 | 40 (3.8%) | 26 (2.8%) |
| $25,000 to $29,999 | 64 (6.1%) | 75 (8.0%) |
| $30,000 to $34,999 | 19 (1.8%) | 177 (18.8%) |
| $35,000 to $39,999 | 22 (2.1%) | 36 (3.8%) |
| $40,000 to $44,999 | 216 (20.7%) | 33 (3.5%) |
| $45,000 to $49,999 | 45 (4.3%) | 109 (11.6%) |
| $50,000 to $54,999 | 8 (0.8%) | 13 (1.4%) |
| $55,000 to $64,999 | 62 (5.9%) | 64 (6.8%) |
| $65,000 to $74,999 | 17 (1.6%) | 50 (5.3%) |
| $75,000 to $99,999 | 220 (21.1%) | 21 (2.2%) |
| $100,000+ | 137 (13.2%) | 38 (4.0%) |
| Total | 1,042 (100.0%) | 942 (100.0%) |
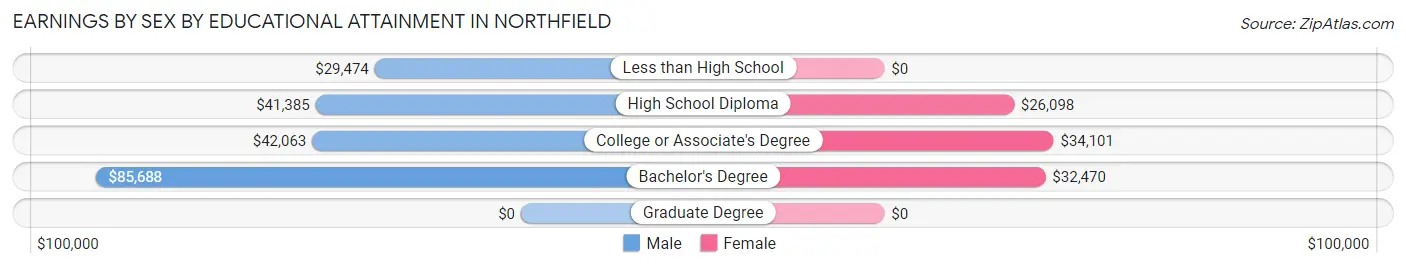
Earnings by Sex by Educational Attainment in Northfield
Average earnings in Northfield are $46,033 for men and $33,596 for women, a difference of 27.0%. Men with an educational attainment of bachelor's degree enjoy the highest average annual earnings of $85,688, while those with less than high school education earn the least with $29,474. Women with an educational attainment of college or associate's degree earn the most with the average annual earnings of $34,101, while those with high school diploma education have the smallest earnings of $26,098.
| Educational Attainment | Male Income | Female Income |
| Less than High School | $29,474 | $0 |
| High School Diploma | $41,385 | $26,098 |
| College or Associate's Degree | $42,063 | $34,101 |
| Bachelor's Degree | $85,688 | $32,470 |
| Graduate Degree | - | - |
| Total | $46,033 | $33,596 |
Family Income in Northfield
Family Income Brackets in Northfield
According to the Northfield family income data, there are 277 families falling into the $100,000 to $149,999 income range, which is the most common income bracket and makes up 28.5% of all families. Conversely, the less than $10,000 income bracket is the least frequent group with only 8 families (0.8%) belonging to this category.
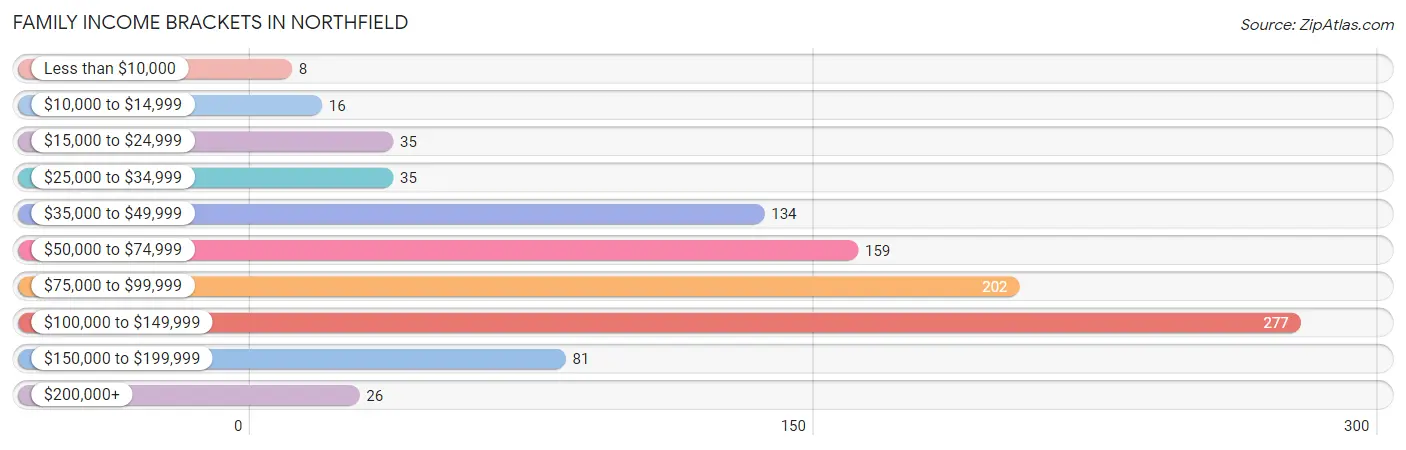
| Income Bracket | # Families | % Families |
| Less than $10,000 | 8 | 0.8% |
| $10,000 to $14,999 | 16 | 1.6% |
| $15,000 to $24,999 | 35 | 3.6% |
| $25,000 to $34,999 | 35 | 3.6% |
| $35,000 to $49,999 | 134 | 13.8% |
| $50,000 to $74,999 | 159 | 16.3% |
| $75,000 to $99,999 | 202 | 20.8% |
| $100,000 to $149,999 | 277 | 28.5% |
| $150,000 to $199,999 | 81 | 8.3% |
| $200,000+ | 26 | 2.7% |
Family Income by Famaliy Size in Northfield
5-person families (101 | 10.4%) account for the highest median family income in Northfield with $132,806 per family, while 3-person families (179 | 18.4%) have the highest median income of $40,940 per family member.
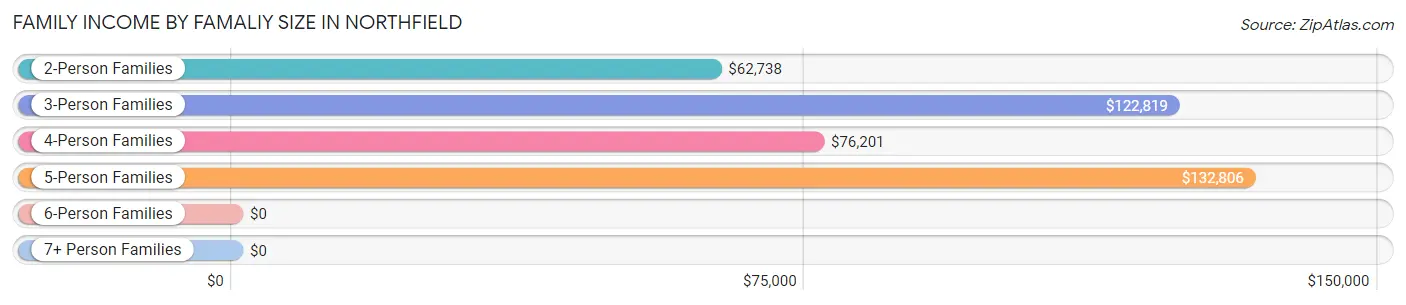
| Income Bracket | # Families | Median Income |
| 2-Person Families | 444 (45.6%) | $62,738 |
| 3-Person Families | 179 (18.4%) | $122,819 |
| 4-Person Families | 187 (19.2%) | $76,201 |
| 5-Person Families | 101 (10.4%) | $132,806 |
| 6-Person Families | 62 (6.4%) | $0 |
| 7+ Person Families | 0 (0.0%) | $0 |
| Total | 973 (100.0%) | $77,415 |
Family Income by Number of Earners in Northfield
The median family income in Northfield is $77,415, with families comprising 3+ earners (87) having the highest median family income of $134,712, while families with 1 earner (288) have the lowest median family income of $41,628, accounting for 8.9% and 29.6% of families, respectively.
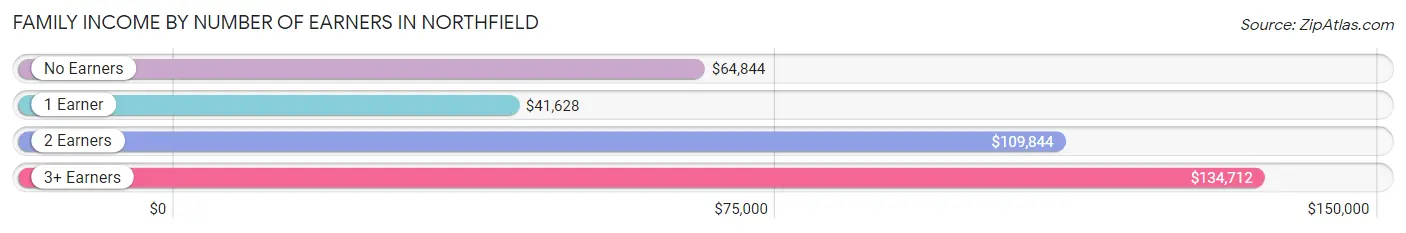
| Number of Earners | # Families | Median Income |
| No Earners | 83 (8.5%) | $64,844 |
| 1 Earner | 288 (29.6%) | $41,628 |
| 2 Earners | 515 (52.9%) | $109,844 |
| 3+ Earners | 87 (8.9%) | $134,712 |
| Total | 973 (100.0%) | $77,415 |
Household Income in Northfield
Household Income Brackets in Northfield
With 340 households falling in the category, the $100,000 to $149,999 income range is the most frequent in Northfield, accounting for 23.0% of all households. In contrast, only 35 households (2.4%) fall into the less than $10,000 income bracket, making it the least populous group.
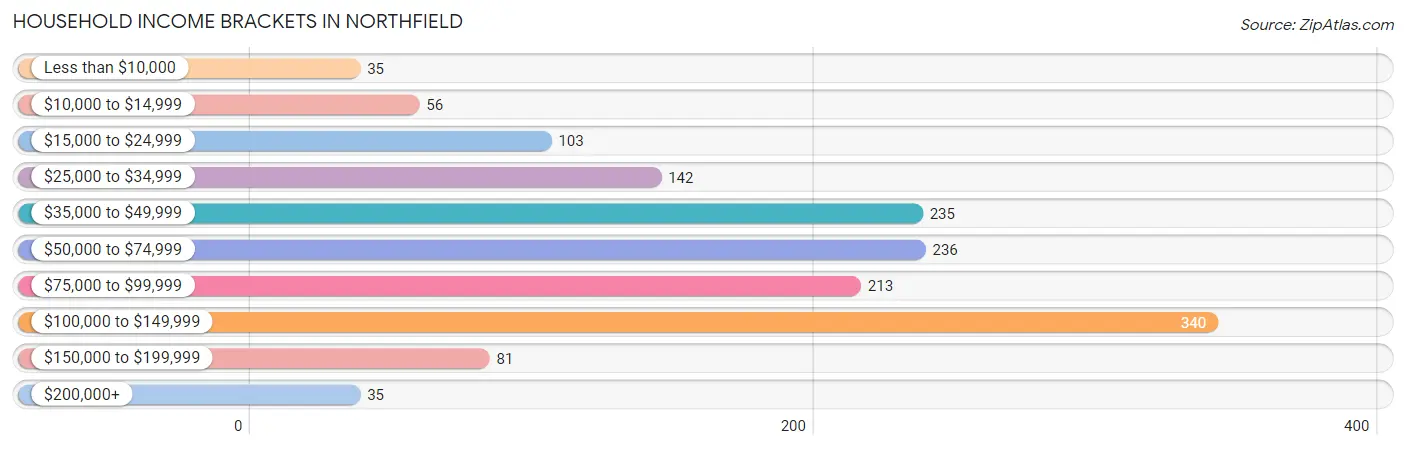
| Income Bracket | # Households | % Households |
| Less than $10,000 | 35 | 2.4% |
| $10,000 to $14,999 | 56 | 3.8% |
| $15,000 to $24,999 | 103 | 7.0% |
| $25,000 to $34,999 | 142 | 9.6% |
| $35,000 to $49,999 | 235 | 15.9% |
| $50,000 to $74,999 | 236 | 16.0% |
| $75,000 to $99,999 | 213 | 14.4% |
| $100,000 to $149,999 | 340 | 23.0% |
| $150,000 to $199,999 | 81 | 5.5% |
| $200,000+ | 35 | 2.4% |
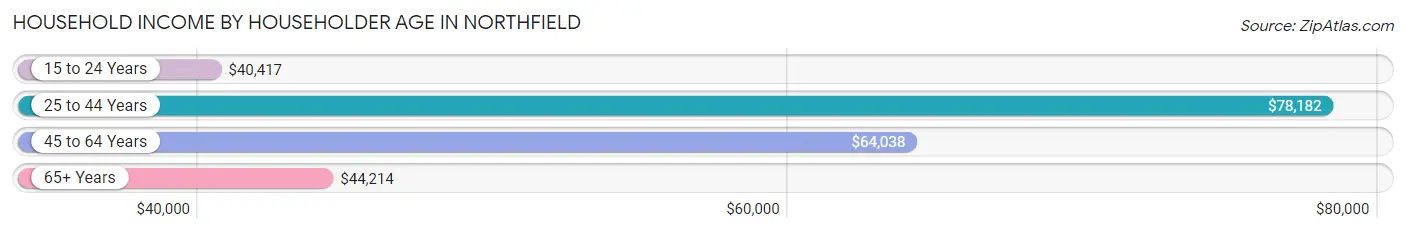
Household Income by Householder Age in Northfield
The median household income in Northfield is $68,342, with the highest median household income of $78,182 found in the 25 to 44 years age bracket for the primary householder. A total of 476 households (32.2%) fall into this category. Meanwhile, the 15 to 24 years age bracket for the primary householder has the lowest median household income of $40,417, with 25 households (1.7%) in this group.
| Income Bracket | # Households | Median Income |
| 15 to 24 Years | 25 (1.7%) | $40,417 |
| 25 to 44 Years | 476 (32.2%) | $78,182 |
| 45 to 64 Years | 608 (41.2%) | $64,038 |
| 65+ Years | 368 (24.9%) | $44,214 |
| Total | 1,477 (100.0%) | $68,342 |
Poverty in Northfield
Income Below Poverty by Sex and Age in Northfield
With 8.1% poverty level for males and 10.8% for females among the residents of Northfield, 16 and 17 year old males and 75 year old and over females are the most vulnerable to poverty, with 24 males (60.0%) and 39 females (23.4%) in their respective age groups living below the poverty level.
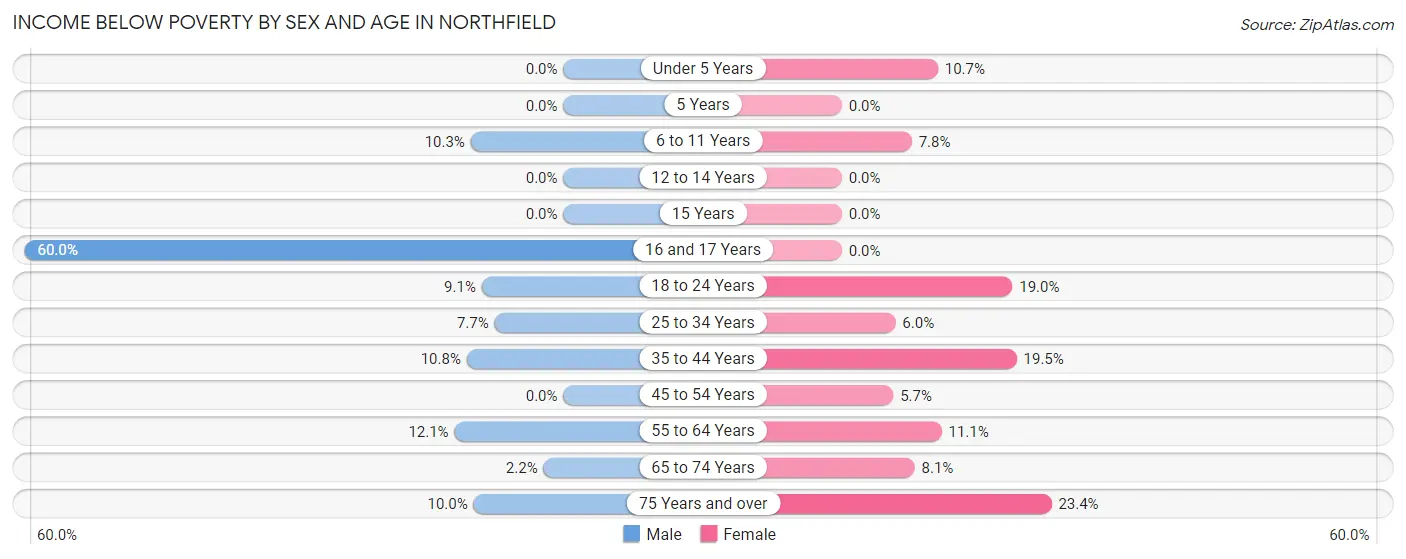
| Age Bracket | Male | Female |
| Under 5 Years | 0 (0.0%) | 17 (10.7%) |
| 5 Years | 0 (0.0%) | 0 (0.0%) |
| 6 to 11 Years | 16 (10.3%) | 12 (7.8%) |
| 12 to 14 Years | 0 (0.0%) | 0 (0.0%) |
| 15 Years | 0 (0.0%) | 0 (0.0%) |
| 16 and 17 Years | 24 (60.0%) | 0 (0.0%) |
| 18 to 24 Years | 5 (9.1%) | 15 (19.0%) |
| 25 to 34 Years | 18 (7.7%) | 16 (6.0%) |
| 35 to 44 Years | 27 (10.8%) | 51 (19.5%) |
| 45 to 54 Years | 0 (0.0%) | 16 (5.7%) |
| 55 to 64 Years | 33 (12.1%) | 22 (11.1%) |
| 65 to 74 Years | 3 (2.2%) | 15 (8.1%) |
| 75 Years and over | 8 (10.0%) | 39 (23.4%) |
| Total | 134 (8.1%) | 203 (10.8%) |
Income Above Poverty by Sex and Age in Northfield
According to the poverty statistics in Northfield, males aged under 5 years and females aged 5 years are the age groups that are most secure financially, with 100.0% of males and 100.0% of females in these age groups living above the poverty line.
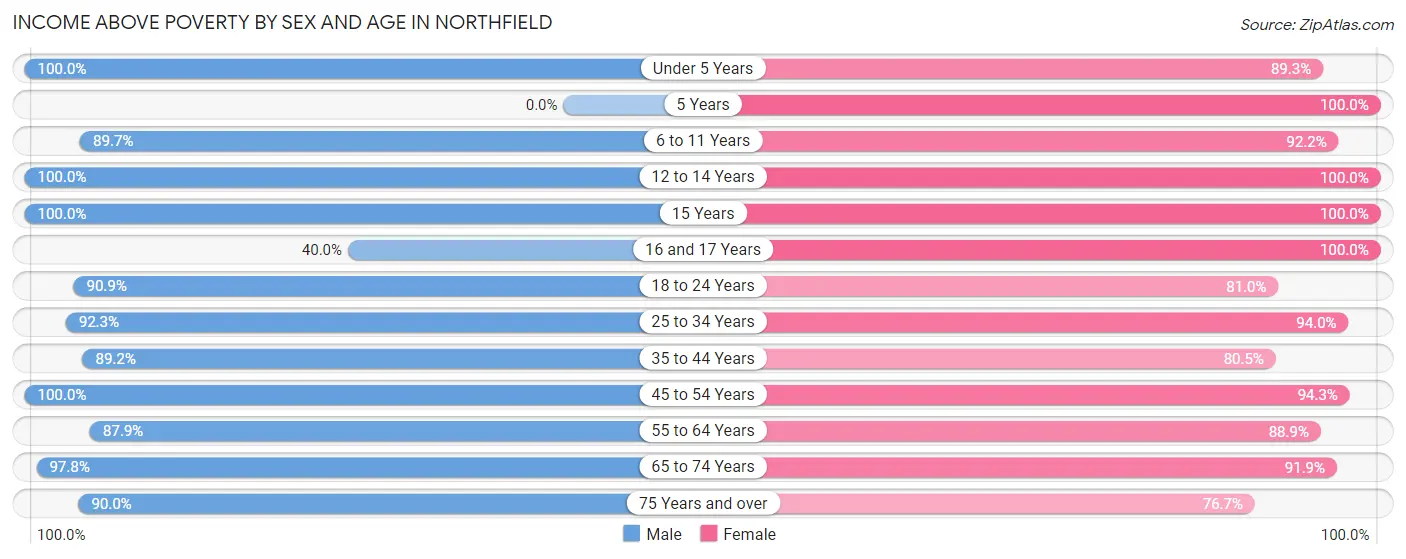
| Age Bracket | Male | Female |
| Under 5 Years | 84 (100.0%) | 142 (89.3%) |
| 5 Years | 0 (0.0%) | 97 (100.0%) |
| 6 to 11 Years | 139 (89.7%) | 142 (92.2%) |
| 12 to 14 Years | 45 (100.0%) | 8 (100.0%) |
| 15 Years | 13 (100.0%) | 7 (100.0%) |
| 16 and 17 Years | 16 (40.0%) | 21 (100.0%) |
| 18 to 24 Years | 50 (90.9%) | 64 (81.0%) |
| 25 to 34 Years | 217 (92.3%) | 252 (94.0%) |
| 35 to 44 Years | 224 (89.2%) | 211 (80.5%) |
| 45 to 54 Years | 287 (100.0%) | 263 (94.3%) |
| 55 to 64 Years | 239 (87.9%) | 176 (88.9%) |
| 65 to 74 Years | 133 (97.8%) | 170 (91.9%) |
| 75 Years and over | 72 (90.0%) | 128 (76.6%) |
| Total | 1,519 (91.9%) | 1,681 (89.2%) |
Income Below Poverty Among Married-Couple Families in Northfield
The poverty statistics for married-couple families in Northfield show that 4.3% or 32 of the total 752 families live below the poverty line. Families with 1 or 2 children have the highest poverty rate of 5.2%, comprising of 16 families. On the other hand, families with 3 or 4 children have the lowest poverty rate of 0.0%, which includes 0 families.
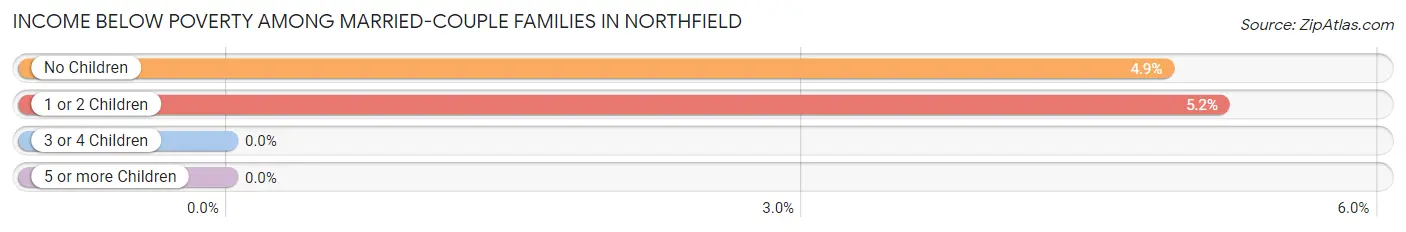
| Children | Above Poverty | Below Poverty |
| No Children | 311 (95.1%) | 16 (4.9%) |
| 1 or 2 Children | 293 (94.8%) | 16 (5.2%) |
| 3 or 4 Children | 116 (100.0%) | 0 (0.0%) |
| 5 or more Children | 0 (0.0%) | 0 (0.0%) |
| Total | 720 (95.7%) | 32 (4.3%) |
Income Below Poverty Among Single-Parent Households in Northfield
According to the poverty data in Northfield, 9.5% or 8 single-father households and 25.6% or 35 single-mother households are living below the poverty line. Among single-father households, those with no children have the highest poverty rate, with 8 households (11.3%) experiencing poverty. Likewise, among single-mother households, those with 1 or 2 children have the highest poverty rate, with 35 households (47.3%) falling below the poverty line.
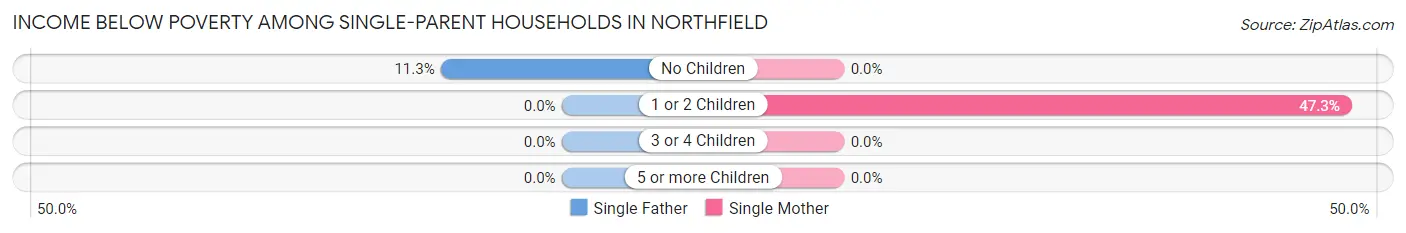
| Children | Single Father | Single Mother |
| No Children | 8 (11.3%) | 0 (0.0%) |
| 1 or 2 Children | 0 (0.0%) | 35 (47.3%) |
| 3 or 4 Children | 0 (0.0%) | 0 (0.0%) |
| 5 or more Children | 0 (0.0%) | 0 (0.0%) |
| Total | 8 (9.5%) | 35 (25.6%) |
Income Below Poverty Among Married-Couple vs Single-Parent Households in Northfield
The poverty data for Northfield shows that 32 of the married-couple family households (4.3%) and 43 of the single-parent households (19.5%) are living below the poverty level. Within the married-couple family households, those with 1 or 2 children have the highest poverty rate, with 16 households (5.2%) falling below the poverty line. Among the single-parent households, those with 1 or 2 children have the highest poverty rate, with 35 household (40.2%) living below poverty.
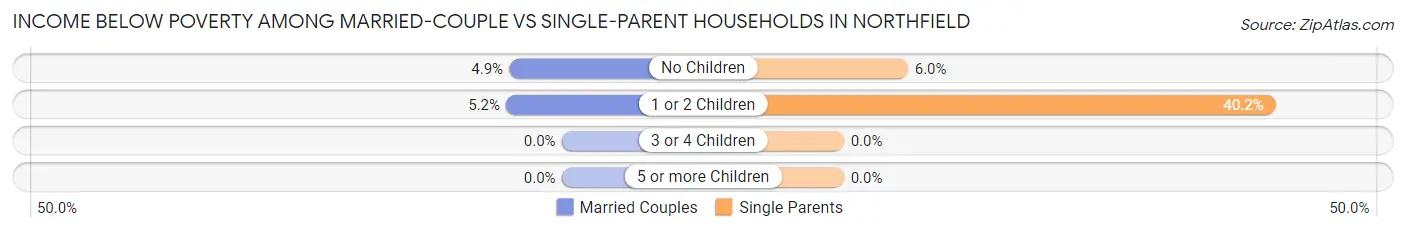
| Children | Married-Couple Families | Single-Parent Households |
| No Children | 16 (4.9%) | 8 (6.0%) |
| 1 or 2 Children | 16 (5.2%) | 35 (40.2%) |
| 3 or 4 Children | 0 (0.0%) | 0 (0.0%) |
| 5 or more Children | 0 (0.0%) | 0 (0.0%) |
| Total | 32 (4.3%) | 43 (19.5%) |
Race in Northfield
The most populous races in Northfield are White / Caucasian (2,766 | 78.0%), Black / African American (429 | 12.1%), and Asian (160 | 4.5%).
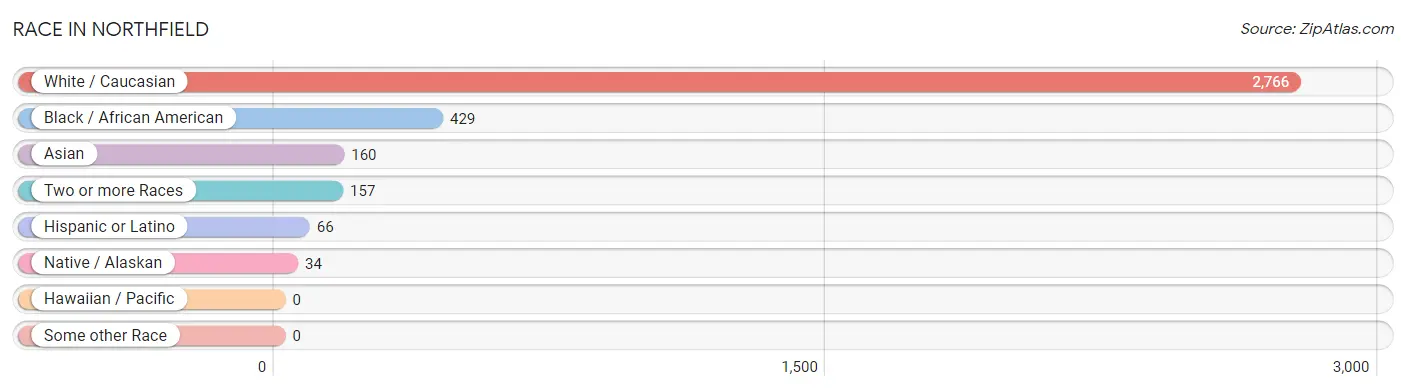
| Race | # Population | % Population |
| Asian | 160 | 4.5% |
| Black / African American | 429 | 12.1% |
| Hawaiian / Pacific | 0 | 0.0% |
| Hispanic or Latino | 66 | 1.9% |
| Native / Alaskan | 34 | 1.0% |
| White / Caucasian | 2,766 | 78.0% |
| Two or more Races | 157 | 4.4% |
| Some other Race | 0 | 0.0% |
| Total | 3,546 | 100.0% |
Ancestry in Northfield
The most populous ancestries reported in Northfield are German (674 | 19.0%), Italian (539 | 15.2%), Irish (459 | 12.9%), English (359 | 10.1%), and Polish (260 | 7.3%), together accounting for 64.6% of all Northfield residents.
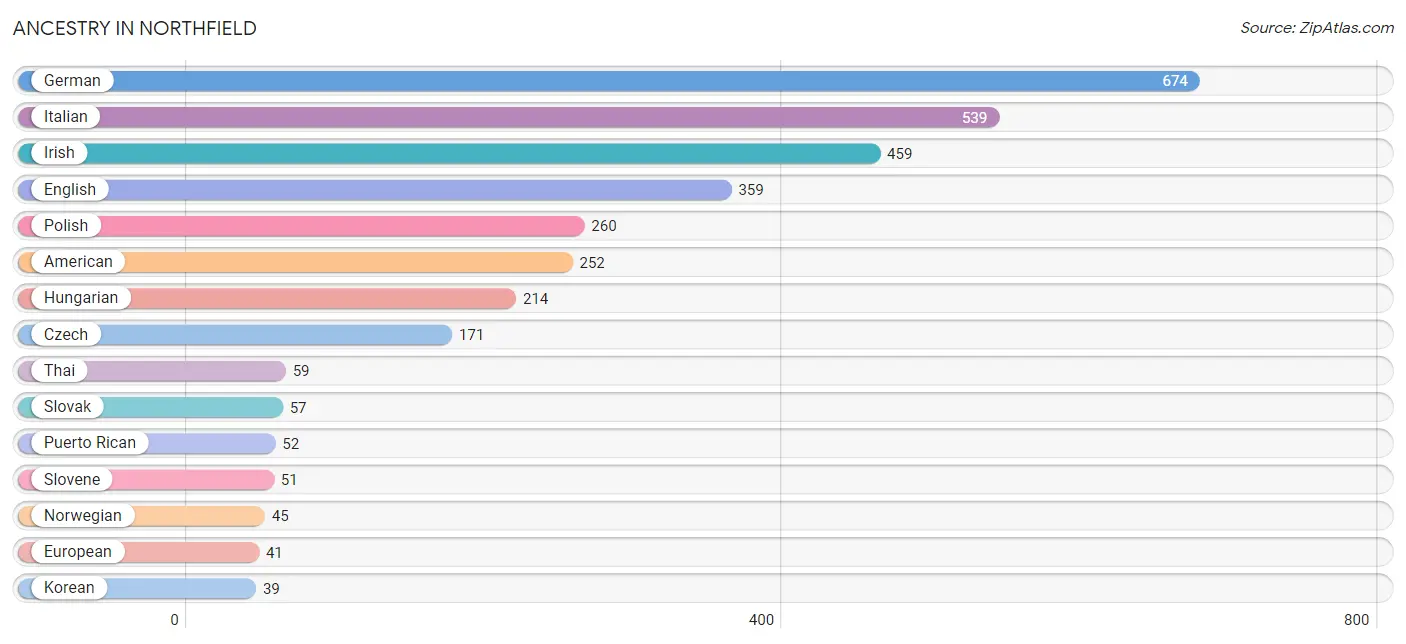
| Ancestry | # Population | % Population |
| African | 11 | 0.3% |
| American | 252 | 7.1% |
| Czech | 171 | 4.8% |
| Czechoslovakian | 13 | 0.4% |
| Danish | 16 | 0.4% |
| Dutch | 4 | 0.1% |
| Eastern European | 3 | 0.1% |
| English | 359 | 10.1% |
| European | 41 | 1.2% |
| French | 35 | 1.0% |
| French Canadian | 10 | 0.3% |
| German | 674 | 19.0% |
| Greek | 18 | 0.5% |
| Hungarian | 214 | 6.0% |
| Indian (Asian) | 14 | 0.4% |
| Irish | 459 | 12.9% |
| Italian | 539 | 15.2% |
| Korean | 39 | 1.1% |
| Norwegian | 45 | 1.3% |
| Polish | 260 | 7.3% |
| Puerto Rican | 52 | 1.5% |
| Romanian | 4 | 0.1% |
| Scotch-Irish | 9 | 0.3% |
| Scottish | 39 | 1.1% |
| Slovak | 57 | 1.6% |
| Slovene | 51 | 1.4% |
| South American | 14 | 0.4% |
| Subsaharan African | 11 | 0.3% |
| Swedish | 5 | 0.1% |
| Swiss | 4 | 0.1% |
| Thai | 59 | 1.7% |
| Venezuelan | 14 | 0.4% |
| Welsh | 9 | 0.3% | View All 33 Rows |
Immigrants in Northfield
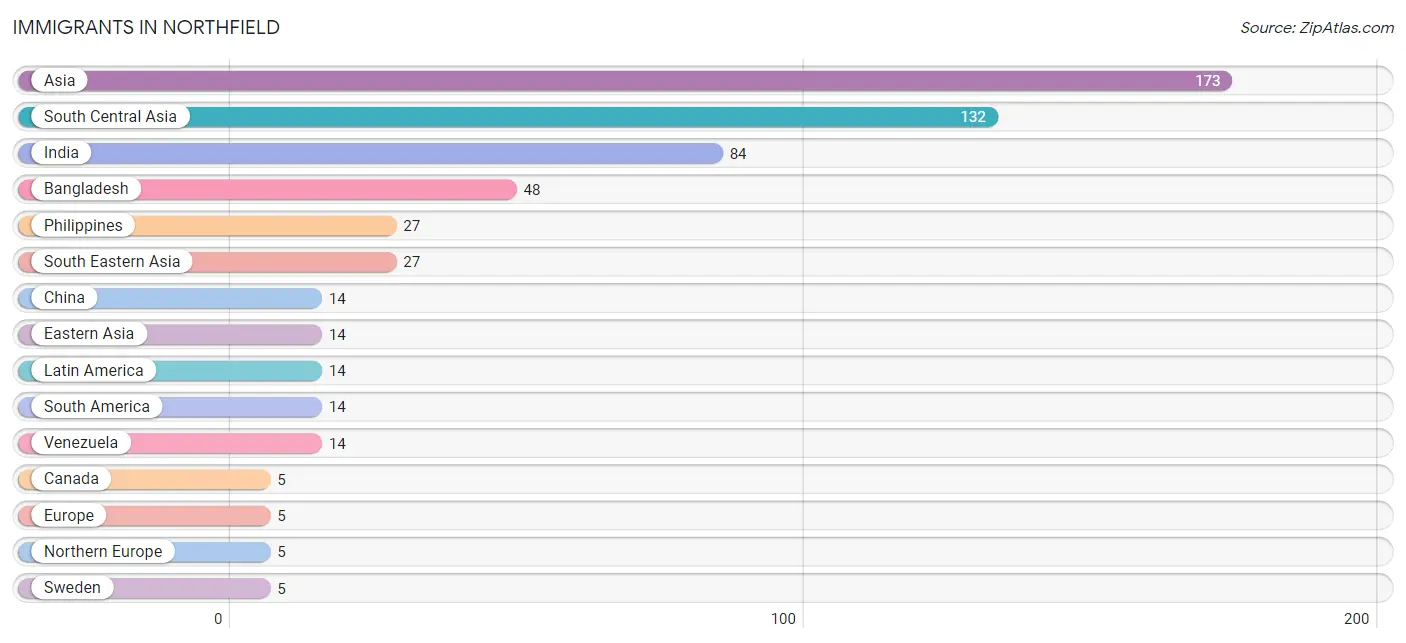
The most numerous immigrant groups reported in Northfield came from Asia (173 | 4.9%), South Central Asia (132 | 3.7%), India (84 | 2.4%), Bangladesh (48 | 1.3%), and Philippines (27 | 0.8%), together accounting for 13.1% of all Northfield residents.
| Immigration Origin | # Population | % Population |
| Asia | 173 | 4.9% |
| Bangladesh | 48 | 1.3% |
| Canada | 5 | 0.1% |
| China | 14 | 0.4% |
| Eastern Asia | 14 | 0.4% |
| Europe | 5 | 0.1% |
| India | 84 | 2.4% |
| Latin America | 14 | 0.4% |
| Northern Europe | 5 | 0.1% |
| Philippines | 27 | 0.8% |
| South America | 14 | 0.4% |
| South Central Asia | 132 | 3.7% |
| South Eastern Asia | 27 | 0.8% |
| Sweden | 5 | 0.1% |
| Venezuela | 14 | 0.4% | View All 15 Rows |
Sex and Age in Northfield
Sex and Age in Northfield
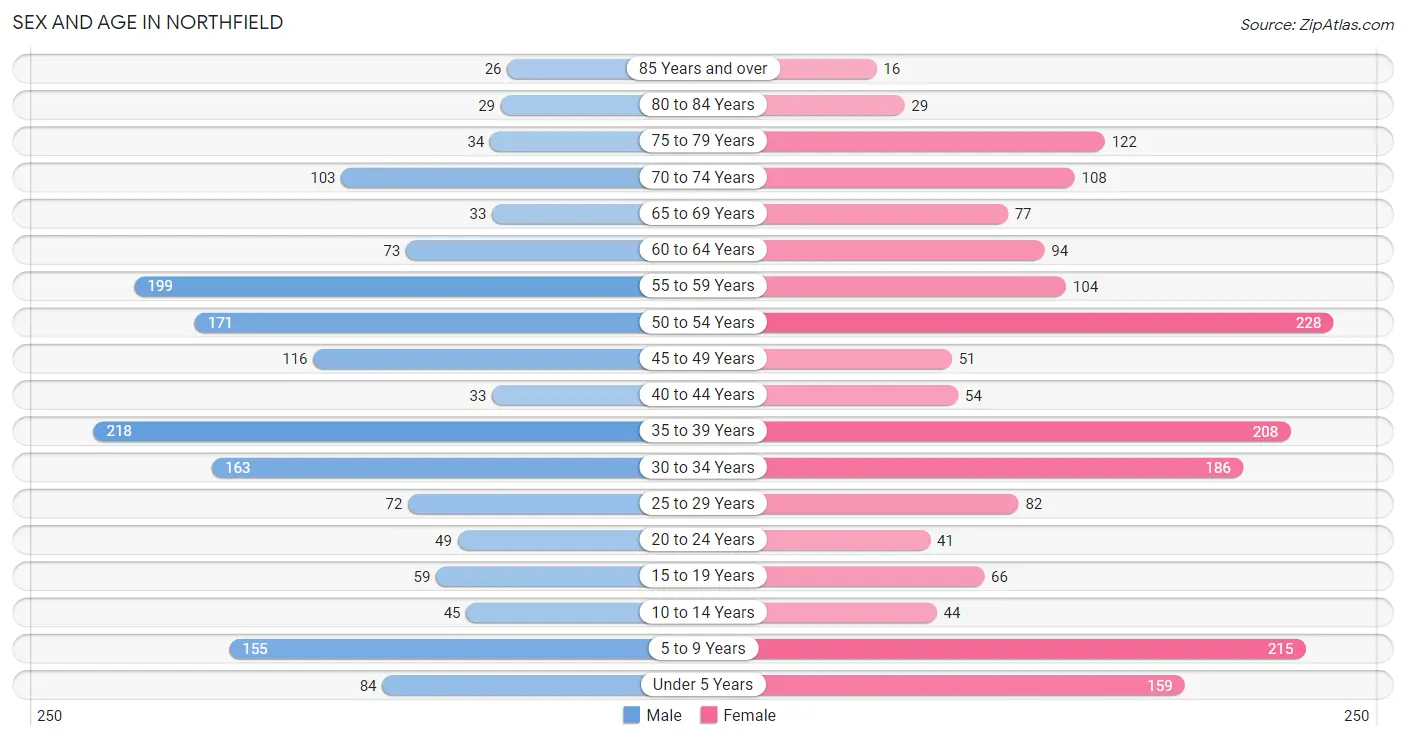
The most populous age groups in Northfield are 35 to 39 Years (218 | 13.1%) for men and 50 to 54 Years (228 | 12.1%) for women.
| Age Bracket | Male | Female |
| Under 5 Years | 84 (5.1%) | 159 (8.4%) |
| 5 to 9 Years | 155 (9.3%) | 215 (11.4%) |
| 10 to 14 Years | 45 (2.7%) | 44 (2.3%) |
| 15 to 19 Years | 59 (3.5%) | 66 (3.5%) |
| 20 to 24 Years | 49 (2.9%) | 41 (2.2%) |
| 25 to 29 Years | 72 (4.3%) | 82 (4.3%) |
| 30 to 34 Years | 163 (9.8%) | 186 (9.9%) |
| 35 to 39 Years | 218 (13.1%) | 208 (11.0%) |
| 40 to 44 Years | 33 (2.0%) | 54 (2.9%) |
| 45 to 49 Years | 116 (7.0%) | 51 (2.7%) |
| 50 to 54 Years | 171 (10.3%) | 228 (12.1%) |
| 55 to 59 Years | 199 (12.0%) | 104 (5.5%) |
| 60 to 64 Years | 73 (4.4%) | 94 (5.0%) |
| 65 to 69 Years | 33 (2.0%) | 77 (4.1%) |
| 70 to 74 Years | 103 (6.2%) | 108 (5.7%) |
| 75 to 79 Years | 34 (2.1%) | 122 (6.5%) |
| 80 to 84 Years | 29 (1.7%) | 29 (1.5%) |
| 85 Years and over | 26 (1.6%) | 16 (0.9%) |
| Total | 1,662 (100.0%) | 1,884 (100.0%) |
Families and Households in Northfield
Median Family Size in Northfield
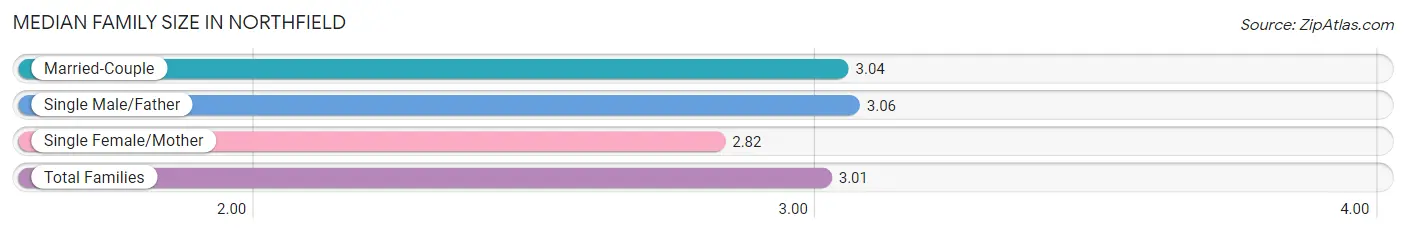
The median family size in Northfield is 3.01 persons per family, with single male/father families (84 | 8.6%) accounting for the largest median family size of 3.06 persons per family. On the other hand, single female/mother families (137 | 14.1%) represent the smallest median family size with 2.82 persons per family.
| Family Type | # Families | Family Size |
| Married-Couple | 752 (77.3%) | 3.04 |
| Single Male/Father | 84 (8.6%) | 3.06 |
| Single Female/Mother | 137 (14.1%) | 2.82 |
| Total Families | 973 (100.0%) | 3.01 |
Median Household Size in Northfield
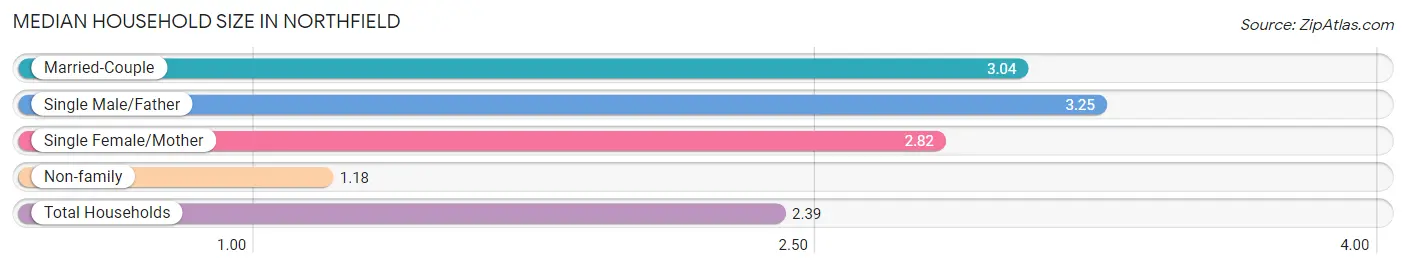
The median household size in Northfield is 2.39 persons per household, with single male/father households (84 | 5.7%) accounting for the largest median household size of 3.25 persons per household. non-family households (504 | 34.1%) represent the smallest median household size with 1.18 persons per household.
| Household Type | # Households | Household Size |
| Married-Couple | 752 (50.9%) | 3.04 |
| Single Male/Father | 84 (5.7%) | 3.25 |
| Single Female/Mother | 137 (9.3%) | 2.82 |
| Non-family | 504 (34.1%) | 1.18 |
| Total Households | 1,477 (100.0%) | 2.39 |
Household Size by Marriage Status in Northfield
Out of a total of 1,477 households in Northfield, 973 (65.9%) are family households, while 504 (34.1%) are nonfamily households. The most numerous type of family households are 2-person households, comprising 422, and the most common type of nonfamily households are 1-person households, comprising 428.
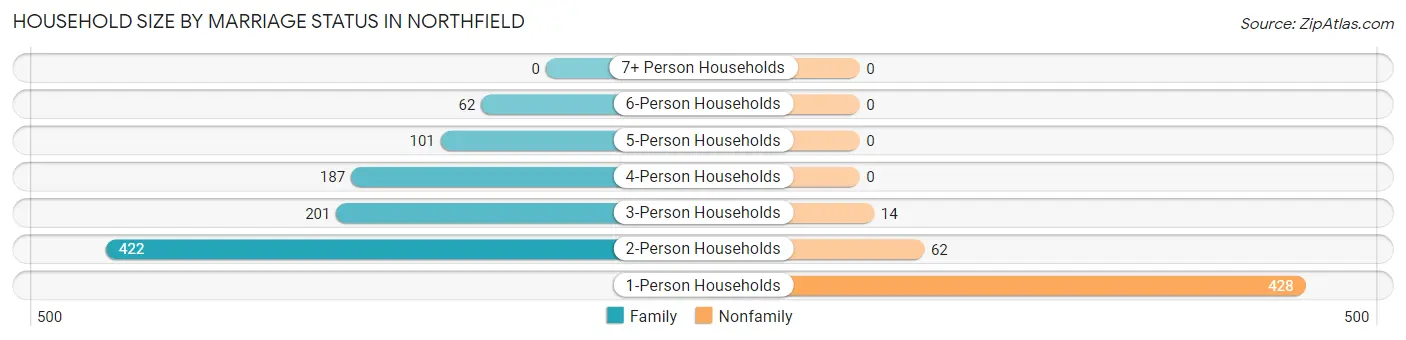
| Household Size | Family Households | Nonfamily Households |
| 1-Person Households | - | 428 (29.0%) |
| 2-Person Households | 422 (28.6%) | 62 (4.2%) |
| 3-Person Households | 201 (13.6%) | 14 (0.9%) |
| 4-Person Households | 187 (12.7%) | 0 (0.0%) |
| 5-Person Households | 101 (6.8%) | 0 (0.0%) |
| 6-Person Households | 62 (4.2%) | 0 (0.0%) |
| 7+ Person Households | 0 (0.0%) | 0 (0.0%) |
| Total | 973 (65.9%) | 504 (34.1%) |
Female Fertility in Northfield
Fertility by Age in Northfield
Average fertility rate in Northfield is 97.0 births per 1,000 women. Women in the age bracket of 20 to 34 years have the highest fertility rate with 230.0 births per 1,000 women. Women in the age bracket of 20 to 34 years acount for 100.0% of all women with births.
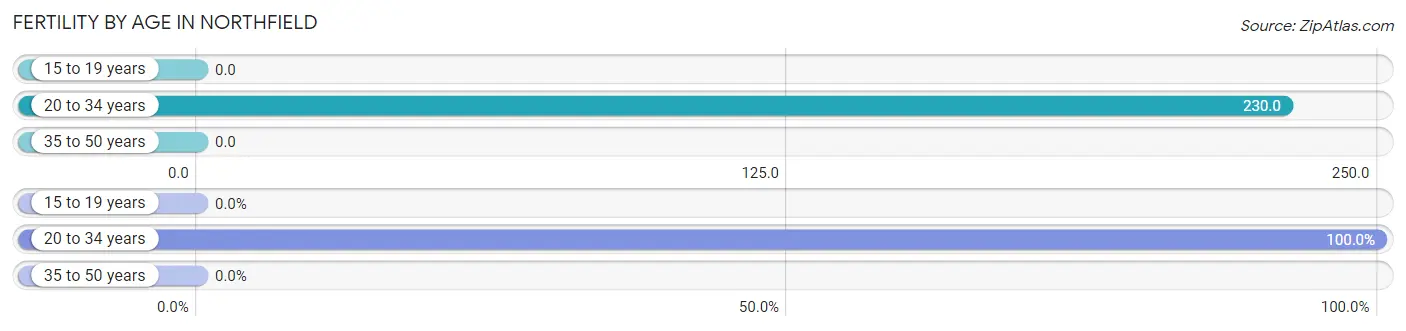
| Age Bracket | Women with Births | Births / 1,000 Women |
| 15 to 19 years | 0 (0.0%) | 0.0 |
| 20 to 34 years | 71 (100.0%) | 230.0 |
| 35 to 50 years | 0 (0.0%) | 0.0 |
| Total | 71 (100.0%) | 97.0 |
Fertility by Age by Marriage Status in Northfield
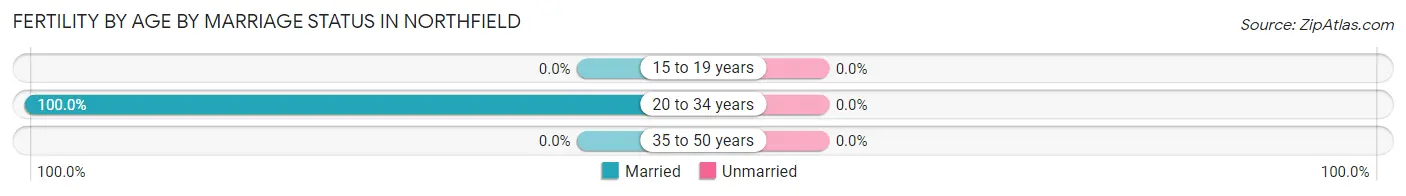
| Age Bracket | Married | Unmarried |
| 15 to 19 years | 0 (0.0%) | 0 (0.0%) |
| 20 to 34 years | 71 (100.0%) | 0 (0.0%) |
| 35 to 50 years | 0 (0.0%) | 0 (0.0%) |
| Total | 71 (100.0%) | 0 (0.0%) |
Fertility by Education in Northfield
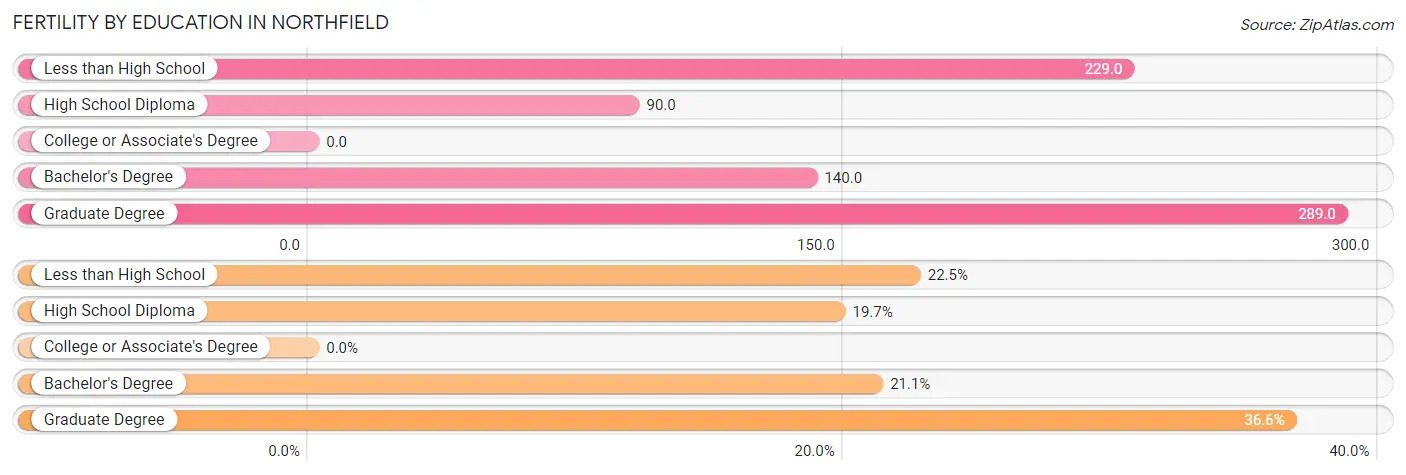
| Educational Attainment | Women with Births | Births / 1,000 Women |
| Less than High School | 16 (22.5%) | 229.0 |
| High School Diploma | 14 (19.7%) | 90.0 |
| College or Associate's Degree | 0 (0.0%) | 0.0 |
| Bachelor's Degree | 15 (21.1%) | 140.0 |
| Graduate Degree | 26 (36.6%) | 289.0 |
| Total | 71 (100.0%) | 97.0 |
Fertility by Education by Marriage Status in Northfield
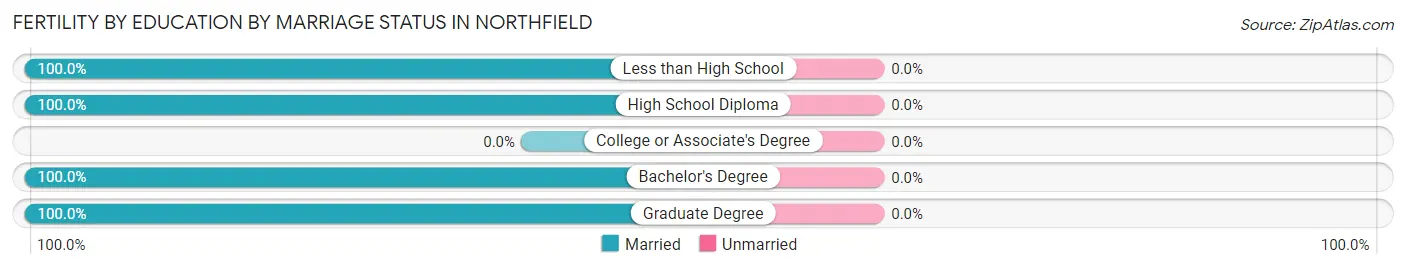
| Educational Attainment | Married | Unmarried |
| Less than High School | 16 (100.0%) | 0 (0.0%) |
| High School Diploma | 14 (100.0%) | 0 (0.0%) |
| College or Associate's Degree | 0 (0.0%) | 0 (0.0%) |
| Bachelor's Degree | 15 (100.0%) | 0 (0.0%) |
| Graduate Degree | 26 (100.0%) | 0 (0.0%) |
| Total | 71 (100.0%) | 0 (0.0%) |
Employment Characteristics in Northfield
Employment by Class of Employer in Northfield
Among the 1,883 employed individuals in Northfield, private company employees (1,386 | 73.6%), not-for-profit organizations (265 | 14.1%), and local government employees (117 | 6.2%) make up the most common classes of employment.
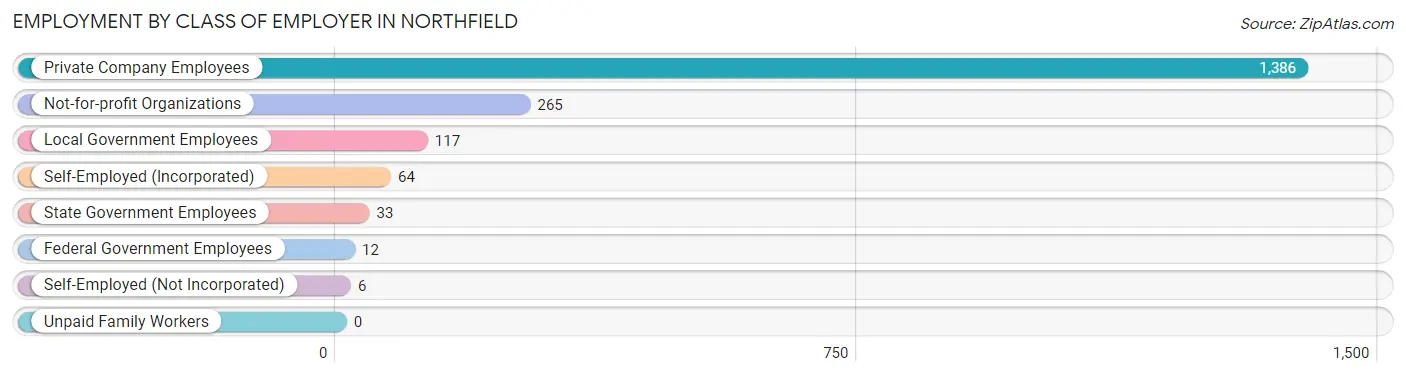
| Employer Class | # Employees | % Employees |
| Private Company Employees | 1,386 | 73.6% |
| Self-Employed (Incorporated) | 64 | 3.4% |
| Self-Employed (Not Incorporated) | 6 | 0.3% |
| Not-for-profit Organizations | 265 | 14.1% |
| Local Government Employees | 117 | 6.2% |
| State Government Employees | 33 | 1.8% |
| Federal Government Employees | 12 | 0.6% |
| Unpaid Family Workers | 0 | 0.0% |
| Total | 1,883 | 100.0% |
Employment Status by Age in Northfield
According to the labor force statistics for Northfield, out of the total population over 16 years of age (2,824), 70.3% or 1,985 individuals are in the labor force, with 3.4% or 67 of them unemployed. The age group with the highest labor force participation rate is 30 to 34 years, with 93.4% or 326 individuals in the labor force. Within the labor force, the 25 to 29 years age range has the highest percentage of unemployed individuals, with 12.6% or 18 of them being unemployed.
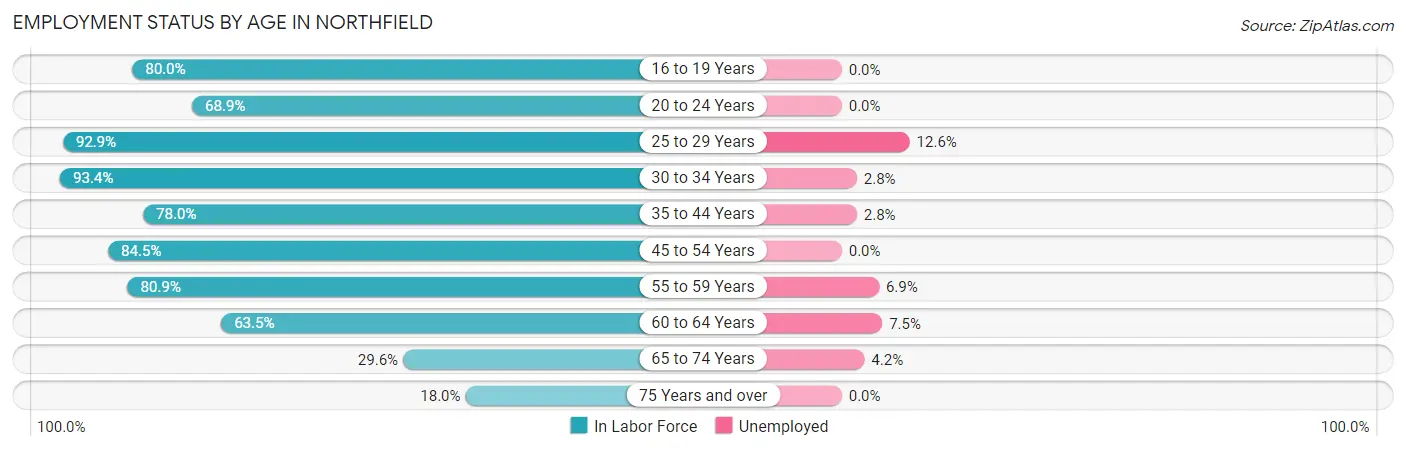
| Age Bracket | In Labor Force | Unemployed |
| 16 to 19 Years | 84 (80.0%) | 0 (0.0%) |
| 20 to 24 Years | 62 (68.9%) | 0 (0.0%) |
| 25 to 29 Years | 143 (92.9%) | 18 (12.6%) |
| 30 to 34 Years | 326 (93.4%) | 9 (2.8%) |
| 35 to 44 Years | 400 (78.0%) | 11 (2.8%) |
| 45 to 54 Years | 478 (84.5%) | 0 (0.0%) |
| 55 to 59 Years | 245 (80.9%) | 17 (6.9%) |
| 60 to 64 Years | 106 (63.5%) | 8 (7.5%) |
| 65 to 74 Years | 95 (29.6%) | 4 (4.2%) |
| 75 Years and over | 46 (18.0%) | 0 (0.0%) |
| Total | 1,985 (70.3%) | 67 (3.4%) |
Employment Status by Educational Attainment in Northfield
According to labor force statistics for Northfield, 82.7% of individuals (1,697) out of the total population between 25 and 64 years of age (2,052) are in the labor force, with 3.7% or 63 of them being unemployed. The group with the highest labor force participation rate are those with the educational attainment of bachelor's degree or higher, with 91.3% or 462 individuals in the labor force. Within the labor force, individuals with college / associate degree education have the highest percentage of unemployment, with 9.4% or 52 of them being unemployed.
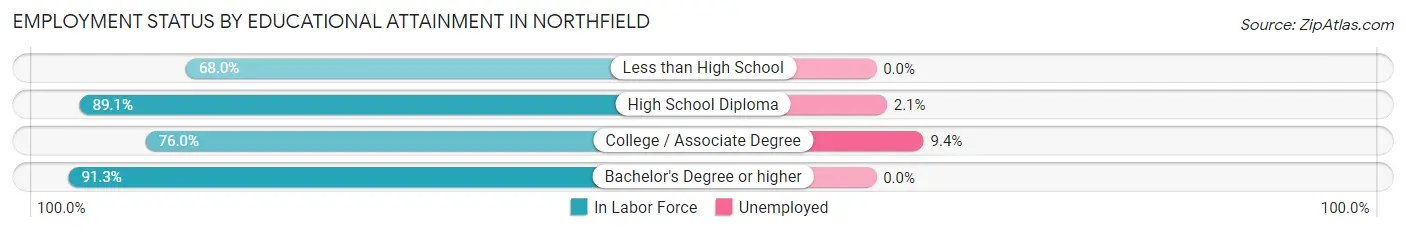
| Educational Attainment | In Labor Force | Unemployed |
| Less than High School | 149 (68.0%) | 0 (0.0%) |
| High School Diploma | 532 (89.1%) | 13 (2.1%) |
| College / Associate Degree | 555 (76.0%) | 69 (9.4%) |
| Bachelor's Degree or higher | 462 (91.3%) | 0 (0.0%) |
| Total | 1,697 (82.7%) | 76 (3.7%) |
Employment Occupations by Sex in Northfield
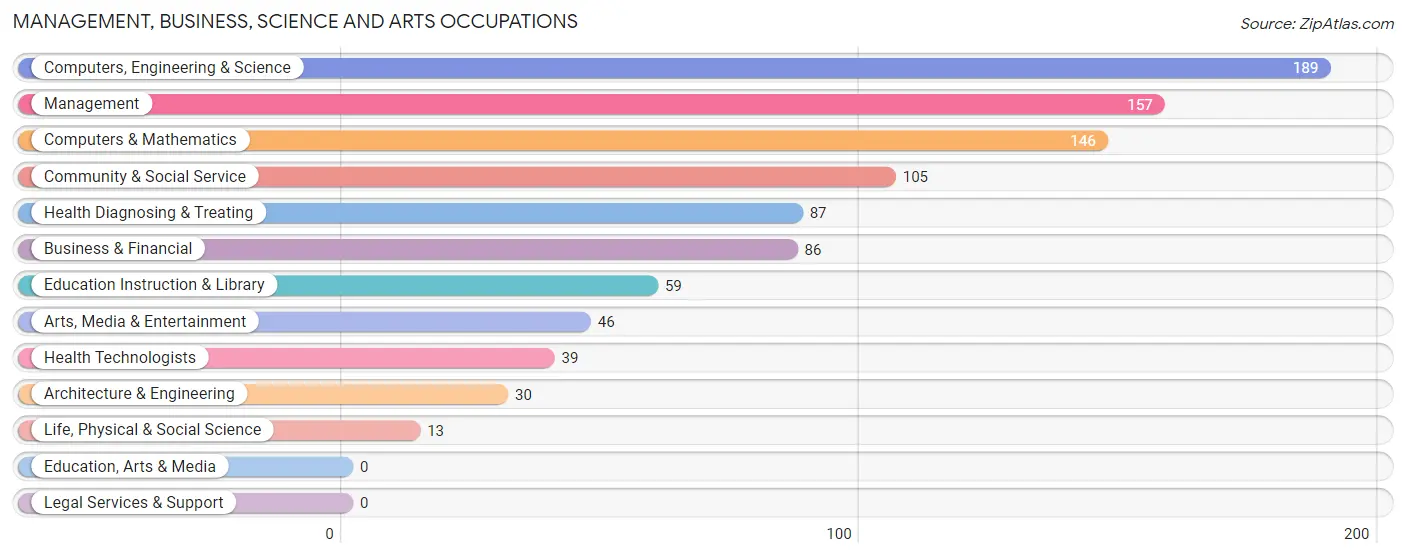
Management, Business, Science and Arts Occupations
The most common Management, Business, Science and Arts occupations in Northfield are Computers, Engineering & Science (189 | 9.9%), Management (157 | 8.2%), Computers & Mathematics (146 | 7.6%), Community & Social Service (105 | 5.5%), and Health Diagnosing & Treating (87 | 4.5%).
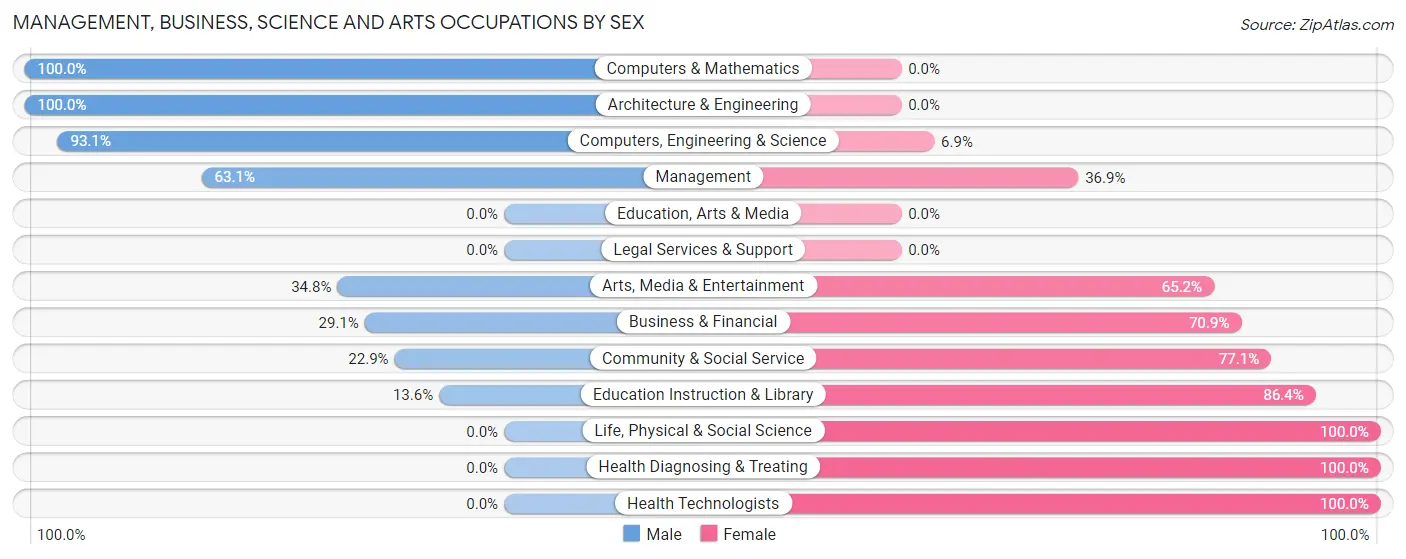
Management, Business, Science and Arts Occupations by Sex
Within the Management, Business, Science and Arts occupations in Northfield, the most male-oriented occupations are Computers & Mathematics (100.0%), Architecture & Engineering (100.0%), and Computers, Engineering & Science (93.1%), while the most female-oriented occupations are Life, Physical & Social Science (100.0%), Health Diagnosing & Treating (100.0%), and Health Technologists (100.0%).
| Occupation | Male | Female |
| Management | 99 (63.1%) | 58 (36.9%) |
| Business & Financial | 25 (29.1%) | 61 (70.9%) |
| Computers, Engineering & Science | 176 (93.1%) | 13 (6.9%) |
| Computers & Mathematics | 146 (100.0%) | 0 (0.0%) |
| Architecture & Engineering | 30 (100.0%) | 0 (0.0%) |
| Life, Physical & Social Science | 0 (0.0%) | 13 (100.0%) |
| Community & Social Service | 24 (22.9%) | 81 (77.1%) |
| Education, Arts & Media | 0 (0.0%) | 0 (0.0%) |
| Legal Services & Support | 0 (0.0%) | 0 (0.0%) |
| Education Instruction & Library | 8 (13.6%) | 51 (86.4%) |
| Arts, Media & Entertainment | 16 (34.8%) | 30 (65.2%) |
| Health Diagnosing & Treating | 0 (0.0%) | 87 (100.0%) |
| Health Technologists | 0 (0.0%) | 39 (100.0%) |
| Total (Category) | 324 (51.9%) | 300 (48.1%) |
| Total (Overall) | 1,010 (52.7%) | 908 (47.3%) |
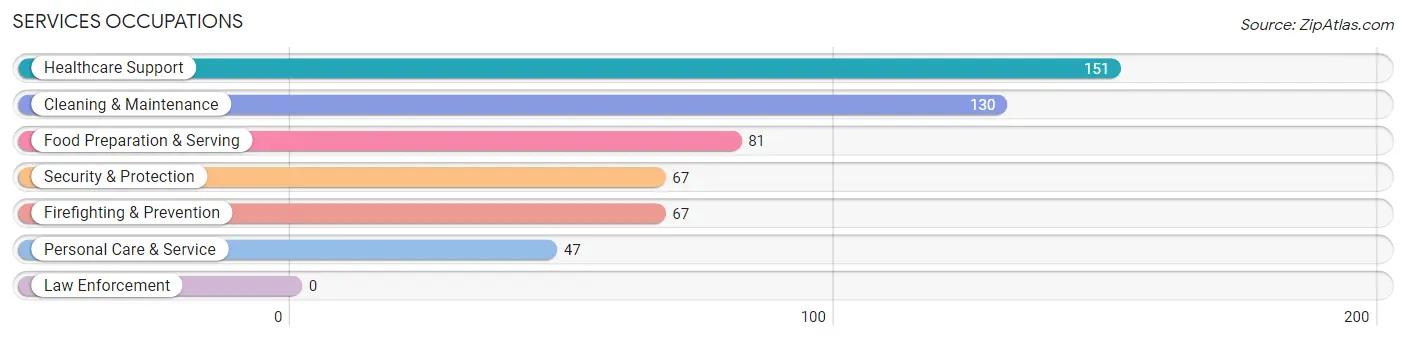
Services Occupations
The most common Services occupations in Northfield are Healthcare Support (151 | 7.9%), Cleaning & Maintenance (130 | 6.8%), Food Preparation & Serving (81 | 4.2%), Security & Protection (67 | 3.5%), and Firefighting & Prevention (67 | 3.5%).
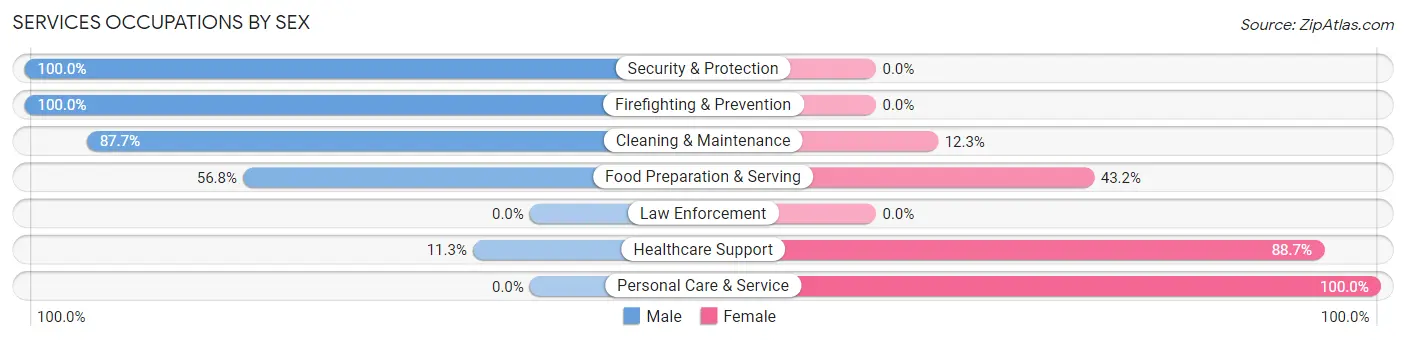
Services Occupations by Sex
Within the Services occupations in Northfield, the most male-oriented occupations are Security & Protection (100.0%), Firefighting & Prevention (100.0%), and Cleaning & Maintenance (87.7%), while the most female-oriented occupations are Personal Care & Service (100.0%), Healthcare Support (88.7%), and Food Preparation & Serving (43.2%).
| Occupation | Male | Female |
| Healthcare Support | 17 (11.3%) | 134 (88.7%) |
| Security & Protection | 67 (100.0%) | 0 (0.0%) |
| Firefighting & Prevention | 67 (100.0%) | 0 (0.0%) |
| Law Enforcement | 0 (0.0%) | 0 (0.0%) |
| Food Preparation & Serving | 46 (56.8%) | 35 (43.2%) |
| Cleaning & Maintenance | 114 (87.7%) | 16 (12.3%) |
| Personal Care & Service | 0 (0.0%) | 47 (100.0%) |
| Total (Category) | 244 (51.3%) | 232 (48.7%) |
| Total (Overall) | 1,010 (52.7%) | 908 (47.3%) |
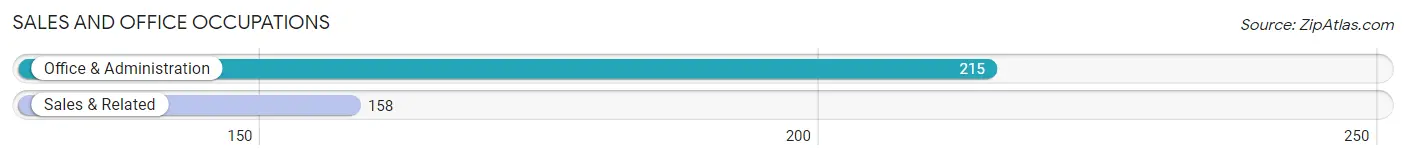
Sales and Office Occupations
The most common Sales and Office occupations in Northfield are Office & Administration (215 | 11.2%), and Sales & Related (158 | 8.2%).
Sales and Office Occupations by Sex
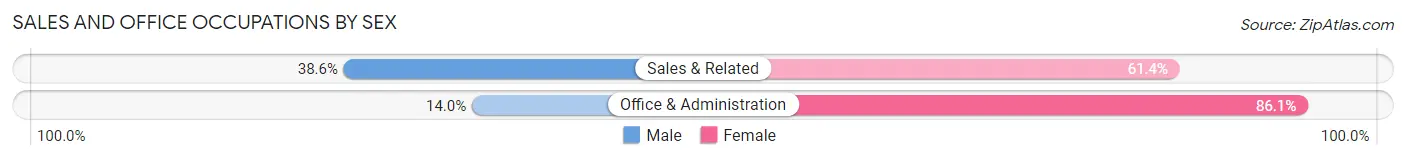
| Occupation | Male | Female |
| Sales & Related | 61 (38.6%) | 97 (61.4%) |
| Office & Administration | 30 (14.0%) | 185 (86.1%) |
| Total (Category) | 91 (24.4%) | 282 (75.6%) |
| Total (Overall) | 1,010 (52.7%) | 908 (47.3%) |
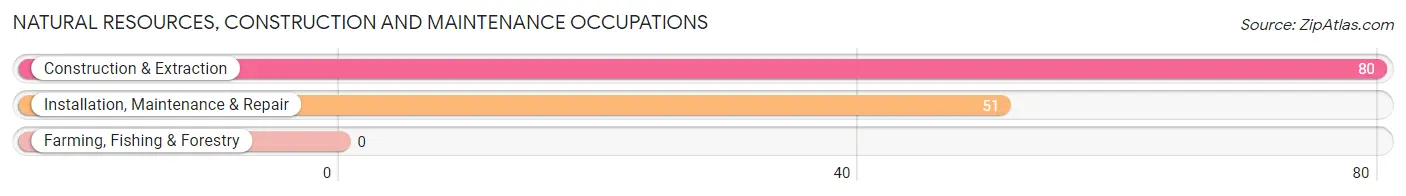
Natural Resources, Construction and Maintenance Occupations
The most common Natural Resources, Construction and Maintenance occupations in Northfield are Construction & Extraction (80 | 4.2%), and Installation, Maintenance & Repair (51 | 2.7%).
Natural Resources, Construction and Maintenance Occupations by Sex
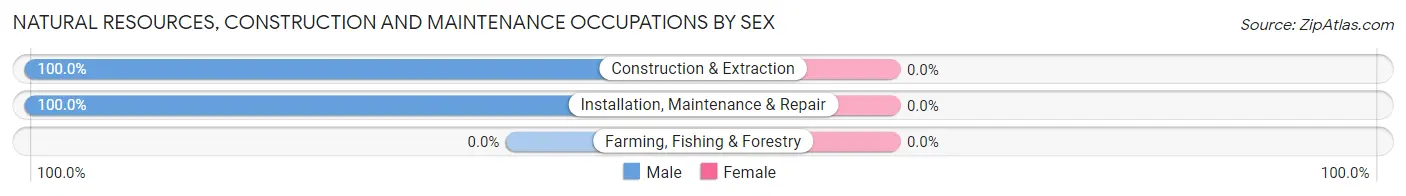
| Occupation | Male | Female |
| Farming, Fishing & Forestry | 0 (0.0%) | 0 (0.0%) |
| Construction & Extraction | 80 (100.0%) | 0 (0.0%) |
| Installation, Maintenance & Repair | 51 (100.0%) | 0 (0.0%) |
| Total (Category) | 131 (100.0%) | 0 (0.0%) |
| Total (Overall) | 1,010 (52.7%) | 908 (47.3%) |
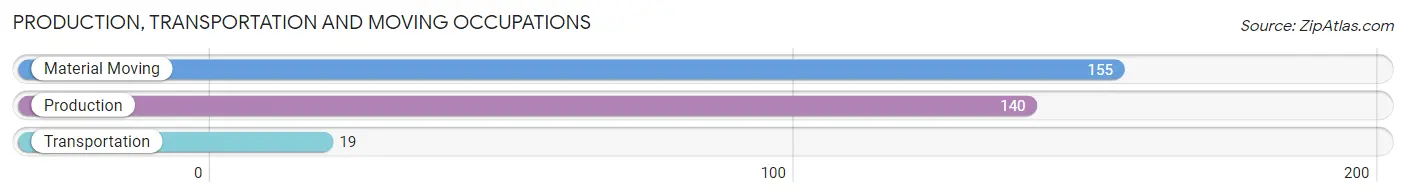
Production, Transportation and Moving Occupations
The most common Production, Transportation and Moving occupations in Northfield are Material Moving (155 | 8.1%), Production (140 | 7.3%), and Transportation (19 | 1.0%).
Production, Transportation and Moving Occupations by Sex
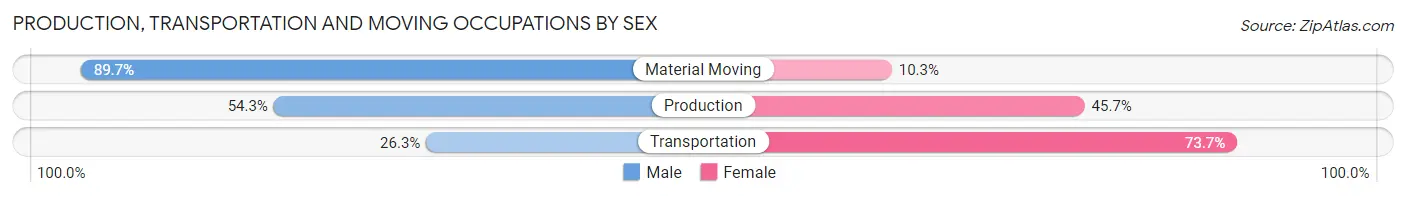
| Occupation | Male | Female |
| Production | 76 (54.3%) | 64 (45.7%) |
| Transportation | 5 (26.3%) | 14 (73.7%) |
| Material Moving | 139 (89.7%) | 16 (10.3%) |
| Total (Category) | 220 (70.1%) | 94 (29.9%) |
| Total (Overall) | 1,010 (52.7%) | 908 (47.3%) |
Employment Industries by Sex in Northfield
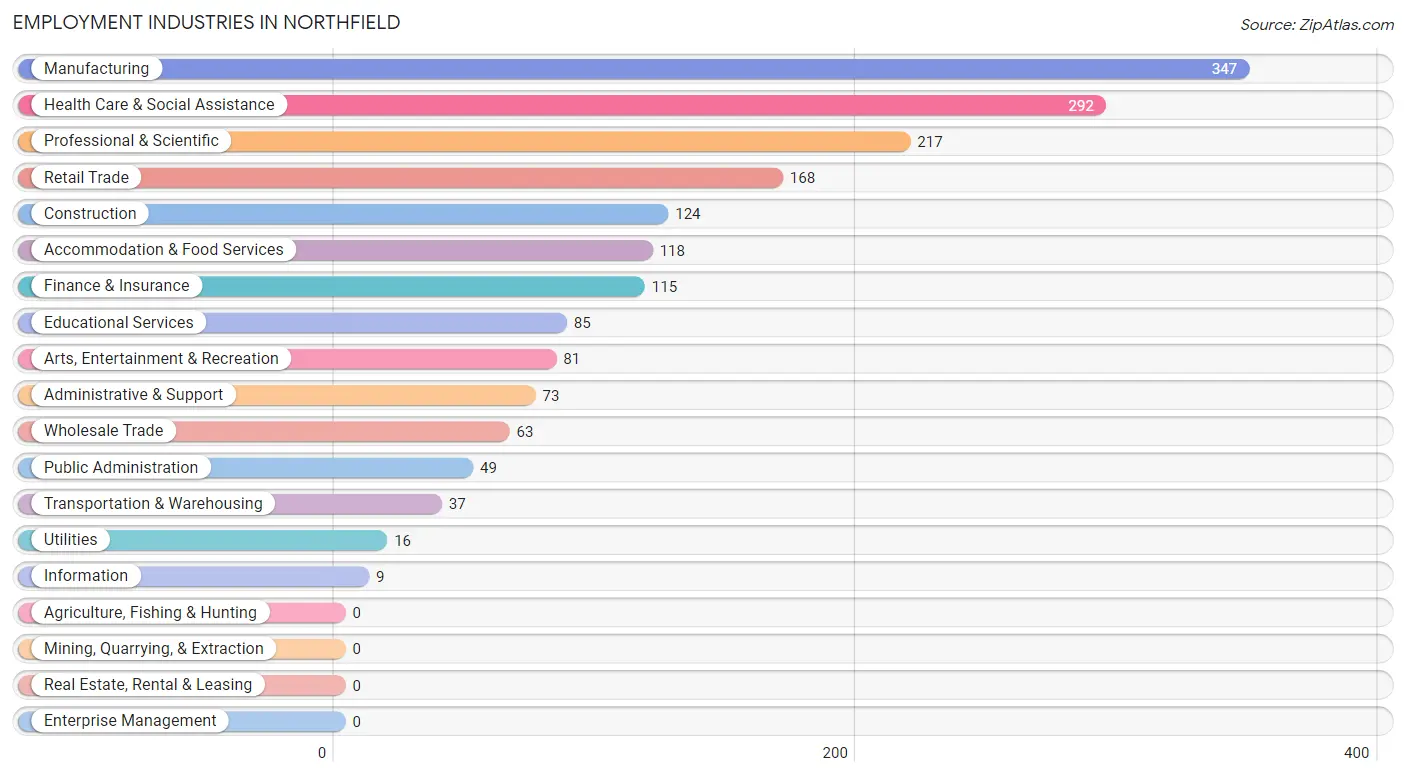
Employment Industries in Northfield
The major employment industries in Northfield include Manufacturing (347 | 18.1%), Health Care & Social Assistance (292 | 15.2%), Professional & Scientific (217 | 11.3%), Retail Trade (168 | 8.8%), and Construction (124 | 6.5%).
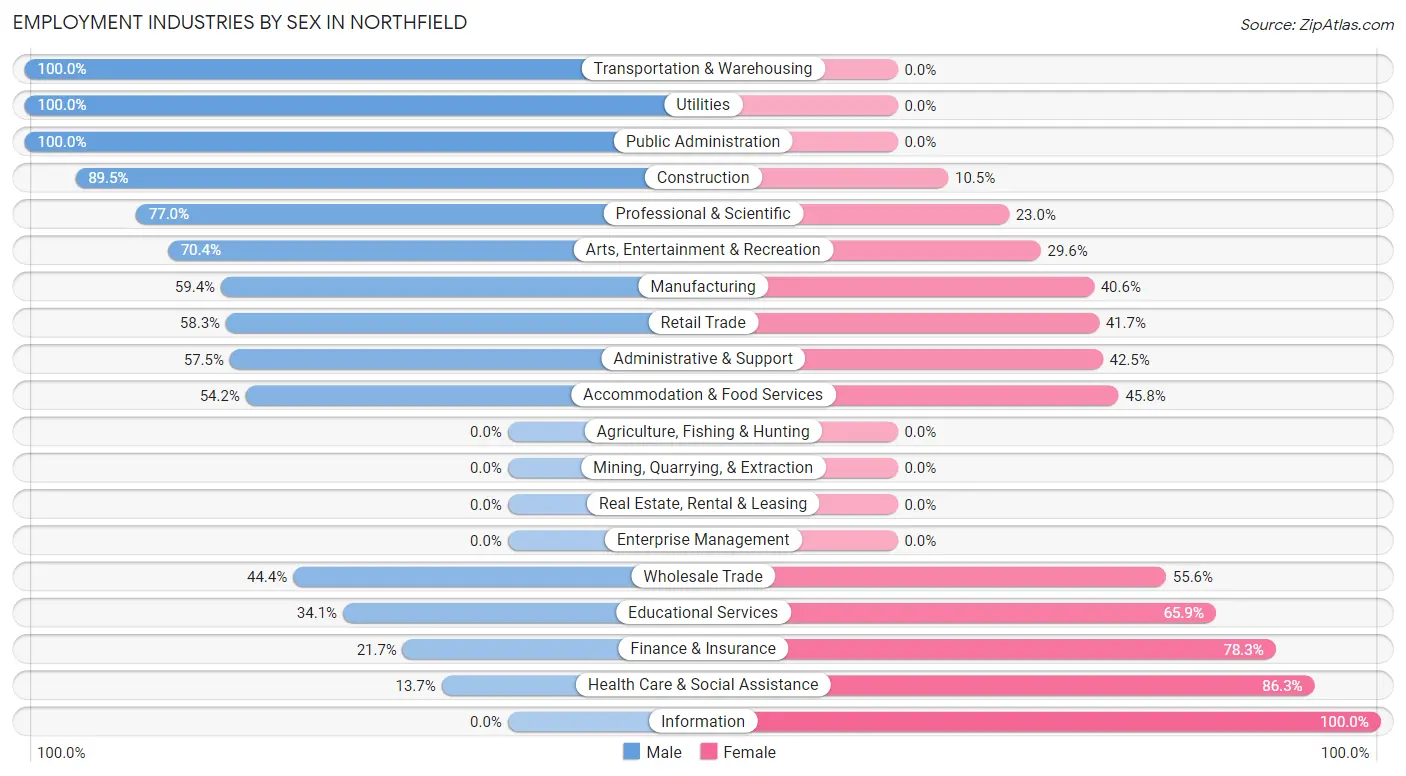
Employment Industries by Sex in Northfield
The Northfield industries that see more men than women are Transportation & Warehousing (100.0%), Utilities (100.0%), and Public Administration (100.0%), whereas the industries that tend to have a higher number of women are Information (100.0%), Health Care & Social Assistance (86.3%), and Finance & Insurance (78.3%).
| Industry | Male | Female |
| Agriculture, Fishing & Hunting | 0 (0.0%) | 0 (0.0%) |
| Mining, Quarrying, & Extraction | 0 (0.0%) | 0 (0.0%) |
| Construction | 111 (89.5%) | 13 (10.5%) |
| Manufacturing | 206 (59.4%) | 141 (40.6%) |
| Wholesale Trade | 28 (44.4%) | 35 (55.6%) |
| Retail Trade | 98 (58.3%) | 70 (41.7%) |
| Transportation & Warehousing | 37 (100.0%) | 0 (0.0%) |
| Utilities | 16 (100.0%) | 0 (0.0%) |
| Information | 0 (0.0%) | 9 (100.0%) |
| Finance & Insurance | 25 (21.7%) | 90 (78.3%) |
| Real Estate, Rental & Leasing | 0 (0.0%) | 0 (0.0%) |
| Professional & Scientific | 167 (77.0%) | 50 (23.0%) |
| Enterprise Management | 0 (0.0%) | 0 (0.0%) |
| Administrative & Support | 42 (57.5%) | 31 (42.5%) |
| Educational Services | 29 (34.1%) | 56 (65.9%) |
| Health Care & Social Assistance | 40 (13.7%) | 252 (86.3%) |
| Arts, Entertainment & Recreation | 57 (70.4%) | 24 (29.6%) |
| Accommodation & Food Services | 64 (54.2%) | 54 (45.8%) |
| Public Administration | 49 (100.0%) | 0 (0.0%) |
| Total | 1,010 (52.7%) | 908 (47.3%) |
Education in Northfield
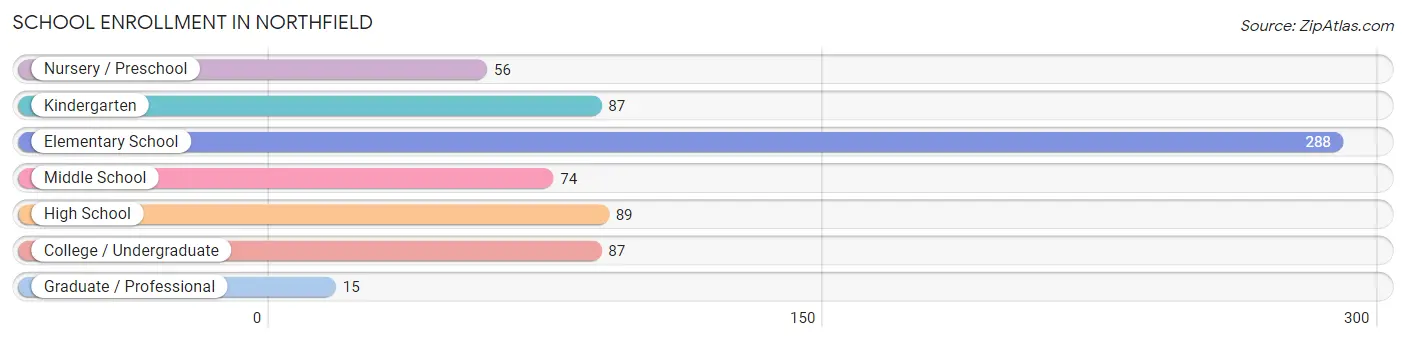
School Enrollment in Northfield
The most common levels of schooling among the 696 students in Northfield are elementary school (288 | 41.4%), high school (89 | 12.8%), and kindergarten (87 | 12.5%).
| School Level | # Students | % Students |
| Nursery / Preschool | 56 | 8.1% |
| Kindergarten | 87 | 12.5% |
| Elementary School | 288 | 41.4% |
| Middle School | 74 | 10.6% |
| High School | 89 | 12.8% |
| College / Undergraduate | 87 | 12.5% |
| Graduate / Professional | 15 | 2.2% |
| Total | 696 | 100.0% |
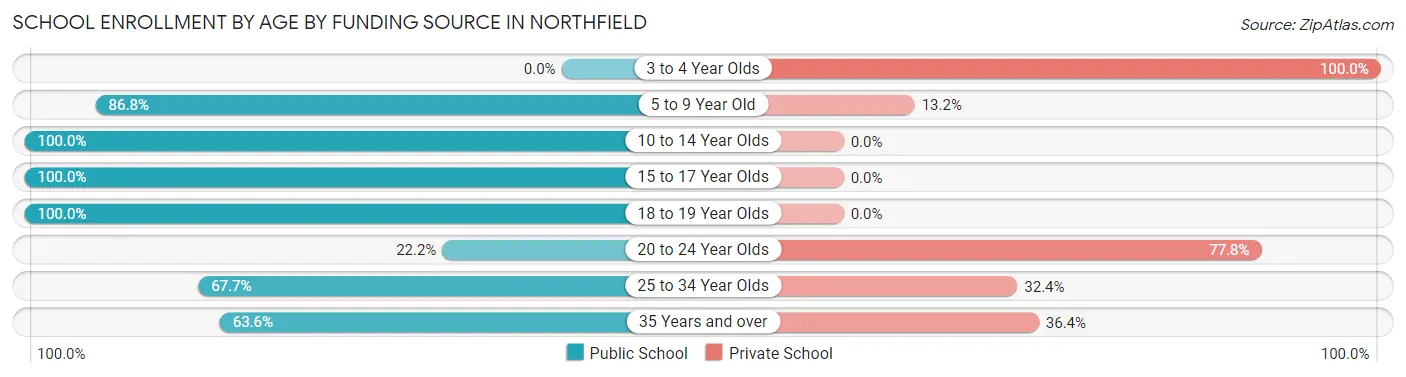
School Enrollment by Age by Funding Source in Northfield
Out of a total of 696 students who are enrolled in schools in Northfield, 131 (18.8%) attend a private institution, while the remaining 565 (81.2%) are enrolled in public schools. The age group of 3 to 4 year olds has the highest likelihood of being enrolled in private schools, with 46 (100.0% in the age bracket) enrolled. Conversely, the age group of 10 to 14 year olds has the lowest likelihood of being enrolled in a private school, with 89 (100.0% in the age bracket) attending a public institution.
| Age Bracket | Public School | Private School |
| 3 to 4 Year Olds | 0 (0.0%) | 46 (100.0%) |
| 5 to 9 Year Old | 321 (86.8%) | 49 (13.2%) |
| 10 to 14 Year Olds | 89 (100.0%) | 0 (0.0%) |
| 15 to 17 Year Olds | 81 (100.0%) | 0 (0.0%) |
| 18 to 19 Year Olds | 38 (100.0%) | 0 (0.0%) |
| 20 to 24 Year Olds | 6 (22.2%) | 21 (77.8%) |
| 25 to 34 Year Olds | 23 (67.6%) | 11 (32.4%) |
| 35 Years and over | 7 (63.6%) | 4 (36.4%) |
| Total | 565 (81.2%) | 131 (18.8%) |
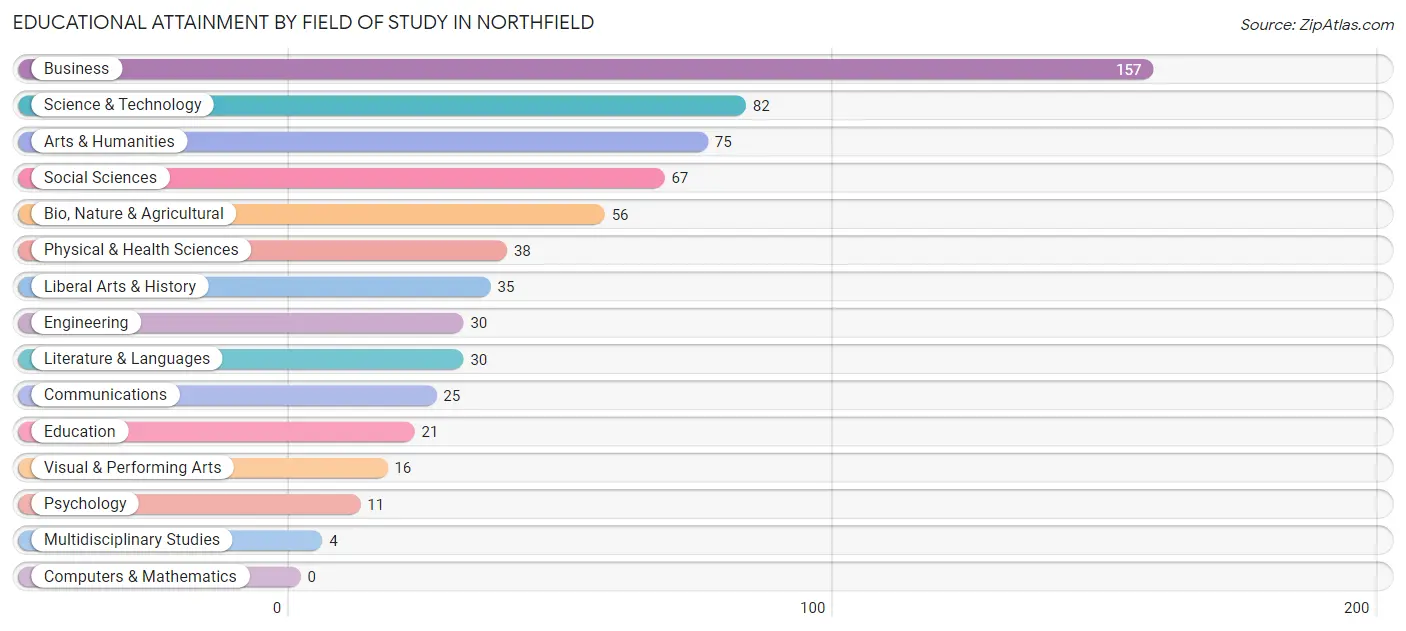
Educational Attainment by Field of Study in Northfield
Business (157 | 24.3%), science & technology (82 | 12.7%), arts & humanities (75 | 11.6%), social sciences (67 | 10.4%), and bio, nature & agricultural (56 | 8.7%) are the most common fields of study among 647 individuals in Northfield who have obtained a bachelor's degree or higher.
| Field of Study | # Graduates | % Graduates |
| Computers & Mathematics | 0 | 0.0% |
| Bio, Nature & Agricultural | 56 | 8.7% |
| Physical & Health Sciences | 38 | 5.9% |
| Psychology | 11 | 1.7% |
| Social Sciences | 67 | 10.4% |
| Engineering | 30 | 4.6% |
| Multidisciplinary Studies | 4 | 0.6% |
| Science & Technology | 82 | 12.7% |
| Business | 157 | 24.3% |
| Education | 21 | 3.3% |
| Literature & Languages | 30 | 4.6% |
| Liberal Arts & History | 35 | 5.4% |
| Visual & Performing Arts | 16 | 2.5% |
| Communications | 25 | 3.9% |
| Arts & Humanities | 75 | 11.6% |
| Total | 647 | 100.0% |
Transportation & Commute in Northfield
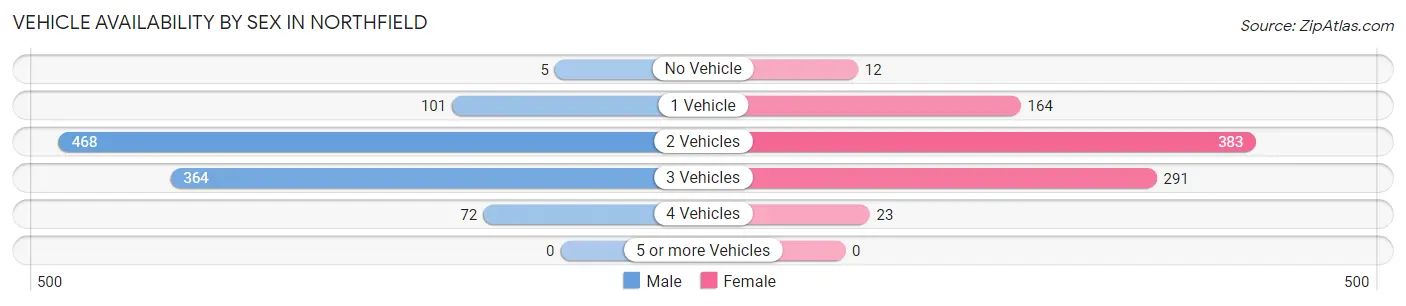
Vehicle Availability by Sex in Northfield
The most prevalent vehicle ownership categories in Northfield are males with 2 vehicles (468, accounting for 46.3%) and females with 2 vehicles (383, making up 53.6%).
| Vehicles Available | Male | Female |
| No Vehicle | 5 (0.5%) | 12 (1.4%) |
| 1 Vehicle | 101 (10.0%) | 164 (18.8%) |
| 2 Vehicles | 468 (46.3%) | 383 (43.9%) |
| 3 Vehicles | 364 (36.0%) | 291 (33.3%) |
| 4 Vehicles | 72 (7.1%) | 23 (2.6%) |
| 5 or more Vehicles | 0 (0.0%) | 0 (0.0%) |
| Total | 1,010 (100.0%) | 873 (100.0%) |
Commute Time in Northfield
The most frequently occuring commute durations in Northfield are 20 to 24 minutes (304 commuters, 17.8%), 45 to 59 minutes (289 commuters, 16.9%), and 5 to 9 minutes (251 commuters, 14.7%).
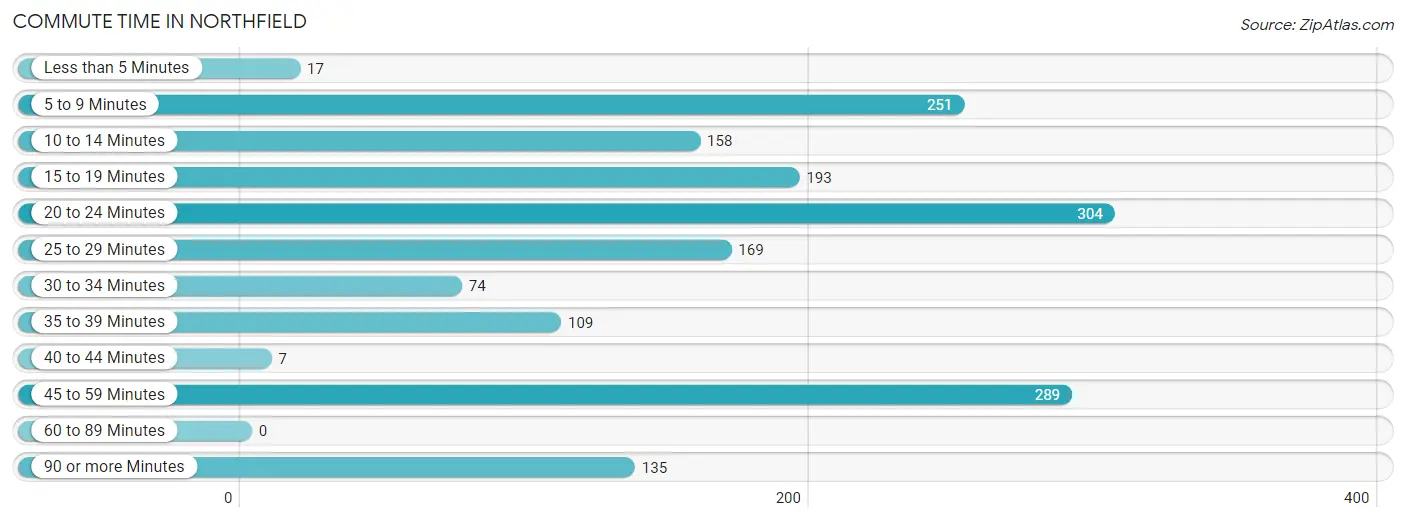
| Commute Time | # Commuters | % Commuters |
| Less than 5 Minutes | 17 | 1.0% |
| 5 to 9 Minutes | 251 | 14.7% |
| 10 to 14 Minutes | 158 | 9.3% |
| 15 to 19 Minutes | 193 | 11.3% |
| 20 to 24 Minutes | 304 | 17.8% |
| 25 to 29 Minutes | 169 | 9.9% |
| 30 to 34 Minutes | 74 | 4.3% |
| 35 to 39 Minutes | 109 | 6.4% |
| 40 to 44 Minutes | 7 | 0.4% |
| 45 to 59 Minutes | 289 | 16.9% |
| 60 to 89 Minutes | 0 | 0.0% |
| 90 or more Minutes | 135 | 7.9% |
Commute Time by Sex in Northfield
The most common commute times in Northfield are 45 to 59 minutes (199 commuters, 21.6%) for males and 20 to 24 minutes (171 commuters, 21.8%) for females.
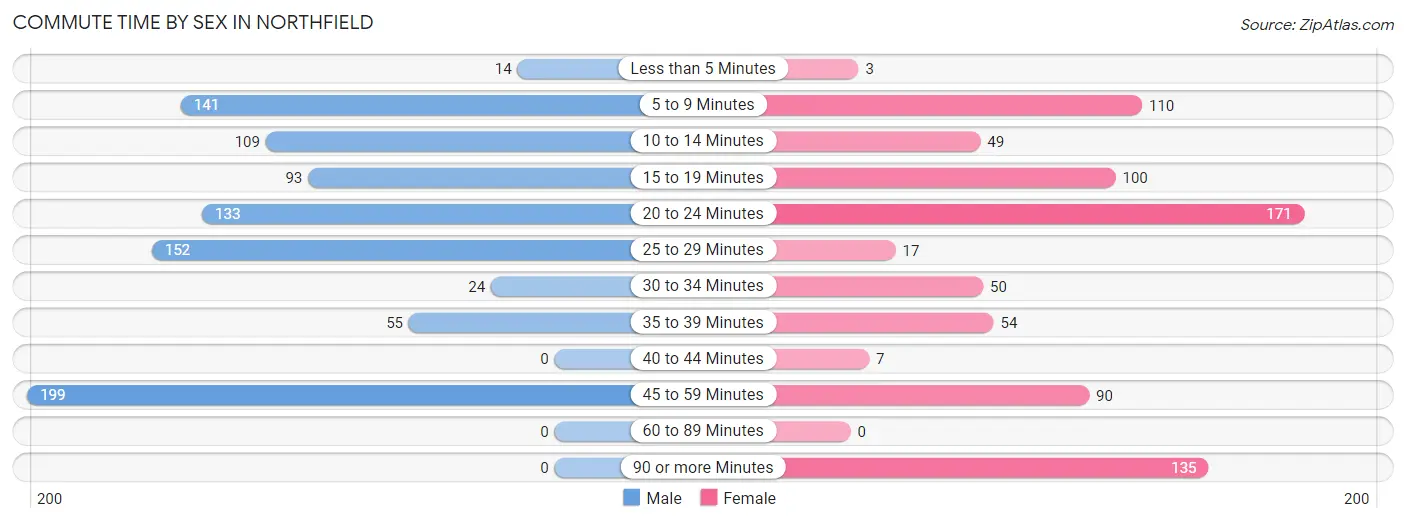
| Commute Time | Male | Female |
| Less than 5 Minutes | 14 (1.5%) | 3 (0.4%) |
| 5 to 9 Minutes | 141 (15.3%) | 110 (14.0%) |
| 10 to 14 Minutes | 109 (11.8%) | 49 (6.2%) |
| 15 to 19 Minutes | 93 (10.1%) | 100 (12.7%) |
| 20 to 24 Minutes | 133 (14.5%) | 171 (21.8%) |
| 25 to 29 Minutes | 152 (16.5%) | 17 (2.2%) |
| 30 to 34 Minutes | 24 (2.6%) | 50 (6.4%) |
| 35 to 39 Minutes | 55 (6.0%) | 54 (6.9%) |
| 40 to 44 Minutes | 0 (0.0%) | 7 (0.9%) |
| 45 to 59 Minutes | 199 (21.6%) | 90 (11.5%) |
| 60 to 89 Minutes | 0 (0.0%) | 0 (0.0%) |
| 90 or more Minutes | 0 (0.0%) | 135 (17.2%) |
Time of Departure to Work by Sex in Northfield
The most frequent times of departure to work in Northfield are 6:30 AM to 6:59 AM (258, 28.0%) for males and 12:00 PM to 3:59 PM (158, 20.1%) for females.
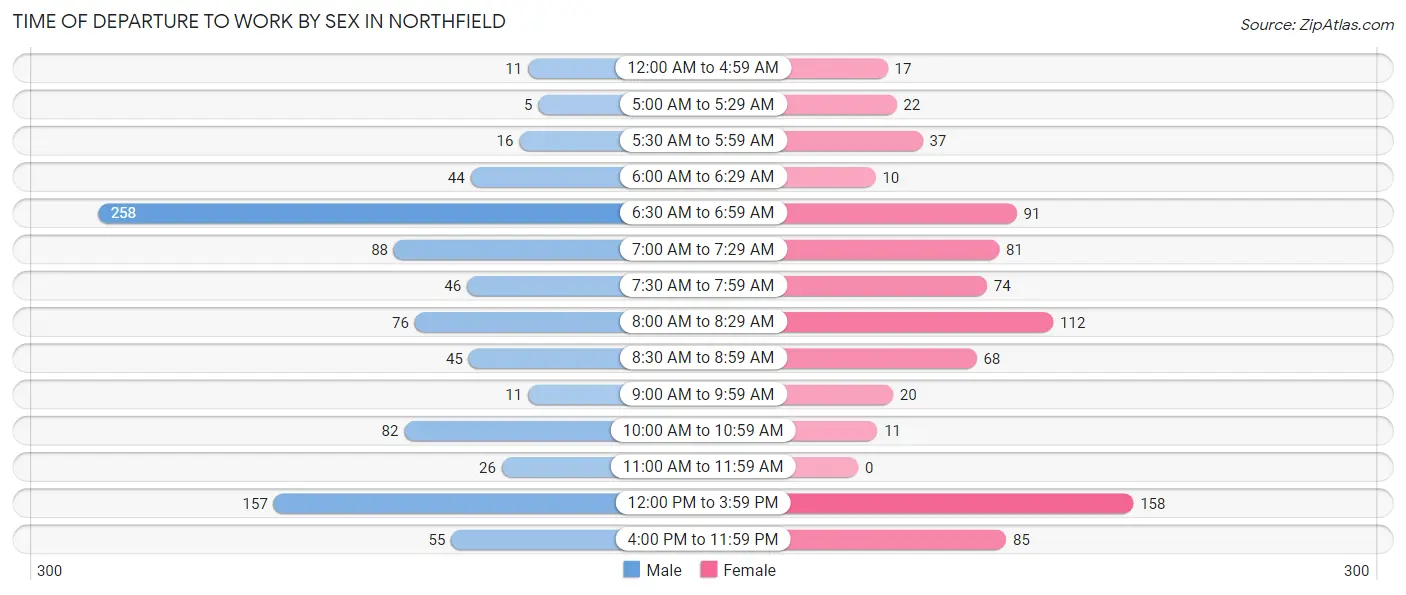
| Time of Departure | Male | Female |
| 12:00 AM to 4:59 AM | 11 (1.2%) | 17 (2.2%) |
| 5:00 AM to 5:29 AM | 5 (0.5%) | 22 (2.8%) |
| 5:30 AM to 5:59 AM | 16 (1.7%) | 37 (4.7%) |
| 6:00 AM to 6:29 AM | 44 (4.8%) | 10 (1.3%) |
| 6:30 AM to 6:59 AM | 258 (28.0%) | 91 (11.6%) |
| 7:00 AM to 7:29 AM | 88 (9.6%) | 81 (10.3%) |
| 7:30 AM to 7:59 AM | 46 (5.0%) | 74 (9.4%) |
| 8:00 AM to 8:29 AM | 76 (8.3%) | 112 (14.2%) |
| 8:30 AM to 8:59 AM | 45 (4.9%) | 68 (8.6%) |
| 9:00 AM to 9:59 AM | 11 (1.2%) | 20 (2.5%) |
| 10:00 AM to 10:59 AM | 82 (8.9%) | 11 (1.4%) |
| 11:00 AM to 11:59 AM | 26 (2.8%) | 0 (0.0%) |
| 12:00 PM to 3:59 PM | 157 (17.1%) | 158 (20.1%) |
| 4:00 PM to 11:59 PM | 55 (6.0%) | 85 (10.8%) |
| Total | 920 (100.0%) | 786 (100.0%) |
Housing Occupancy in Northfield
Occupancy by Ownership in Northfield
Of the total 1,477 dwellings in Northfield, owner-occupied units account for 1,044 (70.7%), while renter-occupied units make up 433 (29.3%).
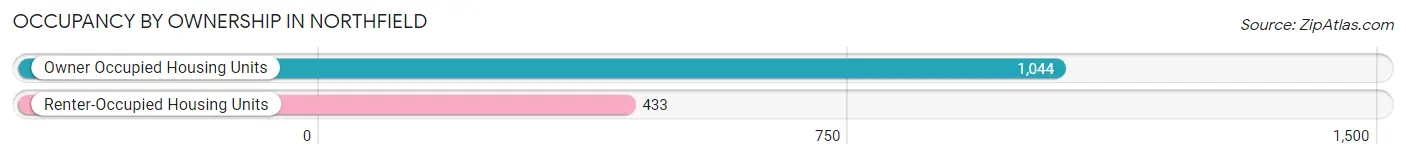
| Occupancy | # Housing Units | % Housing Units |
| Owner Occupied Housing Units | 1,044 | 70.7% |
| Renter-Occupied Housing Units | 433 | 29.3% |
| Total Occupied Housing Units | 1,477 | 100.0% |
Occupancy by Household Size in Northfield
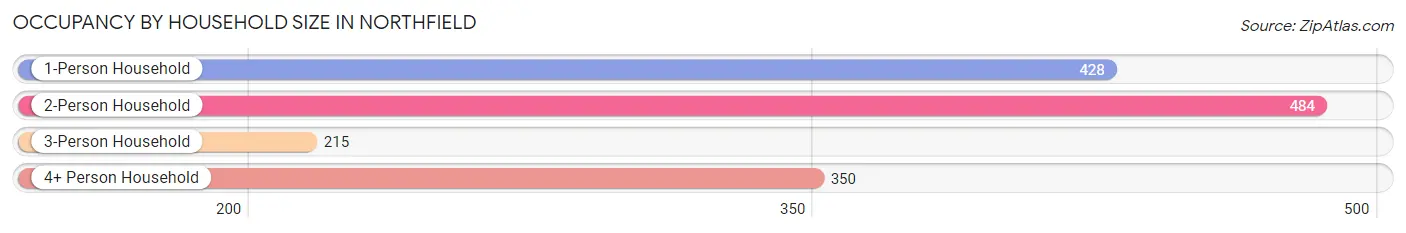
| Household Size | # Housing Units | % Housing Units |
| 1-Person Household | 428 | 29.0% |
| 2-Person Household | 484 | 32.8% |
| 3-Person Household | 215 | 14.6% |
| 4+ Person Household | 350 | 23.7% |
| Total Housing Units | 1,477 | 100.0% |
Occupancy by Ownership by Household Size in Northfield
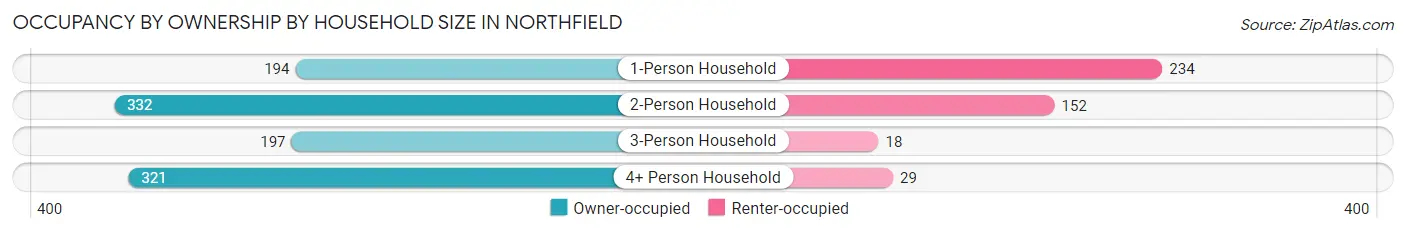
| Household Size | Owner-occupied | Renter-occupied |
| 1-Person Household | 194 (45.3%) | 234 (54.7%) |
| 2-Person Household | 332 (68.6%) | 152 (31.4%) |
| 3-Person Household | 197 (91.6%) | 18 (8.4%) |
| 4+ Person Household | 321 (91.7%) | 29 (8.3%) |
| Total Housing Units | 1,044 (70.7%) | 433 (29.3%) |
Occupancy by Educational Attainment in Northfield
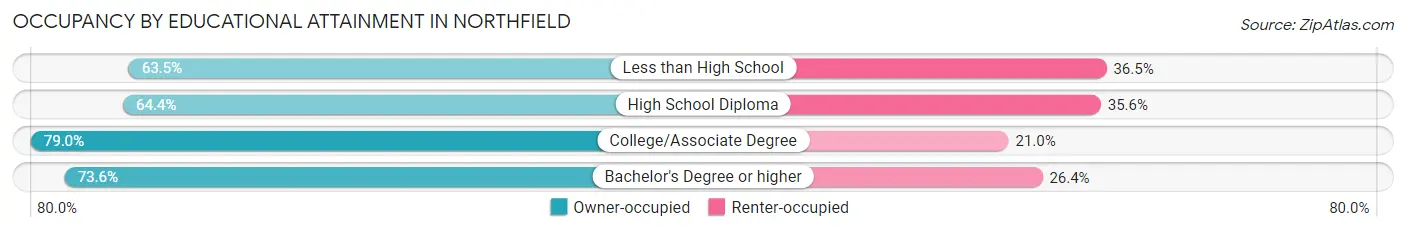
| Household Size | Owner-occupied | Renter-occupied |
| Less than High School | 106 (63.5%) | 61 (36.5%) |
| High School Diploma | 327 (64.4%) | 181 (35.6%) |
| College/Associate Degree | 301 (79.0%) | 80 (21.0%) |
| Bachelor's Degree or higher | 310 (73.6%) | 111 (26.4%) |
Occupancy by Age of Householder in Northfield
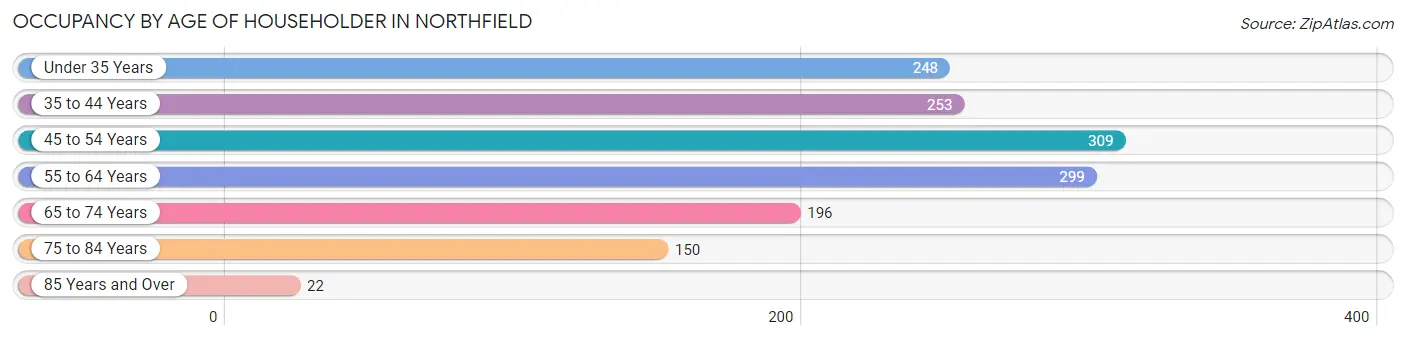
| Age Bracket | # Households | % Households |
| Under 35 Years | 248 | 16.8% |
| 35 to 44 Years | 253 | 17.1% |
| 45 to 54 Years | 309 | 20.9% |
| 55 to 64 Years | 299 | 20.2% |
| 65 to 74 Years | 196 | 13.3% |
| 75 to 84 Years | 150 | 10.2% |
| 85 Years and Over | 22 | 1.5% |
| Total | 1,477 | 100.0% |
Housing Finances in Northfield
Median Income by Occupancy in Northfield
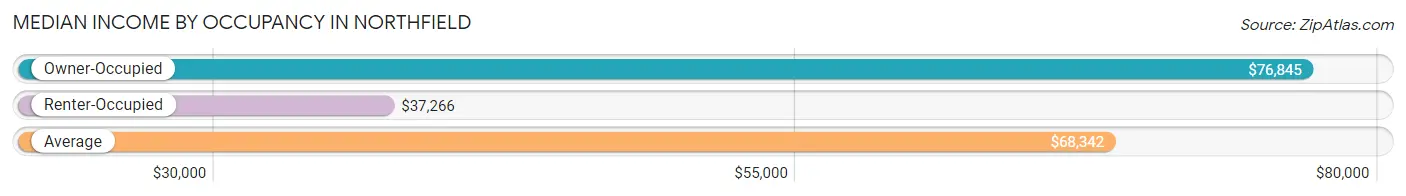
| Occupancy Type | # Households | Median Income |
| Owner-Occupied | 1,044 (70.7%) | $76,845 |
| Renter-Occupied | 433 (29.3%) | $37,266 |
| Average | 1,477 (100.0%) | $68,342 |
Occupancy by Householder Income Bracket in Northfield
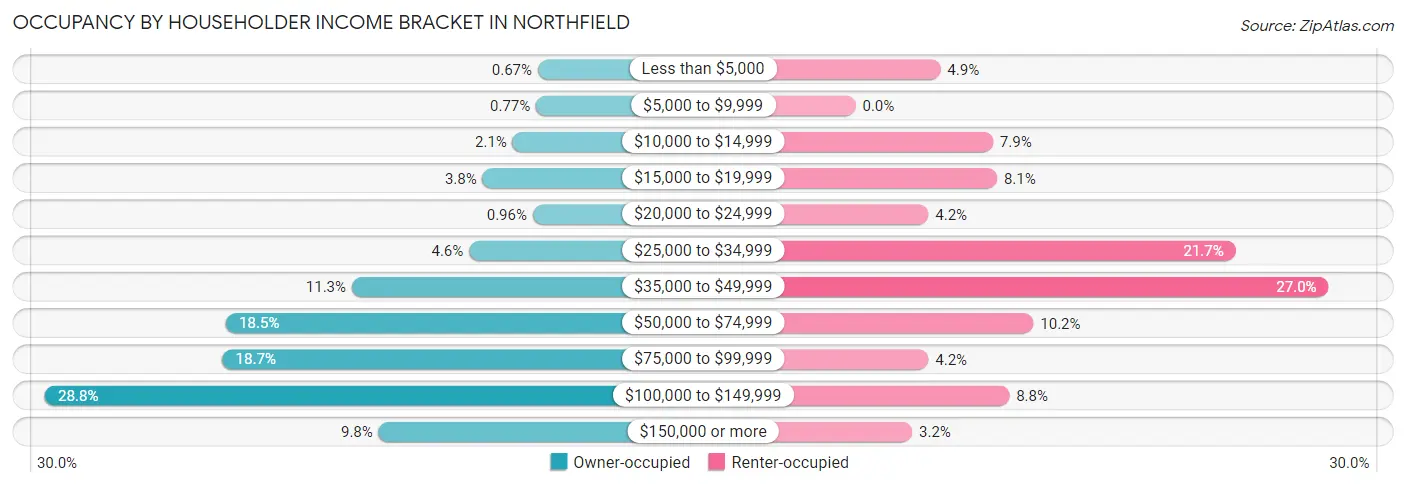
| Income Bracket | Owner-occupied | Renter-occupied |
| Less than $5,000 | 7 (0.7%) | 21 (4.9%) |
| $5,000 to $9,999 | 8 (0.8%) | 0 (0.0%) |
| $10,000 to $14,999 | 22 (2.1%) | 34 (7.9%) |
| $15,000 to $19,999 | 40 (3.8%) | 35 (8.1%) |
| $20,000 to $24,999 | 10 (1.0%) | 18 (4.2%) |
| $25,000 to $34,999 | 48 (4.6%) | 94 (21.7%) |
| $35,000 to $49,999 | 118 (11.3%) | 117 (27.0%) |
| $50,000 to $74,999 | 193 (18.5%) | 44 (10.2%) |
| $75,000 to $99,999 | 195 (18.7%) | 18 (4.2%) |
| $100,000 to $149,999 | 301 (28.8%) | 38 (8.8%) |
| $150,000 or more | 102 (9.8%) | 14 (3.2%) |
| Total | 1,044 (100.0%) | 433 (100.0%) |
Monthly Housing Cost Tiers in Northfield
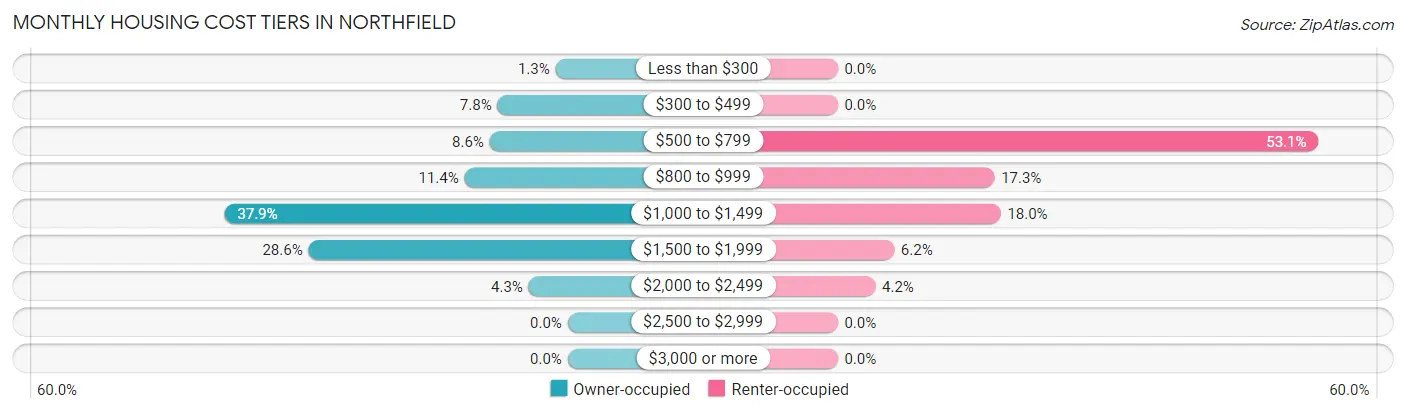
| Monthly Cost | Owner-occupied | Renter-occupied |
| Less than $300 | 14 (1.3%) | 0 (0.0%) |
| $300 to $499 | 81 (7.8%) | 0 (0.0%) |
| $500 to $799 | 90 (8.6%) | 230 (53.1%) |
| $800 to $999 | 119 (11.4%) | 75 (17.3%) |
| $1,000 to $1,499 | 396 (37.9%) | 78 (18.0%) |
| $1,500 to $1,999 | 299 (28.6%) | 27 (6.2%) |
| $2,000 to $2,499 | 45 (4.3%) | 18 (4.2%) |
| $2,500 to $2,999 | 0 (0.0%) | 0 (0.0%) |
| $3,000 or more | 0 (0.0%) | 0 (0.0%) |
| Total | 1,044 (100.0%) | 433 (100.0%) |
Physical Housing Characteristics in Northfield
Housing Structures in Northfield
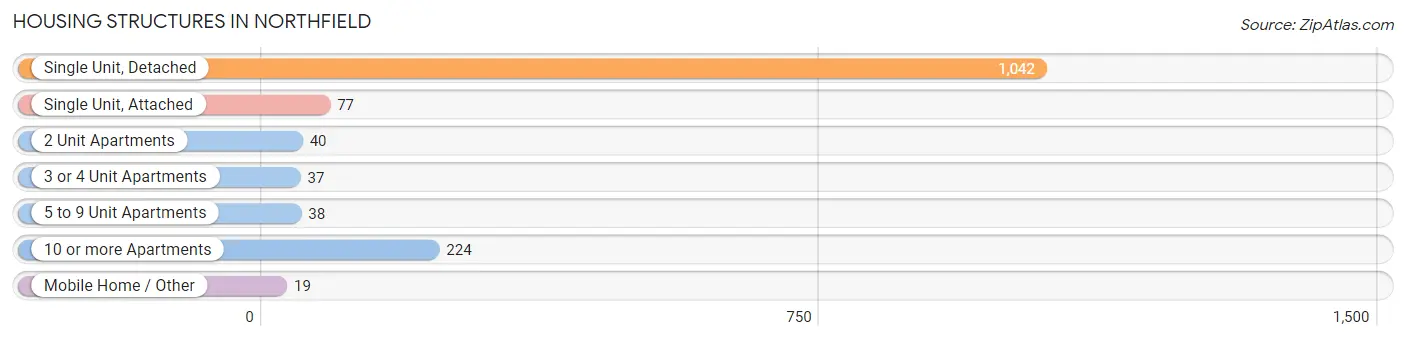
| Structure Type | # Housing Units | % Housing Units |
| Single Unit, Detached | 1,042 | 70.6% |
| Single Unit, Attached | 77 | 5.2% |
| 2 Unit Apartments | 40 | 2.7% |
| 3 or 4 Unit Apartments | 37 | 2.5% |
| 5 to 9 Unit Apartments | 38 | 2.6% |
| 10 or more Apartments | 224 | 15.2% |
| Mobile Home / Other | 19 | 1.3% |
| Total | 1,477 | 100.0% |
Housing Structures by Occupancy in Northfield
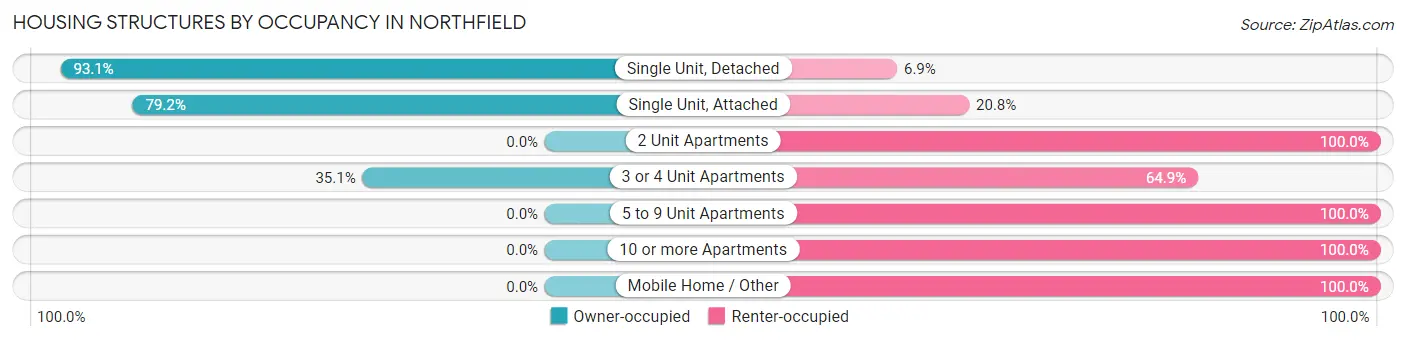
| Structure Type | Owner-occupied | Renter-occupied |
| Single Unit, Detached | 970 (93.1%) | 72 (6.9%) |
| Single Unit, Attached | 61 (79.2%) | 16 (20.8%) |
| 2 Unit Apartments | 0 (0.0%) | 40 (100.0%) |
| 3 or 4 Unit Apartments | 13 (35.1%) | 24 (64.9%) |
| 5 to 9 Unit Apartments | 0 (0.0%) | 38 (100.0%) |
| 10 or more Apartments | 0 (0.0%) | 224 (100.0%) |
| Mobile Home / Other | 0 (0.0%) | 19 (100.0%) |
| Total | 1,044 (70.7%) | 433 (29.3%) |
Housing Structures by Number of Rooms in Northfield
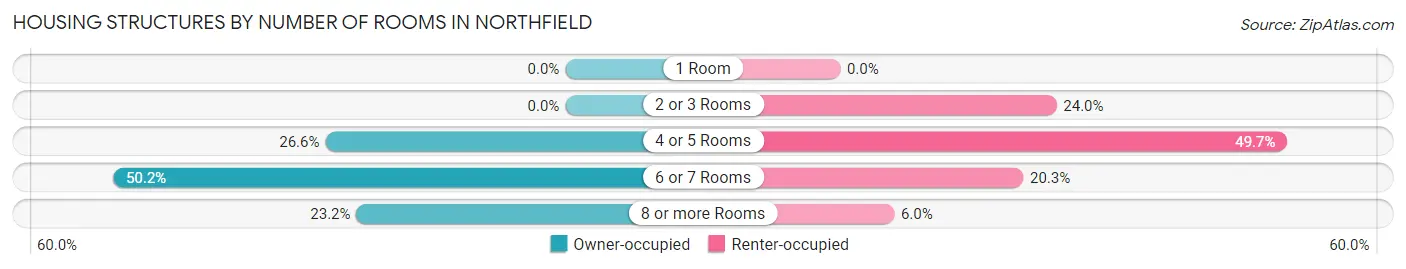
| Number of Rooms | Owner-occupied | Renter-occupied |
| 1 Room | 0 (0.0%) | 0 (0.0%) |
| 2 or 3 Rooms | 0 (0.0%) | 104 (24.0%) |
| 4 or 5 Rooms | 278 (26.6%) | 215 (49.6%) |
| 6 or 7 Rooms | 524 (50.2%) | 88 (20.3%) |
| 8 or more Rooms | 242 (23.2%) | 26 (6.0%) |
| Total | 1,044 (100.0%) | 433 (100.0%) |
Housing Structure by Heating Type in Northfield
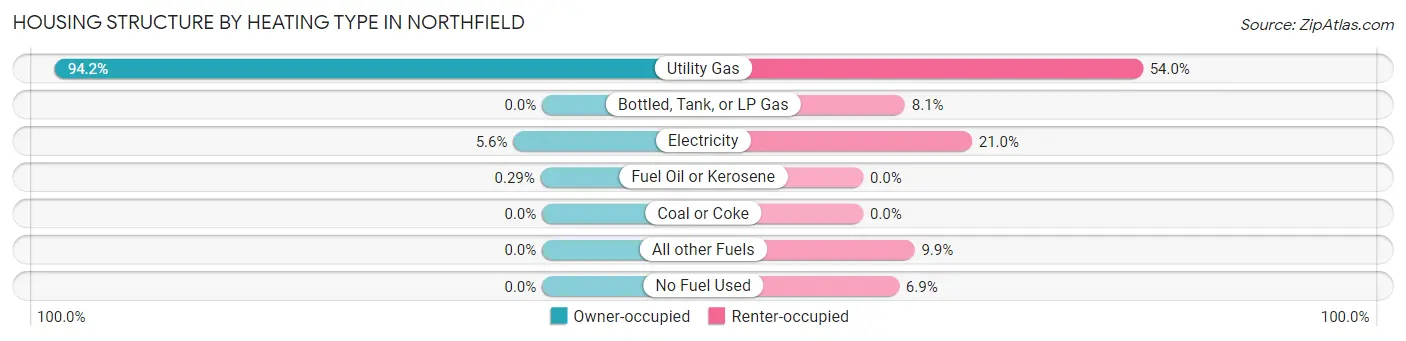
| Heating Type | Owner-occupied | Renter-occupied |
| Utility Gas | 983 (94.2%) | 234 (54.0%) |
| Bottled, Tank, or LP Gas | 0 (0.0%) | 35 (8.1%) |
| Electricity | 58 (5.6%) | 91 (21.0%) |
| Fuel Oil or Kerosene | 3 (0.3%) | 0 (0.0%) |
| Coal or Coke | 0 (0.0%) | 0 (0.0%) |
| All other Fuels | 0 (0.0%) | 43 (9.9%) |
| No Fuel Used | 0 (0.0%) | 30 (6.9%) |
| Total | 1,044 (100.0%) | 433 (100.0%) |
Household Vehicle Usage in Northfield
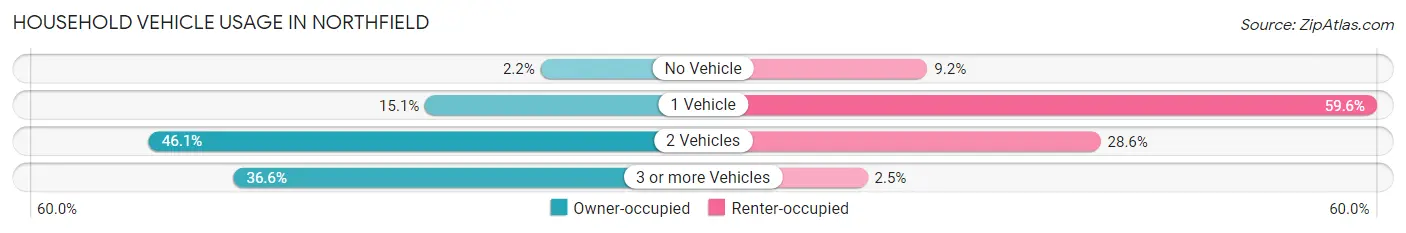
| Vehicles per Household | Owner-occupied | Renter-occupied |
| No Vehicle | 23 (2.2%) | 40 (9.2%) |
| 1 Vehicle | 158 (15.1%) | 258 (59.6%) |
| 2 Vehicles | 481 (46.1%) | 124 (28.6%) |
| 3 or more Vehicles | 382 (36.6%) | 11 (2.5%) |
| Total | 1,044 (100.0%) | 433 (100.0%) |
Real Estate & Mortgages in Northfield
Real Estate and Mortgage Overview in Northfield
| Characteristic | Without Mortgage | With Mortgage |
| Housing Units | 177 | 867 |
| Median Property Value | $157,200 | $169,600 |
| Median Household Income | $51,458 | $98 |
| Monthly Housing Costs | $495 | $0 |
| Real Estate Taxes | $2,500 | $0 |
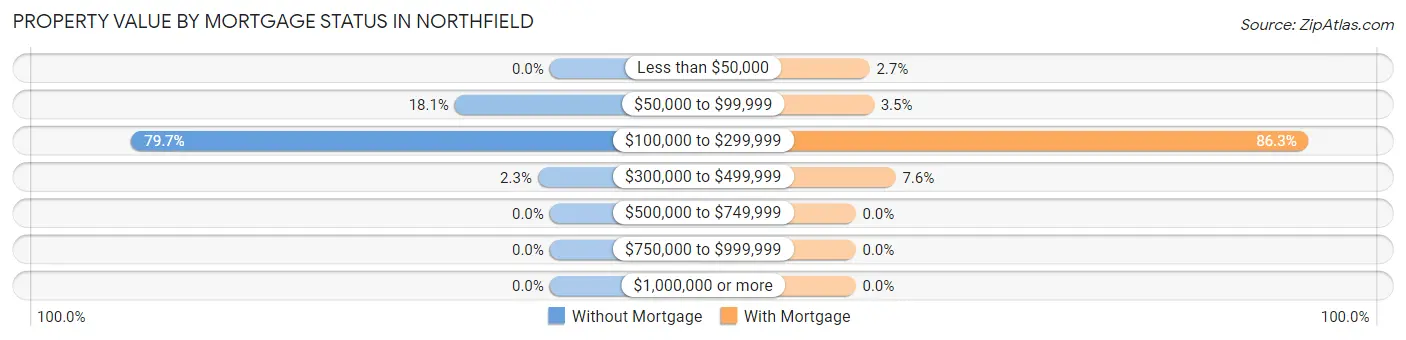
Property Value by Mortgage Status in Northfield
| Property Value | Without Mortgage | With Mortgage |
| Less than $50,000 | 0 (0.0%) | 23 (2.6%) |
| $50,000 to $99,999 | 32 (18.1%) | 30 (3.5%) |
| $100,000 to $299,999 | 141 (79.7%) | 748 (86.3%) |
| $300,000 to $499,999 | 4 (2.3%) | 66 (7.6%) |
| $500,000 to $749,999 | 0 (0.0%) | 0 (0.0%) |
| $750,000 to $999,999 | 0 (0.0%) | 0 (0.0%) |
| $1,000,000 or more | 0 (0.0%) | 0 (0.0%) |
| Total | 177 (100.0%) | 867 (100.0%) |
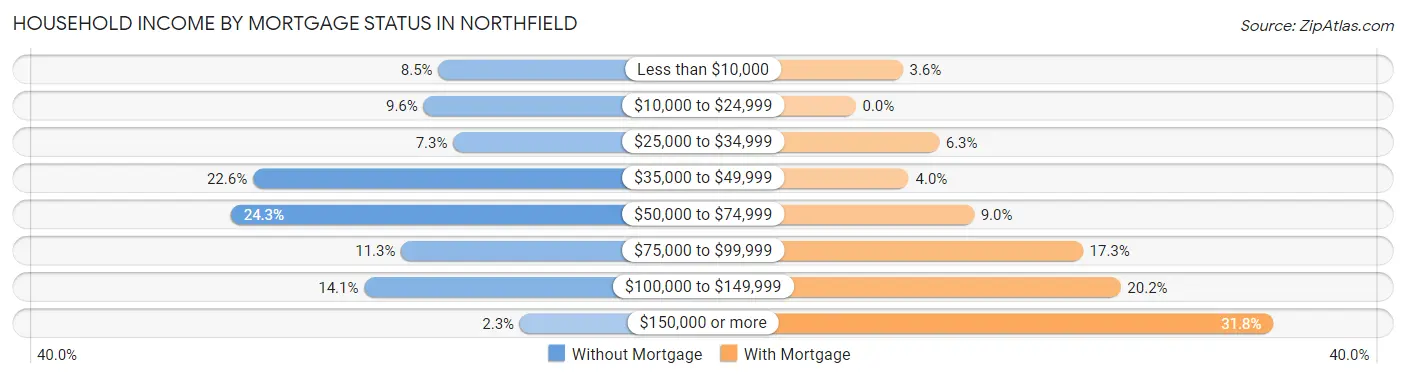
Household Income by Mortgage Status in Northfield
| Household Income | Without Mortgage | With Mortgage |
| Less than $10,000 | 15 (8.5%) | 31 (3.6%) |
| $10,000 to $24,999 | 17 (9.6%) | 0 (0.0%) |
| $25,000 to $34,999 | 13 (7.3%) | 55 (6.3%) |
| $35,000 to $49,999 | 40 (22.6%) | 35 (4.0%) |
| $50,000 to $74,999 | 43 (24.3%) | 78 (9.0%) |
| $75,000 to $99,999 | 20 (11.3%) | 150 (17.3%) |
| $100,000 to $149,999 | 25 (14.1%) | 175 (20.2%) |
| $150,000 or more | 4 (2.3%) | 276 (31.8%) |
| Total | 177 (100.0%) | 867 (100.0%) |
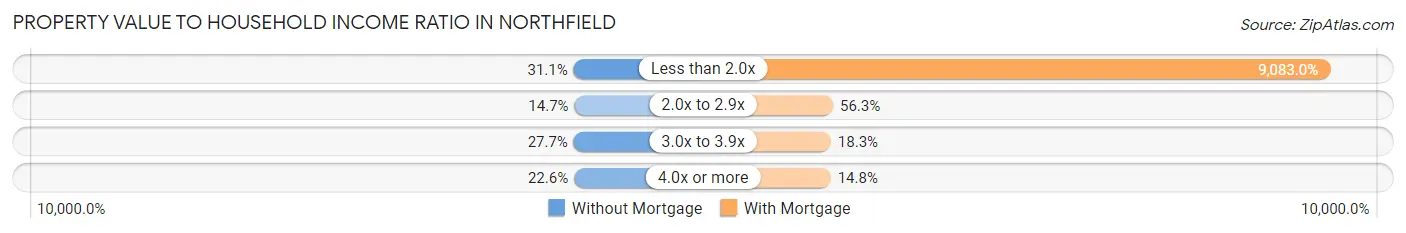
Property Value to Household Income Ratio in Northfield
| Value-to-Income Ratio | Without Mortgage | With Mortgage |
| Less than 2.0x | 55 (31.1%) | 78,750 (9,083.0%) |
| 2.0x to 2.9x | 26 (14.7%) | 488 (56.3%) |
| 3.0x to 3.9x | 49 (27.7%) | 159 (18.3%) |
| 4.0x or more | 40 (22.6%) | 128 (14.8%) |
| Total | 177 (100.0%) | 867 (100.0%) |
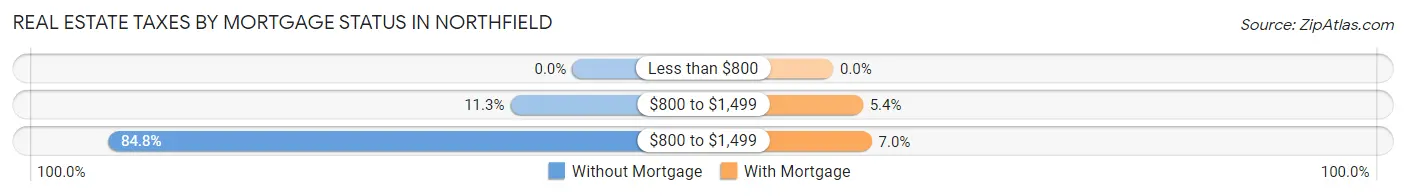
Real Estate Taxes by Mortgage Status in Northfield
| Property Taxes | Without Mortgage | With Mortgage |
| Less than $800 | 0 (0.0%) | 0 (0.0%) |
| $800 to $1,499 | 20 (11.3%) | 47 (5.4%) |
| $800 to $1,499 | 150 (84.8%) | 61 (7.0%) |
| Total | 177 (100.0%) | 867 (100.0%) |
Health & Disability in Northfield
Health Insurance Coverage by Age in Northfield
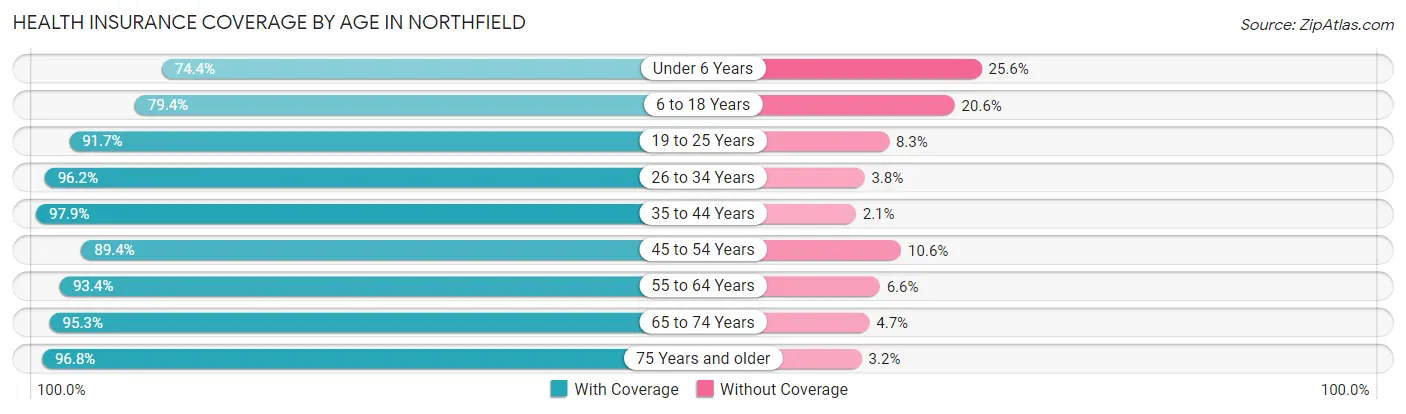
| Age Bracket | With Coverage | Without Coverage |
| Under 6 Years | 253 (74.4%) | 87 (25.6%) |
| 6 to 18 Years | 382 (79.4%) | 99 (20.6%) |
| 19 to 25 Years | 110 (91.7%) | 10 (8.3%) |
| 26 to 34 Years | 461 (96.2%) | 18 (3.8%) |
| 35 to 44 Years | 502 (97.9%) | 11 (2.1%) |
| 45 to 54 Years | 506 (89.4%) | 60 (10.6%) |
| 55 to 64 Years | 439 (93.4%) | 31 (6.6%) |
| 65 to 74 Years | 306 (95.3%) | 15 (4.7%) |
| 75 Years and older | 239 (96.8%) | 8 (3.2%) |
| Total | 3,198 (90.4%) | 339 (9.6%) |
Health Insurance Coverage by Citizenship Status in Northfield
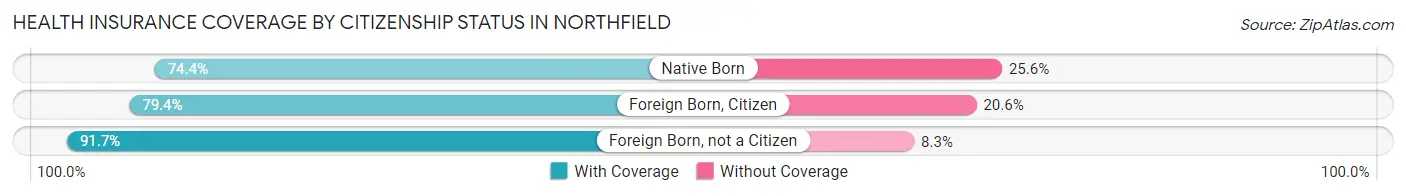
| Citizenship Status | With Coverage | Without Coverage |
| Native Born | 253 (74.4%) | 87 (25.6%) |
| Foreign Born, Citizen | 382 (79.4%) | 99 (20.6%) |
| Foreign Born, not a Citizen | 110 (91.7%) | 10 (8.3%) |
Health Insurance Coverage by Household Income in Northfield
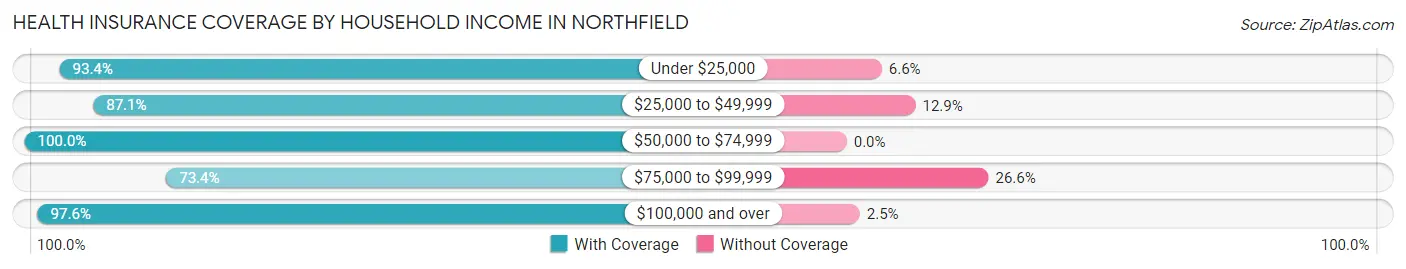
| Household Income | With Coverage | Without Coverage |
| Under $25,000 | 270 (93.4%) | 19 (6.6%) |
| $25,000 to $49,999 | 683 (87.1%) | 101 (12.9%) |
| $50,000 to $74,999 | 454 (100.0%) | 0 (0.0%) |
| $75,000 to $99,999 | 517 (73.4%) | 187 (26.6%) |
| $100,000 and over | 1,274 (97.6%) | 32 (2.5%) |
Public vs Private Health Insurance Coverage by Age in Northfield
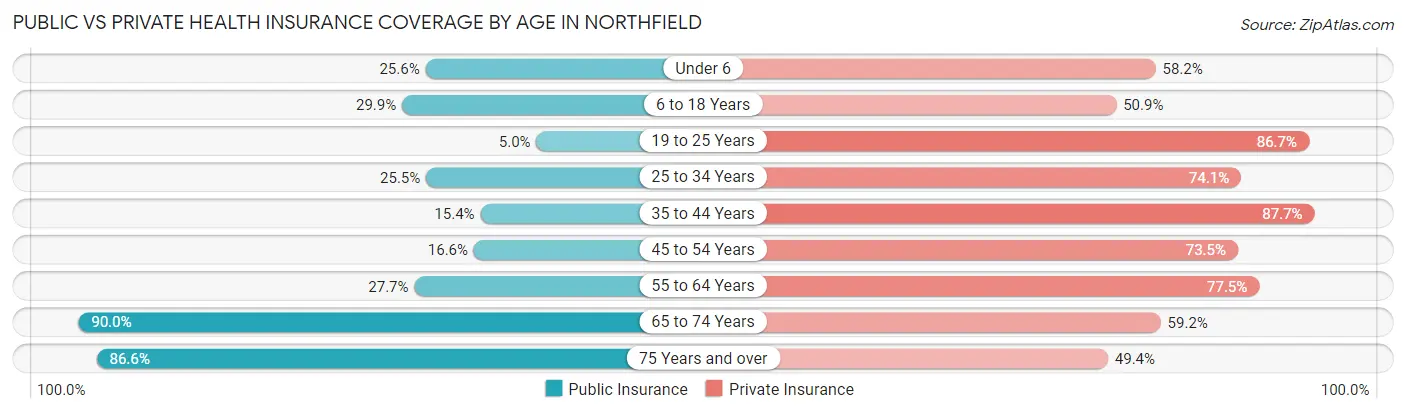
| Age Bracket | Public Insurance | Private Insurance |
| Under 6 | 87 (25.6%) | 198 (58.2%) |
| 6 to 18 Years | 144 (29.9%) | 245 (50.9%) |
| 19 to 25 Years | 6 (5.0%) | 104 (86.7%) |
| 25 to 34 Years | 122 (25.5%) | 355 (74.1%) |
| 35 to 44 Years | 79 (15.4%) | 450 (87.7%) |
| 45 to 54 Years | 94 (16.6%) | 416 (73.5%) |
| 55 to 64 Years | 130 (27.7%) | 364 (77.4%) |
| 65 to 74 Years | 289 (90.0%) | 190 (59.2%) |
| 75 Years and over | 214 (86.6%) | 122 (49.4%) |
| Total | 1,165 (32.9%) | 2,444 (69.1%) |
Disability Status by Sex by Age in Northfield
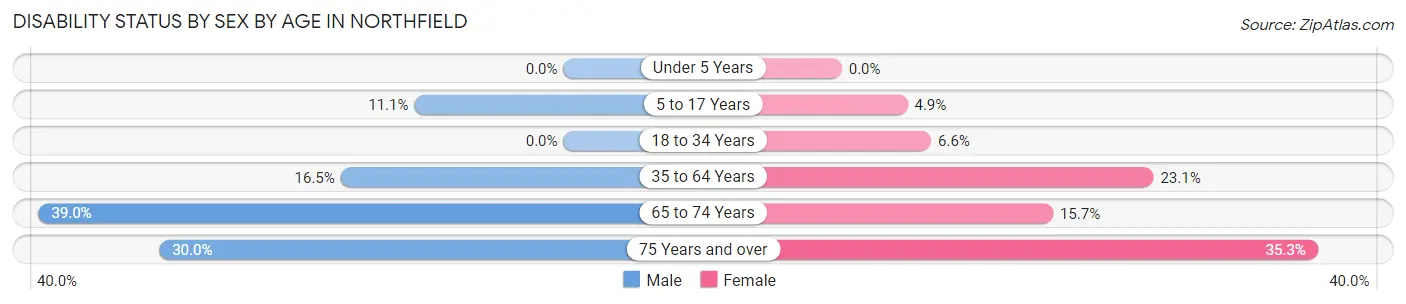
| Age Bracket | Male | Female |
| Under 5 Years | 0 (0.0%) | 0 (0.0%) |
| 5 to 17 Years | 28 (11.1%) | 14 (4.9%) |
| 18 to 34 Years | 0 (0.0%) | 23 (6.6%) |
| 35 to 64 Years | 134 (16.5%) | 171 (23.1%) |
| 65 to 74 Years | 53 (39.0%) | 29 (15.7%) |
| 75 Years and over | 24 (30.0%) | 59 (35.3%) |
Disability Class by Sex by Age in Northfield
Disability Class: Hearing Difficulty
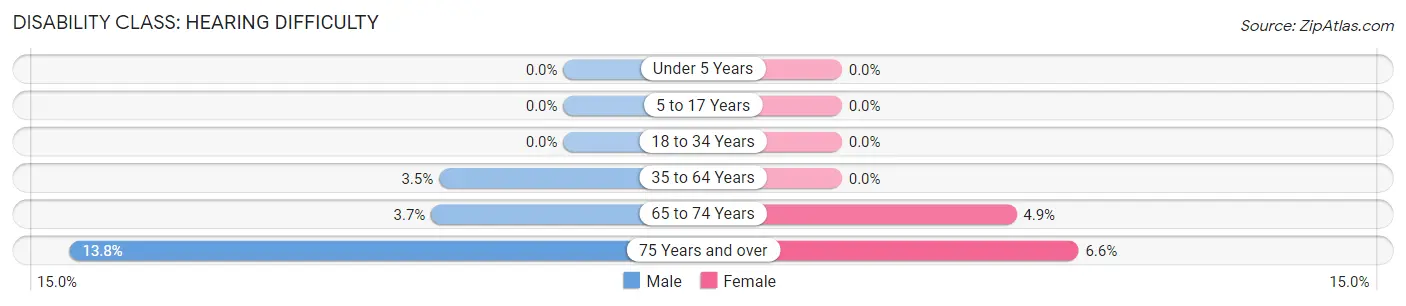
| Age Bracket | Male | Female |
| Under 5 Years | 0 (0.0%) | 0 (0.0%) |
| 5 to 17 Years | 0 (0.0%) | 0 (0.0%) |
| 18 to 34 Years | 0 (0.0%) | 0 (0.0%) |
| 35 to 64 Years | 28 (3.5%) | 0 (0.0%) |
| 65 to 74 Years | 5 (3.7%) | 9 (4.9%) |
| 75 Years and over | 11 (13.8%) | 11 (6.6%) |
Disability Class: Vision Difficulty
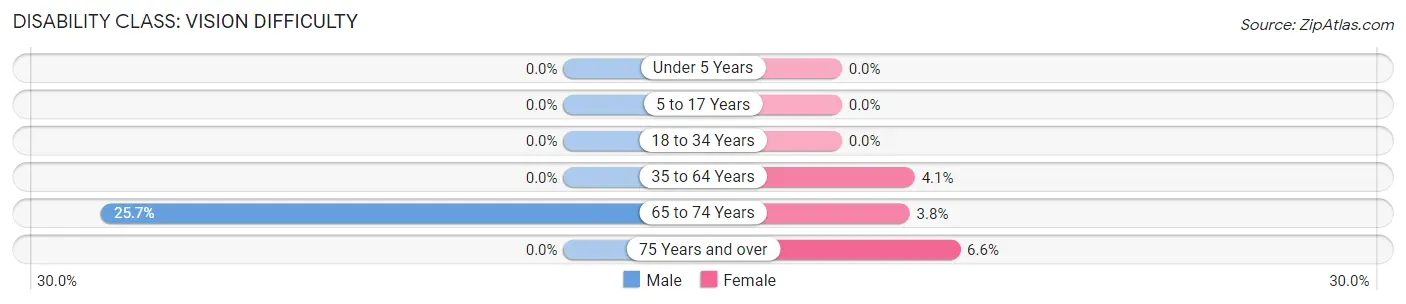
| Age Bracket | Male | Female |
| Under 5 Years | 0 (0.0%) | 0 (0.0%) |
| 5 to 17 Years | 0 (0.0%) | 0 (0.0%) |
| 18 to 34 Years | 0 (0.0%) | 0 (0.0%) |
| 35 to 64 Years | 0 (0.0%) | 30 (4.1%) |
| 65 to 74 Years | 35 (25.7%) | 7 (3.8%) |
| 75 Years and over | 0 (0.0%) | 11 (6.6%) |
Disability Class: Cognitive Difficulty
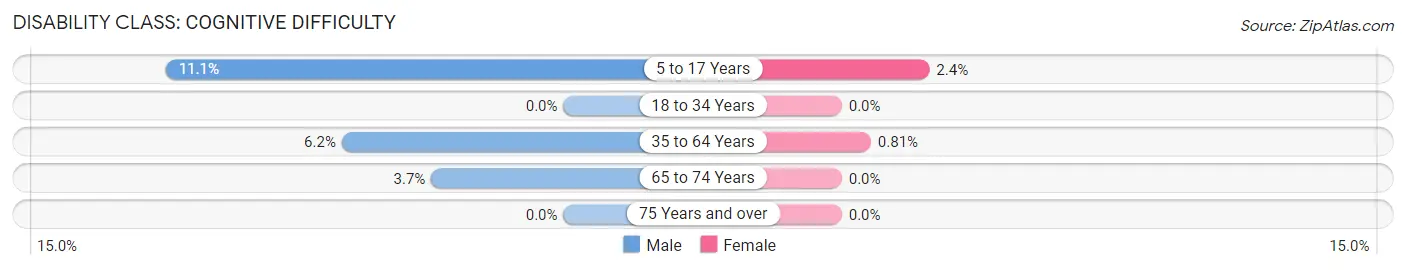
| Age Bracket | Male | Female |
| 5 to 17 Years | 28 (11.1%) | 7 (2.4%) |
| 18 to 34 Years | 0 (0.0%) | 0 (0.0%) |
| 35 to 64 Years | 50 (6.2%) | 6 (0.8%) |
| 65 to 74 Years | 5 (3.7%) | 0 (0.0%) |
| 75 Years and over | 0 (0.0%) | 0 (0.0%) |
Disability Class: Ambulatory Difficulty
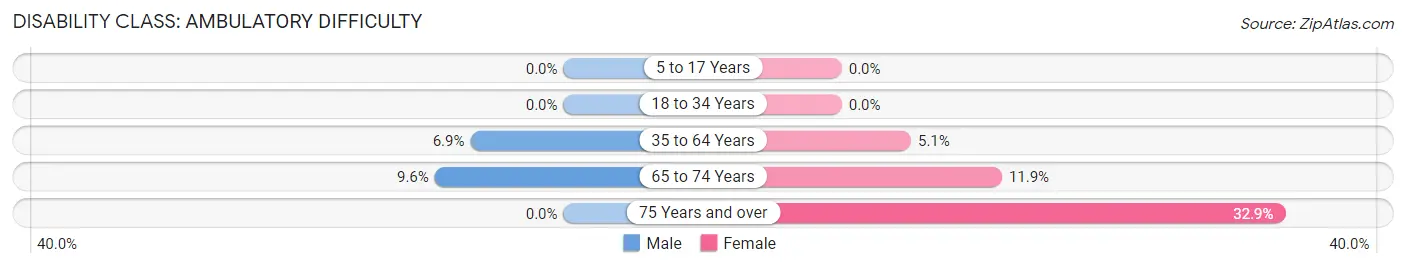
| Age Bracket | Male | Female |
| 5 to 17 Years | 0 (0.0%) | 0 (0.0%) |
| 18 to 34 Years | 0 (0.0%) | 0 (0.0%) |
| 35 to 64 Years | 56 (6.9%) | 38 (5.1%) |
| 65 to 74 Years | 13 (9.6%) | 22 (11.9%) |
| 75 Years and over | 0 (0.0%) | 55 (32.9%) |
Disability Class: Self-Care Difficulty
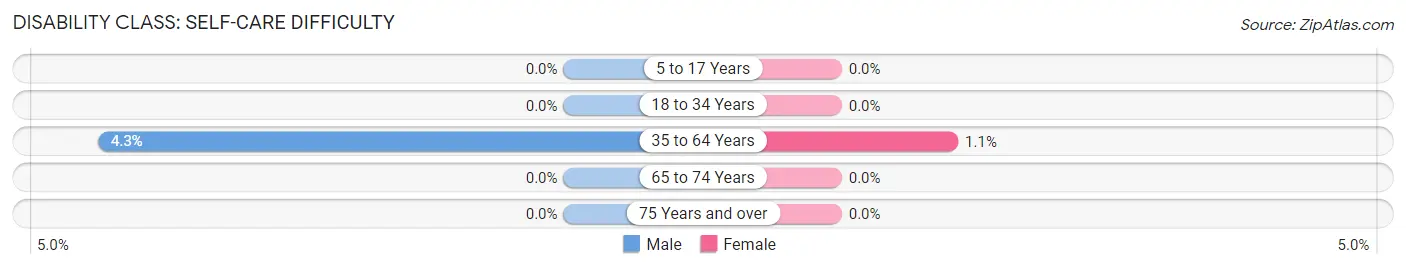
| Age Bracket | Male | Female |
| 5 to 17 Years | 0 (0.0%) | 0 (0.0%) |
| 18 to 34 Years | 0 (0.0%) | 0 (0.0%) |
| 35 to 64 Years | 35 (4.3%) | 8 (1.1%) |
| 65 to 74 Years | 0 (0.0%) | 0 (0.0%) |
| 75 Years and over | 0 (0.0%) | 0 (0.0%) |
Technology Access in Northfield
Computing Device Access in Northfield
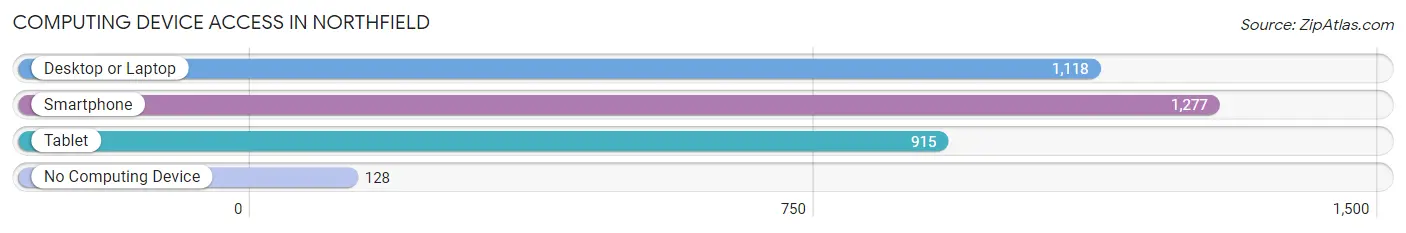
| Device Type | # Households | % Households |
| Desktop or Laptop | 1,118 | 75.7% |
| Smartphone | 1,277 | 86.5% |
| Tablet | 915 | 62.0% |
| No Computing Device | 128 | 8.7% |
| Total | 1,477 | 100.0% |
Internet Access in Northfield
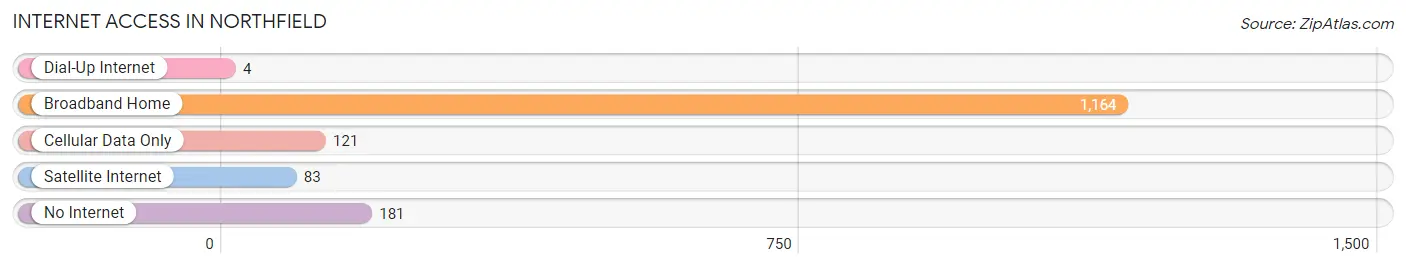
| Internet Type | # Households | % Households |
| Dial-Up Internet | 4 | 0.3% |
| Broadband Home | 1,164 | 78.8% |
| Cellular Data Only | 121 | 8.2% |
| Satellite Internet | 83 | 5.6% |
| No Internet | 181 | 12.2% |
| Total | 1,477 | 100.0% |
Northfield Summary
Northfield, Ohio is a small city located in Summit County, Ohio. It is situated on the Cuyahoga River, about 15 miles south of Cleveland. The city has a population of about 3,000 people and is part of the Akron Metropolitan Statistical Area.
History
Northfield was founded in 1815 by a group of settlers from Connecticut. The settlers were attracted to the area by the abundance of natural resources, including timber, water, and fertile soil. The town was originally called Northfield Center, but the name was changed to Northfield in 1817.
The town grew slowly but steadily over the years, and by the mid-1800s, it had become a thriving agricultural community. The town was also home to several mills, including a grist mill, a saw mill, and a woolen mill.
In the late 1800s, Northfield began to experience a period of rapid growth. This was due in part to the construction of the Cleveland and Akron Railroad, which connected the town to the larger cities of Cleveland and Akron. The railroad also brought new industries to the area, including a brickyard, a canning factory, and a furniture factory.
By the early 1900s, Northfield had become a popular summer resort destination. The town was home to several large hotels, as well as a number of smaller inns and boarding houses. The town also had a thriving business district, with several stores, banks, and other businesses.
Geography
Northfield is located in Summit County, Ohio. It is situated on the Cuyahoga River, about 15 miles south of Cleveland. The city has a total area of 2.2 square miles, all of which is land.
The city is located in the Western Reserve region of Ohio, which is characterized by rolling hills and wooded areas. The city is also home to several parks, including Northfield Park, which is located on the banks of the Cuyahoga River.
Economy
Northfield’s economy is largely based on the service industry. The city is home to several restaurants, retail stores, and other businesses. The city is also home to several manufacturing companies, including a furniture factory and a canning factory.
The city is also home to several educational institutions, including the University of Akron and the University of Mount Union.
Demographics
As of the 2010 census, Northfield had a population of 3,000 people. The racial makeup of the city was 94.3% White, 2.3% African American, 0.3% Native American, 0.7% Asian, and 2.4% from other races. Hispanic or Latino of any race were 1.7% of the population.
The median household income in Northfield was $45,000, and the median family income was $50,000. The per capita income was $20,000. About 8.3% of the population was below the poverty line.
Northfield is a small city with a rich history and a diverse population. The city is home to several businesses, educational institutions, and parks, making it an attractive place to live and work.
Common Questions
What is Per Capita Income in Northfield?
Per Capita income in Northfield is $31,137.
What is the Median Family Income in Northfield?
Median Family Income in Northfield is $77,415.
What is the Median Household income in Northfield?
Median Household Income in Northfield is $68,342.
What is Income or Wage Gap in Northfield?
Income or Wage Gap in Northfield is 22.4%.
Women in Northfield earn 77.6 cents for every dollar earned by a man.
What is Inequality or Gini Index in Northfield?
Inequality or Gini Index in Northfield is 0.36.
What is the Total Population of Northfield?
Total Population of Northfield is 3,546.
What is the Total Male Population of Northfield?
Total Male Population of Northfield is 1,662.
What is the Total Female Population of Northfield?
Total Female Population of Northfield is 1,884.
What is the Ratio of Males per 100 Females in Northfield?
There are 88.22 Males per 100 Females in Northfield.
What is the Ratio of Females per 100 Males in Northfield?
There are 113.36 Females per 100 Males in Northfield.
What is the Median Population Age in Northfield?
Median Population Age in Northfield is 38.9 Years.
What is the Average Family Size in Northfield
Average Family Size in Northfield is 3.0 People.
What is the Average Household Size in Northfield
Average Household Size in Northfield is 2.4 People.
How Large is the Labor Force in Northfield?
There are 1,985 People in the Labor Forcein in Northfield.
What is the Percentage of People in the Labor Force in Northfield?
70.3% of People are in the Labor Force in Northfield.
What is the Unemployment Rate in Northfield?
Unemployment Rate in Northfield is 3.4%.