Kent, OH Map & Demographics
Kent Map
Kent Overview
$27,506
PER CAPITA INCOME
$97,250
AVG FAMILY INCOME
$37,505
AVG HOUSEHOLD INCOME
52.2%
WAGE / INCOME GAP [ % ]
47.8¢/ $1
WAGE / INCOME GAP [ $ ]
0.53
INEQUALITY / GINI INDEX
27,336
TOTAL POPULATION
12,738
MALE POPULATION
14,598
FEMALE POPULATION
87.26
MALES / 100 FEMALES
114.60
FEMALES / 100 MALES
23.8
MEDIAN AGE
2.9
AVG FAMILY SIZE
2.1
AVG HOUSEHOLD SIZE
15,294
LABOR FORCE [ PEOPLE ]
63.7%
PERCENT IN LABOR FORCE
10.7%
UNEMPLOYMENT RATE
Income in Kent
Income Overview in Kent
Per Capita Income in Kent is $27,506, while median incomes of families and households are $97,250 and $37,505 respectively.
| Characteristic | Number | Measure |
| Per Capita Income | 27,336 | $27,506 |
| Median Family Income | 4,526 | $97,250 |
| Mean Family Income | 4,526 | $100,435 |
| Median Household Income | 10,225 | $37,505 |
| Mean Household Income | 10,225 | $67,640 |
| Income Deficit | 4,526 | $0 |
| Wage / Income Gap (%) | 27,336 | 52.24% |
| Wage / Income Gap ($) | 27,336 | 47.76¢ per $1 |
| Gini / Inequality Index | 27,336 | 0.53 |
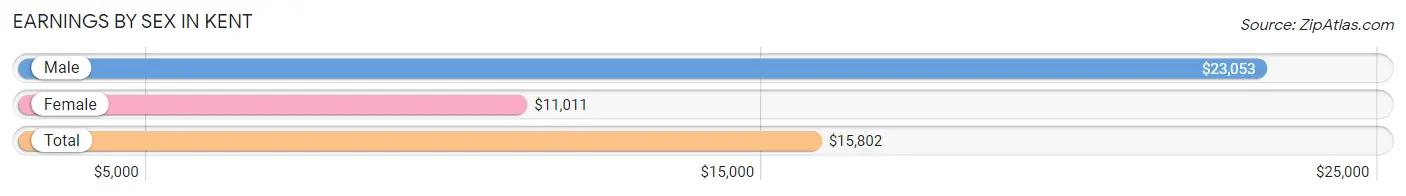
Earnings by Sex in Kent
Average Earnings in Kent are $15,802, $23,053 for men and $11,011 for women, a difference of 52.2%.
| Sex | Number | Average Earnings |
| Male | 8,865 (48.4%) | $23,053 |
| Female | 9,442 (51.6%) | $11,011 |
| Total | 18,307 (100.0%) | $15,802 |
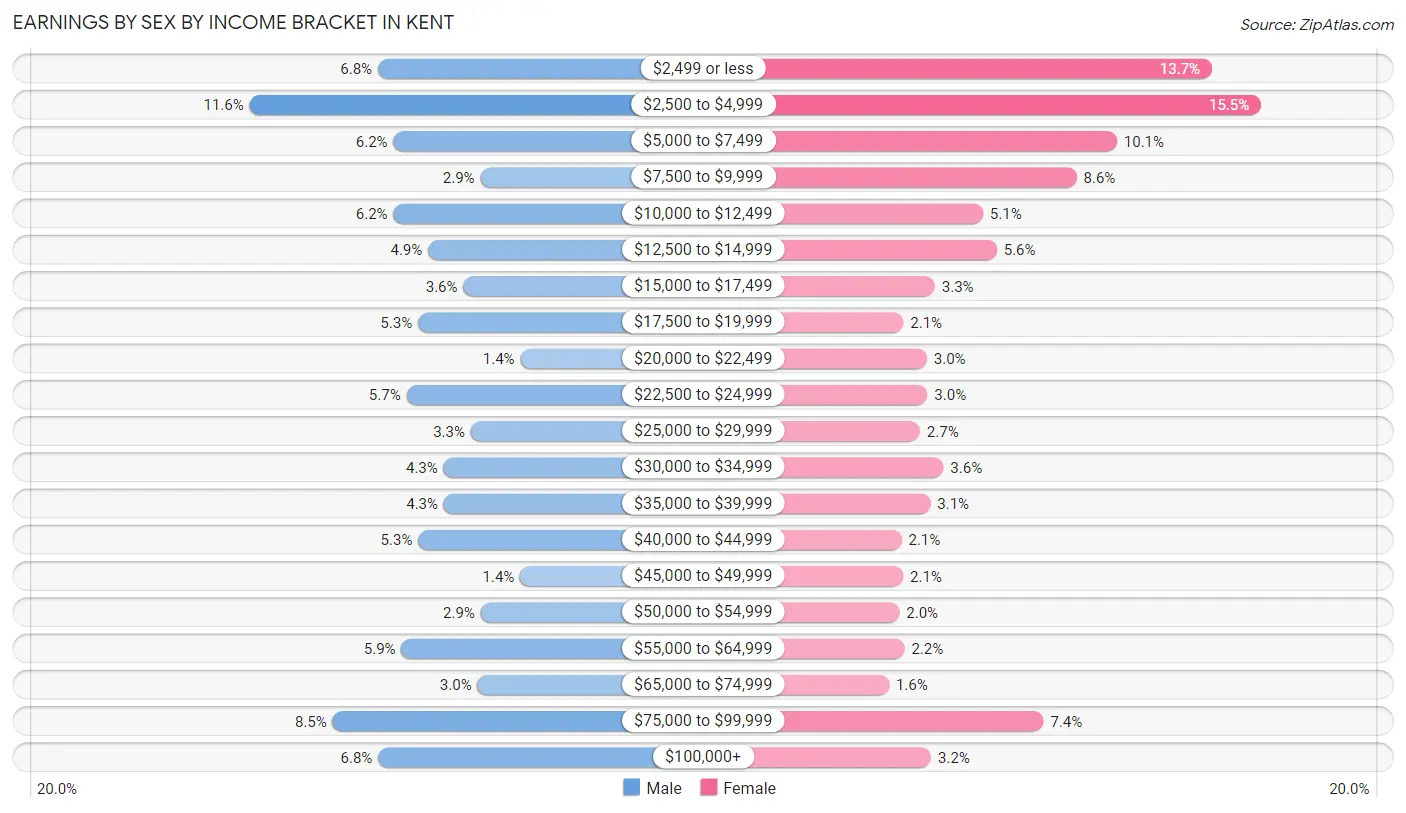
Earnings by Sex by Income Bracket in Kent
The most common earnings brackets in Kent are $2,500 to $4,999 for men (1,026 | 11.6%) and $2,500 to $4,999 for women (1,465 | 15.5%).
| Income | Male | Female |
| $2,499 or less | 599 (6.8%) | 1,292 (13.7%) |
| $2,500 to $4,999 | 1,026 (11.6%) | 1,465 (15.5%) |
| $5,000 to $7,499 | 548 (6.2%) | 956 (10.1%) |
| $7,500 to $9,999 | 259 (2.9%) | 813 (8.6%) |
| $10,000 to $12,499 | 548 (6.2%) | 482 (5.1%) |
| $12,500 to $14,999 | 433 (4.9%) | 531 (5.6%) |
| $15,000 to $17,499 | 316 (3.6%) | 312 (3.3%) |
| $17,500 to $19,999 | 466 (5.3%) | 200 (2.1%) |
| $20,000 to $22,499 | 126 (1.4%) | 283 (3.0%) |
| $22,500 to $24,999 | 504 (5.7%) | 285 (3.0%) |
| $25,000 to $29,999 | 291 (3.3%) | 259 (2.7%) |
| $30,000 to $34,999 | 381 (4.3%) | 342 (3.6%) |
| $35,000 to $39,999 | 380 (4.3%) | 296 (3.1%) |
| $40,000 to $44,999 | 465 (5.2%) | 194 (2.1%) |
| $45,000 to $49,999 | 127 (1.4%) | 199 (2.1%) |
| $50,000 to $54,999 | 258 (2.9%) | 186 (2.0%) |
| $55,000 to $64,999 | 521 (5.9%) | 204 (2.2%) |
| $65,000 to $74,999 | 269 (3.0%) | 149 (1.6%) |
| $75,000 to $99,999 | 750 (8.5%) | 696 (7.4%) |
| $100,000+ | 598 (6.8%) | 298 (3.2%) |
| Total | 8,865 (100.0%) | 9,442 (100.0%) |
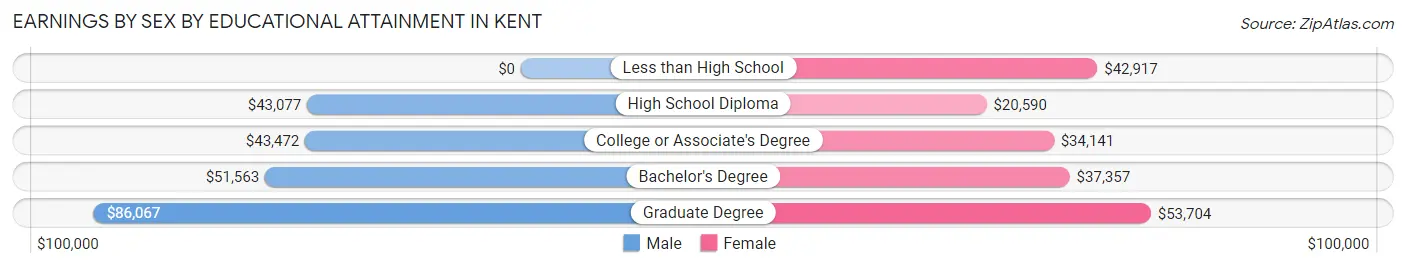
Earnings by Sex by Educational Attainment in Kent
Average earnings in Kent are $44,820 for men and $35,196 for women, a difference of 21.5%. Men with an educational attainment of graduate degree enjoy the highest average annual earnings of $86,067, while those with high school diploma education earn the least with $43,077. Women with an educational attainment of graduate degree earn the most with the average annual earnings of $53,704, while those with high school diploma education have the smallest earnings of $20,590.
| Educational Attainment | Male Income | Female Income |
| Less than High School | - | - |
| High School Diploma | $43,077 | $20,590 |
| College or Associate's Degree | $43,472 | $34,141 |
| Bachelor's Degree | $51,563 | $37,357 |
| Graduate Degree | $86,067 | $53,704 |
| Total | $44,820 | $35,196 |
Family Income in Kent
Family Income Brackets in Kent
According to the Kent family income data, there are 1,421 families falling into the $100,000 to $149,999 income range, which is the most common income bracket and makes up 31.4% of all families. Conversely, the less than $10,000 income bracket is the least frequent group with only 217 families (4.8%) belonging to this category.
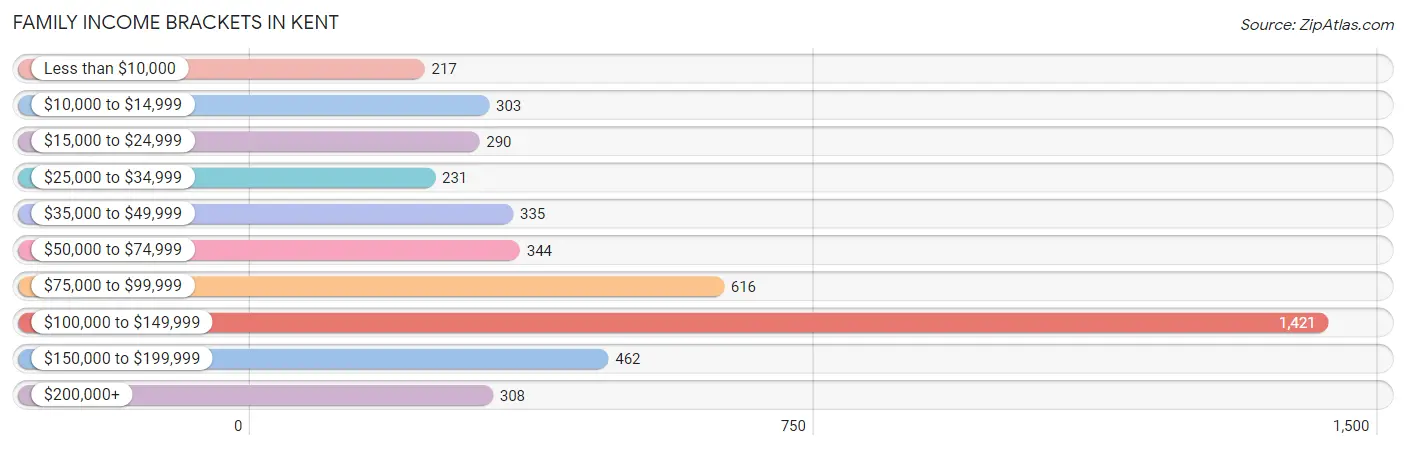
| Income Bracket | # Families | % Families |
| Less than $10,000 | 217 | 4.8% |
| $10,000 to $14,999 | 303 | 6.7% |
| $15,000 to $24,999 | 290 | 6.4% |
| $25,000 to $34,999 | 231 | 5.1% |
| $35,000 to $49,999 | 335 | 7.4% |
| $50,000 to $74,999 | 344 | 7.6% |
| $75,000 to $99,999 | 616 | 13.6% |
| $100,000 to $149,999 | 1,421 | 31.4% |
| $150,000 to $199,999 | 462 | 10.2% |
| $200,000+ | 308 | 6.8% |
Family Income by Famaliy Size in Kent
4-person families (832 | 18.4%) account for the highest median family income in Kent with $140,249 per family, while 2-person families (2,364 | 52.2%) have the highest median income of $42,728 per family member.
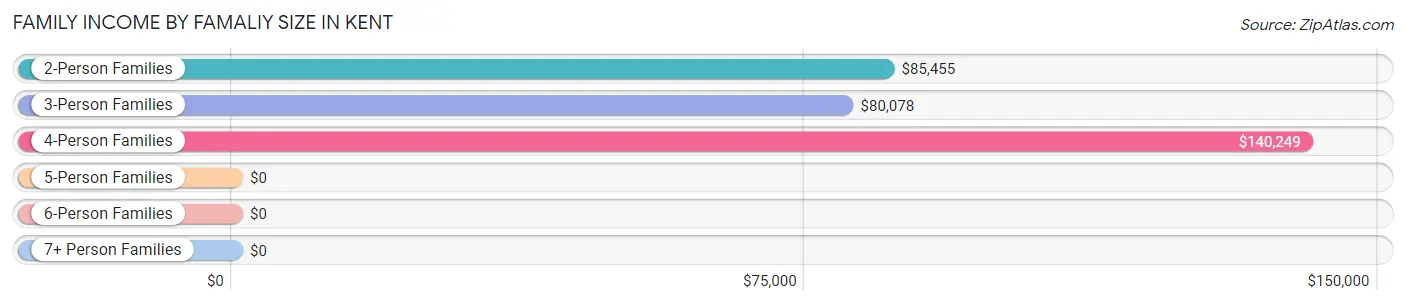
| Income Bracket | # Families | Median Income |
| 2-Person Families | 2,364 (52.2%) | $85,455 |
| 3-Person Families | 977 (21.6%) | $80,078 |
| 4-Person Families | 832 (18.4%) | $140,249 |
| 5-Person Families | 249 (5.5%) | $0 |
| 6-Person Families | 18 (0.4%) | $0 |
| 7+ Person Families | 86 (1.9%) | $0 |
| Total | 4,526 (100.0%) | $97,250 |
Family Income by Number of Earners in Kent
The median family income in Kent is $97,250, with families comprising 3+ earners (361) having the highest median family income of $132,986, while families with no earners (506) have the lowest median family income of $26,269, accounting for 8.0% and 11.2% of families, respectively.
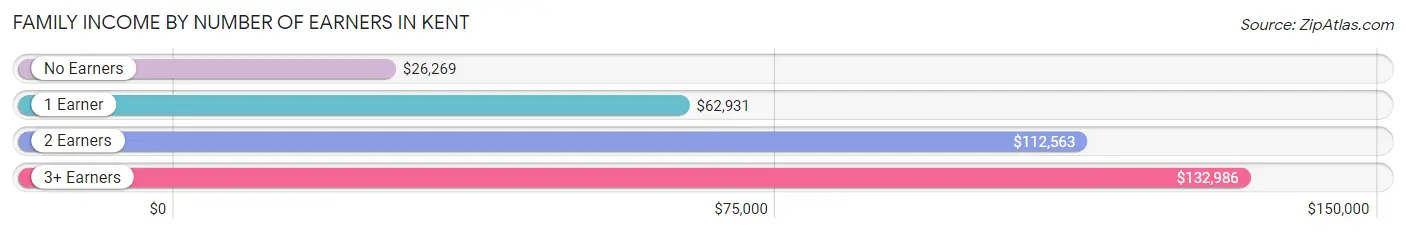
| Number of Earners | # Families | Median Income |
| No Earners | 506 (11.2%) | $26,269 |
| 1 Earner | 1,540 (34.0%) | $62,931 |
| 2 Earners | 2,119 (46.8%) | $112,563 |
| 3+ Earners | 361 (8.0%) | $132,986 |
| Total | 4,526 (100.0%) | $97,250 |
Household Income in Kent
Household Income Brackets in Kent
With 1,472 households falling in the category, the $100,000 to $149,999 income range is the most frequent in Kent, accounting for 14.4% of all households. In contrast, only 532 households (5.2%) fall into the $150,000 to $199,999 income bracket, making it the least populous group.
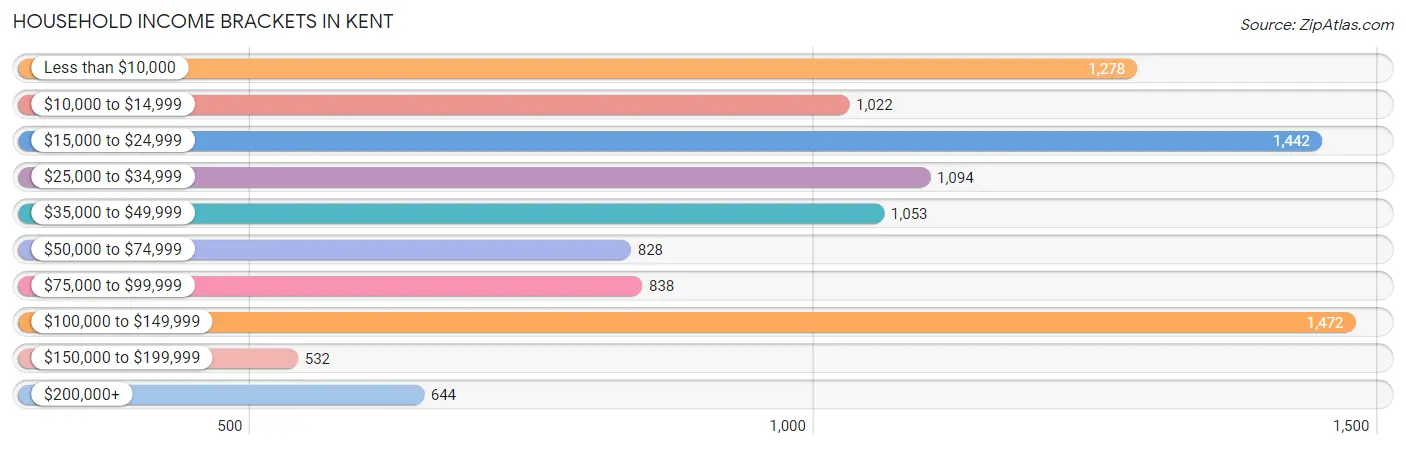
| Income Bracket | # Households | % Households |
| Less than $10,000 | 1,278 | 12.5% |
| $10,000 to $14,999 | 1,022 | 10.0% |
| $15,000 to $24,999 | 1,442 | 14.1% |
| $25,000 to $34,999 | 1,094 | 10.7% |
| $35,000 to $49,999 | 1,053 | 10.3% |
| $50,000 to $74,999 | 828 | 8.1% |
| $75,000 to $99,999 | 838 | 8.2% |
| $100,000 to $149,999 | 1,472 | 14.4% |
| $150,000 to $199,999 | 532 | 5.2% |
| $200,000+ | 644 | 6.3% |
Household Income by Householder Age in Kent
The median household income in Kent is $37,505, with the highest median household income of $77,000 found in the 45 to 64 years age bracket for the primary householder. A total of 2,564 households (25.1%) fall into this category. Meanwhile, the 15 to 24 years age bracket for the primary householder has the lowest median household income of $18,470, with 2,243 households (21.9%) in this group.
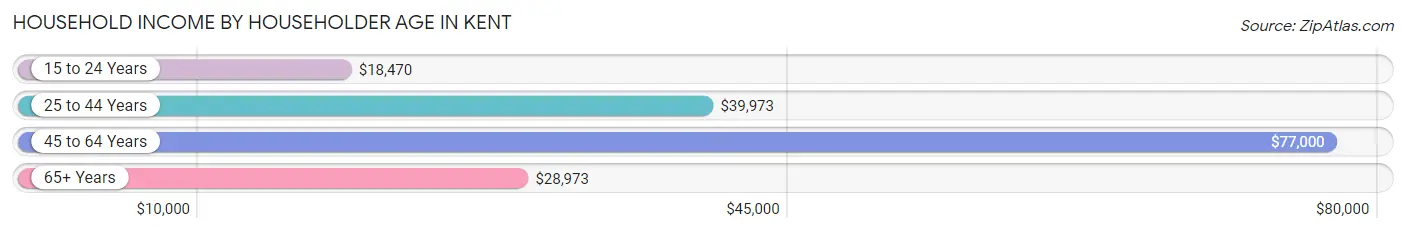
| Income Bracket | # Households | Median Income |
| 15 to 24 Years | 2,243 (21.9%) | $18,470 |
| 25 to 44 Years | 3,466 (33.9%) | $39,973 |
| 45 to 64 Years | 2,564 (25.1%) | $77,000 |
| 65+ Years | 1,952 (19.1%) | $28,973 |
| Total | 10,225 (100.0%) | $37,505 |
Poverty in Kent
Income Below Poverty by Sex and Age in Kent
With 24.4% poverty level for males and 26.6% for females among the residents of Kent, 18 to 24 year old males and 18 to 24 year old females are the most vulnerable to poverty, with 1,238 males (40.0%) and 1,477 females (58.7%) in their respective age groups living below the poverty level.
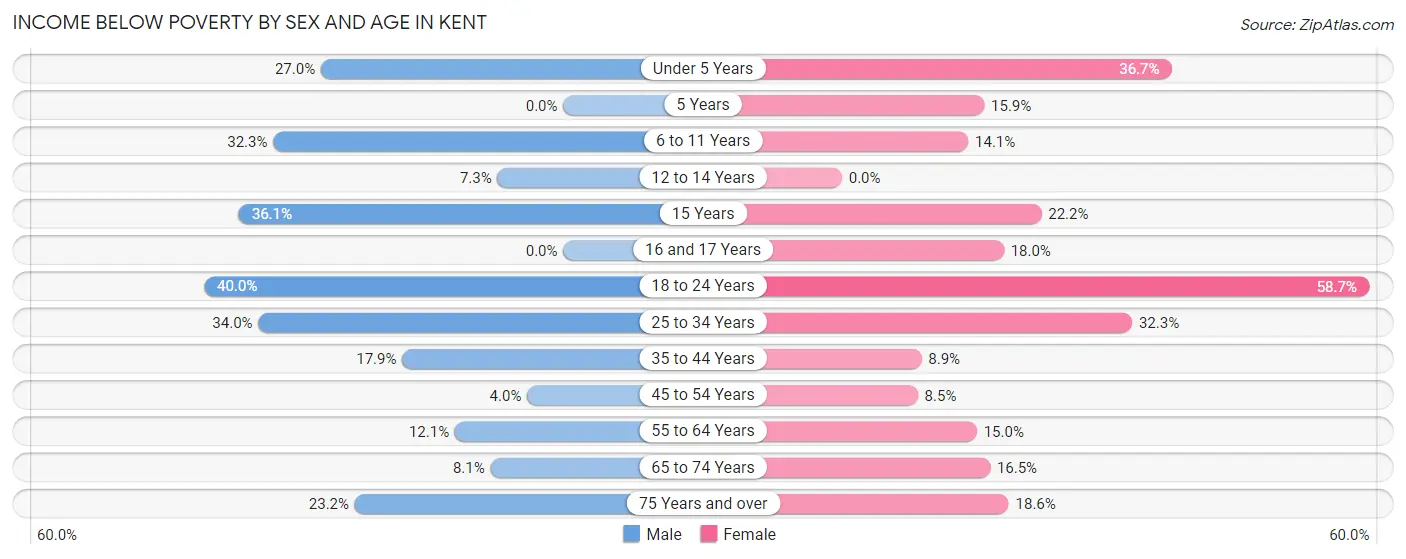
| Age Bracket | Male | Female |
| Under 5 Years | 105 (27.0%) | 160 (36.7%) |
| 5 Years | 0 (0.0%) | 52 (15.9%) |
| 6 to 11 Years | 188 (32.3%) | 101 (14.1%) |
| 12 to 14 Years | 28 (7.3%) | 0 (0.0%) |
| 15 Years | 30 (36.1%) | 6 (22.2%) |
| 16 and 17 Years | 0 (0.0%) | 42 (18.0%) |
| 18 to 24 Years | 1,238 (40.0%) | 1,477 (58.7%) |
| 25 to 34 Years | 520 (34.0%) | 456 (32.3%) |
| 35 to 44 Years | 218 (17.9%) | 123 (8.9%) |
| 45 to 54 Years | 43 (4.0%) | 79 (8.5%) |
| 55 to 64 Years | 119 (12.1%) | 167 (15.0%) |
| 65 to 74 Years | 77 (8.1%) | 164 (16.5%) |
| 75 Years and over | 62 (23.2%) | 123 (18.6%) |
| Total | 2,628 (24.4%) | 2,950 (26.6%) |
Income Above Poverty by Sex and Age in Kent
According to the poverty statistics in Kent, males aged 5 years and females aged 12 to 14 years are the age groups that are most secure financially, with 100.0% of males and 100.0% of females in these age groups living above the poverty line.
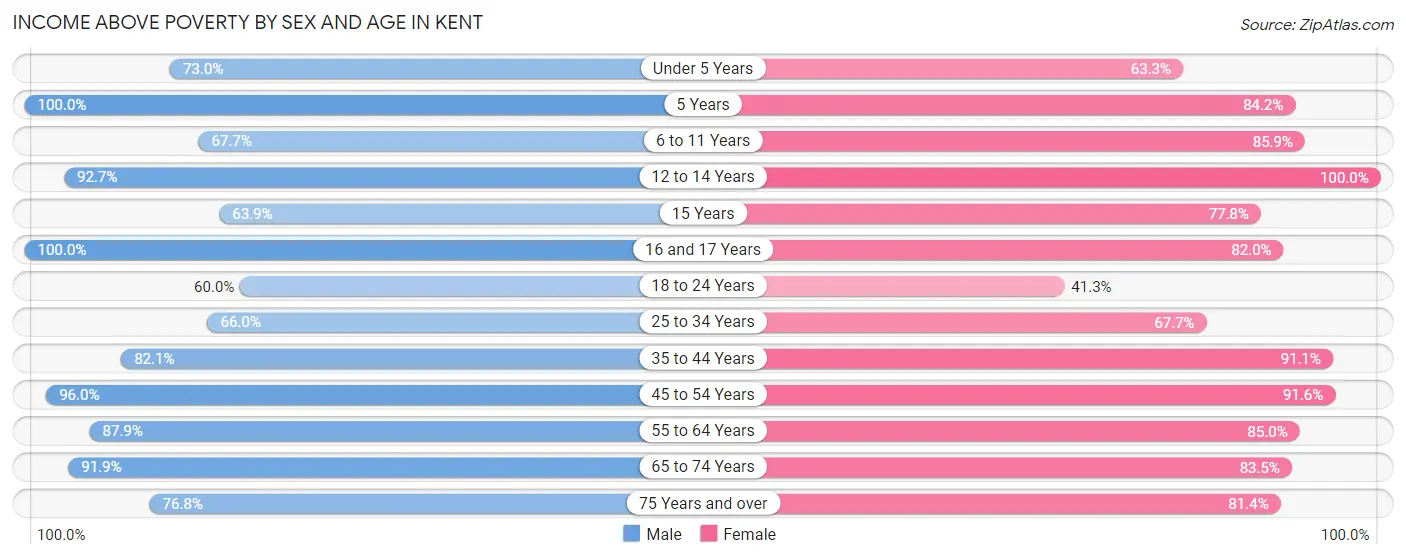
| Age Bracket | Male | Female |
| Under 5 Years | 284 (73.0%) | 276 (63.3%) |
| 5 Years | 41 (100.0%) | 276 (84.2%) |
| 6 to 11 Years | 394 (67.7%) | 617 (85.9%) |
| 12 to 14 Years | 354 (92.7%) | 312 (100.0%) |
| 15 Years | 53 (63.9%) | 21 (77.8%) |
| 16 and 17 Years | 172 (100.0%) | 191 (82.0%) |
| 18 to 24 Years | 1,856 (60.0%) | 1,040 (41.3%) |
| 25 to 34 Years | 1,011 (66.0%) | 955 (67.7%) |
| 35 to 44 Years | 997 (82.1%) | 1,266 (91.1%) |
| 45 to 54 Years | 1,026 (96.0%) | 856 (91.5%) |
| 55 to 64 Years | 867 (87.9%) | 944 (85.0%) |
| 65 to 74 Years | 872 (91.9%) | 830 (83.5%) |
| 75 Years and over | 205 (76.8%) | 539 (81.4%) |
| Total | 8,132 (75.6%) | 8,123 (73.4%) |
Income Below Poverty Among Married-Couple Families in Kent
The poverty statistics for married-couple families in Kent show that 3.6% or 108 of the total 3,006 families live below the poverty line. Families with 3 or 4 children have the highest poverty rate of 6.5%, comprising of 13 families. On the other hand, families with 5 or more children have the lowest poverty rate of 0.0%, which includes 0 families.
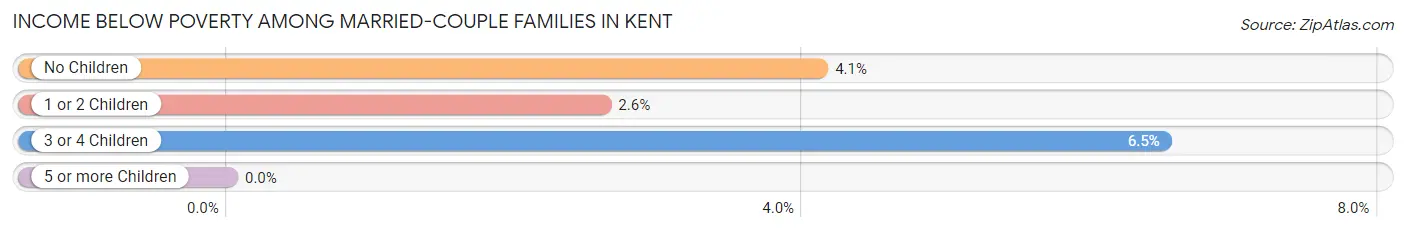
| Children | Above Poverty | Below Poverty |
| No Children | 1,540 (95.9%) | 66 (4.1%) |
| 1 or 2 Children | 1,085 (97.4%) | 29 (2.6%) |
| 3 or 4 Children | 187 (93.5%) | 13 (6.5%) |
| 5 or more Children | 86 (100.0%) | 0 (0.0%) |
| Total | 2,898 (96.4%) | 108 (3.6%) |
Income Below Poverty Among Single-Parent Households in Kent
According to the poverty data in Kent, 23.5% or 70 single-father households and 40.7% or 497 single-mother households are living below the poverty line. Among single-father households, those with no children have the highest poverty rate, with 54 households (26.5%) experiencing poverty. Likewise, among single-mother households, those with 3 or 4 children have the highest poverty rate, with 46 households (83.6%) falling below the poverty line.
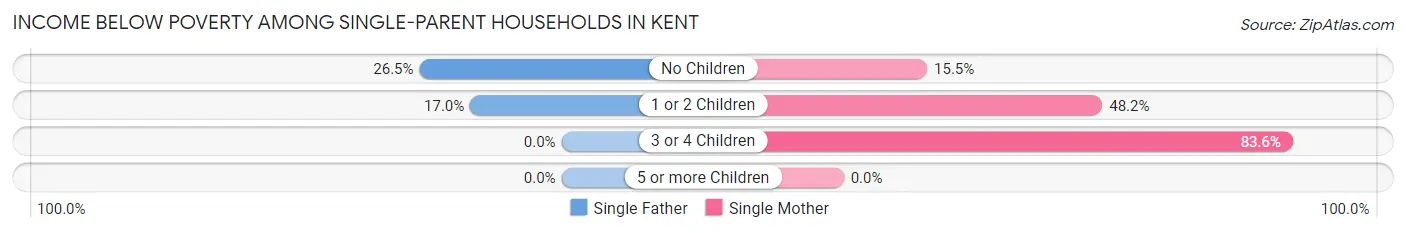
| Children | Single Father | Single Mother |
| No Children | 54 (26.5%) | 53 (15.5%) |
| 1 or 2 Children | 16 (17.0%) | 398 (48.2%) |
| 3 or 4 Children | 0 (0.0%) | 46 (83.6%) |
| 5 or more Children | 0 (0.0%) | 0 (0.0%) |
| Total | 70 (23.5%) | 497 (40.7%) |
Income Below Poverty Among Married-Couple vs Single-Parent Households in Kent
The poverty data for Kent shows that 108 of the married-couple family households (3.6%) and 567 of the single-parent households (37.3%) are living below the poverty level. Within the married-couple family households, those with 3 or 4 children have the highest poverty rate, with 13 households (6.5%) falling below the poverty line. Among the single-parent households, those with 3 or 4 children have the highest poverty rate, with 46 household (83.6%) living below poverty.
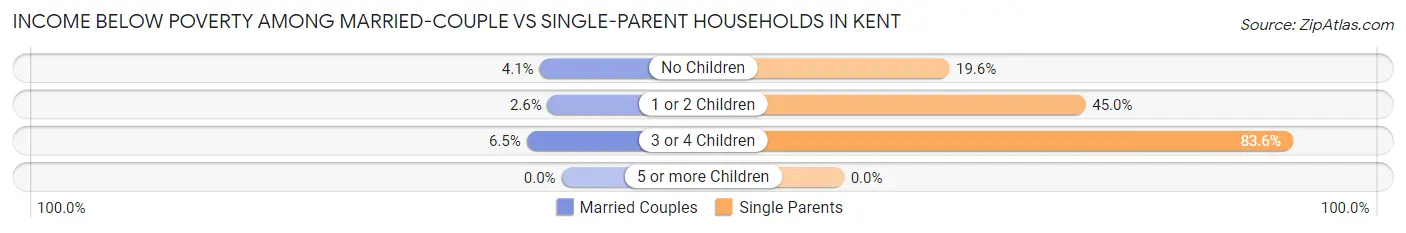
| Children | Married-Couple Families | Single-Parent Households |
| No Children | 66 (4.1%) | 107 (19.6%) |
| 1 or 2 Children | 29 (2.6%) | 414 (45.0%) |
| 3 or 4 Children | 13 (6.5%) | 46 (83.6%) |
| 5 or more Children | 0 (0.0%) | 0 (0.0%) |
| Total | 108 (3.6%) | 567 (37.3%) |
Race in Kent
The most populous races in Kent are White / Caucasian (22,244 | 81.4%), Black / African American (2,397 | 8.8%), and Two or more Races (1,733 | 6.3%).
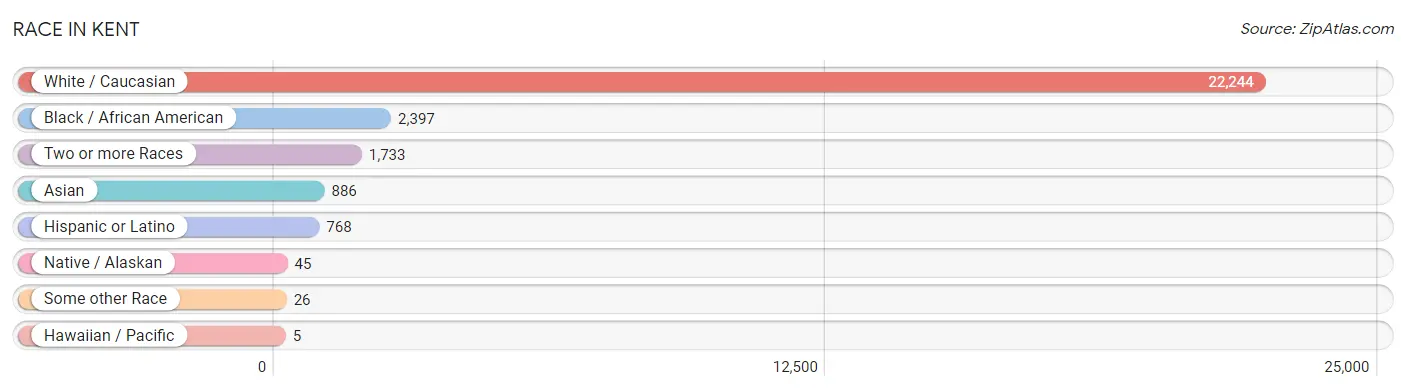
| Race | # Population | % Population |
| Asian | 886 | 3.2% |
| Black / African American | 2,397 | 8.8% |
| Hawaiian / Pacific | 5 | 0.0% |
| Hispanic or Latino | 768 | 2.8% |
| Native / Alaskan | 45 | 0.2% |
| White / Caucasian | 22,244 | 81.4% |
| Two or more Races | 1,733 | 6.3% |
| Some other Race | 26 | 0.1% |
| Total | 27,336 | 100.0% |
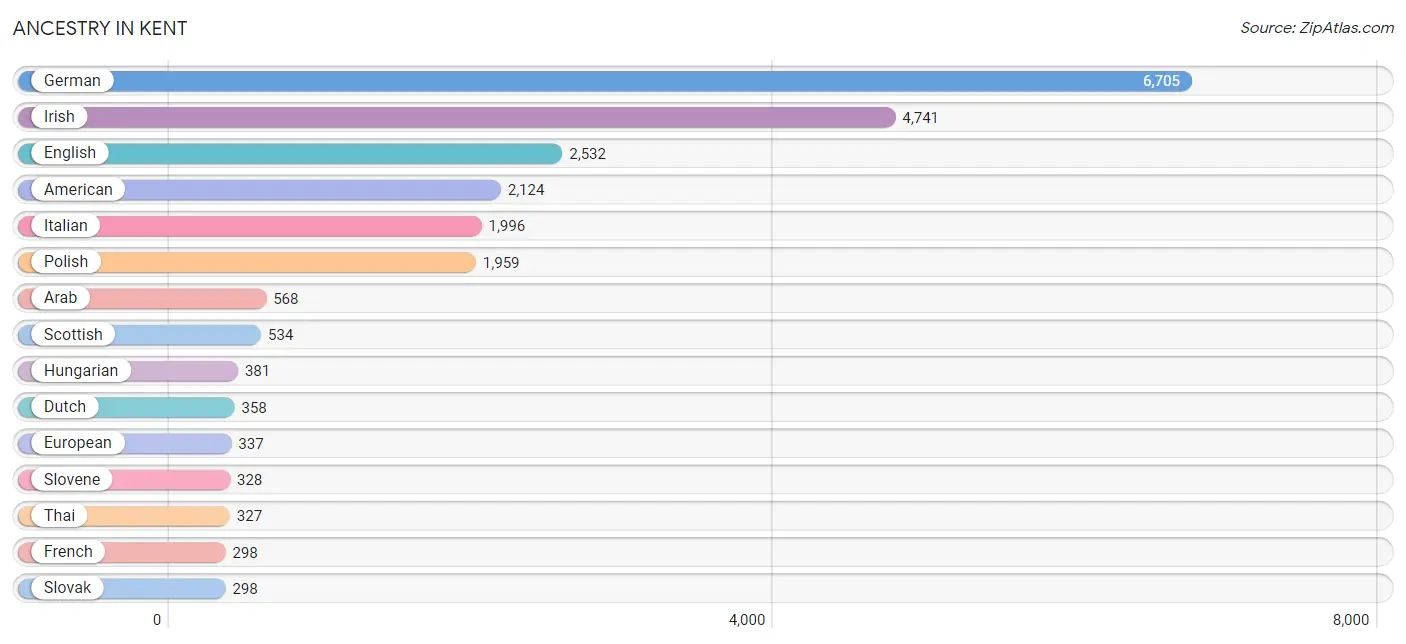
Ancestry in Kent
The most populous ancestries reported in Kent are German (6,705 | 24.5%), Irish (4,741 | 17.3%), English (2,532 | 9.3%), American (2,124 | 7.8%), and Italian (1,996 | 7.3%), together accounting for 66.2% of all Kent residents.
| Ancestry | # Population | % Population |
| African | 72 | 0.3% |
| Albanian | 4 | 0.0% |
| American | 2,124 | 7.8% |
| Apache | 2 | 0.0% |
| Arab | 568 | 2.1% |
| Argentinean | 16 | 0.1% |
| Armenian | 29 | 0.1% |
| Austrian | 32 | 0.1% |
| Belgian | 34 | 0.1% |
| Bhutanese | 128 | 0.5% |
| Blackfeet | 272 | 1.0% |
| Brazilian | 27 | 0.1% |
| British | 105 | 0.4% |
| Bulgarian | 11 | 0.0% |
| Burmese | 29 | 0.1% |
| Central American | 64 | 0.2% |
| Cherokee | 258 | 0.9% |
| Costa Rican | 5 | 0.0% |
| Croatian | 29 | 0.1% |
| Cuban | 183 | 0.7% |
| Czech | 150 | 0.5% |
| Czechoslovakian | 246 | 0.9% |
| Danish | 24 | 0.1% |
| Dutch | 358 | 1.3% |
| Eastern European | 50 | 0.2% |
| Egyptian | 105 | 0.4% |
| English | 2,532 | 9.3% |
| European | 337 | 1.2% |
| Finnish | 95 | 0.4% |
| French | 298 | 1.1% |
| French Canadian | 143 | 0.5% |
| German | 6,705 | 24.5% |
| Ghanaian | 11 | 0.0% |
| Greek | 116 | 0.4% |
| Hungarian | 381 | 1.4% |
| Indian (Asian) | 278 | 1.0% |
| Iranian | 27 | 0.1% |
| Irish | 4,741 | 17.3% |
| Italian | 1,996 | 7.3% |
| Jamaican | 18 | 0.1% |
| Jordanian | 78 | 0.3% |
| Korean | 153 | 0.6% |
| Latvian | 4 | 0.0% |
| Lebanese | 10 | 0.0% |
| Lithuanian | 34 | 0.1% |
| Mexican | 217 | 0.8% |
| Moroccan | 16 | 0.1% |
| Native Hawaiian | 16 | 0.1% |
| Nicaraguan | 49 | 0.2% |
| Nigerian | 63 | 0.2% |
| Norwegian | 168 | 0.6% |
| Pakistani | 28 | 0.1% |
| Panamanian | 10 | 0.0% |
| Pennsylvania German | 8 | 0.0% |
| Polish | 1,959 | 7.2% |
| Puerto Rican | 200 | 0.7% |
| Romanian | 88 | 0.3% |
| Russian | 176 | 0.6% |
| Scotch-Irish | 232 | 0.9% |
| Scottish | 534 | 1.9% |
| Serbian | 16 | 0.1% |
| Slovak | 298 | 1.1% |
| Slovene | 328 | 1.2% |
| South American | 16 | 0.1% |
| Soviet Union | 5 | 0.0% |
| Spanish | 74 | 0.3% |
| Sri Lankan | 71 | 0.3% |
| Subsaharan African | 150 | 0.5% |
| Swedish | 124 | 0.4% |
| Swiss | 114 | 0.4% |
| Syrian | 5 | 0.0% |
| Thai | 327 | 1.2% |
| Trinidadian and Tobagonian | 5 | 0.0% |
| Ukrainian | 162 | 0.6% |
| Vietnamese | 34 | 0.1% |
| Welsh | 179 | 0.6% |
| West Indian | 57 | 0.2% | View All 77 Rows |
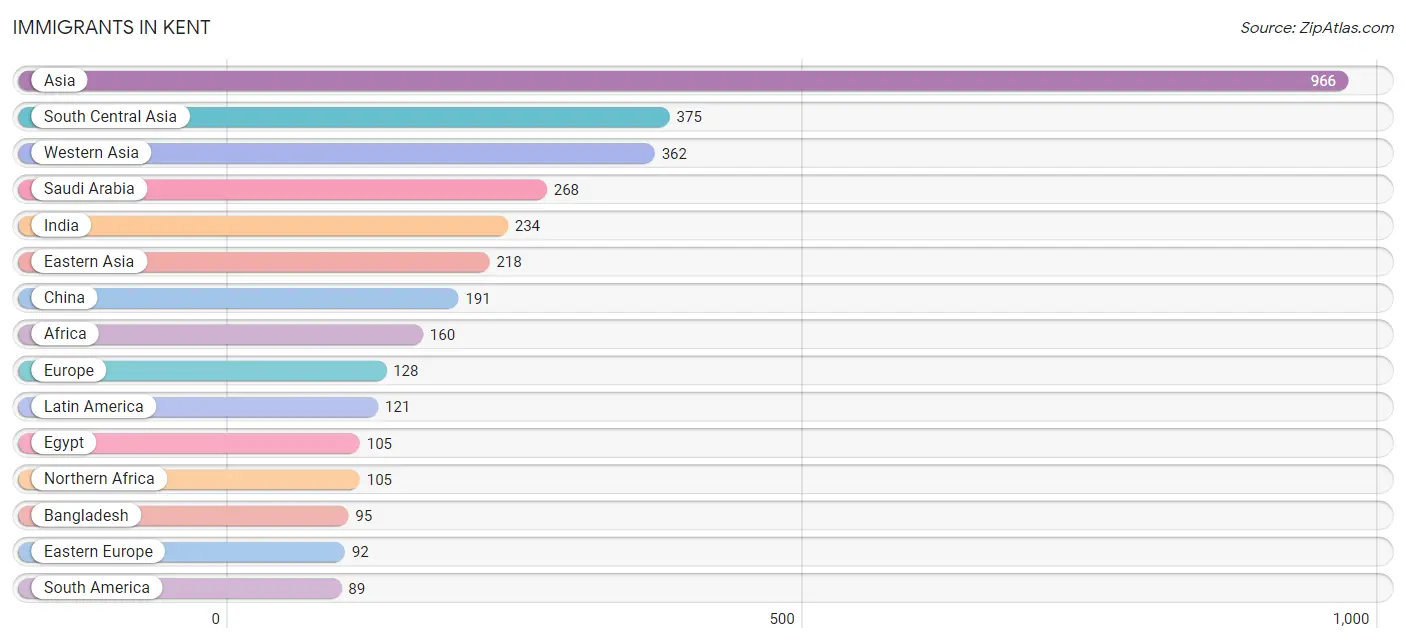
Immigrants in Kent
The most numerous immigrant groups reported in Kent came from Asia (966 | 3.5%), South Central Asia (375 | 1.4%), Western Asia (362 | 1.3%), Saudi Arabia (268 | 1.0%), and India (234 | 0.9%), together accounting for 8.1% of all Kent residents.
| Immigration Origin | # Population | % Population |
| Africa | 160 | 0.6% |
| Argentina | 5 | 0.0% |
| Asia | 966 | 3.5% |
| Bahamas | 5 | 0.0% |
| Bangladesh | 95 | 0.4% |
| Brazil | 27 | 0.1% |
| Canada | 61 | 0.2% |
| Caribbean | 32 | 0.1% |
| China | 191 | 0.7% |
| Czechoslovakia | 6 | 0.0% |
| Eastern Africa | 10 | 0.0% |
| Eastern Asia | 218 | 0.8% |
| Eastern Europe | 92 | 0.3% |
| Ecuador | 57 | 0.2% |
| Egypt | 105 | 0.4% |
| England | 15 | 0.1% |
| Europe | 128 | 0.5% |
| Germany | 21 | 0.1% |
| Ghana | 30 | 0.1% |
| India | 234 | 0.9% |
| Iran | 27 | 0.1% |
| Jamaica | 14 | 0.1% |
| Japan | 22 | 0.1% |
| Jordan | 78 | 0.3% |
| Korea | 5 | 0.0% |
| Latin America | 121 | 0.4% |
| Nigeria | 9 | 0.0% |
| Northern Africa | 105 | 0.4% |
| Northern Europe | 15 | 0.1% |
| Poland | 19 | 0.1% |
| Russia | 67 | 0.3% |
| Saudi Arabia | 268 | 1.0% |
| South America | 89 | 0.3% |
| South Central Asia | 375 | 1.4% |
| South Eastern Asia | 11 | 0.0% |
| Sri Lanka | 19 | 0.1% |
| Syria | 16 | 0.1% |
| Trinidad and Tobago | 13 | 0.1% |
| Vietnam | 11 | 0.0% |
| Western Africa | 39 | 0.1% |
| Western Asia | 362 | 1.3% |
| Western Europe | 21 | 0.1% | View All 42 Rows |
Sex and Age in Kent
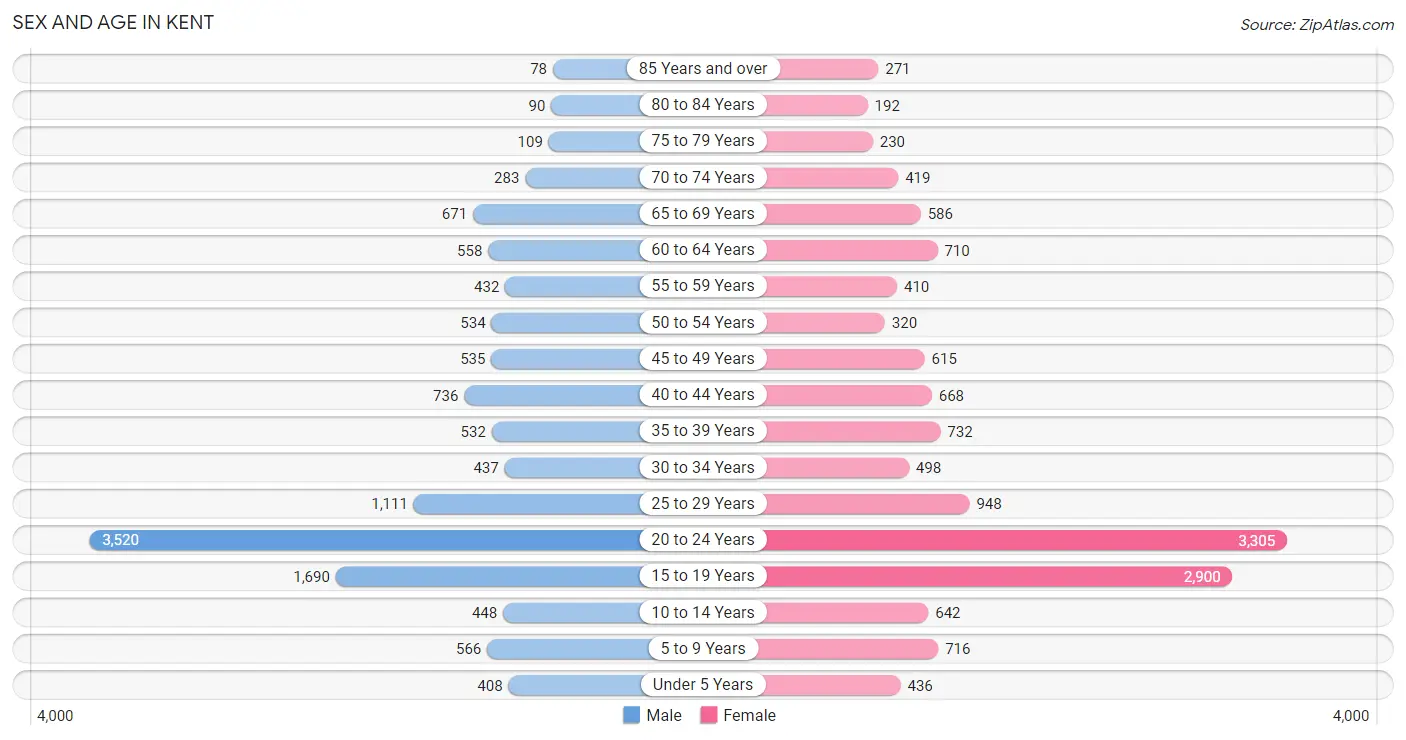
Sex and Age in Kent
The most populous age groups in Kent are 20 to 24 Years (3,520 | 27.6%) for men and 20 to 24 Years (3,305 | 22.6%) for women.
| Age Bracket | Male | Female |
| Under 5 Years | 408 (3.2%) | 436 (3.0%) |
| 5 to 9 Years | 566 (4.4%) | 716 (4.9%) |
| 10 to 14 Years | 448 (3.5%) | 642 (4.4%) |
| 15 to 19 Years | 1,690 (13.3%) | 2,900 (19.9%) |
| 20 to 24 Years | 3,520 (27.6%) | 3,305 (22.6%) |
| 25 to 29 Years | 1,111 (8.7%) | 948 (6.5%) |
| 30 to 34 Years | 437 (3.4%) | 498 (3.4%) |
| 35 to 39 Years | 532 (4.2%) | 732 (5.0%) |
| 40 to 44 Years | 736 (5.8%) | 668 (4.6%) |
| 45 to 49 Years | 535 (4.2%) | 615 (4.2%) |
| 50 to 54 Years | 534 (4.2%) | 320 (2.2%) |
| 55 to 59 Years | 432 (3.4%) | 410 (2.8%) |
| 60 to 64 Years | 558 (4.4%) | 710 (4.9%) |
| 65 to 69 Years | 671 (5.3%) | 586 (4.0%) |
| 70 to 74 Years | 283 (2.2%) | 419 (2.9%) |
| 75 to 79 Years | 109 (0.9%) | 230 (1.6%) |
| 80 to 84 Years | 90 (0.7%) | 192 (1.3%) |
| 85 Years and over | 78 (0.6%) | 271 (1.9%) |
| Total | 12,738 (100.0%) | 14,598 (100.0%) |
Families and Households in Kent
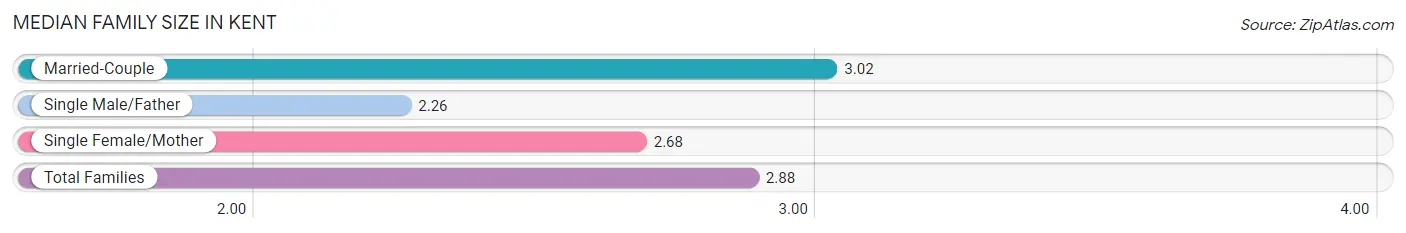
Median Family Size in Kent
The median family size in Kent is 2.88 persons per family, with married-couple families (3,006 | 66.4%) accounting for the largest median family size of 3.02 persons per family. On the other hand, single male/father families (298 | 6.6%) represent the smallest median family size with 2.26 persons per family.
| Family Type | # Families | Family Size |
| Married-Couple | 3,006 (66.4%) | 3.02 |
| Single Male/Father | 298 (6.6%) | 2.26 |
| Single Female/Mother | 1,222 (27.0%) | 2.68 |
| Total Families | 4,526 (100.0%) | 2.88 |
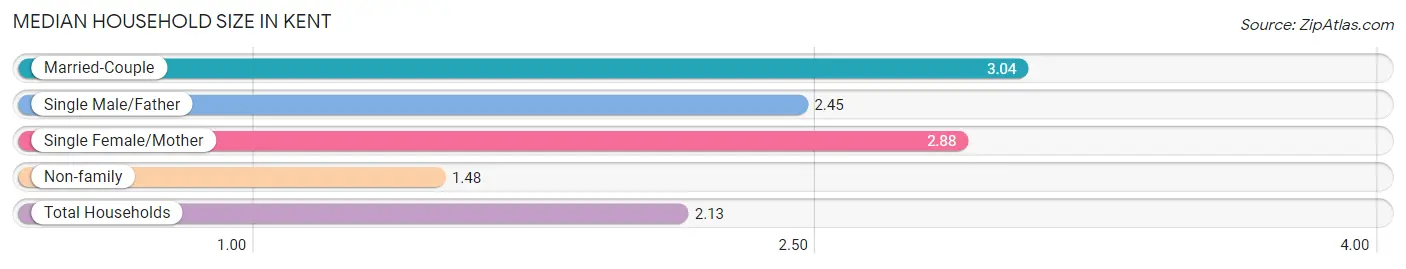
Median Household Size in Kent
The median household size in Kent is 2.13 persons per household, with married-couple households (3,006 | 29.4%) accounting for the largest median household size of 3.04 persons per household. non-family households (5,699 | 55.7%) represent the smallest median household size with 1.48 persons per household.
| Household Type | # Households | Household Size |
| Married-Couple | 3,006 (29.4%) | 3.04 |
| Single Male/Father | 298 (2.9%) | 2.45 |
| Single Female/Mother | 1,222 (11.9%) | 2.88 |
| Non-family | 5,699 (55.7%) | 1.48 |
| Total Households | 10,225 (100.0%) | 2.13 |
Household Size by Marriage Status in Kent
Out of a total of 10,225 households in Kent, 4,526 (44.3%) are family households, while 5,699 (55.7%) are nonfamily households. The most numerous type of family households are 2-person households, comprising 2,194, and the most common type of nonfamily households are 1-person households, comprising 4,290.
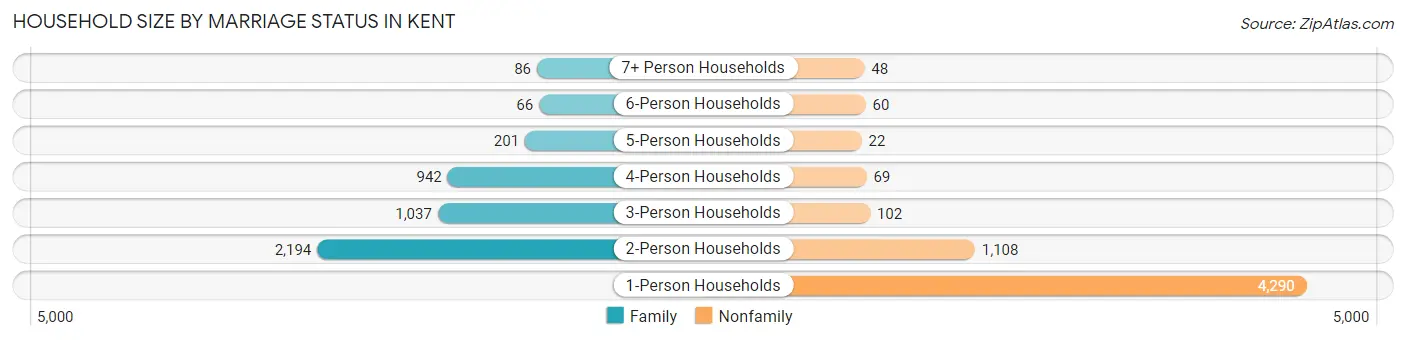
| Household Size | Family Households | Nonfamily Households |
| 1-Person Households | - | 4,290 (42.0%) |
| 2-Person Households | 2,194 (21.5%) | 1,108 (10.8%) |
| 3-Person Households | 1,037 (10.1%) | 102 (1.0%) |
| 4-Person Households | 942 (9.2%) | 69 (0.7%) |
| 5-Person Households | 201 (2.0%) | 22 (0.2%) |
| 6-Person Households | 66 (0.6%) | 60 (0.6%) |
| 7+ Person Households | 86 (0.8%) | 48 (0.5%) |
| Total | 4,526 (44.3%) | 5,699 (55.7%) |
Female Fertility in Kent
Fertility by Age in Kent
Average fertility rate in Kent is 11.0 births per 1,000 women. Women in the age bracket of 20 to 34 years have the highest fertility rate with 23.0 births per 1,000 women. Women in the age bracket of 20 to 34 years acount for 100.0% of all women with births.
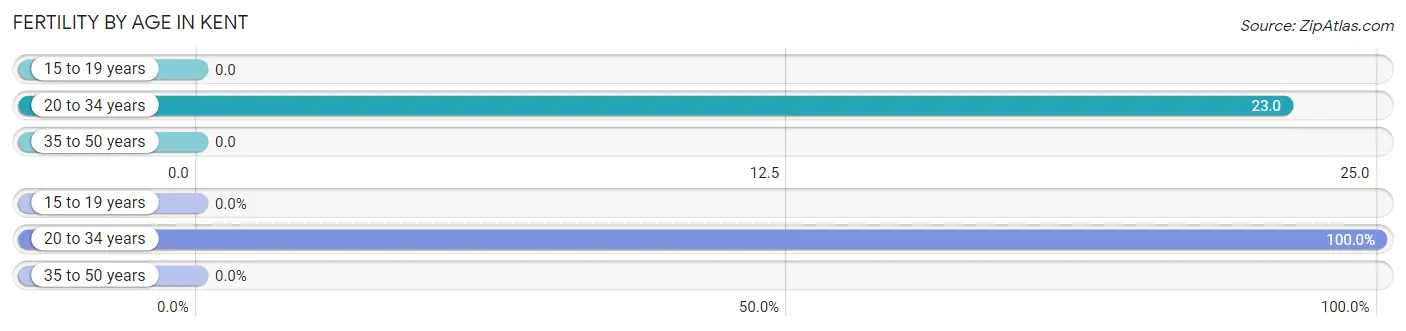
| Age Bracket | Women with Births | Births / 1,000 Women |
| 15 to 19 years | 0 (0.0%) | 0.0 |
| 20 to 34 years | 109 (100.0%) | 23.0 |
| 35 to 50 years | 0 (0.0%) | 0.0 |
| Total | 109 (100.0%) | 11.0 |
Fertility by Age by Marriage Status in Kent
26.6% of women with births (109) in Kent are married. The highest percentage of unmarried women with births falls into 20 to 34 years age bracket with 73.4% of them unmarried at the time of birth, while the lowest percentage of unmarried women with births belong to 20 to 34 years age bracket with 73.4% of them unmarried.
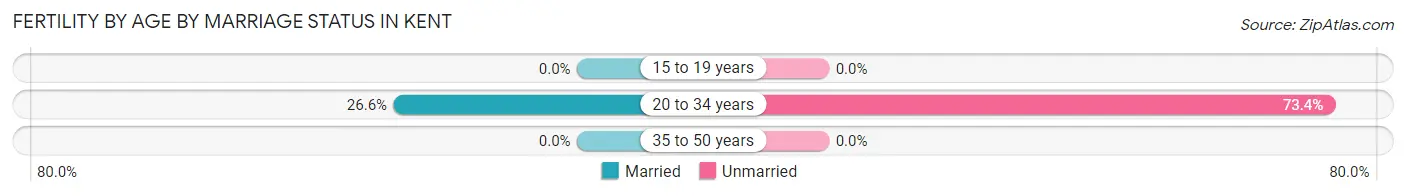
| Age Bracket | Married | Unmarried |
| 15 to 19 years | 0 (0.0%) | 0 (0.0%) |
| 20 to 34 years | 29 (26.6%) | 80 (73.4%) |
| 35 to 50 years | 0 (0.0%) | 0 (0.0%) |
| Total | 29 (26.6%) | 80 (73.4%) |
Fertility by Education in Kent
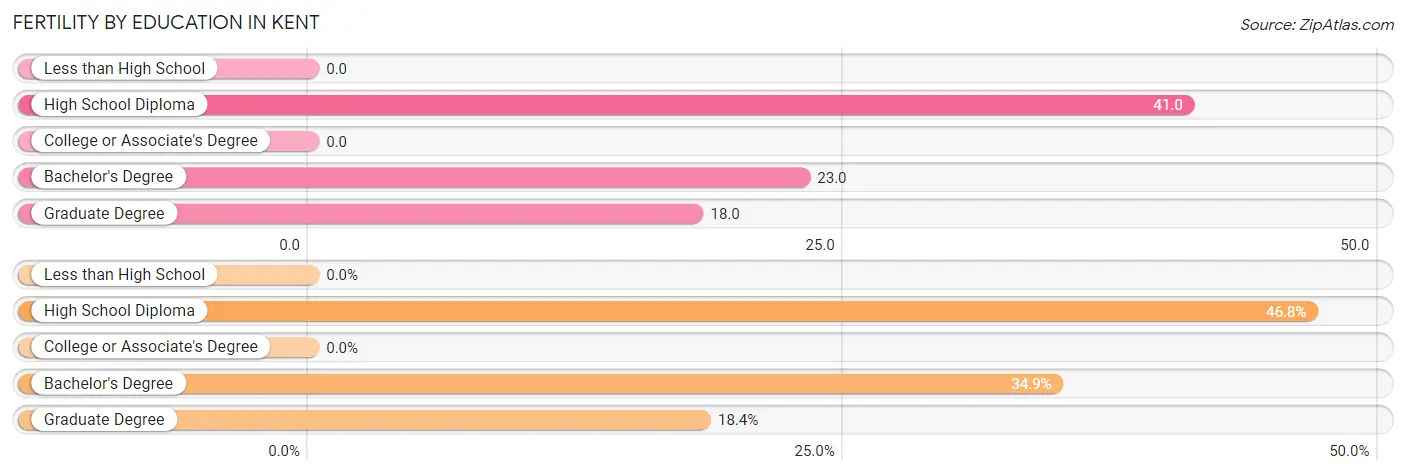
| Educational Attainment | Women with Births | Births / 1,000 Women |
| Less than High School | 0 (0.0%) | 0.0 |
| High School Diploma | 51 (46.8%) | 41.0 |
| College or Associate's Degree | 0 (0.0%) | 0.0 |
| Bachelor's Degree | 38 (34.9%) | 23.0 |
| Graduate Degree | 20 (18.3%) | 18.0 |
| Total | 109 (100.0%) | 11.0 |
Fertility by Education by Marriage Status in Kent
73.4% of women with births in Kent are unmarried. Women with the educational attainment of graduate degree are most likely to be married with 100.0% of them married at childbirth, while women with the educational attainment of high school diploma are least likely to be married with 100.0% of them unmarried at childbirth.
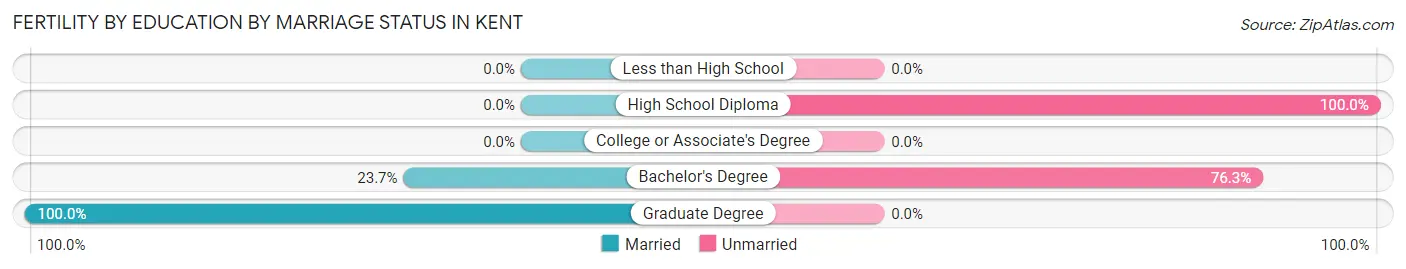
| Educational Attainment | Married | Unmarried |
| Less than High School | 0 (0.0%) | 0 (0.0%) |
| High School Diploma | 0 (0.0%) | 51 (100.0%) |
| College or Associate's Degree | 0 (0.0%) | 0 (0.0%) |
| Bachelor's Degree | 9 (23.7%) | 29 (76.3%) |
| Graduate Degree | 20 (100.0%) | 0 (0.0%) |
| Total | 29 (26.6%) | 80 (73.4%) |
Employment Characteristics in Kent
Employment by Class of Employer in Kent
Among the 12,550 employed individuals in Kent, private company employees (9,345 | 74.5%), local government employees (1,052 | 8.4%), and not-for-profit organizations (785 | 6.2%) make up the most common classes of employment.
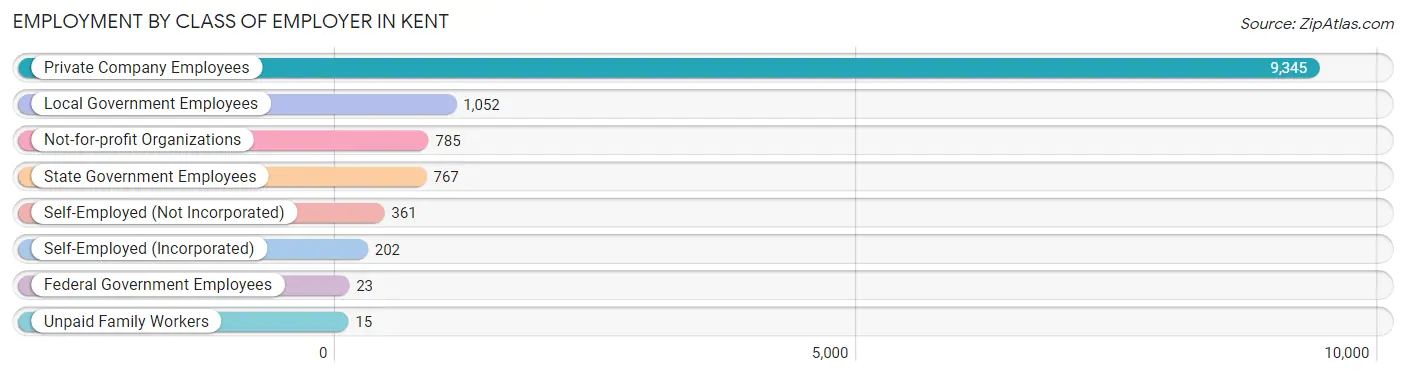
| Employer Class | # Employees | % Employees |
| Private Company Employees | 9,345 | 74.5% |
| Self-Employed (Incorporated) | 202 | 1.6% |
| Self-Employed (Not Incorporated) | 361 | 2.9% |
| Not-for-profit Organizations | 785 | 6.2% |
| Local Government Employees | 1,052 | 8.4% |
| State Government Employees | 767 | 6.1% |
| Federal Government Employees | 23 | 0.2% |
| Unpaid Family Workers | 15 | 0.1% |
| Total | 12,550 | 100.0% |
Employment Status by Age in Kent
According to the labor force statistics for Kent, out of the total population over 16 years of age (24,010), 63.7% or 15,294 individuals are in the labor force, with 10.7% or 1,636 of them unemployed. The age group with the highest labor force participation rate is 45 to 54 years, with 85.6% or 1,715 individuals in the labor force. Within the labor force, the 16 to 19 years age range has the highest percentage of unemployed individuals, with 21.3% or 503 of them being unemployed.
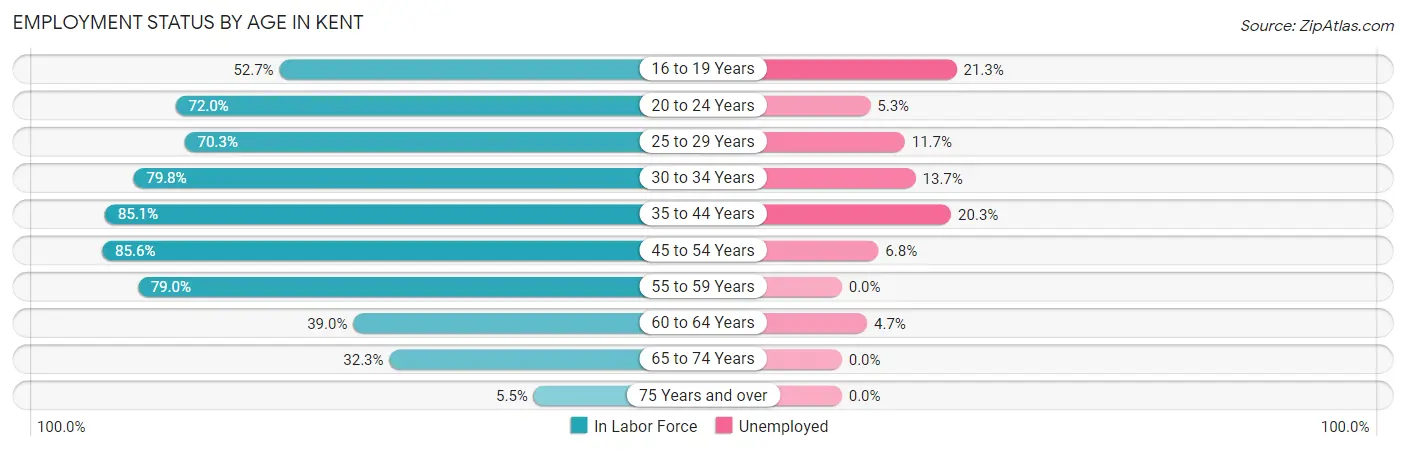
| Age Bracket | In Labor Force | Unemployed |
| 16 to 19 Years | 2,361 (52.7%) | 503 (21.3%) |
| 20 to 24 Years | 4,914 (72.0%) | 260 (5.3%) |
| 25 to 29 Years | 1,447 (70.3%) | 169 (11.7%) |
| 30 to 34 Years | 746 (79.8%) | 102 (13.7%) |
| 35 to 44 Years | 2,270 (85.1%) | 461 (20.3%) |
| 45 to 54 Years | 1,715 (85.6%) | 117 (6.8%) |
| 55 to 59 Years | 665 (79.0%) | 0 (0.0%) |
| 60 to 64 Years | 495 (39.0%) | 23 (4.7%) |
| 65 to 74 Years | 633 (32.3%) | 0 (0.0%) |
| 75 Years and over | 53 (5.5%) | 0 (0.0%) |
| Total | 15,294 (63.7%) | 1,636 (10.7%) |
Employment Status by Educational Attainment in Kent
According to labor force statistics for Kent, 75.1% of individuals (7,342) out of the total population between 25 and 64 years of age (9,776) are in the labor force, with 11.9% or 874 of them being unemployed. The group with the highest labor force participation rate are those with the educational attainment of bachelor's degree or higher, with 80.7% or 3,395 individuals in the labor force. Within the labor force, individuals with high school diploma education have the highest percentage of unemployment, with 29.3% or 606 of them being unemployed.
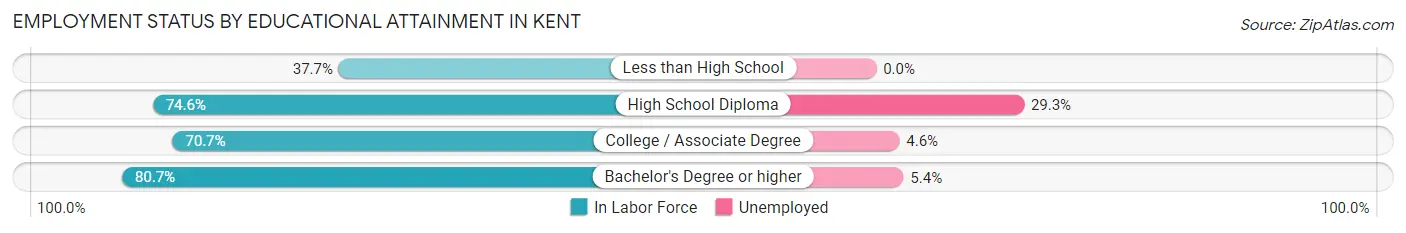
| Educational Attainment | In Labor Force | Unemployed |
| Less than High School | 119 (37.7%) | 0 (0.0%) |
| High School Diploma | 2,067 (74.6%) | 812 (29.3%) |
| College / Associate Degree | 1,755 (70.7%) | 114 (4.6%) |
| Bachelor's Degree or higher | 3,395 (80.7%) | 227 (5.4%) |
| Total | 7,342 (75.1%) | 1,163 (11.9%) |
Employment Occupations by Sex in Kent
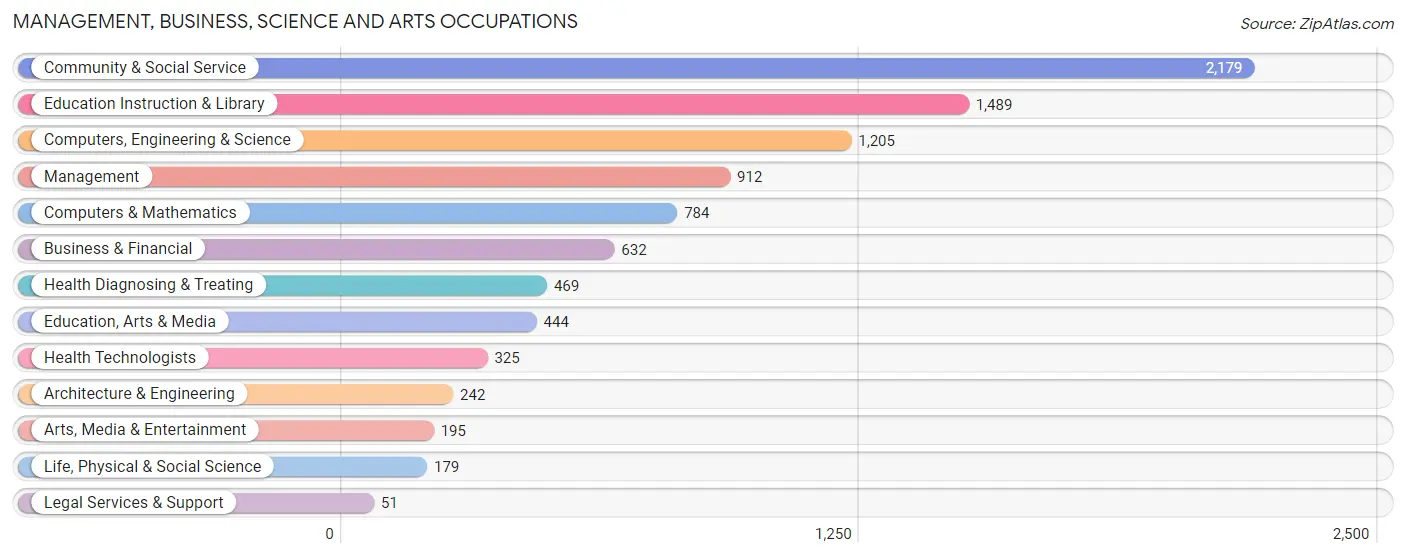
Management, Business, Science and Arts Occupations
The most common Management, Business, Science and Arts occupations in Kent are Community & Social Service (2,179 | 16.0%), Education Instruction & Library (1,489 | 10.9%), Computers, Engineering & Science (1,205 | 8.8%), Management (912 | 6.7%), and Computers & Mathematics (784 | 5.7%).
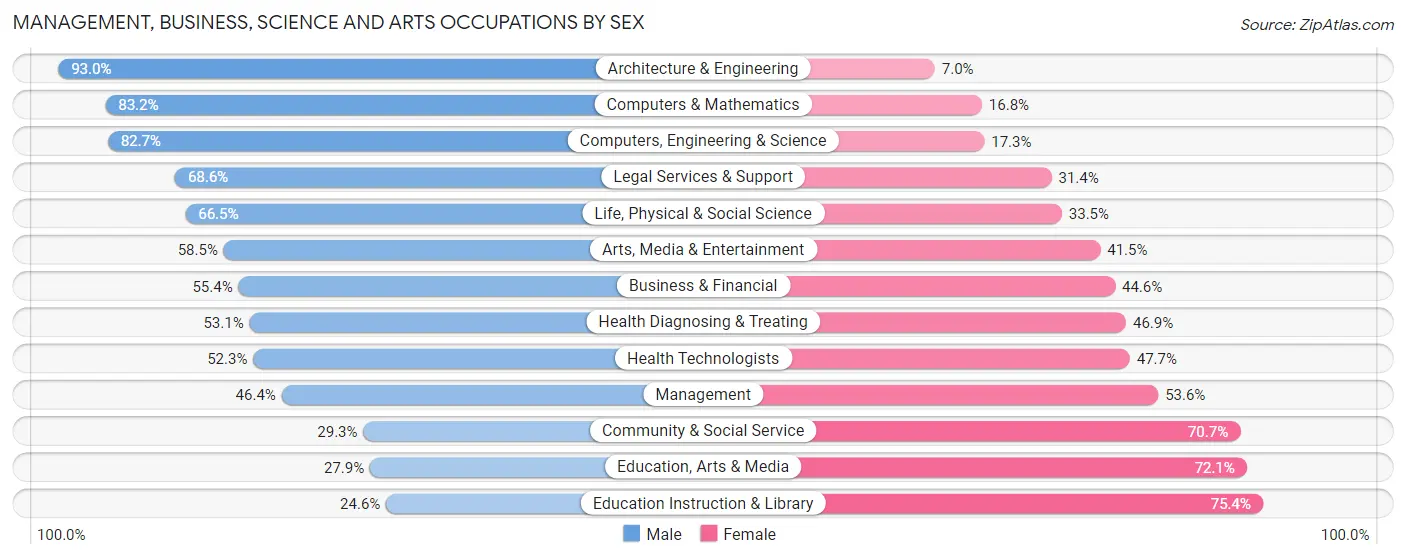
Management, Business, Science and Arts Occupations by Sex
Within the Management, Business, Science and Arts occupations in Kent, the most male-oriented occupations are Architecture & Engineering (93.0%), Computers & Mathematics (83.2%), and Computers, Engineering & Science (82.7%), while the most female-oriented occupations are Education Instruction & Library (75.4%), Education, Arts & Media (72.1%), and Community & Social Service (70.7%).
| Occupation | Male | Female |
| Management | 423 (46.4%) | 489 (53.6%) |
| Business & Financial | 350 (55.4%) | 282 (44.6%) |
| Computers, Engineering & Science | 996 (82.7%) | 209 (17.3%) |
| Computers & Mathematics | 652 (83.2%) | 132 (16.8%) |
| Architecture & Engineering | 225 (93.0%) | 17 (7.0%) |
| Life, Physical & Social Science | 119 (66.5%) | 60 (33.5%) |
| Community & Social Service | 639 (29.3%) | 1,540 (70.7%) |
| Education, Arts & Media | 124 (27.9%) | 320 (72.1%) |
| Legal Services & Support | 35 (68.6%) | 16 (31.4%) |
| Education Instruction & Library | 366 (24.6%) | 1,123 (75.4%) |
| Arts, Media & Entertainment | 114 (58.5%) | 81 (41.5%) |
| Health Diagnosing & Treating | 249 (53.1%) | 220 (46.9%) |
| Health Technologists | 170 (52.3%) | 155 (47.7%) |
| Total (Category) | 2,657 (49.2%) | 2,740 (50.8%) |
| Total (Overall) | 6,746 (49.4%) | 6,914 (50.6%) |
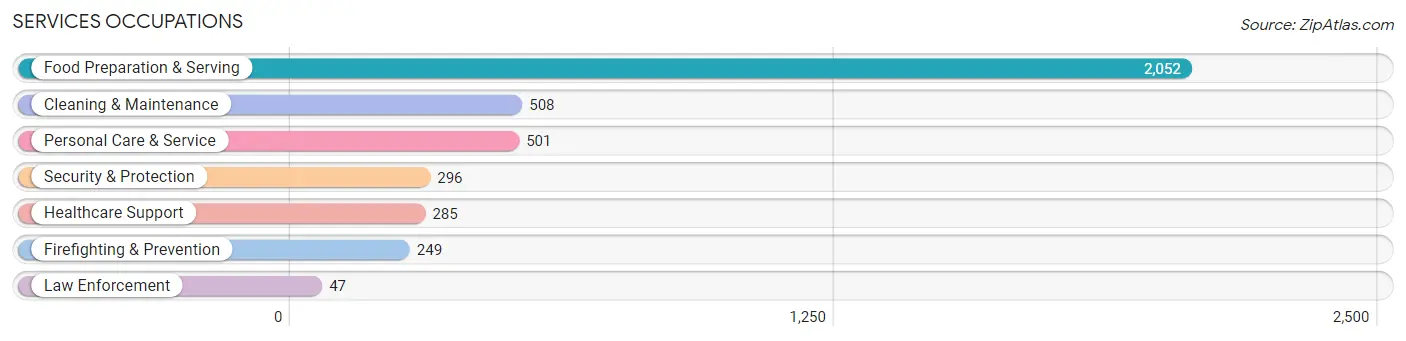
Services Occupations
The most common Services occupations in Kent are Food Preparation & Serving (2,052 | 15.0%), Cleaning & Maintenance (508 | 3.7%), Personal Care & Service (501 | 3.7%), Security & Protection (296 | 2.2%), and Healthcare Support (285 | 2.1%).
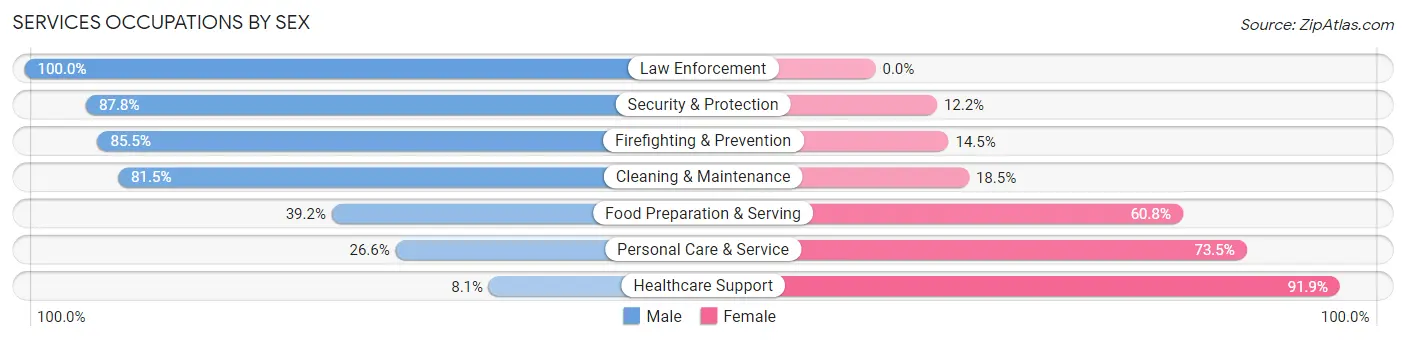
Services Occupations by Sex
Within the Services occupations in Kent, the most male-oriented occupations are Law Enforcement (100.0%), Security & Protection (87.8%), and Firefighting & Prevention (85.5%), while the most female-oriented occupations are Healthcare Support (91.9%), Personal Care & Service (73.5%), and Food Preparation & Serving (60.8%).
| Occupation | Male | Female |
| Healthcare Support | 23 (8.1%) | 262 (91.9%) |
| Security & Protection | 260 (87.8%) | 36 (12.2%) |
| Firefighting & Prevention | 213 (85.5%) | 36 (14.5%) |
| Law Enforcement | 47 (100.0%) | 0 (0.0%) |
| Food Preparation & Serving | 804 (39.2%) | 1,248 (60.8%) |
| Cleaning & Maintenance | 414 (81.5%) | 94 (18.5%) |
| Personal Care & Service | 133 (26.6%) | 368 (73.5%) |
| Total (Category) | 1,634 (44.9%) | 2,008 (55.1%) |
| Total (Overall) | 6,746 (49.4%) | 6,914 (50.6%) |
Sales and Office Occupations
The most common Sales and Office occupations in Kent are Office & Administration (1,361 | 10.0%), and Sales & Related (1,145 | 8.4%).

Sales and Office Occupations by Sex
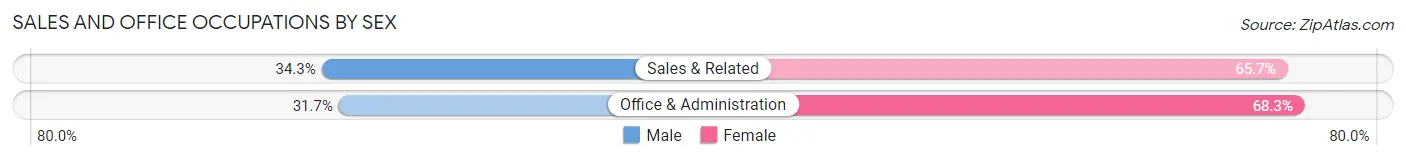
| Occupation | Male | Female |
| Sales & Related | 393 (34.3%) | 752 (65.7%) |
| Office & Administration | 431 (31.7%) | 930 (68.3%) |
| Total (Category) | 824 (32.9%) | 1,682 (67.1%) |
| Total (Overall) | 6,746 (49.4%) | 6,914 (50.6%) |
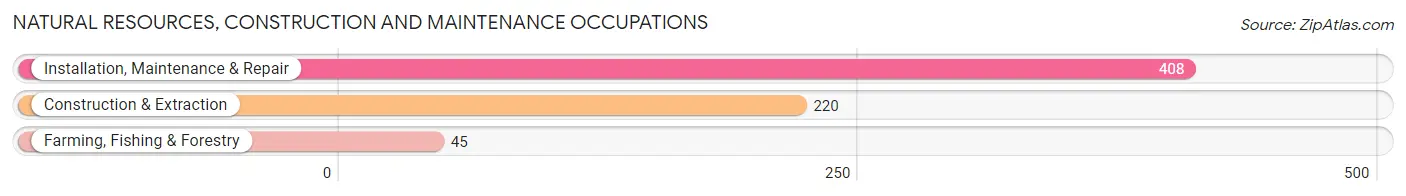
Natural Resources, Construction and Maintenance Occupations
The most common Natural Resources, Construction and Maintenance occupations in Kent are Installation, Maintenance & Repair (408 | 3.0%), Construction & Extraction (220 | 1.6%), and Farming, Fishing & Forestry (45 | 0.3%).
Natural Resources, Construction and Maintenance Occupations by Sex
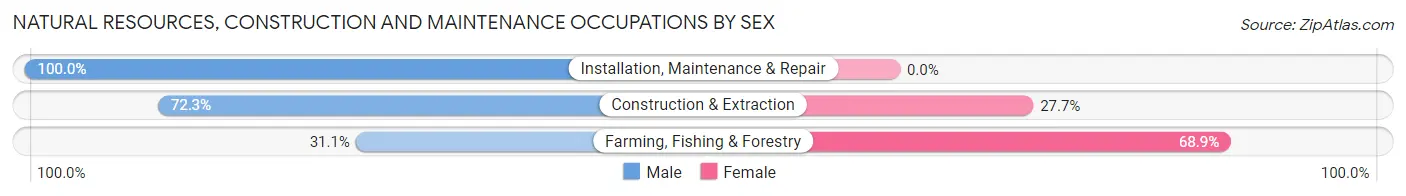
| Occupation | Male | Female |
| Farming, Fishing & Forestry | 14 (31.1%) | 31 (68.9%) |
| Construction & Extraction | 159 (72.3%) | 61 (27.7%) |
| Installation, Maintenance & Repair | 408 (100.0%) | 0 (0.0%) |
| Total (Category) | 581 (86.3%) | 92 (13.7%) |
| Total (Overall) | 6,746 (49.4%) | 6,914 (50.6%) |
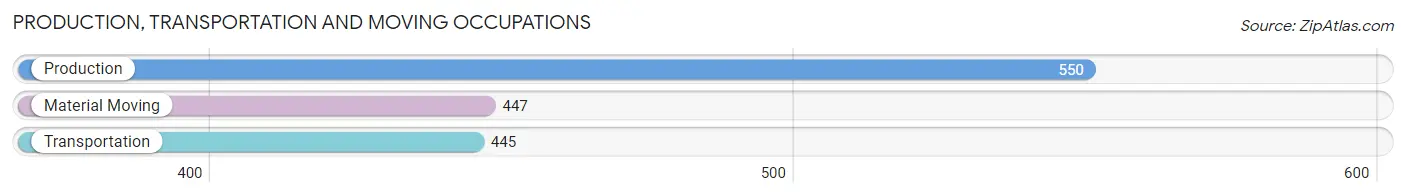
Production, Transportation and Moving Occupations
The most common Production, Transportation and Moving occupations in Kent are Production (550 | 4.0%), Material Moving (447 | 3.3%), and Transportation (445 | 3.3%).
Production, Transportation and Moving Occupations by Sex
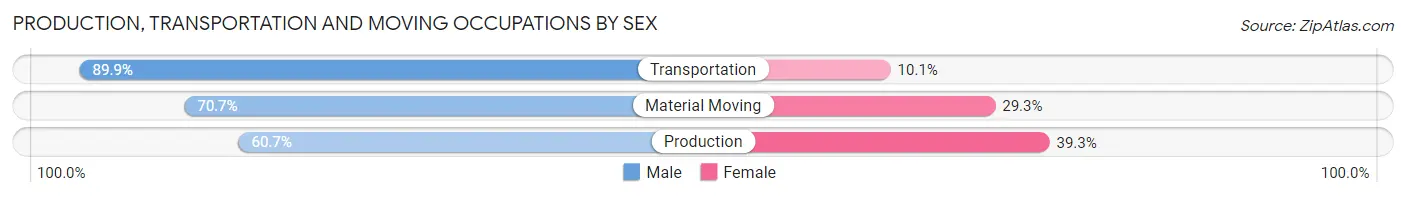
| Occupation | Male | Female |
| Production | 334 (60.7%) | 216 (39.3%) |
| Transportation | 400 (89.9%) | 45 (10.1%) |
| Material Moving | 316 (70.7%) | 131 (29.3%) |
| Total (Category) | 1,050 (72.8%) | 392 (27.2%) |
| Total (Overall) | 6,746 (49.4%) | 6,914 (50.6%) |
Employment Industries by Sex in Kent
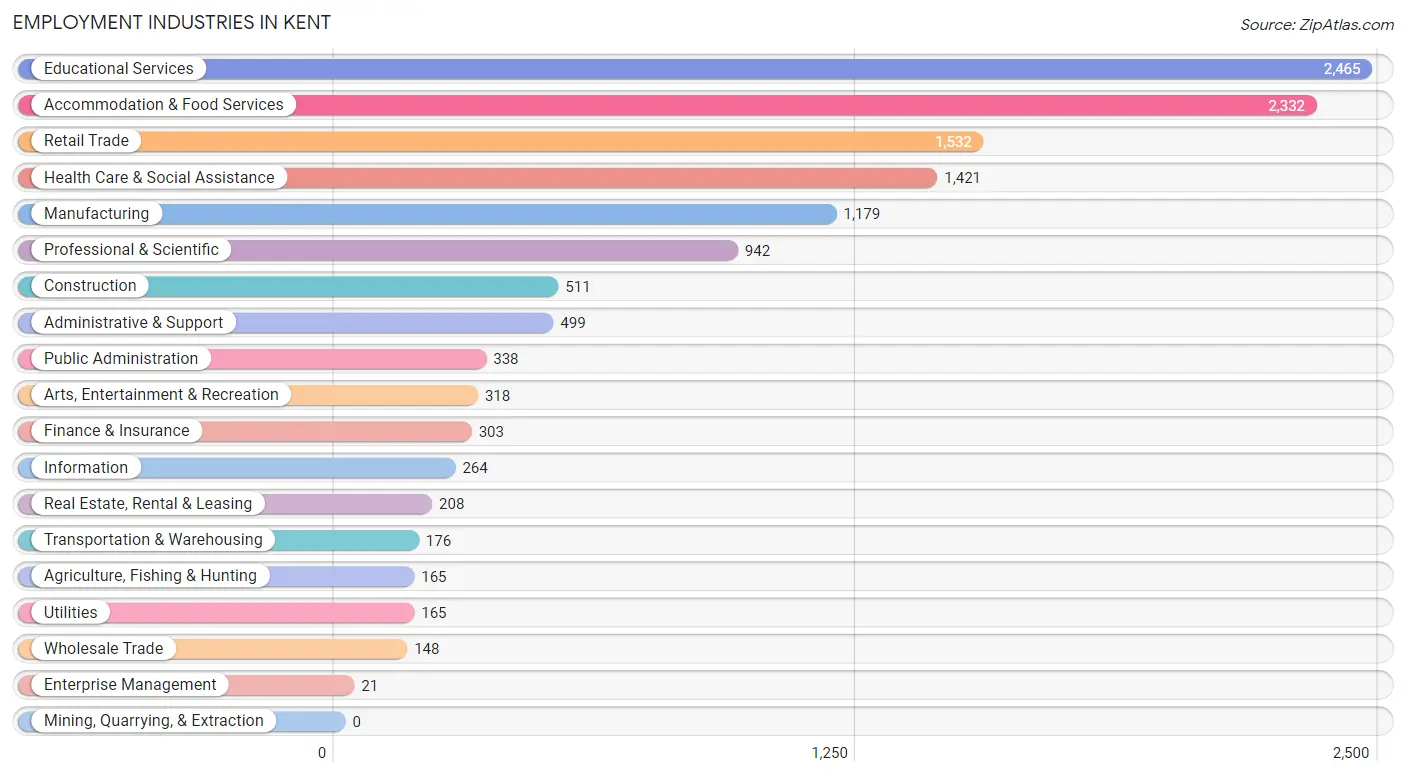
Employment Industries in Kent
The major employment industries in Kent include Educational Services (2,465 | 18.0%), Accommodation & Food Services (2,332 | 17.1%), Retail Trade (1,532 | 11.2%), Health Care & Social Assistance (1,421 | 10.4%), and Manufacturing (1,179 | 8.6%).
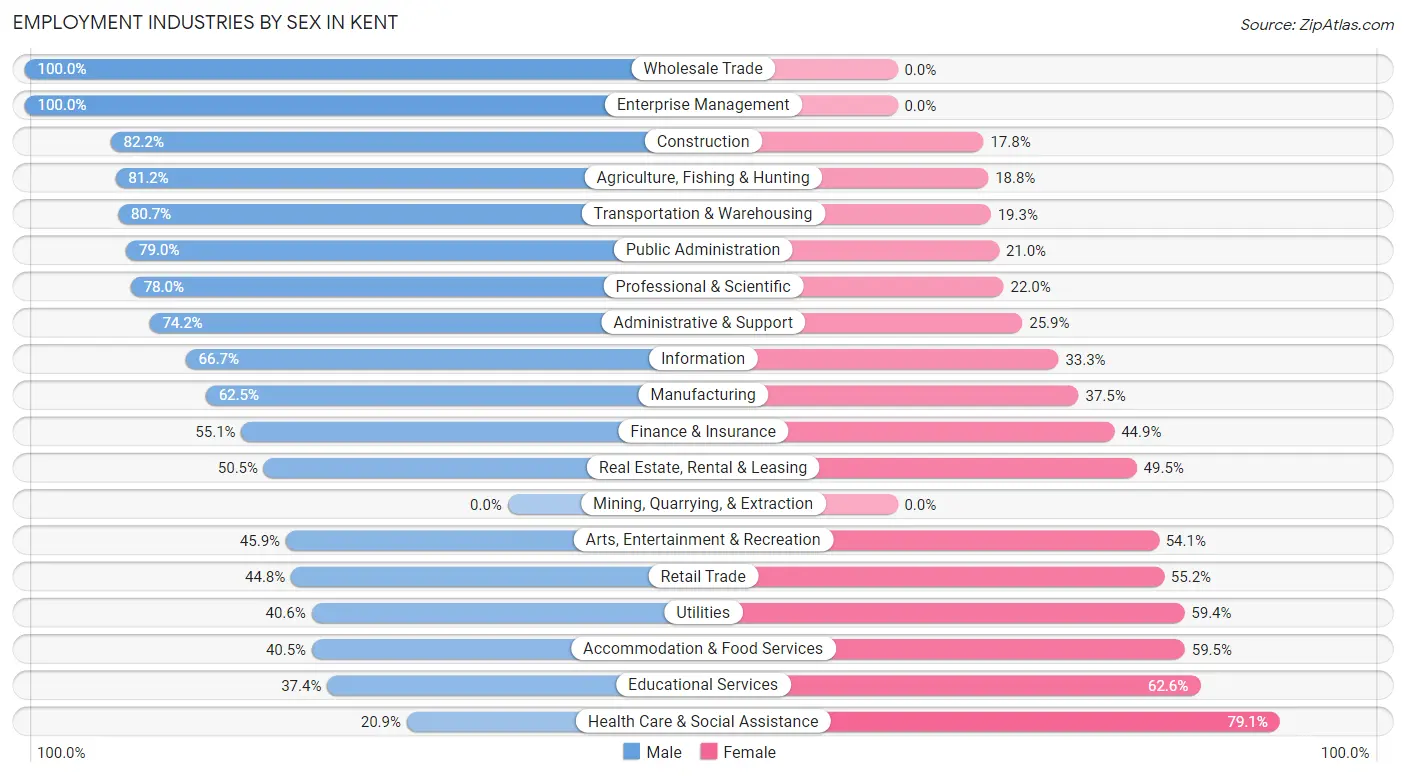
Employment Industries by Sex in Kent
The Kent industries that see more men than women are Wholesale Trade (100.0%), Enterprise Management (100.0%), and Construction (82.2%), whereas the industries that tend to have a higher number of women are Health Care & Social Assistance (79.1%), Educational Services (62.6%), and Accommodation & Food Services (59.5%).
| Industry | Male | Female |
| Agriculture, Fishing & Hunting | 134 (81.2%) | 31 (18.8%) |
| Mining, Quarrying, & Extraction | 0 (0.0%) | 0 (0.0%) |
| Construction | 420 (82.2%) | 91 (17.8%) |
| Manufacturing | 737 (62.5%) | 442 (37.5%) |
| Wholesale Trade | 148 (100.0%) | 0 (0.0%) |
| Retail Trade | 687 (44.8%) | 845 (55.2%) |
| Transportation & Warehousing | 142 (80.7%) | 34 (19.3%) |
| Utilities | 67 (40.6%) | 98 (59.4%) |
| Information | 176 (66.7%) | 88 (33.3%) |
| Finance & Insurance | 167 (55.1%) | 136 (44.9%) |
| Real Estate, Rental & Leasing | 105 (50.5%) | 103 (49.5%) |
| Professional & Scientific | 735 (78.0%) | 207 (22.0%) |
| Enterprise Management | 21 (100.0%) | 0 (0.0%) |
| Administrative & Support | 370 (74.2%) | 129 (25.9%) |
| Educational Services | 921 (37.4%) | 1,544 (62.6%) |
| Health Care & Social Assistance | 297 (20.9%) | 1,124 (79.1%) |
| Arts, Entertainment & Recreation | 146 (45.9%) | 172 (54.1%) |
| Accommodation & Food Services | 945 (40.5%) | 1,387 (59.5%) |
| Public Administration | 267 (79.0%) | 71 (21.0%) |
| Total | 6,746 (49.4%) | 6,914 (50.6%) |
Education in Kent
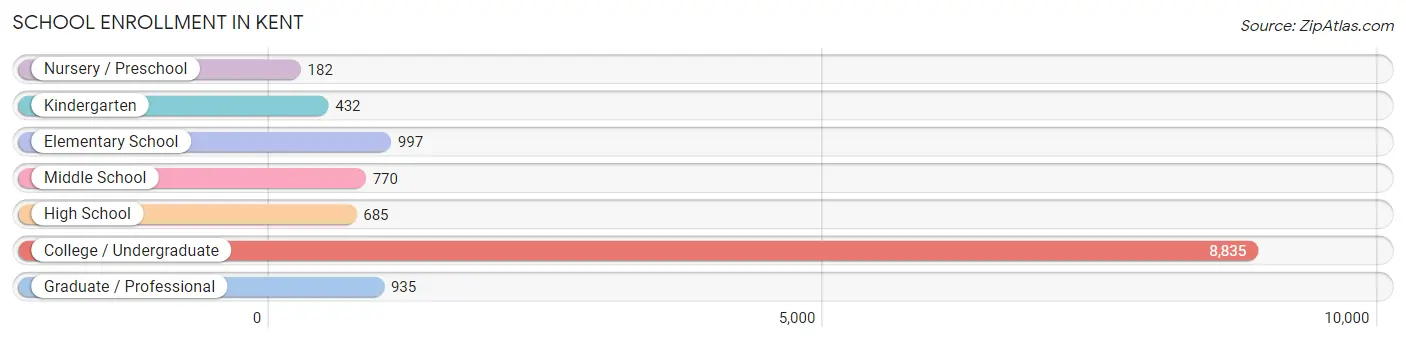
School Enrollment in Kent
The most common levels of schooling among the 12,836 students in Kent are college / undergraduate (8,835 | 68.8%), elementary school (997 | 7.8%), and graduate / professional (935 | 7.3%).
| School Level | # Students | % Students |
| Nursery / Preschool | 182 | 1.4% |
| Kindergarten | 432 | 3.4% |
| Elementary School | 997 | 7.8% |
| Middle School | 770 | 6.0% |
| High School | 685 | 5.3% |
| College / Undergraduate | 8,835 | 68.8% |
| Graduate / Professional | 935 | 7.3% |
| Total | 12,836 | 100.0% |
School Enrollment by Age by Funding Source in Kent
Out of a total of 12,836 students who are enrolled in schools in Kent, 680 (5.3%) attend a private institution, while the remaining 12,156 (94.7%) are enrolled in public schools. The age group of 3 to 4 year olds has the highest likelihood of being enrolled in private schools, with 77 (42.3% in the age bracket) enrolled. Conversely, the age group of 10 to 14 year olds has the lowest likelihood of being enrolled in a private school, with 1,068 (98.0% in the age bracket) attending a public institution.
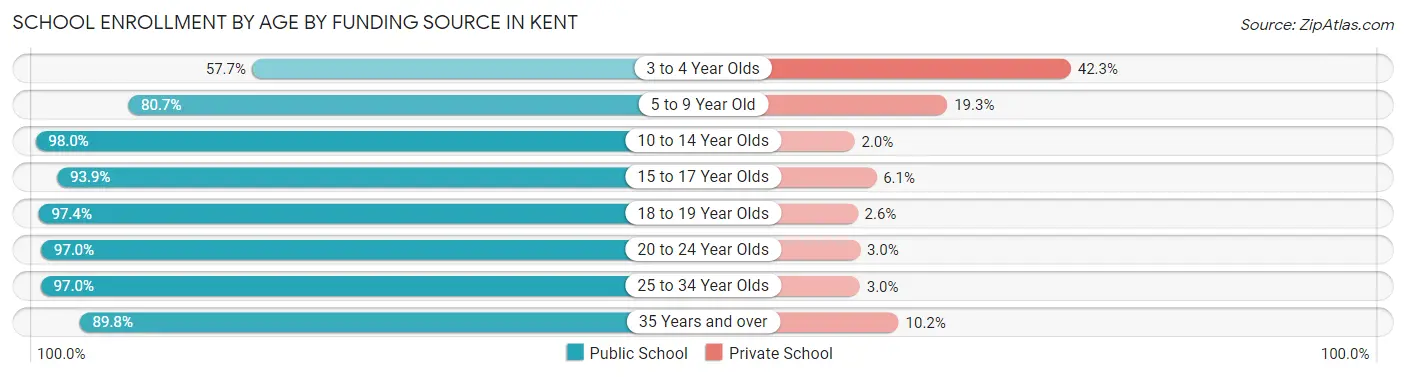
| Age Bracket | Public School | Private School |
| 3 to 4 Year Olds | 105 (57.7%) | 77 (42.3%) |
| 5 to 9 Year Old | 979 (80.7%) | 234 (19.3%) |
| 10 to 14 Year Olds | 1,068 (98.0%) | 22 (2.0%) |
| 15 to 17 Year Olds | 496 (93.9%) | 32 (6.1%) |
| 18 to 19 Year Olds | 3,821 (97.4%) | 102 (2.6%) |
| 20 to 24 Year Olds | 4,567 (97.0%) | 143 (3.0%) |
| 25 to 34 Year Olds | 775 (97.0%) | 24 (3.0%) |
| 35 Years and over | 351 (89.8%) | 40 (10.2%) |
| Total | 12,156 (94.7%) | 680 (5.3%) |
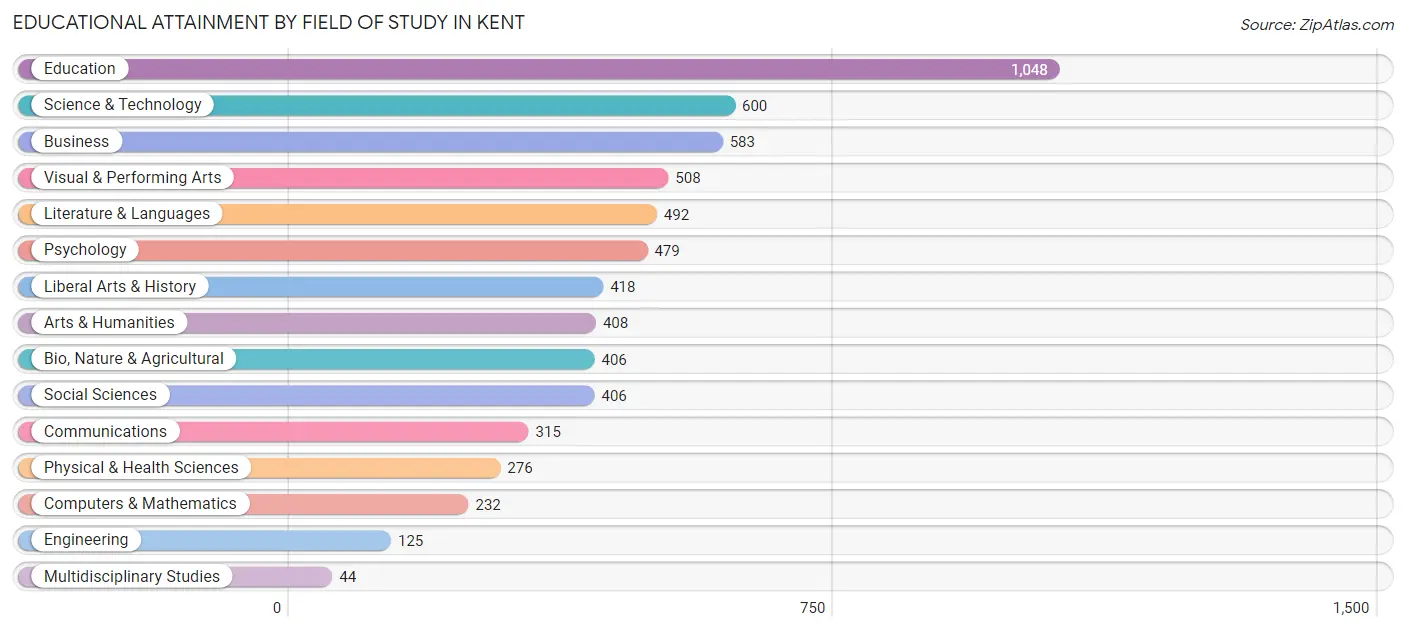
Educational Attainment by Field of Study in Kent
Education (1,048 | 16.5%), science & technology (600 | 9.5%), business (583 | 9.2%), visual & performing arts (508 | 8.0%), and literature & languages (492 | 7.8%) are the most common fields of study among 6,340 individuals in Kent who have obtained a bachelor's degree or higher.
| Field of Study | # Graduates | % Graduates |
| Computers & Mathematics | 232 | 3.7% |
| Bio, Nature & Agricultural | 406 | 6.4% |
| Physical & Health Sciences | 276 | 4.3% |
| Psychology | 479 | 7.6% |
| Social Sciences | 406 | 6.4% |
| Engineering | 125 | 2.0% |
| Multidisciplinary Studies | 44 | 0.7% |
| Science & Technology | 600 | 9.5% |
| Business | 583 | 9.2% |
| Education | 1,048 | 16.5% |
| Literature & Languages | 492 | 7.8% |
| Liberal Arts & History | 418 | 6.6% |
| Visual & Performing Arts | 508 | 8.0% |
| Communications | 315 | 5.0% |
| Arts & Humanities | 408 | 6.4% |
| Total | 6,340 | 100.0% |
Transportation & Commute in Kent
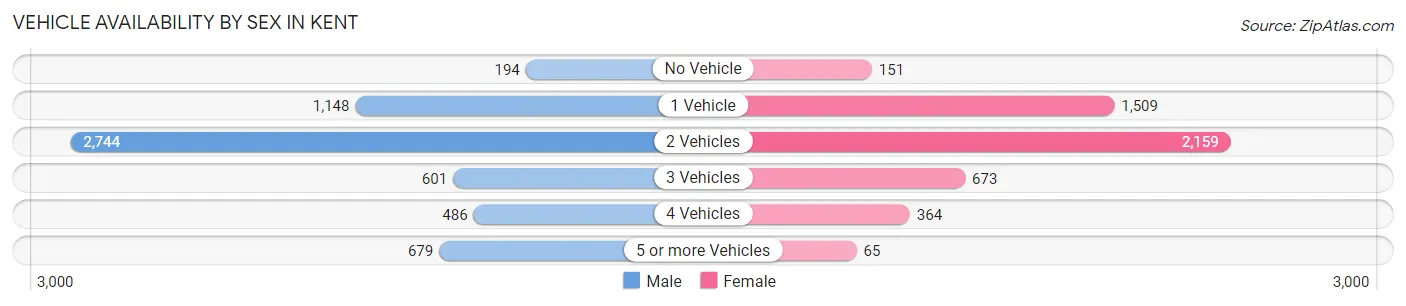
Vehicle Availability by Sex in Kent
The most prevalent vehicle ownership categories in Kent are males with 2 vehicles (2,744, accounting for 46.9%) and females with 2 vehicles (2,159, making up 55.8%).
| Vehicles Available | Male | Female |
| No Vehicle | 194 (3.3%) | 151 (3.1%) |
| 1 Vehicle | 1,148 (19.6%) | 1,509 (30.7%) |
| 2 Vehicles | 2,744 (46.9%) | 2,159 (43.9%) |
| 3 Vehicles | 601 (10.3%) | 673 (13.7%) |
| 4 Vehicles | 486 (8.3%) | 364 (7.4%) |
| 5 or more Vehicles | 679 (11.6%) | 65 (1.3%) |
| Total | 5,852 (100.0%) | 4,921 (100.0%) |
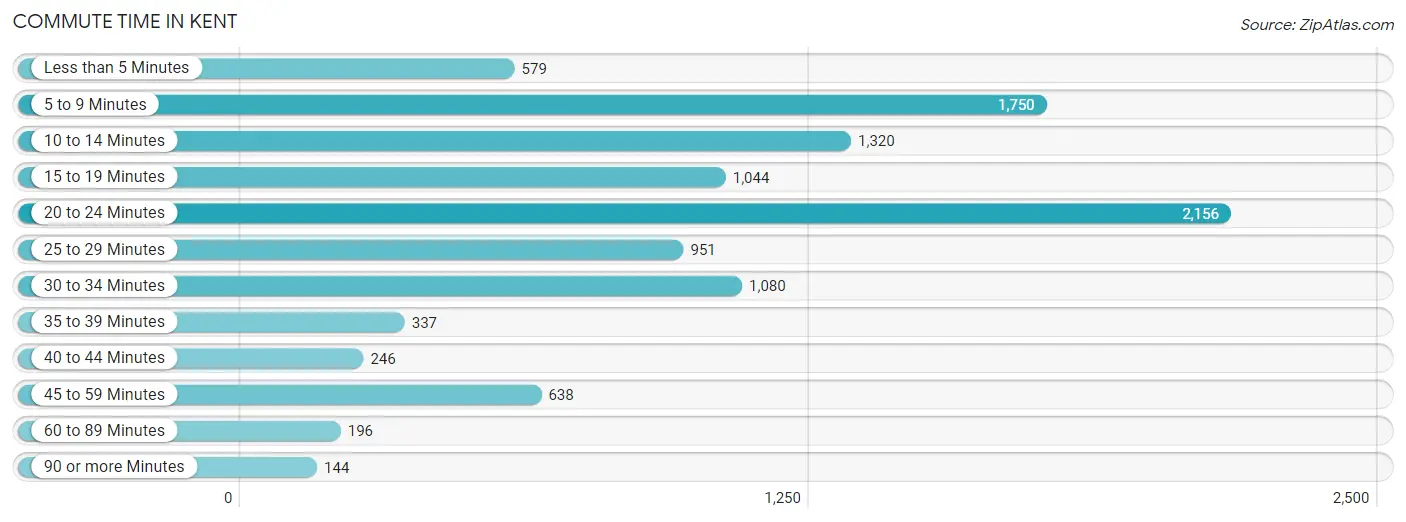
Commute Time in Kent
The most frequently occuring commute durations in Kent are 20 to 24 minutes (2,156 commuters, 20.6%), 5 to 9 minutes (1,750 commuters, 16.8%), and 10 to 14 minutes (1,320 commuters, 12.6%).
| Commute Time | # Commuters | % Commuters |
| Less than 5 Minutes | 579 | 5.6% |
| 5 to 9 Minutes | 1,750 | 16.8% |
| 10 to 14 Minutes | 1,320 | 12.6% |
| 15 to 19 Minutes | 1,044 | 10.0% |
| 20 to 24 Minutes | 2,156 | 20.6% |
| 25 to 29 Minutes | 951 | 9.1% |
| 30 to 34 Minutes | 1,080 | 10.3% |
| 35 to 39 Minutes | 337 | 3.2% |
| 40 to 44 Minutes | 246 | 2.4% |
| 45 to 59 Minutes | 638 | 6.1% |
| 60 to 89 Minutes | 196 | 1.9% |
| 90 or more Minutes | 144 | 1.4% |
Commute Time by Sex in Kent
The most common commute times in Kent are 20 to 24 minutes (1,398 commuters, 25.7%) for males and 10 to 14 minutes (866 commuters, 17.3%) for females.
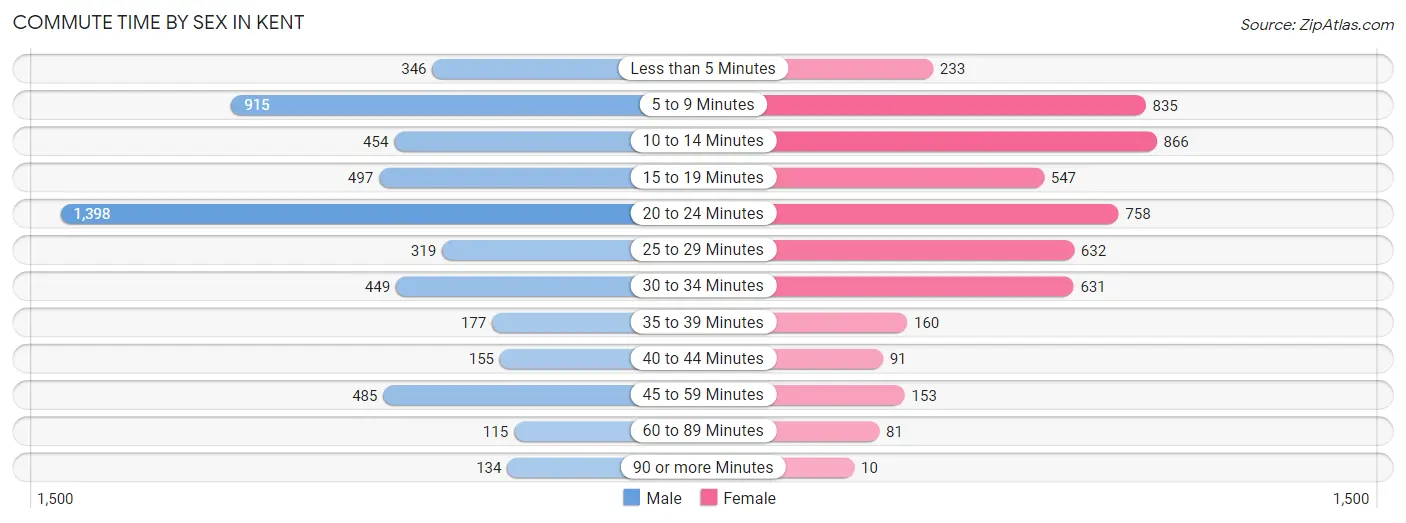
| Commute Time | Male | Female |
| Less than 5 Minutes | 346 (6.4%) | 233 (4.7%) |
| 5 to 9 Minutes | 915 (16.8%) | 835 (16.7%) |
| 10 to 14 Minutes | 454 (8.3%) | 866 (17.3%) |
| 15 to 19 Minutes | 497 (9.1%) | 547 (11.0%) |
| 20 to 24 Minutes | 1,398 (25.7%) | 758 (15.2%) |
| 25 to 29 Minutes | 319 (5.9%) | 632 (12.7%) |
| 30 to 34 Minutes | 449 (8.3%) | 631 (12.6%) |
| 35 to 39 Minutes | 177 (3.3%) | 160 (3.2%) |
| 40 to 44 Minutes | 155 (2.9%) | 91 (1.8%) |
| 45 to 59 Minutes | 485 (8.9%) | 153 (3.1%) |
| 60 to 89 Minutes | 115 (2.1%) | 81 (1.6%) |
| 90 or more Minutes | 134 (2.5%) | 10 (0.2%) |
Time of Departure to Work by Sex in Kent
The most frequent times of departure to work in Kent are 12:00 PM to 3:59 PM (868, 15.9%) for males and 7:00 AM to 7:29 AM (685, 13.7%) for females.
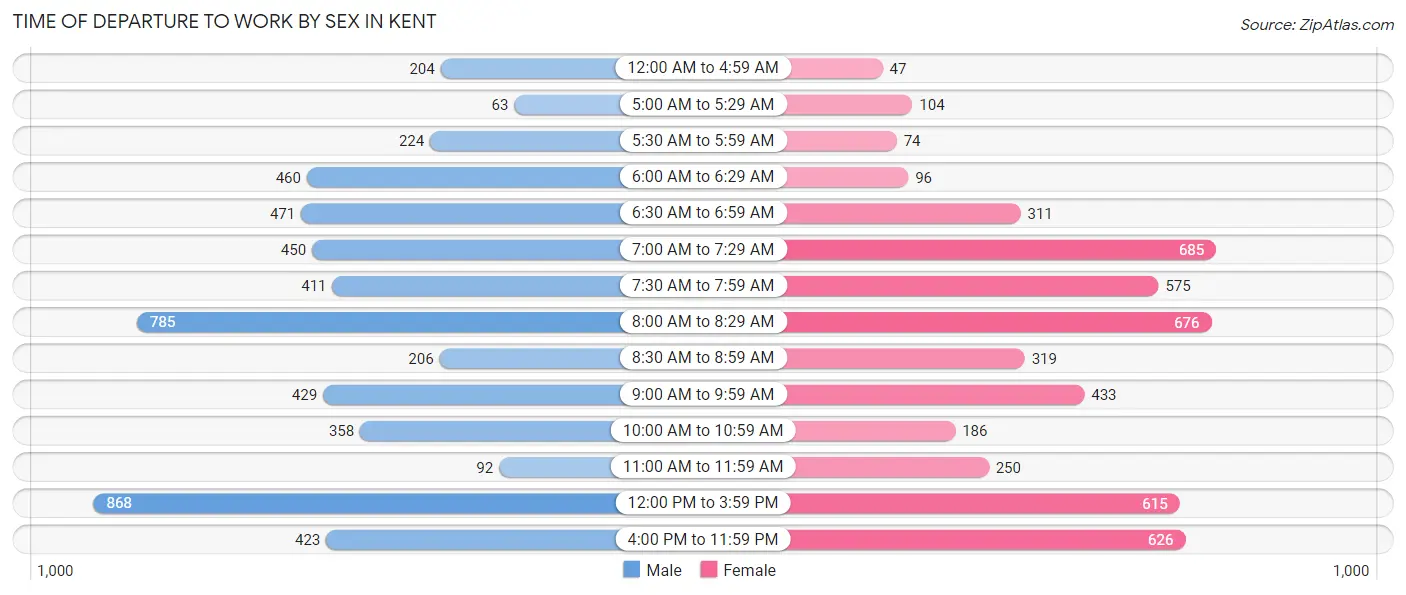
| Time of Departure | Male | Female |
| 12:00 AM to 4:59 AM | 204 (3.7%) | 47 (0.9%) |
| 5:00 AM to 5:29 AM | 63 (1.2%) | 104 (2.1%) |
| 5:30 AM to 5:59 AM | 224 (4.1%) | 74 (1.5%) |
| 6:00 AM to 6:29 AM | 460 (8.5%) | 96 (1.9%) |
| 6:30 AM to 6:59 AM | 471 (8.6%) | 311 (6.2%) |
| 7:00 AM to 7:29 AM | 450 (8.3%) | 685 (13.7%) |
| 7:30 AM to 7:59 AM | 411 (7.5%) | 575 (11.5%) |
| 8:00 AM to 8:29 AM | 785 (14.4%) | 676 (13.5%) |
| 8:30 AM to 8:59 AM | 206 (3.8%) | 319 (6.4%) |
| 9:00 AM to 9:59 AM | 429 (7.9%) | 433 (8.7%) |
| 10:00 AM to 10:59 AM | 358 (6.6%) | 186 (3.7%) |
| 11:00 AM to 11:59 AM | 92 (1.7%) | 250 (5.0%) |
| 12:00 PM to 3:59 PM | 868 (15.9%) | 615 (12.3%) |
| 4:00 PM to 11:59 PM | 423 (7.8%) | 626 (12.5%) |
| Total | 5,444 (100.0%) | 4,997 (100.0%) |
Housing Occupancy in Kent
Occupancy by Ownership in Kent
Of the total 10,225 dwellings in Kent, owner-occupied units account for 4,371 (42.7%), while renter-occupied units make up 5,854 (57.3%).
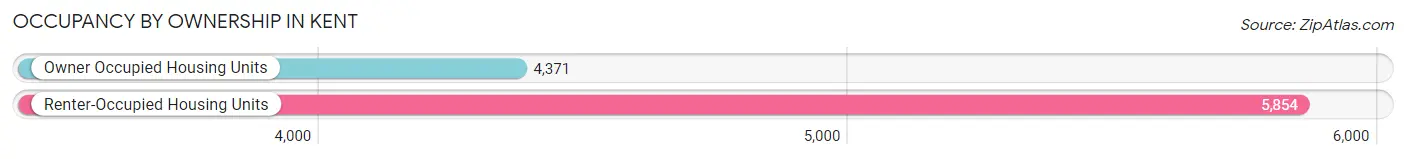
| Occupancy | # Housing Units | % Housing Units |
| Owner Occupied Housing Units | 4,371 | 42.7% |
| Renter-Occupied Housing Units | 5,854 | 57.3% |
| Total Occupied Housing Units | 10,225 | 100.0% |
Occupancy by Household Size in Kent
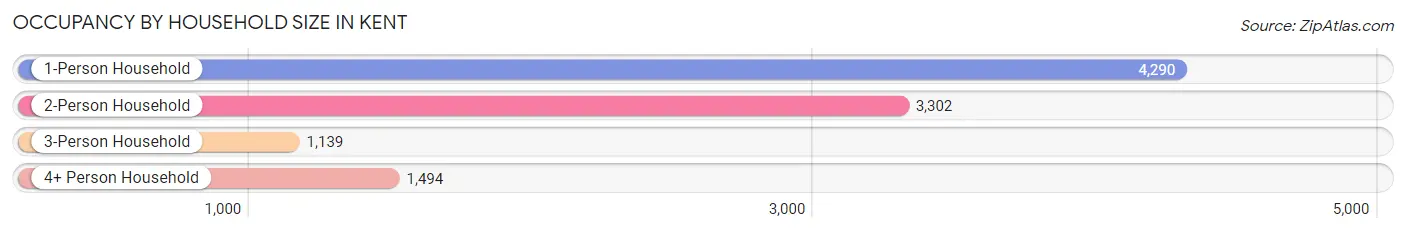
| Household Size | # Housing Units | % Housing Units |
| 1-Person Household | 4,290 | 42.0% |
| 2-Person Household | 3,302 | 32.3% |
| 3-Person Household | 1,139 | 11.1% |
| 4+ Person Household | 1,494 | 14.6% |
| Total Housing Units | 10,225 | 100.0% |
Occupancy by Ownership by Household Size in Kent
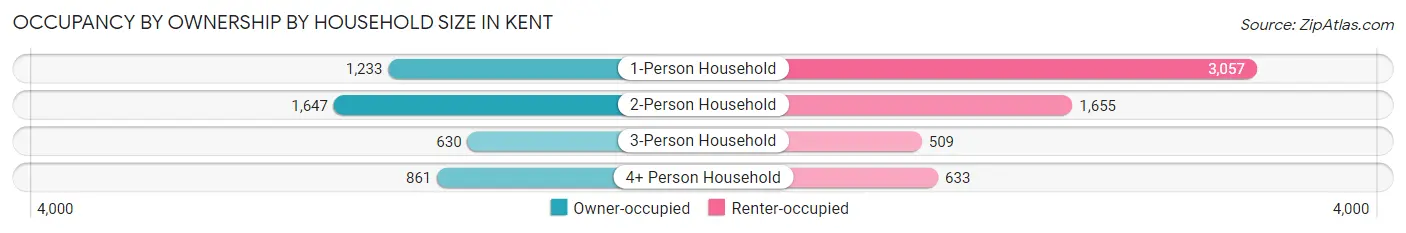
| Household Size | Owner-occupied | Renter-occupied |
| 1-Person Household | 1,233 (28.7%) | 3,057 (71.3%) |
| 2-Person Household | 1,647 (49.9%) | 1,655 (50.1%) |
| 3-Person Household | 630 (55.3%) | 509 (44.7%) |
| 4+ Person Household | 861 (57.6%) | 633 (42.4%) |
| Total Housing Units | 4,371 (42.7%) | 5,854 (57.3%) |
Occupancy by Educational Attainment in Kent
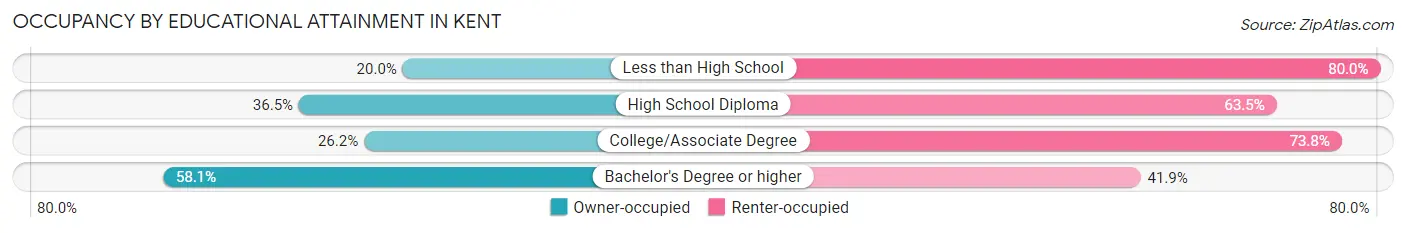
| Household Size | Owner-occupied | Renter-occupied |
| Less than High School | 106 (20.0%) | 423 (80.0%) |
| High School Diploma | 735 (36.5%) | 1,279 (63.5%) |
| College/Associate Degree | 764 (26.2%) | 2,155 (73.8%) |
| Bachelor's Degree or higher | 2,766 (58.1%) | 1,997 (41.9%) |
Occupancy by Age of Householder in Kent
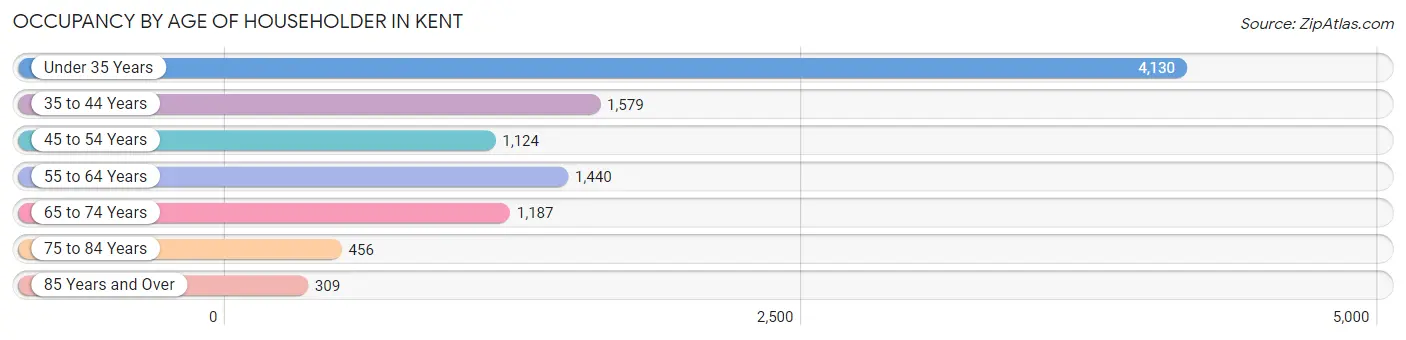
| Age Bracket | # Households | % Households |
| Under 35 Years | 4,130 | 40.4% |
| 35 to 44 Years | 1,579 | 15.4% |
| 45 to 54 Years | 1,124 | 11.0% |
| 55 to 64 Years | 1,440 | 14.1% |
| 65 to 74 Years | 1,187 | 11.6% |
| 75 to 84 Years | 456 | 4.5% |
| 85 Years and Over | 309 | 3.0% |
| Total | 10,225 | 100.0% |
Housing Finances in Kent
Median Income by Occupancy in Kent
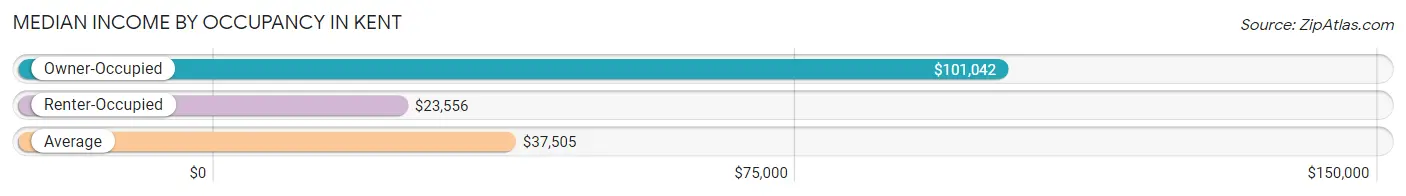
| Occupancy Type | # Households | Median Income |
| Owner-Occupied | 4,371 (42.7%) | $101,042 |
| Renter-Occupied | 5,854 (57.3%) | $23,556 |
| Average | 10,225 (100.0%) | $37,505 |
Occupancy by Householder Income Bracket in Kent
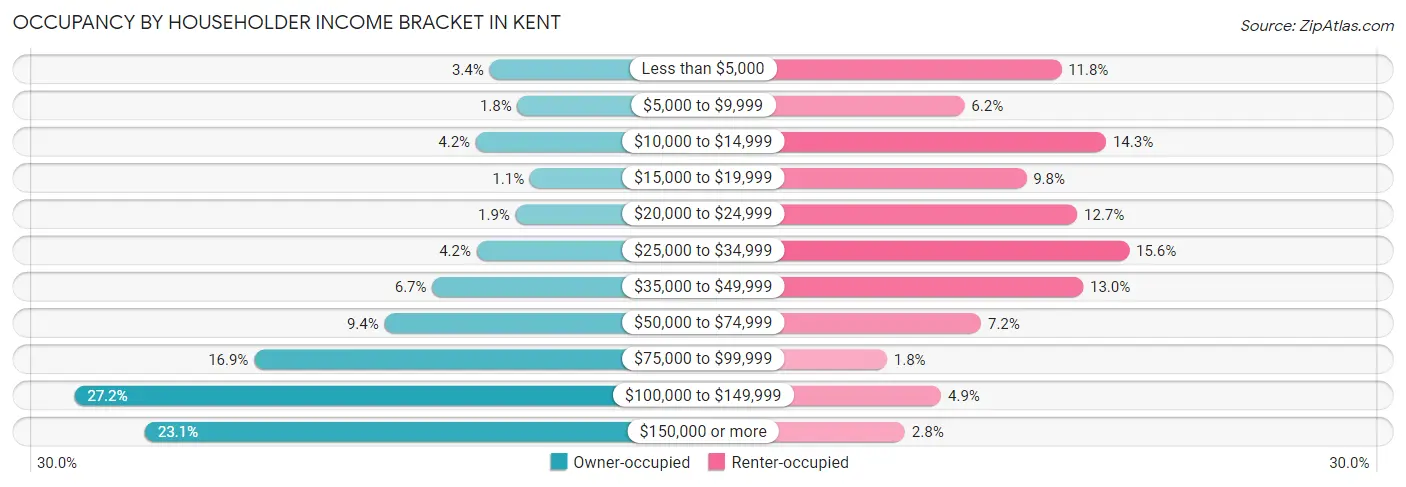
| Income Bracket | Owner-occupied | Renter-occupied |
| Less than $5,000 | 150 (3.4%) | 688 (11.7%) |
| $5,000 to $9,999 | 80 (1.8%) | 364 (6.2%) |
| $10,000 to $14,999 | 184 (4.2%) | 838 (14.3%) |
| $15,000 to $19,999 | 49 (1.1%) | 571 (9.8%) |
| $20,000 to $24,999 | 85 (1.9%) | 741 (12.7%) |
| $25,000 to $34,999 | 182 (4.2%) | 915 (15.6%) |
| $35,000 to $49,999 | 293 (6.7%) | 761 (13.0%) |
| $50,000 to $74,999 | 412 (9.4%) | 420 (7.2%) |
| $75,000 to $99,999 | 738 (16.9%) | 105 (1.8%) |
| $100,000 to $149,999 | 1,187 (27.2%) | 286 (4.9%) |
| $150,000 or more | 1,011 (23.1%) | 165 (2.8%) |
| Total | 4,371 (100.0%) | 5,854 (100.0%) |
Monthly Housing Cost Tiers in Kent
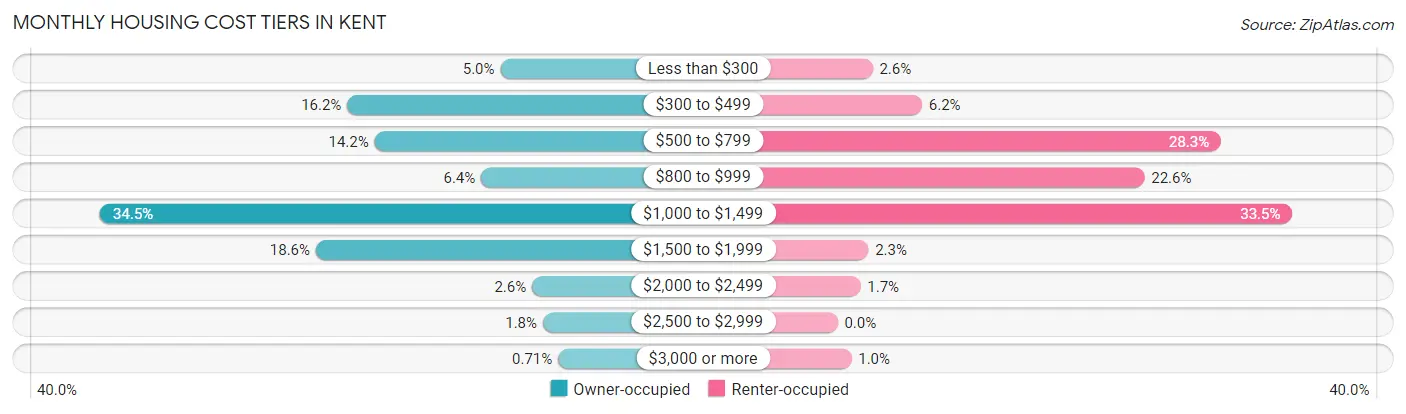
| Monthly Cost | Owner-occupied | Renter-occupied |
| Less than $300 | 217 (5.0%) | 151 (2.6%) |
| $300 to $499 | 710 (16.2%) | 364 (6.2%) |
| $500 to $799 | 622 (14.2%) | 1,654 (28.2%) |
| $800 to $999 | 279 (6.4%) | 1,323 (22.6%) |
| $1,000 to $1,499 | 1,506 (34.4%) | 1,961 (33.5%) |
| $1,500 to $1,999 | 811 (18.5%) | 133 (2.3%) |
| $2,000 to $2,499 | 115 (2.6%) | 99 (1.7%) |
| $2,500 to $2,999 | 80 (1.8%) | 0 (0.0%) |
| $3,000 or more | 31 (0.7%) | 60 (1.0%) |
| Total | 4,371 (100.0%) | 5,854 (100.0%) |
Physical Housing Characteristics in Kent
Housing Structures in Kent
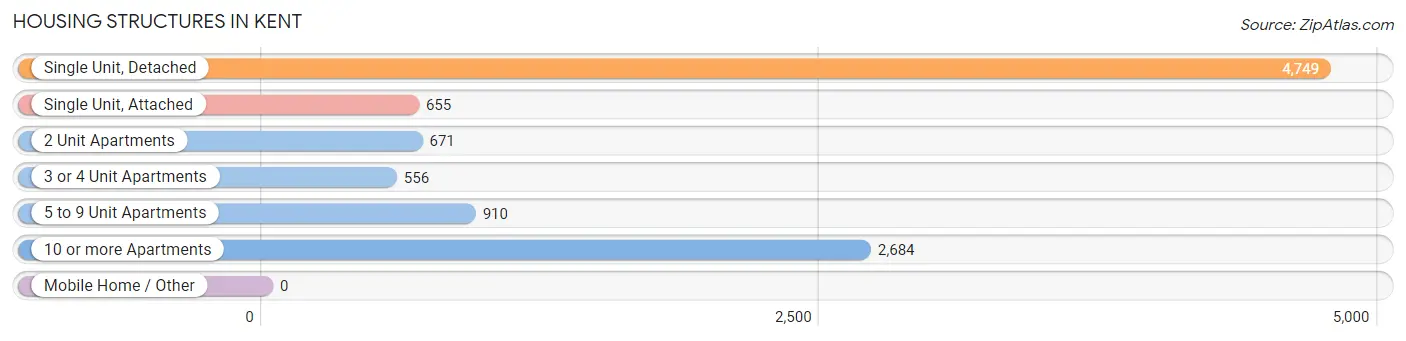
| Structure Type | # Housing Units | % Housing Units |
| Single Unit, Detached | 4,749 | 46.4% |
| Single Unit, Attached | 655 | 6.4% |
| 2 Unit Apartments | 671 | 6.6% |
| 3 or 4 Unit Apartments | 556 | 5.4% |
| 5 to 9 Unit Apartments | 910 | 8.9% |
| 10 or more Apartments | 2,684 | 26.3% |
| Mobile Home / Other | 0 | 0.0% |
| Total | 10,225 | 100.0% |
Housing Structures by Occupancy in Kent
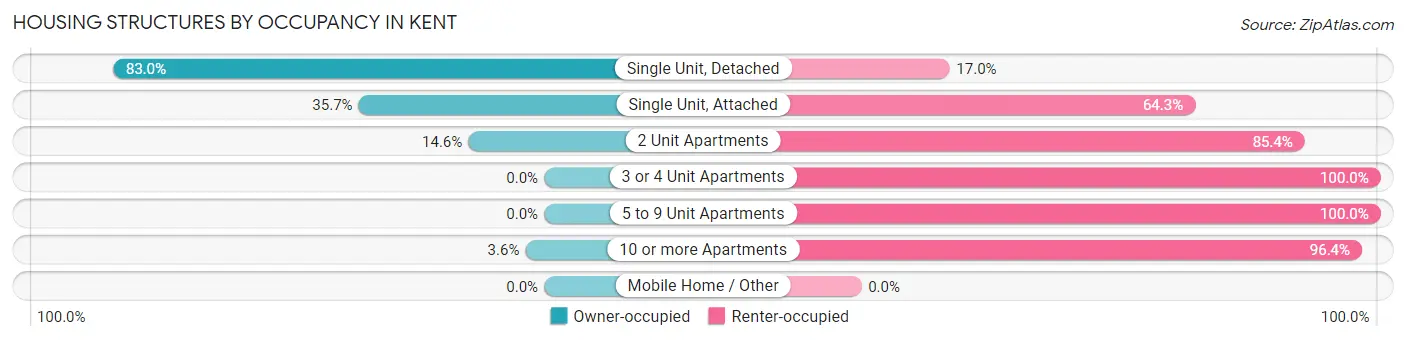
| Structure Type | Owner-occupied | Renter-occupied |
| Single Unit, Detached | 3,942 (83.0%) | 807 (17.0%) |
| Single Unit, Attached | 234 (35.7%) | 421 (64.3%) |
| 2 Unit Apartments | 98 (14.6%) | 573 (85.4%) |
| 3 or 4 Unit Apartments | 0 (0.0%) | 556 (100.0%) |
| 5 to 9 Unit Apartments | 0 (0.0%) | 910 (100.0%) |
| 10 or more Apartments | 97 (3.6%) | 2,587 (96.4%) |
| Mobile Home / Other | 0 (0.0%) | 0 (0.0%) |
| Total | 4,371 (42.7%) | 5,854 (57.3%) |
Housing Structures by Number of Rooms in Kent
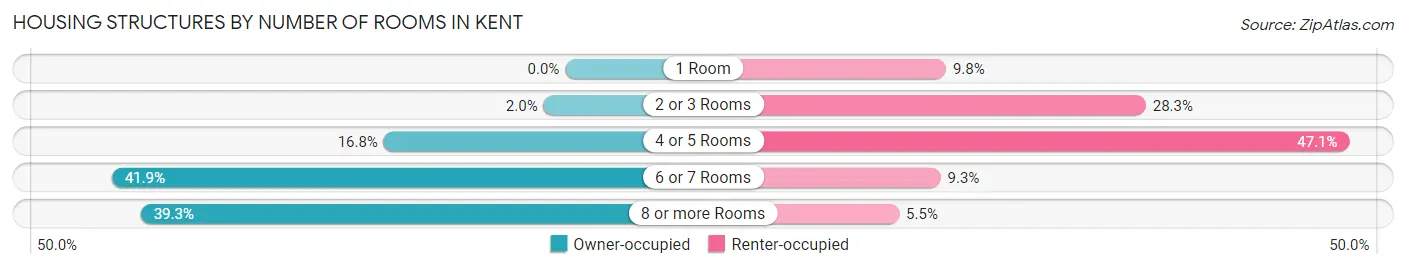
| Number of Rooms | Owner-occupied | Renter-occupied |
| 1 Room | 0 (0.0%) | 574 (9.8%) |
| 2 or 3 Rooms | 88 (2.0%) | 1,656 (28.3%) |
| 4 or 5 Rooms | 734 (16.8%) | 2,758 (47.1%) |
| 6 or 7 Rooms | 1,833 (41.9%) | 545 (9.3%) |
| 8 or more Rooms | 1,716 (39.3%) | 321 (5.5%) |
| Total | 4,371 (100.0%) | 5,854 (100.0%) |
Housing Structure by Heating Type in Kent
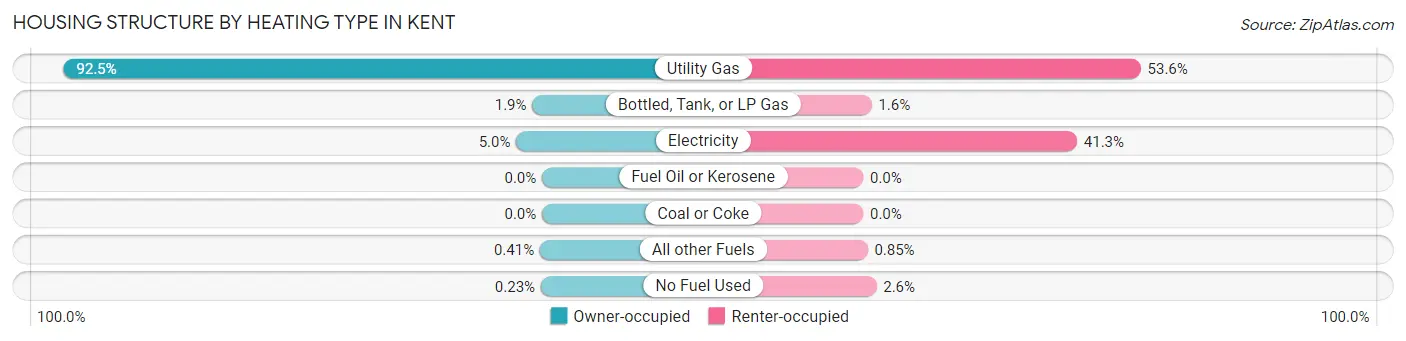
| Heating Type | Owner-occupied | Renter-occupied |
| Utility Gas | 4,043 (92.5%) | 3,140 (53.6%) |
| Bottled, Tank, or LP Gas | 82 (1.9%) | 95 (1.6%) |
| Electricity | 218 (5.0%) | 2,419 (41.3%) |
| Fuel Oil or Kerosene | 0 (0.0%) | 0 (0.0%) |
| Coal or Coke | 0 (0.0%) | 0 (0.0%) |
| All other Fuels | 18 (0.4%) | 50 (0.9%) |
| No Fuel Used | 10 (0.2%) | 150 (2.6%) |
| Total | 4,371 (100.0%) | 5,854 (100.0%) |
Household Vehicle Usage in Kent
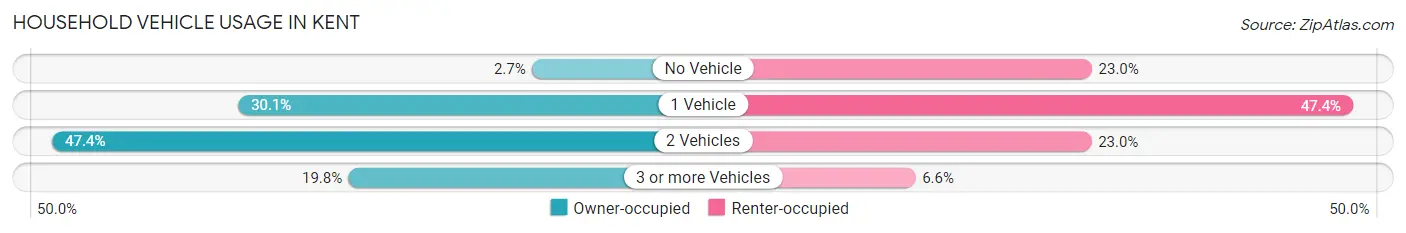
| Vehicles per Household | Owner-occupied | Renter-occupied |
| No Vehicle | 117 (2.7%) | 1,348 (23.0%) |
| 1 Vehicle | 1,315 (30.1%) | 2,776 (47.4%) |
| 2 Vehicles | 2,073 (47.4%) | 1,346 (23.0%) |
| 3 or more Vehicles | 866 (19.8%) | 384 (6.6%) |
| Total | 4,371 (100.0%) | 5,854 (100.0%) |
Real Estate & Mortgages in Kent
Real Estate and Mortgage Overview in Kent
| Characteristic | Without Mortgage | With Mortgage |
| Housing Units | 1,845 | 2,526 |
| Median Property Value | $159,500 | $216,900 |
| Median Household Income | $79,523 | $700 |
| Monthly Housing Costs | $517 | $31 |
| Real Estate Taxes | $2,948 | $8 |
Property Value by Mortgage Status in Kent
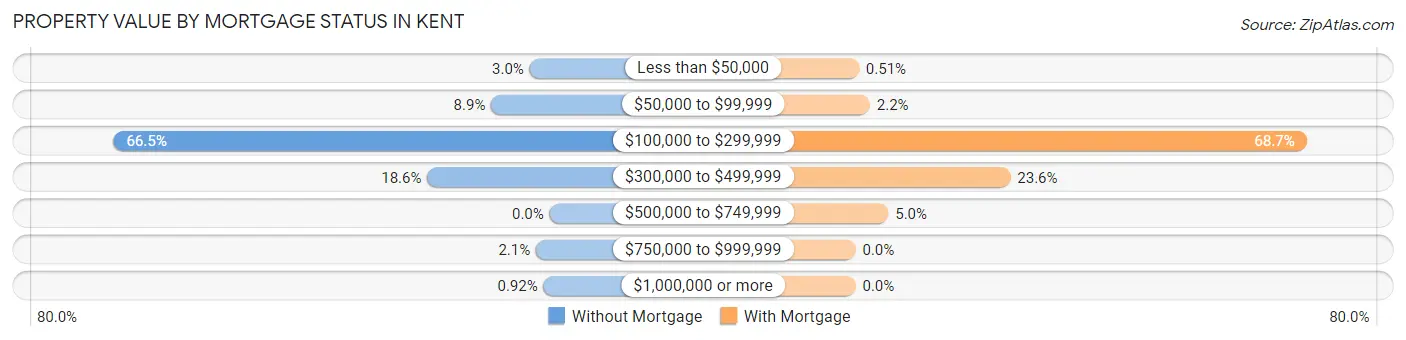
| Property Value | Without Mortgage | With Mortgage |
| Less than $50,000 | 56 (3.0%) | 13 (0.5%) |
| $50,000 to $99,999 | 164 (8.9%) | 55 (2.2%) |
| $100,000 to $299,999 | 1,226 (66.4%) | 1,736 (68.7%) |
| $300,000 to $499,999 | 344 (18.6%) | 596 (23.6%) |
| $500,000 to $749,999 | 0 (0.0%) | 126 (5.0%) |
| $750,000 to $999,999 | 38 (2.1%) | 0 (0.0%) |
| $1,000,000 or more | 17 (0.9%) | 0 (0.0%) |
| Total | 1,845 (100.0%) | 2,526 (100.0%) |
Household Income by Mortgage Status in Kent
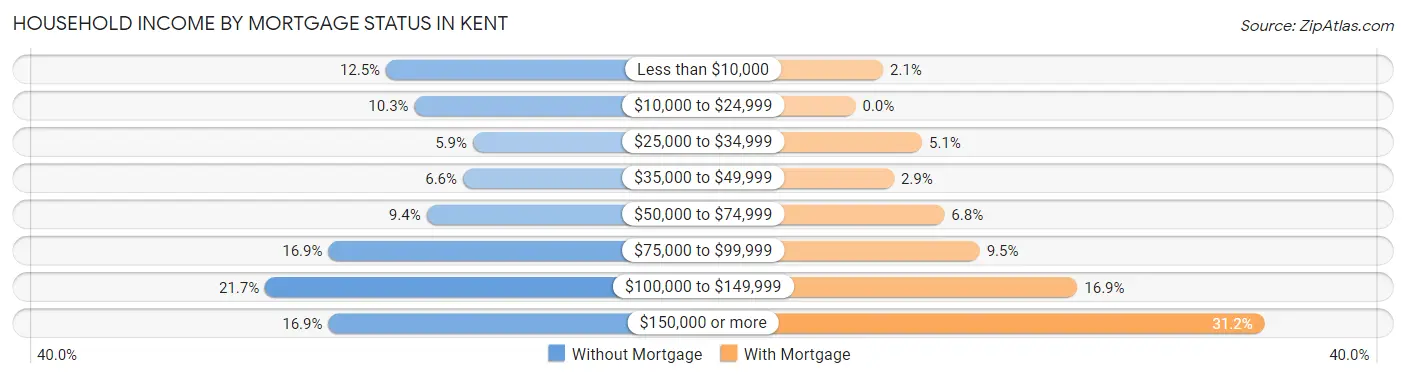
| Household Income | Without Mortgage | With Mortgage |
| Less than $10,000 | 230 (12.5%) | 53 (2.1%) |
| $10,000 to $24,999 | 190 (10.3%) | 0 (0.0%) |
| $25,000 to $34,999 | 108 (5.9%) | 128 (5.1%) |
| $35,000 to $49,999 | 122 (6.6%) | 74 (2.9%) |
| $50,000 to $74,999 | 173 (9.4%) | 171 (6.8%) |
| $75,000 to $99,999 | 311 (16.9%) | 239 (9.5%) |
| $100,000 to $149,999 | 400 (21.7%) | 427 (16.9%) |
| $150,000 or more | 311 (16.9%) | 787 (31.2%) |
| Total | 1,845 (100.0%) | 2,526 (100.0%) |
Property Value to Household Income Ratio in Kent
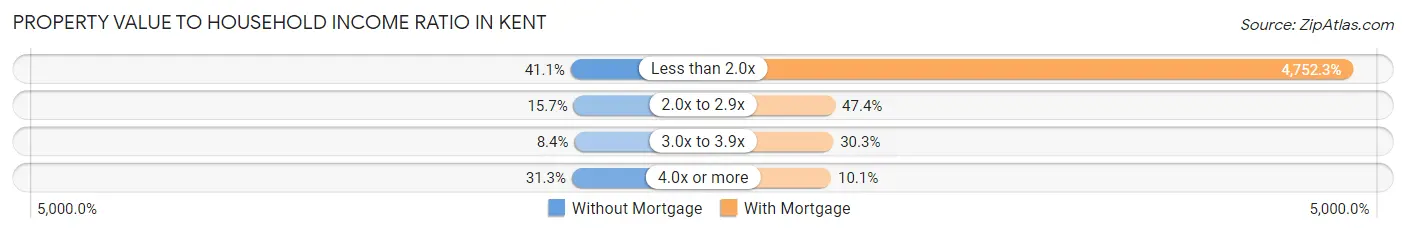
| Value-to-Income Ratio | Without Mortgage | With Mortgage |
| Less than 2.0x | 759 (41.1%) | 120,042 (4,752.3%) |
| 2.0x to 2.9x | 289 (15.7%) | 1,197 (47.4%) |
| 3.0x to 3.9x | 154 (8.4%) | 764 (30.2%) |
| 4.0x or more | 578 (31.3%) | 256 (10.1%) |
| Total | 1,845 (100.0%) | 2,526 (100.0%) |
Real Estate Taxes by Mortgage Status in Kent
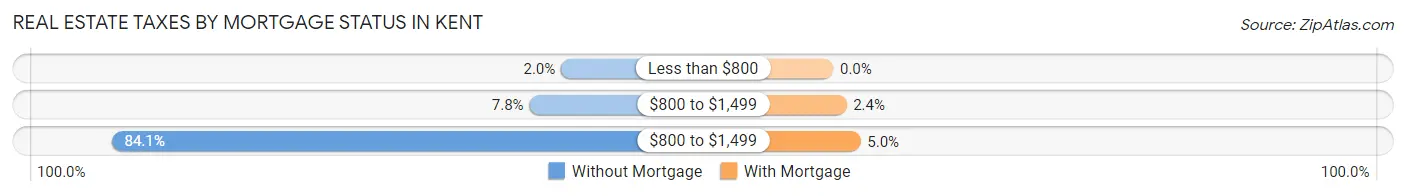
| Property Taxes | Without Mortgage | With Mortgage |
| Less than $800 | 37 (2.0%) | 0 (0.0%) |
| $800 to $1,499 | 144 (7.8%) | 61 (2.4%) |
| $800 to $1,499 | 1,552 (84.1%) | 126 (5.0%) |
| Total | 1,845 (100.0%) | 2,526 (100.0%) |
Health & Disability in Kent
Health Insurance Coverage by Age in Kent
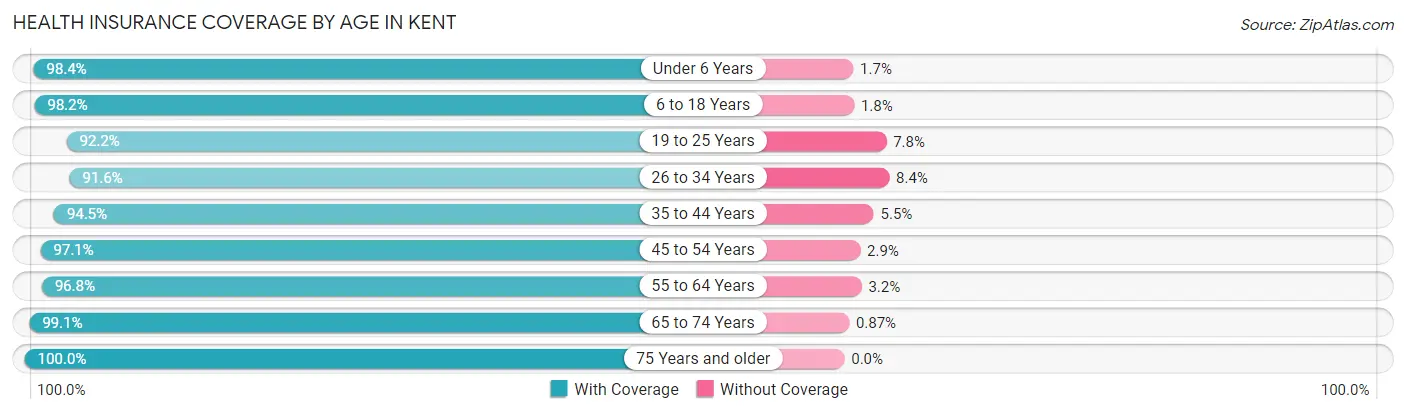
| Age Bracket | With Coverage | Without Coverage |
| Under 6 Years | 1,193 (98.4%) | 20 (1.7%) |
| 6 to 18 Years | 4,604 (98.2%) | 85 (1.8%) |
| 19 to 25 Years | 8,655 (92.2%) | 733 (7.8%) |
| 26 to 34 Years | 2,137 (91.6%) | 195 (8.4%) |
| 35 to 44 Years | 2,511 (94.5%) | 145 (5.5%) |
| 45 to 54 Years | 1,945 (97.1%) | 59 (2.9%) |
| 55 to 64 Years | 2,030 (96.8%) | 67 (3.2%) |
| 65 to 74 Years | 1,926 (99.1%) | 17 (0.9%) |
| 75 Years and older | 929 (100.0%) | 0 (0.0%) |
| Total | 25,930 (95.2%) | 1,321 (4.9%) |
Health Insurance Coverage by Citizenship Status in Kent
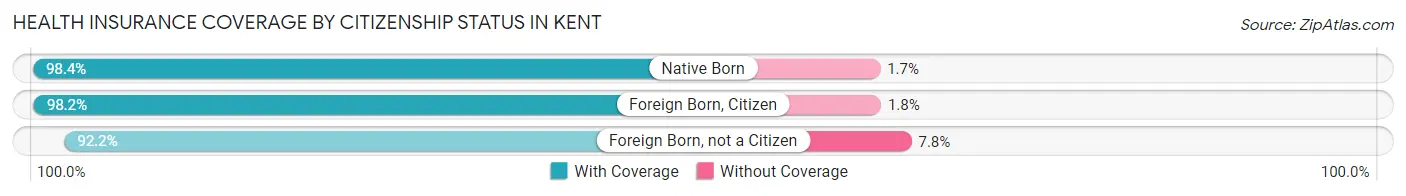
| Citizenship Status | With Coverage | Without Coverage |
| Native Born | 1,193 (98.4%) | 20 (1.7%) |
| Foreign Born, Citizen | 4,604 (98.2%) | 85 (1.8%) |
| Foreign Born, not a Citizen | 8,655 (92.2%) | 733 (7.8%) |
Health Insurance Coverage by Household Income in Kent
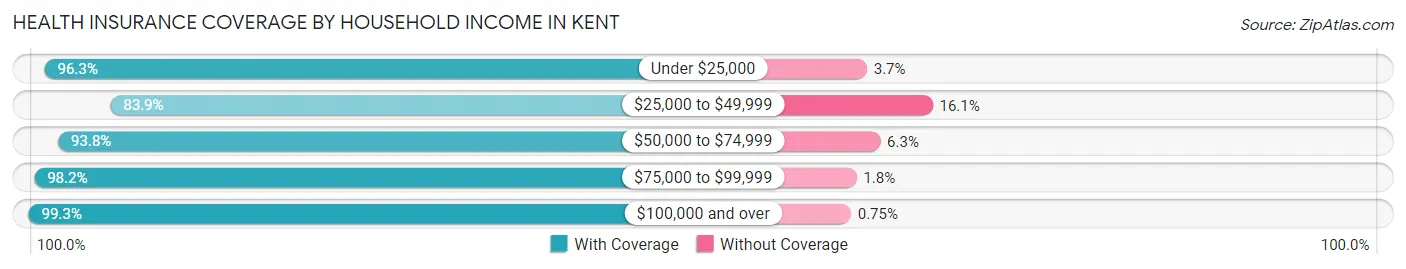
| Household Income | With Coverage | Without Coverage |
| Under $25,000 | 5,335 (96.3%) | 207 (3.7%) |
| $25,000 to $49,999 | 3,545 (83.9%) | 679 (16.1%) |
| $50,000 to $74,999 | 1,606 (93.8%) | 107 (6.2%) |
| $75,000 to $99,999 | 2,005 (98.2%) | 37 (1.8%) |
| $100,000 and over | 8,246 (99.3%) | 62 (0.7%) |
Public vs Private Health Insurance Coverage by Age in Kent
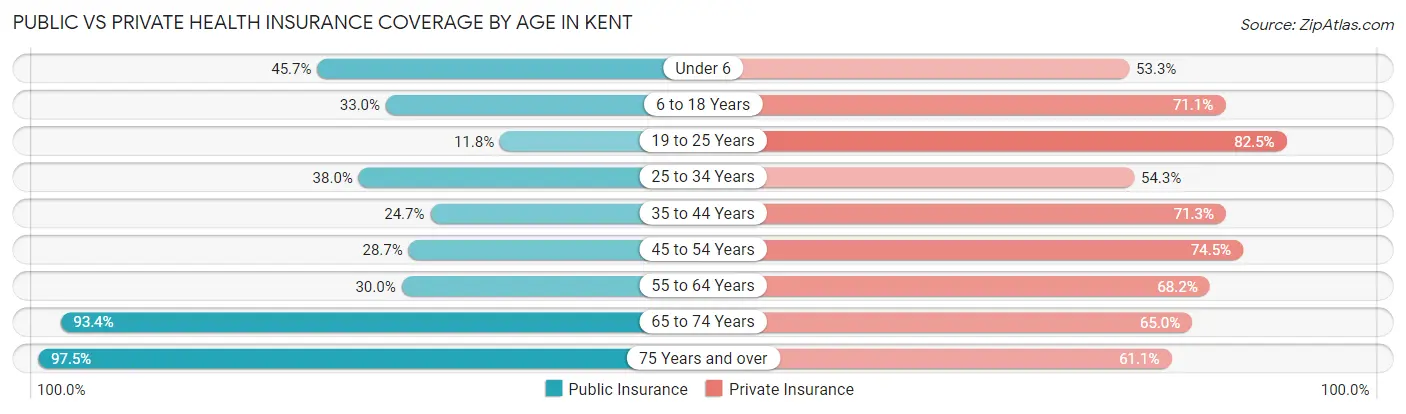
| Age Bracket | Public Insurance | Private Insurance |
| Under 6 | 554 (45.7%) | 647 (53.3%) |
| 6 to 18 Years | 1,545 (33.0%) | 3,335 (71.1%) |
| 19 to 25 Years | 1,104 (11.8%) | 7,747 (82.5%) |
| 25 to 34 Years | 886 (38.0%) | 1,265 (54.2%) |
| 35 to 44 Years | 656 (24.7%) | 1,893 (71.3%) |
| 45 to 54 Years | 576 (28.7%) | 1,492 (74.5%) |
| 55 to 64 Years | 630 (30.0%) | 1,431 (68.2%) |
| 65 to 74 Years | 1,814 (93.4%) | 1,263 (65.0%) |
| 75 Years and over | 906 (97.5%) | 568 (61.1%) |
| Total | 8,671 (31.8%) | 19,641 (72.1%) |
Disability Status by Sex by Age in Kent
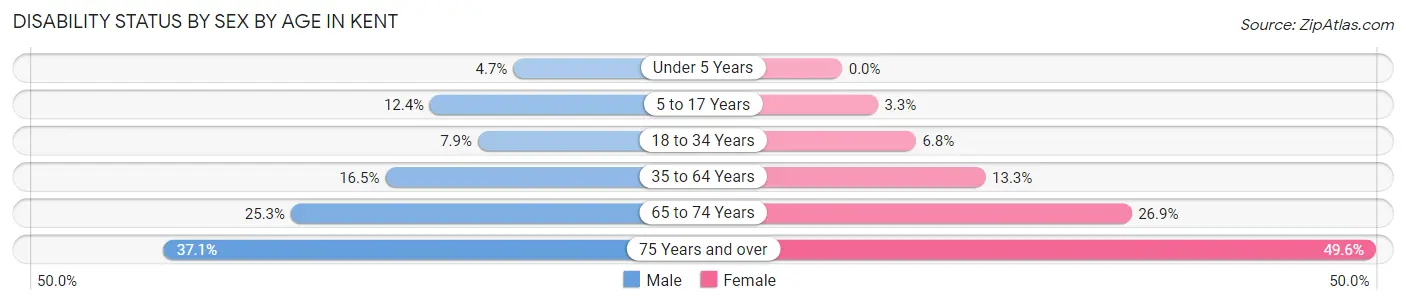
| Age Bracket | Male | Female |
| Under 5 Years | 19 (4.7%) | 0 (0.0%) |
| 5 to 17 Years | 157 (12.4%) | 54 (3.3%) |
| 18 to 34 Years | 516 (7.9%) | 505 (6.8%) |
| 35 to 64 Years | 549 (16.5%) | 457 (13.3%) |
| 65 to 74 Years | 240 (25.3%) | 267 (26.9%) |
| 75 Years and over | 99 (37.1%) | 328 (49.5%) |
Disability Class by Sex by Age in Kent
Disability Class: Hearing Difficulty
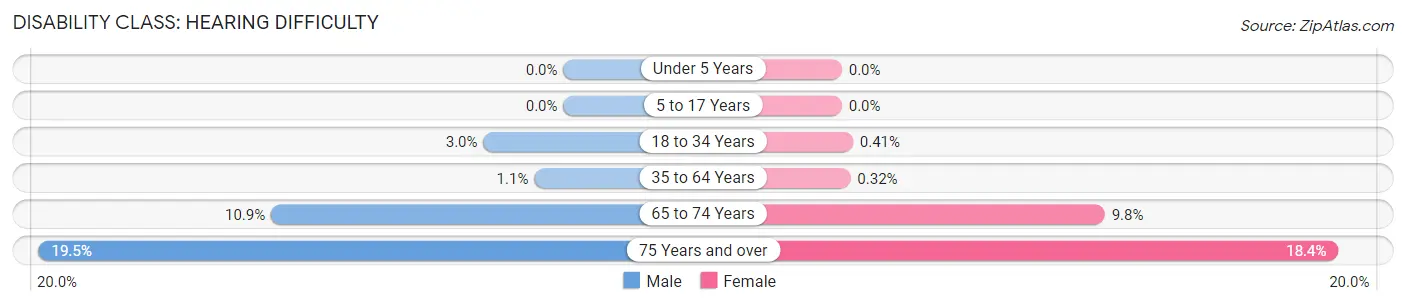
| Age Bracket | Male | Female |
| Under 5 Years | 0 (0.0%) | 0 (0.0%) |
| 5 to 17 Years | 0 (0.0%) | 0 (0.0%) |
| 18 to 34 Years | 193 (3.0%) | 30 (0.4%) |
| 35 to 64 Years | 36 (1.1%) | 11 (0.3%) |
| 65 to 74 Years | 103 (10.8%) | 97 (9.8%) |
| 75 Years and over | 52 (19.5%) | 122 (18.4%) |
Disability Class: Vision Difficulty
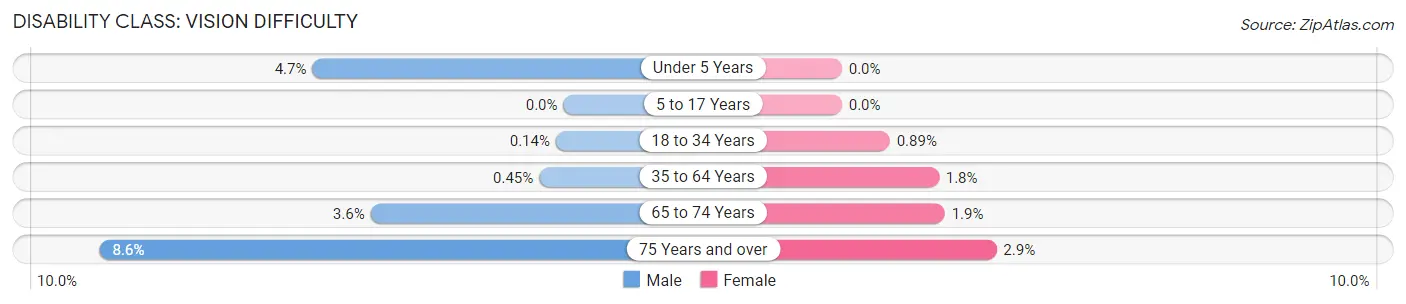
| Age Bracket | Male | Female |
| Under 5 Years | 19 (4.7%) | 0 (0.0%) |
| 5 to 17 Years | 0 (0.0%) | 0 (0.0%) |
| 18 to 34 Years | 9 (0.1%) | 66 (0.9%) |
| 35 to 64 Years | 15 (0.4%) | 62 (1.8%) |
| 65 to 74 Years | 34 (3.6%) | 19 (1.9%) |
| 75 Years and over | 23 (8.6%) | 19 (2.9%) |
Disability Class: Cognitive Difficulty
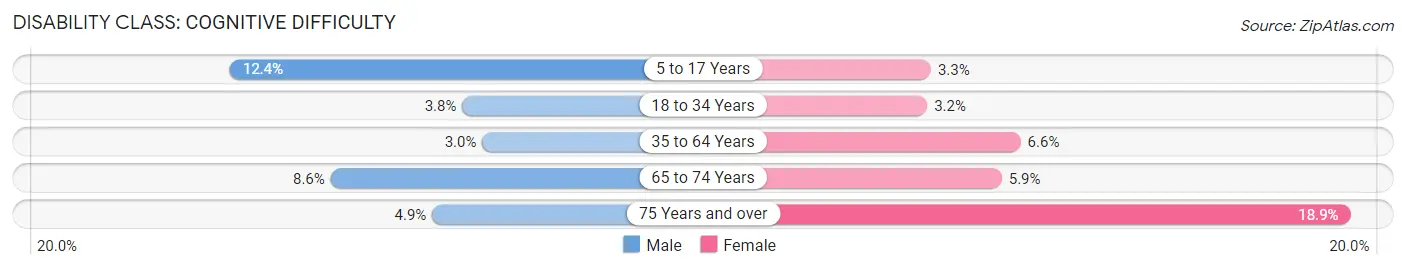
| Age Bracket | Male | Female |
| 5 to 17 Years | 157 (12.4%) | 54 (3.3%) |
| 18 to 34 Years | 244 (3.7%) | 234 (3.2%) |
| 35 to 64 Years | 100 (3.0%) | 228 (6.6%) |
| 65 to 74 Years | 82 (8.6%) | 59 (5.9%) |
| 75 Years and over | 13 (4.9%) | 125 (18.9%) |
Disability Class: Ambulatory Difficulty
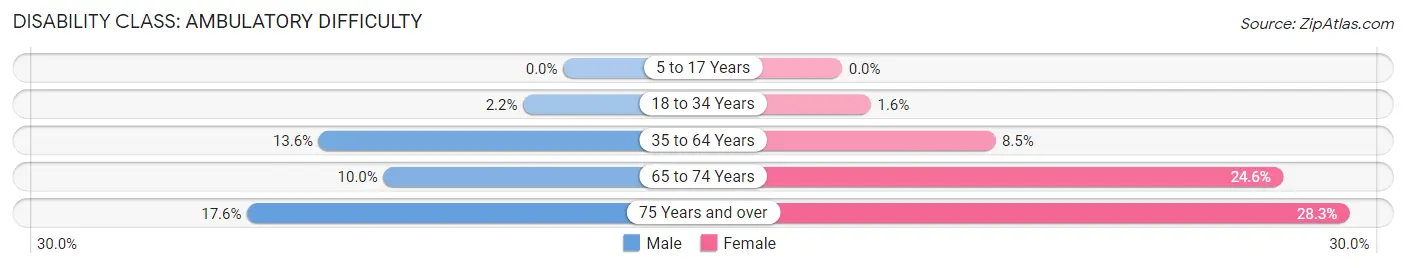
| Age Bracket | Male | Female |
| 5 to 17 Years | 0 (0.0%) | 0 (0.0%) |
| 18 to 34 Years | 145 (2.2%) | 118 (1.6%) |
| 35 to 64 Years | 452 (13.6%) | 293 (8.5%) |
| 65 to 74 Years | 95 (10.0%) | 244 (24.5%) |
| 75 Years and over | 47 (17.6%) | 187 (28.2%) |
Disability Class: Self-Care Difficulty
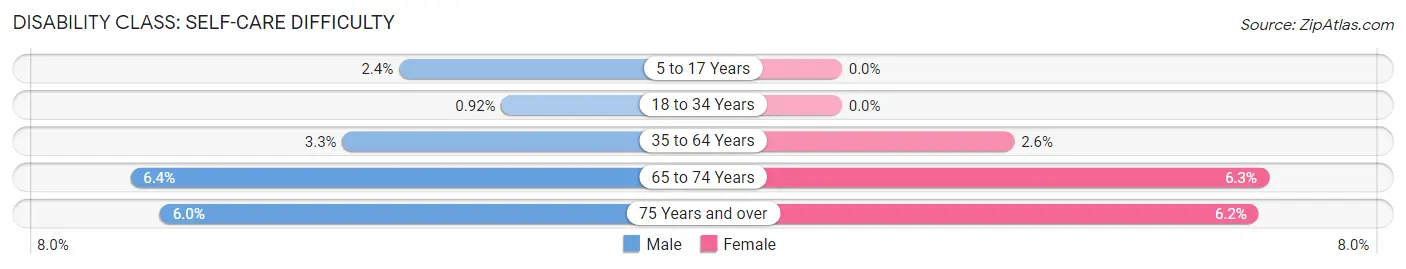
| Age Bracket | Male | Female |
| 5 to 17 Years | 31 (2.4%) | 0 (0.0%) |
| 18 to 34 Years | 60 (0.9%) | 0 (0.0%) |
| 35 to 64 Years | 109 (3.3%) | 88 (2.6%) |
| 65 to 74 Years | 61 (6.4%) | 63 (6.3%) |
| 75 Years and over | 16 (6.0%) | 41 (6.2%) |
Technology Access in Kent
Computing Device Access in Kent
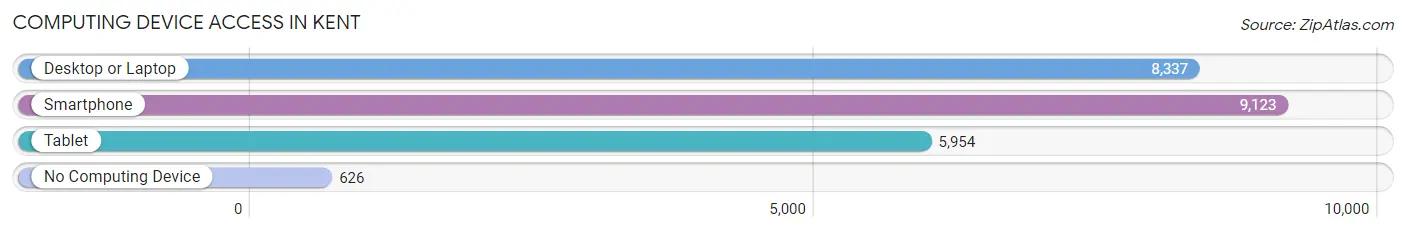
| Device Type | # Households | % Households |
| Desktop or Laptop | 8,337 | 81.5% |
| Smartphone | 9,123 | 89.2% |
| Tablet | 5,954 | 58.2% |
| No Computing Device | 626 | 6.1% |
| Total | 10,225 | 100.0% |
Internet Access in Kent
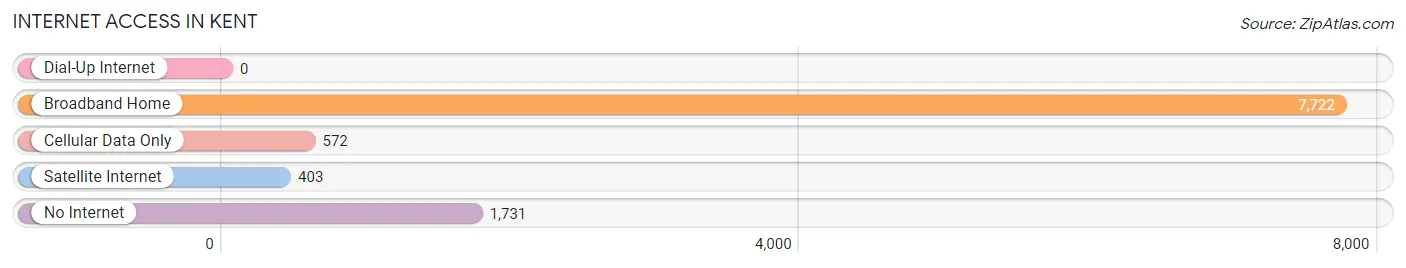
| Internet Type | # Households | % Households |
| Dial-Up Internet | 0 | 0.0% |
| Broadband Home | 7,722 | 75.5% |
| Cellular Data Only | 572 | 5.6% |
| Satellite Internet | 403 | 3.9% |
| No Internet | 1,731 | 16.9% |
| Total | 10,225 | 100.0% |
Kent Summary
Kent, Ohio is a city located in Portage County in the northeastern part of the state. It is situated along the Cuyahoga River and is part of the Akron metropolitan area. The city has a population of 28,904 as of the 2010 census, making it the largest city in Portage County.
History
The area that is now Kent was first settled in 1805 by John and Jacob Haymaker, who were among the first settlers in the area. The city was originally known as Franklin Mills, and was renamed Kent in 1864 after Marvin Kent, a local businessman. The city was incorporated in 1867 and has since grown to become the largest city in Portage County.
Geography
Kent is located at 41°10'N 81°20'W (41.17, -81.33). It is situated along the Cuyahoga River and is part of the Akron metropolitan area. The city has a total area of 8.3 square miles, of which 8.2 square miles is land and 0.1 square miles is water.
Economy
Kent is home to a variety of businesses and industries, including manufacturing, retail, and healthcare. The city is also home to Kent State University, which is one of the largest employers in the area. Other major employers include the Davey Tree Expert Company, the Kent City School District, and the Kent Free Library.
Demographics
As of the 2010 census, there were 28,904 people, 11,845 households, and 6,717 families residing in the city. The population density was 3,521.3 people per square mile. The racial makeup of the city was 87.2% White, 8.2% African American, 0.3% Native American, 1.7% Asian, 0.1% Pacific Islander, 0.7% from other races, and 1.9% from two or more races. Hispanic or Latino of any race were 2.7% of the population.
The median income for a household in the city was $37,945, and the median income for a family was $50,919. The per capita income for the city was $20,945. About 11.2% of families and 16.2% of the population were below the poverty line, including 22.2% of those under age 18 and 8.2% of those age 65 or over.
Overall, Kent is a diverse city with a rich history and a vibrant economy. It is home to a variety of businesses and industries, as well as Kent State University, which is one of the largest employers in the area. The city has a population of 28,904 as of the 2010 census, making it the largest city in Portage County.
Common Questions
What is Per Capita Income in Kent?
Per Capita income in Kent is $27,506.
What is the Median Family Income in Kent?
Median Family Income in Kent is $97,250.
What is the Median Household income in Kent?
Median Household Income in Kent is $37,505.
What is Income or Wage Gap in Kent?
Income or Wage Gap in Kent is 52.2%.
Women in Kent earn 47.8 cents for every dollar earned by a man.
What is Inequality or Gini Index in Kent?
Inequality or Gini Index in Kent is 0.53.
What is the Total Population of Kent?
Total Population of Kent is 27,336.
What is the Total Male Population of Kent?
Total Male Population of Kent is 12,738.
What is the Total Female Population of Kent?
Total Female Population of Kent is 14,598.
What is the Ratio of Males per 100 Females in Kent?
There are 87.26 Males per 100 Females in Kent.
What is the Ratio of Females per 100 Males in Kent?
There are 114.60 Females per 100 Males in Kent.
What is the Median Population Age in Kent?
Median Population Age in Kent is 23.8 Years.
What is the Average Family Size in Kent
Average Family Size in Kent is 2.9 People.
What is the Average Household Size in Kent
Average Household Size in Kent is 2.1 People.
How Large is the Labor Force in Kent?
There are 15,294 People in the Labor Forcein in Kent.
What is the Percentage of People in the Labor Force in Kent?
63.7% of People are in the Labor Force in Kent.
What is the Unemployment Rate in Kent?
Unemployment Rate in Kent is 10.7%.