Zip Codes with the Highest Percentage of Population Employed in Food Preparation & Serving in Chicopee, MA
RELATED REPORTS & OPTIONS
Food Preparation & Serving
Chicopee
Compare Zip Codes
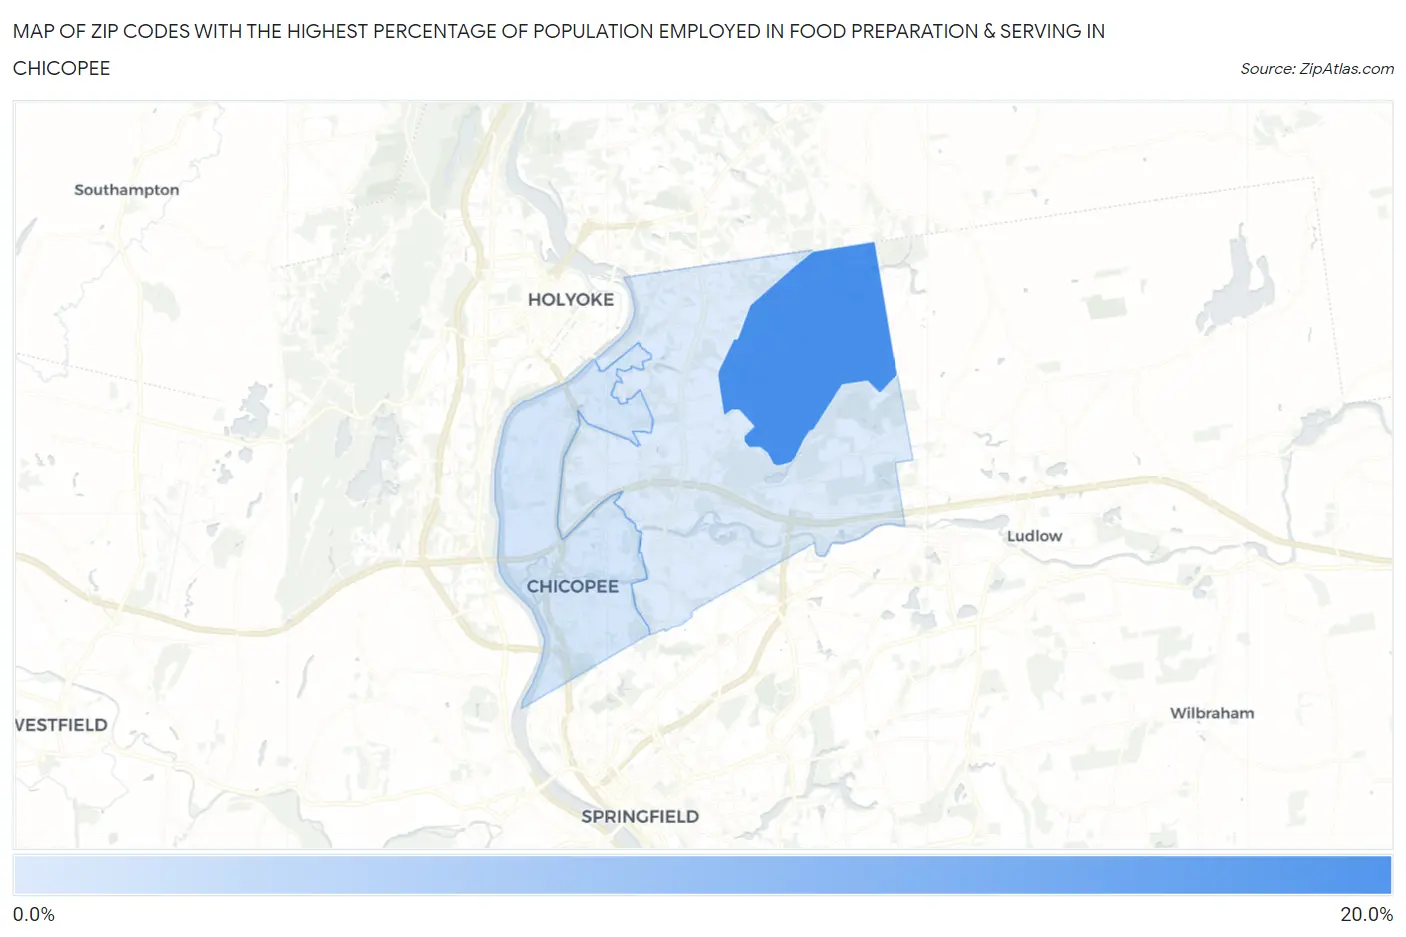
Map of Zip Codes with the Highest Percentage of Population Employed in Food Preparation & Serving in Chicopee
5.0%
19.6%
Zip Codes with the Highest Percentage of Population Employed in Food Preparation & Serving in Chicopee, MA
| Zip Code | % Employed | vs State | vs National | |
| 1. | 01022 | 19.6% | 4.6%(+14.9)#5 | 5.3%(+14.3)#528 |
| 2. | 01013 | 5.8% | 4.6%(+1.20)#127 | 5.3%(+0.529)#9,980 |
| 3. | 01020 | 5.0% | 4.6%(+0.408)#171 | 5.3%(-0.267)#12,873 |
1
Common Questions
What are the Top Zip Codes with the Highest Percentage of Population Employed in Food Preparation & Serving in Chicopee, MA?
Top Zip Codes with the Highest Percentage of Population Employed in Food Preparation & Serving in Chicopee, MA are:
What zip code has the Highest Percentage of Population Employed in Food Preparation & Serving in Chicopee, MA?
01022 has the Highest Percentage of Population Employed in Food Preparation & Serving in Chicopee, MA with 19.6%.
What is the Percentage of Population Employed in Food Preparation & Serving in Chicopee, MA?
Percentage of Population Employed in Food Preparation & Serving in Chicopee is 5.8%.
What is the Percentage of Population Employed in Food Preparation & Serving in Massachusetts?
Percentage of Population Employed in Food Preparation & Serving in Massachusetts is 4.6%.
What is the Percentage of Population Employed in Food Preparation & Serving in the United States?
Percentage of Population Employed in Food Preparation & Serving in the United States is 5.3%.