South Ashburnham, MA Map & Demographics
South Ashburnham Map
South Ashburnham Overview
$39,876
PER CAPITA INCOME
$102,216
AVG FAMILY INCOME
$100,455
AVG HOUSEHOLD INCOME
33.4%
WAGE / INCOME GAP [ % ]
66.6¢/ $1
WAGE / INCOME GAP [ $ ]
0.40
INEQUALITY / GINI INDEX
1,049
TOTAL POPULATION
555
MALE POPULATION
494
FEMALE POPULATION
112.35
MALES / 100 FEMALES
89.01
FEMALES / 100 MALES
47.0
MEDIAN AGE
2.8
AVG FAMILY SIZE
2.7
AVG HOUSEHOLD SIZE
583
LABOR FORCE [ PEOPLE ]
66.4%
PERCENT IN LABOR FORCE
Income in South Ashburnham
Income Overview in South Ashburnham
Per Capita Income in South Ashburnham is $39,876, while median incomes of families and households are $102,216 and $100,455 respectively.
| Characteristic | Number | Measure |
| Per Capita Income | 1,049 | $39,876 |
| Median Family Income | 359 | $102,216 |
| Mean Family Income | 359 | $108,241 |
| Median Household Income | 390 | $100,455 |
| Mean Household Income | 390 | $103,064 |
| Income Deficit | 359 | $0 |
| Wage / Income Gap (%) | 1,049 | 33.38% |
| Wage / Income Gap ($) | 1,049 | 66.62¢ per $1 |
| Gini / Inequality Index | 1,049 | 0.40 |
Earnings by Sex in South Ashburnham
Average Earnings in South Ashburnham are $60,353, $51,699 for men and $77,600 for women, a difference of 33.4%.
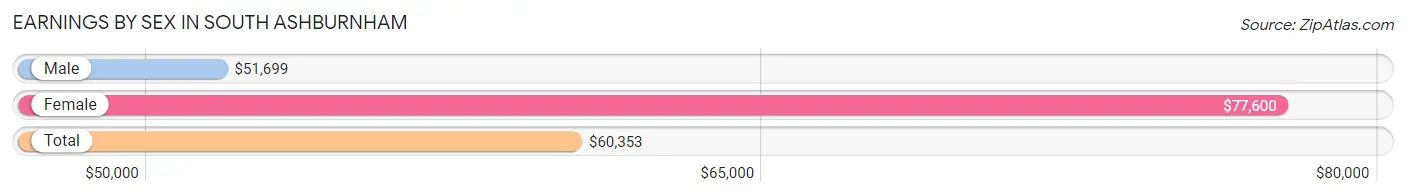
| Sex | Number | Average Earnings |
| Male | 307 (51.4%) | $51,699 |
| Female | 290 (48.6%) | $77,600 |
| Total | 597 (100.0%) | $60,353 |
Earnings by Sex by Income Bracket in South Ashburnham
The most common earnings brackets in South Ashburnham are $75,000 to $99,999 for men (91 | 29.6%) and $100,000+ for women (74 | 25.5%).
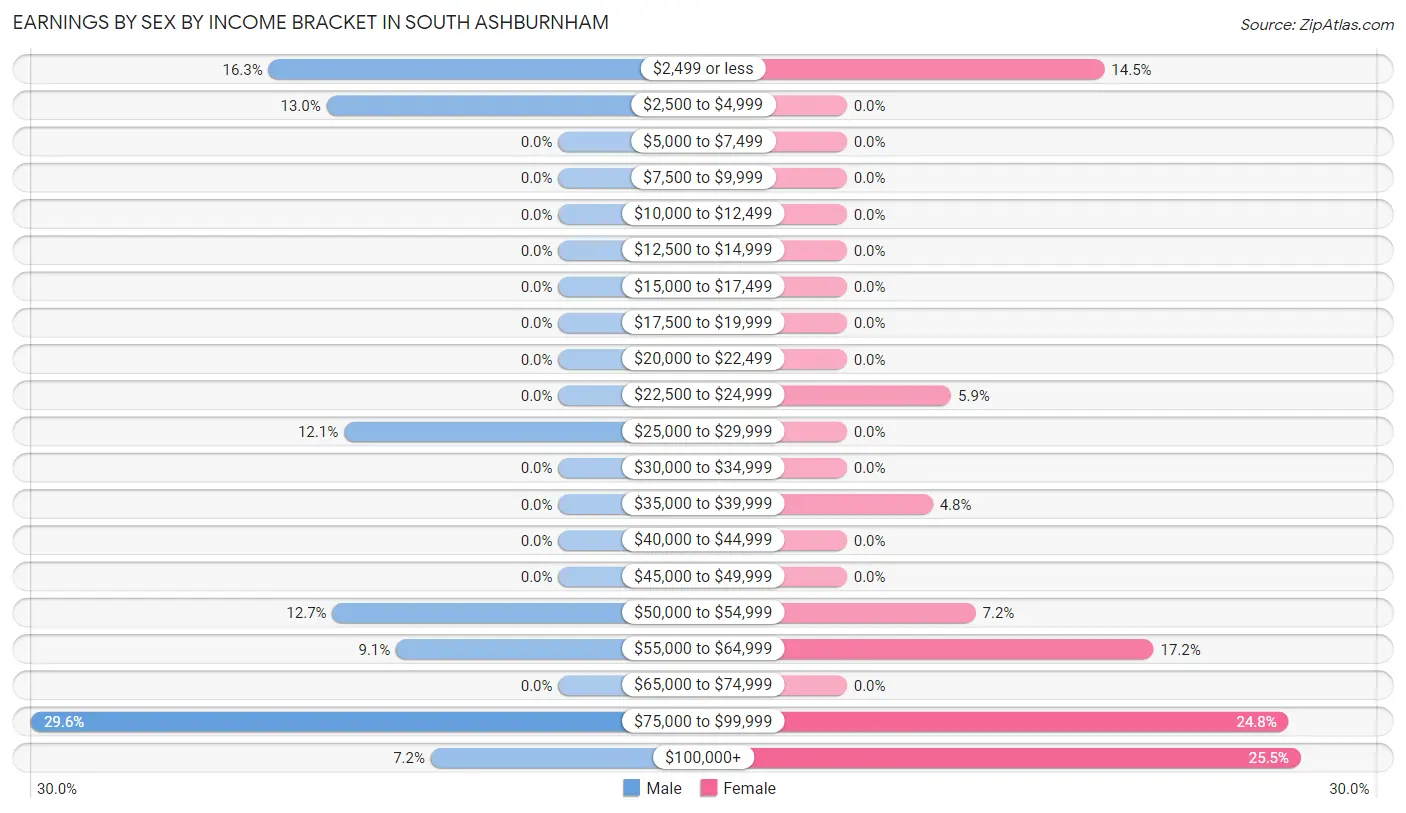
| Income | Male | Female |
| $2,499 or less | 50 (16.3%) | 42 (14.5%) |
| $2,500 to $4,999 | 40 (13.0%) | 0 (0.0%) |
| $5,000 to $7,499 | 0 (0.0%) | 0 (0.0%) |
| $7,500 to $9,999 | 0 (0.0%) | 0 (0.0%) |
| $10,000 to $12,499 | 0 (0.0%) | 0 (0.0%) |
| $12,500 to $14,999 | 0 (0.0%) | 0 (0.0%) |
| $15,000 to $17,499 | 0 (0.0%) | 0 (0.0%) |
| $17,500 to $19,999 | 0 (0.0%) | 0 (0.0%) |
| $20,000 to $22,499 | 0 (0.0%) | 0 (0.0%) |
| $22,500 to $24,999 | 0 (0.0%) | 17 (5.9%) |
| $25,000 to $29,999 | 37 (12.0%) | 0 (0.0%) |
| $30,000 to $34,999 | 0 (0.0%) | 0 (0.0%) |
| $35,000 to $39,999 | 0 (0.0%) | 14 (4.8%) |
| $40,000 to $44,999 | 0 (0.0%) | 0 (0.0%) |
| $45,000 to $49,999 | 0 (0.0%) | 0 (0.0%) |
| $50,000 to $54,999 | 39 (12.7%) | 21 (7.2%) |
| $55,000 to $64,999 | 28 (9.1%) | 50 (17.2%) |
| $65,000 to $74,999 | 0 (0.0%) | 0 (0.0%) |
| $75,000 to $99,999 | 91 (29.6%) | 72 (24.8%) |
| $100,000+ | 22 (7.2%) | 74 (25.5%) |
| Total | 307 (100.0%) | 290 (100.0%) |
Earnings by Sex by Educational Attainment in South Ashburnham
Average earnings in South Ashburnham are $82,344 for men and $77,600 for women, a difference of 5.8%. Men with an educational attainment of college or associate's degree enjoy the highest average annual earnings of $90,268, while those with college or associate's degree education earn the least with $90,268. Women with an educational attainment of college or associate's degree earn the most with the average annual earnings of $79,300, while those with bachelor's degree education have the smallest earnings of $60,625.
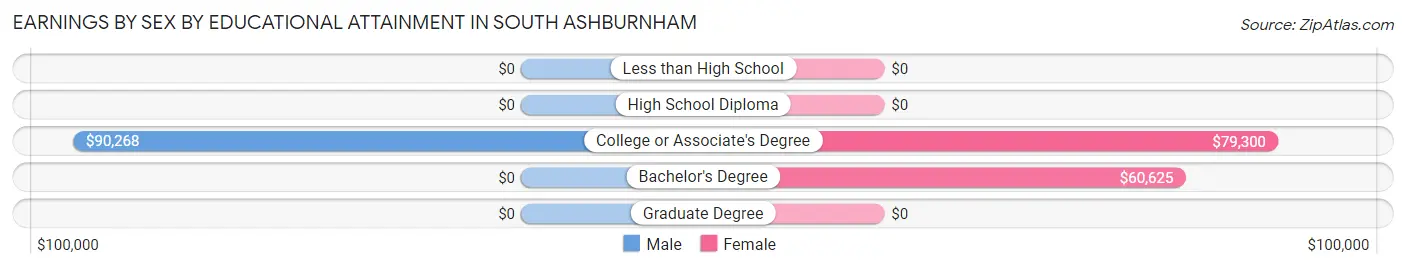
| Educational Attainment | Male Income | Female Income |
| Less than High School | - | - |
| High School Diploma | - | - |
| College or Associate's Degree | $90,268 | $79,300 |
| Bachelor's Degree | - | - |
| Graduate Degree | - | - |
| Total | $82,344 | $77,600 |
Family Income in South Ashburnham
Family Income Brackets in South Ashburnham
According to the South Ashburnham family income data, there are 113 families falling into the $100,000 to $149,999 income range, which is the most common income bracket and makes up 31.5% of all families.
| Income Bracket | # Families | % Families |
| Less than $10,000 | 42 | 11.7% |
| $10,000 to $14,999 | 0 | 0.0% |
| $15,000 to $24,999 | 0 | 0.0% |
| $25,000 to $34,999 | 0 | 0.0% |
| $35,000 to $49,999 | 88 | 24.5% |
| $50,000 to $74,999 | 5 | 1.4% |
| $75,000 to $99,999 | 25 | 7.0% |
| $100,000 to $149,999 | 113 | 31.5% |
| $150,000 to $199,999 | 51 | 14.2% |
| $200,000+ | 35 | 9.7% |
Family Income by Famaliy Size in South Ashburnham
3-person families (94 | 26.2%) account for the highest median family income in South Ashburnham with $162,756 per family, while 3-person families (94 | 26.2%) have the highest median income of $54,252 per family member.
| Income Bracket | # Families | Median Income |
| 2-Person Families | 188 (52.4%) | $78,100 |
| 3-Person Families | 94 (26.2%) | $162,756 |
| 4-Person Families | 42 (11.7%) | $0 |
| 5-Person Families | 35 (9.8%) | $0 |
| 6-Person Families | 0 (0.0%) | $0 |
| 7+ Person Families | 0 (0.0%) | $0 |
| Total | 359 (100.0%) | $102,216 |
Family Income by Number of Earners in South Ashburnham
| Number of Earners | # Families | Median Income |
| No Earners | 72 (20.1%) | $39,808 |
| 1 Earner | 100 (27.9%) | $100,455 |
| 2 Earners | 134 (37.3%) | $148,108 |
| 3+ Earners | 53 (14.8%) | $0 |
| Total | 359 (100.0%) | $102,216 |
Household Income in South Ashburnham
Household Income Brackets in South Ashburnham
With 113 households falling in the category, the $100,000 to $149,999 income range is the most frequent in South Ashburnham, accounting for 29.0% of all households.
| Income Bracket | # Households | % Households |
| Less than $10,000 | 42 | 10.8% |
| $10,000 to $14,999 | 0 | 0.0% |
| $15,000 to $24,999 | 0 | 0.0% |
| $25,000 to $34,999 | 17 | 4.4% |
| $35,000 to $49,999 | 88 | 22.6% |
| $50,000 to $74,999 | 19 | 4.9% |
| $75,000 to $99,999 | 25 | 6.4% |
| $100,000 to $149,999 | 113 | 29.0% |
| $150,000 to $199,999 | 51 | 13.1% |
| $200,000+ | 35 | 9.0% |
Household Income by Householder Age in South Ashburnham
The median household income in South Ashburnham is $100,455, with the highest median household income of $148,180 found in the 45 to 64 years age bracket for the primary householder. A total of 231 households (59.2%) fall into this category.
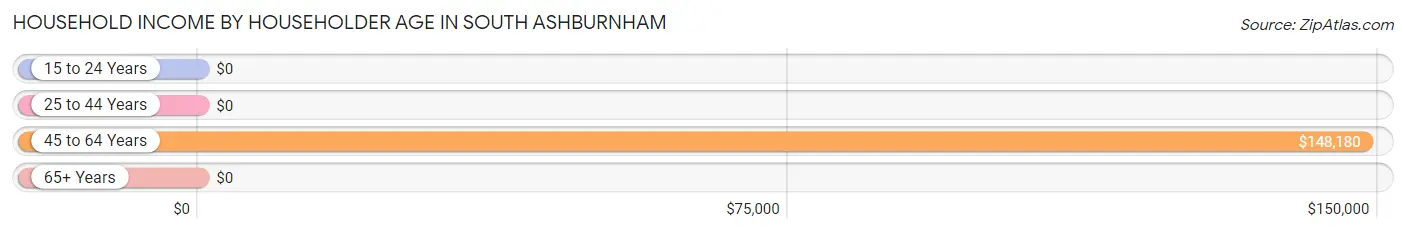
| Income Bracket | # Households | Median Income |
| 15 to 24 Years | 0 (0.0%) | $0 |
| 25 to 44 Years | 67 (17.2%) | $0 |
| 45 to 64 Years | 231 (59.2%) | $148,180 |
| 65+ Years | 92 (23.6%) | $0 |
| Total | 390 (100.0%) | $100,455 |
Poverty in South Ashburnham
Income Below Poverty by Sex and Age in South Ashburnham
With 16.4% poverty level for males and 17.4% for females among the residents of South Ashburnham, 35 to 44 year old males and 12 to 14 year old females are the most vulnerable to poverty, with 44 males (100.0%) and 44 females (100.0%) in their respective age groups living below the poverty level.
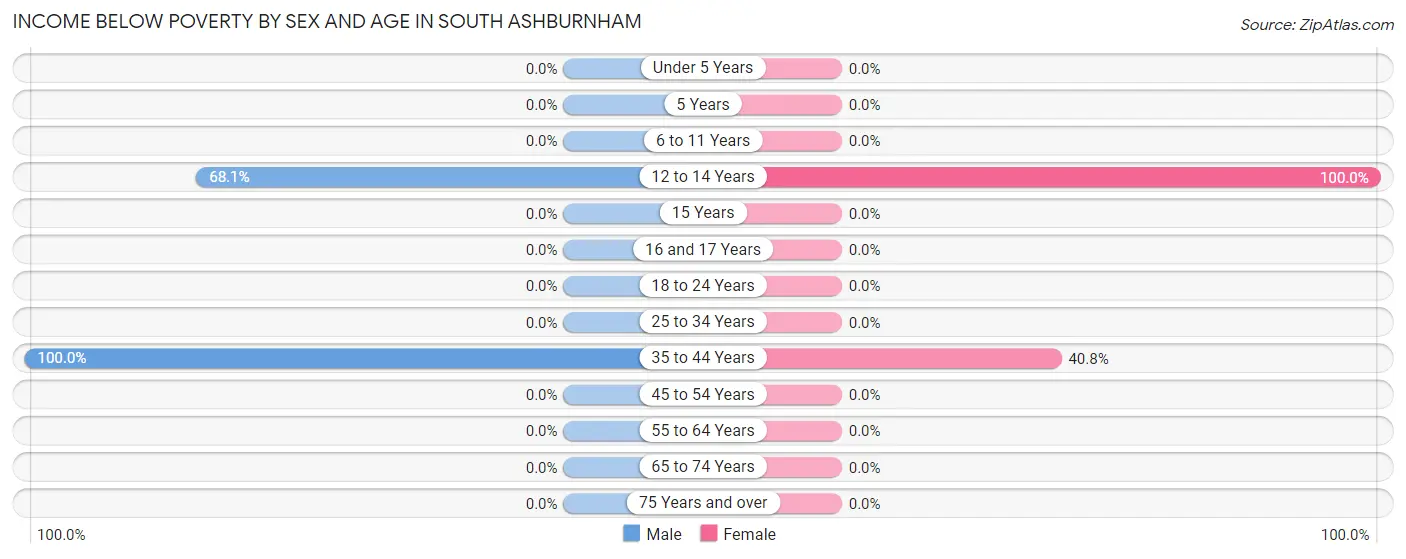
| Age Bracket | Male | Female |
| Under 5 Years | 0 (0.0%) | 0 (0.0%) |
| 5 Years | 0 (0.0%) | 0 (0.0%) |
| 6 to 11 Years | 0 (0.0%) | 0 (0.0%) |
| 12 to 14 Years | 47 (68.1%) | 44 (100.0%) |
| 15 Years | 0 (0.0%) | 0 (0.0%) |
| 16 and 17 Years | 0 (0.0%) | 0 (0.0%) |
| 18 to 24 Years | 0 (0.0%) | 0 (0.0%) |
| 25 to 34 Years | 0 (0.0%) | 0 (0.0%) |
| 35 to 44 Years | 44 (100.0%) | 42 (40.8%) |
| 45 to 54 Years | 0 (0.0%) | 0 (0.0%) |
| 55 to 64 Years | 0 (0.0%) | 0 (0.0%) |
| 65 to 74 Years | 0 (0.0%) | 0 (0.0%) |
| 75 Years and over | 0 (0.0%) | 0 (0.0%) |
| Total | 91 (16.4%) | 86 (17.4%) |
Income Above Poverty by Sex and Age in South Ashburnham
According to the poverty statistics in South Ashburnham, males aged 6 to 11 years and females aged 15 years are the age groups that are most secure financially, with 100.0% of males and 100.0% of females in these age groups living above the poverty line.
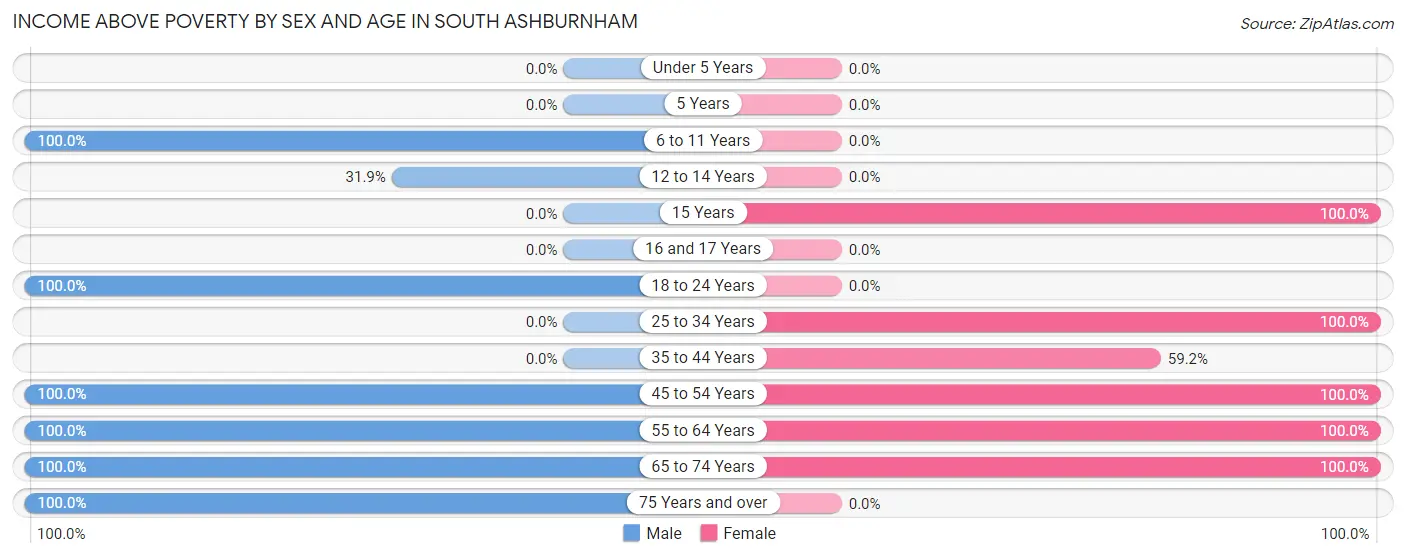
| Age Bracket | Male | Female |
| Under 5 Years | 0 (0.0%) | 0 (0.0%) |
| 5 Years | 0 (0.0%) | 0 (0.0%) |
| 6 to 11 Years | 22 (100.0%) | 0 (0.0%) |
| 12 to 14 Years | 22 (31.9%) | 0 (0.0%) |
| 15 Years | 0 (0.0%) | 36 (100.0%) |
| 16 and 17 Years | 0 (0.0%) | 0 (0.0%) |
| 18 to 24 Years | 111 (100.0%) | 0 (0.0%) |
| 25 to 34 Years | 0 (0.0%) | 55 (100.0%) |
| 35 to 44 Years | 0 (0.0%) | 61 (59.2%) |
| 45 to 54 Years | 97 (100.0%) | 91 (100.0%) |
| 55 to 64 Years | 121 (100.0%) | 107 (100.0%) |
| 65 to 74 Years | 62 (100.0%) | 58 (100.0%) |
| 75 Years and over | 29 (100.0%) | 0 (0.0%) |
| Total | 464 (83.6%) | 408 (82.6%) |
Income Below Poverty Among Married-Couple Families in South Ashburnham
The poverty statistics for married-couple families in South Ashburnham show that 14.0% or 42 of the total 300 families live below the poverty line. Families with 1 or 2 children have the highest poverty rate of 43.3%, comprising of 42 families. On the other hand, families with no children have the lowest poverty rate of 0.0%, which includes 0 families.
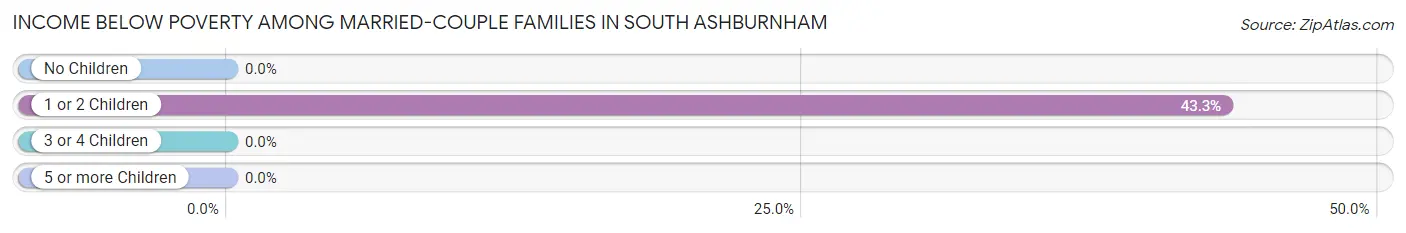
| Children | Above Poverty | Below Poverty |
| No Children | 203 (100.0%) | 0 (0.0%) |
| 1 or 2 Children | 55 (56.7%) | 42 (43.3%) |
| 3 or 4 Children | 0 (0.0%) | 0 (0.0%) |
| 5 or more Children | 0 (0.0%) | 0 (0.0%) |
| Total | 258 (86.0%) | 42 (14.0%) |
Income Below Poverty Among Single-Parent Households in South Ashburnham
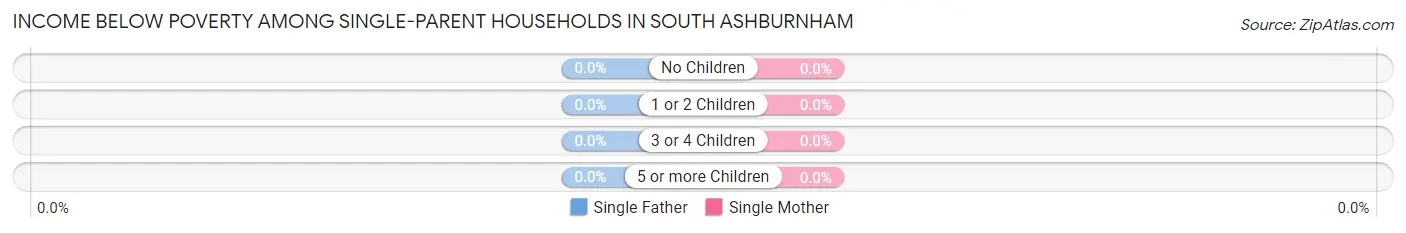
| Children | Single Father | Single Mother |
| No Children | 0 (0.0%) | 0 (0.0%) |
| 1 or 2 Children | 0 (0.0%) | 0 (0.0%) |
| 3 or 4 Children | 0 (0.0%) | 0 (0.0%) |
| 5 or more Children | 0 (0.0%) | 0 (0.0%) |
| Total | 0 (0.0%) | 0 (0.0%) |
Income Below Poverty Among Married-Couple vs Single-Parent Households in South Ashburnham
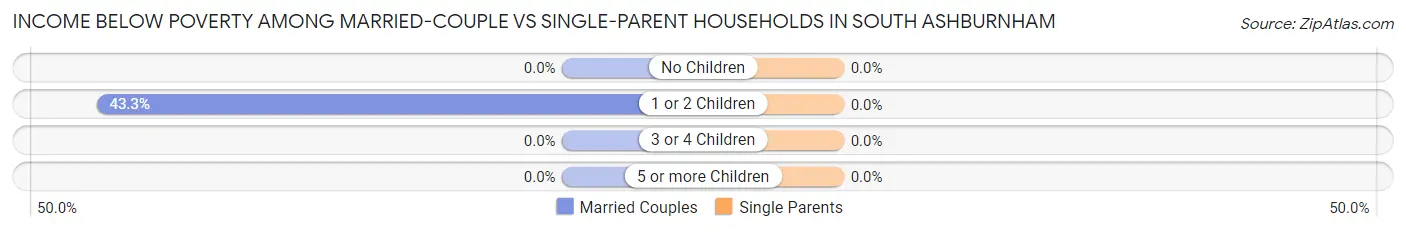
| Children | Married-Couple Families | Single-Parent Households |
| No Children | 0 (0.0%) | 0 (0.0%) |
| 1 or 2 Children | 42 (43.3%) | 0 (0.0%) |
| 3 or 4 Children | 0 (0.0%) | 0 (0.0%) |
| 5 or more Children | 0 (0.0%) | 0 (0.0%) |
| Total | 42 (14.0%) | 0 (0.0%) |
Race in South Ashburnham
The most populous races in South Ashburnham are White / Caucasian (1,021 | 97.3%), Hispanic or Latino (141 | 13.4%), and Two or more Races (28 | 2.7%).
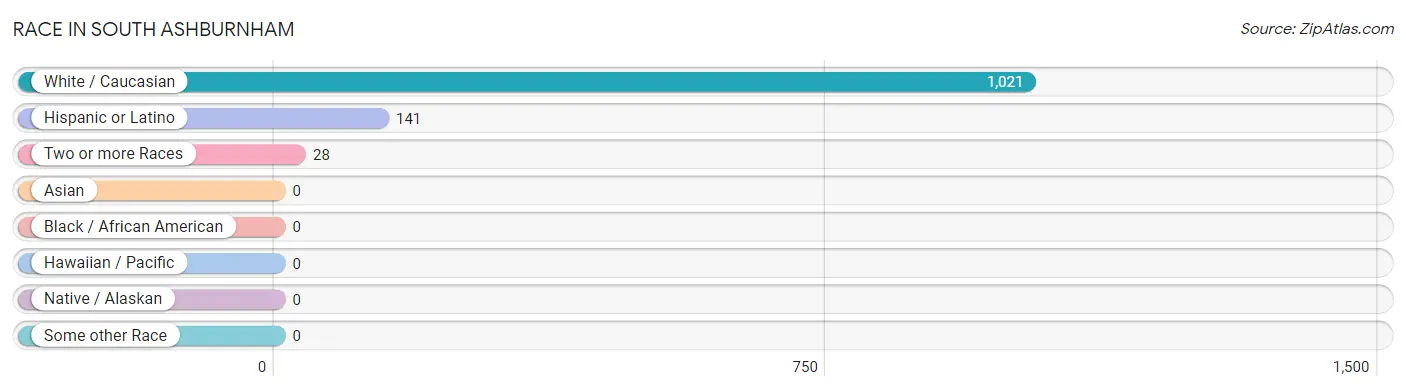
| Race | # Population | % Population |
| Asian | 0 | 0.0% |
| Black / African American | 0 | 0.0% |
| Hawaiian / Pacific | 0 | 0.0% |
| Hispanic or Latino | 141 | 13.4% |
| Native / Alaskan | 0 | 0.0% |
| White / Caucasian | 1,021 | 97.3% |
| Two or more Races | 28 | 2.7% |
| Some other Race | 0 | 0.0% |
| Total | 1,049 | 100.0% |
Ancestry in South Ashburnham
The most populous ancestries reported in South Ashburnham are Irish (282 | 26.9%), German (161 | 15.3%), French (124 | 11.8%), English (121 | 11.5%), and Mexican (94 | 9.0%), together accounting for 74.5% of all South Ashburnham residents.
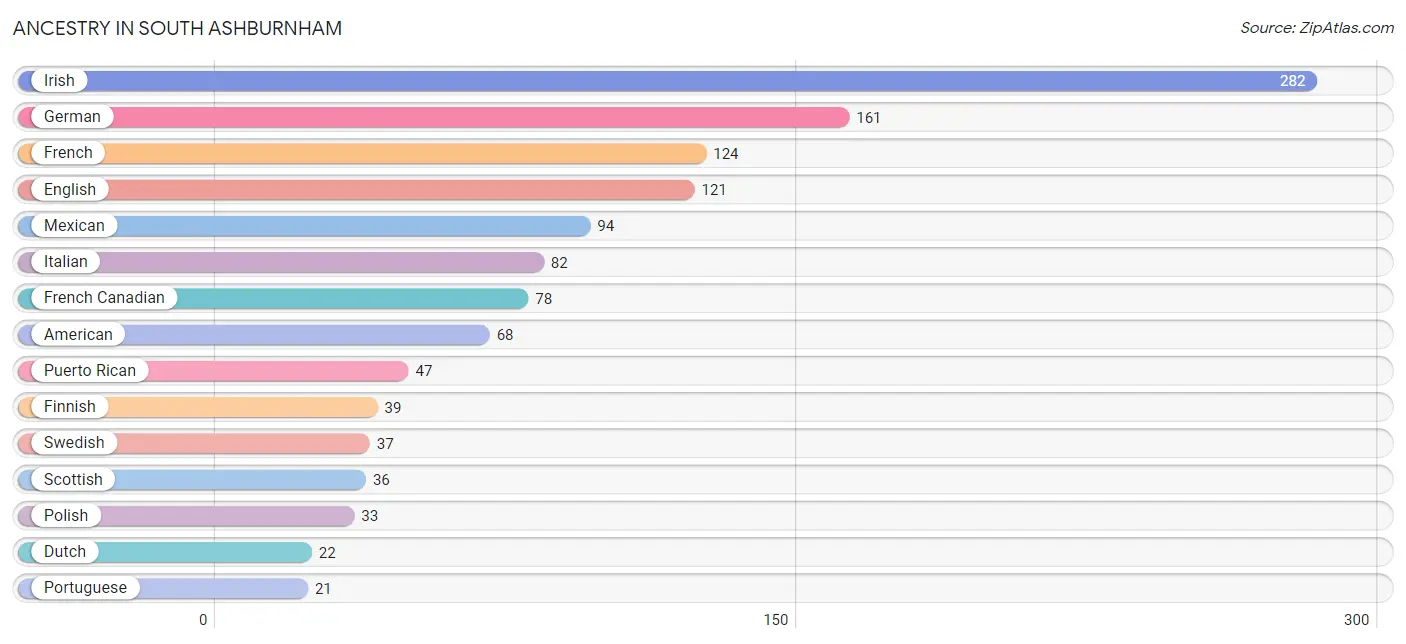
| Ancestry | # Population | % Population |
| American | 68 | 6.5% |
| Czechoslovakian | 16 | 1.5% |
| Dutch | 22 | 2.1% |
| English | 121 | 11.5% |
| Finnish | 39 | 3.7% |
| French | 124 | 11.8% |
| French Canadian | 78 | 7.4% |
| German | 161 | 15.3% |
| Hungarian | 16 | 1.5% |
| Irish | 282 | 26.9% |
| Italian | 82 | 7.8% |
| Lithuanian | 13 | 1.2% |
| Mexican | 94 | 9.0% |
| Polish | 33 | 3.2% |
| Portuguese | 21 | 2.0% |
| Puerto Rican | 47 | 4.5% |
| Scottish | 36 | 3.4% |
| Swedish | 37 | 3.5% | View All 18 Rows |
Immigrants in South Ashburnham

| Immigration Origin | # Population | % Population | View All 0 Rows |
Sex and Age in South Ashburnham
Sex and Age in South Ashburnham
The most populous age groups in South Ashburnham are 60 to 64 Years (99 | 17.8%) for men and 35 to 39 Years (84 | 17.0%) for women.
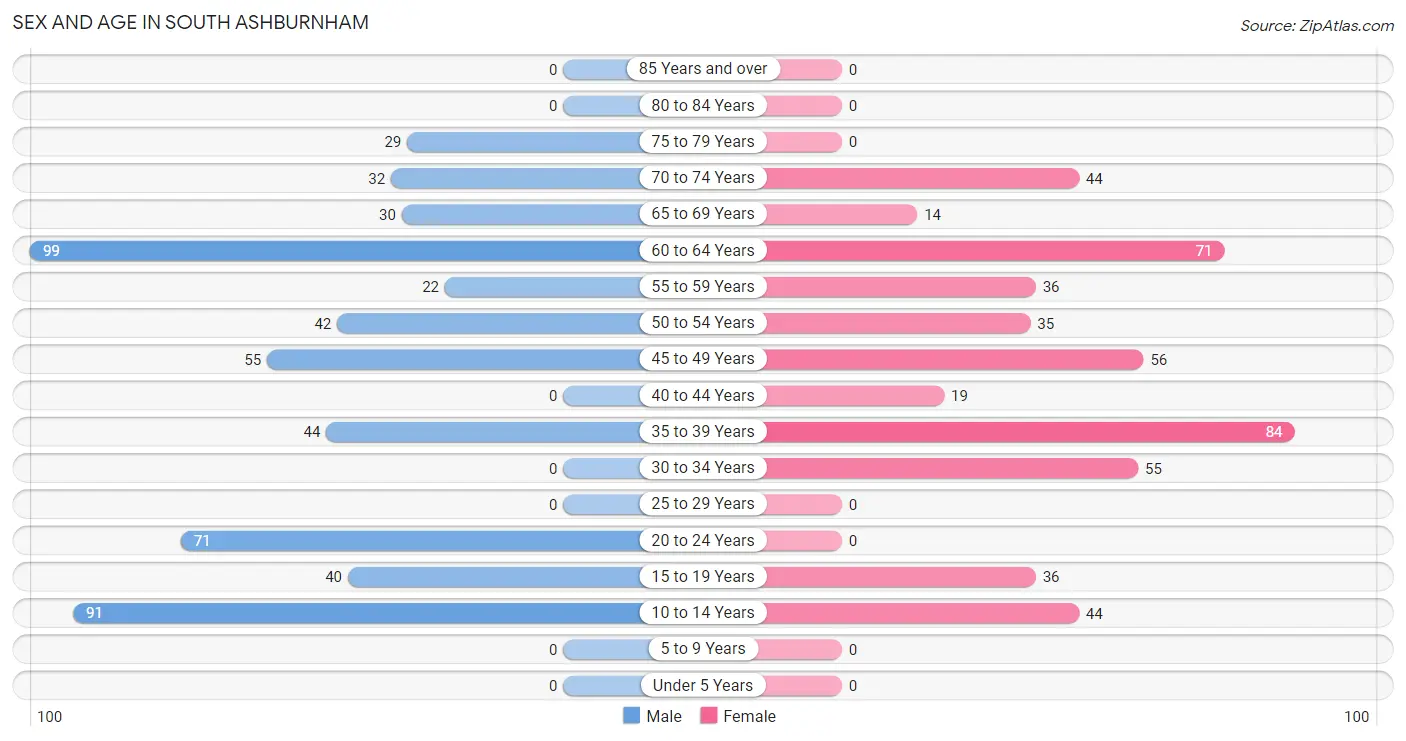
| Age Bracket | Male | Female |
| Under 5 Years | 0 (0.0%) | 0 (0.0%) |
| 5 to 9 Years | 0 (0.0%) | 0 (0.0%) |
| 10 to 14 Years | 91 (16.4%) | 44 (8.9%) |
| 15 to 19 Years | 40 (7.2%) | 36 (7.3%) |
| 20 to 24 Years | 71 (12.8%) | 0 (0.0%) |
| 25 to 29 Years | 0 (0.0%) | 0 (0.0%) |
| 30 to 34 Years | 0 (0.0%) | 55 (11.1%) |
| 35 to 39 Years | 44 (7.9%) | 84 (17.0%) |
| 40 to 44 Years | 0 (0.0%) | 19 (3.8%) |
| 45 to 49 Years | 55 (9.9%) | 56 (11.3%) |
| 50 to 54 Years | 42 (7.6%) | 35 (7.1%) |
| 55 to 59 Years | 22 (4.0%) | 36 (7.3%) |
| 60 to 64 Years | 99 (17.8%) | 71 (14.4%) |
| 65 to 69 Years | 30 (5.4%) | 14 (2.8%) |
| 70 to 74 Years | 32 (5.8%) | 44 (8.9%) |
| 75 to 79 Years | 29 (5.2%) | 0 (0.0%) |
| 80 to 84 Years | 0 (0.0%) | 0 (0.0%) |
| 85 Years and over | 0 (0.0%) | 0 (0.0%) |
| Total | 555 (100.0%) | 494 (100.0%) |
Families and Households in South Ashburnham
Median Family Size in South Ashburnham
The median family size in South Ashburnham is 2.84 persons per family, with married-couple families (300 | 83.6%) accounting for the largest median family size of 2.94 persons per family. On the other hand, single male/father families (16 | 4.5%) represent the smallest median family size with 2.06 persons per family.
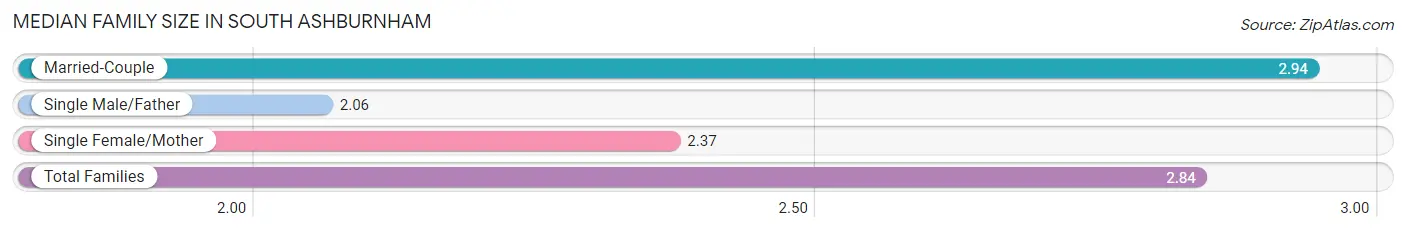
| Family Type | # Families | Family Size |
| Married-Couple | 300 (83.6%) | 2.94 |
| Single Male/Father | 16 (4.5%) | 2.06 |
| Single Female/Mother | 43 (12.0%) | 2.37 |
| Total Families | 359 (100.0%) | 2.84 |
Median Household Size in South Ashburnham
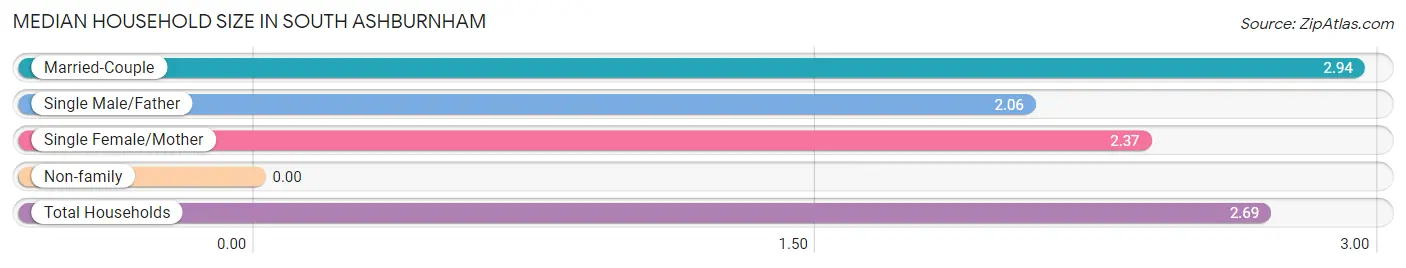
| Household Type | # Households | Household Size |
| Married-Couple | 300 (76.9%) | 2.94 |
| Single Male/Father | 16 (4.1%) | 2.06 |
| Single Female/Mother | 43 (11.0%) | 2.37 |
| Non-family | 31 (8.0%) | - |
| Total Households | 390 (100.0%) | 2.69 |
Household Size by Marriage Status in South Ashburnham
Out of a total of 390 households in South Ashburnham, 359 (92.0%) are family households, while 31 (8.0%) are nonfamily households. The most numerous type of family households are 2-person households, comprising 188, and the most common type of nonfamily households are 1-person households, comprising 31.
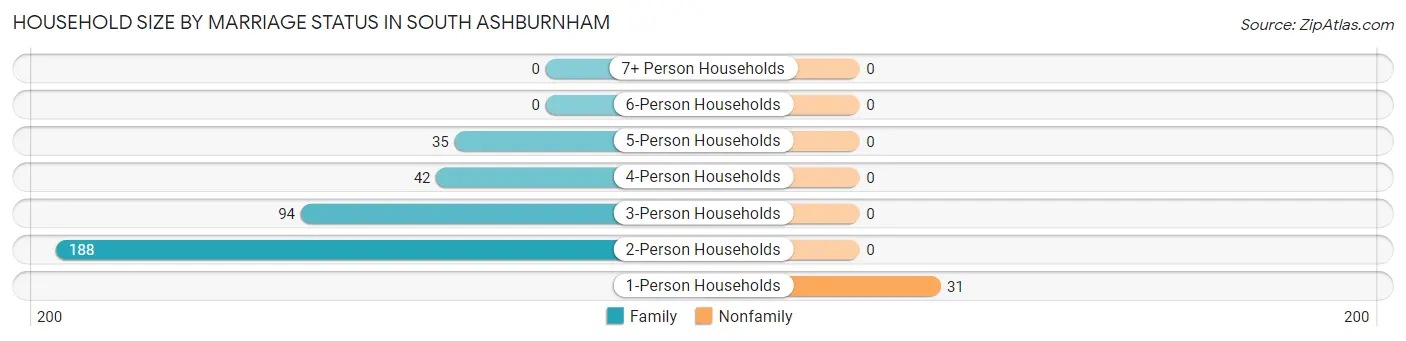
| Household Size | Family Households | Nonfamily Households |
| 1-Person Households | - | 31 (8.0%) |
| 2-Person Households | 188 (48.2%) | 0 (0.0%) |
| 3-Person Households | 94 (24.1%) | 0 (0.0%) |
| 4-Person Households | 42 (10.8%) | 0 (0.0%) |
| 5-Person Households | 35 (9.0%) | 0 (0.0%) |
| 6-Person Households | 0 (0.0%) | 0 (0.0%) |
| 7+ Person Households | 0 (0.0%) | 0 (0.0%) |
| Total | 359 (92.0%) | 31 (8.0%) |
Female Fertility in South Ashburnham
Fertility by Age in South Ashburnham
Average fertility rate in South Ashburnham is 140.0 births per 1,000 women. Women in the age bracket of 35 to 50 years have the highest fertility rate with 220.0 births per 1,000 women. Women in the age bracket of 35 to 50 years acount for 100.0% of all women with births.
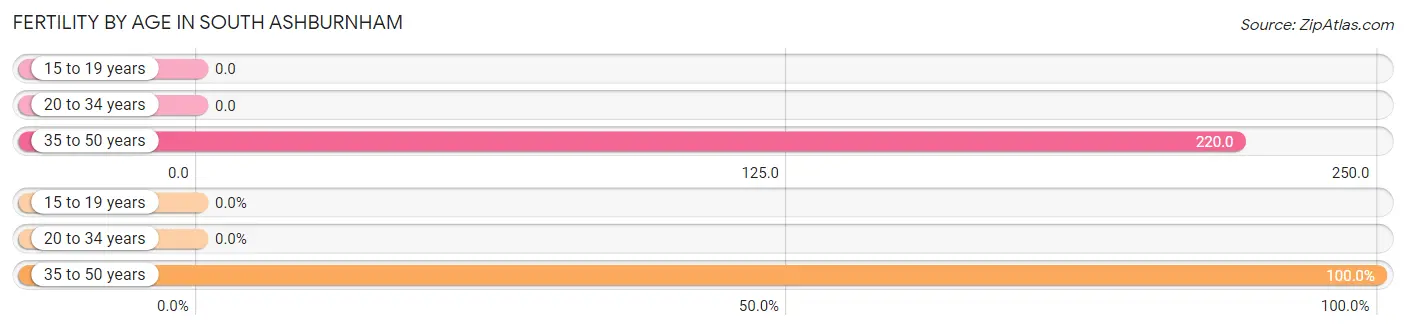
| Age Bracket | Women with Births | Births / 1,000 Women |
| 15 to 19 years | 0 (0.0%) | 0.0 |
| 20 to 34 years | 0 (0.0%) | 0.0 |
| 35 to 50 years | 35 (100.0%) | 220.0 |
| Total | 35 (100.0%) | 140.0 |
Fertility by Age by Marriage Status in South Ashburnham
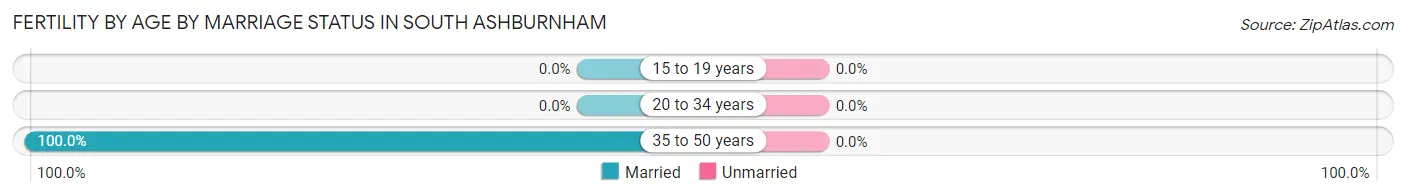
| Age Bracket | Married | Unmarried |
| 15 to 19 years | 0 (0.0%) | 0 (0.0%) |
| 20 to 34 years | 0 (0.0%) | 0 (0.0%) |
| 35 to 50 years | 35 (100.0%) | 0 (0.0%) |
| Total | 35 (100.0%) | 0 (0.0%) |
Fertility by Education in South Ashburnham
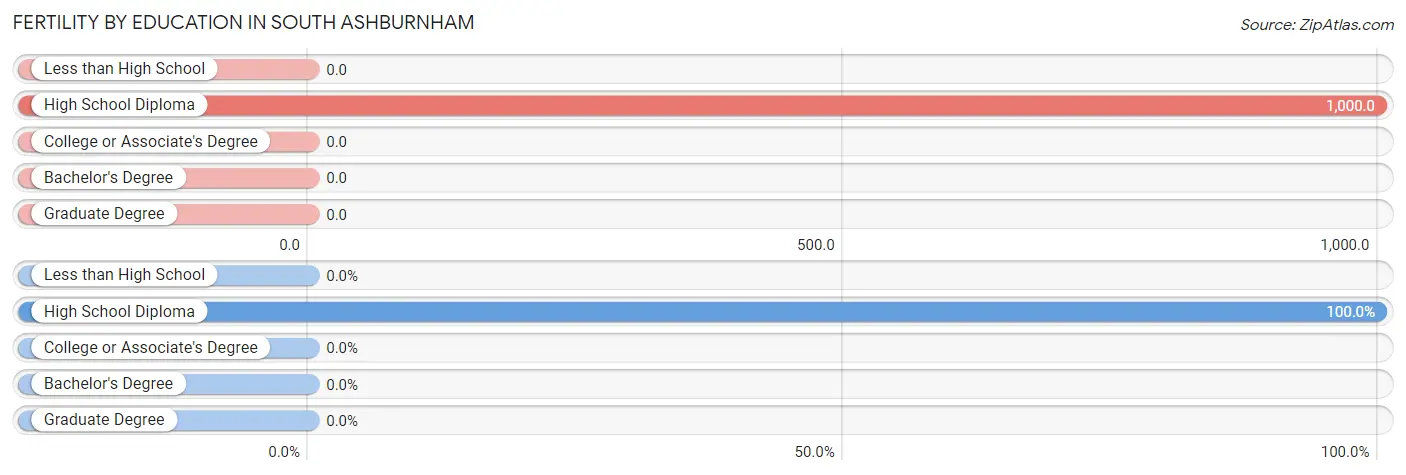
| Educational Attainment | Women with Births | Births / 1,000 Women |
| Less than High School | 0 (0.0%) | 0.0 |
| High School Diploma | 35 (100.0%) | 1,000.0 |
| College or Associate's Degree | 0 (0.0%) | 0.0 |
| Bachelor's Degree | 0 (0.0%) | 0.0 |
| Graduate Degree | 0 (0.0%) | 0.0 |
| Total | 35 (100.0%) | 140.0 |
Fertility by Education by Marriage Status in South Ashburnham
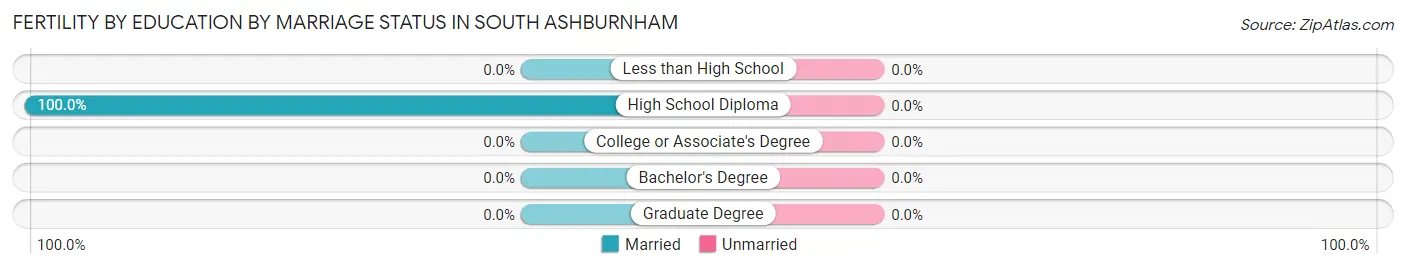
| Educational Attainment | Married | Unmarried |
| Less than High School | 0 (0.0%) | 0 (0.0%) |
| High School Diploma | 35 (100.0%) | 0 (0.0%) |
| College or Associate's Degree | 0 (0.0%) | 0 (0.0%) |
| Bachelor's Degree | 0 (0.0%) | 0 (0.0%) |
| Graduate Degree | 0 (0.0%) | 0 (0.0%) |
| Total | 35 (100.0%) | 0 (0.0%) |
Employment Characteristics in South Ashburnham
Employment by Class of Employer in South Ashburnham
Among the 583 employed individuals in South Ashburnham, private company employees (347 | 59.5%), federal government employees (61 | 10.5%), and self-employed (not incorporated) (58 | 10.0%) make up the most common classes of employment.
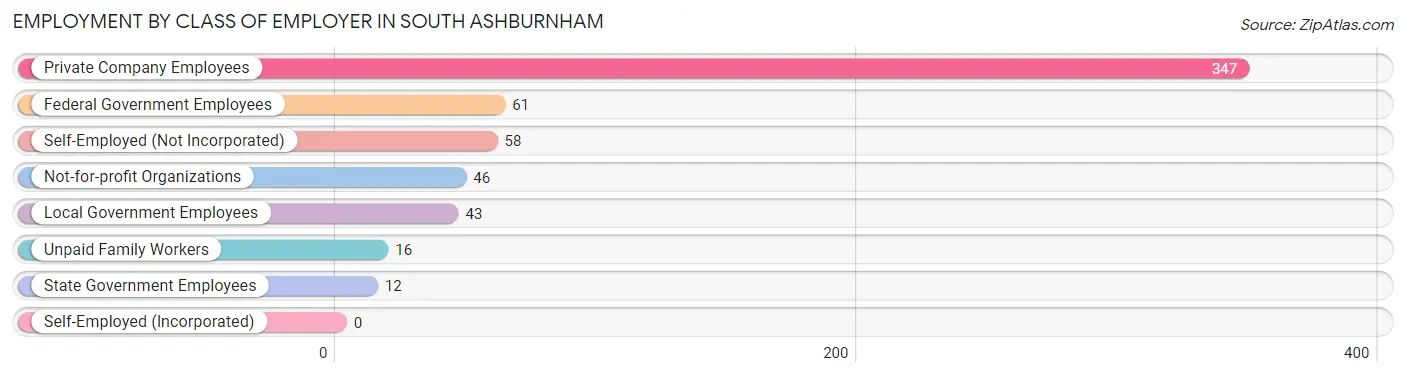
| Employer Class | # Employees | % Employees |
| Private Company Employees | 347 | 59.5% |
| Self-Employed (Incorporated) | 0 | 0.0% |
| Self-Employed (Not Incorporated) | 58 | 10.0% |
| Not-for-profit Organizations | 46 | 7.9% |
| Local Government Employees | 43 | 7.4% |
| State Government Employees | 12 | 2.1% |
| Federal Government Employees | 61 | 10.5% |
| Unpaid Family Workers | 16 | 2.7% |
| Total | 583 | 100.0% |
Employment Status by Age in South Ashburnham
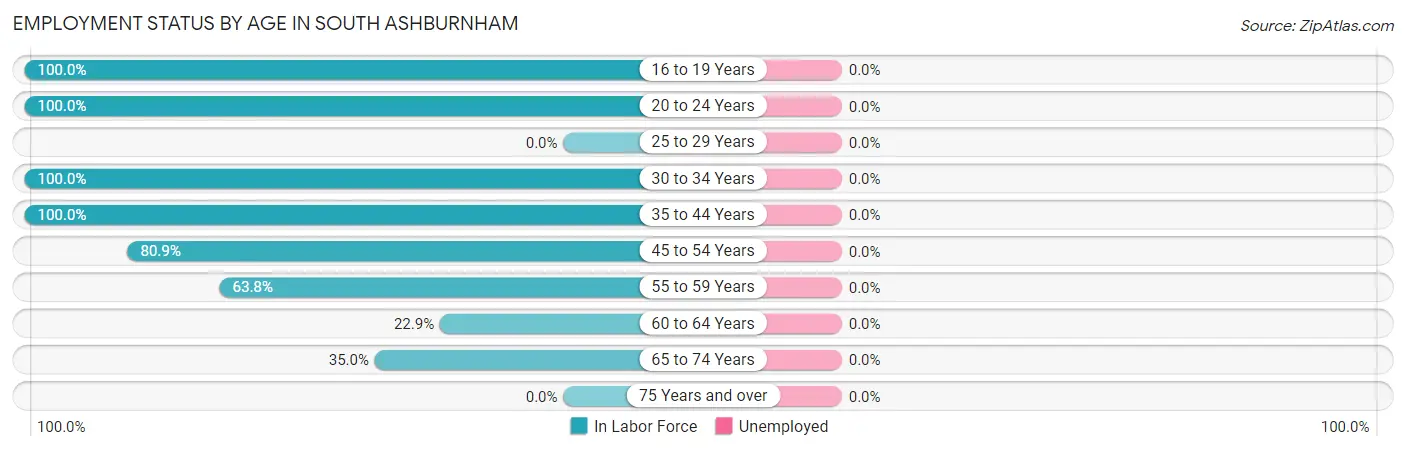
| Age Bracket | In Labor Force | Unemployed |
| 16 to 19 Years | 40 (100.0%) | 0 (0.0%) |
| 20 to 24 Years | 71 (100.0%) | 0 (0.0%) |
| 25 to 29 Years | 0 (0.0%) | 0 (0.0%) |
| 30 to 34 Years | 55 (100.0%) | 0 (0.0%) |
| 35 to 44 Years | 147 (100.0%) | 0 (0.0%) |
| 45 to 54 Years | 152 (80.9%) | 0 (0.0%) |
| 55 to 59 Years | 37 (63.8%) | 0 (0.0%) |
| 60 to 64 Years | 39 (22.9%) | 0 (0.0%) |
| 65 to 74 Years | 42 (35.0%) | 0 (0.0%) |
| 75 Years and over | 0 (0.0%) | 0 (0.0%) |
| Total | 583 (66.4%) | 0 (0.0%) |
Employment Status by Educational Attainment in South Ashburnham
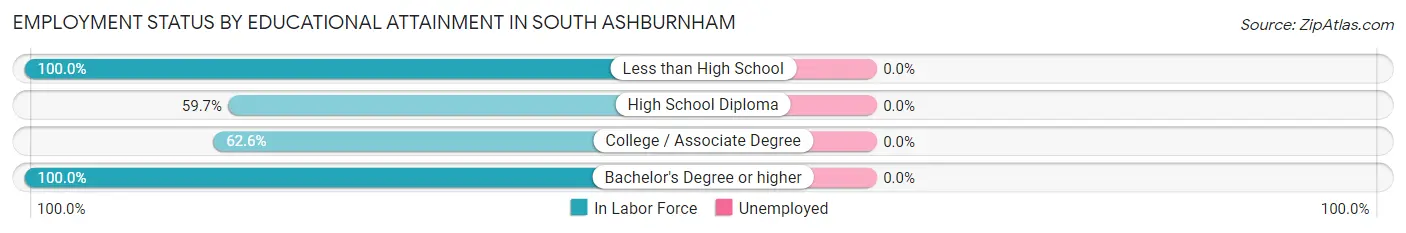
| Educational Attainment | In Labor Force | Unemployed |
| Less than High School | 86 (100.0%) | 0 (0.0%) |
| High School Diploma | 74 (59.7%) | 0 (0.0%) |
| College / Associate Degree | 231 (62.6%) | 0 (0.0%) |
| Bachelor's Degree or higher | 39 (100.0%) | 0 (0.0%) |
| Total | 430 (69.6%) | 0 (0.0%) |
Employment Occupations by Sex in South Ashburnham
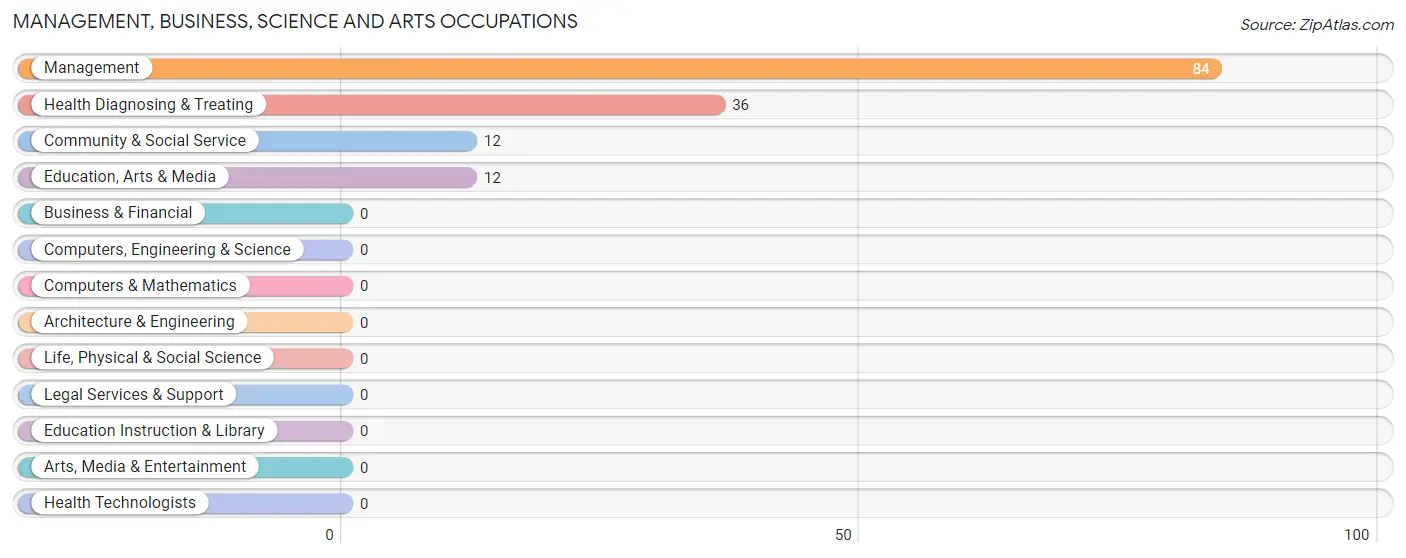
Management, Business, Science and Arts Occupations
The most common Management, Business, Science and Arts occupations in South Ashburnham are Management (84 | 14.4%), Health Diagnosing & Treating (36 | 6.2%), Community & Social Service (12 | 2.1%), and Education, Arts & Media (12 | 2.1%).
Management, Business, Science and Arts Occupations by Sex
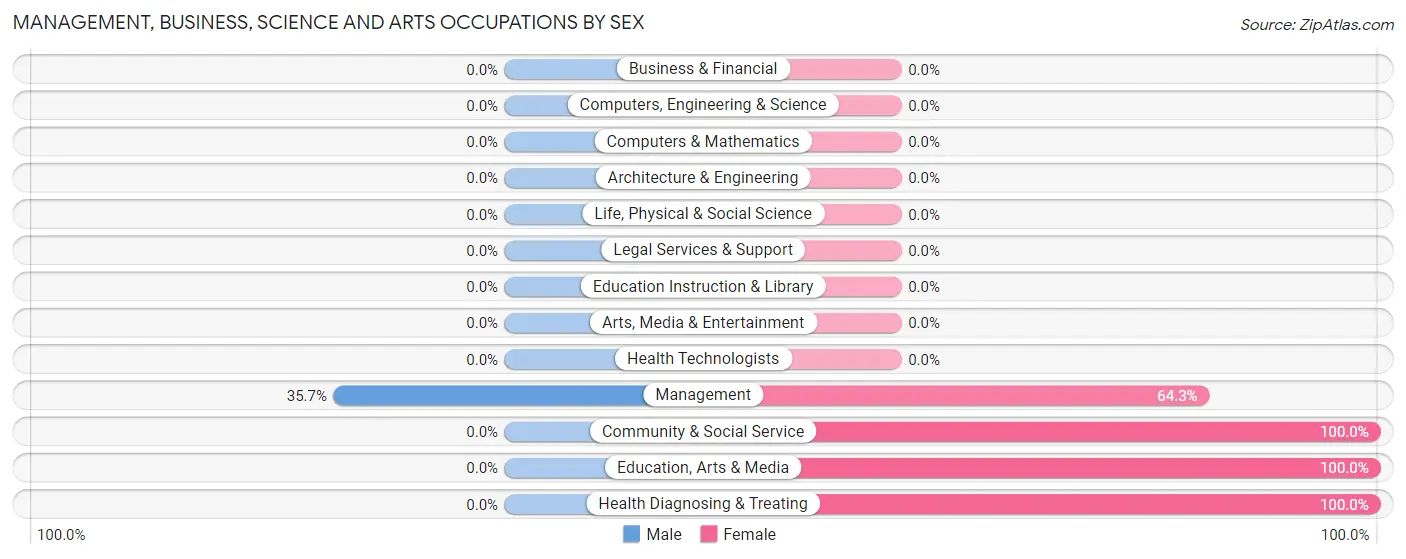
| Occupation | Male | Female |
| Management | 30 (35.7%) | 54 (64.3%) |
| Business & Financial | 0 (0.0%) | 0 (0.0%) |
| Computers, Engineering & Science | 0 (0.0%) | 0 (0.0%) |
| Computers & Mathematics | 0 (0.0%) | 0 (0.0%) |
| Architecture & Engineering | 0 (0.0%) | 0 (0.0%) |
| Life, Physical & Social Science | 0 (0.0%) | 0 (0.0%) |
| Community & Social Service | 0 (0.0%) | 12 (100.0%) |
| Education, Arts & Media | 0 (0.0%) | 12 (100.0%) |
| Legal Services & Support | 0 (0.0%) | 0 (0.0%) |
| Education Instruction & Library | 0 (0.0%) | 0 (0.0%) |
| Arts, Media & Entertainment | 0 (0.0%) | 0 (0.0%) |
| Health Diagnosing & Treating | 0 (0.0%) | 36 (100.0%) |
| Health Technologists | 0 (0.0%) | 0 (0.0%) |
| Total (Category) | 30 (22.7%) | 102 (77.3%) |
| Total (Overall) | 307 (52.7%) | 276 (47.3%) |
Services Occupations
The most common Services occupations in South Ashburnham are Food Preparation & Serving (40 | 6.9%), Cleaning & Maintenance (19 | 3.3%), and Healthcare Support (17 | 2.9%).
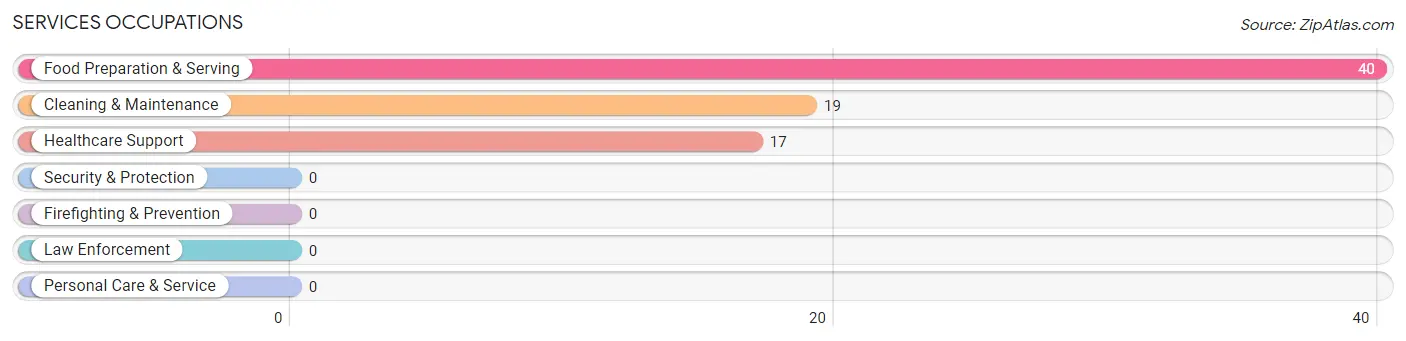
Services Occupations by Sex
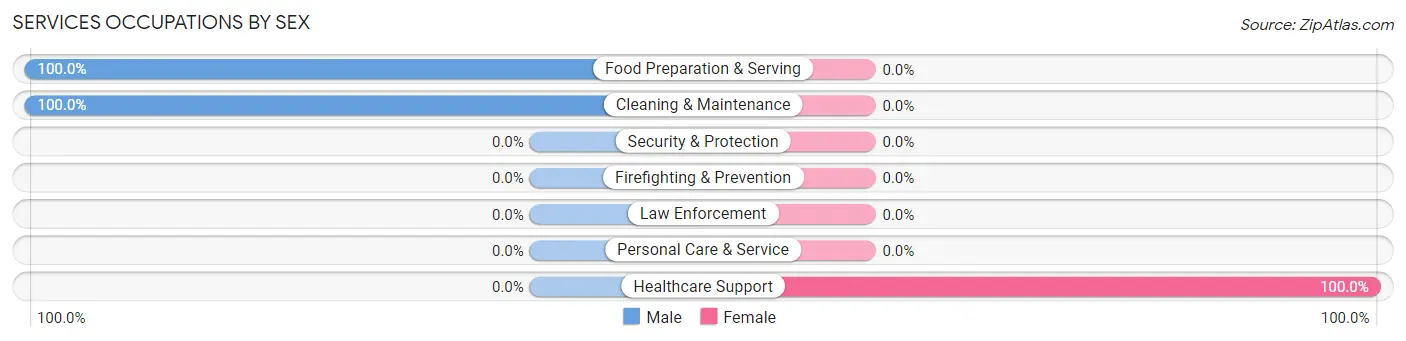
| Occupation | Male | Female |
| Healthcare Support | 0 (0.0%) | 17 (100.0%) |
| Security & Protection | 0 (0.0%) | 0 (0.0%) |
| Firefighting & Prevention | 0 (0.0%) | 0 (0.0%) |
| Law Enforcement | 0 (0.0%) | 0 (0.0%) |
| Food Preparation & Serving | 40 (100.0%) | 0 (0.0%) |
| Cleaning & Maintenance | 19 (100.0%) | 0 (0.0%) |
| Personal Care & Service | 0 (0.0%) | 0 (0.0%) |
| Total (Category) | 59 (77.6%) | 17 (22.4%) |
| Total (Overall) | 307 (52.7%) | 276 (47.3%) |
Sales and Office Occupations
The most common Sales and Office occupations in South Ashburnham are Office & Administration (152 | 26.1%), and Sales & Related (111 | 19.0%).
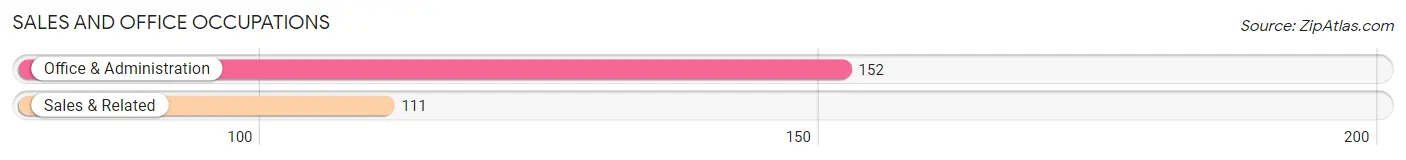
Sales and Office Occupations by Sex
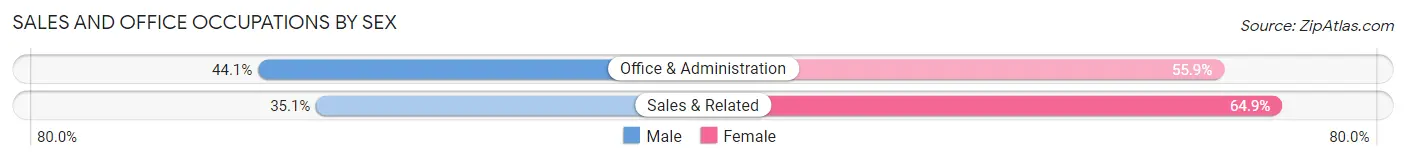
| Occupation | Male | Female |
| Sales & Related | 39 (35.1%) | 72 (64.9%) |
| Office & Administration | 67 (44.1%) | 85 (55.9%) |
| Total (Category) | 106 (40.3%) | 157 (59.7%) |
| Total (Overall) | 307 (52.7%) | 276 (47.3%) |
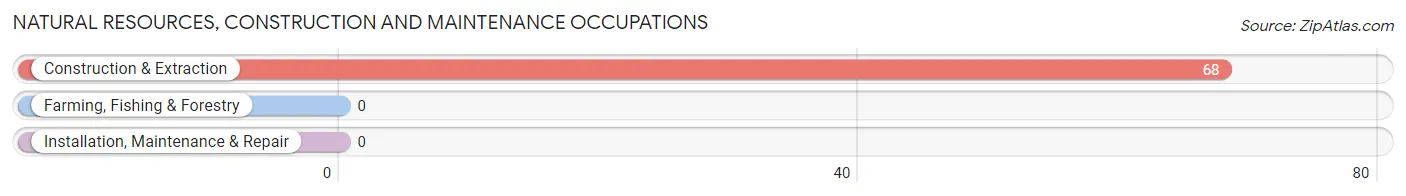
Natural Resources, Construction and Maintenance Occupations
The most common Natural Resources, Construction and Maintenance occupations in South Ashburnham are , and Construction & Extraction (68 | 11.7%).
Natural Resources, Construction and Maintenance Occupations by Sex
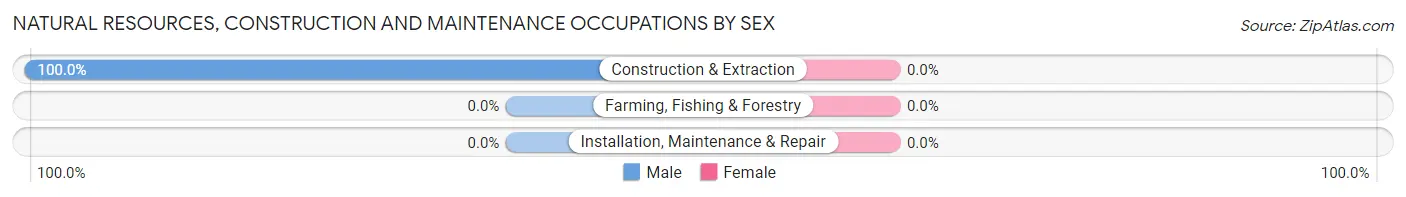
| Occupation | Male | Female |
| Farming, Fishing & Forestry | 0 (0.0%) | 0 (0.0%) |
| Construction & Extraction | 68 (100.0%) | 0 (0.0%) |
| Installation, Maintenance & Repair | 0 (0.0%) | 0 (0.0%) |
| Total (Category) | 68 (100.0%) | 0 (0.0%) |
| Total (Overall) | 307 (52.7%) | 276 (47.3%) |
Production, Transportation and Moving Occupations
The most common Production, Transportation and Moving occupations in South Ashburnham are , and Production (44 | 7.5%).
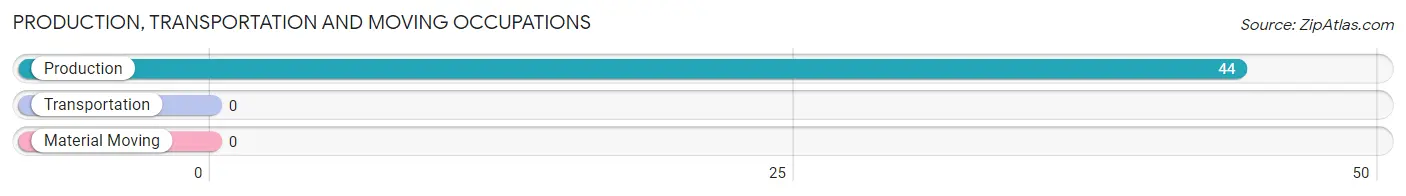
Production, Transportation and Moving Occupations by Sex
| Occupation | Male | Female |
| Production | 44 (100.0%) | 0 (0.0%) |
| Transportation | 0 (0.0%) | 0 (0.0%) |
| Material Moving | 0 (0.0%) | 0 (0.0%) |
| Total (Category) | 44 (100.0%) | 0 (0.0%) |
| Total (Overall) | 307 (52.7%) | 276 (47.3%) |
Employment Industries by Sex in South Ashburnham
Employment Industries in South Ashburnham
The major employment industries in South Ashburnham include Health Care & Social Assistance (103 | 17.7%), Real Estate, Rental & Leasing (94 | 16.1%), Construction (82 | 14.1%), Retail Trade (80 | 13.7%), and Transportation & Warehousing (77 | 13.2%).
Employment Industries by Sex in South Ashburnham
The South Ashburnham industries that see more men than women are Construction (100.0%), Transportation & Warehousing (100.0%), and Educational Services (100.0%), whereas the industries that tend to have a higher number of women are Health Care & Social Assistance (100.0%), Arts, Entertainment & Recreation (100.0%), and Public Administration (83.3%).
| Industry | Male | Female |
| Agriculture, Fishing & Hunting | 0 (0.0%) | 0 (0.0%) |
| Mining, Quarrying, & Extraction | 0 (0.0%) | 0 (0.0%) |
| Construction | 82 (100.0%) | 0 (0.0%) |
| Manufacturing | 0 (0.0%) | 0 (0.0%) |
| Wholesale Trade | 0 (0.0%) | 0 (0.0%) |
| Retail Trade | 44 (55.0%) | 36 (45.0%) |
| Transportation & Warehousing | 77 (100.0%) | 0 (0.0%) |
| Utilities | 0 (0.0%) | 0 (0.0%) |
| Information | 0 (0.0%) | 0 (0.0%) |
| Finance & Insurance | 0 (0.0%) | 0 (0.0%) |
| Real Estate, Rental & Leasing | 39 (41.5%) | 55 (58.5%) |
| Professional & Scientific | 0 (0.0%) | 0 (0.0%) |
| Enterprise Management | 0 (0.0%) | 0 (0.0%) |
| Administrative & Support | 0 (0.0%) | 0 (0.0%) |
| Educational Services | 19 (100.0%) | 0 (0.0%) |
| Health Care & Social Assistance | 0 (0.0%) | 103 (100.0%) |
| Arts, Entertainment & Recreation | 0 (0.0%) | 17 (100.0%) |
| Accommodation & Food Services | 40 (53.3%) | 35 (46.7%) |
| Public Administration | 6 (16.7%) | 30 (83.3%) |
| Total | 307 (52.7%) | 276 (47.3%) |
Education in South Ashburnham
School Enrollment in South Ashburnham
The most common levels of schooling among the 234 students in South Ashburnham are middle school (135 | 57.7%), college / undergraduate (63 | 26.9%), and high school (36 | 15.4%).
| School Level | # Students | % Students |
| Nursery / Preschool | 0 | 0.0% |
| Kindergarten | 0 | 0.0% |
| Elementary School | 0 | 0.0% |
| Middle School | 135 | 57.7% |
| High School | 36 | 15.4% |
| College / Undergraduate | 63 | 26.9% |
| Graduate / Professional | 0 | 0.0% |
| Total | 234 | 100.0% |
School Enrollment by Age by Funding Source in South Ashburnham
Out of a total of 234 students who are enrolled in schools in South Ashburnham, 17 (7.3%) attend a private institution, while the remaining 217 (92.7%) are enrolled in public schools. The age group of 35 years and over has the highest likelihood of being enrolled in private schools, with 17 (100.0% in the age bracket) enrolled. Conversely, the age group of 10 to 14 year olds has the lowest likelihood of being enrolled in a private school, with 135 (100.0% in the age bracket) attending a public institution.
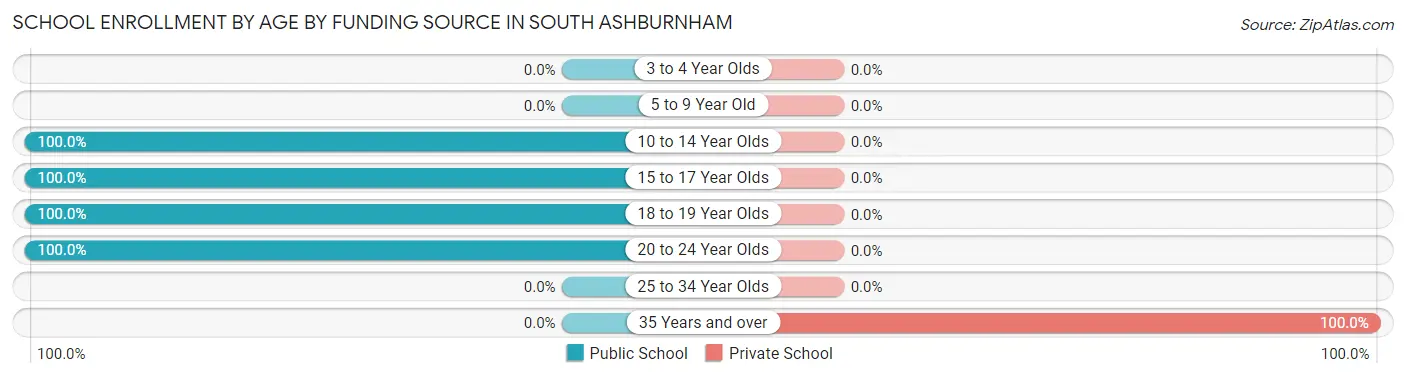
| Age Bracket | Public School | Private School |
| 3 to 4 Year Olds | 0 (0.0%) | 0 (0.0%) |
| 5 to 9 Year Old | 0 (0.0%) | 0 (0.0%) |
| 10 to 14 Year Olds | 135 (100.0%) | 0 (0.0%) |
| 15 to 17 Year Olds | 36 (100.0%) | 0 (0.0%) |
| 18 to 19 Year Olds | 40 (100.0%) | 0 (0.0%) |
| 20 to 24 Year Olds | 6 (100.0%) | 0 (0.0%) |
| 25 to 34 Year Olds | 0 (0.0%) | 0 (0.0%) |
| 35 Years and over | 0 (0.0%) | 17 (100.0%) |
| Total | 217 (92.7%) | 17 (7.3%) |
Educational Attainment by Field of Study in South Ashburnham
Education (25 | 22.9%), computers & mathematics (21 | 19.3%), science & technology (21 | 19.3%), business (18 | 16.5%), and engineering (12 | 11.0%) are the most common fields of study among 109 individuals in South Ashburnham who have obtained a bachelor's degree or higher.
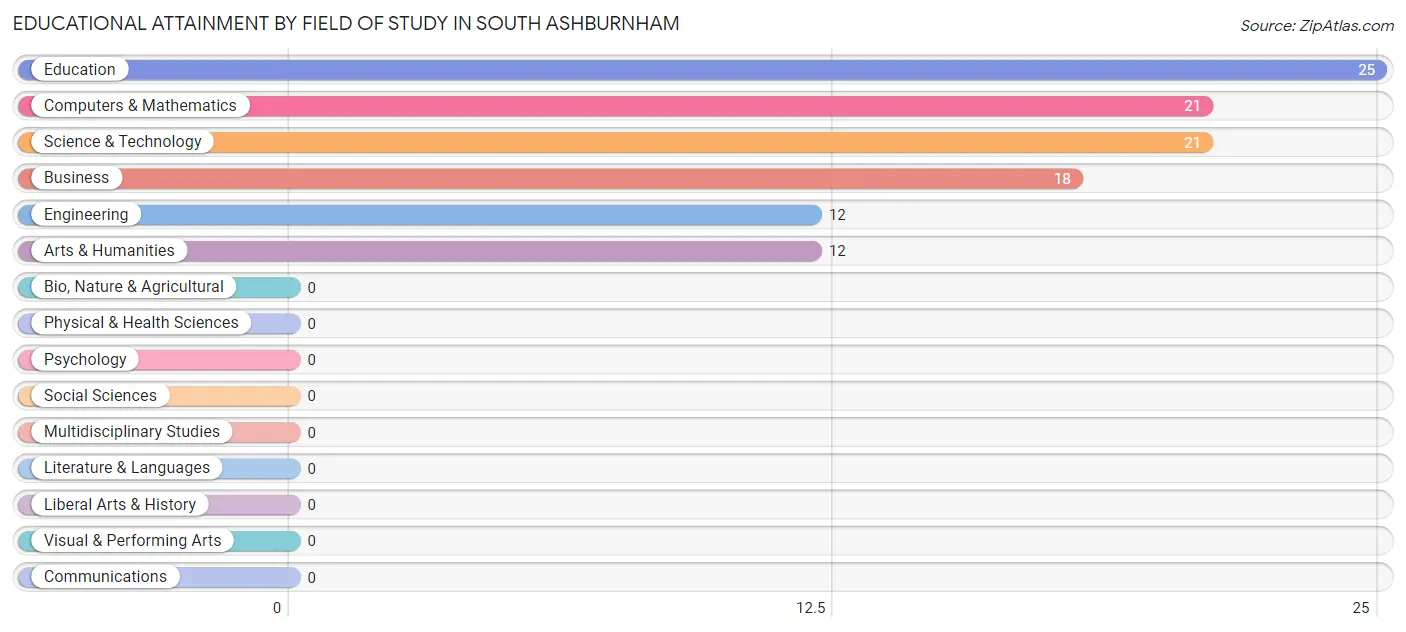
| Field of Study | # Graduates | % Graduates |
| Computers & Mathematics | 21 | 19.3% |
| Bio, Nature & Agricultural | 0 | 0.0% |
| Physical & Health Sciences | 0 | 0.0% |
| Psychology | 0 | 0.0% |
| Social Sciences | 0 | 0.0% |
| Engineering | 12 | 11.0% |
| Multidisciplinary Studies | 0 | 0.0% |
| Science & Technology | 21 | 19.3% |
| Business | 18 | 16.5% |
| Education | 25 | 22.9% |
| Literature & Languages | 0 | 0.0% |
| Liberal Arts & History | 0 | 0.0% |
| Visual & Performing Arts | 0 | 0.0% |
| Communications | 0 | 0.0% |
| Arts & Humanities | 12 | 11.0% |
| Total | 109 | 100.0% |
Transportation & Commute in South Ashburnham
Vehicle Availability by Sex in South Ashburnham
The most prevalent vehicle ownership categories in South Ashburnham are males with 4 vehicles (144, accounting for 46.9%) and females with 4 vehicles (65, making up 52.2%).
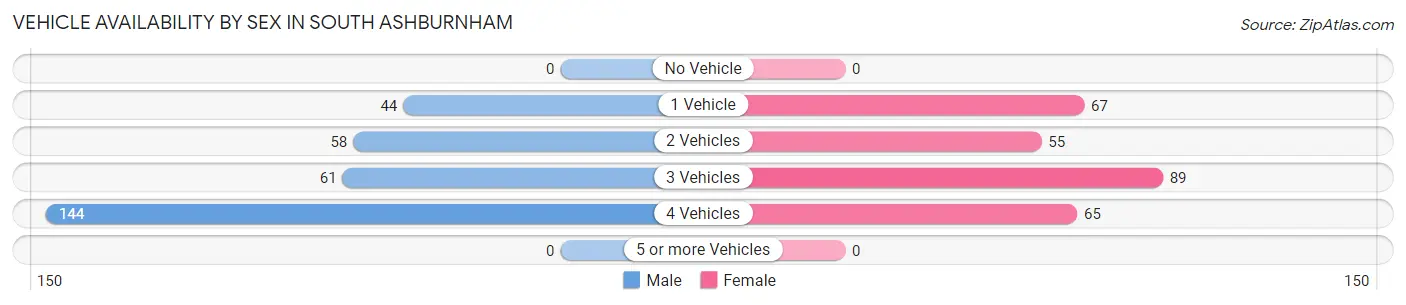
| Vehicles Available | Male | Female |
| No Vehicle | 0 (0.0%) | 0 (0.0%) |
| 1 Vehicle | 44 (14.3%) | 67 (24.3%) |
| 2 Vehicles | 58 (18.9%) | 55 (19.9%) |
| 3 Vehicles | 61 (19.9%) | 89 (32.3%) |
| 4 Vehicles | 144 (46.9%) | 65 (23.5%) |
| 5 or more Vehicles | 0 (0.0%) | 0 (0.0%) |
| Total | 307 (100.0%) | 276 (100.0%) |
Commute Time in South Ashburnham
The most frequently occuring commute durations in South Ashburnham are 25 to 29 minutes (161 commuters, 32.9%), 20 to 24 minutes (112 commuters, 22.9%), and 60 to 89 minutes (64 commuters, 13.1%).
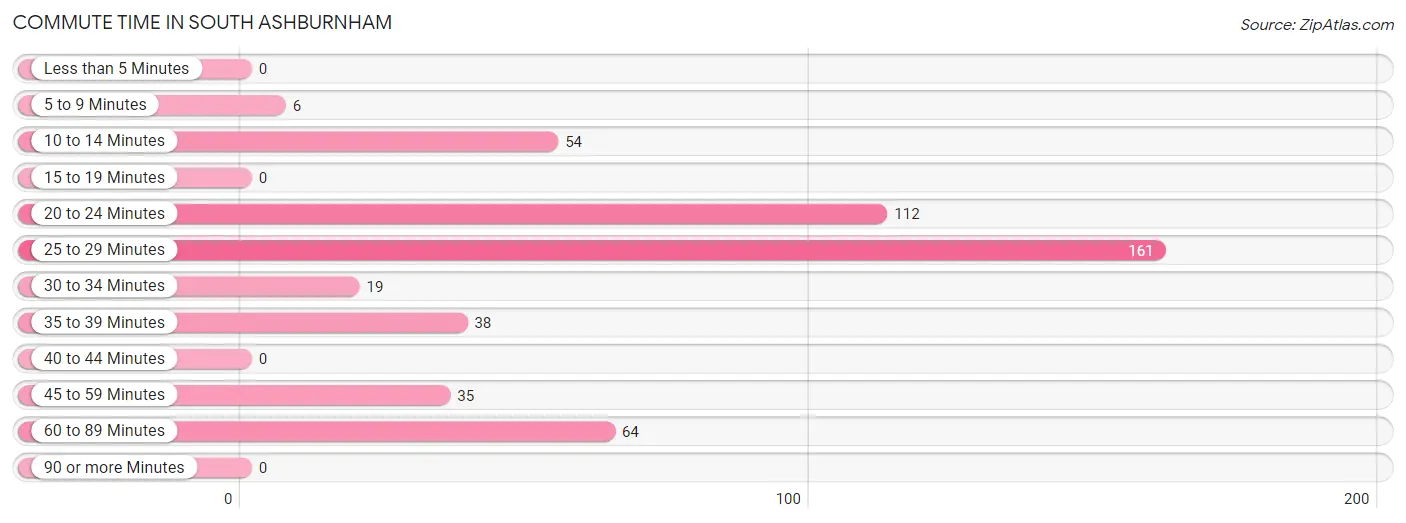
| Commute Time | # Commuters | % Commuters |
| Less than 5 Minutes | 0 | 0.0% |
| 5 to 9 Minutes | 6 | 1.2% |
| 10 to 14 Minutes | 54 | 11.0% |
| 15 to 19 Minutes | 0 | 0.0% |
| 20 to 24 Minutes | 112 | 22.9% |
| 25 to 29 Minutes | 161 | 32.9% |
| 30 to 34 Minutes | 19 | 3.9% |
| 35 to 39 Minutes | 38 | 7.8% |
| 40 to 44 Minutes | 0 | 0.0% |
| 45 to 59 Minutes | 35 | 7.2% |
| 60 to 89 Minutes | 64 | 13.1% |
| 90 or more Minutes | 0 | 0.0% |
Commute Time by Sex in South Ashburnham
The most common commute times in South Ashburnham are 20 to 24 minutes (82 commuters, 30.6%) for males and 25 to 29 minutes (121 commuters, 54.7%) for females.
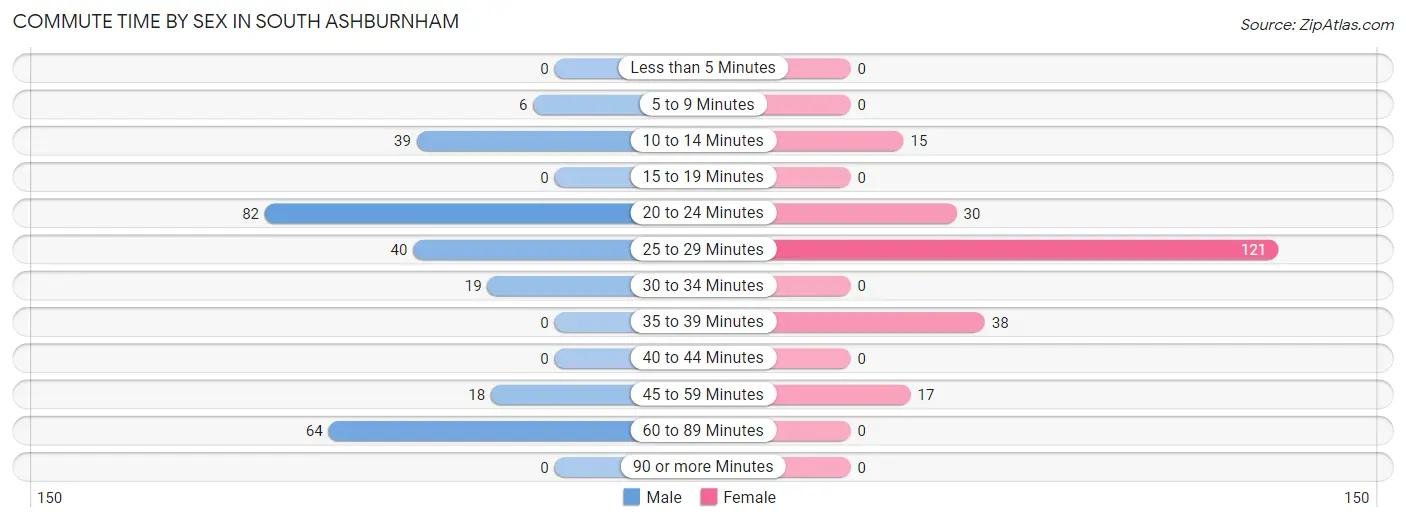
| Commute Time | Male | Female |
| Less than 5 Minutes | 0 (0.0%) | 0 (0.0%) |
| 5 to 9 Minutes | 6 (2.2%) | 0 (0.0%) |
| 10 to 14 Minutes | 39 (14.5%) | 15 (6.8%) |
| 15 to 19 Minutes | 0 (0.0%) | 0 (0.0%) |
| 20 to 24 Minutes | 82 (30.6%) | 30 (13.6%) |
| 25 to 29 Minutes | 40 (14.9%) | 121 (54.7%) |
| 30 to 34 Minutes | 19 (7.1%) | 0 (0.0%) |
| 35 to 39 Minutes | 0 (0.0%) | 38 (17.2%) |
| 40 to 44 Minutes | 0 (0.0%) | 0 (0.0%) |
| 45 to 59 Minutes | 18 (6.7%) | 17 (7.7%) |
| 60 to 89 Minutes | 64 (23.9%) | 0 (0.0%) |
| 90 or more Minutes | 0 (0.0%) | 0 (0.0%) |
Time of Departure to Work by Sex in South Ashburnham
The most frequent times of departure to work in South Ashburnham are 7:00 AM to 7:29 AM (92, 34.3%) for males and 7:00 AM to 7:29 AM (105, 47.5%) for females.
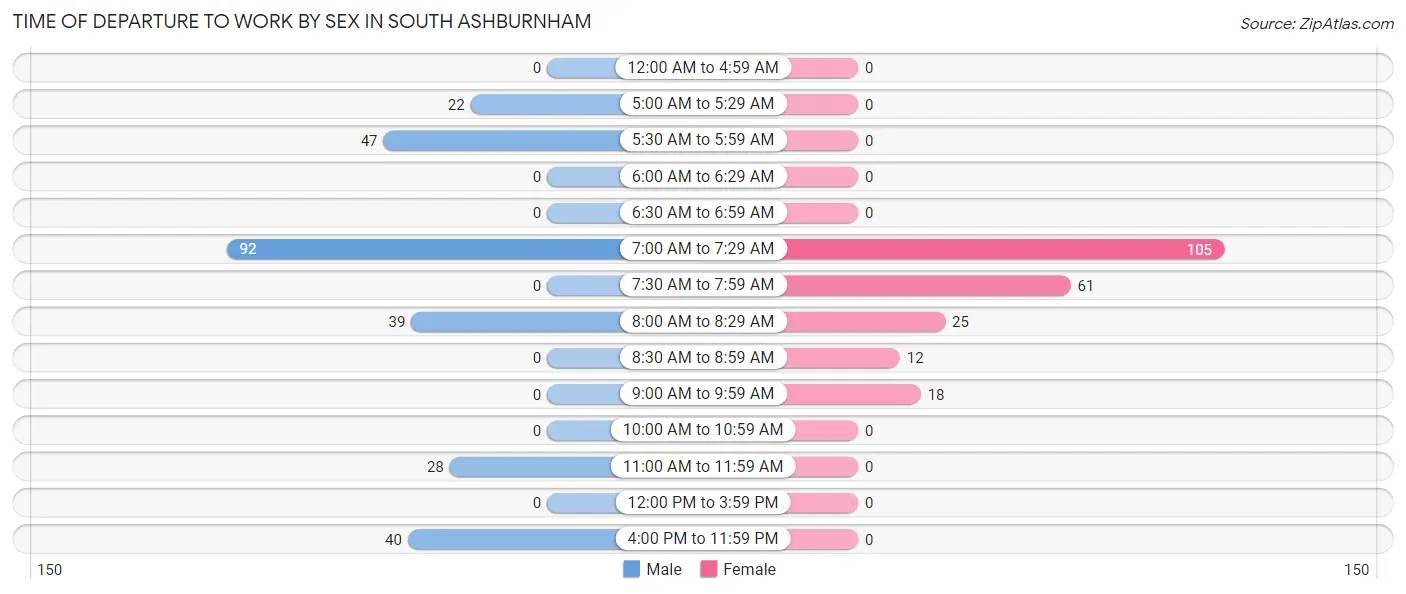
| Time of Departure | Male | Female |
| 12:00 AM to 4:59 AM | 0 (0.0%) | 0 (0.0%) |
| 5:00 AM to 5:29 AM | 22 (8.2%) | 0 (0.0%) |
| 5:30 AM to 5:59 AM | 47 (17.5%) | 0 (0.0%) |
| 6:00 AM to 6:29 AM | 0 (0.0%) | 0 (0.0%) |
| 6:30 AM to 6:59 AM | 0 (0.0%) | 0 (0.0%) |
| 7:00 AM to 7:29 AM | 92 (34.3%) | 105 (47.5%) |
| 7:30 AM to 7:59 AM | 0 (0.0%) | 61 (27.6%) |
| 8:00 AM to 8:29 AM | 39 (14.5%) | 25 (11.3%) |
| 8:30 AM to 8:59 AM | 0 (0.0%) | 12 (5.4%) |
| 9:00 AM to 9:59 AM | 0 (0.0%) | 18 (8.1%) |
| 10:00 AM to 10:59 AM | 0 (0.0%) | 0 (0.0%) |
| 11:00 AM to 11:59 AM | 28 (10.4%) | 0 (0.0%) |
| 12:00 PM to 3:59 PM | 0 (0.0%) | 0 (0.0%) |
| 4:00 PM to 11:59 PM | 40 (14.9%) | 0 (0.0%) |
| Total | 268 (100.0%) | 221 (100.0%) |
Housing Occupancy in South Ashburnham
Occupancy by Ownership in South Ashburnham
Of the total 390 dwellings in South Ashburnham, owner-occupied units account for 331 (84.9%), while renter-occupied units make up 59 (15.1%).
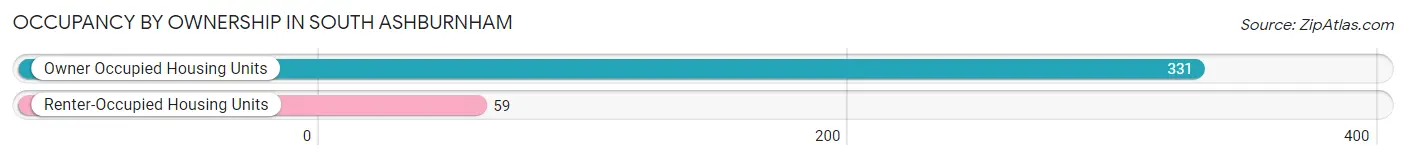
| Occupancy | # Housing Units | % Housing Units |
| Owner Occupied Housing Units | 331 | 84.9% |
| Renter-Occupied Housing Units | 59 | 15.1% |
| Total Occupied Housing Units | 390 | 100.0% |
Occupancy by Household Size in South Ashburnham
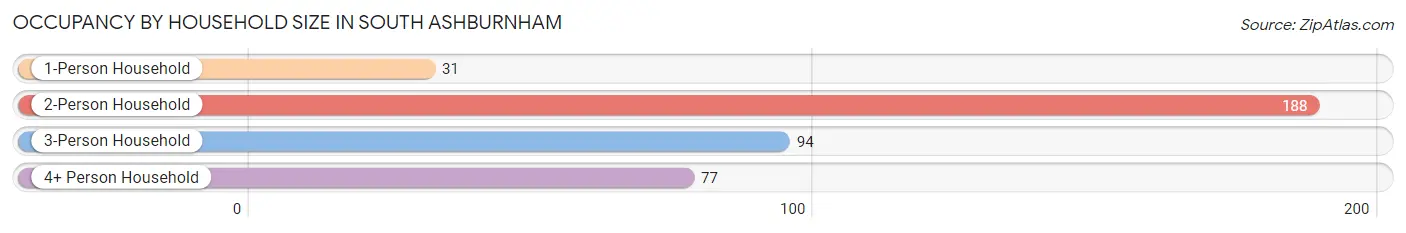
| Household Size | # Housing Units | % Housing Units |
| 1-Person Household | 31 | 8.0% |
| 2-Person Household | 188 | 48.2% |
| 3-Person Household | 94 | 24.1% |
| 4+ Person Household | 77 | 19.7% |
| Total Housing Units | 390 | 100.0% |
Occupancy by Ownership by Household Size in South Ashburnham
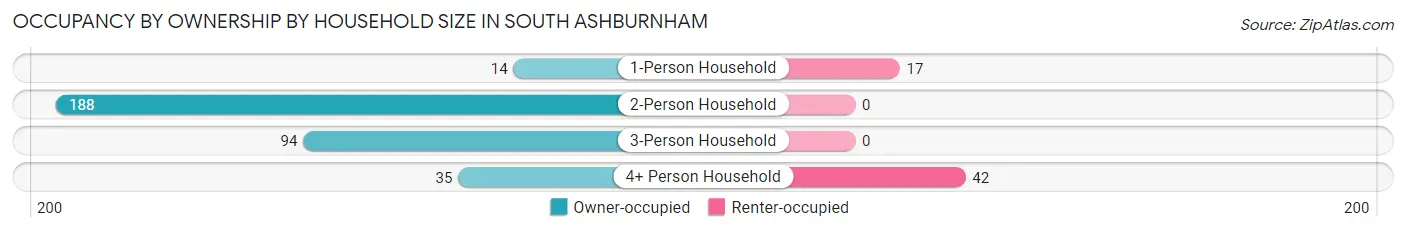
| Household Size | Owner-occupied | Renter-occupied |
| 1-Person Household | 14 (45.2%) | 17 (54.8%) |
| 2-Person Household | 188 (100.0%) | 0 (0.0%) |
| 3-Person Household | 94 (100.0%) | 0 (0.0%) |
| 4+ Person Household | 35 (45.5%) | 42 (54.5%) |
| Total Housing Units | 331 (84.9%) | 59 (15.1%) |
Occupancy by Educational Attainment in South Ashburnham
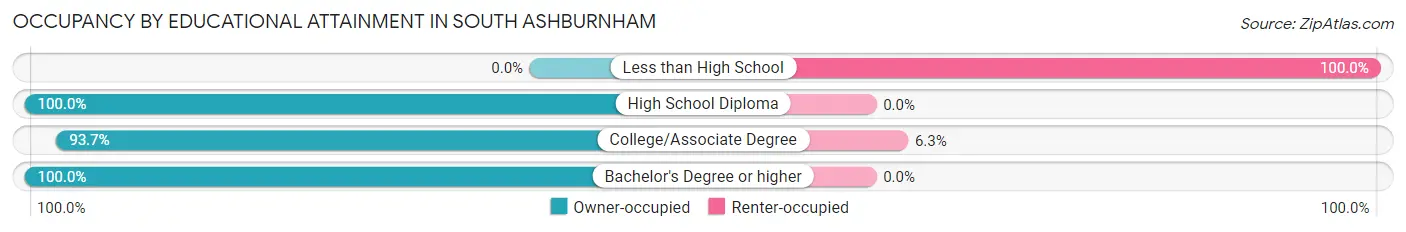
| Household Size | Owner-occupied | Renter-occupied |
| Less than High School | 0 (0.0%) | 42 (100.0%) |
| High School Diploma | 35 (100.0%) | 0 (0.0%) |
| College/Associate Degree | 253 (93.7%) | 17 (6.3%) |
| Bachelor's Degree or higher | 43 (100.0%) | 0 (0.0%) |
Occupancy by Age of Householder in South Ashburnham
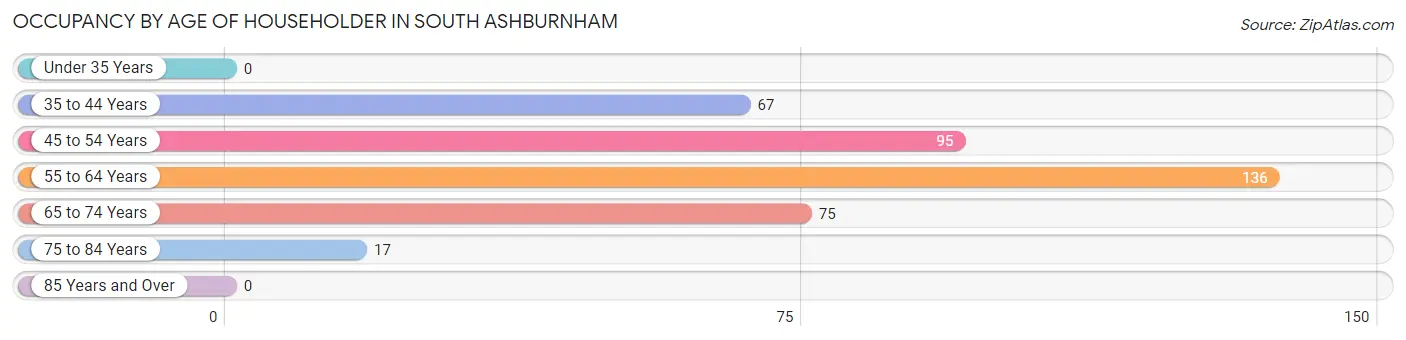
| Age Bracket | # Households | % Households |
| Under 35 Years | 0 | 0.0% |
| 35 to 44 Years | 67 | 17.2% |
| 45 to 54 Years | 95 | 24.4% |
| 55 to 64 Years | 136 | 34.9% |
| 65 to 74 Years | 75 | 19.2% |
| 75 to 84 Years | 17 | 4.4% |
| 85 Years and Over | 0 | 0.0% |
| Total | 390 | 100.0% |
Housing Finances in South Ashburnham
Median Income by Occupancy in South Ashburnham
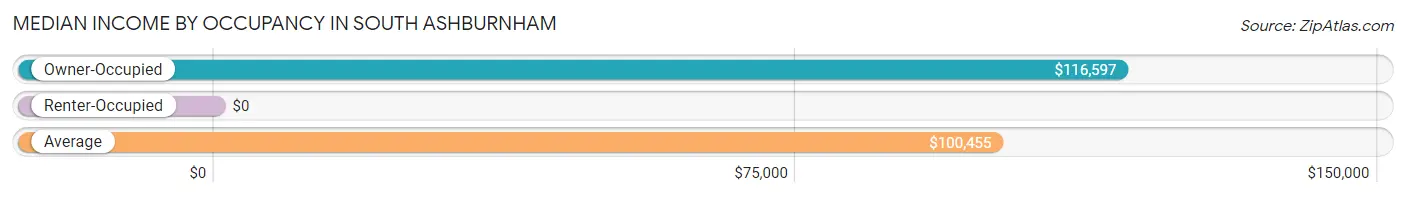
| Occupancy Type | # Households | Median Income |
| Owner-Occupied | 331 (84.9%) | $116,597 |
| Renter-Occupied | 59 (15.1%) | $0 |
| Average | 390 (100.0%) | $100,455 |
Occupancy by Householder Income Bracket in South Ashburnham
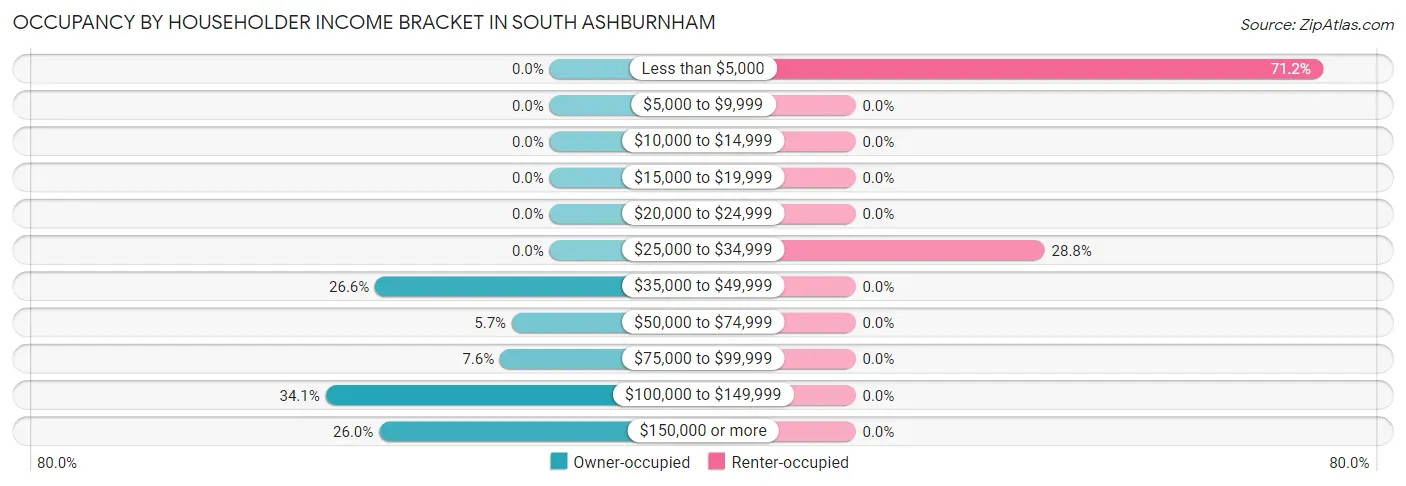
| Income Bracket | Owner-occupied | Renter-occupied |
| Less than $5,000 | 0 (0.0%) | 42 (71.2%) |
| $5,000 to $9,999 | 0 (0.0%) | 0 (0.0%) |
| $10,000 to $14,999 | 0 (0.0%) | 0 (0.0%) |
| $15,000 to $19,999 | 0 (0.0%) | 0 (0.0%) |
| $20,000 to $24,999 | 0 (0.0%) | 0 (0.0%) |
| $25,000 to $34,999 | 0 (0.0%) | 17 (28.8%) |
| $35,000 to $49,999 | 88 (26.6%) | 0 (0.0%) |
| $50,000 to $74,999 | 19 (5.7%) | 0 (0.0%) |
| $75,000 to $99,999 | 25 (7.5%) | 0 (0.0%) |
| $100,000 to $149,999 | 113 (34.1%) | 0 (0.0%) |
| $150,000 or more | 86 (26.0%) | 0 (0.0%) |
| Total | 331 (100.0%) | 59 (100.0%) |
Monthly Housing Cost Tiers in South Ashburnham
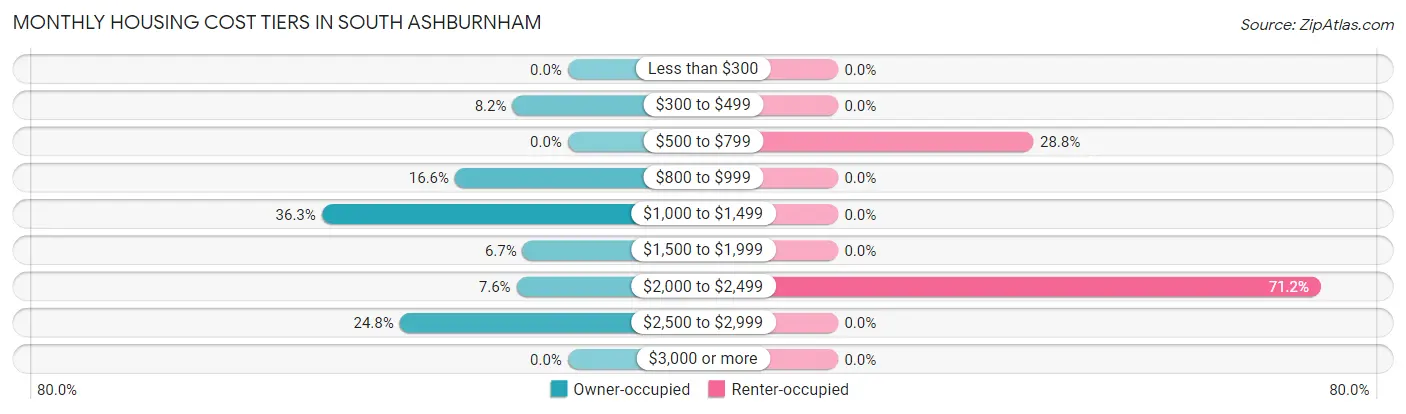
| Monthly Cost | Owner-occupied | Renter-occupied |
| Less than $300 | 0 (0.0%) | 0 (0.0%) |
| $300 to $499 | 27 (8.2%) | 0 (0.0%) |
| $500 to $799 | 0 (0.0%) | 17 (28.8%) |
| $800 to $999 | 55 (16.6%) | 0 (0.0%) |
| $1,000 to $1,499 | 120 (36.2%) | 0 (0.0%) |
| $1,500 to $1,999 | 22 (6.7%) | 0 (0.0%) |
| $2,000 to $2,499 | 25 (7.5%) | 42 (71.2%) |
| $2,500 to $2,999 | 82 (24.8%) | 0 (0.0%) |
| $3,000 or more | 0 (0.0%) | 0 (0.0%) |
| Total | 331 (100.0%) | 59 (100.0%) |
Physical Housing Characteristics in South Ashburnham
Housing Structures in South Ashburnham
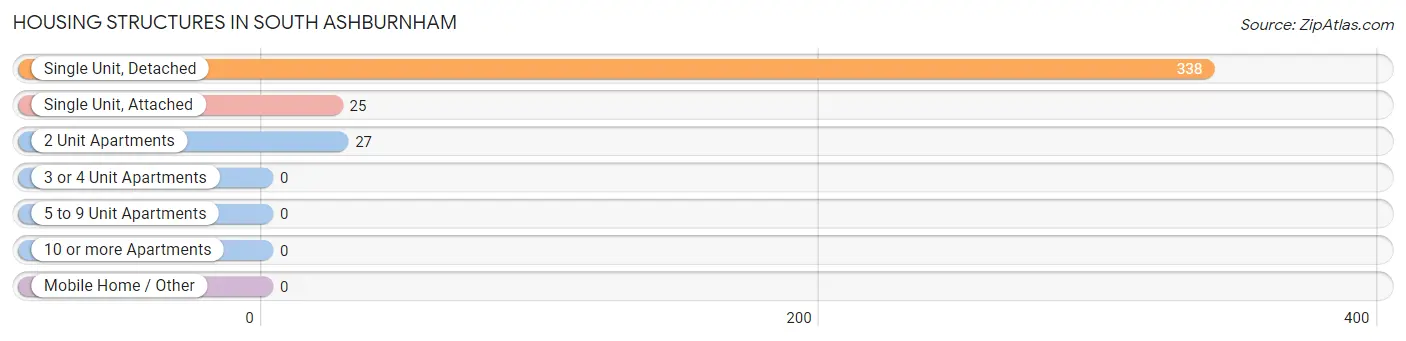
| Structure Type | # Housing Units | % Housing Units |
| Single Unit, Detached | 338 | 86.7% |
| Single Unit, Attached | 25 | 6.4% |
| 2 Unit Apartments | 27 | 6.9% |
| 3 or 4 Unit Apartments | 0 | 0.0% |
| 5 to 9 Unit Apartments | 0 | 0.0% |
| 10 or more Apartments | 0 | 0.0% |
| Mobile Home / Other | 0 | 0.0% |
| Total | 390 | 100.0% |
Housing Structures by Occupancy in South Ashburnham
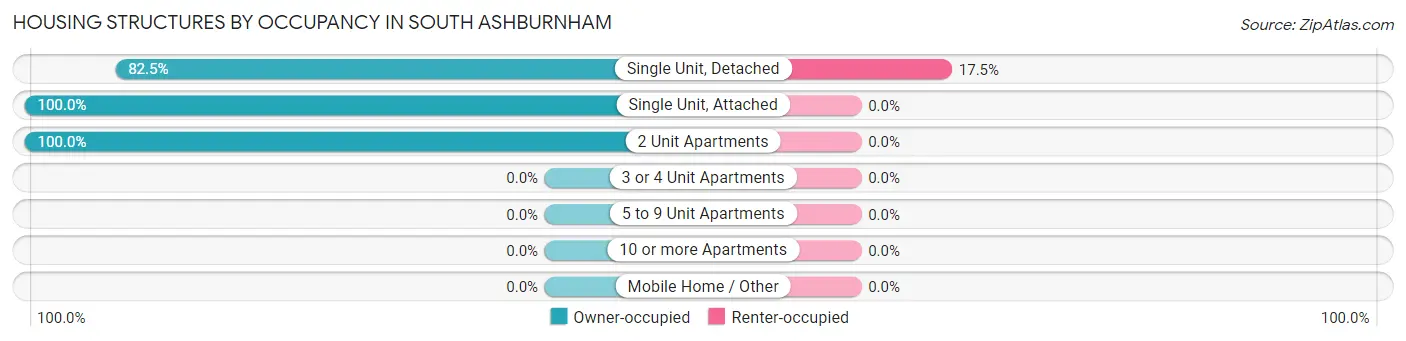
| Structure Type | Owner-occupied | Renter-occupied |
| Single Unit, Detached | 279 (82.5%) | 59 (17.5%) |
| Single Unit, Attached | 25 (100.0%) | 0 (0.0%) |
| 2 Unit Apartments | 27 (100.0%) | 0 (0.0%) |
| 3 or 4 Unit Apartments | 0 (0.0%) | 0 (0.0%) |
| 5 to 9 Unit Apartments | 0 (0.0%) | 0 (0.0%) |
| 10 or more Apartments | 0 (0.0%) | 0 (0.0%) |
| Mobile Home / Other | 0 (0.0%) | 0 (0.0%) |
| Total | 331 (84.9%) | 59 (15.1%) |
Housing Structures by Number of Rooms in South Ashburnham
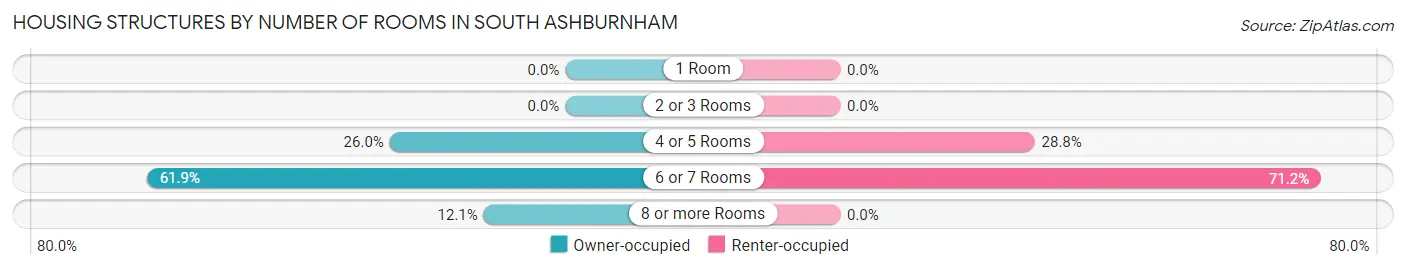
| Number of Rooms | Owner-occupied | Renter-occupied |
| 1 Room | 0 (0.0%) | 0 (0.0%) |
| 2 or 3 Rooms | 0 (0.0%) | 0 (0.0%) |
| 4 or 5 Rooms | 86 (26.0%) | 17 (28.8%) |
| 6 or 7 Rooms | 205 (61.9%) | 42 (71.2%) |
| 8 or more Rooms | 40 (12.1%) | 0 (0.0%) |
| Total | 331 (100.0%) | 59 (100.0%) |
Housing Structure by Heating Type in South Ashburnham
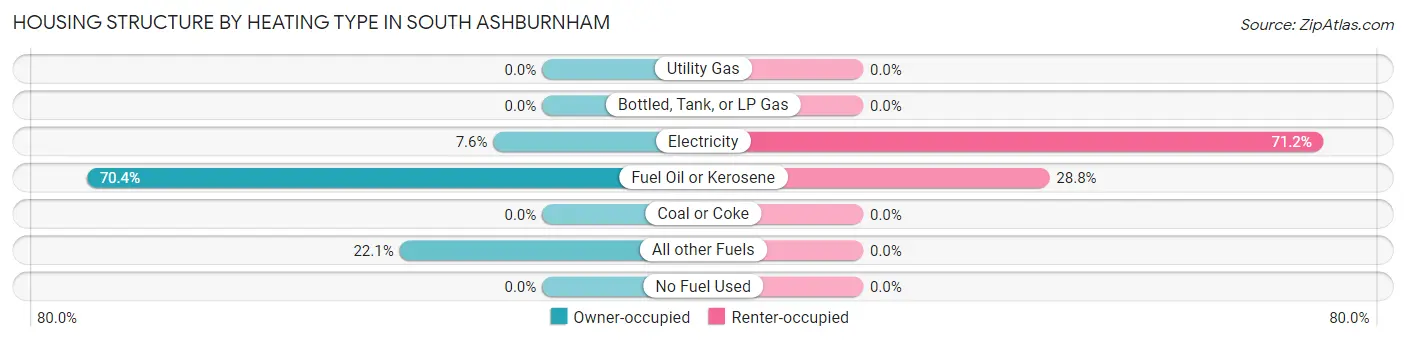
| Heating Type | Owner-occupied | Renter-occupied |
| Utility Gas | 0 (0.0%) | 0 (0.0%) |
| Bottled, Tank, or LP Gas | 0 (0.0%) | 0 (0.0%) |
| Electricity | 25 (7.5%) | 42 (71.2%) |
| Fuel Oil or Kerosene | 233 (70.4%) | 17 (28.8%) |
| Coal or Coke | 0 (0.0%) | 0 (0.0%) |
| All other Fuels | 73 (22.1%) | 0 (0.0%) |
| No Fuel Used | 0 (0.0%) | 0 (0.0%) |
| Total | 331 (100.0%) | 59 (100.0%) |
Household Vehicle Usage in South Ashburnham
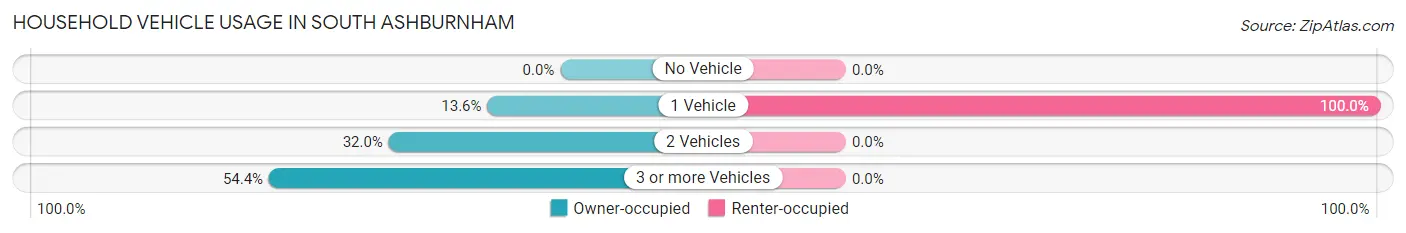
| Vehicles per Household | Owner-occupied | Renter-occupied |
| No Vehicle | 0 (0.0%) | 0 (0.0%) |
| 1 Vehicle | 45 (13.6%) | 59 (100.0%) |
| 2 Vehicles | 106 (32.0%) | 0 (0.0%) |
| 3 or more Vehicles | 180 (54.4%) | 0 (0.0%) |
| Total | 331 (100.0%) | 59 (100.0%) |
Real Estate & Mortgages in South Ashburnham
Real Estate and Mortgage Overview in South Ashburnham
| Characteristic | Without Mortgage | With Mortgage |
| Housing Units | 94 | 237 |
| Median Property Value | $339,200 | $265,100 |
| Median Household Income | - | - |
| Monthly Housing Costs | $910 | $0 |
| Real Estate Taxes | $5,746 | $0 |
Property Value by Mortgage Status in South Ashburnham
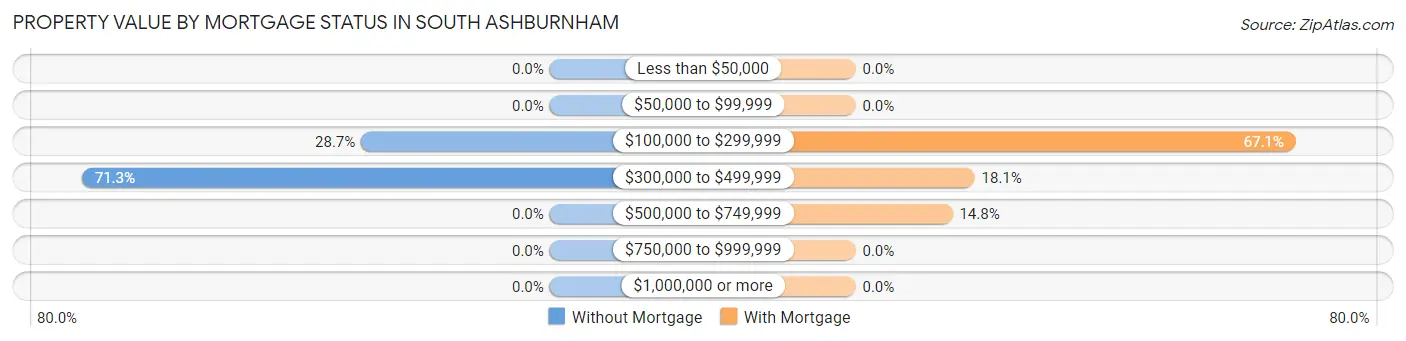
| Property Value | Without Mortgage | With Mortgage |
| Less than $50,000 | 0 (0.0%) | 0 (0.0%) |
| $50,000 to $99,999 | 0 (0.0%) | 0 (0.0%) |
| $100,000 to $299,999 | 27 (28.7%) | 159 (67.1%) |
| $300,000 to $499,999 | 67 (71.3%) | 43 (18.1%) |
| $500,000 to $749,999 | 0 (0.0%) | 35 (14.8%) |
| $750,000 to $999,999 | 0 (0.0%) | 0 (0.0%) |
| $1,000,000 or more | 0 (0.0%) | 0 (0.0%) |
| Total | 94 (100.0%) | 237 (100.0%) |
Household Income by Mortgage Status in South Ashburnham
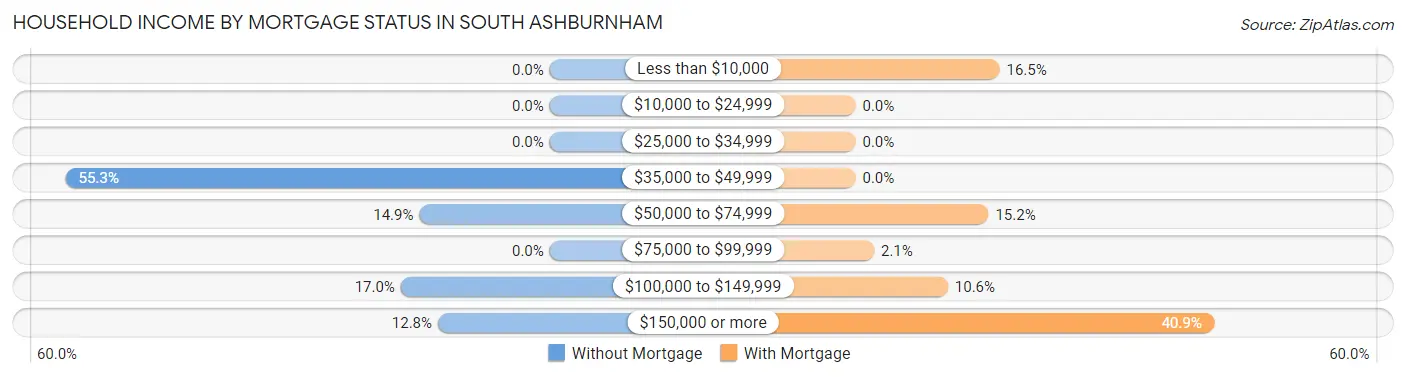
| Household Income | Without Mortgage | With Mortgage |
| Less than $10,000 | 0 (0.0%) | 39 (16.5%) |
| $10,000 to $24,999 | 0 (0.0%) | 0 (0.0%) |
| $25,000 to $34,999 | 0 (0.0%) | 0 (0.0%) |
| $35,000 to $49,999 | 52 (55.3%) | 0 (0.0%) |
| $50,000 to $74,999 | 14 (14.9%) | 36 (15.2%) |
| $75,000 to $99,999 | 0 (0.0%) | 5 (2.1%) |
| $100,000 to $149,999 | 16 (17.0%) | 25 (10.5%) |
| $150,000 or more | 12 (12.8%) | 97 (40.9%) |
| Total | 94 (100.0%) | 237 (100.0%) |
Property Value to Household Income Ratio in South Ashburnham
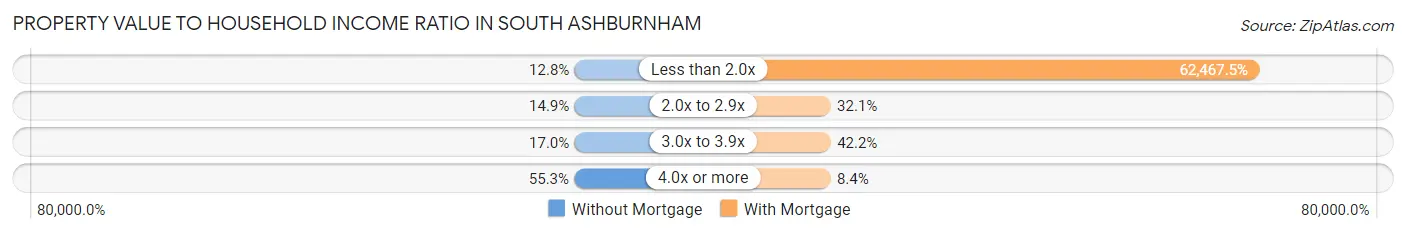
| Value-to-Income Ratio | Without Mortgage | With Mortgage |
| Less than 2.0x | 12 (12.8%) | 148,048 (62,467.5%) |
| 2.0x to 2.9x | 14 (14.9%) | 76 (32.1%) |
| 3.0x to 3.9x | 16 (17.0%) | 100 (42.2%) |
| 4.0x or more | 52 (55.3%) | 20 (8.4%) |
| Total | 94 (100.0%) | 237 (100.0%) |
Real Estate Taxes by Mortgage Status in South Ashburnham
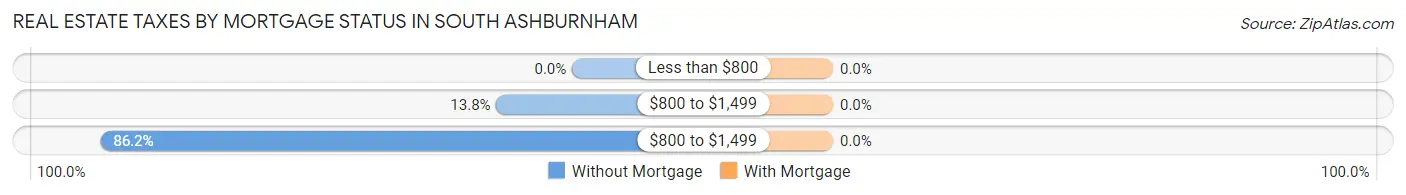
| Property Taxes | Without Mortgage | With Mortgage |
| Less than $800 | 0 (0.0%) | 0 (0.0%) |
| $800 to $1,499 | 13 (13.8%) | 0 (0.0%) |
| $800 to $1,499 | 81 (86.2%) | 0 (0.0%) |
| Total | 94 (100.0%) | 237 (100.0%) |
Health & Disability in South Ashburnham
Health Insurance Coverage by Age in South Ashburnham
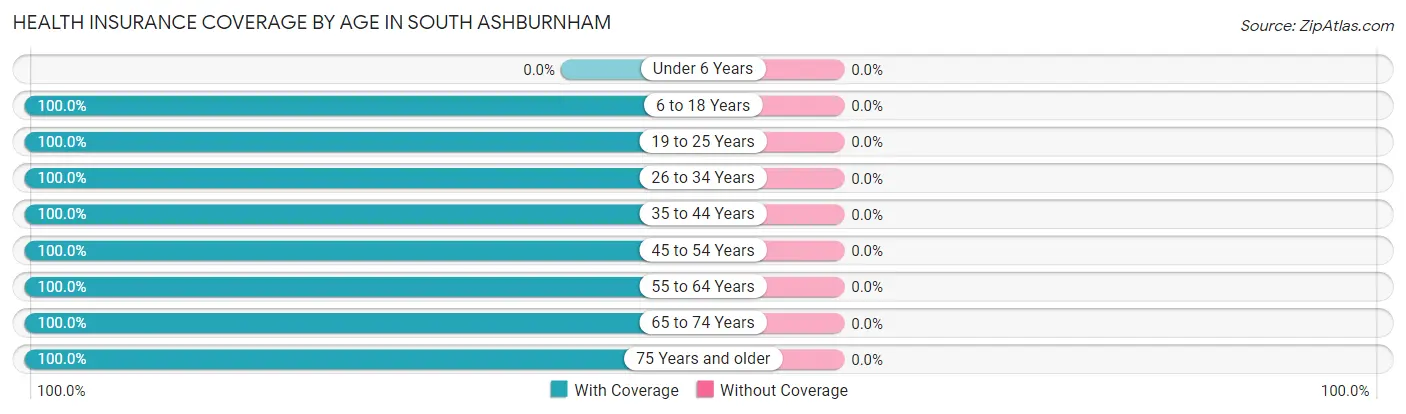
| Age Bracket | With Coverage | Without Coverage |
| Under 6 Years | 0 (0.0%) | 0 (0.0%) |
| 6 to 18 Years | 171 (100.0%) | 0 (0.0%) |
| 19 to 25 Years | 111 (100.0%) | 0 (0.0%) |
| 26 to 34 Years | 55 (100.0%) | 0 (0.0%) |
| 35 to 44 Years | 147 (100.0%) | 0 (0.0%) |
| 45 to 54 Years | 188 (100.0%) | 0 (0.0%) |
| 55 to 64 Years | 228 (100.0%) | 0 (0.0%) |
| 65 to 74 Years | 120 (100.0%) | 0 (0.0%) |
| 75 Years and older | 29 (100.0%) | 0 (0.0%) |
| Total | 1,049 (100.0%) | 0 (0.0%) |
Health Insurance Coverage by Citizenship Status in South Ashburnham
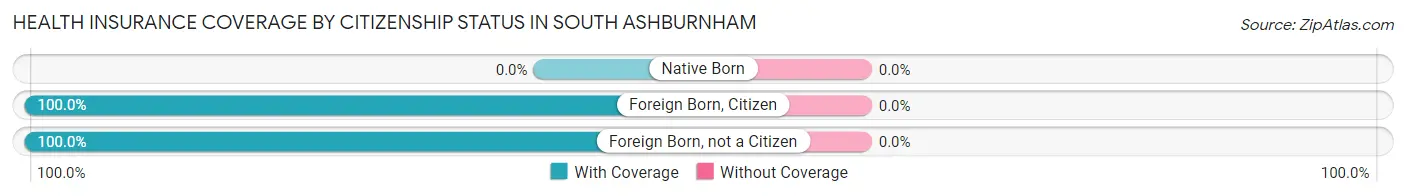
| Citizenship Status | With Coverage | Without Coverage |
| Native Born | 0 (0.0%) | 0 (0.0%) |
| Foreign Born, Citizen | 171 (100.0%) | 0 (0.0%) |
| Foreign Born, not a Citizen | 111 (100.0%) | 0 (0.0%) |
Health Insurance Coverage by Household Income in South Ashburnham
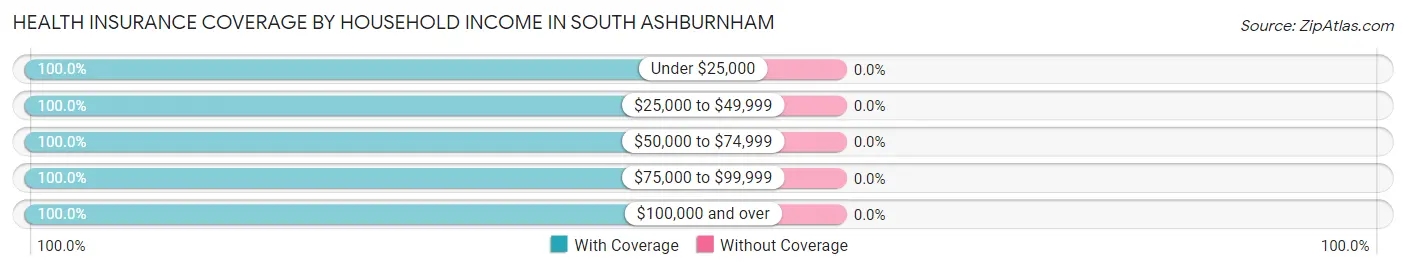
| Household Income | With Coverage | Without Coverage |
| Under $25,000 | 177 (100.0%) | 0 (0.0%) |
| $25,000 to $49,999 | 182 (100.0%) | 0 (0.0%) |
| $50,000 to $74,999 | 30 (100.0%) | 0 (0.0%) |
| $75,000 to $99,999 | 47 (100.0%) | 0 (0.0%) |
| $100,000 and over | 613 (100.0%) | 0 (0.0%) |
Public vs Private Health Insurance Coverage by Age in South Ashburnham
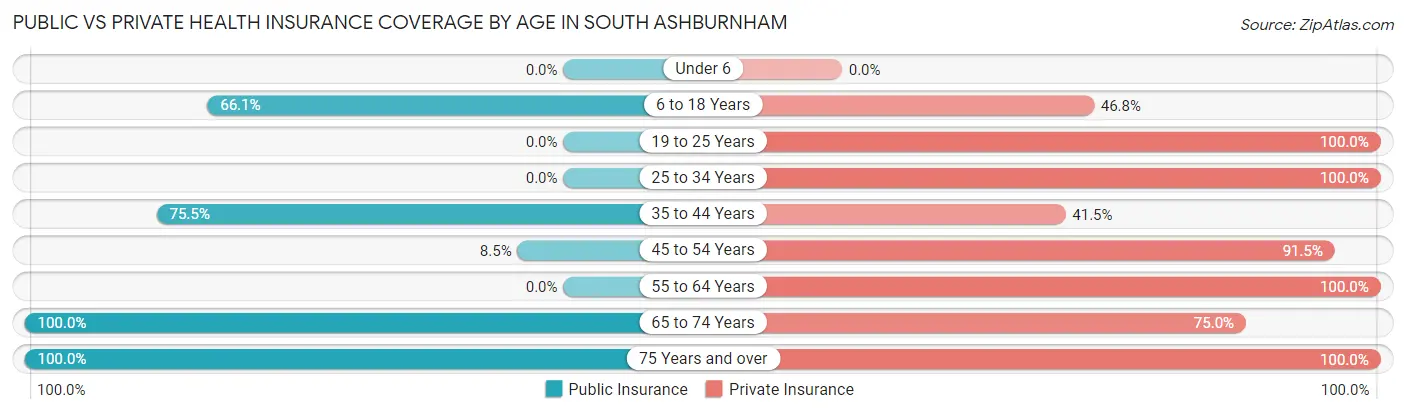
| Age Bracket | Public Insurance | Private Insurance |
| Under 6 | 0 (0.0%) | 0 (0.0%) |
| 6 to 18 Years | 113 (66.1%) | 80 (46.8%) |
| 19 to 25 Years | 0 (0.0%) | 111 (100.0%) |
| 25 to 34 Years | 0 (0.0%) | 55 (100.0%) |
| 35 to 44 Years | 111 (75.5%) | 61 (41.5%) |
| 45 to 54 Years | 16 (8.5%) | 172 (91.5%) |
| 55 to 64 Years | 0 (0.0%) | 228 (100.0%) |
| 65 to 74 Years | 120 (100.0%) | 90 (75.0%) |
| 75 Years and over | 29 (100.0%) | 29 (100.0%) |
| Total | 389 (37.1%) | 826 (78.7%) |
Disability Status by Sex by Age in South Ashburnham
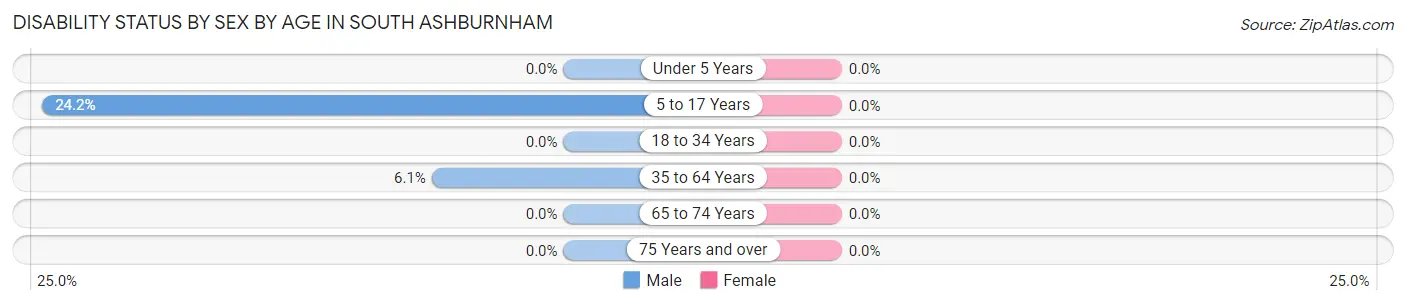
| Age Bracket | Male | Female |
| Under 5 Years | 0 (0.0%) | 0 (0.0%) |
| 5 to 17 Years | 22 (24.2%) | 0 (0.0%) |
| 18 to 34 Years | 0 (0.0%) | 0 (0.0%) |
| 35 to 64 Years | 16 (6.1%) | 0 (0.0%) |
| 65 to 74 Years | 0 (0.0%) | 0 (0.0%) |
| 75 Years and over | 0 (0.0%) | 0 (0.0%) |
Disability Class by Sex by Age in South Ashburnham
Disability Class: Hearing Difficulty
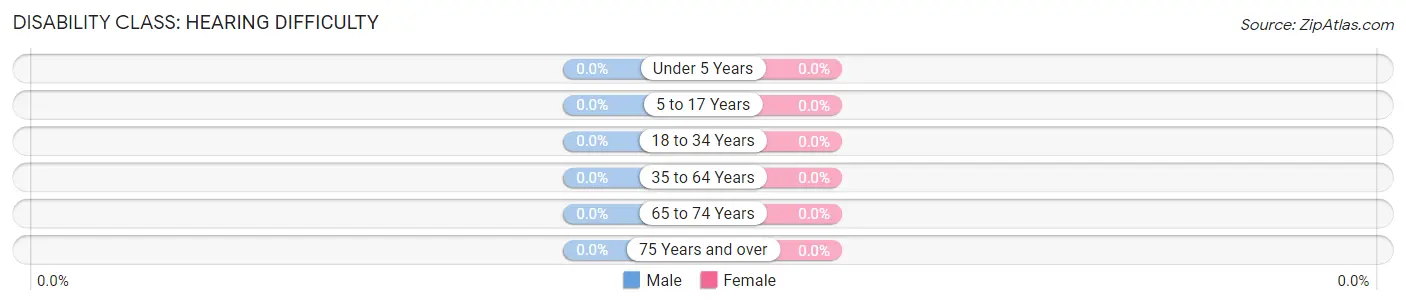
| Age Bracket | Male | Female |
| Under 5 Years | 0 (0.0%) | 0 (0.0%) |
| 5 to 17 Years | 0 (0.0%) | 0 (0.0%) |
| 18 to 34 Years | 0 (0.0%) | 0 (0.0%) |
| 35 to 64 Years | 0 (0.0%) | 0 (0.0%) |
| 65 to 74 Years | 0 (0.0%) | 0 (0.0%) |
| 75 Years and over | 0 (0.0%) | 0 (0.0%) |
Disability Class: Vision Difficulty
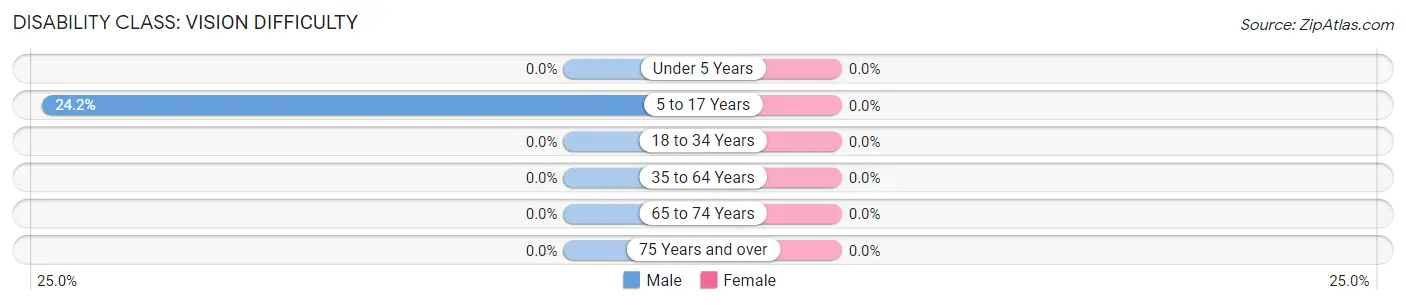
| Age Bracket | Male | Female |
| Under 5 Years | 0 (0.0%) | 0 (0.0%) |
| 5 to 17 Years | 22 (24.2%) | 0 (0.0%) |
| 18 to 34 Years | 0 (0.0%) | 0 (0.0%) |
| 35 to 64 Years | 0 (0.0%) | 0 (0.0%) |
| 65 to 74 Years | 0 (0.0%) | 0 (0.0%) |
| 75 Years and over | 0 (0.0%) | 0 (0.0%) |
Disability Class: Cognitive Difficulty
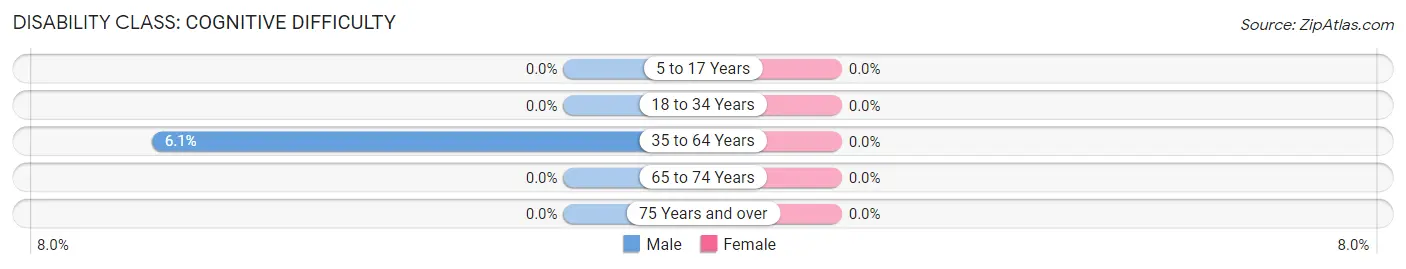
| Age Bracket | Male | Female |
| 5 to 17 Years | 0 (0.0%) | 0 (0.0%) |
| 18 to 34 Years | 0 (0.0%) | 0 (0.0%) |
| 35 to 64 Years | 16 (6.1%) | 0 (0.0%) |
| 65 to 74 Years | 0 (0.0%) | 0 (0.0%) |
| 75 Years and over | 0 (0.0%) | 0 (0.0%) |
Disability Class: Ambulatory Difficulty
| Age Bracket | Male | Female |
| 5 to 17 Years | 0 (0.0%) | 0 (0.0%) |
| 18 to 34 Years | 0 (0.0%) | 0 (0.0%) |
| 35 to 64 Years | 0 (0.0%) | 0 (0.0%) |
| 65 to 74 Years | 0 (0.0%) | 0 (0.0%) |
| 75 Years and over | 0 (0.0%) | 0 (0.0%) |
Disability Class: Self-Care Difficulty
| Age Bracket | Male | Female |
| 5 to 17 Years | 0 (0.0%) | 0 (0.0%) |
| 18 to 34 Years | 0 (0.0%) | 0 (0.0%) |
| 35 to 64 Years | 0 (0.0%) | 0 (0.0%) |
| 65 to 74 Years | 0 (0.0%) | 0 (0.0%) |
| 75 Years and over | 0 (0.0%) | 0 (0.0%) |
Technology Access in South Ashburnham
Computing Device Access in South Ashburnham
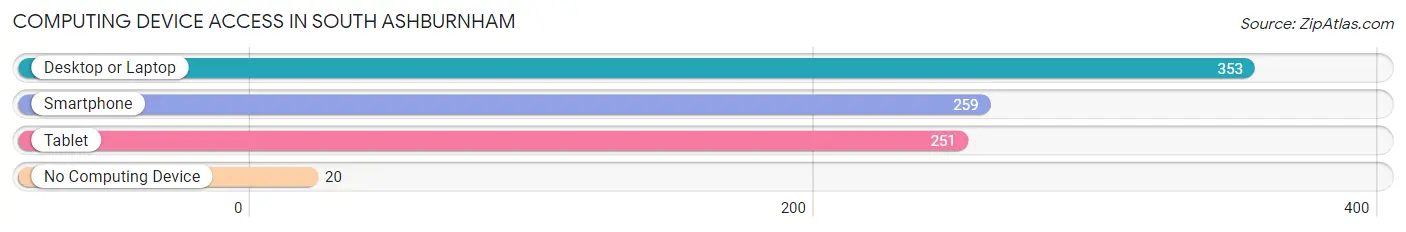
| Device Type | # Households | % Households |
| Desktop or Laptop | 353 | 90.5% |
| Smartphone | 259 | 66.4% |
| Tablet | 251 | 64.4% |
| No Computing Device | 20 | 5.1% |
| Total | 390 | 100.0% |
Internet Access in South Ashburnham
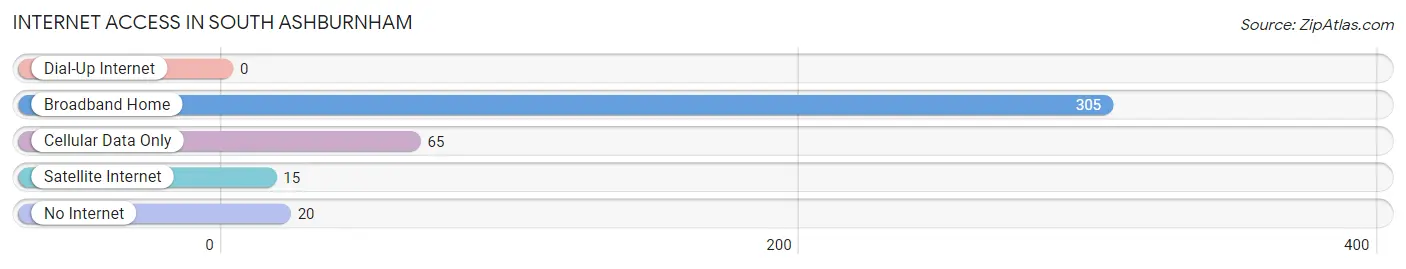
| Internet Type | # Households | % Households |
| Dial-Up Internet | 0 | 0.0% |
| Broadband Home | 305 | 78.2% |
| Cellular Data Only | 65 | 16.7% |
| Satellite Internet | 15 | 3.8% |
| No Internet | 20 | 5.1% |
| Total | 390 | 100.0% |
South Ashburnham Summary
Ashburnham is a small town located in the north-central part of Massachusetts, in the county of Worcester. It is bordered by the towns of Westminster, Gardner, Winchendon, and Ashby. The town has a population of approximately 4,000 people, and is located about 40 miles west of Boston.
History
The area that is now Ashburnham was originally inhabited by the Nipmuc tribe, who called the area “Ashquonam”, meaning “place of many oaks”. The first European settlers arrived in the area in 1735, and the town was officially incorporated in 1765. The town was named after William Ashburnham, a British politician who had served as the Paymaster General of the British Army.
In the 19th century, Ashburnham was a thriving agricultural community, with many farms and mills. The town was also home to several small industries, including a paper mill, a grist mill, and a sawmill. The town also had a thriving lumber industry, and was home to several sawmills.
Geography
Ashburnham is located in north-central Massachusetts, in the county of Worcester. It is bordered by the towns of Westminster, Gardner, Winchendon, and Ashby. The town is located about 40 miles west of Boston.
The town is located in the foothills of the Berkshires, and is surrounded by rolling hills and forests. The town is home to several lakes, including Lake Watatic, Lake Monomonac, and Lake Wyman. The town is also home to several rivers, including the Nashua River, the Quinapoxet River, and the Millers River.
Economy
The economy of Ashburnham is largely based on agriculture and tourism. The town is home to several farms, which produce a variety of crops, including apples, corn, and hay. The town is also home to several small businesses, including restaurants, retail stores, and service providers.
The town is also home to several tourist attractions, including the Ashburnham State Forest, the Ashburnham Historical Society, and the Ashburnham Town Hall. The town is also home to several golf courses, including the Ashburnham Country Club and the Ashburnham Golf Course.
Demographics
As of the 2010 census, the population of Ashburnham was 4,081. The racial makeup of the town was 97.3% White, 0.7% African American, 0.3% Native American, 0.4% Asian, 0.1% Pacific Islander, 0.3% from other races, and 0.9% from two or more races. Hispanic or Latino of any race were 1.2% of the population.
The median household income in Ashburnham was $60,938, and the median family income was $71,250. The per capita income for the town was $27,945. About 5.2% of families and 7.2% of the population were below the poverty line, including 8.3% of those under age 18 and 5.2% of those age 65 or over.
Common Questions
What is Per Capita Income in South Ashburnham?
Per Capita income in South Ashburnham is $39,876.
What is the Median Family Income in South Ashburnham?
Median Family Income in South Ashburnham is $102,216.
What is the Median Household income in South Ashburnham?
Median Household Income in South Ashburnham is $100,455.
What is Income or Wage Gap in South Ashburnham?
Income or Wage Gap in South Ashburnham is 33.4%.
Women in South Ashburnham earn 66.6 cents for every dollar earned by a man.
What is Inequality or Gini Index in South Ashburnham?
Inequality or Gini Index in South Ashburnham is 0.40.
What is the Total Population of South Ashburnham?
Total Population of South Ashburnham is 1,049.
What is the Total Male Population of South Ashburnham?
Total Male Population of South Ashburnham is 555.
What is the Total Female Population of South Ashburnham?
Total Female Population of South Ashburnham is 494.
What is the Ratio of Males per 100 Females in South Ashburnham?
There are 112.35 Males per 100 Females in South Ashburnham.
What is the Ratio of Females per 100 Males in South Ashburnham?
There are 89.01 Females per 100 Males in South Ashburnham.
What is the Median Population Age in South Ashburnham?
Median Population Age in South Ashburnham is 47.0 Years.
What is the Average Family Size in South Ashburnham
Average Family Size in South Ashburnham is 2.8 People.
What is the Average Household Size in South Ashburnham
Average Household Size in South Ashburnham is 2.7 People.
How Large is the Labor Force in South Ashburnham?
There are 583 People in the Labor Forcein in South Ashburnham.
What is the Percentage of People in the Labor Force in South Ashburnham?
66.4% of People are in the Labor Force in South Ashburnham.