Fitchburg, MA Map & Demographics
Fitchburg Map

Fitchburg Overview
$33,436
PER CAPITA INCOME
$81,720
AVG FAMILY INCOME
$65,963
AVG HOUSEHOLD INCOME
19.8%
WAGE / INCOME GAP [ % ]
80.2¢/ $1
WAGE / INCOME GAP [ $ ]
$8,715
FAMILY INCOME DEFICIT
0.43
INEQUALITY / GINI INDEX
41,621
TOTAL POPULATION
20,082
MALE POPULATION
21,539
FEMALE POPULATION
93.24
MALES / 100 FEMALES
107.26
FEMALES / 100 MALES
37.6
MEDIAN AGE
3.1
AVG FAMILY SIZE
2.4
AVG HOUSEHOLD SIZE
22,525
LABOR FORCE [ PEOPLE ]
66.3%
PERCENT IN LABOR FORCE
7.7%
UNEMPLOYMENT RATE
Fitchburg Zip Codes
Income in Fitchburg
Income Overview in Fitchburg
Per Capita Income in Fitchburg is $33,436, while median incomes of families and households are $81,720 and $65,963 respectively.
| Characteristic | Number | Measure |
| Per Capita Income | 41,621 | $33,436 |
| Median Family Income | 9,656 | $81,720 |
| Mean Family Income | 9,656 | $91,956 |
| Median Household Income | 16,645 | $65,963 |
| Mean Household Income | 16,645 | $82,372 |
| Income Deficit | 9,656 | $8,715 |
| Wage / Income Gap (%) | 41,621 | 19.79% |
| Wage / Income Gap ($) | 41,621 | 80.21¢ per $1 |
| Gini / Inequality Index | 41,621 | 0.43 |
Earnings by Sex in Fitchburg
Average Earnings in Fitchburg are $40,280, $44,143 for men and $35,407 for women, a difference of 19.8%.
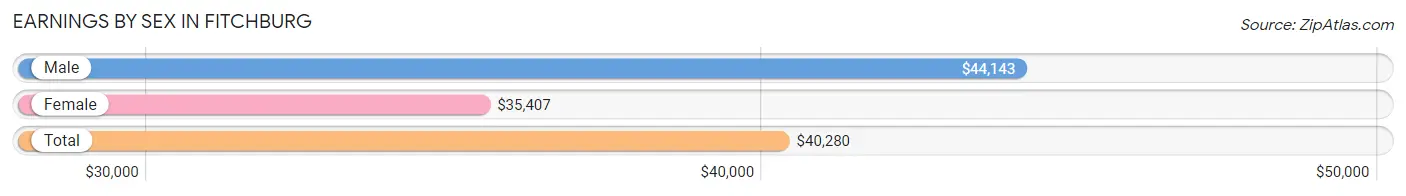
| Sex | Number | Average Earnings |
| Male | 11,600 (50.5%) | $44,143 |
| Female | 11,389 (49.5%) | $35,407 |
| Total | 22,989 (100.0%) | $40,280 |
Earnings by Sex by Income Bracket in Fitchburg
The most common earnings brackets in Fitchburg are $75,000 to $99,999 for men (1,615 | 13.9%) and $55,000 to $64,999 for women (1,095 | 9.6%).
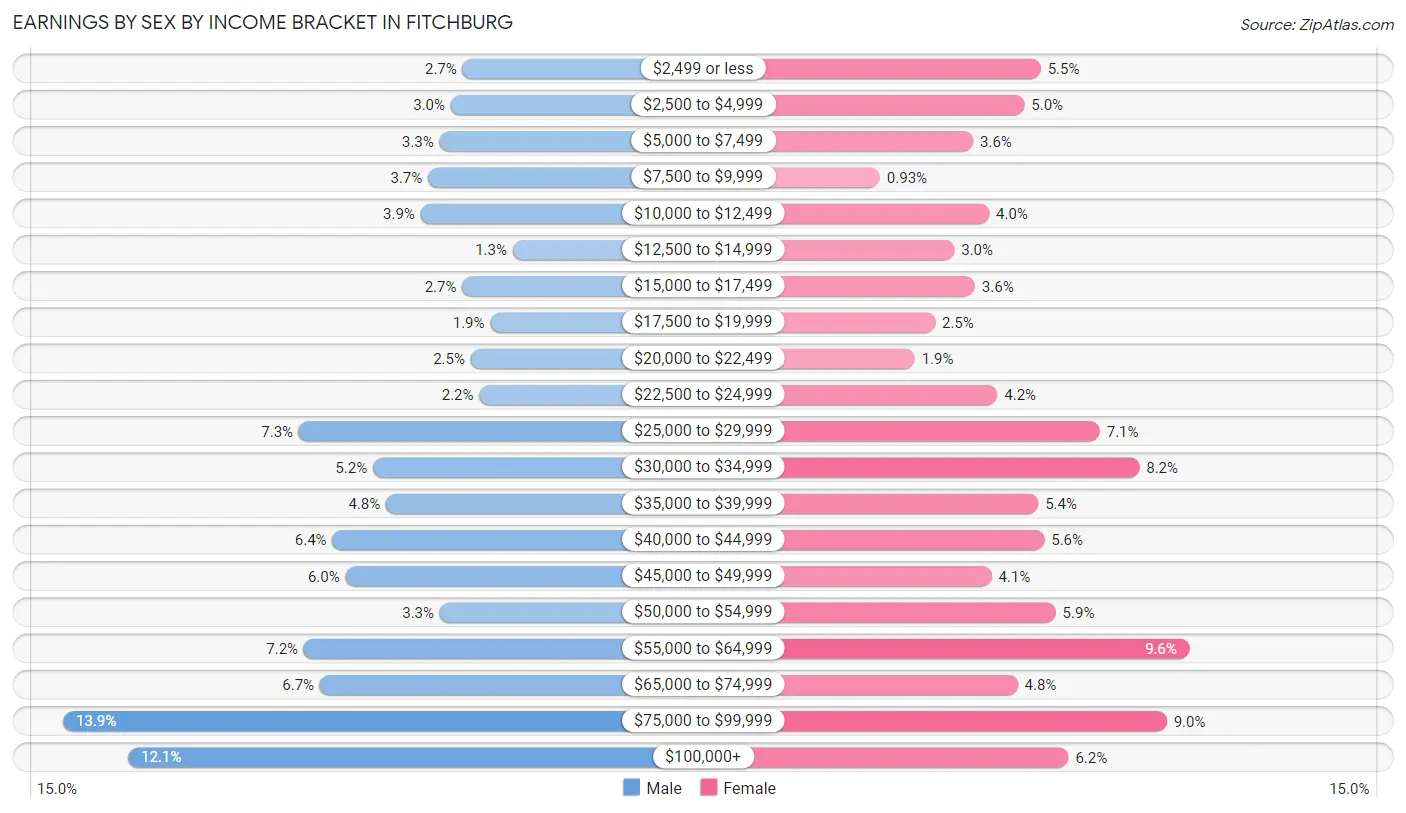
| Income | Male | Female |
| $2,499 or less | 312 (2.7%) | 621 (5.4%) |
| $2,500 to $4,999 | 350 (3.0%) | 568 (5.0%) |
| $5,000 to $7,499 | 387 (3.3%) | 404 (3.5%) |
| $7,500 to $9,999 | 424 (3.7%) | 106 (0.9%) |
| $10,000 to $12,499 | 449 (3.9%) | 456 (4.0%) |
| $12,500 to $14,999 | 149 (1.3%) | 344 (3.0%) |
| $15,000 to $17,499 | 313 (2.7%) | 410 (3.6%) |
| $17,500 to $19,999 | 222 (1.9%) | 282 (2.5%) |
| $20,000 to $22,499 | 285 (2.5%) | 218 (1.9%) |
| $22,500 to $24,999 | 258 (2.2%) | 482 (4.2%) |
| $25,000 to $29,999 | 846 (7.3%) | 810 (7.1%) |
| $30,000 to $34,999 | 604 (5.2%) | 936 (8.2%) |
| $35,000 to $39,999 | 561 (4.8%) | 613 (5.4%) |
| $40,000 to $44,999 | 737 (6.4%) | 632 (5.6%) |
| $45,000 to $49,999 | 694 (6.0%) | 464 (4.1%) |
| $50,000 to $54,999 | 386 (3.3%) | 668 (5.9%) |
| $55,000 to $64,999 | 829 (7.1%) | 1,095 (9.6%) |
| $65,000 to $74,999 | 777 (6.7%) | 547 (4.8%) |
| $75,000 to $99,999 | 1,615 (13.9%) | 1,024 (9.0%) |
| $100,000+ | 1,402 (12.1%) | 709 (6.2%) |
| Total | 11,600 (100.0%) | 11,389 (100.0%) |
Earnings by Sex by Educational Attainment in Fitchburg
Average earnings in Fitchburg are $50,913 for men and $44,343 for women, a difference of 12.9%. Men with an educational attainment of graduate degree enjoy the highest average annual earnings of $84,328, while those with less than high school education earn the least with $32,019. Women with an educational attainment of graduate degree earn the most with the average annual earnings of $72,863, while those with less than high school education have the smallest earnings of $35,495.
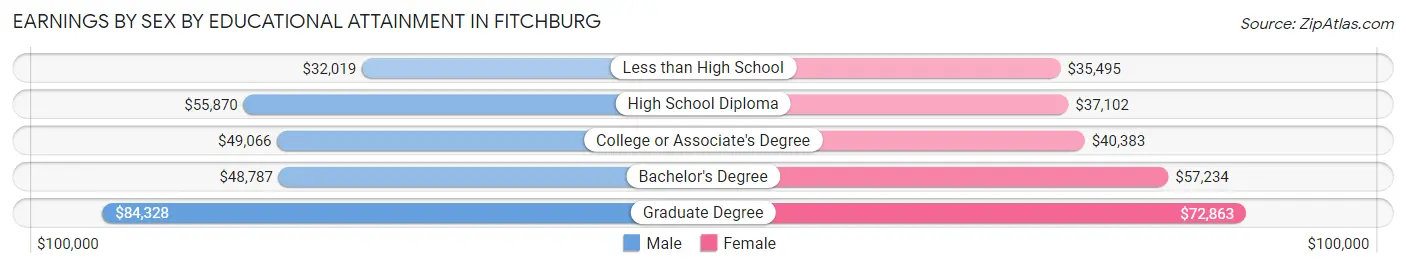
| Educational Attainment | Male Income | Female Income |
| Less than High School | $32,019 | $35,495 |
| High School Diploma | $55,870 | $37,102 |
| College or Associate's Degree | $49,066 | $40,383 |
| Bachelor's Degree | $48,787 | $57,234 |
| Graduate Degree | $84,328 | $72,863 |
| Total | $50,913 | $44,343 |
Family Income in Fitchburg
Family Income Brackets in Fitchburg
According to the Fitchburg family income data, there are 2,482 families falling into the $100,000 to $149,999 income range, which is the most common income bracket and makes up 25.7% of all families. Conversely, the $10,000 to $14,999 income bracket is the least frequent group with only 241 families (2.5%) belonging to this category.
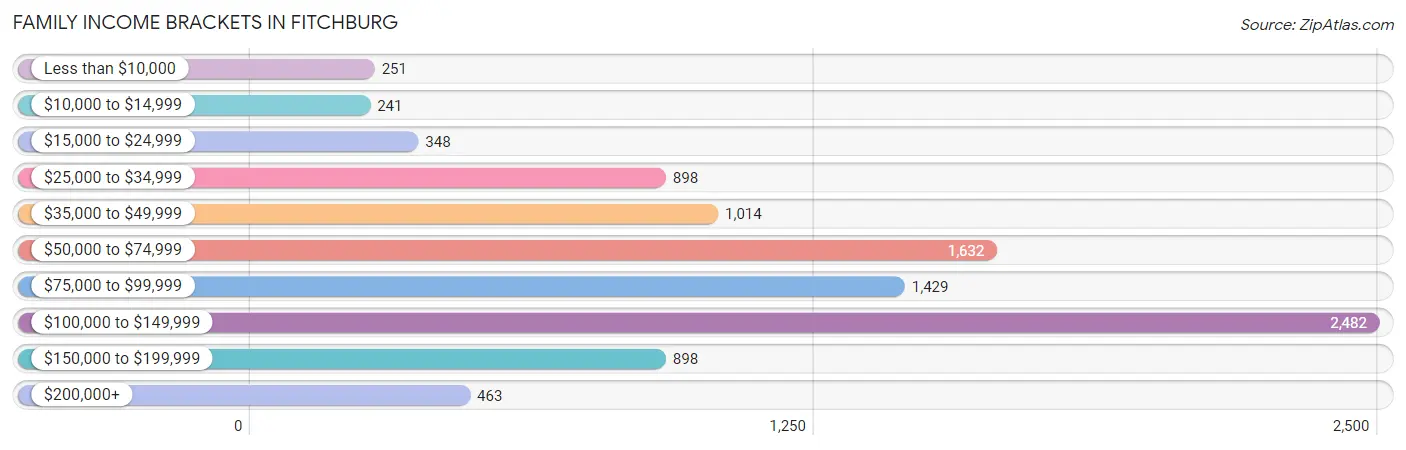
| Income Bracket | # Families | % Families |
| Less than $10,000 | 251 | 2.6% |
| $10,000 to $14,999 | 241 | 2.5% |
| $15,000 to $24,999 | 348 | 3.6% |
| $25,000 to $34,999 | 898 | 9.3% |
| $35,000 to $49,999 | 1,014 | 10.5% |
| $50,000 to $74,999 | 1,632 | 16.9% |
| $75,000 to $99,999 | 1,429 | 14.8% |
| $100,000 to $149,999 | 2,482 | 25.7% |
| $150,000 to $199,999 | 898 | 9.3% |
| $200,000+ | 463 | 4.8% |
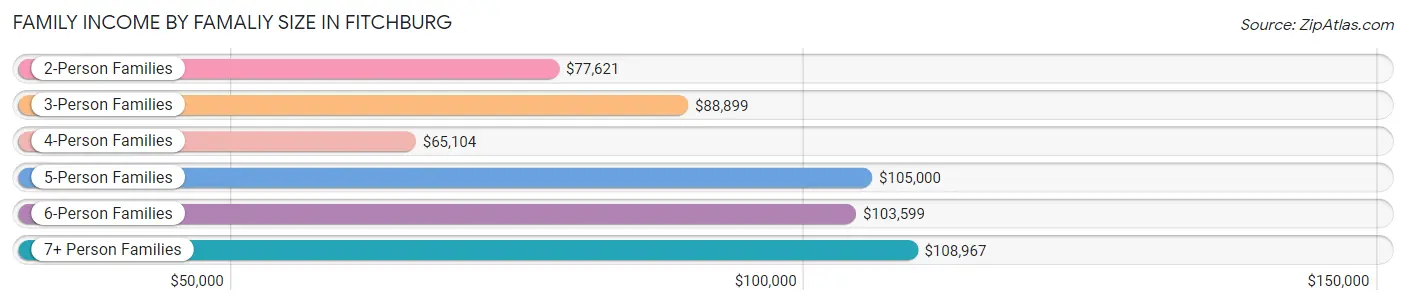
Family Income by Famaliy Size in Fitchburg
7+ person families (219 | 2.3%) account for the highest median family income in Fitchburg with $108,967 per family, while 2-person families (4,320 | 44.7%) have the highest median income of $38,810 per family member.
| Income Bracket | # Families | Median Income |
| 2-Person Families | 4,320 (44.7%) | $77,621 |
| 3-Person Families | 2,301 (23.8%) | $88,899 |
| 4-Person Families | 2,049 (21.2%) | $65,104 |
| 5-Person Families | 582 (6.0%) | $105,000 |
| 6-Person Families | 185 (1.9%) | $103,599 |
| 7+ Person Families | 219 (2.3%) | $108,967 |
| Total | 9,656 (100.0%) | $81,720 |
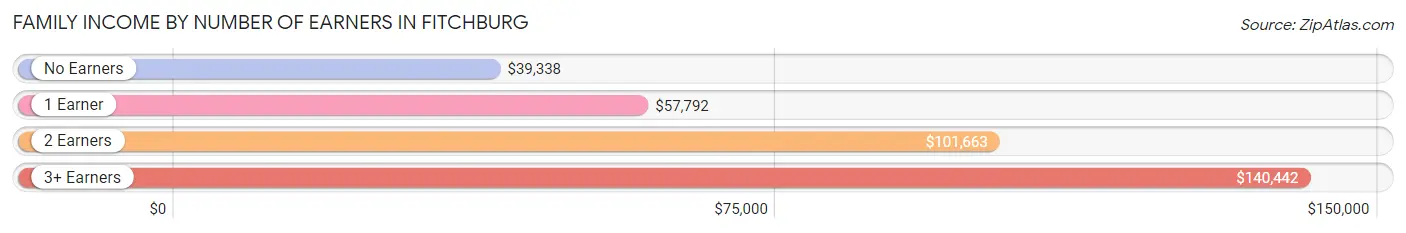
Family Income by Number of Earners in Fitchburg
The median family income in Fitchburg is $81,720, with families comprising 3+ earners (1,287) having the highest median family income of $140,442, while families with no earners (1,199) have the lowest median family income of $39,338, accounting for 13.3% and 12.4% of families, respectively.
| Number of Earners | # Families | Median Income |
| No Earners | 1,199 (12.4%) | $39,338 |
| 1 Earner | 3,221 (33.4%) | $57,792 |
| 2 Earners | 3,949 (40.9%) | $101,663 |
| 3+ Earners | 1,287 (13.3%) | $140,442 |
| Total | 9,656 (100.0%) | $81,720 |
Household Income in Fitchburg
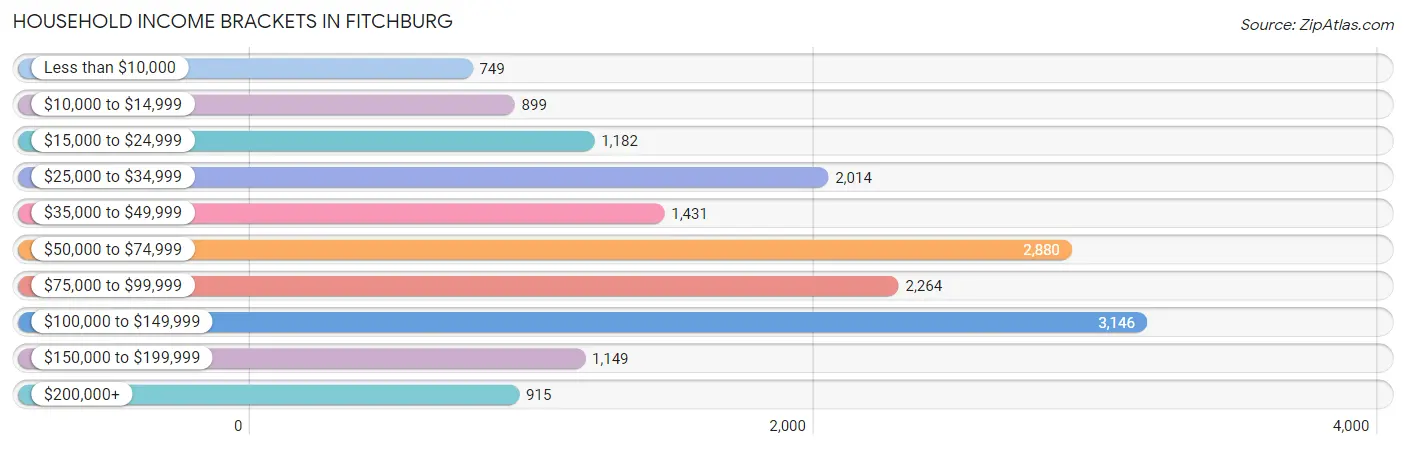
Household Income Brackets in Fitchburg
With 3,146 households falling in the category, the $100,000 to $149,999 income range is the most frequent in Fitchburg, accounting for 18.9% of all households. In contrast, only 749 households (4.5%) fall into the less than $10,000 income bracket, making it the least populous group.
| Income Bracket | # Households | % Households |
| Less than $10,000 | 749 | 4.5% |
| $10,000 to $14,999 | 899 | 5.4% |
| $15,000 to $24,999 | 1,182 | 7.1% |
| $25,000 to $34,999 | 2,014 | 12.1% |
| $35,000 to $49,999 | 1,431 | 8.6% |
| $50,000 to $74,999 | 2,880 | 17.3% |
| $75,000 to $99,999 | 2,264 | 13.6% |
| $100,000 to $149,999 | 3,146 | 18.9% |
| $150,000 to $199,999 | 1,149 | 6.9% |
| $200,000+ | 915 | 5.5% |
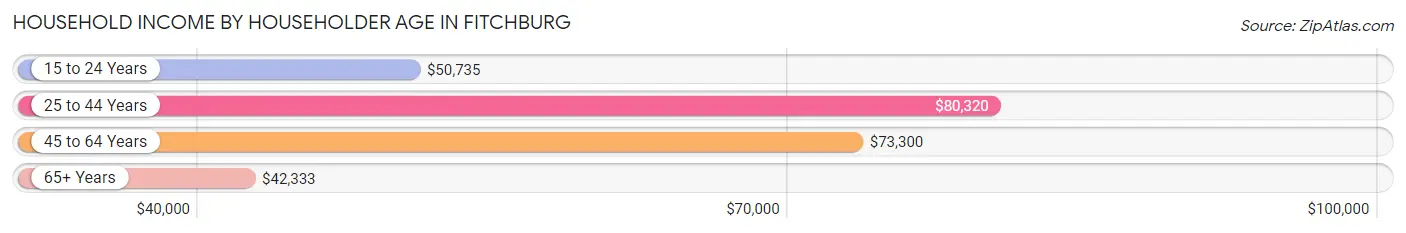
Household Income by Householder Age in Fitchburg
The median household income in Fitchburg is $65,963, with the highest median household income of $80,320 found in the 25 to 44 years age bracket for the primary householder. A total of 5,343 households (32.1%) fall into this category. Meanwhile, the 65+ years age bracket for the primary householder has the lowest median household income of $42,333, with 3,676 households (22.1%) in this group.
| Income Bracket | # Households | Median Income |
| 15 to 24 Years | 810 (4.9%) | $50,735 |
| 25 to 44 Years | 5,343 (32.1%) | $80,320 |
| 45 to 64 Years | 6,816 (40.9%) | $73,300 |
| 65+ Years | 3,676 (22.1%) | $42,333 |
| Total | 16,645 (100.0%) | $65,963 |
Poverty in Fitchburg
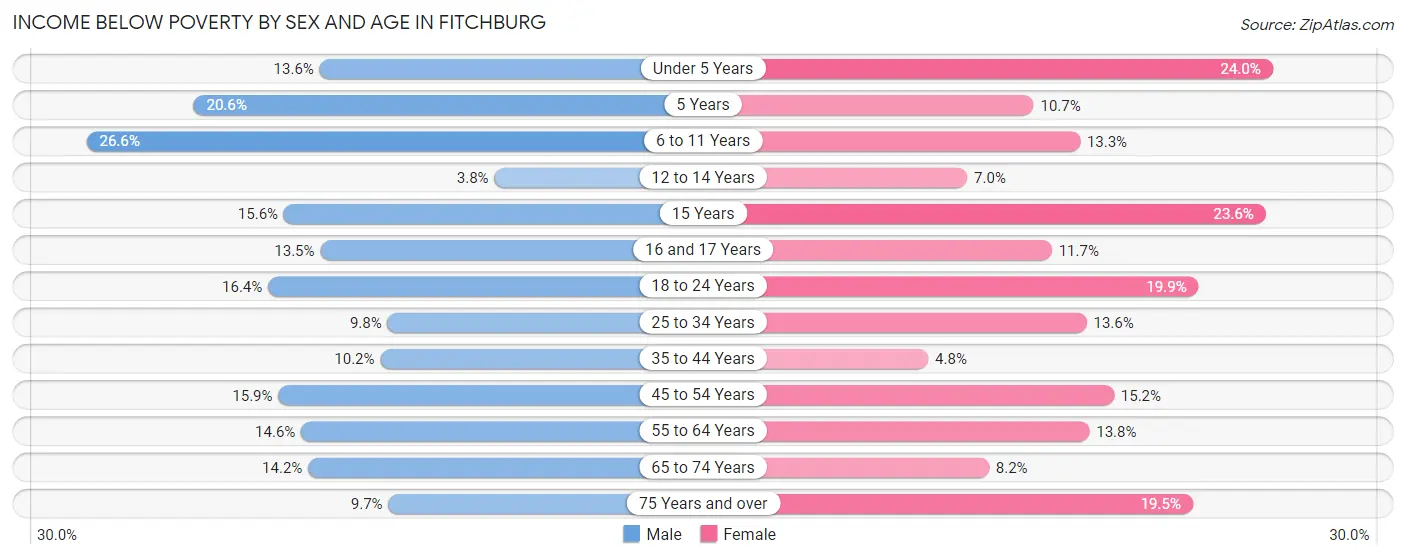
Income Below Poverty by Sex and Age in Fitchburg
With 13.9% poverty level for males and 14.0% for females among the residents of Fitchburg, 6 to 11 year old males and under 5 year old females are the most vulnerable to poverty, with 385 males (26.6%) and 363 females (24.0%) in their respective age groups living below the poverty level.
| Age Bracket | Male | Female |
| Under 5 Years | 92 (13.6%) | 363 (24.0%) |
| 5 Years | 42 (20.6%) | 25 (10.7%) |
| 6 to 11 Years | 385 (26.6%) | 189 (13.3%) |
| 12 to 14 Years | 29 (3.8%) | 59 (7.0%) |
| 15 Years | 28 (15.6%) | 38 (23.6%) |
| 16 and 17 Years | 51 (13.5%) | 47 (11.7%) |
| 18 to 24 Years | 294 (16.4%) | 476 (19.9%) |
| 25 to 34 Years | 285 (9.8%) | 387 (13.6%) |
| 35 to 44 Years | 279 (10.2%) | 114 (4.8%) |
| 45 to 54 Years | 487 (15.9%) | 355 (15.1%) |
| 55 to 64 Years | 413 (14.6%) | 395 (13.8%) |
| 65 to 74 Years | 206 (14.2%) | 148 (8.2%) |
| 75 Years and over | 85 (9.7%) | 295 (19.5%) |
| Total | 2,676 (13.9%) | 2,891 (14.0%) |
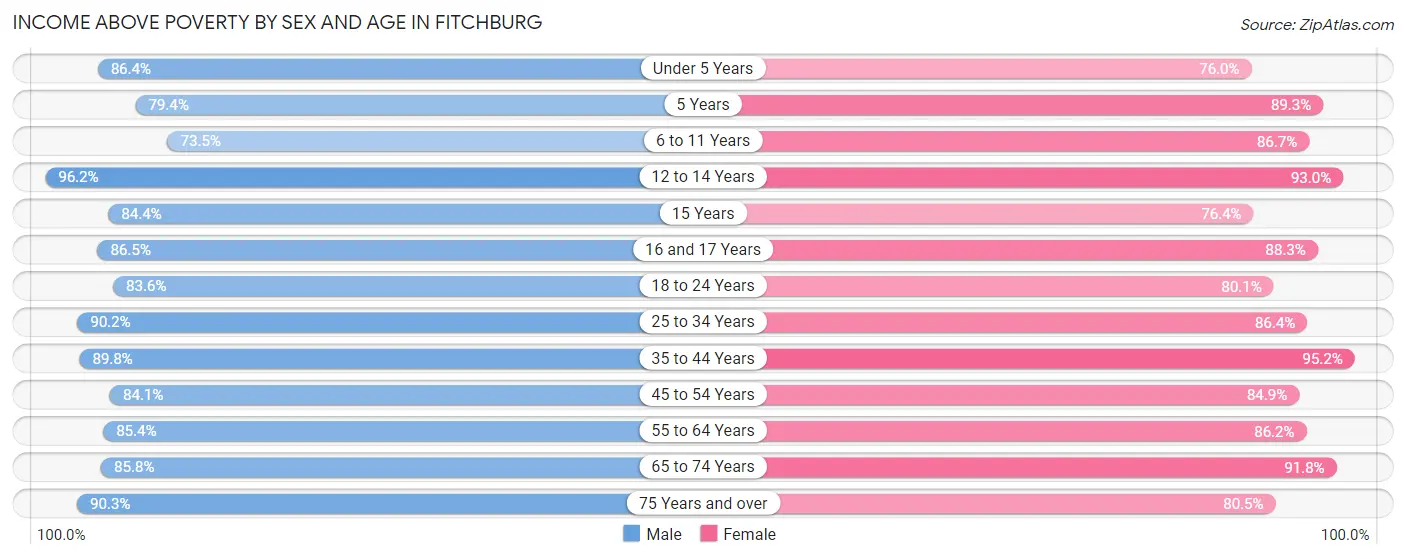
Income Above Poverty by Sex and Age in Fitchburg
According to the poverty statistics in Fitchburg, males aged 12 to 14 years and females aged 35 to 44 years are the age groups that are most secure financially, with 96.2% of males and 95.2% of females in these age groups living above the poverty line.
| Age Bracket | Male | Female |
| Under 5 Years | 586 (86.4%) | 1,150 (76.0%) |
| 5 Years | 162 (79.4%) | 209 (89.3%) |
| 6 to 11 Years | 1,065 (73.5%) | 1,236 (86.7%) |
| 12 to 14 Years | 727 (96.2%) | 786 (93.0%) |
| 15 Years | 152 (84.4%) | 123 (76.4%) |
| 16 and 17 Years | 326 (86.5%) | 355 (88.3%) |
| 18 to 24 Years | 1,494 (83.6%) | 1,921 (80.1%) |
| 25 to 34 Years | 2,625 (90.2%) | 2,453 (86.4%) |
| 35 to 44 Years | 2,459 (89.8%) | 2,258 (95.2%) |
| 45 to 54 Years | 2,582 (84.1%) | 1,989 (84.9%) |
| 55 to 64 Years | 2,416 (85.4%) | 2,471 (86.2%) |
| 65 to 74 Years | 1,244 (85.8%) | 1,659 (91.8%) |
| 75 Years and over | 788 (90.3%) | 1,215 (80.5%) |
| Total | 16,626 (86.1%) | 17,825 (86.0%) |
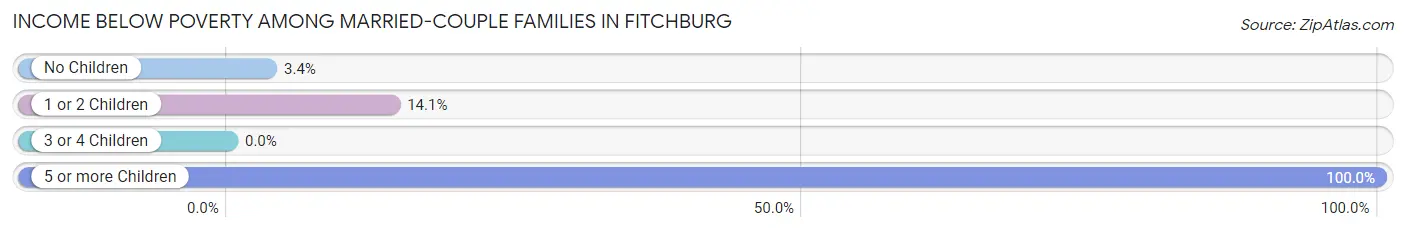
Income Below Poverty Among Married-Couple Families in Fitchburg
The poverty statistics for married-couple families in Fitchburg show that 7.3% or 433 of the total 5,909 families live below the poverty line. Families with 5 or more children have the highest poverty rate of 100.0%, comprising of 18 families. On the other hand, families with 3 or 4 children have the lowest poverty rate of 0.0%, which includes 0 families.
| Children | Above Poverty | Below Poverty |
| No Children | 3,213 (96.6%) | 113 (3.4%) |
| 1 or 2 Children | 1,837 (85.9%) | 302 (14.1%) |
| 3 or 4 Children | 426 (100.0%) | 0 (0.0%) |
| 5 or more Children | 0 (0.0%) | 18 (100.0%) |
| Total | 5,476 (92.7%) | 433 (7.3%) |
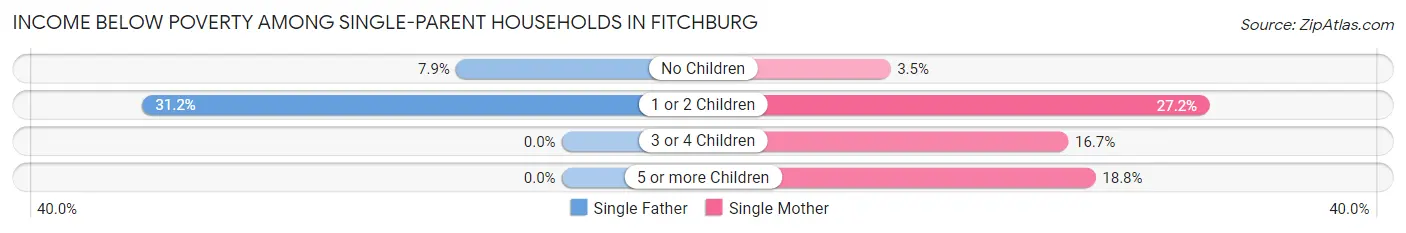
Income Below Poverty Among Single-Parent Households in Fitchburg
According to the poverty data in Fitchburg, 15.2% or 160 single-father households and 14.9% or 402 single-mother households are living below the poverty line. Among single-father households, those with 1 or 2 children have the highest poverty rate, with 118 households (31.2%) experiencing poverty. Likewise, among single-mother households, those with 1 or 2 children have the highest poverty rate, with 298 households (27.2%) falling below the poverty line.
| Children | Single Father | Single Mother |
| No Children | 42 (7.9%) | 43 (3.5%) |
| 1 or 2 Children | 118 (31.2%) | 298 (27.2%) |
| 3 or 4 Children | 0 (0.0%) | 52 (16.7%) |
| 5 or more Children | 0 (0.0%) | 9 (18.8%) |
| Total | 160 (15.2%) | 402 (14.9%) |
Income Below Poverty Among Married-Couple vs Single-Parent Households in Fitchburg
The poverty data for Fitchburg shows that 433 of the married-couple family households (7.3%) and 562 of the single-parent households (15.0%) are living below the poverty level. Within the married-couple family households, those with 5 or more children have the highest poverty rate, with 18 households (100.0%) falling below the poverty line. Among the single-parent households, those with 1 or 2 children have the highest poverty rate, with 416 household (28.2%) living below poverty.
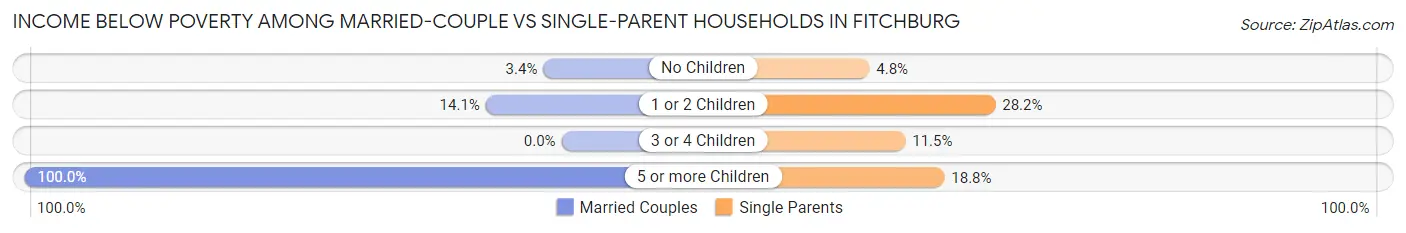
| Children | Married-Couple Families | Single-Parent Households |
| No Children | 113 (3.4%) | 85 (4.8%) |
| 1 or 2 Children | 302 (14.1%) | 416 (28.2%) |
| 3 or 4 Children | 0 (0.0%) | 52 (11.5%) |
| 5 or more Children | 18 (100.0%) | 9 (18.8%) |
| Total | 433 (7.3%) | 562 (15.0%) |
Race in Fitchburg
The most populous races in Fitchburg are White / Caucasian (28,698 | 69.0%), Hispanic or Latino (12,721 | 30.6%), and Two or more Races (6,338 | 15.2%).
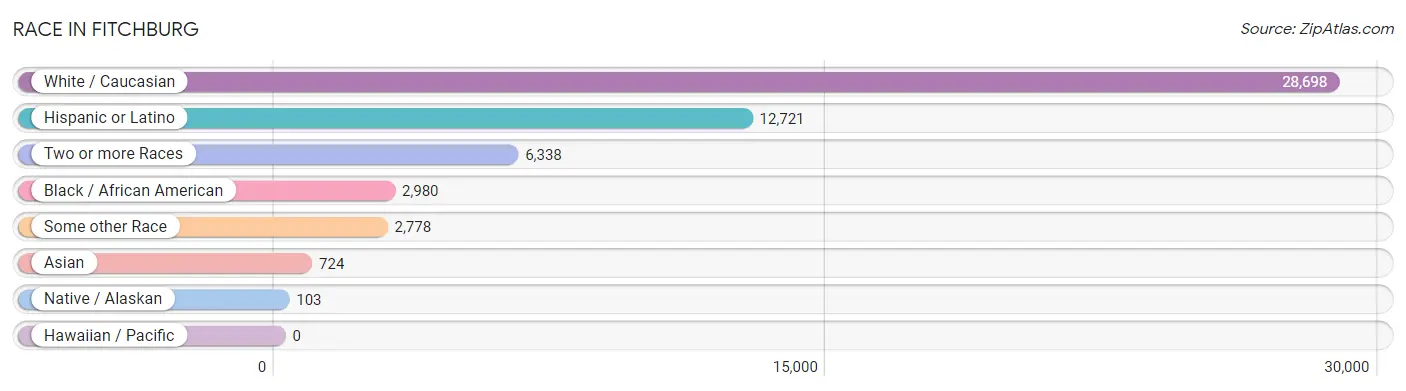
| Race | # Population | % Population |
| Asian | 724 | 1.7% |
| Black / African American | 2,980 | 7.2% |
| Hawaiian / Pacific | 0 | 0.0% |
| Hispanic or Latino | 12,721 | 30.6% |
| Native / Alaskan | 103 | 0.3% |
| White / Caucasian | 28,698 | 69.0% |
| Two or more Races | 6,338 | 15.2% |
| Some other Race | 2,778 | 6.7% |
| Total | 41,621 | 100.0% |
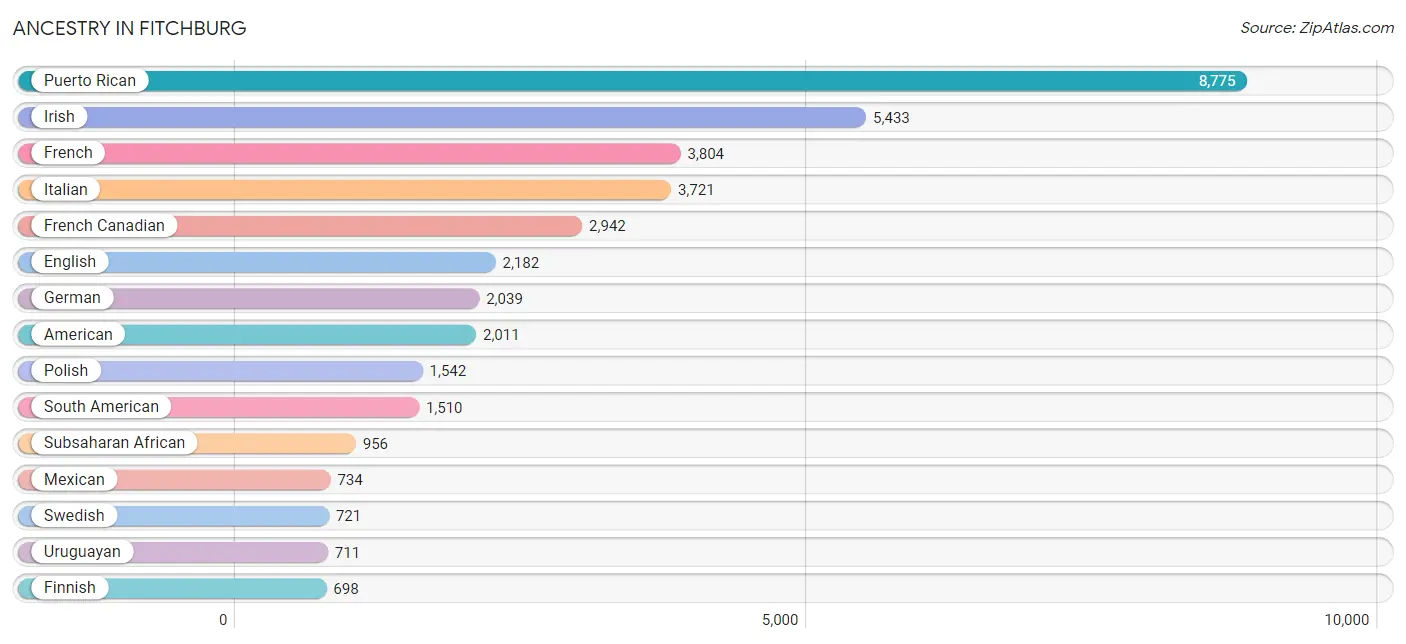
Ancestry in Fitchburg
The most populous ancestries reported in Fitchburg are Puerto Rican (8,775 | 21.1%), Irish (5,433 | 13.1%), French (3,804 | 9.1%), Italian (3,721 | 8.9%), and French Canadian (2,942 | 7.1%), together accounting for 59.3% of all Fitchburg residents.
| Ancestry | # Population | % Population |
| African | 548 | 1.3% |
| Albanian | 75 | 0.2% |
| American | 2,011 | 4.8% |
| Arab | 207 | 0.5% |
| Armenian | 65 | 0.2% |
| Australian | 7 | 0.0% |
| Austrian | 6 | 0.0% |
| Bangladeshi | 364 | 0.9% |
| Barbadian | 18 | 0.0% |
| Basque | 27 | 0.1% |
| Belgian | 8 | 0.0% |
| Bhutanese | 51 | 0.1% |
| Blackfeet | 17 | 0.0% |
| Bolivian | 7 | 0.0% |
| Brazilian | 200 | 0.5% |
| British | 89 | 0.2% |
| Bulgarian | 5 | 0.0% |
| Burmese | 41 | 0.1% |
| Canadian | 267 | 0.6% |
| Cape Verdean | 162 | 0.4% |
| Celtic | 326 | 0.8% |
| Central American | 265 | 0.6% |
| Central American Indian | 63 | 0.2% |
| Cherokee | 86 | 0.2% |
| Chilean | 54 | 0.1% |
| Chippewa | 12 | 0.0% |
| Choctaw | 7 | 0.0% |
| Colombian | 290 | 0.7% |
| Cuban | 174 | 0.4% |
| Czech | 49 | 0.1% |
| Danish | 13 | 0.0% |
| Dominican | 684 | 1.6% |
| Dutch | 195 | 0.5% |
| Eastern European | 23 | 0.1% |
| Ecuadorian | 325 | 0.8% |
| English | 2,182 | 5.2% |
| European | 343 | 0.8% |
| Finnish | 698 | 1.7% |
| French | 3,804 | 9.1% |
| French American Indian | 23 | 0.1% |
| French Canadian | 2,942 | 7.1% |
| German | 2,039 | 4.9% |
| Ghanaian | 10 | 0.0% |
| Greek | 355 | 0.9% |
| Guamanian / Chamorro | 3 | 0.0% |
| Guatemalan | 130 | 0.3% |
| Haitian | 195 | 0.5% |
| Honduran | 30 | 0.1% |
| Hungarian | 119 | 0.3% |
| Indian (Asian) | 48 | 0.1% |
| Iranian | 28 | 0.1% |
| Irish | 5,433 | 13.1% |
| Italian | 3,721 | 8.9% |
| Jamaican | 89 | 0.2% |
| Japanese | 52 | 0.1% |
| Kenyan | 70 | 0.2% |
| Korean | 160 | 0.4% |
| Latvian | 73 | 0.2% |
| Lebanese | 64 | 0.2% |
| Liberian | 1 | 0.0% |
| Lithuanian | 144 | 0.4% |
| Malaysian | 79 | 0.2% |
| Mexican | 734 | 1.8% |
| Moroccan | 99 | 0.2% |
| Native Hawaiian | 23 | 0.1% |
| Navajo | 10 | 0.0% |
| Nicaraguan | 14 | 0.0% |
| Nigerian | 119 | 0.3% |
| Northern European | 14 | 0.0% |
| Norwegian | 81 | 0.2% |
| Paiute | 8 | 0.0% |
| Peruvian | 10 | 0.0% |
| Polish | 1,542 | 3.7% |
| Portuguese | 410 | 1.0% |
| Pueblo | 8 | 0.0% |
| Puerto Rican | 8,775 | 21.1% |
| Russian | 78 | 0.2% |
| Salvadoran | 91 | 0.2% |
| Scandinavian | 24 | 0.1% |
| Scotch-Irish | 59 | 0.1% |
| Scottish | 397 | 0.9% |
| Slovak | 5 | 0.0% |
| South American | 1,510 | 3.6% |
| South American Indian | 10 | 0.0% |
| Spaniard | 36 | 0.1% |
| Spanish | 141 | 0.3% |
| Sri Lankan | 192 | 0.5% |
| Subsaharan African | 956 | 2.3% |
| Swedish | 721 | 1.7% |
| Swiss | 4 | 0.0% |
| Syrian | 14 | 0.0% |
| Thai | 130 | 0.3% |
| Ukrainian | 171 | 0.4% |
| Uruguayan | 711 | 1.7% |
| Venezuelan | 113 | 0.3% |
| Welsh | 60 | 0.1% |
| West Indian | 47 | 0.1% |
| Yugoslavian | 6 | 0.0% | View All 98 Rows |
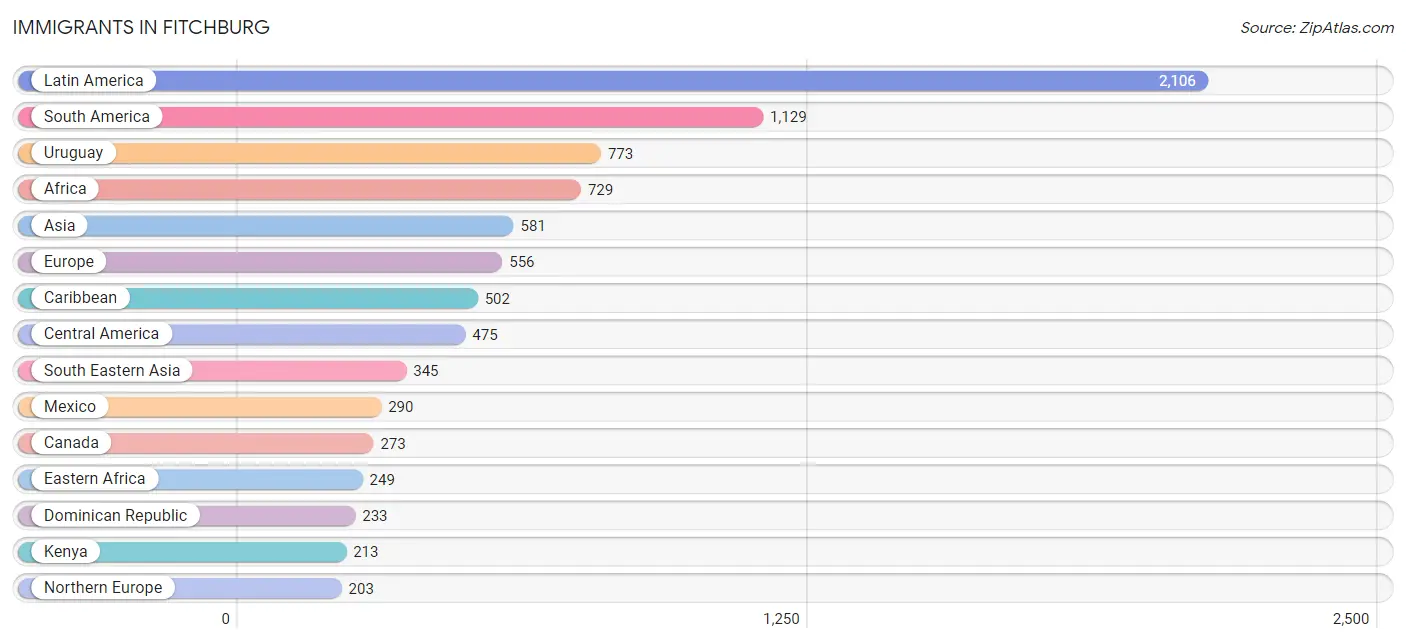
Immigrants in Fitchburg
The most numerous immigrant groups reported in Fitchburg came from Latin America (2,106 | 5.1%), South America (1,129 | 2.7%), Uruguay (773 | 1.9%), Africa (729 | 1.8%), and Asia (581 | 1.4%), together accounting for 12.8% of all Fitchburg residents.
| Immigration Origin | # Population | % Population |
| Africa | 729 | 1.8% |
| Albania | 31 | 0.1% |
| Argentina | 11 | 0.0% |
| Asia | 581 | 1.4% |
| Australia | 7 | 0.0% |
| Azores | 33 | 0.1% |
| Brazil | 111 | 0.3% |
| Bulgaria | 5 | 0.0% |
| Cabo Verde | 17 | 0.0% |
| Cambodia | 12 | 0.0% |
| Cameroon | 43 | 0.1% |
| Canada | 273 | 0.7% |
| Caribbean | 502 | 1.2% |
| Central America | 475 | 1.1% |
| Chile | 40 | 0.1% |
| China | 5 | 0.0% |
| Colombia | 97 | 0.2% |
| Cuba | 60 | 0.1% |
| Dominican Republic | 233 | 0.6% |
| Eastern Africa | 249 | 0.6% |
| Eastern Asia | 29 | 0.1% |
| Eastern Europe | 56 | 0.1% |
| Ecuador | 53 | 0.1% |
| El Salvador | 61 | 0.2% |
| Europe | 556 | 1.3% |
| France | 41 | 0.1% |
| Germany | 95 | 0.2% |
| Ghana | 31 | 0.1% |
| Greece | 18 | 0.0% |
| Guatemala | 111 | 0.3% |
| Guyana | 16 | 0.0% |
| Haiti | 120 | 0.3% |
| Honduras | 13 | 0.0% |
| India | 160 | 0.4% |
| Ireland | 167 | 0.4% |
| Italy | 38 | 0.1% |
| Jamaica | 89 | 0.2% |
| Japan | 8 | 0.0% |
| Kazakhstan | 4 | 0.0% |
| Kenya | 213 | 0.5% |
| Korea | 16 | 0.0% |
| Laos | 144 | 0.4% |
| Latin America | 2,106 | 5.1% |
| Lebanon | 8 | 0.0% |
| Liberia | 6 | 0.0% |
| Malaysia | 12 | 0.0% |
| Mexico | 290 | 0.7% |
| Middle Africa | 43 | 0.1% |
| Morocco | 54 | 0.1% |
| Netherlands | 16 | 0.0% |
| Nigeria | 29 | 0.1% |
| Northern Africa | 54 | 0.1% |
| Northern Europe | 203 | 0.5% |
| Oceania | 7 | 0.0% |
| Pakistan | 35 | 0.1% |
| Philippines | 95 | 0.2% |
| Poland | 13 | 0.0% |
| Portugal | 89 | 0.2% |
| Russia | 7 | 0.0% |
| South America | 1,129 | 2.7% |
| South Central Asia | 199 | 0.5% |
| South Eastern Asia | 345 | 0.8% |
| Southern Europe | 145 | 0.4% |
| Thailand | 9 | 0.0% |
| Uruguay | 773 | 1.9% |
| Venezuela | 28 | 0.1% |
| Vietnam | 73 | 0.2% |
| Western Africa | 83 | 0.2% |
| Western Asia | 8 | 0.0% |
| Western Europe | 152 | 0.4% | View All 70 Rows |
Sex and Age in Fitchburg
Sex and Age in Fitchburg
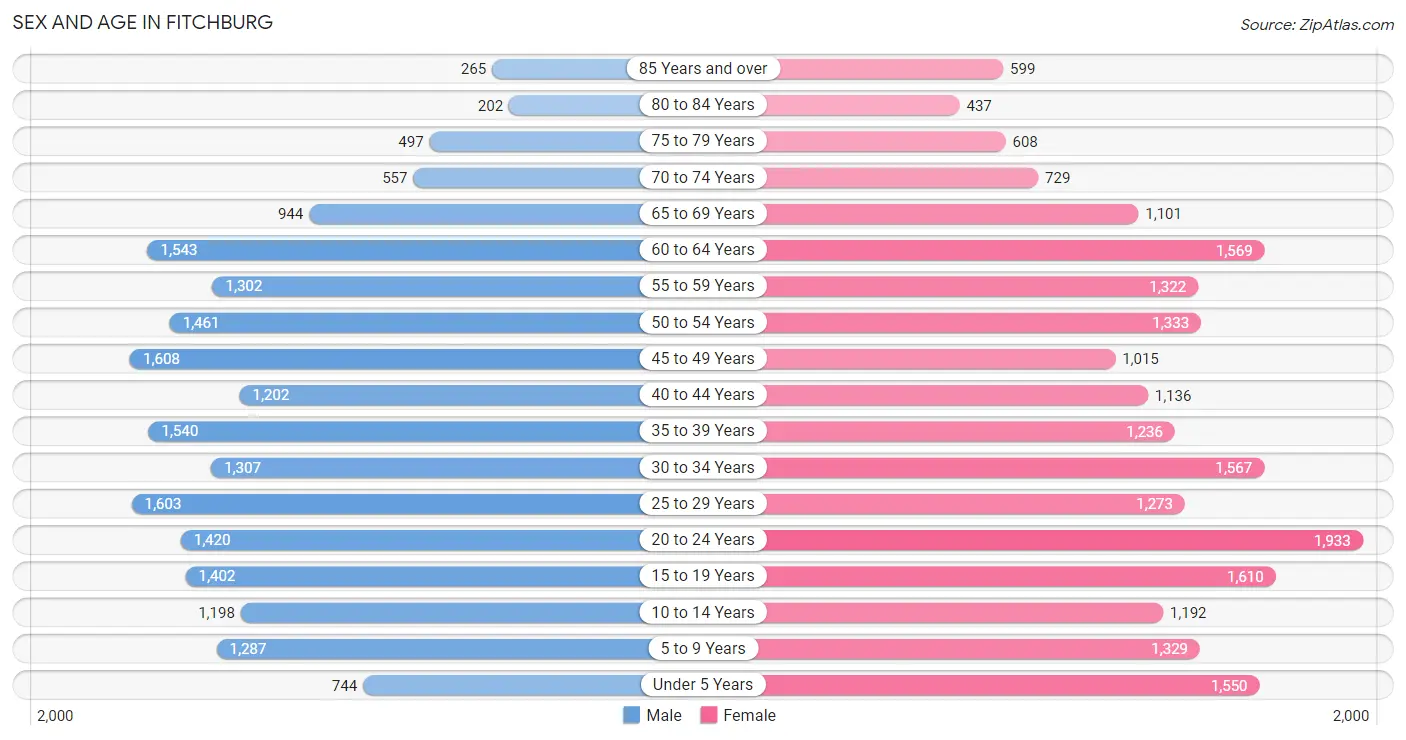
The most populous age groups in Fitchburg are 45 to 49 Years (1,608 | 8.0%) for men and 20 to 24 Years (1,933 | 9.0%) for women.
| Age Bracket | Male | Female |
| Under 5 Years | 744 (3.7%) | 1,550 (7.2%) |
| 5 to 9 Years | 1,287 (6.4%) | 1,329 (6.2%) |
| 10 to 14 Years | 1,198 (6.0%) | 1,192 (5.5%) |
| 15 to 19 Years | 1,402 (7.0%) | 1,610 (7.5%) |
| 20 to 24 Years | 1,420 (7.1%) | 1,933 (9.0%) |
| 25 to 29 Years | 1,603 (8.0%) | 1,273 (5.9%) |
| 30 to 34 Years | 1,307 (6.5%) | 1,567 (7.3%) |
| 35 to 39 Years | 1,540 (7.7%) | 1,236 (5.7%) |
| 40 to 44 Years | 1,202 (6.0%) | 1,136 (5.3%) |
| 45 to 49 Years | 1,608 (8.0%) | 1,015 (4.7%) |
| 50 to 54 Years | 1,461 (7.3%) | 1,333 (6.2%) |
| 55 to 59 Years | 1,302 (6.5%) | 1,322 (6.1%) |
| 60 to 64 Years | 1,543 (7.7%) | 1,569 (7.3%) |
| 65 to 69 Years | 944 (4.7%) | 1,101 (5.1%) |
| 70 to 74 Years | 557 (2.8%) | 729 (3.4%) |
| 75 to 79 Years | 497 (2.5%) | 608 (2.8%) |
| 80 to 84 Years | 202 (1.0%) | 437 (2.0%) |
| 85 Years and over | 265 (1.3%) | 599 (2.8%) |
| Total | 20,082 (100.0%) | 21,539 (100.0%) |
Families and Households in Fitchburg
Median Family Size in Fitchburg
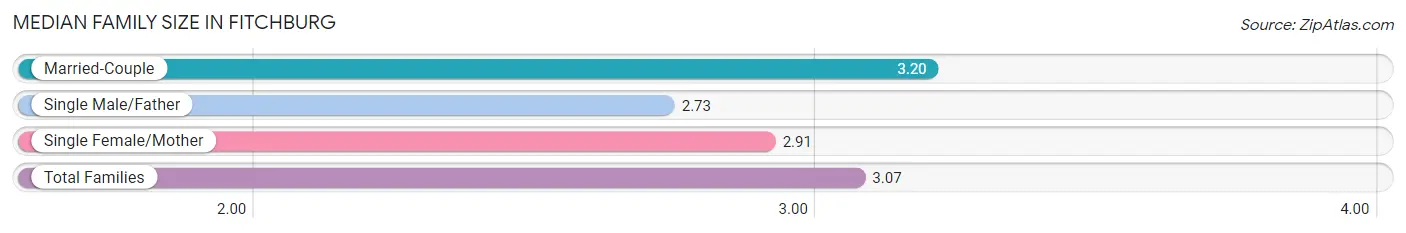
The median family size in Fitchburg is 3.07 persons per family, with married-couple families (5,909 | 61.2%) accounting for the largest median family size of 3.2 persons per family. On the other hand, single male/father families (1,053 | 10.9%) represent the smallest median family size with 2.73 persons per family.
| Family Type | # Families | Family Size |
| Married-Couple | 5,909 (61.2%) | 3.20 |
| Single Male/Father | 1,053 (10.9%) | 2.73 |
| Single Female/Mother | 2,694 (27.9%) | 2.91 |
| Total Families | 9,656 (100.0%) | 3.07 |
Median Household Size in Fitchburg
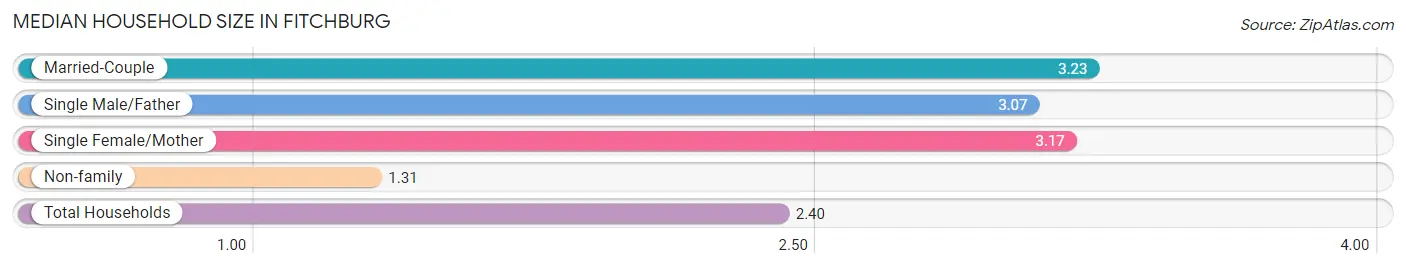
The median household size in Fitchburg is 2.40 persons per household, with married-couple households (5,909 | 35.5%) accounting for the largest median household size of 3.23 persons per household. non-family households (6,989 | 42.0%) represent the smallest median household size with 1.31 persons per household.
| Household Type | # Households | Household Size |
| Married-Couple | 5,909 (35.5%) | 3.23 |
| Single Male/Father | 1,053 (6.3%) | 3.07 |
| Single Female/Mother | 2,694 (16.2%) | 3.17 |
| Non-family | 6,989 (42.0%) | 1.31 |
| Total Households | 16,645 (100.0%) | 2.40 |
Household Size by Marriage Status in Fitchburg
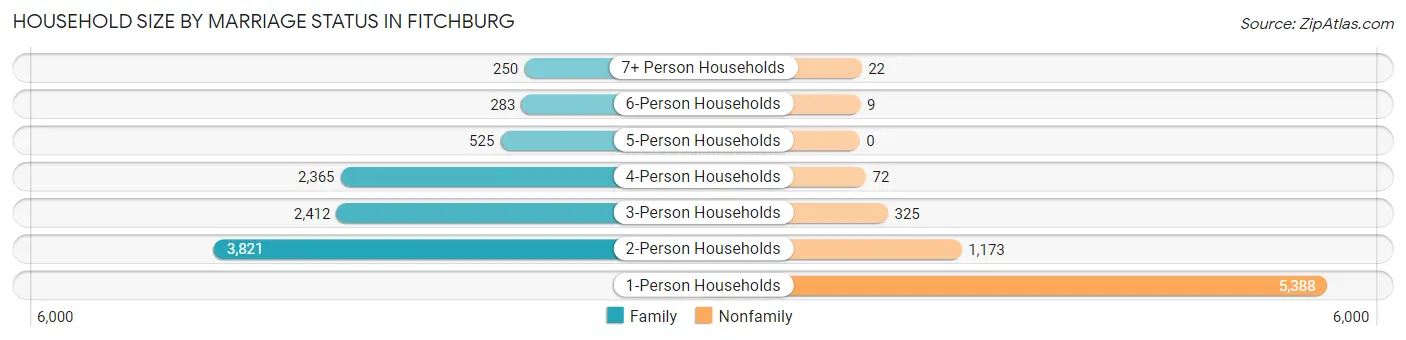
Out of a total of 16,645 households in Fitchburg, 9,656 (58.0%) are family households, while 6,989 (42.0%) are nonfamily households. The most numerous type of family households are 2-person households, comprising 3,821, and the most common type of nonfamily households are 1-person households, comprising 5,388.
| Household Size | Family Households | Nonfamily Households |
| 1-Person Households | - | 5,388 (32.4%) |
| 2-Person Households | 3,821 (23.0%) | 1,173 (7.0%) |
| 3-Person Households | 2,412 (14.5%) | 325 (1.9%) |
| 4-Person Households | 2,365 (14.2%) | 72 (0.4%) |
| 5-Person Households | 525 (3.2%) | 0 (0.0%) |
| 6-Person Households | 283 (1.7%) | 9 (0.1%) |
| 7+ Person Households | 250 (1.5%) | 22 (0.1%) |
| Total | 9,656 (58.0%) | 6,989 (42.0%) |
Female Fertility in Fitchburg
Fertility by Age in Fitchburg
Average fertility rate in Fitchburg is 57.0 births per 1,000 women. Women in the age bracket of 20 to 34 years have the highest fertility rate with 110.0 births per 1,000 women. Women in the age bracket of 20 to 34 years acount for 93.7% of all women with births.
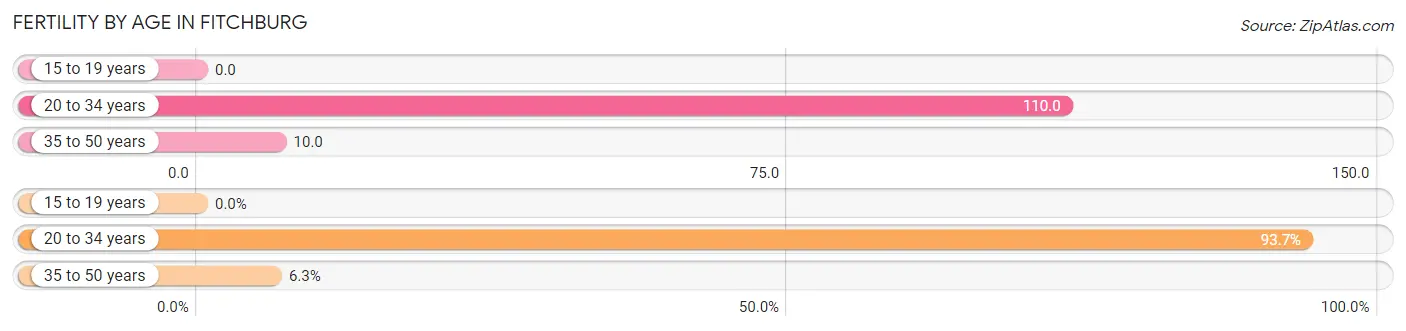
| Age Bracket | Women with Births | Births / 1,000 Women |
| 15 to 19 years | 0 (0.0%) | 0.0 |
| 20 to 34 years | 523 (93.7%) | 110.0 |
| 35 to 50 years | 35 (6.3%) | 10.0 |
| Total | 558 (100.0%) | 57.0 |
Fertility by Age by Marriage Status in Fitchburg
31.0% of women with births (558) in Fitchburg are married. The highest percentage of unmarried women with births falls into 20 to 34 years age bracket with 69.8% of them unmarried at the time of birth, while the lowest percentage of unmarried women with births belong to 35 to 50 years age bracket with 57.1% of them unmarried.
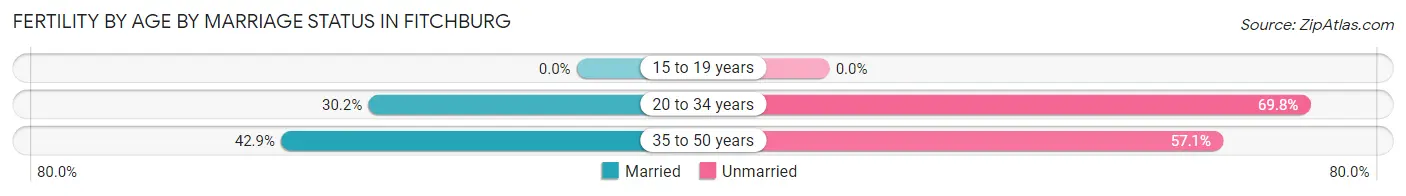
| Age Bracket | Married | Unmarried |
| 15 to 19 years | 0 (0.0%) | 0 (0.0%) |
| 20 to 34 years | 158 (30.2%) | 365 (69.8%) |
| 35 to 50 years | 15 (42.9%) | 20 (57.1%) |
| Total | 173 (31.0%) | 385 (69.0%) |
Fertility by Education in Fitchburg
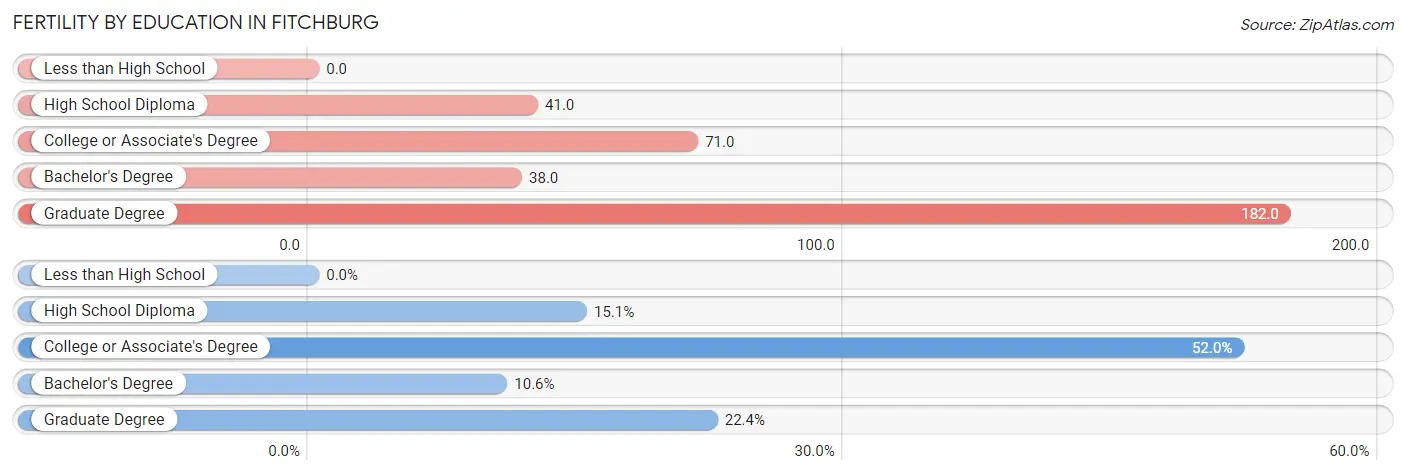
| Educational Attainment | Women with Births | Births / 1,000 Women |
| Less than High School | 0 (0.0%) | 0.0 |
| High School Diploma | 84 (15.0%) | 41.0 |
| College or Associate's Degree | 290 (52.0%) | 71.0 |
| Bachelor's Degree | 59 (10.6%) | 38.0 |
| Graduate Degree | 125 (22.4%) | 182.0 |
| Total | 558 (100.0%) | 57.0 |
Fertility by Education by Marriage Status in Fitchburg
69.0% of women with births in Fitchburg are unmarried. Women with the educational attainment of graduate degree are most likely to be married with 92.0% of them married at childbirth, while women with the educational attainment of college or associate's degree are least likely to be married with 100.0% of them unmarried at childbirth.
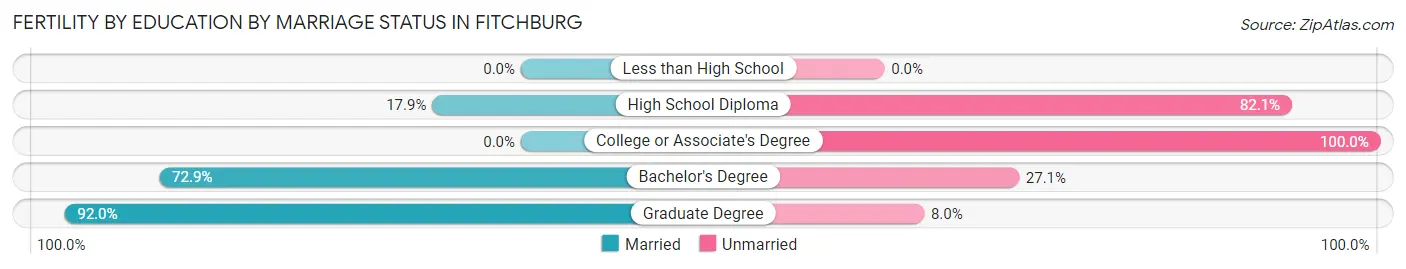
| Educational Attainment | Married | Unmarried |
| Less than High School | 0 (0.0%) | 0 (0.0%) |
| High School Diploma | 15 (17.9%) | 69 (82.1%) |
| College or Associate's Degree | 0 (0.0%) | 290 (100.0%) |
| Bachelor's Degree | 43 (72.9%) | 16 (27.1%) |
| Graduate Degree | 115 (92.0%) | 10 (8.0%) |
| Total | 173 (31.0%) | 385 (69.0%) |
Employment Characteristics in Fitchburg
Employment by Class of Employer in Fitchburg
Among the 20,540 employed individuals in Fitchburg, private company employees (14,394 | 70.1%), not-for-profit organizations (2,121 | 10.3%), and local government employees (1,226 | 6.0%) make up the most common classes of employment.
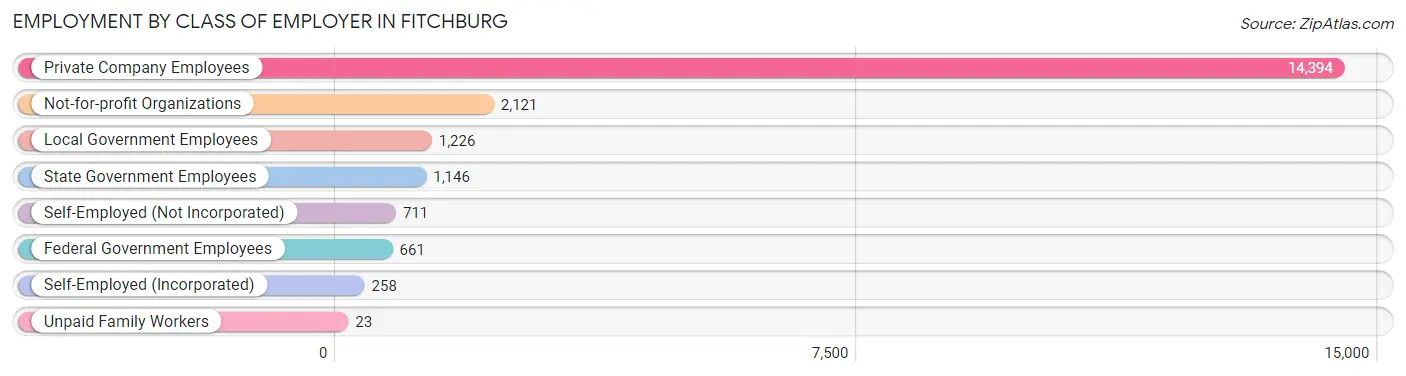
| Employer Class | # Employees | % Employees |
| Private Company Employees | 14,394 | 70.1% |
| Self-Employed (Incorporated) | 258 | 1.3% |
| Self-Employed (Not Incorporated) | 711 | 3.5% |
| Not-for-profit Organizations | 2,121 | 10.3% |
| Local Government Employees | 1,226 | 6.0% |
| State Government Employees | 1,146 | 5.6% |
| Federal Government Employees | 661 | 3.2% |
| Unpaid Family Workers | 23 | 0.1% |
| Total | 20,540 | 100.0% |
Employment Status by Age in Fitchburg
According to the labor force statistics for Fitchburg, out of the total population over 16 years of age (33,975), 66.3% or 22,525 individuals are in the labor force, with 7.7% or 1,734 of them unemployed. The age group with the highest labor force participation rate is 30 to 34 years, with 88.5% or 2,543 individuals in the labor force. Within the labor force, the 16 to 19 years age range has the highest percentage of unemployed individuals, with 14.2% or 200 of them being unemployed.
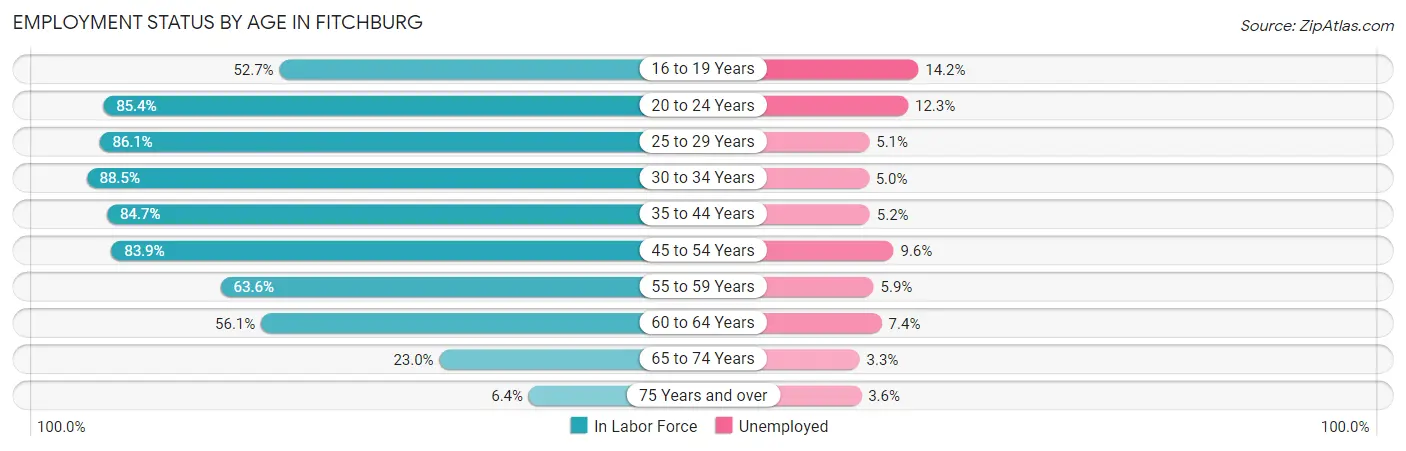
| Age Bracket | In Labor Force | Unemployed |
| 16 to 19 Years | 1,405 (52.7%) | 200 (14.2%) |
| 20 to 24 Years | 2,863 (85.4%) | 352 (12.3%) |
| 25 to 29 Years | 2,476 (86.1%) | 126 (5.1%) |
| 30 to 34 Years | 2,543 (88.5%) | 127 (5.0%) |
| 35 to 44 Years | 4,332 (84.7%) | 225 (5.2%) |
| 45 to 54 Years | 4,545 (83.9%) | 436 (9.6%) |
| 55 to 59 Years | 1,669 (63.6%) | 98 (5.9%) |
| 60 to 64 Years | 1,746 (56.1%) | 129 (7.4%) |
| 65 to 74 Years | 766 (23.0%) | 25 (3.3%) |
| 75 Years and over | 167 (6.4%) | 6 (3.6%) |
| Total | 22,525 (66.3%) | 1,734 (7.7%) |
Employment Status by Educational Attainment in Fitchburg
According to labor force statistics for Fitchburg, 78.6% of individuals (17,305) out of the total population between 25 and 64 years of age (22,017) are in the labor force, with 6.6% or 1,142 of them being unemployed. The group with the highest labor force participation rate are those with the educational attainment of bachelor's degree or higher, with 88.7% or 5,036 individuals in the labor force. Within the labor force, individuals with high school diploma education have the highest percentage of unemployment, with 10.3% or 471 of them being unemployed.
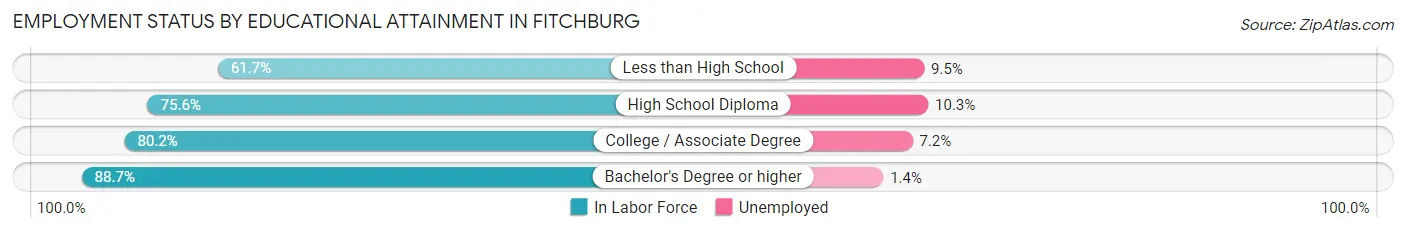
| Educational Attainment | In Labor Force | Unemployed |
| Less than High School | 1,846 (61.7%) | 284 (9.5%) |
| High School Diploma | 4,576 (75.6%) | 623 (10.3%) |
| College / Associate Degree | 5,850 (80.2%) | 525 (7.2%) |
| Bachelor's Degree or higher | 5,036 (88.7%) | 79 (1.4%) |
| Total | 17,305 (78.6%) | 1,453 (6.6%) |
Employment Occupations by Sex in Fitchburg
Management, Business, Science and Arts Occupations
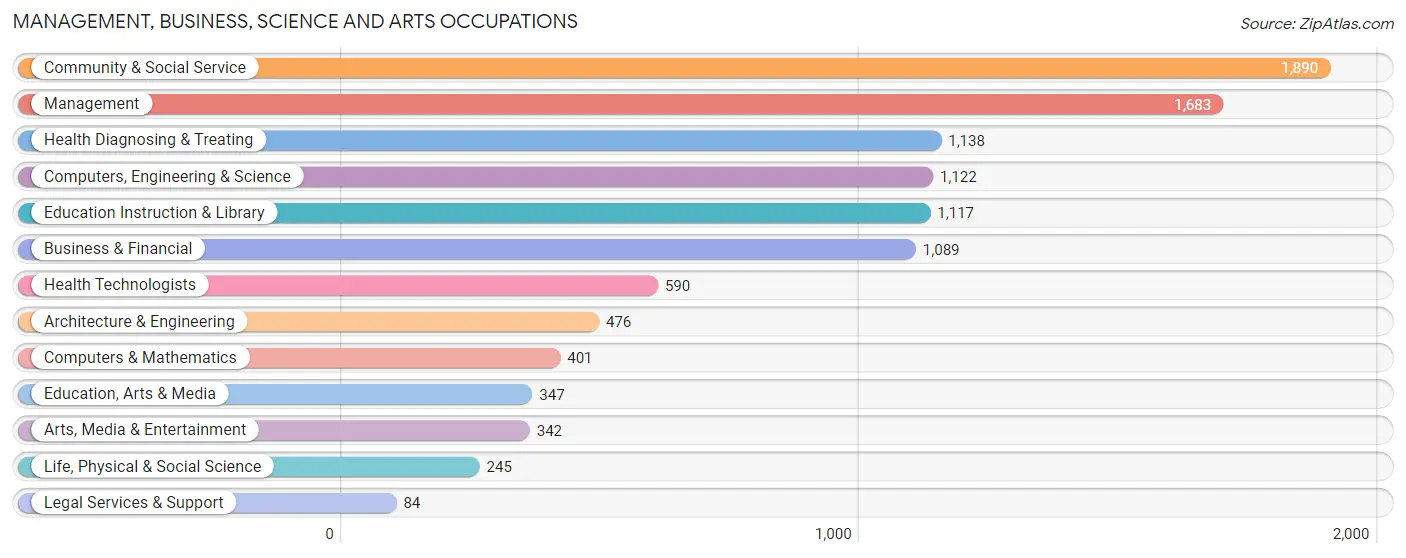
The most common Management, Business, Science and Arts occupations in Fitchburg are Community & Social Service (1,890 | 9.1%), Management (1,683 | 8.1%), Health Diagnosing & Treating (1,138 | 5.5%), Computers, Engineering & Science (1,122 | 5.4%), and Education Instruction & Library (1,117 | 5.4%).
Management, Business, Science and Arts Occupations by Sex
Within the Management, Business, Science and Arts occupations in Fitchburg, the most male-oriented occupations are Legal Services & Support (100.0%), Architecture & Engineering (94.3%), and Computers, Engineering & Science (77.4%), while the most female-oriented occupations are Health Technologists (89.5%), Health Diagnosing & Treating (84.2%), and Education Instruction & Library (76.4%).
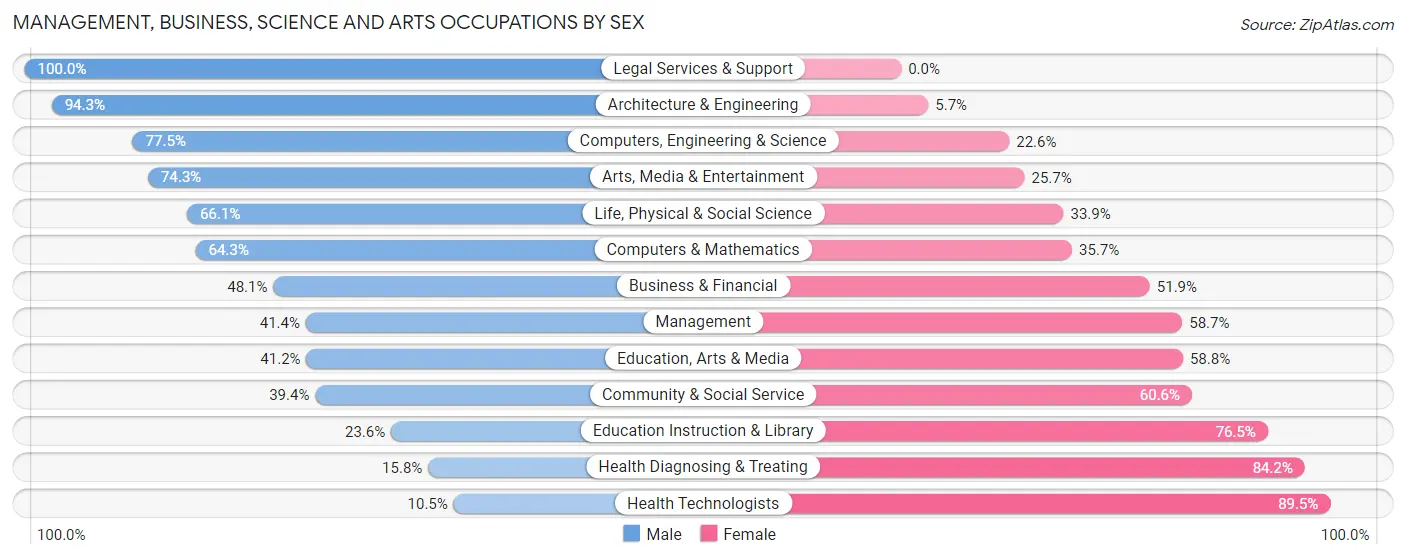
| Occupation | Male | Female |
| Management | 696 (41.3%) | 987 (58.7%) |
| Business & Financial | 524 (48.1%) | 565 (51.9%) |
| Computers, Engineering & Science | 869 (77.4%) | 253 (22.6%) |
| Computers & Mathematics | 258 (64.3%) | 143 (35.7%) |
| Architecture & Engineering | 449 (94.3%) | 27 (5.7%) |
| Life, Physical & Social Science | 162 (66.1%) | 83 (33.9%) |
| Community & Social Service | 744 (39.4%) | 1,146 (60.6%) |
| Education, Arts & Media | 143 (41.2%) | 204 (58.8%) |
| Legal Services & Support | 84 (100.0%) | 0 (0.0%) |
| Education Instruction & Library | 263 (23.5%) | 854 (76.4%) |
| Arts, Media & Entertainment | 254 (74.3%) | 88 (25.7%) |
| Health Diagnosing & Treating | 180 (15.8%) | 958 (84.2%) |
| Health Technologists | 62 (10.5%) | 528 (89.5%) |
| Total (Category) | 3,013 (43.5%) | 3,909 (56.5%) |
| Total (Overall) | 10,652 (51.3%) | 10,093 (48.6%) |
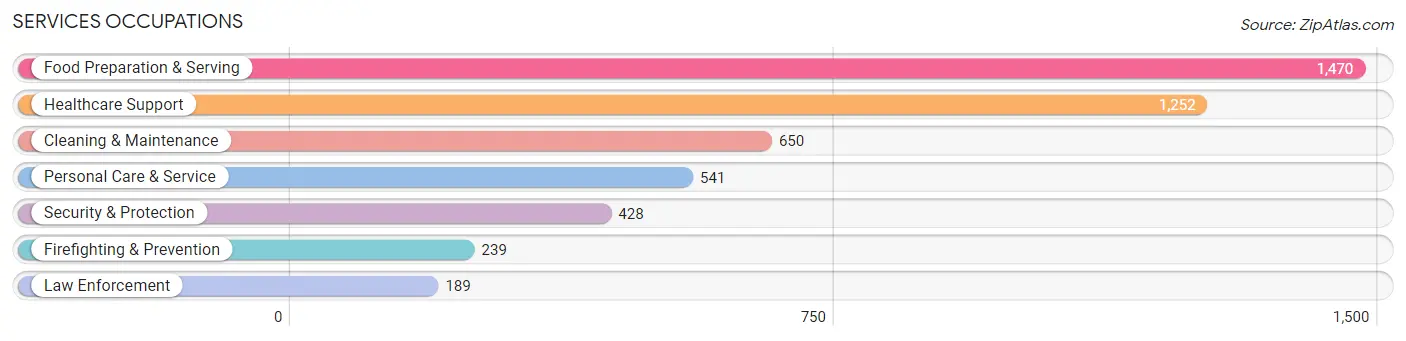
Services Occupations
The most common Services occupations in Fitchburg are Food Preparation & Serving (1,470 | 7.1%), Healthcare Support (1,252 | 6.0%), Cleaning & Maintenance (650 | 3.1%), Personal Care & Service (541 | 2.6%), and Security & Protection (428 | 2.1%).
Services Occupations by Sex
Within the Services occupations in Fitchburg, the most male-oriented occupations are Law Enforcement (94.7%), Security & Protection (89.9%), and Firefighting & Prevention (86.2%), while the most female-oriented occupations are Healthcare Support (68.7%), Personal Care & Service (63.4%), and Food Preparation & Serving (50.5%).
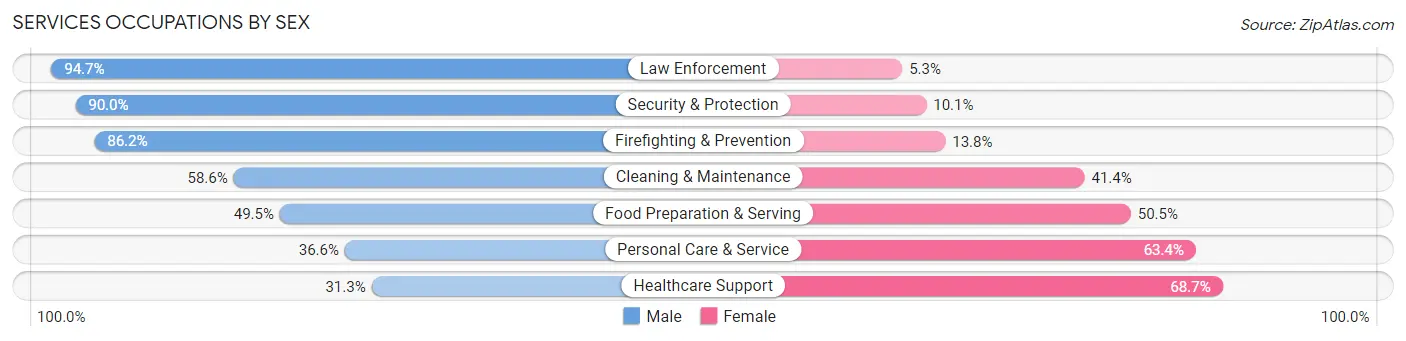
| Occupation | Male | Female |
| Healthcare Support | 392 (31.3%) | 860 (68.7%) |
| Security & Protection | 385 (89.9%) | 43 (10.1%) |
| Firefighting & Prevention | 206 (86.2%) | 33 (13.8%) |
| Law Enforcement | 179 (94.7%) | 10 (5.3%) |
| Food Preparation & Serving | 727 (49.5%) | 743 (50.5%) |
| Cleaning & Maintenance | 381 (58.6%) | 269 (41.4%) |
| Personal Care & Service | 198 (36.6%) | 343 (63.4%) |
| Total (Category) | 2,083 (48.0%) | 2,258 (52.0%) |
| Total (Overall) | 10,652 (51.3%) | 10,093 (48.6%) |
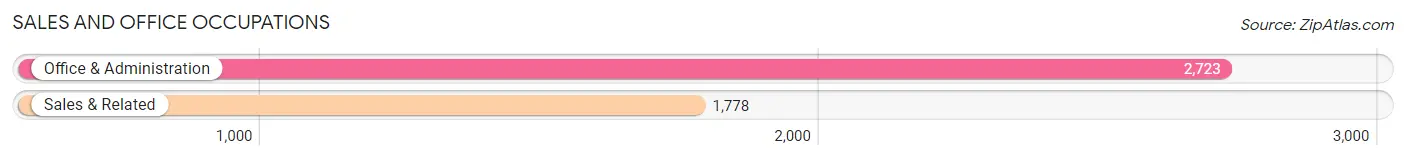
Sales and Office Occupations
The most common Sales and Office occupations in Fitchburg are Office & Administration (2,723 | 13.1%), and Sales & Related (1,778 | 8.6%).
Sales and Office Occupations by Sex
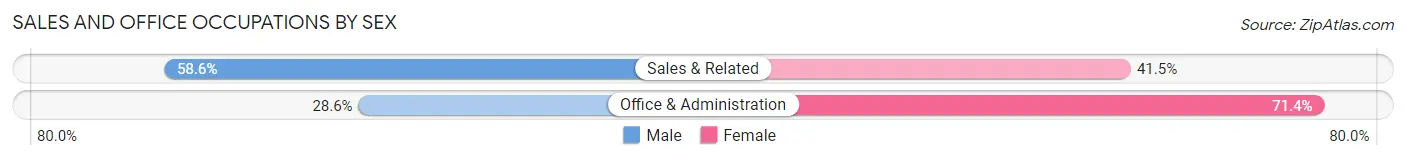
| Occupation | Male | Female |
| Sales & Related | 1,041 (58.6%) | 737 (41.4%) |
| Office & Administration | 780 (28.6%) | 1,943 (71.4%) |
| Total (Category) | 1,821 (40.5%) | 2,680 (59.5%) |
| Total (Overall) | 10,652 (51.3%) | 10,093 (48.6%) |
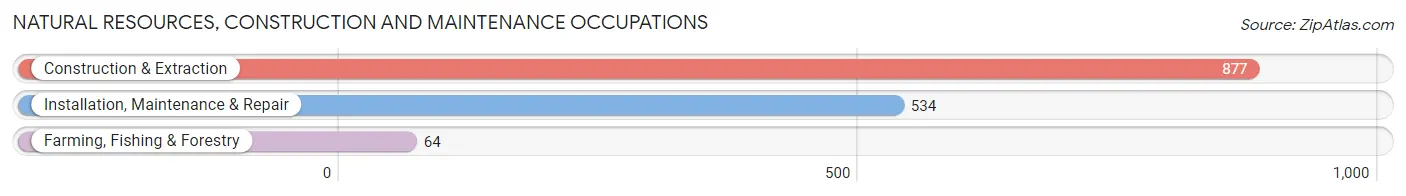
Natural Resources, Construction and Maintenance Occupations
The most common Natural Resources, Construction and Maintenance occupations in Fitchburg are Construction & Extraction (877 | 4.2%), Installation, Maintenance & Repair (534 | 2.6%), and Farming, Fishing & Forestry (64 | 0.3%).
Natural Resources, Construction and Maintenance Occupations by Sex
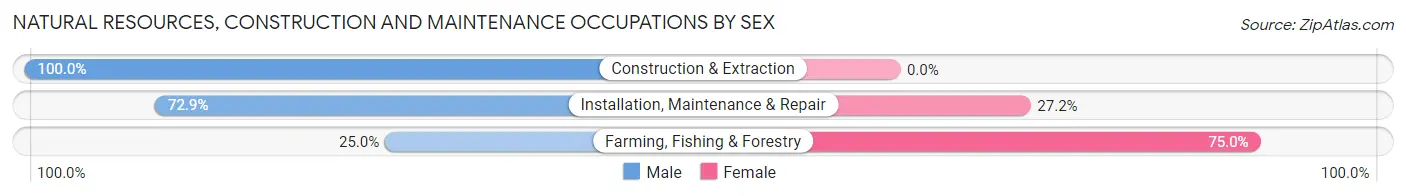
| Occupation | Male | Female |
| Farming, Fishing & Forestry | 16 (25.0%) | 48 (75.0%) |
| Construction & Extraction | 877 (100.0%) | 0 (0.0%) |
| Installation, Maintenance & Repair | 389 (72.9%) | 145 (27.2%) |
| Total (Category) | 1,282 (86.9%) | 193 (13.1%) |
| Total (Overall) | 10,652 (51.3%) | 10,093 (48.6%) |
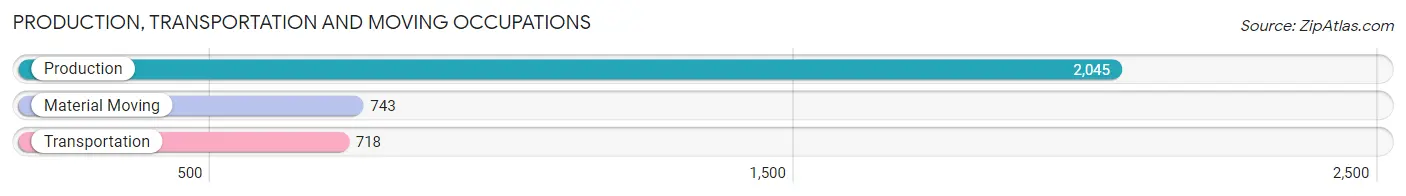
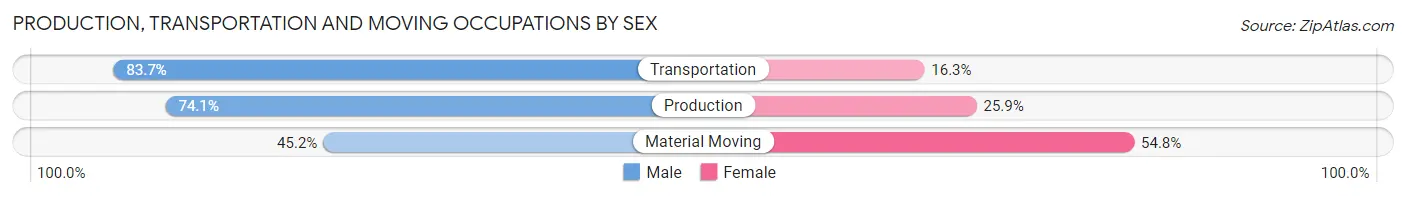
Production, Transportation and Moving Occupations
The most common Production, Transportation and Moving occupations in Fitchburg are Production (2,045 | 9.9%), Material Moving (743 | 3.6%), and Transportation (718 | 3.5%).
Production, Transportation and Moving Occupations by Sex
| Occupation | Male | Female |
| Production | 1,516 (74.1%) | 529 (25.9%) |
| Transportation | 601 (83.7%) | 117 (16.3%) |
| Material Moving | 336 (45.2%) | 407 (54.8%) |
| Total (Category) | 2,453 (70.0%) | 1,053 (30.0%) |
| Total (Overall) | 10,652 (51.3%) | 10,093 (48.6%) |
Employment Industries by Sex in Fitchburg
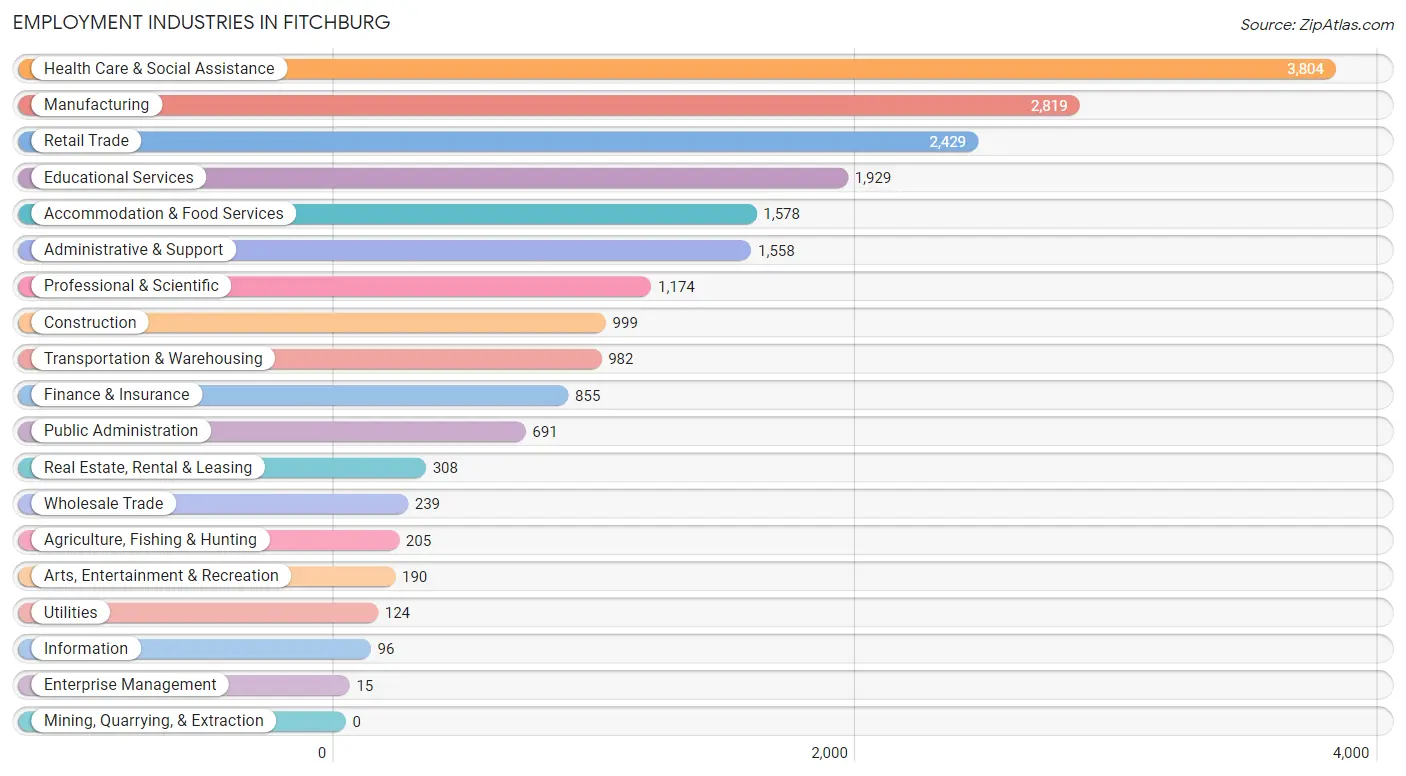
Employment Industries in Fitchburg
The major employment industries in Fitchburg include Health Care & Social Assistance (3,804 | 18.3%), Manufacturing (2,819 | 13.6%), Retail Trade (2,429 | 11.7%), Educational Services (1,929 | 9.3%), and Accommodation & Food Services (1,578 | 7.6%).
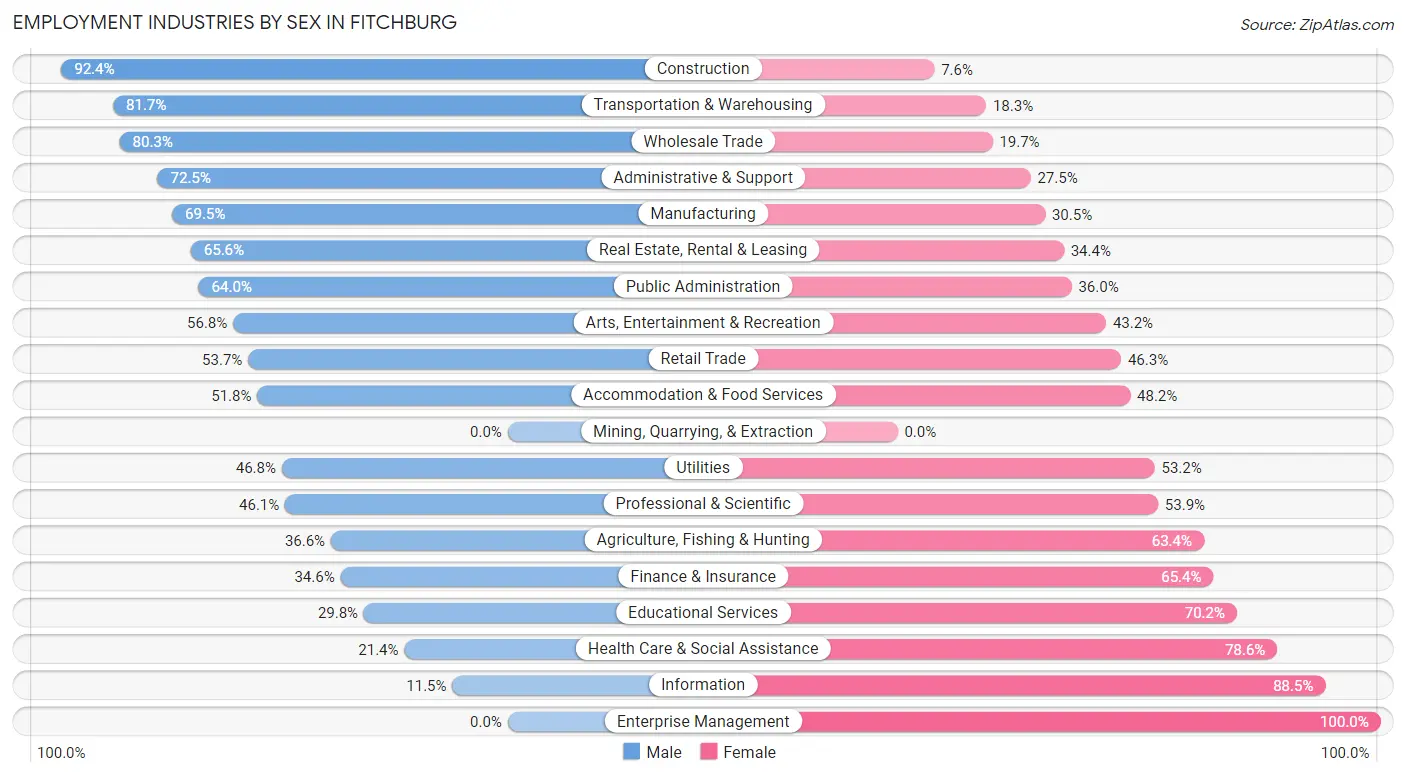
Employment Industries by Sex in Fitchburg
The Fitchburg industries that see more men than women are Construction (92.4%), Transportation & Warehousing (81.7%), and Wholesale Trade (80.3%), whereas the industries that tend to have a higher number of women are Enterprise Management (100.0%), Information (88.5%), and Health Care & Social Assistance (78.6%).
| Industry | Male | Female |
| Agriculture, Fishing & Hunting | 75 (36.6%) | 130 (63.4%) |
| Mining, Quarrying, & Extraction | 0 (0.0%) | 0 (0.0%) |
| Construction | 923 (92.4%) | 76 (7.6%) |
| Manufacturing | 1,958 (69.5%) | 861 (30.5%) |
| Wholesale Trade | 192 (80.3%) | 47 (19.7%) |
| Retail Trade | 1,305 (53.7%) | 1,124 (46.3%) |
| Transportation & Warehousing | 802 (81.7%) | 180 (18.3%) |
| Utilities | 58 (46.8%) | 66 (53.2%) |
| Information | 11 (11.5%) | 85 (88.5%) |
| Finance & Insurance | 296 (34.6%) | 559 (65.4%) |
| Real Estate, Rental & Leasing | 202 (65.6%) | 106 (34.4%) |
| Professional & Scientific | 541 (46.1%) | 633 (53.9%) |
| Enterprise Management | 0 (0.0%) | 15 (100.0%) |
| Administrative & Support | 1,129 (72.5%) | 429 (27.5%) |
| Educational Services | 574 (29.8%) | 1,355 (70.2%) |
| Health Care & Social Assistance | 814 (21.4%) | 2,990 (78.6%) |
| Arts, Entertainment & Recreation | 108 (56.8%) | 82 (43.2%) |
| Accommodation & Food Services | 818 (51.8%) | 760 (48.2%) |
| Public Administration | 442 (64.0%) | 249 (36.0%) |
| Total | 10,652 (51.3%) | 10,093 (48.6%) |
Education in Fitchburg
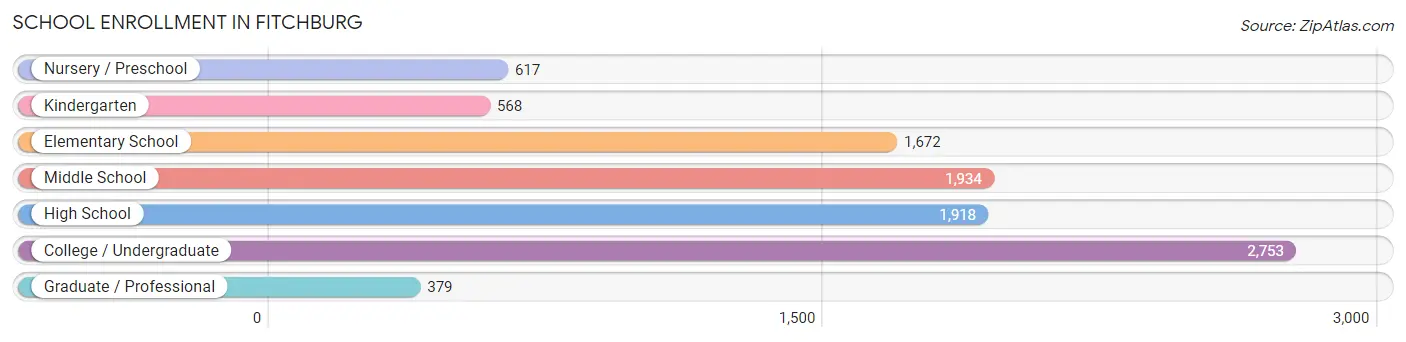
School Enrollment in Fitchburg
The most common levels of schooling among the 9,841 students in Fitchburg are college / undergraduate (2,753 | 28.0%), middle school (1,934 | 19.7%), and high school (1,918 | 19.5%).
| School Level | # Students | % Students |
| Nursery / Preschool | 617 | 6.3% |
| Kindergarten | 568 | 5.8% |
| Elementary School | 1,672 | 17.0% |
| Middle School | 1,934 | 19.7% |
| High School | 1,918 | 19.5% |
| College / Undergraduate | 2,753 | 28.0% |
| Graduate / Professional | 379 | 3.8% |
| Total | 9,841 | 100.0% |
School Enrollment by Age by Funding Source in Fitchburg
Out of a total of 9,841 students who are enrolled in schools in Fitchburg, 1,840 (18.7%) attend a private institution, while the remaining 8,001 (81.3%) are enrolled in public schools. The age group of 25 to 34 year olds has the highest likelihood of being enrolled in private schools, with 223 (54.4% in the age bracket) enrolled. Conversely, the age group of 5 to 9 year old has the lowest likelihood of being enrolled in a private school, with 2,071 (91.0% in the age bracket) attending a public institution.
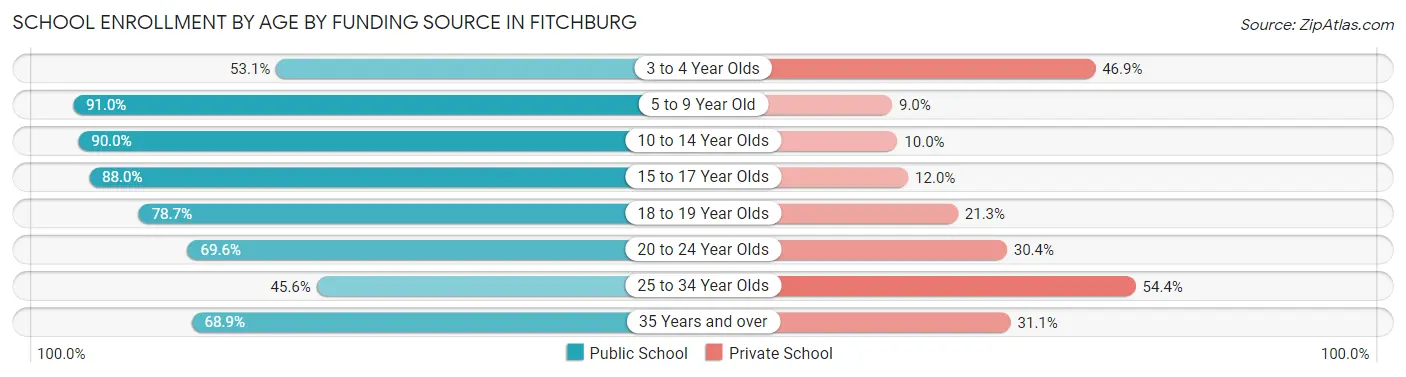
| Age Bracket | Public School | Private School |
| 3 to 4 Year Olds | 237 (53.1%) | 209 (46.9%) |
| 5 to 9 Year Old | 2,071 (91.0%) | 205 (9.0%) |
| 10 to 14 Year Olds | 2,131 (90.0%) | 237 (10.0%) |
| 15 to 17 Year Olds | 1,040 (88.0%) | 142 (12.0%) |
| 18 to 19 Year Olds | 1,207 (78.7%) | 326 (21.3%) |
| 20 to 24 Year Olds | 738 (69.6%) | 322 (30.4%) |
| 25 to 34 Year Olds | 187 (45.6%) | 223 (54.4%) |
| 35 Years and over | 390 (68.9%) | 176 (31.1%) |
| Total | 8,001 (81.3%) | 1,840 (18.7%) |
Educational Attainment by Field of Study in Fitchburg
Business (1,285 | 18.5%), education (869 | 12.5%), arts & humanities (638 | 9.2%), literature & languages (584 | 8.4%), and social sciences (539 | 7.8%) are the most common fields of study among 6,939 individuals in Fitchburg who have obtained a bachelor's degree or higher.
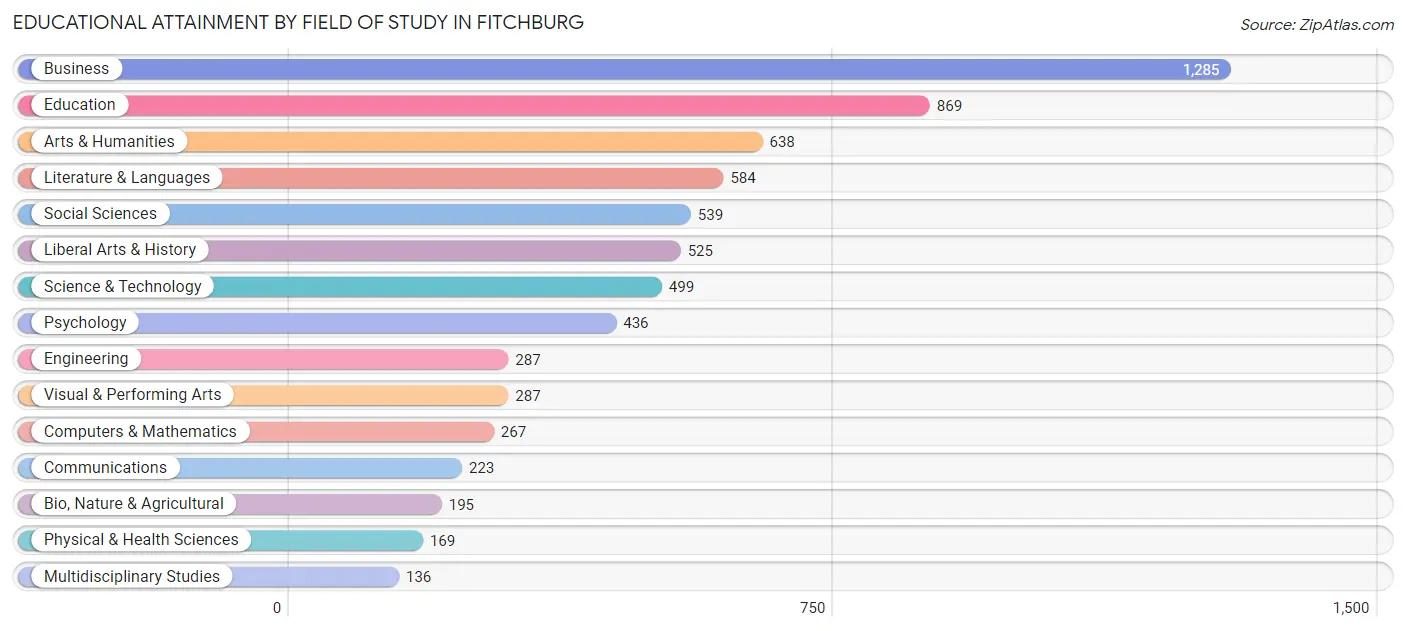
| Field of Study | # Graduates | % Graduates |
| Computers & Mathematics | 267 | 3.8% |
| Bio, Nature & Agricultural | 195 | 2.8% |
| Physical & Health Sciences | 169 | 2.4% |
| Psychology | 436 | 6.3% |
| Social Sciences | 539 | 7.8% |
| Engineering | 287 | 4.1% |
| Multidisciplinary Studies | 136 | 2.0% |
| Science & Technology | 499 | 7.2% |
| Business | 1,285 | 18.5% |
| Education | 869 | 12.5% |
| Literature & Languages | 584 | 8.4% |
| Liberal Arts & History | 525 | 7.6% |
| Visual & Performing Arts | 287 | 4.1% |
| Communications | 223 | 3.2% |
| Arts & Humanities | 638 | 9.2% |
| Total | 6,939 | 100.0% |
Transportation & Commute in Fitchburg
Vehicle Availability by Sex in Fitchburg
The most prevalent vehicle ownership categories in Fitchburg are males with 2 vehicles (4,804, accounting for 46.3%) and females with 2 vehicles (4,218, making up 49.5%).
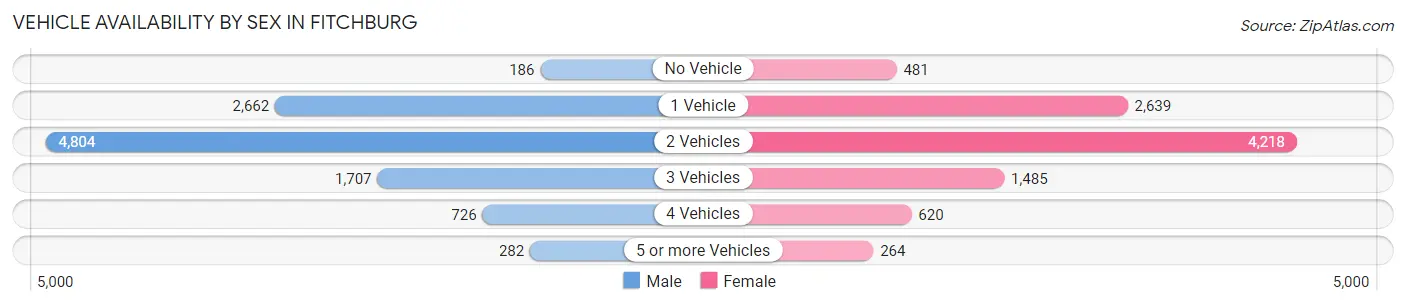
| Vehicles Available | Male | Female |
| No Vehicle | 186 (1.8%) | 481 (5.0%) |
| 1 Vehicle | 2,662 (25.7%) | 2,639 (27.2%) |
| 2 Vehicles | 4,804 (46.3%) | 4,218 (43.4%) |
| 3 Vehicles | 1,707 (16.5%) | 1,485 (15.3%) |
| 4 Vehicles | 726 (7.0%) | 620 (6.4%) |
| 5 or more Vehicles | 282 (2.7%) | 264 (2.7%) |
| Total | 10,367 (100.0%) | 9,707 (100.0%) |
Commute Time in Fitchburg
The most frequently occuring commute durations in Fitchburg are 15 to 19 minutes (3,031 commuters, 16.2%), 10 to 14 minutes (2,935 commuters, 15.7%), and 5 to 9 minutes (2,567 commuters, 13.7%).
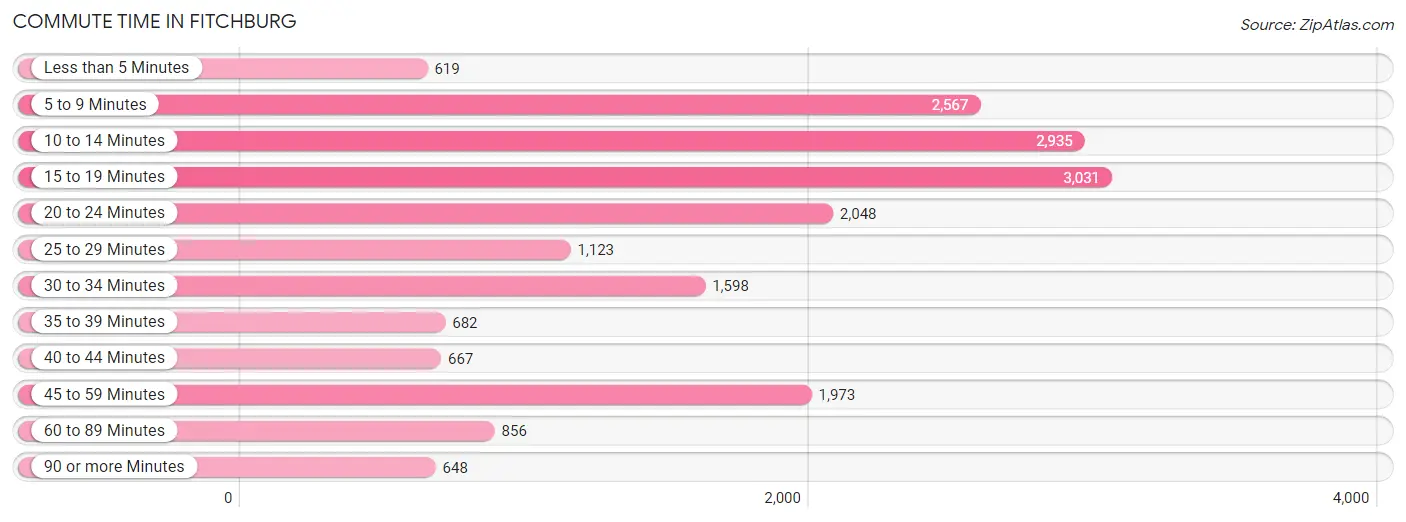
| Commute Time | # Commuters | % Commuters |
| Less than 5 Minutes | 619 | 3.3% |
| 5 to 9 Minutes | 2,567 | 13.7% |
| 10 to 14 Minutes | 2,935 | 15.7% |
| 15 to 19 Minutes | 3,031 | 16.2% |
| 20 to 24 Minutes | 2,048 | 10.9% |
| 25 to 29 Minutes | 1,123 | 6.0% |
| 30 to 34 Minutes | 1,598 | 8.5% |
| 35 to 39 Minutes | 682 | 3.6% |
| 40 to 44 Minutes | 667 | 3.6% |
| 45 to 59 Minutes | 1,973 | 10.5% |
| 60 to 89 Minutes | 856 | 4.6% |
| 90 or more Minutes | 648 | 3.5% |
Commute Time by Sex in Fitchburg
The most common commute times in Fitchburg are 10 to 14 minutes (1,492 commuters, 15.4%) for males and 15 to 19 minutes (1,607 commuters, 17.8%) for females.
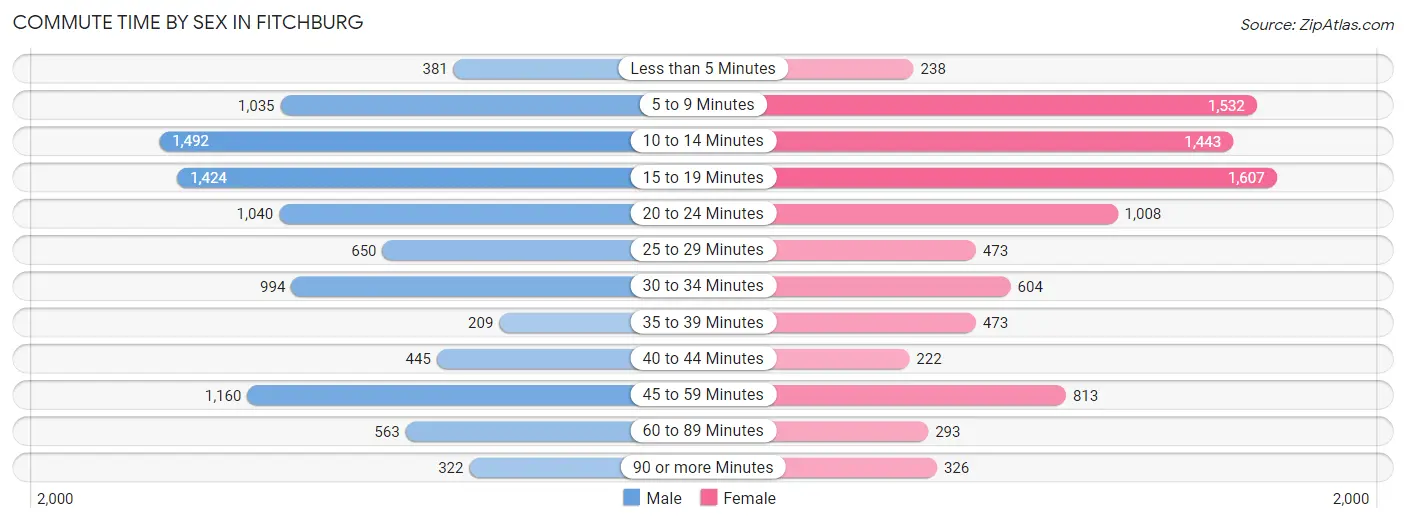
| Commute Time | Male | Female |
| Less than 5 Minutes | 381 (3.9%) | 238 (2.6%) |
| 5 to 9 Minutes | 1,035 (10.6%) | 1,532 (17.0%) |
| 10 to 14 Minutes | 1,492 (15.4%) | 1,443 (16.0%) |
| 15 to 19 Minutes | 1,424 (14.7%) | 1,607 (17.8%) |
| 20 to 24 Minutes | 1,040 (10.7%) | 1,008 (11.2%) |
| 25 to 29 Minutes | 650 (6.7%) | 473 (5.2%) |
| 30 to 34 Minutes | 994 (10.2%) | 604 (6.7%) |
| 35 to 39 Minutes | 209 (2.1%) | 473 (5.2%) |
| 40 to 44 Minutes | 445 (4.6%) | 222 (2.5%) |
| 45 to 59 Minutes | 1,160 (11.9%) | 813 (9.0%) |
| 60 to 89 Minutes | 563 (5.8%) | 293 (3.2%) |
| 90 or more Minutes | 322 (3.3%) | 326 (3.6%) |
Time of Departure to Work by Sex in Fitchburg
The most frequent times of departure to work in Fitchburg are 6:00 AM to 6:29 AM (1,239, 12.8%) for males and 7:30 AM to 7:59 AM (1,765, 19.5%) for females.
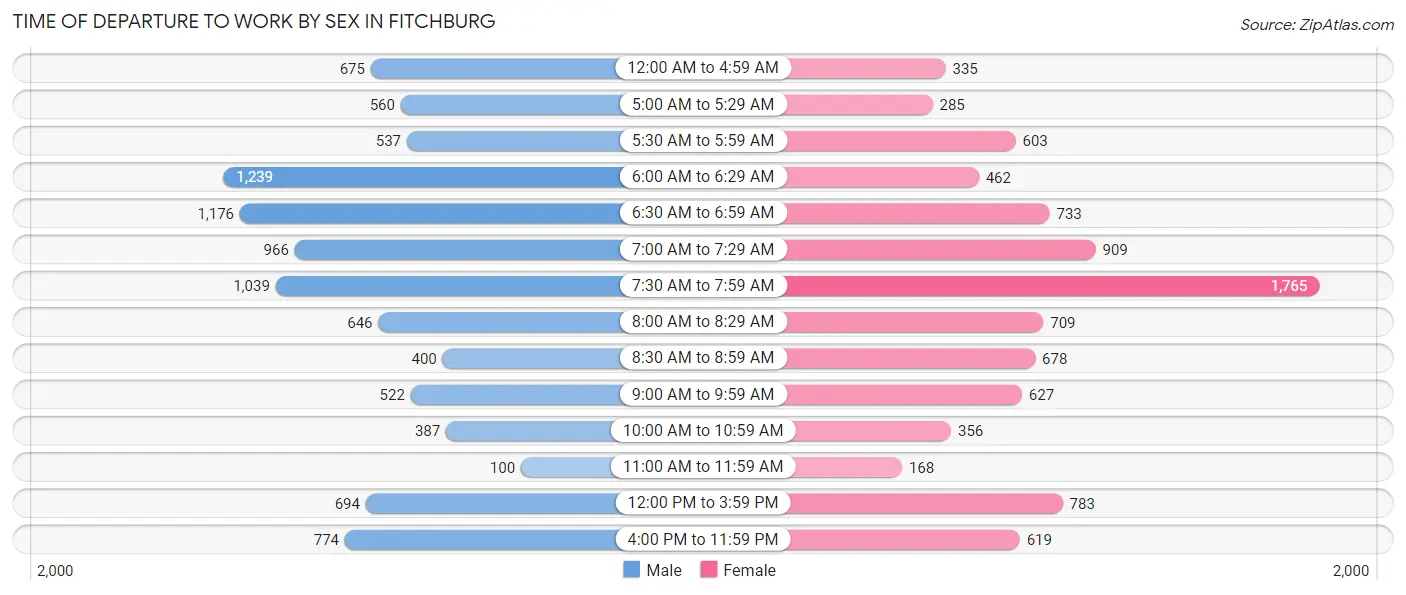
| Time of Departure | Male | Female |
| 12:00 AM to 4:59 AM | 675 (7.0%) | 335 (3.7%) |
| 5:00 AM to 5:29 AM | 560 (5.8%) | 285 (3.2%) |
| 5:30 AM to 5:59 AM | 537 (5.5%) | 603 (6.7%) |
| 6:00 AM to 6:29 AM | 1,239 (12.8%) | 462 (5.1%) |
| 6:30 AM to 6:59 AM | 1,176 (12.1%) | 733 (8.1%) |
| 7:00 AM to 7:29 AM | 966 (9.9%) | 909 (10.1%) |
| 7:30 AM to 7:59 AM | 1,039 (10.7%) | 1,765 (19.5%) |
| 8:00 AM to 8:29 AM | 646 (6.7%) | 709 (7.9%) |
| 8:30 AM to 8:59 AM | 400 (4.1%) | 678 (7.5%) |
| 9:00 AM to 9:59 AM | 522 (5.4%) | 627 (6.9%) |
| 10:00 AM to 10:59 AM | 387 (4.0%) | 356 (3.9%) |
| 11:00 AM to 11:59 AM | 100 (1.0%) | 168 (1.9%) |
| 12:00 PM to 3:59 PM | 694 (7.1%) | 783 (8.7%) |
| 4:00 PM to 11:59 PM | 774 (8.0%) | 619 (6.9%) |
| Total | 9,715 (100.0%) | 9,032 (100.0%) |
Housing Occupancy in Fitchburg
Occupancy by Ownership in Fitchburg
Of the total 16,645 dwellings in Fitchburg, owner-occupied units account for 9,270 (55.7%), while renter-occupied units make up 7,375 (44.3%).
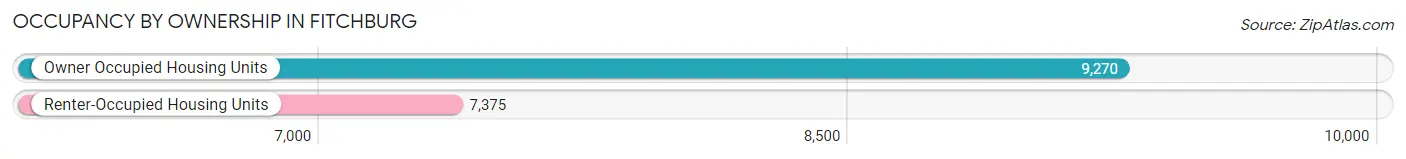
| Occupancy | # Housing Units | % Housing Units |
| Owner Occupied Housing Units | 9,270 | 55.7% |
| Renter-Occupied Housing Units | 7,375 | 44.3% |
| Total Occupied Housing Units | 16,645 | 100.0% |
Occupancy by Household Size in Fitchburg
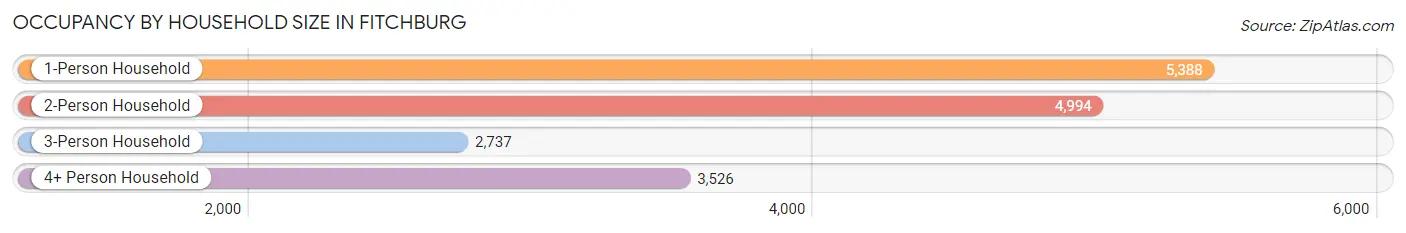
| Household Size | # Housing Units | % Housing Units |
| 1-Person Household | 5,388 | 32.4% |
| 2-Person Household | 4,994 | 30.0% |
| 3-Person Household | 2,737 | 16.4% |
| 4+ Person Household | 3,526 | 21.2% |
| Total Housing Units | 16,645 | 100.0% |
Occupancy by Ownership by Household Size in Fitchburg
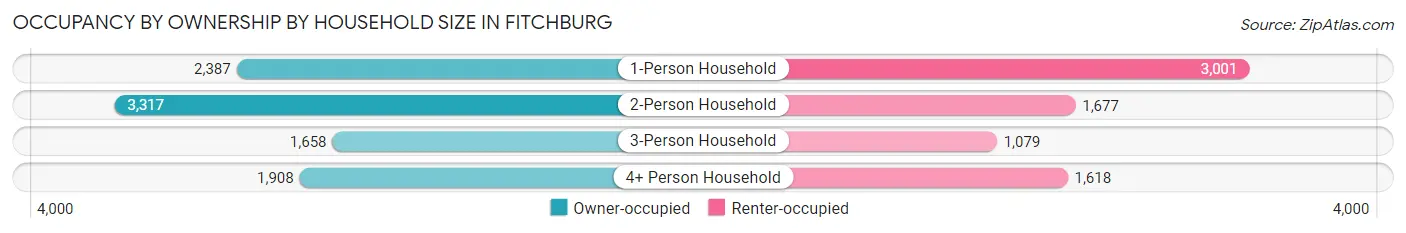
| Household Size | Owner-occupied | Renter-occupied |
| 1-Person Household | 2,387 (44.3%) | 3,001 (55.7%) |
| 2-Person Household | 3,317 (66.4%) | 1,677 (33.6%) |
| 3-Person Household | 1,658 (60.6%) | 1,079 (39.4%) |
| 4+ Person Household | 1,908 (54.1%) | 1,618 (45.9%) |
| Total Housing Units | 9,270 (55.7%) | 7,375 (44.3%) |
Occupancy by Educational Attainment in Fitchburg
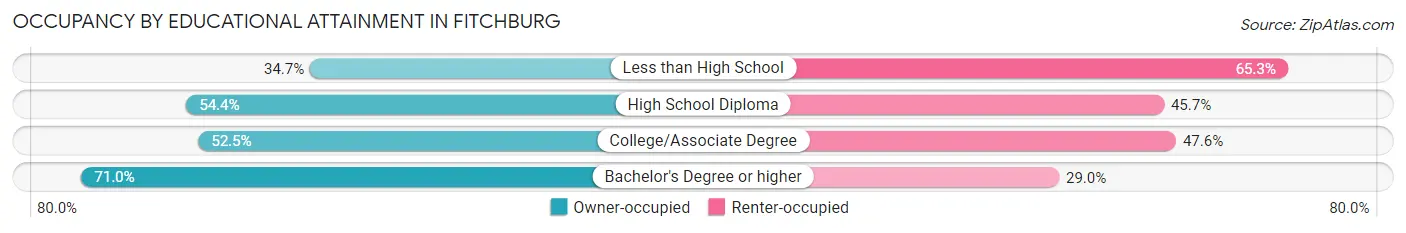
| Household Size | Owner-occupied | Renter-occupied |
| Less than High School | 604 (34.7%) | 1,135 (65.3%) |
| High School Diploma | 2,667 (54.3%) | 2,240 (45.7%) |
| College/Associate Degree | 3,109 (52.4%) | 2,819 (47.5%) |
| Bachelor's Degree or higher | 2,890 (71.0%) | 1,181 (29.0%) |
Occupancy by Age of Householder in Fitchburg
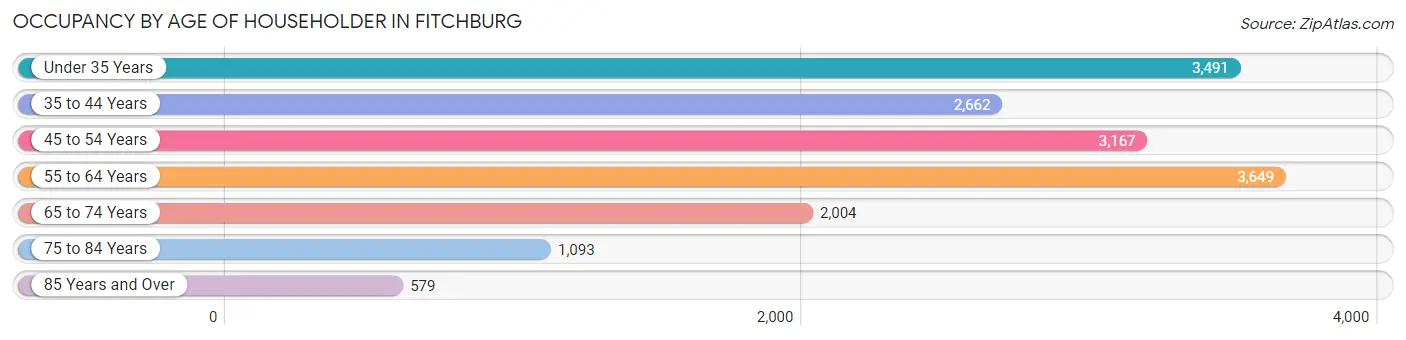
| Age Bracket | # Households | % Households |
| Under 35 Years | 3,491 | 21.0% |
| 35 to 44 Years | 2,662 | 16.0% |
| 45 to 54 Years | 3,167 | 19.0% |
| 55 to 64 Years | 3,649 | 21.9% |
| 65 to 74 Years | 2,004 | 12.0% |
| 75 to 84 Years | 1,093 | 6.6% |
| 85 Years and Over | 579 | 3.5% |
| Total | 16,645 | 100.0% |
Housing Finances in Fitchburg
Median Income by Occupancy in Fitchburg
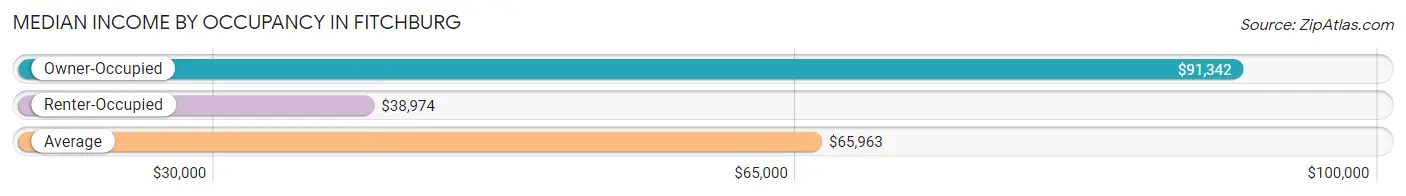
| Occupancy Type | # Households | Median Income |
| Owner-Occupied | 9,270 (55.7%) | $91,342 |
| Renter-Occupied | 7,375 (44.3%) | $38,974 |
| Average | 16,645 (100.0%) | $65,963 |
Occupancy by Householder Income Bracket in Fitchburg
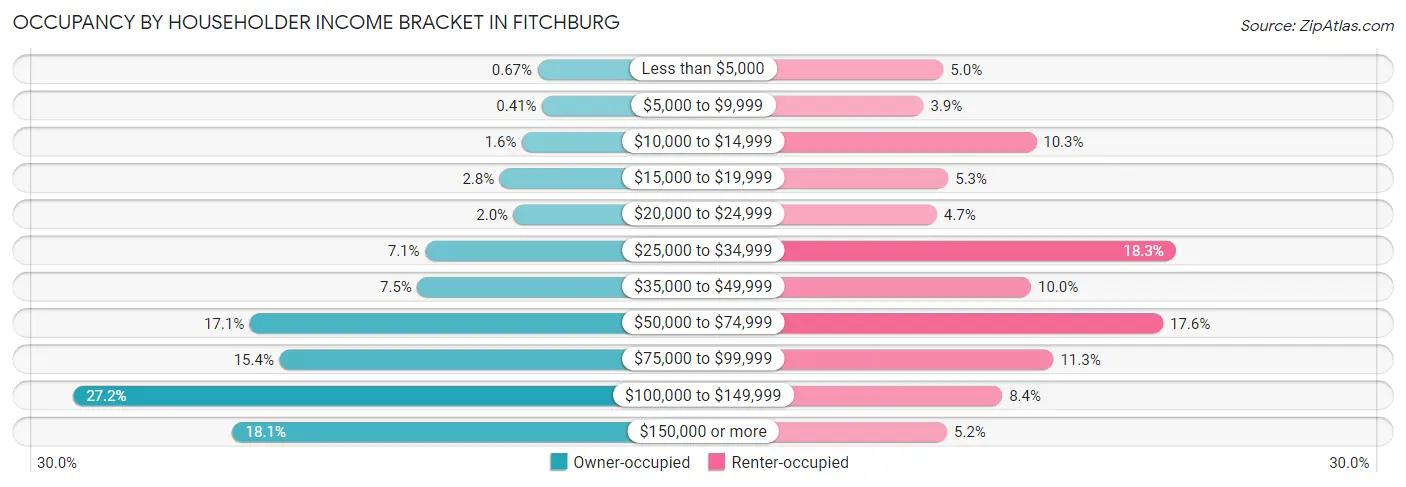
| Income Bracket | Owner-occupied | Renter-occupied |
| Less than $5,000 | 62 (0.7%) | 370 (5.0%) |
| $5,000 to $9,999 | 38 (0.4%) | 286 (3.9%) |
| $10,000 to $14,999 | 145 (1.6%) | 762 (10.3%) |
| $15,000 to $19,999 | 262 (2.8%) | 391 (5.3%) |
| $20,000 to $24,999 | 189 (2.0%) | 343 (4.6%) |
| $25,000 to $34,999 | 658 (7.1%) | 1,349 (18.3%) |
| $35,000 to $49,999 | 699 (7.5%) | 740 (10.0%) |
| $50,000 to $74,999 | 1,586 (17.1%) | 1,296 (17.6%) |
| $75,000 to $99,999 | 1,429 (15.4%) | 834 (11.3%) |
| $100,000 to $149,999 | 2,523 (27.2%) | 618 (8.4%) |
| $150,000 or more | 1,679 (18.1%) | 386 (5.2%) |
| Total | 9,270 (100.0%) | 7,375 (100.0%) |
Monthly Housing Cost Tiers in Fitchburg
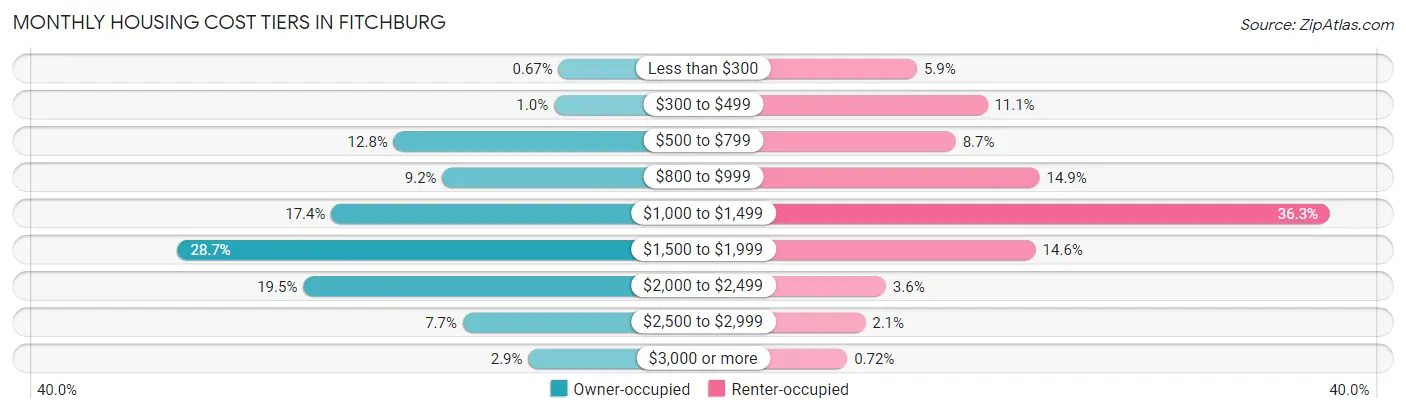
| Monthly Cost | Owner-occupied | Renter-occupied |
| Less than $300 | 62 (0.7%) | 432 (5.9%) |
| $300 to $499 | 94 (1.0%) | 815 (11.1%) |
| $500 to $799 | 1,188 (12.8%) | 642 (8.7%) |
| $800 to $999 | 856 (9.2%) | 1,098 (14.9%) |
| $1,000 to $1,499 | 1,614 (17.4%) | 2,675 (36.3%) |
| $1,500 to $1,999 | 2,664 (28.7%) | 1,077 (14.6%) |
| $2,000 to $2,499 | 1,806 (19.5%) | 263 (3.6%) |
| $2,500 to $2,999 | 717 (7.7%) | 151 (2.1%) |
| $3,000 or more | 269 (2.9%) | 53 (0.7%) |
| Total | 9,270 (100.0%) | 7,375 (100.0%) |
Physical Housing Characteristics in Fitchburg
Housing Structures in Fitchburg
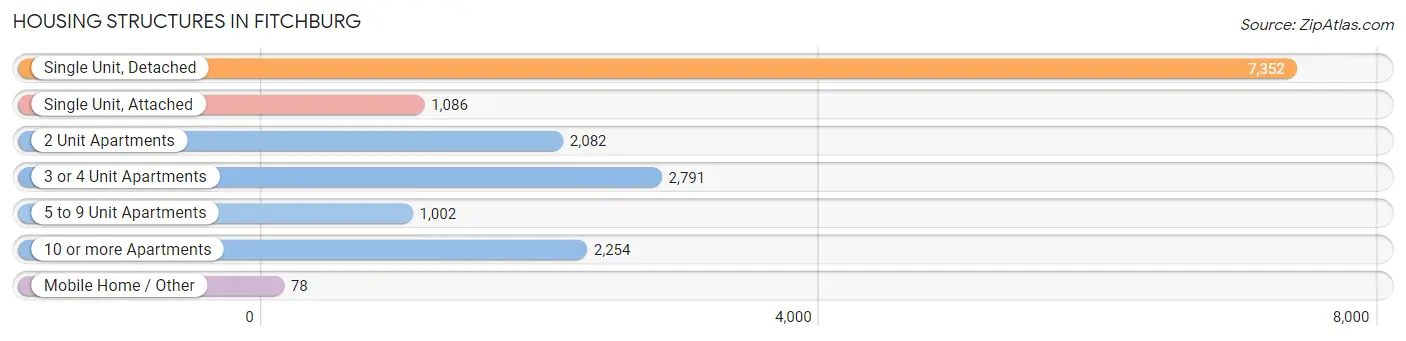
| Structure Type | # Housing Units | % Housing Units |
| Single Unit, Detached | 7,352 | 44.2% |
| Single Unit, Attached | 1,086 | 6.5% |
| 2 Unit Apartments | 2,082 | 12.5% |
| 3 or 4 Unit Apartments | 2,791 | 16.8% |
| 5 to 9 Unit Apartments | 1,002 | 6.0% |
| 10 or more Apartments | 2,254 | 13.5% |
| Mobile Home / Other | 78 | 0.5% |
| Total | 16,645 | 100.0% |
Housing Structures by Occupancy in Fitchburg
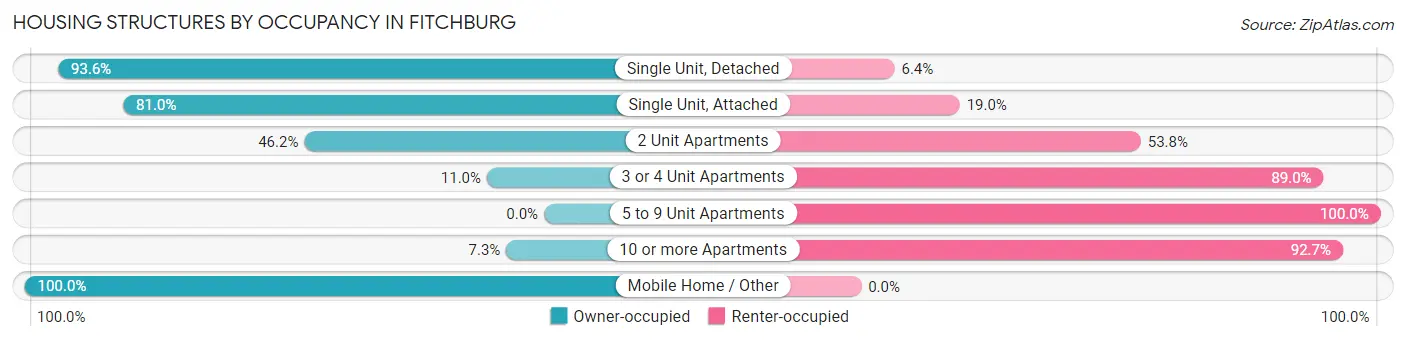
| Structure Type | Owner-occupied | Renter-occupied |
| Single Unit, Detached | 6,880 (93.6%) | 472 (6.4%) |
| Single Unit, Attached | 880 (81.0%) | 206 (19.0%) |
| 2 Unit Apartments | 961 (46.2%) | 1,121 (53.8%) |
| 3 or 4 Unit Apartments | 307 (11.0%) | 2,484 (89.0%) |
| 5 to 9 Unit Apartments | 0 (0.0%) | 1,002 (100.0%) |
| 10 or more Apartments | 164 (7.3%) | 2,090 (92.7%) |
| Mobile Home / Other | 78 (100.0%) | 0 (0.0%) |
| Total | 9,270 (55.7%) | 7,375 (44.3%) |
Housing Structures by Number of Rooms in Fitchburg
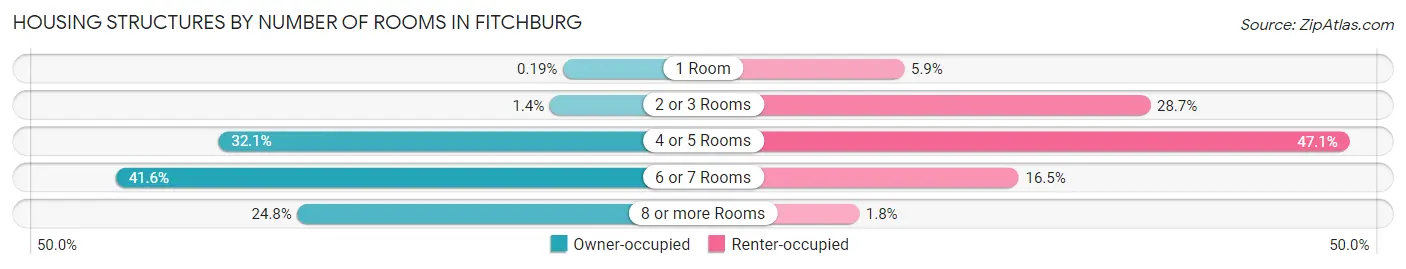
| Number of Rooms | Owner-occupied | Renter-occupied |
| 1 Room | 18 (0.2%) | 437 (5.9%) |
| 2 or 3 Rooms | 130 (1.4%) | 2,115 (28.7%) |
| 4 or 5 Rooms | 2,974 (32.1%) | 3,476 (47.1%) |
| 6 or 7 Rooms | 3,854 (41.6%) | 1,218 (16.5%) |
| 8 or more Rooms | 2,294 (24.7%) | 129 (1.8%) |
| Total | 9,270 (100.0%) | 7,375 (100.0%) |
Housing Structure by Heating Type in Fitchburg
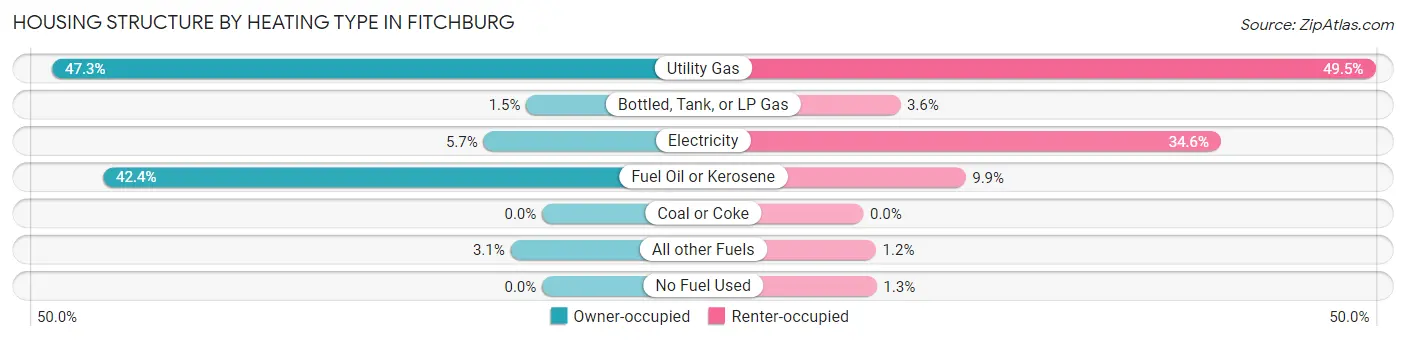
| Heating Type | Owner-occupied | Renter-occupied |
| Utility Gas | 4,388 (47.3%) | 3,649 (49.5%) |
| Bottled, Tank, or LP Gas | 142 (1.5%) | 263 (3.6%) |
| Electricity | 525 (5.7%) | 2,549 (34.6%) |
| Fuel Oil or Kerosene | 3,932 (42.4%) | 729 (9.9%) |
| Coal or Coke | 0 (0.0%) | 0 (0.0%) |
| All other Fuels | 283 (3.0%) | 90 (1.2%) |
| No Fuel Used | 0 (0.0%) | 95 (1.3%) |
| Total | 9,270 (100.0%) | 7,375 (100.0%) |
Household Vehicle Usage in Fitchburg
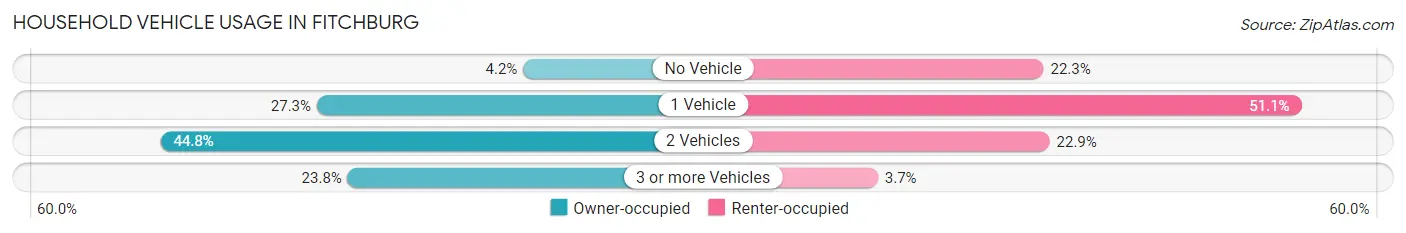
| Vehicles per Household | Owner-occupied | Renter-occupied |
| No Vehicle | 385 (4.2%) | 1,641 (22.3%) |
| 1 Vehicle | 2,527 (27.3%) | 3,771 (51.1%) |
| 2 Vehicles | 4,151 (44.8%) | 1,691 (22.9%) |
| 3 or more Vehicles | 2,207 (23.8%) | 272 (3.7%) |
| Total | 9,270 (100.0%) | 7,375 (100.0%) |
Real Estate & Mortgages in Fitchburg
Real Estate and Mortgage Overview in Fitchburg
| Characteristic | Without Mortgage | With Mortgage |
| Housing Units | 2,608 | 6,662 |
| Median Property Value | $251,700 | $267,900 |
| Median Household Income | $63,903 | $1,398 |
| Monthly Housing Costs | $816 | $262 |
| Real Estate Taxes | $4,254 | $93 |
Property Value by Mortgage Status in Fitchburg
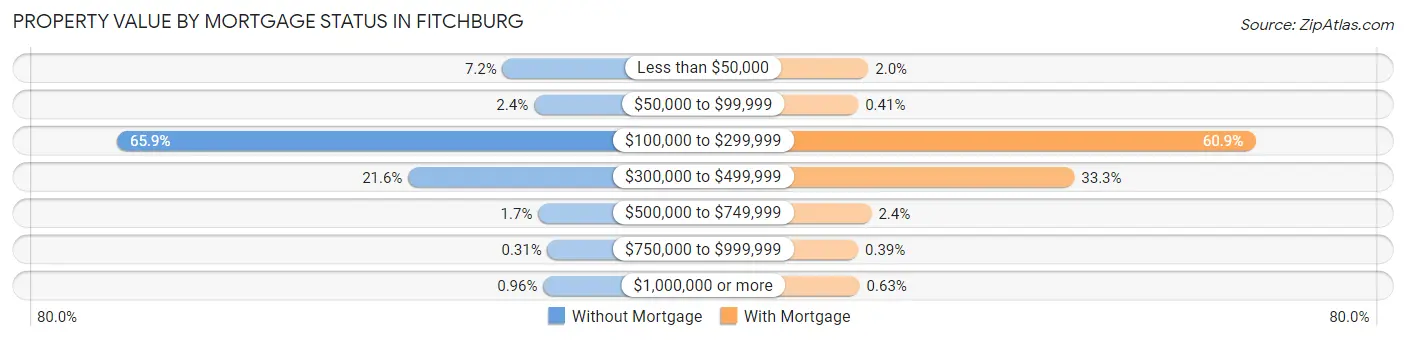
| Property Value | Without Mortgage | With Mortgage |
| Less than $50,000 | 187 (7.2%) | 130 (1.9%) |
| $50,000 to $99,999 | 62 (2.4%) | 27 (0.4%) |
| $100,000 to $299,999 | 1,719 (65.9%) | 4,055 (60.9%) |
| $300,000 to $499,999 | 562 (21.5%) | 2,221 (33.3%) |
| $500,000 to $749,999 | 45 (1.7%) | 161 (2.4%) |
| $750,000 to $999,999 | 8 (0.3%) | 26 (0.4%) |
| $1,000,000 or more | 25 (1.0%) | 42 (0.6%) |
| Total | 2,608 (100.0%) | 6,662 (100.0%) |
Household Income by Mortgage Status in Fitchburg
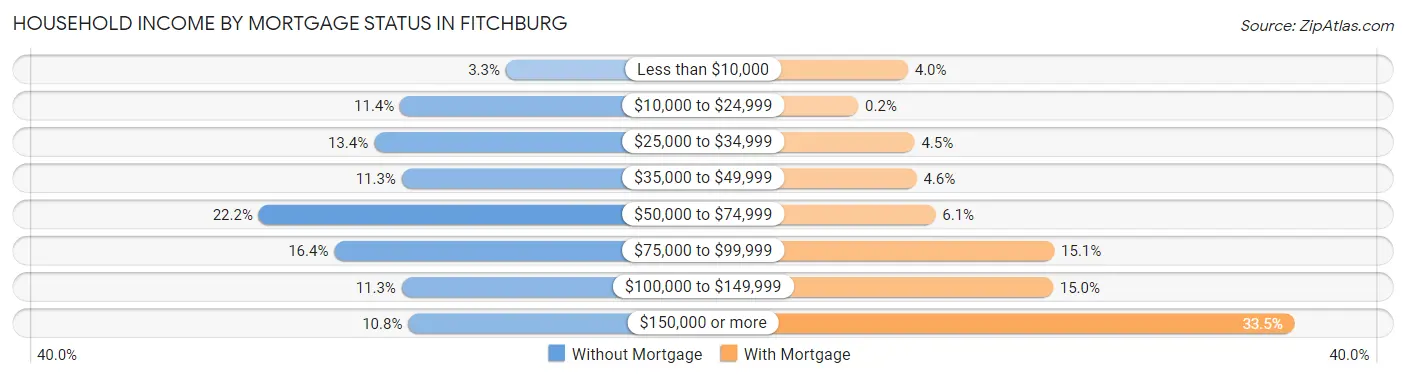
| Household Income | Without Mortgage | With Mortgage |
| Less than $10,000 | 87 (3.3%) | 265 (4.0%) |
| $10,000 to $24,999 | 297 (11.4%) | 13 (0.2%) |
| $25,000 to $34,999 | 349 (13.4%) | 299 (4.5%) |
| $35,000 to $49,999 | 294 (11.3%) | 309 (4.6%) |
| $50,000 to $74,999 | 578 (22.2%) | 405 (6.1%) |
| $75,000 to $99,999 | 428 (16.4%) | 1,008 (15.1%) |
| $100,000 to $149,999 | 294 (11.3%) | 1,001 (15.0%) |
| $150,000 or more | 281 (10.8%) | 2,229 (33.5%) |
| Total | 2,608 (100.0%) | 6,662 (100.0%) |
Property Value to Household Income Ratio in Fitchburg
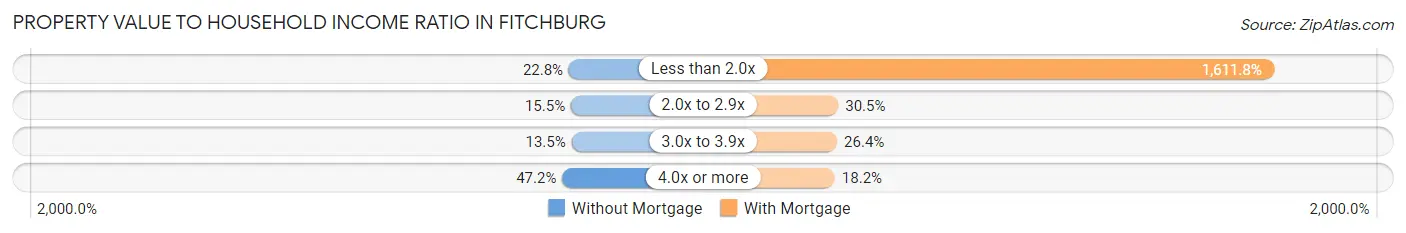
| Value-to-Income Ratio | Without Mortgage | With Mortgage |
| Less than 2.0x | 594 (22.8%) | 107,380 (1,611.8%) |
| 2.0x to 2.9x | 403 (15.4%) | 2,031 (30.5%) |
| 3.0x to 3.9x | 351 (13.5%) | 1,756 (26.4%) |
| 4.0x or more | 1,231 (47.2%) | 1,210 (18.2%) |
| Total | 2,608 (100.0%) | 6,662 (100.0%) |
Real Estate Taxes by Mortgage Status in Fitchburg
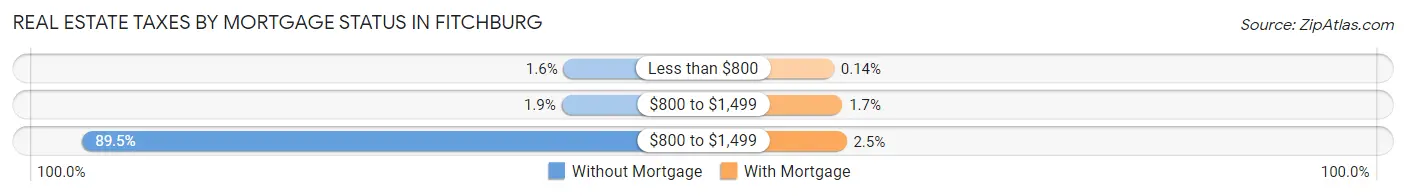
| Property Taxes | Without Mortgage | With Mortgage |
| Less than $800 | 41 (1.6%) | 9 (0.1%) |
| $800 to $1,499 | 50 (1.9%) | 112 (1.7%) |
| $800 to $1,499 | 2,333 (89.5%) | 163 (2.5%) |
| Total | 2,608 (100.0%) | 6,662 (100.0%) |
Health & Disability in Fitchburg
Health Insurance Coverage by Age in Fitchburg
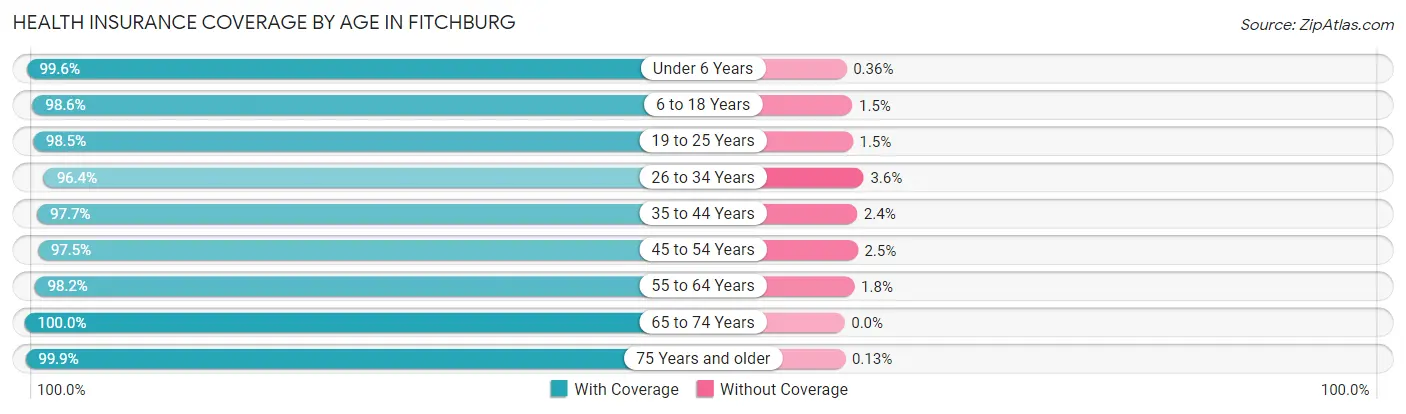
| Age Bracket | With Coverage | Without Coverage |
| Under 6 Years | 2,753 (99.6%) | 10 (0.4%) |
| 6 to 18 Years | 6,587 (98.6%) | 97 (1.5%) |
| 19 to 25 Years | 4,629 (98.5%) | 72 (1.5%) |
| 26 to 34 Years | 4,991 (96.4%) | 185 (3.6%) |
| 35 to 44 Years | 4,982 (97.7%) | 120 (2.4%) |
| 45 to 54 Years | 5,280 (97.5%) | 133 (2.5%) |
| 55 to 64 Years | 5,590 (98.2%) | 105 (1.8%) |
| 65 to 74 Years | 3,257 (100.0%) | 0 (0.0%) |
| 75 Years and older | 2,380 (99.9%) | 3 (0.1%) |
| Total | 40,449 (98.2%) | 725 (1.8%) |
Health Insurance Coverage by Citizenship Status in Fitchburg
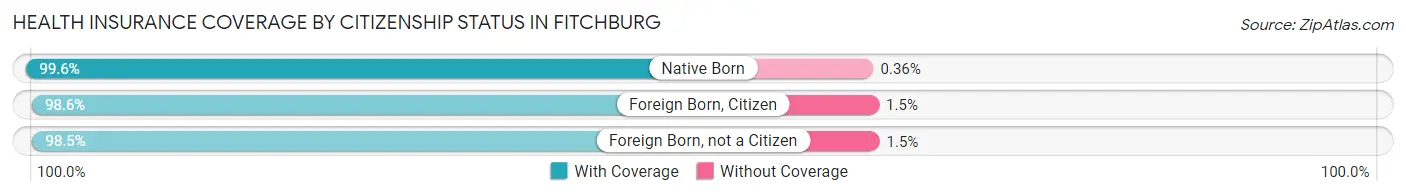
| Citizenship Status | With Coverage | Without Coverage |
| Native Born | 2,753 (99.6%) | 10 (0.4%) |
| Foreign Born, Citizen | 6,587 (98.6%) | 97 (1.5%) |
| Foreign Born, not a Citizen | 4,629 (98.5%) | 72 (1.5%) |
Health Insurance Coverage by Household Income in Fitchburg
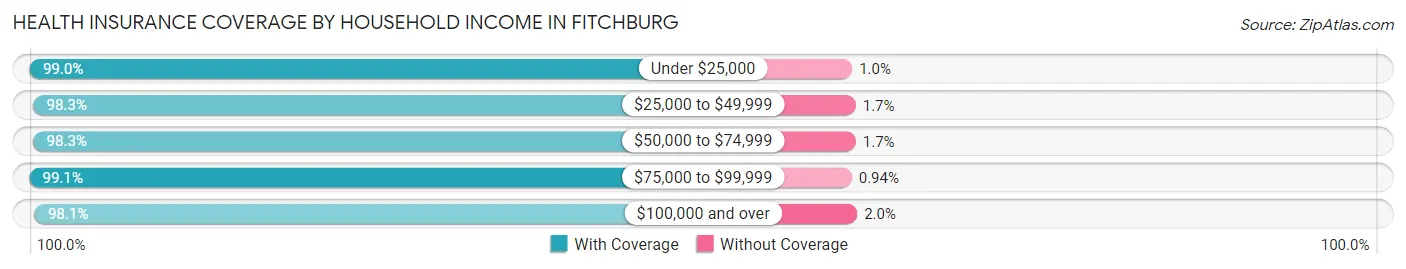
| Household Income | With Coverage | Without Coverage |
| Under $25,000 | 4,182 (99.0%) | 43 (1.0%) |
| $25,000 to $49,999 | 7,187 (98.3%) | 123 (1.7%) |
| $50,000 to $74,999 | 6,692 (98.3%) | 116 (1.7%) |
| $75,000 to $99,999 | 5,489 (99.1%) | 52 (0.9%) |
| $100,000 and over | 15,759 (98.1%) | 313 (1.9%) |
Public vs Private Health Insurance Coverage by Age in Fitchburg
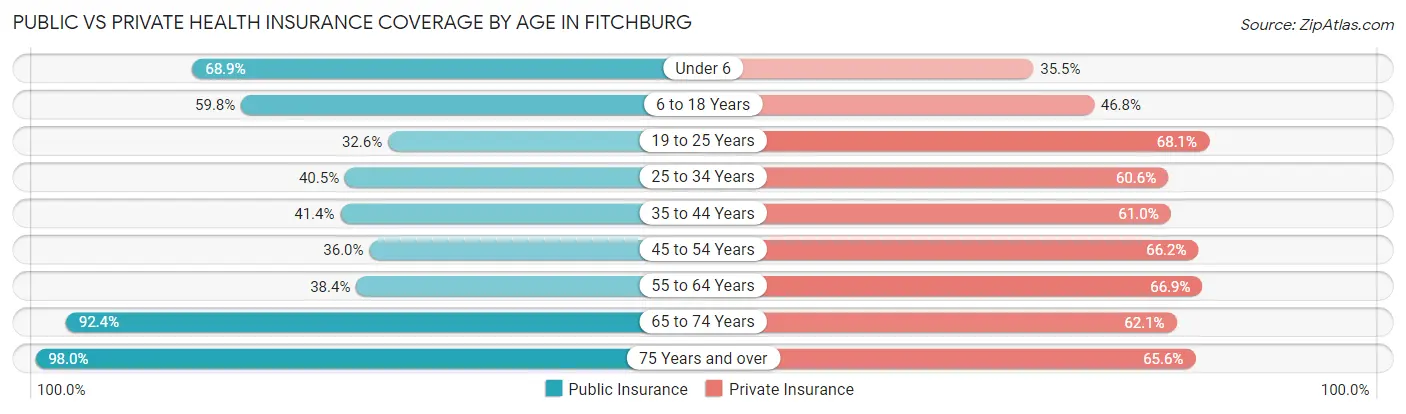
| Age Bracket | Public Insurance | Private Insurance |
| Under 6 | 1,903 (68.9%) | 982 (35.5%) |
| 6 to 18 Years | 3,998 (59.8%) | 3,127 (46.8%) |
| 19 to 25 Years | 1,530 (32.6%) | 3,203 (68.1%) |
| 25 to 34 Years | 2,098 (40.5%) | 3,134 (60.6%) |
| 35 to 44 Years | 2,112 (41.4%) | 3,113 (61.0%) |
| 45 to 54 Years | 1,949 (36.0%) | 3,582 (66.2%) |
| 55 to 64 Years | 2,189 (38.4%) | 3,811 (66.9%) |
| 65 to 74 Years | 3,008 (92.3%) | 2,023 (62.1%) |
| 75 Years and over | 2,336 (98.0%) | 1,563 (65.6%) |
| Total | 21,123 (51.3%) | 24,538 (59.6%) |
Disability Status by Sex by Age in Fitchburg
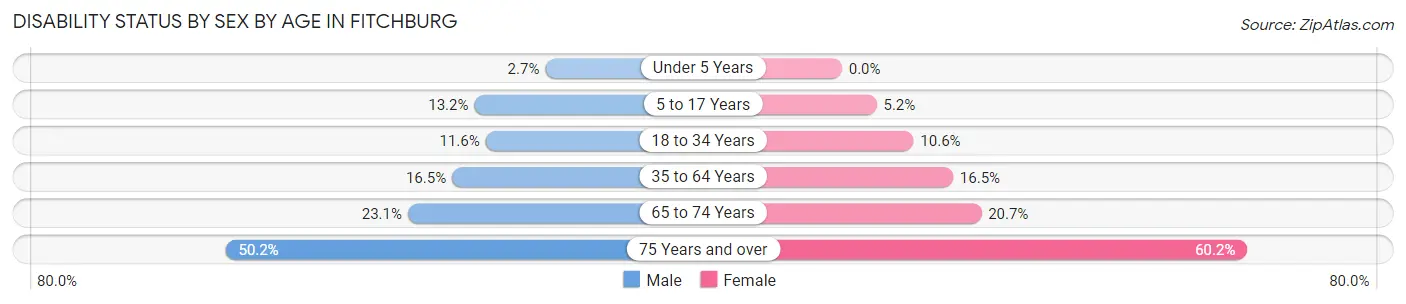
| Age Bracket | Male | Female |
| Under 5 Years | 20 (2.7%) | 0 (0.0%) |
| 5 to 17 Years | 406 (13.2%) | 159 (5.2%) |
| 18 to 34 Years | 589 (11.6%) | 615 (10.6%) |
| 35 to 64 Years | 1,427 (16.5%) | 1,251 (16.5%) |
| 65 to 74 Years | 335 (23.1%) | 374 (20.7%) |
| 75 Years and over | 438 (50.2%) | 909 (60.2%) |
Disability Class by Sex by Age in Fitchburg
Disability Class: Hearing Difficulty
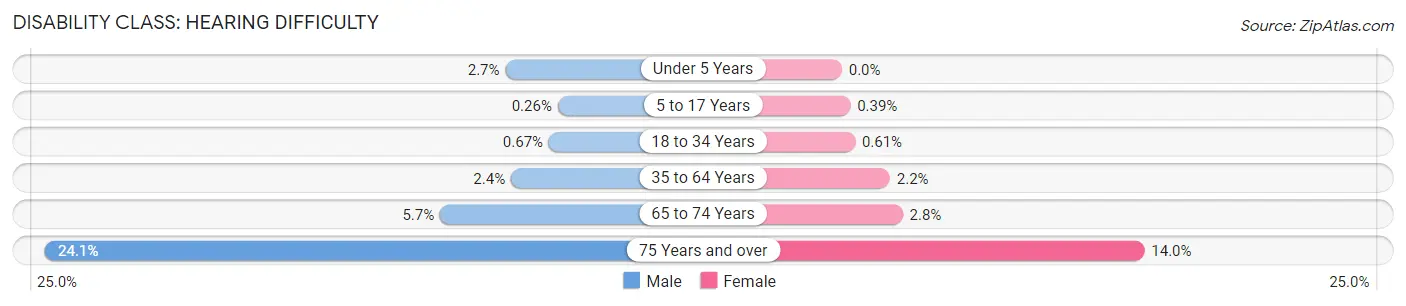
| Age Bracket | Male | Female |
| Under 5 Years | 20 (2.7%) | 0 (0.0%) |
| 5 to 17 Years | 8 (0.3%) | 12 (0.4%) |
| 18 to 34 Years | 34 (0.7%) | 35 (0.6%) |
| 35 to 64 Years | 210 (2.4%) | 169 (2.2%) |
| 65 to 74 Years | 83 (5.7%) | 51 (2.8%) |
| 75 Years and over | 210 (24.0%) | 212 (14.0%) |
Disability Class: Vision Difficulty
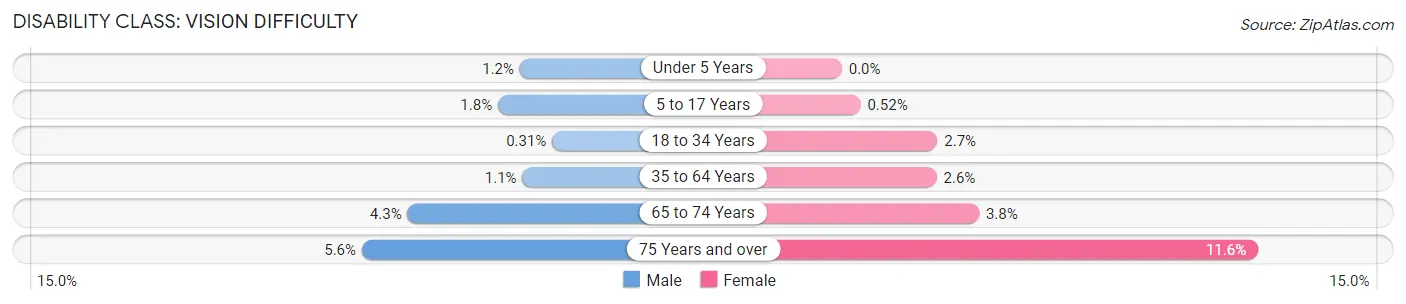
| Age Bracket | Male | Female |
| Under 5 Years | 9 (1.2%) | 0 (0.0%) |
| 5 to 17 Years | 56 (1.8%) | 16 (0.5%) |
| 18 to 34 Years | 16 (0.3%) | 154 (2.7%) |
| 35 to 64 Years | 98 (1.1%) | 200 (2.6%) |
| 65 to 74 Years | 63 (4.3%) | 69 (3.8%) |
| 75 Years and over | 49 (5.6%) | 175 (11.6%) |
Disability Class: Cognitive Difficulty
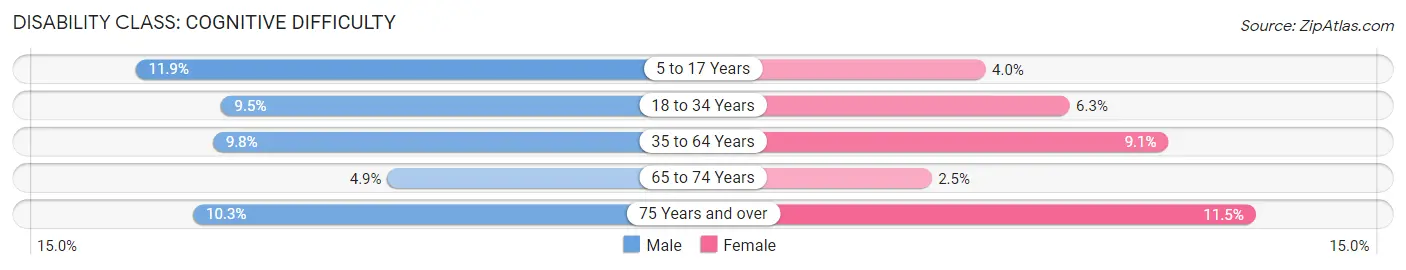
| Age Bracket | Male | Female |
| 5 to 17 Years | 366 (11.9%) | 123 (4.0%) |
| 18 to 34 Years | 485 (9.5%) | 366 (6.3%) |
| 35 to 64 Years | 842 (9.8%) | 689 (9.1%) |
| 65 to 74 Years | 71 (4.9%) | 45 (2.5%) |
| 75 Years and over | 90 (10.3%) | 174 (11.5%) |
Disability Class: Ambulatory Difficulty
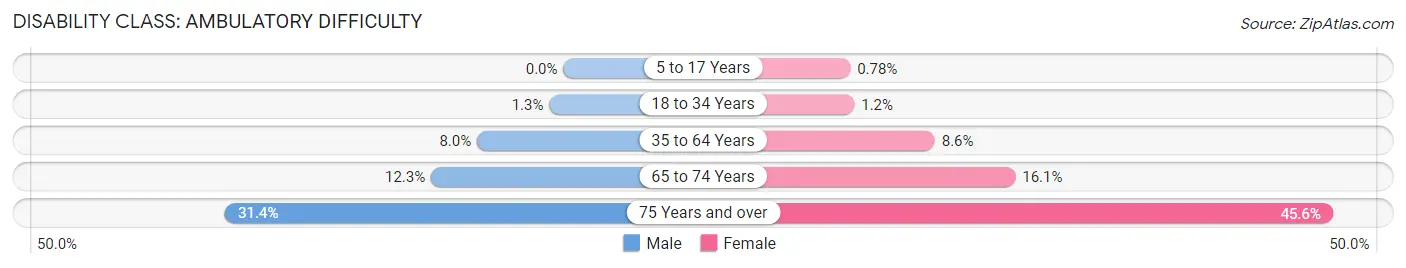
| Age Bracket | Male | Female |
| 5 to 17 Years | 0 (0.0%) | 24 (0.8%) |
| 18 to 34 Years | 66 (1.3%) | 67 (1.2%) |
| 35 to 64 Years | 691 (8.0%) | 654 (8.6%) |
| 65 to 74 Years | 178 (12.3%) | 291 (16.1%) |
| 75 Years and over | 274 (31.4%) | 688 (45.6%) |
Disability Class: Self-Care Difficulty
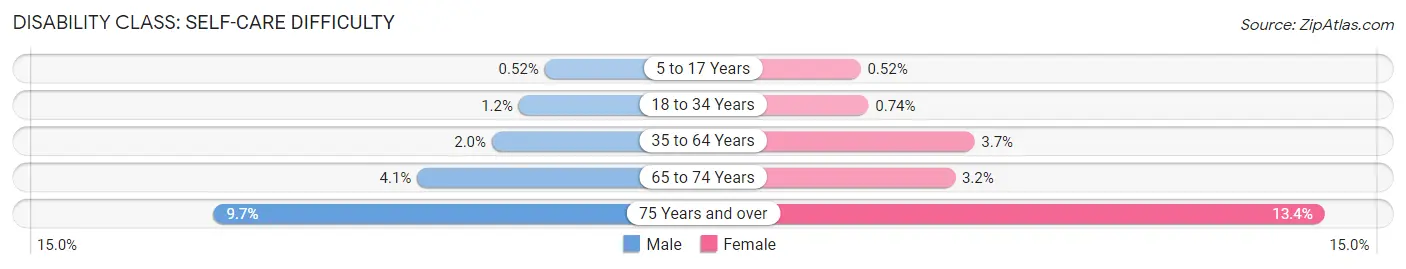
| Age Bracket | Male | Female |
| 5 to 17 Years | 16 (0.5%) | 16 (0.5%) |
| 18 to 34 Years | 63 (1.2%) | 43 (0.7%) |
| 35 to 64 Years | 172 (2.0%) | 280 (3.7%) |
| 65 to 74 Years | 59 (4.1%) | 57 (3.2%) |
| 75 Years and over | 85 (9.7%) | 203 (13.4%) |
Technology Access in Fitchburg
Computing Device Access in Fitchburg
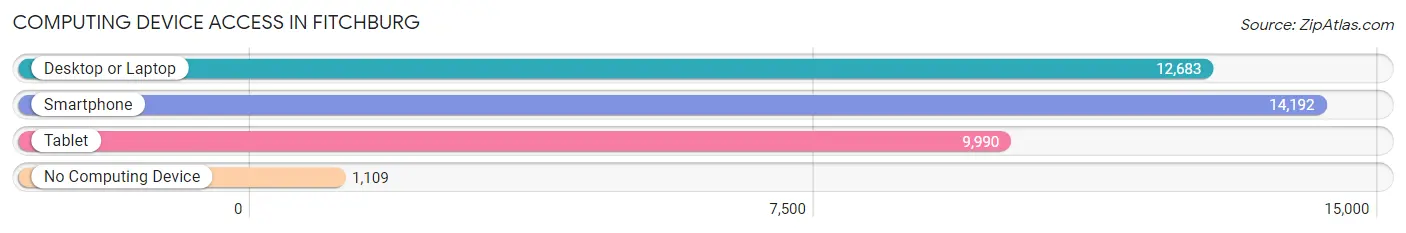
| Device Type | # Households | % Households |
| Desktop or Laptop | 12,683 | 76.2% |
| Smartphone | 14,192 | 85.3% |
| Tablet | 9,990 | 60.0% |
| No Computing Device | 1,109 | 6.7% |
| Total | 16,645 | 100.0% |
Internet Access in Fitchburg
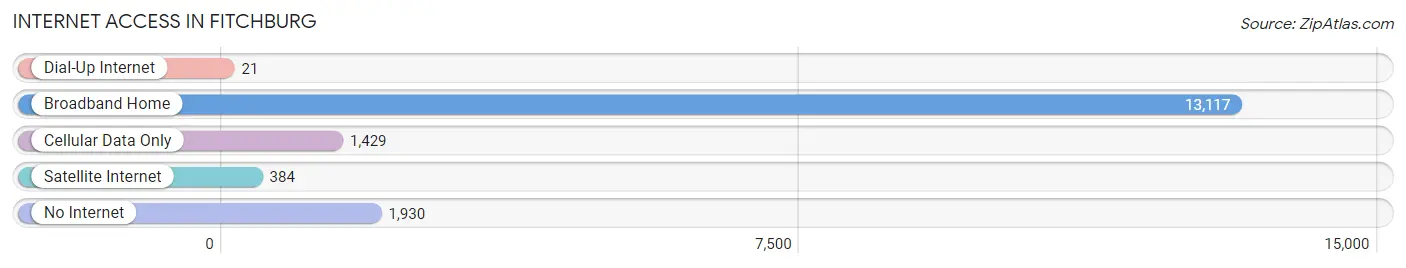
| Internet Type | # Households | % Households |
| Dial-Up Internet | 21 | 0.1% |
| Broadband Home | 13,117 | 78.8% |
| Cellular Data Only | 1,429 | 8.6% |
| Satellite Internet | 384 | 2.3% |
| No Internet | 1,930 | 11.6% |
| Total | 16,645 | 100.0% |
Fitchburg Summary
Fitchburg, Massachusetts is a city located in Worcester County, in the north-central part of the state. It is situated on the Nashua River, about 40 miles northwest of Boston. The city has a population of approximately 40,000 people, making it the fourth-largest city in the county.
History
Fitchburg was first settled in 1730 by settlers from Groton, Massachusetts. The town was named after John Fitch, a prominent local landowner. The town was officially incorporated in 1764.
In the 19th century, Fitchburg was an important industrial center. It was home to several factories, including the Fitchburg Iron Works, which produced railroad cars and locomotives. The city was also home to several paper mills, which produced paper products for the region.
In the late 19th century, Fitchburg was a major stop on the Boston & Maine Railroad. The railroad brought many new people to the city, and the population grew rapidly.
Geography
Fitchburg is located in north-central Massachusetts, about 40 miles northwest of Boston. It is situated on the Nashua River, which flows through the city. The city is bordered by the towns of Ashby, Lunenburg, Leominster, Westminster, and Ashburnham.
The city has a total area of 22.2 square miles, of which 21.9 square miles is land and 0.3 square miles is water. The highest point in the city is the summit of Mount Wachusett, which has an elevation of 2,006 feet.
Economy
Fitchburg’s economy is largely based on manufacturing and services. The city is home to several factories, including the Fitchburg Iron Works, which produces railroad cars and locomotives. The city is also home to several paper mills, which produce paper products for the region.
The city is also home to several retail stores, restaurants, and other businesses. The city is home to several colleges and universities, including Fitchburg State University and Mount Wachusett Community College.
Demographics
As of the 2010 census, Fitchburg had a population of 40,318 people. The racial makeup of the city was 79.2% White, 8.3% African American, 0.4% Native American, 2.2% Asian, 0.1% Pacific Islander, 6.7% from other races, and 2.4% from two or more races. Hispanic or Latino of any race were 14.2% of the population.
The median household income in the city was $41,945, and the median family income was $50,919. The per capita income in the city was $20,945. About 16.2% of the population was below the poverty line.
Common Questions
What is Per Capita Income in Fitchburg?
Per Capita income in Fitchburg is $33,436.
What is the Median Family Income in Fitchburg?
Median Family Income in Fitchburg is $81,720.
What is the Median Household income in Fitchburg?
Median Household Income in Fitchburg is $65,963.
What is Income or Wage Gap in Fitchburg?
Income or Wage Gap in Fitchburg is 19.8%.
Women in Fitchburg earn 80.2 cents for every dollar earned by a man.
What is Family Income Deficit in Fitchburg?
Family Income Deficit in Fitchburg is $8,715.
Families that are below poverty line in Fitchburg earn $8,715 less on average than the poverty threshold level.
What is Inequality or Gini Index in Fitchburg?
Inequality or Gini Index in Fitchburg is 0.43.
What is the Total Population of Fitchburg?
Total Population of Fitchburg is 41,621.
What is the Total Male Population of Fitchburg?
Total Male Population of Fitchburg is 20,082.
What is the Total Female Population of Fitchburg?
Total Female Population of Fitchburg is 21,539.
What is the Ratio of Males per 100 Females in Fitchburg?
There are 93.24 Males per 100 Females in Fitchburg.
What is the Ratio of Females per 100 Males in Fitchburg?
There are 107.26 Females per 100 Males in Fitchburg.
What is the Median Population Age in Fitchburg?
Median Population Age in Fitchburg is 37.6 Years.
What is the Average Family Size in Fitchburg
Average Family Size in Fitchburg is 3.1 People.
What is the Average Household Size in Fitchburg
Average Household Size in Fitchburg is 2.4 People.
How Large is the Labor Force in Fitchburg?
There are 22,525 People in the Labor Forcein in Fitchburg.
What is the Percentage of People in the Labor Force in Fitchburg?
66.3% of People are in the Labor Force in Fitchburg.
What is the Unemployment Rate in Fitchburg?
Unemployment Rate in Fitchburg is 7.7%.