Monument Beach, MA Map & Demographics
Monument Beach Map
Monument Beach Overview
$54,527
PER CAPITA INCOME
$137,426
AVG FAMILY INCOME
$93,688
AVG HOUSEHOLD INCOME
0.35
INEQUALITY / GINI INDEX
3,024
TOTAL POPULATION
1,167
MALE POPULATION
1,857
FEMALE POPULATION
62.84
MALES / 100 FEMALES
159.13
FEMALES / 100 MALES
54.1
MEDIAN AGE
3.1
AVG FAMILY SIZE
2.3
AVG HOUSEHOLD SIZE
1,575
LABOR FORCE [ PEOPLE ]
64.8%
PERCENT IN LABOR FORCE
2.2%
UNEMPLOYMENT RATE
Monument Beach Zip Codes
Monument Beach Area Codes
Income in Monument Beach
Income Overview in Monument Beach
Per Capita Income in Monument Beach is $54,527, while median incomes of families and households are $137,426 and $93,688 respectively.
| Characteristic | Number | Measure |
| Per Capita Income | 3,024 | $54,527 |
| Median Family Income | 763 | $137,426 |
| Mean Family Income | 763 | $140,749 |
| Median Household Income | 1,309 | $93,688 |
| Mean Household Income | 1,309 | $123,150 |
| Income Deficit | 763 | $0 |
| Wage / Income Gap (%) | 3,024 | 0.00% |
| Wage / Income Gap ($) | 3,024 | 100.00¢ per $1 |
| Gini / Inequality Index | 3,024 | 0.35 |
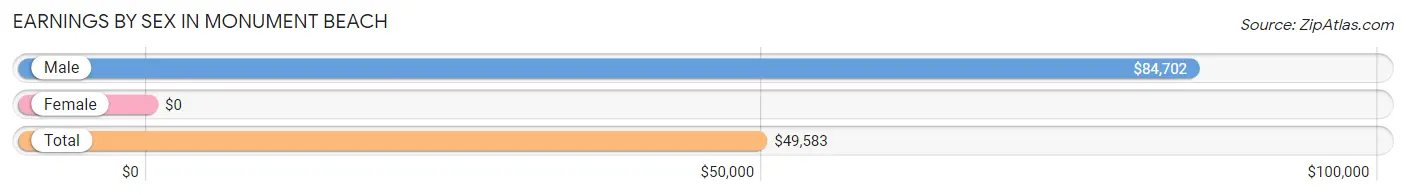
Earnings by Sex in Monument Beach
| Sex | Number | Average Earnings |
| Male | 569 (34.9%) | $84,702 |
| Female | 1,060 (65.1%) | $0 |
| Total | 1,629 (100.0%) | $49,583 |
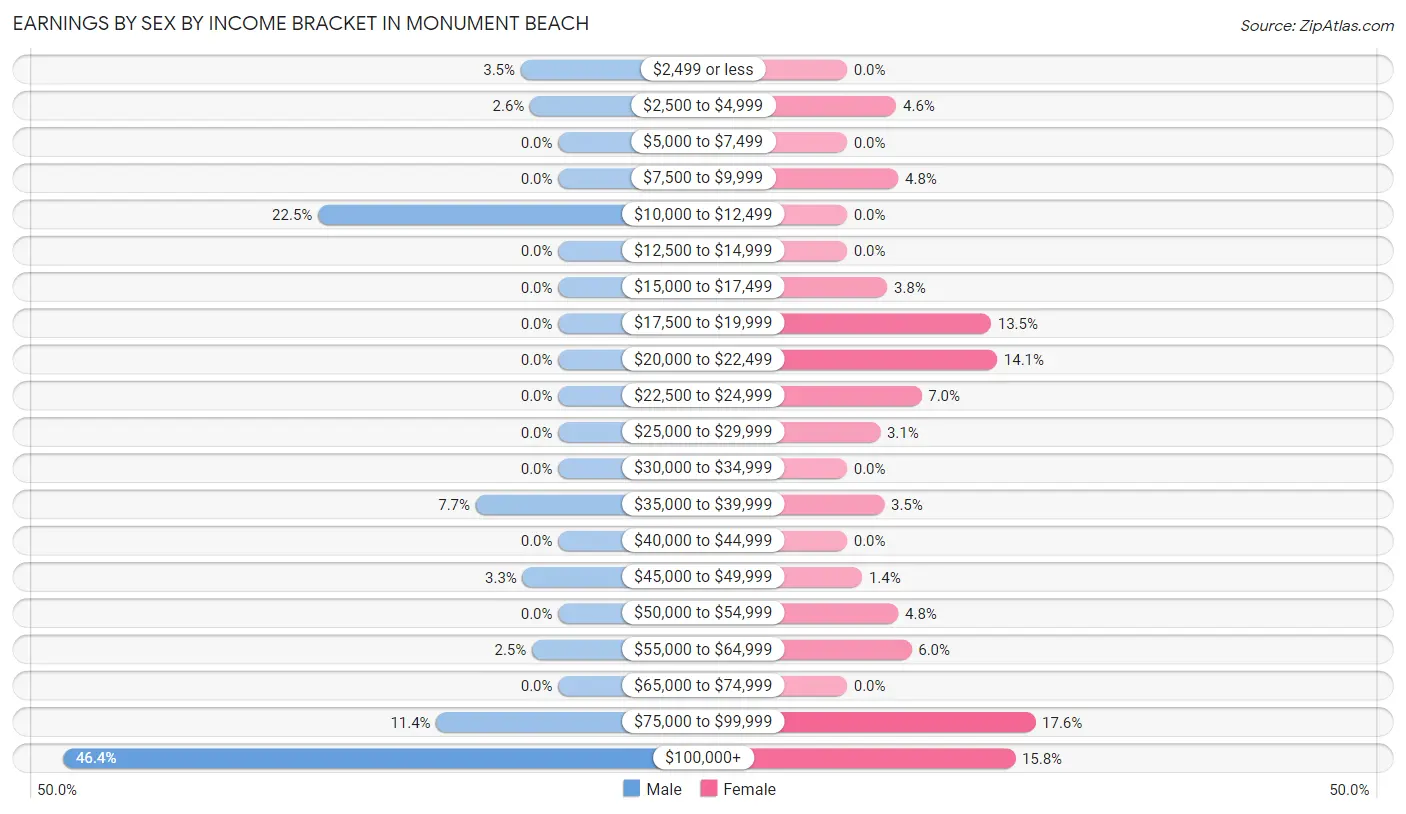
Earnings by Sex by Income Bracket in Monument Beach
The most common earnings brackets in Monument Beach are $100,000+ for men (264 | 46.4%) and $75,000 to $99,999 for women (187 | 17.6%).
| Income | Male | Female |
| $2,499 or less | 20 (3.5%) | 0 (0.0%) |
| $2,500 to $4,999 | 15 (2.6%) | 49 (4.6%) |
| $5,000 to $7,499 | 0 (0.0%) | 0 (0.0%) |
| $7,500 to $9,999 | 0 (0.0%) | 51 (4.8%) |
| $10,000 to $12,499 | 128 (22.5%) | 0 (0.0%) |
| $12,500 to $14,999 | 0 (0.0%) | 0 (0.0%) |
| $15,000 to $17,499 | 0 (0.0%) | 40 (3.8%) |
| $17,500 to $19,999 | 0 (0.0%) | 143 (13.5%) |
| $20,000 to $22,499 | 0 (0.0%) | 149 (14.1%) |
| $22,500 to $24,999 | 0 (0.0%) | 74 (7.0%) |
| $25,000 to $29,999 | 0 (0.0%) | 33 (3.1%) |
| $30,000 to $34,999 | 0 (0.0%) | 0 (0.0%) |
| $35,000 to $39,999 | 44 (7.7%) | 37 (3.5%) |
| $40,000 to $44,999 | 0 (0.0%) | 0 (0.0%) |
| $45,000 to $49,999 | 19 (3.3%) | 15 (1.4%) |
| $50,000 to $54,999 | 0 (0.0%) | 51 (4.8%) |
| $55,000 to $64,999 | 14 (2.5%) | 64 (6.0%) |
| $65,000 to $74,999 | 0 (0.0%) | 0 (0.0%) |
| $75,000 to $99,999 | 65 (11.4%) | 187 (17.6%) |
| $100,000+ | 264 (46.4%) | 167 (15.8%) |
| Total | 569 (100.0%) | 1,060 (100.0%) |
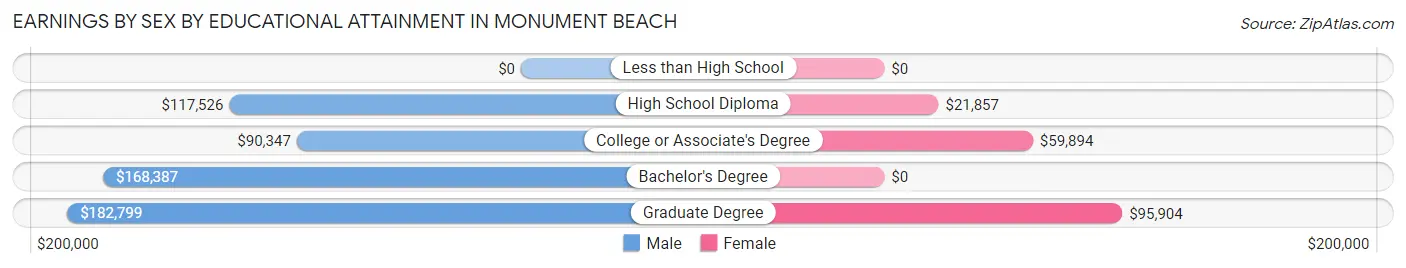
Earnings by Sex by Educational Attainment in Monument Beach
Average earnings in Monument Beach are $101,754 for men and $50,784 for women, a difference of 50.1%. Men with an educational attainment of graduate degree enjoy the highest average annual earnings of $182,799, while those with college or associate's degree education earn the least with $90,347. Women with an educational attainment of graduate degree earn the most with the average annual earnings of $95,904, while those with high school diploma education have the smallest earnings of $21,857.
| Educational Attainment | Male Income | Female Income |
| Less than High School | - | - |
| High School Diploma | $117,526 | $21,857 |
| College or Associate's Degree | $90,347 | $59,894 |
| Bachelor's Degree | $168,387 | $0 |
| Graduate Degree | $182,799 | $95,904 |
| Total | $101,754 | $50,784 |
Family Income in Monument Beach
Family Income Brackets in Monument Beach
According to the Monument Beach family income data, there are 240 families falling into the $200,000+ income range, which is the most common income bracket and makes up 31.5% of all families.
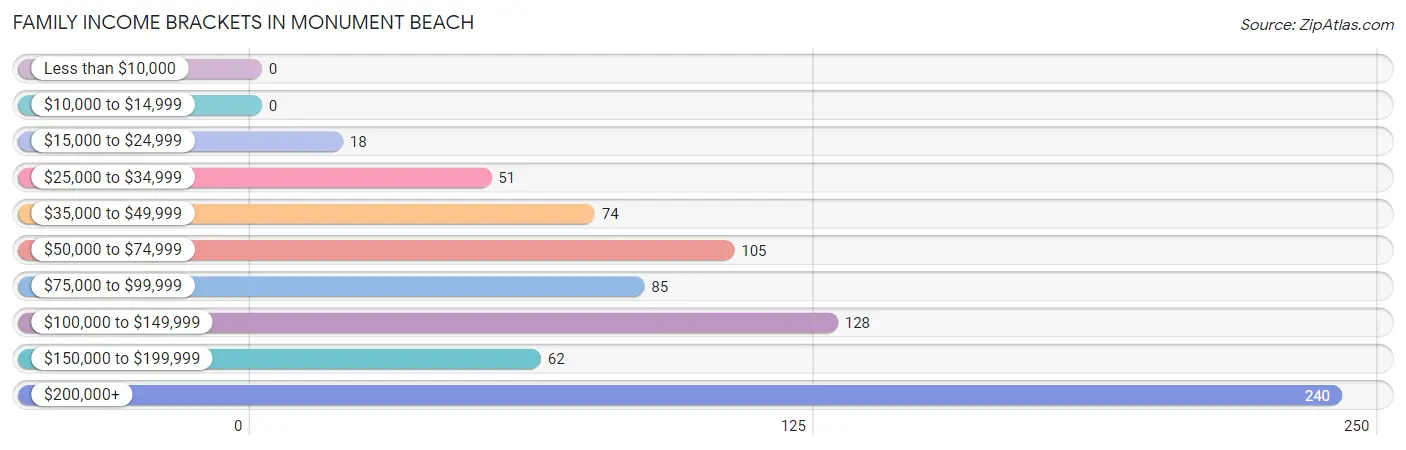
| Income Bracket | # Families | % Families |
| Less than $10,000 | 0 | 0.0% |
| $10,000 to $14,999 | 0 | 0.0% |
| $15,000 to $24,999 | 18 | 2.4% |
| $25,000 to $34,999 | 51 | 6.7% |
| $35,000 to $49,999 | 74 | 9.7% |
| $50,000 to $74,999 | 105 | 13.8% |
| $75,000 to $99,999 | 85 | 11.1% |
| $100,000 to $149,999 | 128 | 16.8% |
| $150,000 to $199,999 | 62 | 8.1% |
| $200,000+ | 240 | 31.5% |
Family Income by Famaliy Size in Monument Beach
2-person families (526 | 68.9%) account for the highest median family income in Monument Beach with $150,000 per family, while 2-person families (526 | 68.9%) have the highest median income of $75,000 per family member.
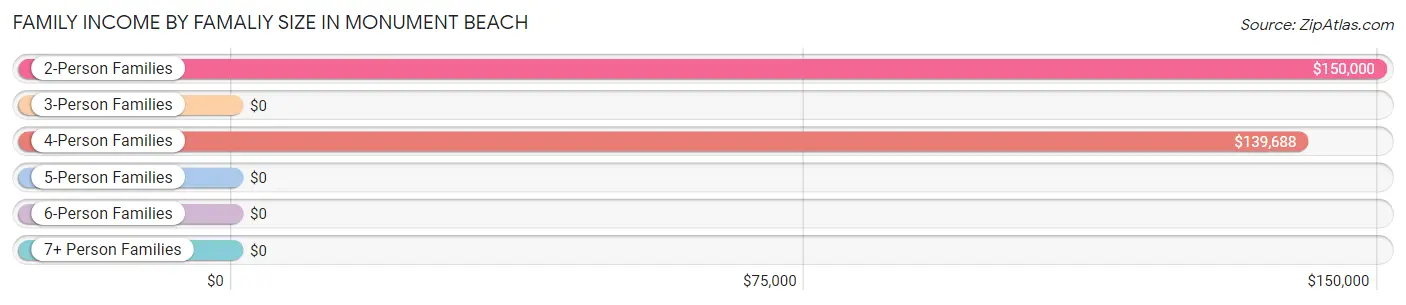
| Income Bracket | # Families | Median Income |
| 2-Person Families | 526 (68.9%) | $150,000 |
| 3-Person Families | 18 (2.4%) | $0 |
| 4-Person Families | 86 (11.3%) | $139,688 |
| 5-Person Families | 107 (14.0%) | $0 |
| 6-Person Families | 26 (3.4%) | $0 |
| 7+ Person Families | 0 (0.0%) | $0 |
| Total | 763 (100.0%) | $137,426 |
Family Income by Number of Earners in Monument Beach
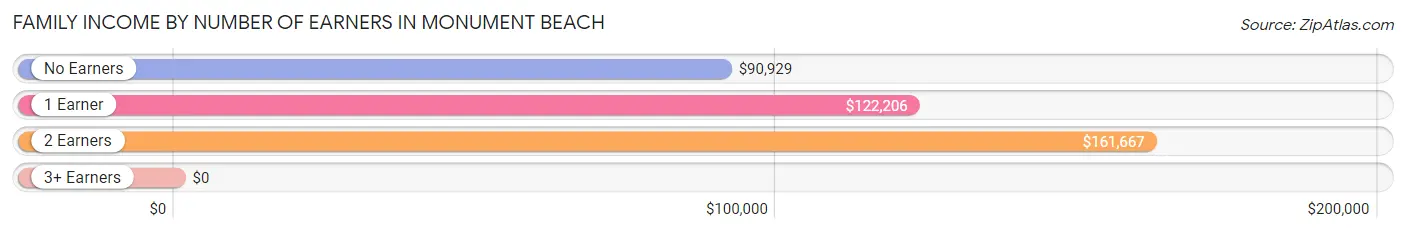
| Number of Earners | # Families | Median Income |
| No Earners | 165 (21.6%) | $90,929 |
| 1 Earner | 264 (34.6%) | $122,206 |
| 2 Earners | 262 (34.3%) | $161,667 |
| 3+ Earners | 72 (9.4%) | $0 |
| Total | 763 (100.0%) | $137,426 |
Household Income in Monument Beach
Household Income Brackets in Monument Beach
With 270 households falling in the category, the $200,000+ income range is the most frequent in Monument Beach, accounting for 20.6% of all households.
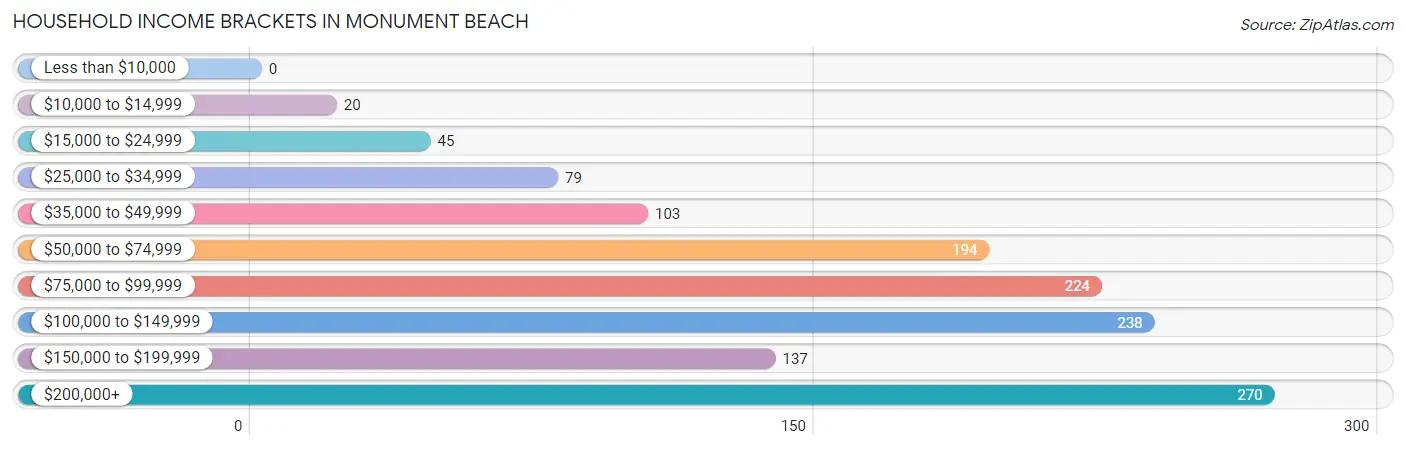
| Income Bracket | # Households | % Households |
| Less than $10,000 | 0 | 0.0% |
| $10,000 to $14,999 | 20 | 1.5% |
| $15,000 to $24,999 | 45 | 3.4% |
| $25,000 to $34,999 | 79 | 6.0% |
| $35,000 to $49,999 | 103 | 7.9% |
| $50,000 to $74,999 | 194 | 14.8% |
| $75,000 to $99,999 | 224 | 17.1% |
| $100,000 to $149,999 | 238 | 18.2% |
| $150,000 to $199,999 | 137 | 10.5% |
| $200,000+ | 270 | 20.6% |
Household Income by Householder Age in Monument Beach
The median household income in Monument Beach is $93,688, with the highest median household income of $147,798 found in the 45 to 64 years age bracket for the primary householder. A total of 483 households (36.9%) fall into this category.
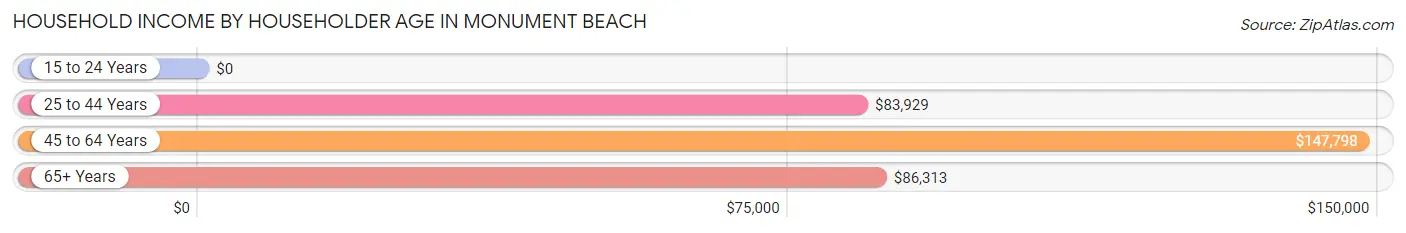
| Income Bracket | # Households | Median Income |
| 15 to 24 Years | 0 (0.0%) | $0 |
| 25 to 44 Years | 158 (12.1%) | $83,929 |
| 45 to 64 Years | 483 (36.9%) | $147,798 |
| 65+ Years | 668 (51.0%) | $86,313 |
| Total | 1,309 (100.0%) | $93,688 |
Poverty in Monument Beach
Income Below Poverty by Sex and Age in Monument Beach
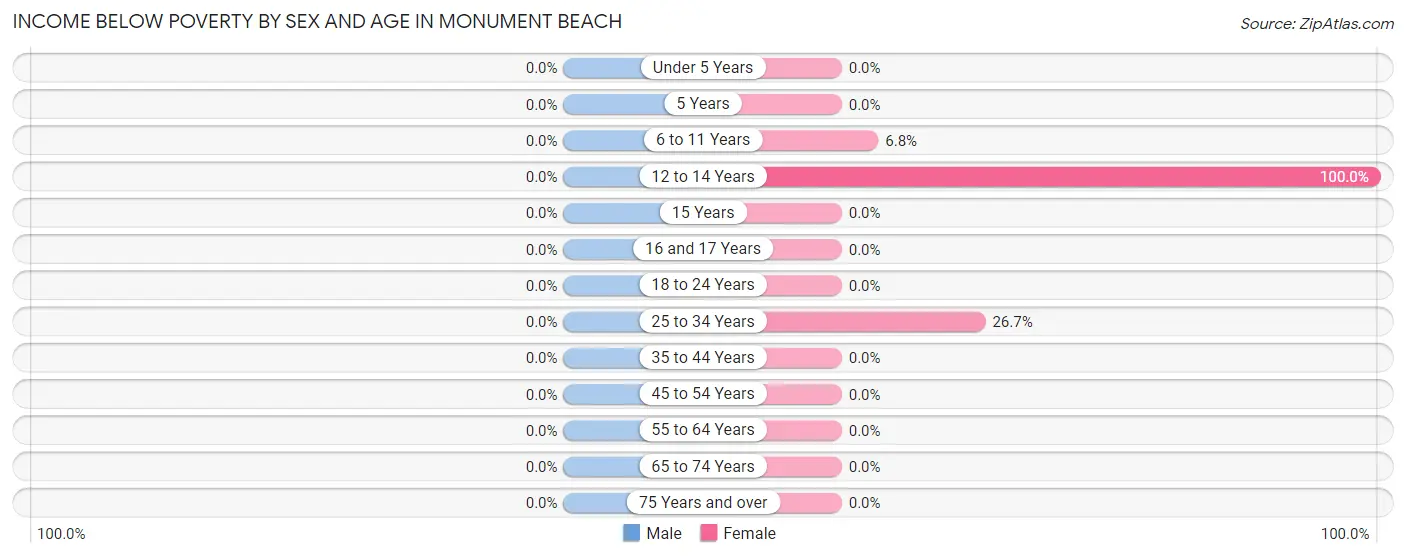
| Age Bracket | Male | Female |
| Under 5 Years | 0 (0.0%) | 0 (0.0%) |
| 5 Years | 0 (0.0%) | 0 (0.0%) |
| 6 to 11 Years | 0 (0.0%) | 18 (6.8%) |
| 12 to 14 Years | 0 (0.0%) | 17 (100.0%) |
| 15 Years | 0 (0.0%) | 0 (0.0%) |
| 16 and 17 Years | 0 (0.0%) | 0 (0.0%) |
| 18 to 24 Years | 0 (0.0%) | 0 (0.0%) |
| 25 to 34 Years | 0 (0.0%) | 52 (26.7%) |
| 35 to 44 Years | 0 (0.0%) | 0 (0.0%) |
| 45 to 54 Years | 0 (0.0%) | 0 (0.0%) |
| 55 to 64 Years | 0 (0.0%) | 0 (0.0%) |
| 65 to 74 Years | 0 (0.0%) | 0 (0.0%) |
| 75 Years and over | 0 (0.0%) | 0 (0.0%) |
| Total | 0 (0.0%) | 87 (4.7%) |
Income Above Poverty by Sex and Age in Monument Beach
According to the poverty statistics in Monument Beach, males aged under 5 years and females aged under 5 years are the age groups that are most secure financially, with 100.0% of males and 100.0% of females in these age groups living above the poverty line.
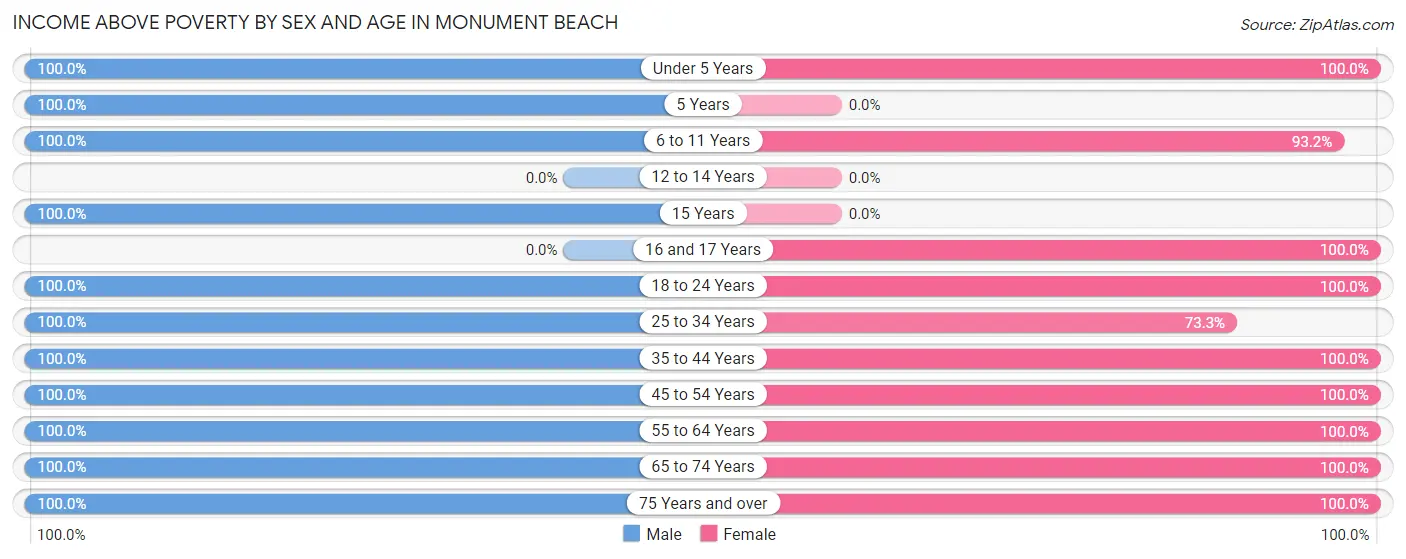
| Age Bracket | Male | Female |
| Under 5 Years | 61 (100.0%) | 82 (100.0%) |
| 5 Years | 30 (100.0%) | 0 (0.0%) |
| 6 to 11 Years | 108 (100.0%) | 247 (93.2%) |
| 12 to 14 Years | 0 (0.0%) | 0 (0.0%) |
| 15 Years | 31 (100.0%) | 0 (0.0%) |
| 16 and 17 Years | 0 (0.0%) | 29 (100.0%) |
| 18 to 24 Years | 128 (100.0%) | 125 (100.0%) |
| 25 to 34 Years | 81 (100.0%) | 143 (73.3%) |
| 35 to 44 Years | 19 (100.0%) | 70 (100.0%) |
| 45 to 54 Years | 166 (100.0%) | 298 (100.0%) |
| 55 to 64 Years | 104 (100.0%) | 201 (100.0%) |
| 65 to 74 Years | 278 (100.0%) | 431 (100.0%) |
| 75 Years and over | 161 (100.0%) | 144 (100.0%) |
| Total | 1,167 (100.0%) | 1,770 (95.3%) |
Income Below Poverty Among Married-Couple Families in Monument Beach
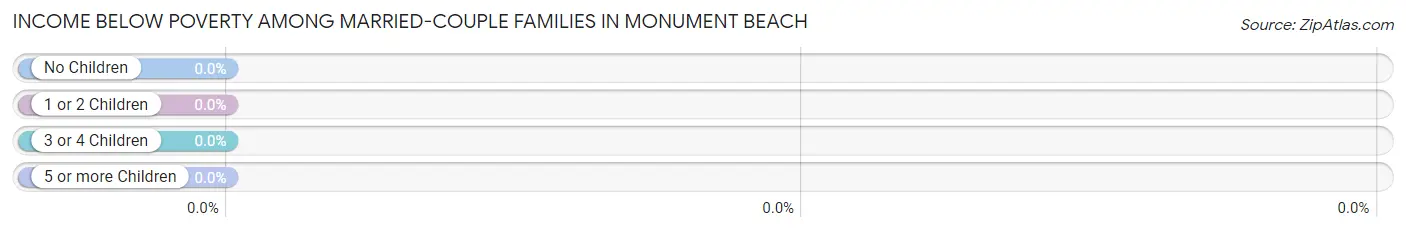
| Children | Above Poverty | Below Poverty |
| No Children | 513 (100.0%) | 0 (0.0%) |
| 1 or 2 Children | 47 (100.0%) | 0 (0.0%) |
| 3 or 4 Children | 59 (100.0%) | 0 (0.0%) |
| 5 or more Children | 0 (0.0%) | 0 (0.0%) |
| Total | 619 (100.0%) | 0 (0.0%) |
Income Below Poverty Among Single-Parent Households in Monument Beach
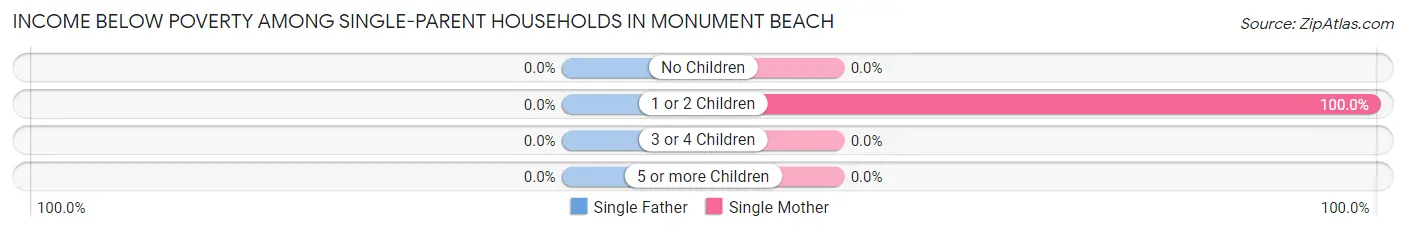
| Children | Single Father | Single Mother |
| No Children | 0 (0.0%) | 0 (0.0%) |
| 1 or 2 Children | 0 (0.0%) | 18 (100.0%) |
| 3 or 4 Children | 0 (0.0%) | 0 (0.0%) |
| 5 or more Children | 0 (0.0%) | 0 (0.0%) |
| Total | 0 (0.0%) | 18 (13.9%) |
Income Below Poverty Among Married-Couple vs Single-Parent Households in Monument Beach
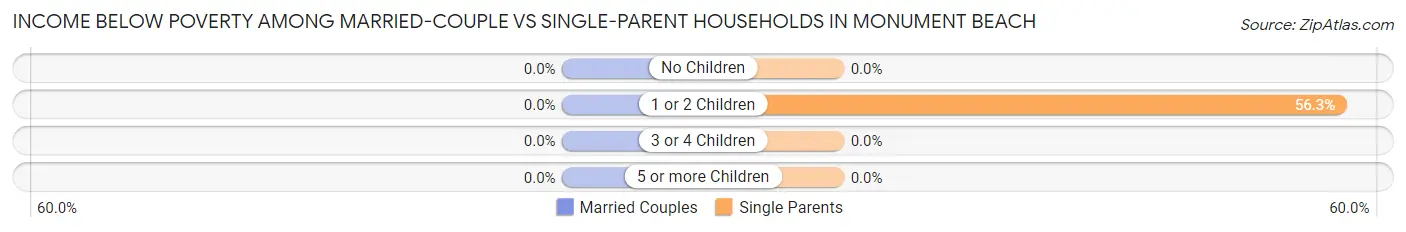
| Children | Married-Couple Families | Single-Parent Households |
| No Children | 0 (0.0%) | 0 (0.0%) |
| 1 or 2 Children | 0 (0.0%) | 18 (56.2%) |
| 3 or 4 Children | 0 (0.0%) | 0 (0.0%) |
| 5 or more Children | 0 (0.0%) | 0 (0.0%) |
| Total | 0 (0.0%) | 18 (12.5%) |
Race in Monument Beach
The most populous races in Monument Beach are White / Caucasian (2,537 | 83.9%), Some other Race (406 | 13.4%), and Two or more Races (46 | 1.5%).
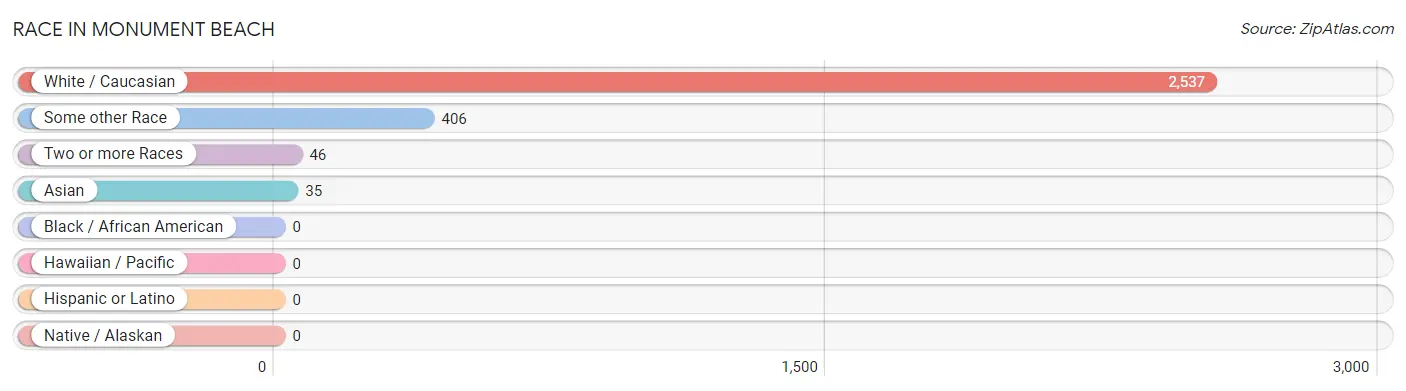
| Race | # Population | % Population |
| Asian | 35 | 1.2% |
| Black / African American | 0 | 0.0% |
| Hawaiian / Pacific | 0 | 0.0% |
| Hispanic or Latino | 0 | 0.0% |
| Native / Alaskan | 0 | 0.0% |
| White / Caucasian | 2,537 | 83.9% |
| Two or more Races | 46 | 1.5% |
| Some other Race | 406 | 13.4% |
| Total | 3,024 | 100.0% |
Ancestry in Monument Beach
The most populous ancestries reported in Monument Beach are Irish (1,220 | 40.3%), English (490 | 16.2%), German (407 | 13.5%), Cape Verdean (406 | 13.4%), and Subsaharan African (406 | 13.4%), together accounting for 96.9% of all Monument Beach residents.
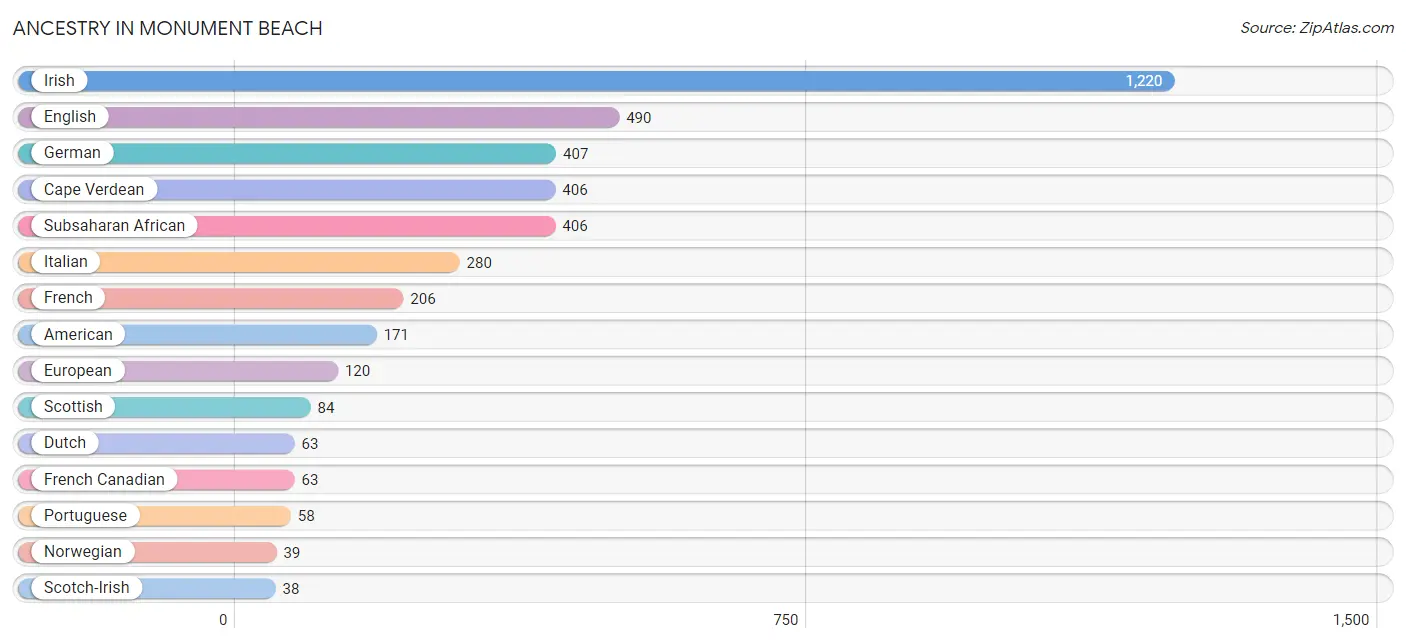
| Ancestry | # Population | % Population |
| American | 171 | 5.7% |
| Austrian | 19 | 0.6% |
| British | 15 | 0.5% |
| Canadian | 21 | 0.7% |
| Cape Verdean | 406 | 13.4% |
| Czech | 14 | 0.5% |
| Czechoslovakian | 36 | 1.2% |
| Dutch | 63 | 2.1% |
| English | 490 | 16.2% |
| European | 120 | 4.0% |
| French | 206 | 6.8% |
| French Canadian | 63 | 2.1% |
| German | 407 | 13.5% |
| Indian (Asian) | 35 | 1.2% |
| Irish | 1,220 | 40.3% |
| Italian | 280 | 9.3% |
| Norwegian | 39 | 1.3% |
| Portuguese | 58 | 1.9% |
| Russian | 32 | 1.1% |
| Scandinavian | 15 | 0.5% |
| Scotch-Irish | 38 | 1.3% |
| Scottish | 84 | 2.8% |
| Subsaharan African | 406 | 13.4% |
| Swedish | 15 | 0.5% |
| Ukrainian | 15 | 0.5% | View All 25 Rows |
Immigrants in Monument Beach
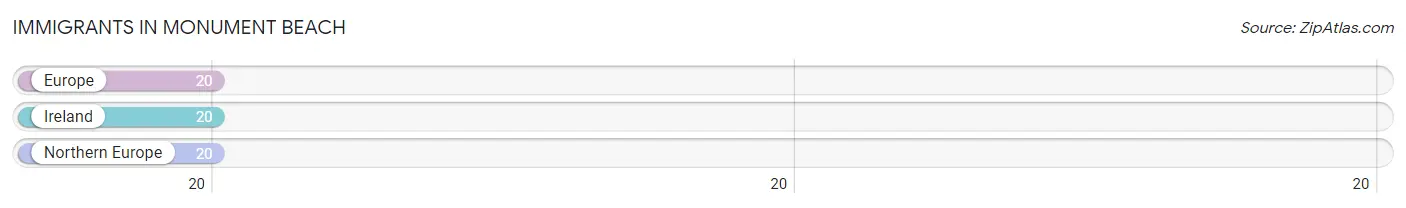
The most numerous immigrant groups reported in Monument Beach came from Europe (20 | 0.7%), Ireland (20 | 0.7%), and Northern Europe (20 | 0.7%), together accounting for 2.0% of all Monument Beach residents.
| Immigration Origin | # Population | % Population |
| Europe | 20 | 0.7% |
| Ireland | 20 | 0.7% |
| Northern Europe | 20 | 0.7% | View All 3 Rows |
Sex and Age in Monument Beach
Sex and Age in Monument Beach
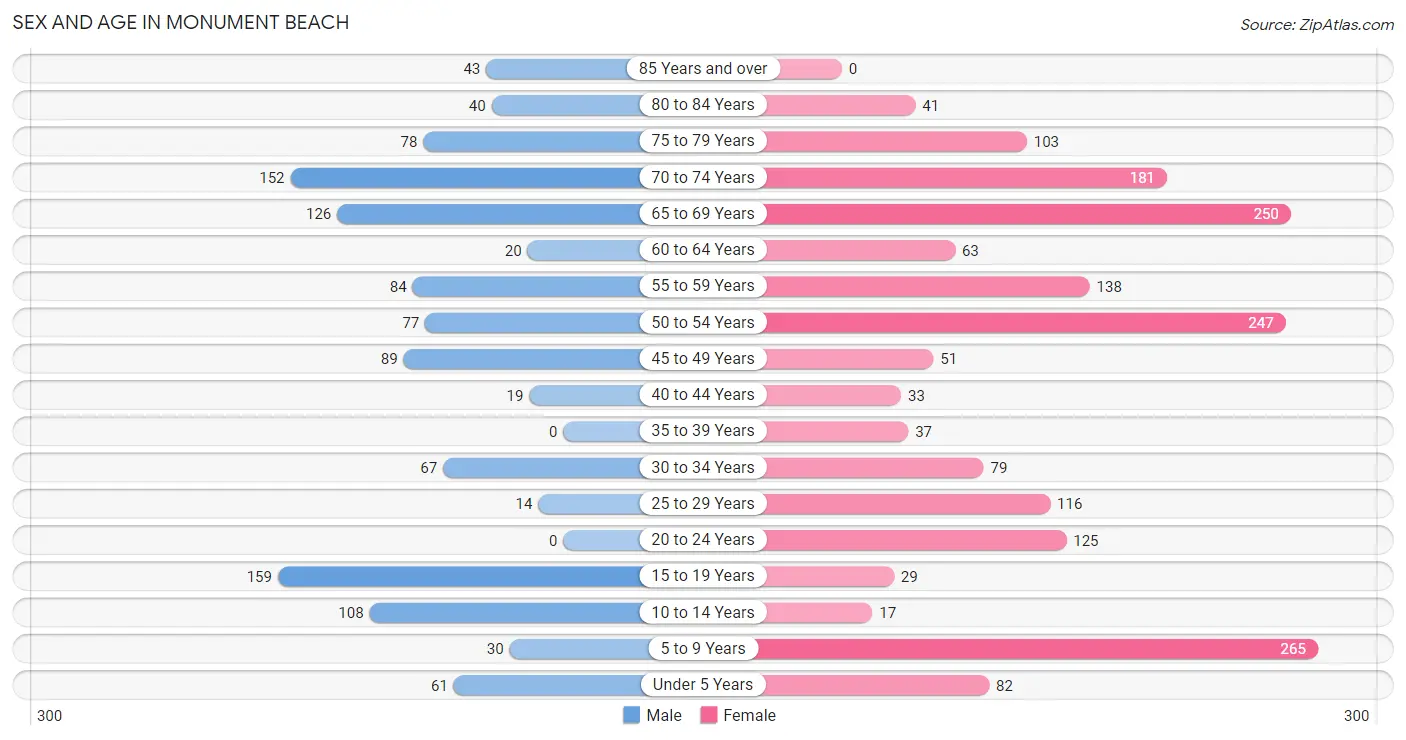
The most populous age groups in Monument Beach are 15 to 19 Years (159 | 13.6%) for men and 5 to 9 Years (265 | 14.3%) for women.
| Age Bracket | Male | Female |
| Under 5 Years | 61 (5.2%) | 82 (4.4%) |
| 5 to 9 Years | 30 (2.6%) | 265 (14.3%) |
| 10 to 14 Years | 108 (9.2%) | 17 (0.9%) |
| 15 to 19 Years | 159 (13.6%) | 29 (1.6%) |
| 20 to 24 Years | 0 (0.0%) | 125 (6.7%) |
| 25 to 29 Years | 14 (1.2%) | 116 (6.2%) |
| 30 to 34 Years | 67 (5.7%) | 79 (4.3%) |
| 35 to 39 Years | 0 (0.0%) | 37 (2.0%) |
| 40 to 44 Years | 19 (1.6%) | 33 (1.8%) |
| 45 to 49 Years | 89 (7.6%) | 51 (2.8%) |
| 50 to 54 Years | 77 (6.6%) | 247 (13.3%) |
| 55 to 59 Years | 84 (7.2%) | 138 (7.4%) |
| 60 to 64 Years | 20 (1.7%) | 63 (3.4%) |
| 65 to 69 Years | 126 (10.8%) | 250 (13.5%) |
| 70 to 74 Years | 152 (13.0%) | 181 (9.8%) |
| 75 to 79 Years | 78 (6.7%) | 103 (5.6%) |
| 80 to 84 Years | 40 (3.4%) | 41 (2.2%) |
| 85 Years and over | 43 (3.7%) | 0 (0.0%) |
| Total | 1,167 (100.0%) | 1,857 (100.0%) |
Families and Households in Monument Beach
Median Family Size in Monument Beach
The median family size in Monument Beach is 3.13 persons per family, with single female/mother families (130 | 17.0%) accounting for the largest median family size of 4.48 persons per family. On the other hand, single male/father families (14 | 1.8%) represent the smallest median family size with 1.93 persons per family.
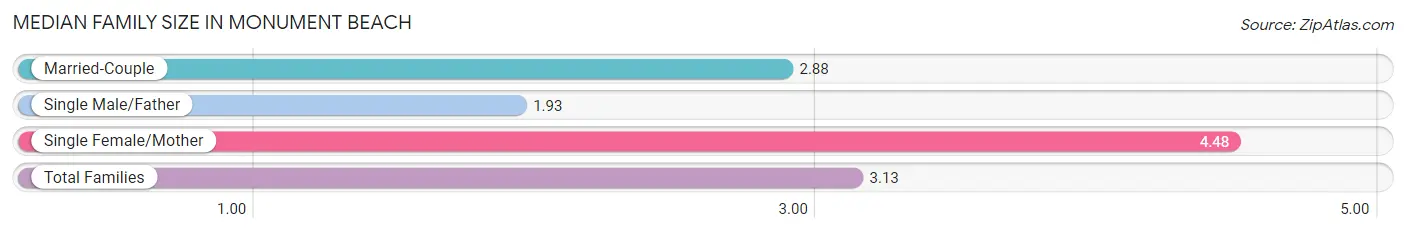
| Family Type | # Families | Family Size |
| Married-Couple | 619 (81.1%) | 2.88 |
| Single Male/Father | 14 (1.8%) | 1.93 |
| Single Female/Mother | 130 (17.0%) | 4.48 |
| Total Families | 763 (100.0%) | 3.13 |
Median Household Size in Monument Beach
The median household size in Monument Beach is 2.31 persons per household, with single female/mother households (130 | 9.9%) accounting for the largest median household size of 4.77 persons per household. non-family households (546 | 41.7%) represent the smallest median household size with 1.07 persons per household.
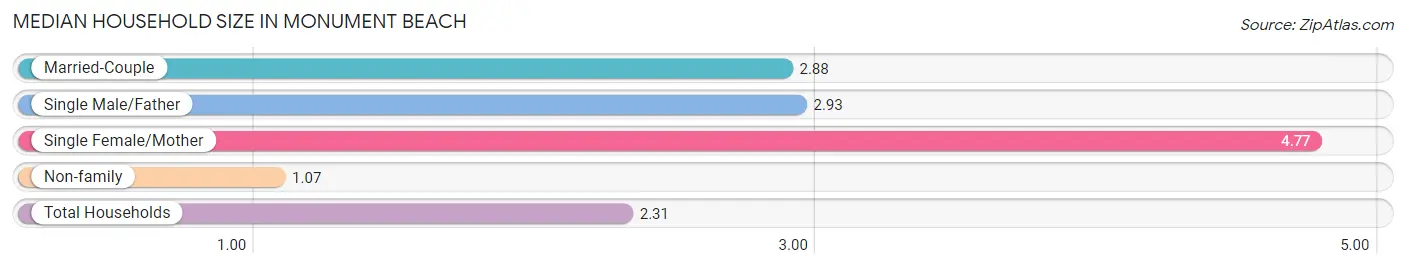
| Household Type | # Households | Household Size |
| Married-Couple | 619 (47.3%) | 2.88 |
| Single Male/Father | 14 (1.1%) | 2.93 |
| Single Female/Mother | 130 (9.9%) | 4.77 |
| Non-family | 546 (41.7%) | 1.07 |
| Total Households | 1,309 (100.0%) | 2.31 |
Household Size by Marriage Status in Monument Beach
Out of a total of 1,309 households in Monument Beach, 763 (58.3%) are family households, while 546 (41.7%) are nonfamily households. The most numerous type of family households are 2-person households, comprising 495, and the most common type of nonfamily households are 1-person households, comprising 506.
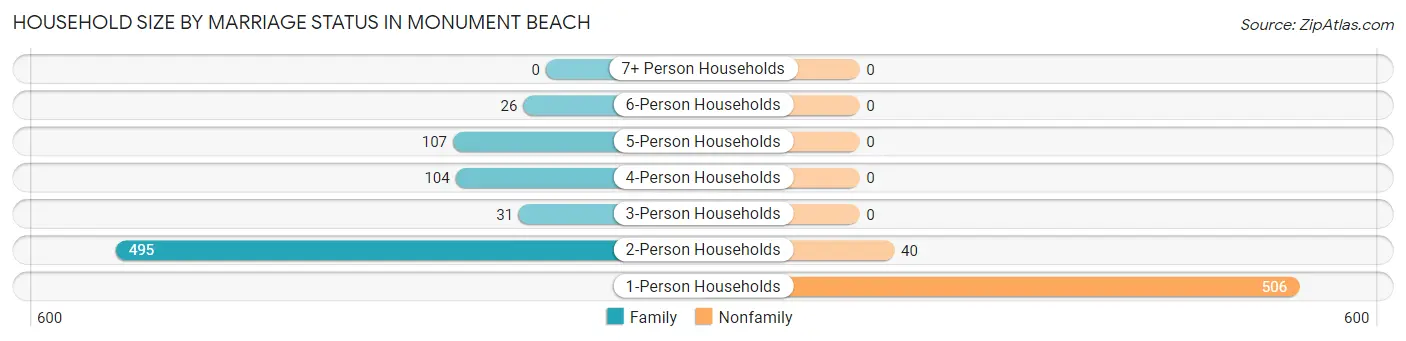
| Household Size | Family Households | Nonfamily Households |
| 1-Person Households | - | 506 (38.7%) |
| 2-Person Households | 495 (37.8%) | 40 (3.1%) |
| 3-Person Households | 31 (2.4%) | 0 (0.0%) |
| 4-Person Households | 104 (7.9%) | 0 (0.0%) |
| 5-Person Households | 107 (8.2%) | 0 (0.0%) |
| 6-Person Households | 26 (2.0%) | 0 (0.0%) |
| 7+ Person Households | 0 (0.0%) | 0 (0.0%) |
| Total | 763 (58.3%) | 546 (41.7%) |
Female Fertility in Monument Beach
Fertility by Age in Monument Beach
Average fertility rate in Monument Beach is 75.0 births per 1,000 women. Women in the age bracket of 35 to 50 years have the highest fertility rate with 257.0 births per 1,000 women. Women in the age bracket of 35 to 50 years acount for 100.0% of all women with births.
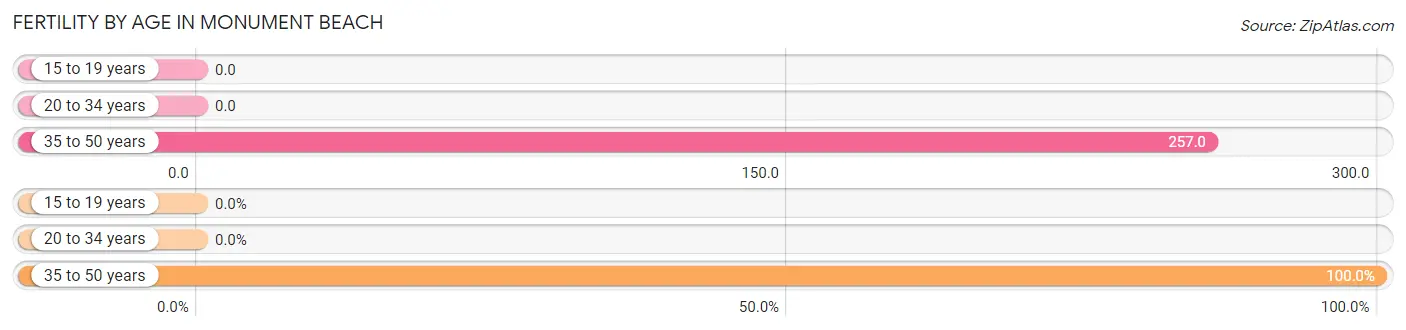
| Age Bracket | Women with Births | Births / 1,000 Women |
| 15 to 19 years | 0 (0.0%) | 0.0 |
| 20 to 34 years | 0 (0.0%) | 0.0 |
| 35 to 50 years | 37 (100.0%) | 257.0 |
| Total | 37 (100.0%) | 75.0 |
Fertility by Age by Marriage Status in Monument Beach
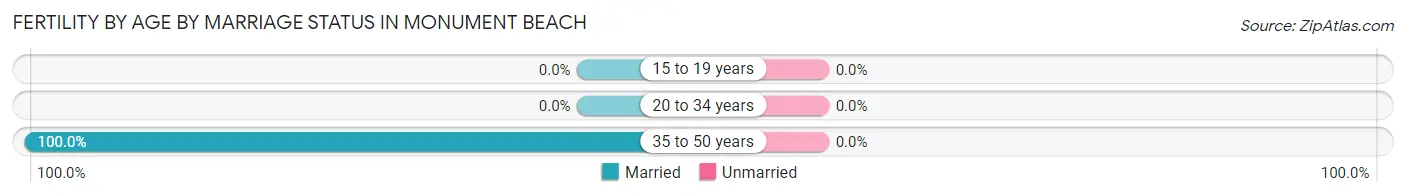
| Age Bracket | Married | Unmarried |
| 15 to 19 years | 0 (0.0%) | 0 (0.0%) |
| 20 to 34 years | 0 (0.0%) | 0 (0.0%) |
| 35 to 50 years | 37 (100.0%) | 0 (0.0%) |
| Total | 37 (100.0%) | 0 (0.0%) |
Fertility by Education in Monument Beach
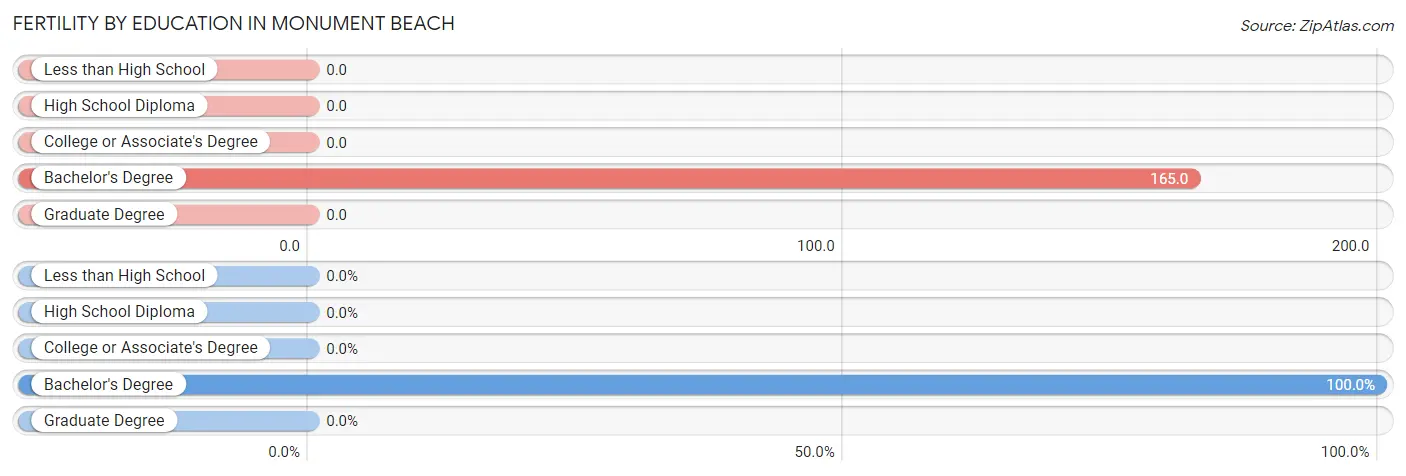
| Educational Attainment | Women with Births | Births / 1,000 Women |
| Less than High School | 0 (0.0%) | 0.0 |
| High School Diploma | 0 (0.0%) | 0.0 |
| College or Associate's Degree | 0 (0.0%) | 0.0 |
| Bachelor's Degree | 37 (100.0%) | 165.0 |
| Graduate Degree | 0 (0.0%) | 0.0 |
| Total | 37 (100.0%) | 75.0 |
Fertility by Education by Marriage Status in Monument Beach
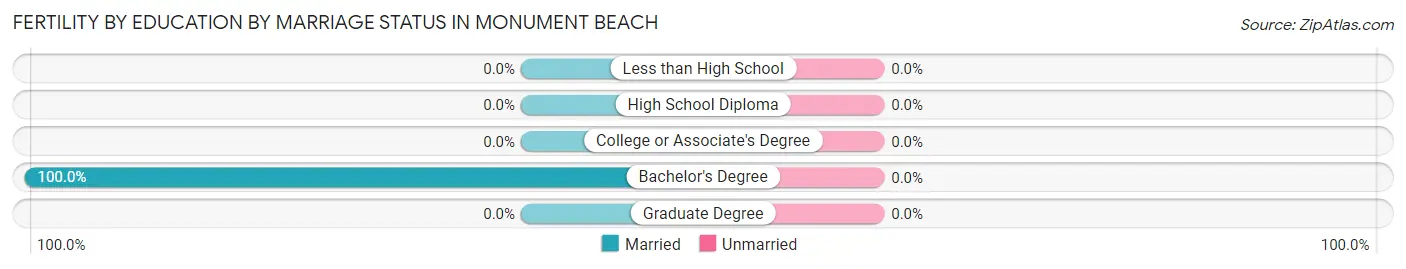
| Educational Attainment | Married | Unmarried |
| Less than High School | 0 (0.0%) | 0 (0.0%) |
| High School Diploma | 0 (0.0%) | 0 (0.0%) |
| College or Associate's Degree | 0 (0.0%) | 0 (0.0%) |
| Bachelor's Degree | 37 (100.0%) | 0 (0.0%) |
| Graduate Degree | 0 (0.0%) | 0 (0.0%) |
| Total | 37 (100.0%) | 0 (0.0%) |
Employment Characteristics in Monument Beach
Employment by Class of Employer in Monument Beach
Among the 1,472 employed individuals in Monument Beach, private company employees (918 | 62.4%), not-for-profit organizations (206 | 14.0%), and self-employed (incorporated) (96 | 6.5%) make up the most common classes of employment.
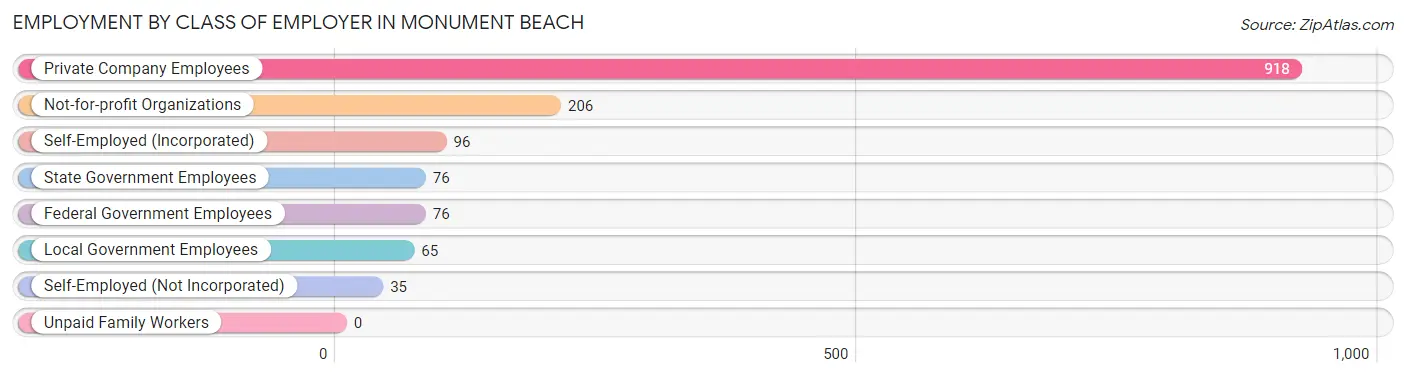
| Employer Class | # Employees | % Employees |
| Private Company Employees | 918 | 62.4% |
| Self-Employed (Incorporated) | 96 | 6.5% |
| Self-Employed (Not Incorporated) | 35 | 2.4% |
| Not-for-profit Organizations | 206 | 14.0% |
| Local Government Employees | 65 | 4.4% |
| State Government Employees | 76 | 5.2% |
| Federal Government Employees | 76 | 5.2% |
| Unpaid Family Workers | 0 | 0.0% |
| Total | 1,472 | 100.0% |
Employment Status by Age in Monument Beach
According to the labor force statistics for Monument Beach, out of the total population over 16 years of age (2,430), 64.8% or 1,575 individuals are in the labor force, with 2.2% or 35 of them unemployed. The age group with the highest labor force participation rate is 16 to 19 years, with 100.0% or 157 individuals in the labor force. Within the labor force, the 65 to 74 years age range has the highest percentage of unemployed individuals, with 11.7% or 34 of them being unemployed.
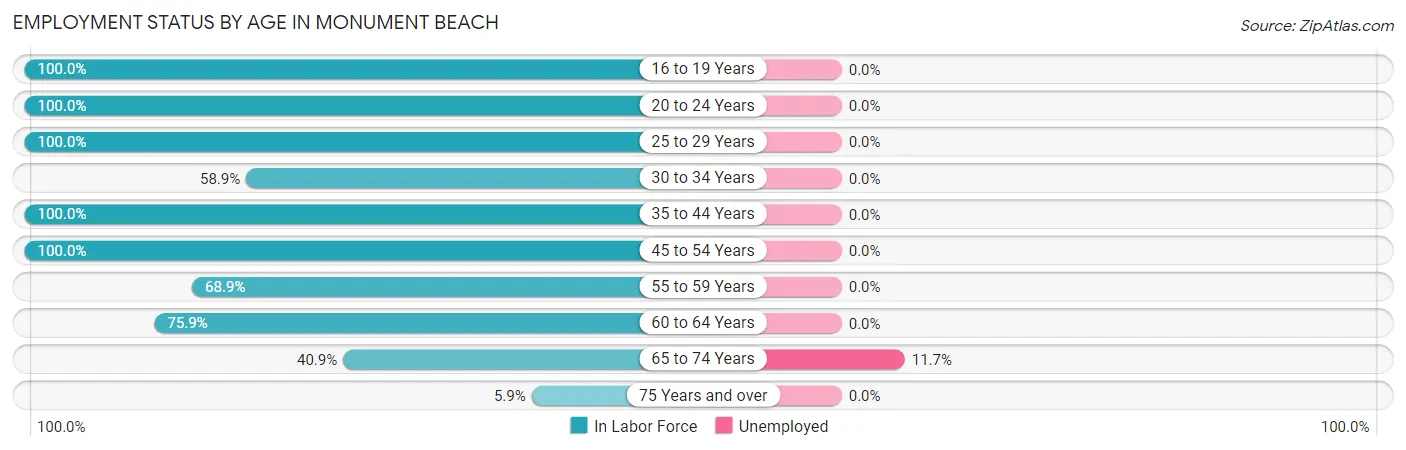
| Age Bracket | In Labor Force | Unemployed |
| 16 to 19 Years | 157 (100.0%) | 0 (0.0%) |
| 20 to 24 Years | 125 (100.0%) | 0 (0.0%) |
| 25 to 29 Years | 130 (100.0%) | 0 (0.0%) |
| 30 to 34 Years | 86 (58.9%) | 0 (0.0%) |
| 35 to 44 Years | 89 (100.0%) | 0 (0.0%) |
| 45 to 54 Years | 464 (100.0%) | 0 (0.0%) |
| 55 to 59 Years | 153 (68.9%) | 0 (0.0%) |
| 60 to 64 Years | 63 (75.9%) | 0 (0.0%) |
| 65 to 74 Years | 290 (40.9%) | 34 (11.7%) |
| 75 Years and over | 18 (5.9%) | 0 (0.0%) |
| Total | 1,575 (64.8%) | 35 (2.2%) |
Employment Status by Educational Attainment in Monument Beach
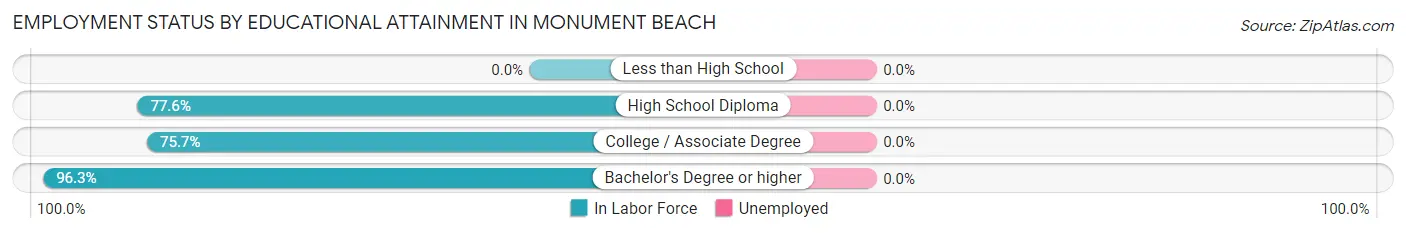
| Educational Attainment | In Labor Force | Unemployed |
| Less than High School | 0 (0.0%) | 0 (0.0%) |
| High School Diploma | 118 (77.6%) | 0 (0.0%) |
| College / Associate Degree | 290 (75.7%) | 0 (0.0%) |
| Bachelor's Degree or higher | 577 (96.3%) | 0 (0.0%) |
| Total | 985 (86.9%) | 0 (0.0%) |
Employment Occupations by Sex in Monument Beach
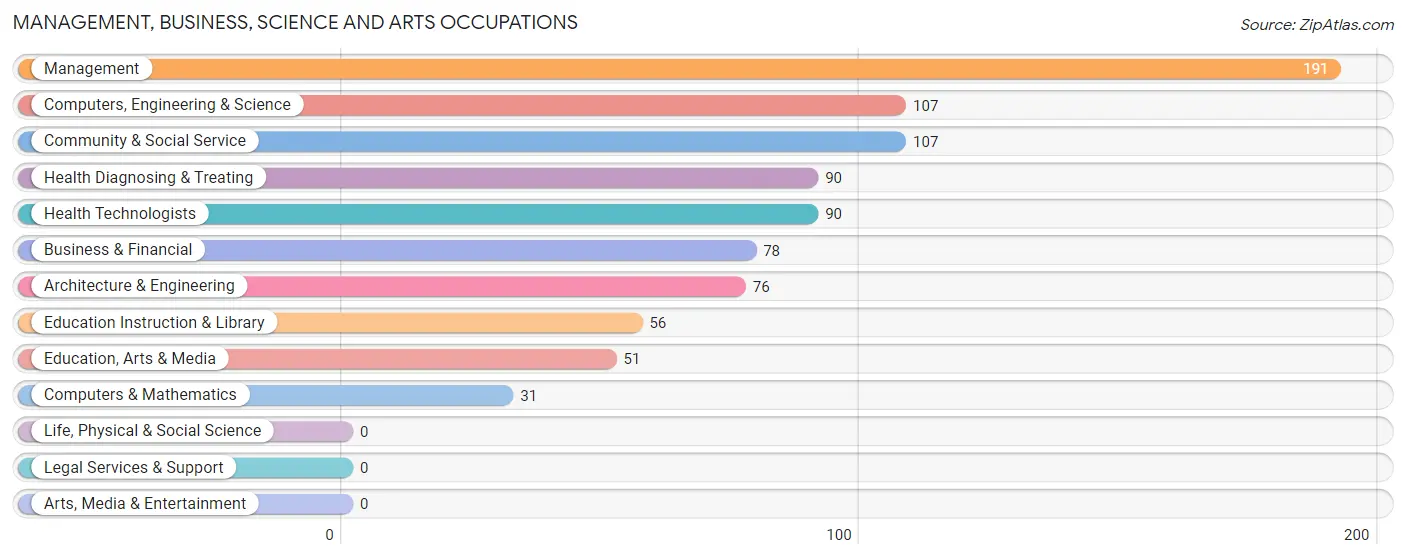
Management, Business, Science and Arts Occupations
The most common Management, Business, Science and Arts occupations in Monument Beach are Management (191 | 12.4%), Computers, Engineering & Science (107 | 6.9%), Community & Social Service (107 | 6.9%), Health Diagnosing & Treating (90 | 5.8%), and Health Technologists (90 | 5.8%).
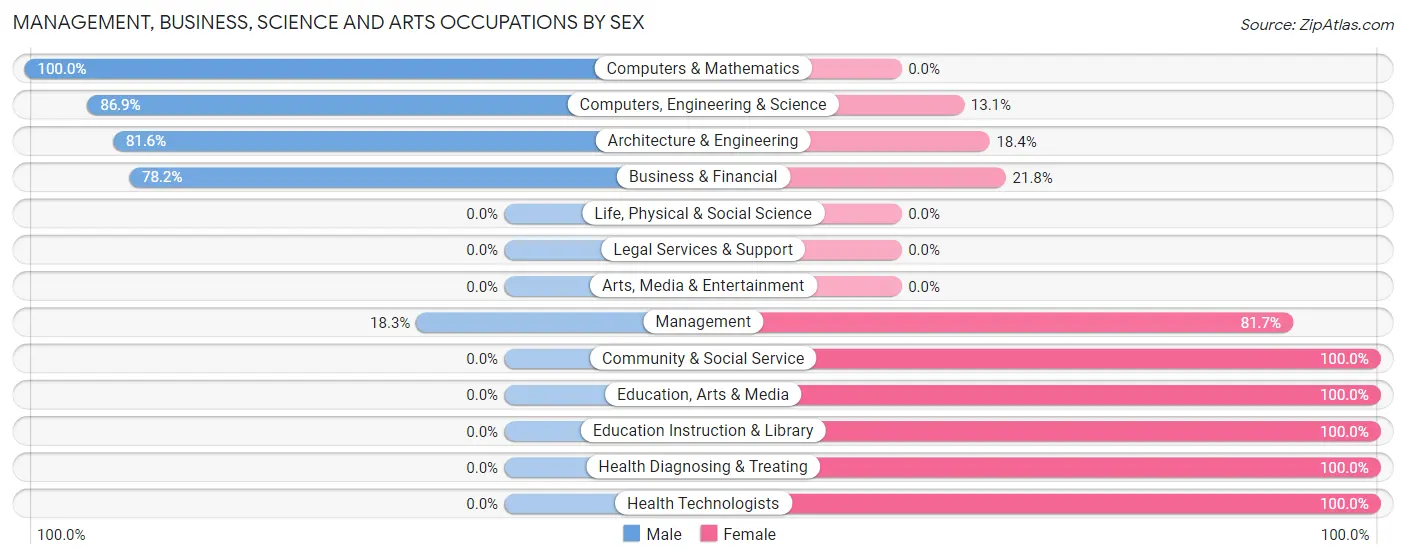
Management, Business, Science and Arts Occupations by Sex
Within the Management, Business, Science and Arts occupations in Monument Beach, the most male-oriented occupations are Computers & Mathematics (100.0%), Computers, Engineering & Science (86.9%), and Architecture & Engineering (81.6%), while the most female-oriented occupations are Community & Social Service (100.0%), Education, Arts & Media (100.0%), and Education Instruction & Library (100.0%).
| Occupation | Male | Female |
| Management | 35 (18.3%) | 156 (81.7%) |
| Business & Financial | 61 (78.2%) | 17 (21.8%) |
| Computers, Engineering & Science | 93 (86.9%) | 14 (13.1%) |
| Computers & Mathematics | 31 (100.0%) | 0 (0.0%) |
| Architecture & Engineering | 62 (81.6%) | 14 (18.4%) |
| Life, Physical & Social Science | 0 (0.0%) | 0 (0.0%) |
| Community & Social Service | 0 (0.0%) | 107 (100.0%) |
| Education, Arts & Media | 0 (0.0%) | 51 (100.0%) |
| Legal Services & Support | 0 (0.0%) | 0 (0.0%) |
| Education Instruction & Library | 0 (0.0%) | 56 (100.0%) |
| Arts, Media & Entertainment | 0 (0.0%) | 0 (0.0%) |
| Health Diagnosing & Treating | 0 (0.0%) | 90 (100.0%) |
| Health Technologists | 0 (0.0%) | 90 (100.0%) |
| Total (Category) | 189 (33.0%) | 384 (67.0%) |
| Total (Overall) | 515 (33.4%) | 1,026 (66.6%) |
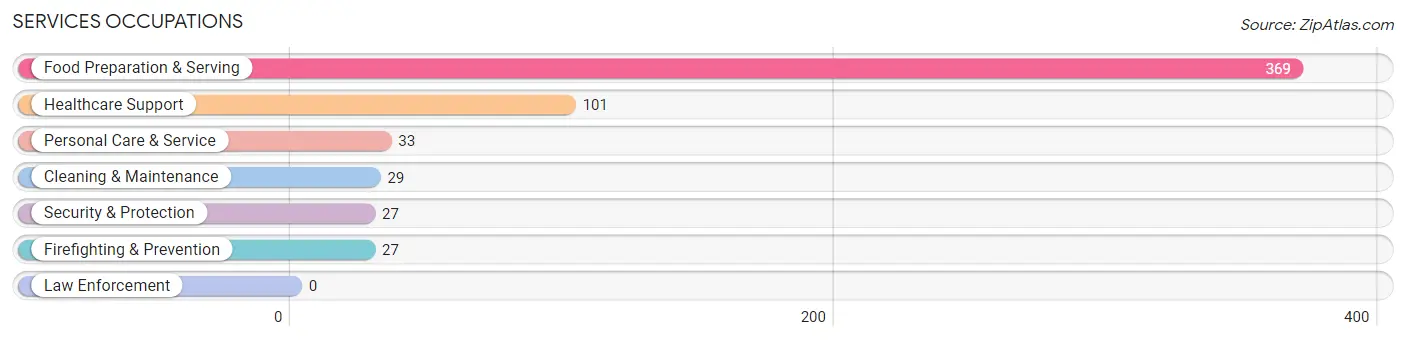
Services Occupations
The most common Services occupations in Monument Beach are Food Preparation & Serving (369 | 23.9%), Healthcare Support (101 | 6.6%), Personal Care & Service (33 | 2.1%), Cleaning & Maintenance (29 | 1.9%), and Security & Protection (27 | 1.8%).
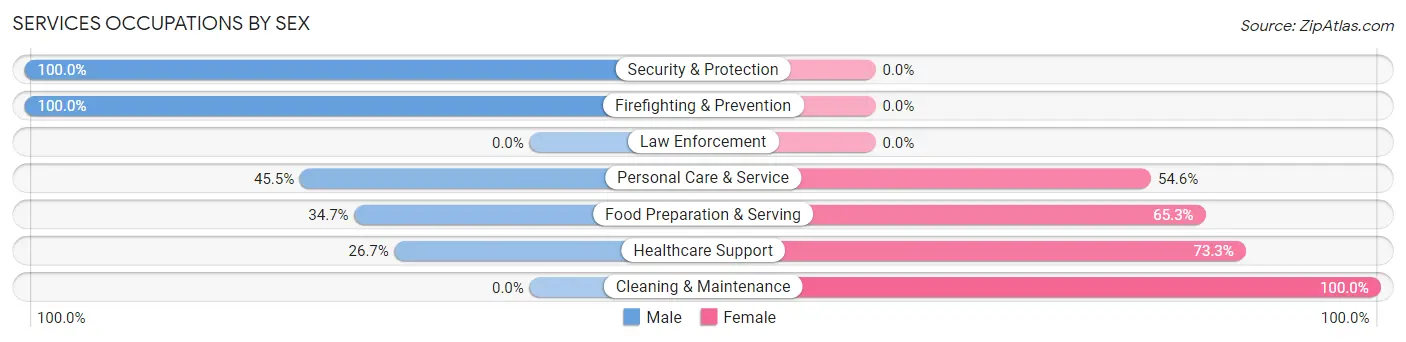
Services Occupations by Sex
Within the Services occupations in Monument Beach, the most male-oriented occupations are Security & Protection (100.0%), Firefighting & Prevention (100.0%), and Personal Care & Service (45.5%), while the most female-oriented occupations are Cleaning & Maintenance (100.0%), Healthcare Support (73.3%), and Food Preparation & Serving (65.3%).
| Occupation | Male | Female |
| Healthcare Support | 27 (26.7%) | 74 (73.3%) |
| Security & Protection | 27 (100.0%) | 0 (0.0%) |
| Firefighting & Prevention | 27 (100.0%) | 0 (0.0%) |
| Law Enforcement | 0 (0.0%) | 0 (0.0%) |
| Food Preparation & Serving | 128 (34.7%) | 241 (65.3%) |
| Cleaning & Maintenance | 0 (0.0%) | 29 (100.0%) |
| Personal Care & Service | 15 (45.5%) | 18 (54.5%) |
| Total (Category) | 197 (35.2%) | 362 (64.8%) |
| Total (Overall) | 515 (33.4%) | 1,026 (66.6%) |
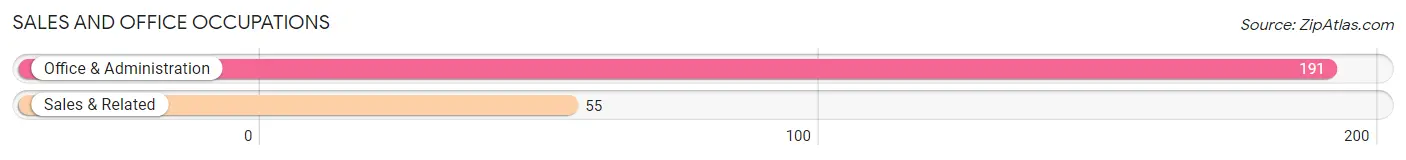
Sales and Office Occupations
The most common Sales and Office occupations in Monument Beach are Office & Administration (191 | 12.4%), and Sales & Related (55 | 3.6%).
Sales and Office Occupations by Sex
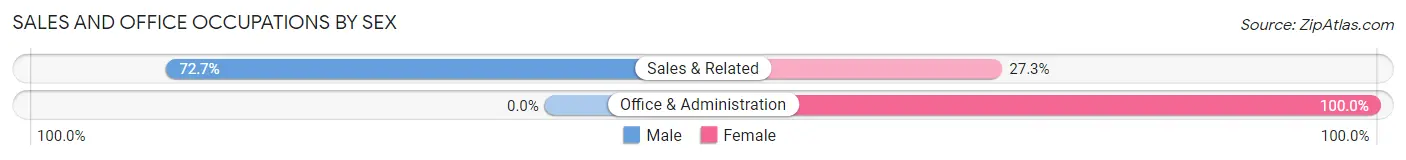
| Occupation | Male | Female |
| Sales & Related | 40 (72.7%) | 15 (27.3%) |
| Office & Administration | 0 (0.0%) | 191 (100.0%) |
| Total (Category) | 40 (16.3%) | 206 (83.7%) |
| Total (Overall) | 515 (33.4%) | 1,026 (66.6%) |
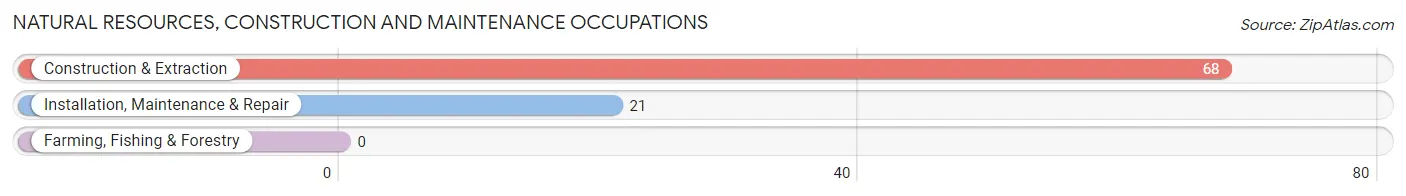
Natural Resources, Construction and Maintenance Occupations
The most common Natural Resources, Construction and Maintenance occupations in Monument Beach are Construction & Extraction (68 | 4.4%), and Installation, Maintenance & Repair (21 | 1.4%).
Natural Resources, Construction and Maintenance Occupations by Sex
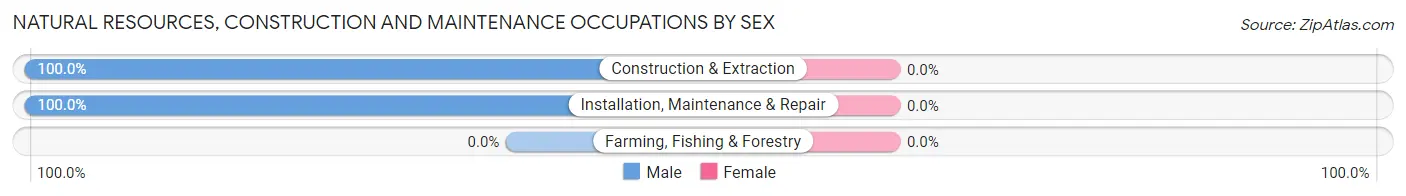
| Occupation | Male | Female |
| Farming, Fishing & Forestry | 0 (0.0%) | 0 (0.0%) |
| Construction & Extraction | 68 (100.0%) | 0 (0.0%) |
| Installation, Maintenance & Repair | 21 (100.0%) | 0 (0.0%) |
| Total (Category) | 89 (100.0%) | 0 (0.0%) |
| Total (Overall) | 515 (33.4%) | 1,026 (66.6%) |
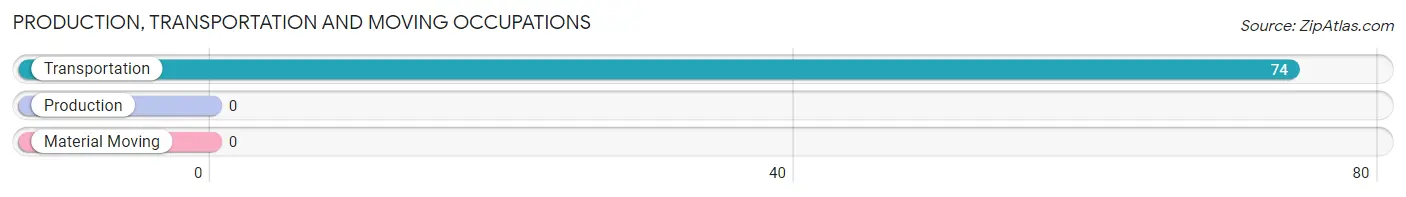
Production, Transportation and Moving Occupations
The most common Production, Transportation and Moving occupations in Monument Beach are , and Transportation (74 | 4.8%).
Production, Transportation and Moving Occupations by Sex
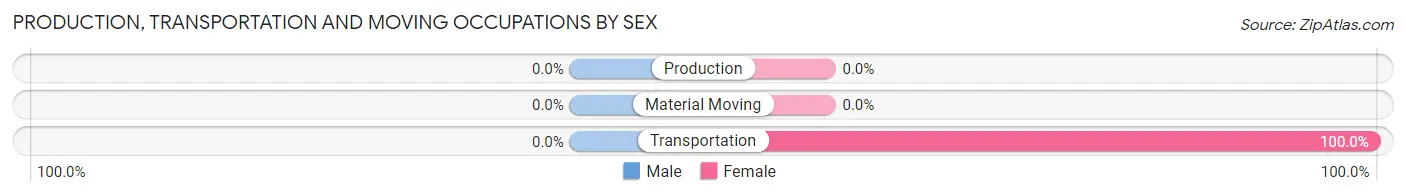
| Occupation | Male | Female |
| Production | 0 (0.0%) | 0 (0.0%) |
| Transportation | 0 (0.0%) | 74 (100.0%) |
| Material Moving | 0 (0.0%) | 0 (0.0%) |
| Total (Category) | 0 (0.0%) | 74 (100.0%) |
| Total (Overall) | 515 (33.4%) | 1,026 (66.6%) |
Employment Industries by Sex in Monument Beach
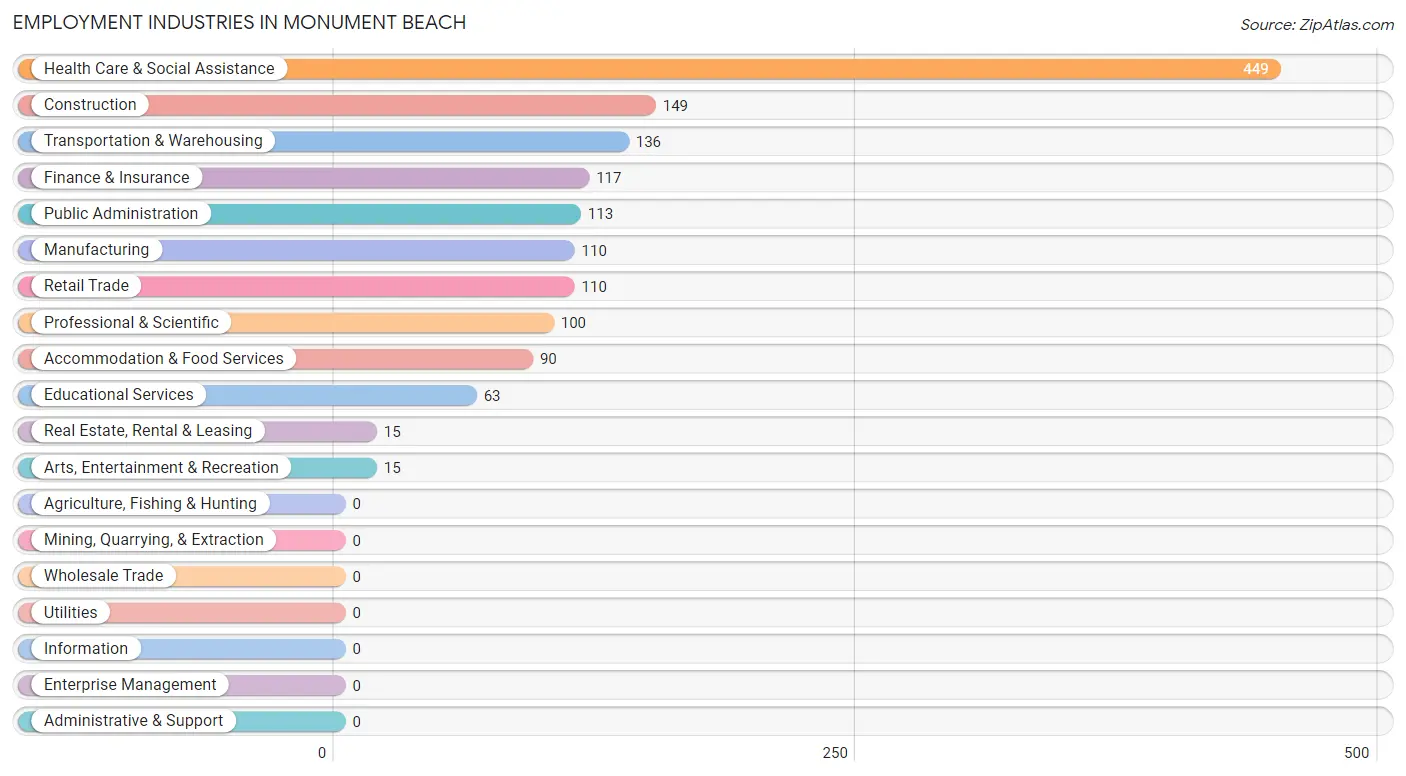
Employment Industries in Monument Beach
The major employment industries in Monument Beach include Health Care & Social Assistance (449 | 29.1%), Construction (149 | 9.7%), Transportation & Warehousing (136 | 8.8%), Finance & Insurance (117 | 7.6%), and Public Administration (113 | 7.3%).
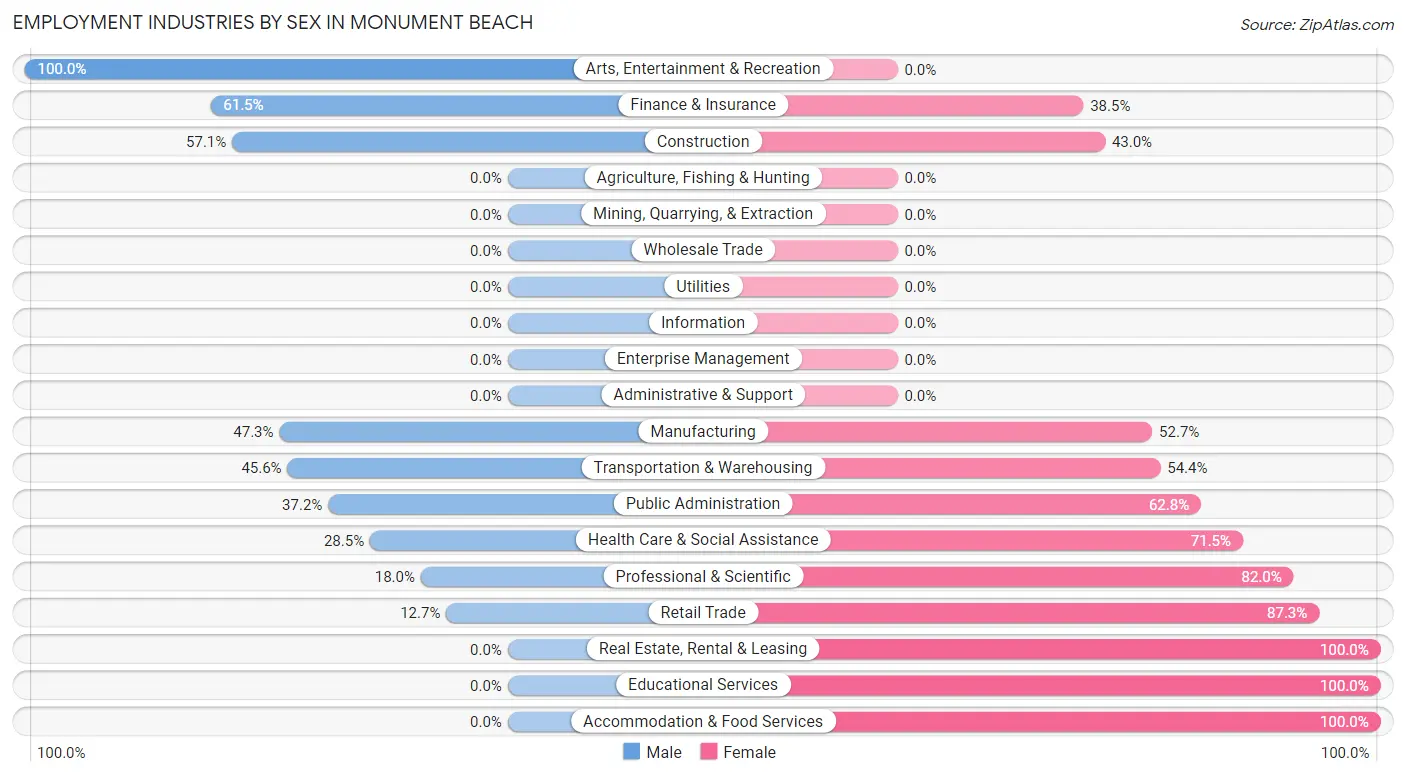
Employment Industries by Sex in Monument Beach
The Monument Beach industries that see more men than women are Arts, Entertainment & Recreation (100.0%), Finance & Insurance (61.5%), and Construction (57.1%), whereas the industries that tend to have a higher number of women are Real Estate, Rental & Leasing (100.0%), Educational Services (100.0%), and Accommodation & Food Services (100.0%).
| Industry | Male | Female |
| Agriculture, Fishing & Hunting | 0 (0.0%) | 0 (0.0%) |
| Mining, Quarrying, & Extraction | 0 (0.0%) | 0 (0.0%) |
| Construction | 85 (57.1%) | 64 (42.9%) |
| Manufacturing | 52 (47.3%) | 58 (52.7%) |
| Wholesale Trade | 0 (0.0%) | 0 (0.0%) |
| Retail Trade | 14 (12.7%) | 96 (87.3%) |
| Transportation & Warehousing | 62 (45.6%) | 74 (54.4%) |
| Utilities | 0 (0.0%) | 0 (0.0%) |
| Information | 0 (0.0%) | 0 (0.0%) |
| Finance & Insurance | 72 (61.5%) | 45 (38.5%) |
| Real Estate, Rental & Leasing | 0 (0.0%) | 15 (100.0%) |
| Professional & Scientific | 18 (18.0%) | 82 (82.0%) |
| Enterprise Management | 0 (0.0%) | 0 (0.0%) |
| Administrative & Support | 0 (0.0%) | 0 (0.0%) |
| Educational Services | 0 (0.0%) | 63 (100.0%) |
| Health Care & Social Assistance | 128 (28.5%) | 321 (71.5%) |
| Arts, Entertainment & Recreation | 15 (100.0%) | 0 (0.0%) |
| Accommodation & Food Services | 0 (0.0%) | 90 (100.0%) |
| Public Administration | 42 (37.2%) | 71 (62.8%) |
| Total | 515 (33.4%) | 1,026 (66.6%) |
Education in Monument Beach
School Enrollment in Monument Beach
The most common levels of schooling among the 787 students in Monument Beach are elementary school (343 | 43.6%), high school (188 | 23.9%), and college / undergraduate (128 | 16.3%).
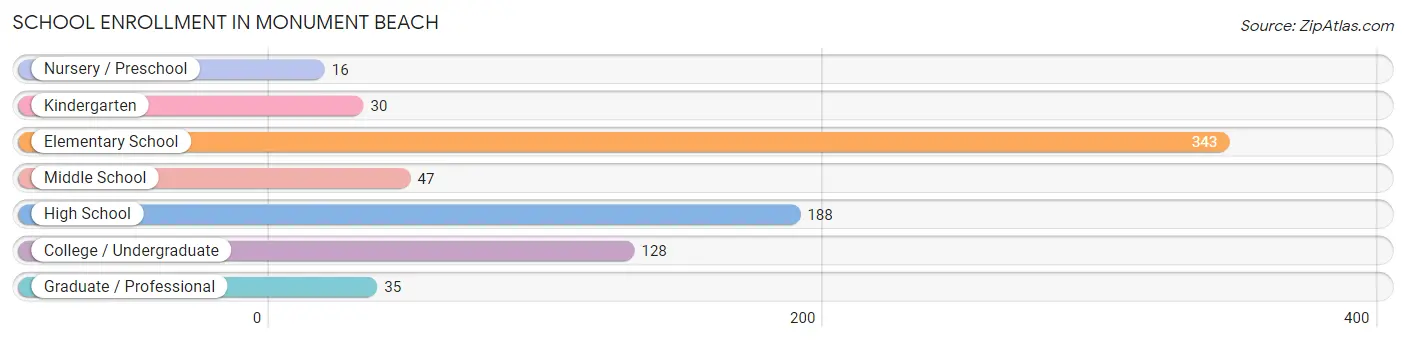
| School Level | # Students | % Students |
| Nursery / Preschool | 16 | 2.0% |
| Kindergarten | 30 | 3.8% |
| Elementary School | 343 | 43.6% |
| Middle School | 47 | 6.0% |
| High School | 188 | 23.9% |
| College / Undergraduate | 128 | 16.3% |
| Graduate / Professional | 35 | 4.4% |
| Total | 787 | 100.0% |
School Enrollment by Age by Funding Source in Monument Beach
Out of a total of 787 students who are enrolled in schools in Monument Beach, 135 (17.2%) attend a private institution, while the remaining 652 (82.8%) are enrolled in public schools. The age group of 3 to 4 year olds has the highest likelihood of being enrolled in private schools, with 16 (100.0% in the age bracket) enrolled. Conversely, the age group of 10 to 14 year olds has the lowest likelihood of being enrolled in a private school, with 125 (100.0% in the age bracket) attending a public institution.
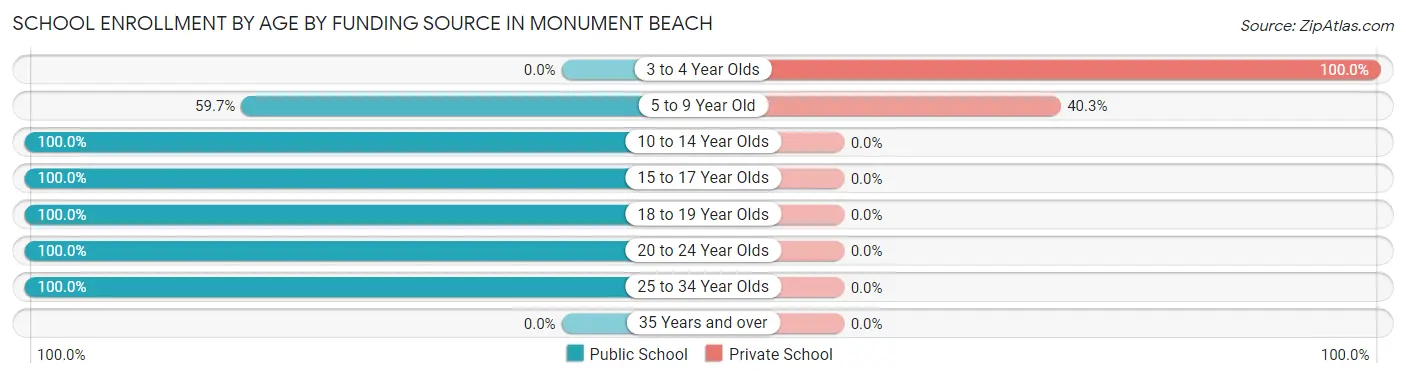
| Age Bracket | Public School | Private School |
| 3 to 4 Year Olds | 0 (0.0%) | 16 (100.0%) |
| 5 to 9 Year Old | 176 (59.7%) | 119 (40.3%) |
| 10 to 14 Year Olds | 125 (100.0%) | 0 (0.0%) |
| 15 to 17 Year Olds | 60 (100.0%) | 0 (0.0%) |
| 18 to 19 Year Olds | 128 (100.0%) | 0 (0.0%) |
| 20 to 24 Year Olds | 125 (100.0%) | 0 (0.0%) |
| 25 to 34 Year Olds | 38 (100.0%) | 0 (0.0%) |
| 35 Years and over | 0 (0.0%) | 0 (0.0%) |
| Total | 652 (82.8%) | 135 (17.2%) |
Educational Attainment by Field of Study in Monument Beach
Education (335 | 29.9%), science & technology (126 | 11.2%), business (115 | 10.2%), arts & humanities (111 | 9.9%), and social sciences (82 | 7.3%) are the most common fields of study among 1,122 individuals in Monument Beach who have obtained a bachelor's degree or higher.
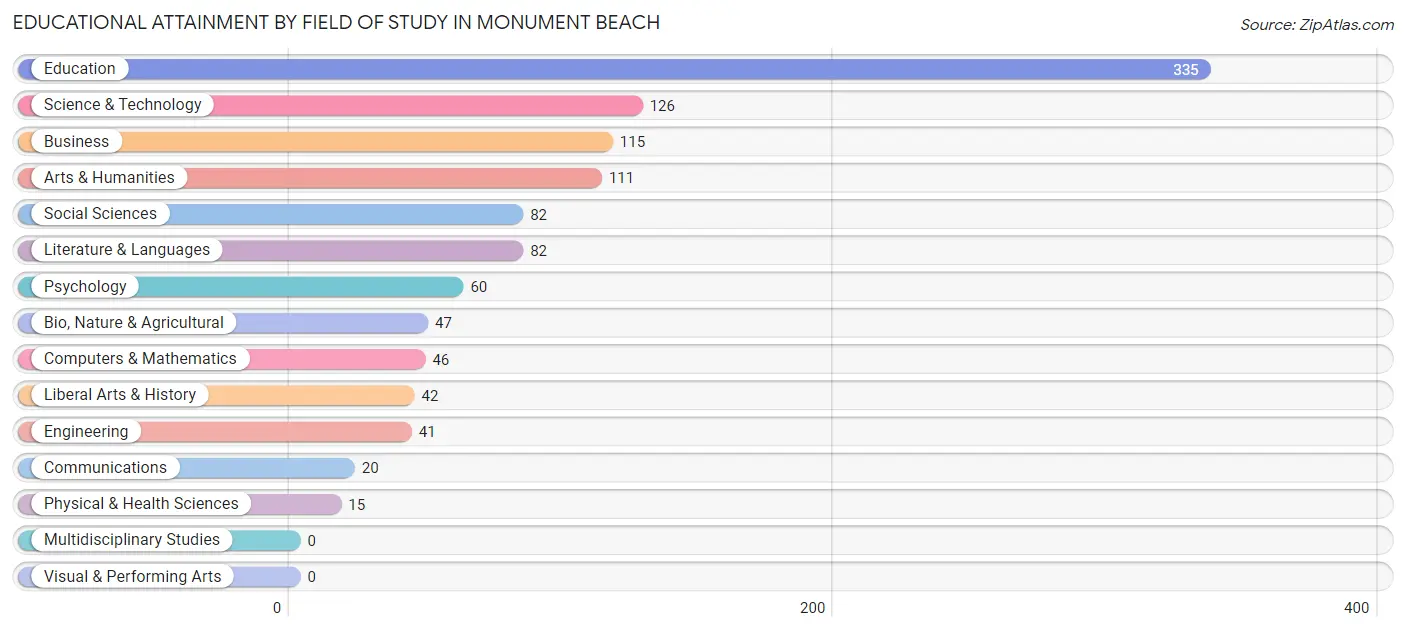
| Field of Study | # Graduates | % Graduates |
| Computers & Mathematics | 46 | 4.1% |
| Bio, Nature & Agricultural | 47 | 4.2% |
| Physical & Health Sciences | 15 | 1.3% |
| Psychology | 60 | 5.3% |
| Social Sciences | 82 | 7.3% |
| Engineering | 41 | 3.6% |
| Multidisciplinary Studies | 0 | 0.0% |
| Science & Technology | 126 | 11.2% |
| Business | 115 | 10.2% |
| Education | 335 | 29.9% |
| Literature & Languages | 82 | 7.3% |
| Liberal Arts & History | 42 | 3.7% |
| Visual & Performing Arts | 0 | 0.0% |
| Communications | 20 | 1.8% |
| Arts & Humanities | 111 | 9.9% |
| Total | 1,122 | 100.0% |
Transportation & Commute in Monument Beach
Vehicle Availability by Sex in Monument Beach
The most prevalent vehicle ownership categories in Monument Beach are males with 2 vehicles (198, accounting for 39.6%) and females with 2 vehicles (461, making up 20.4%).
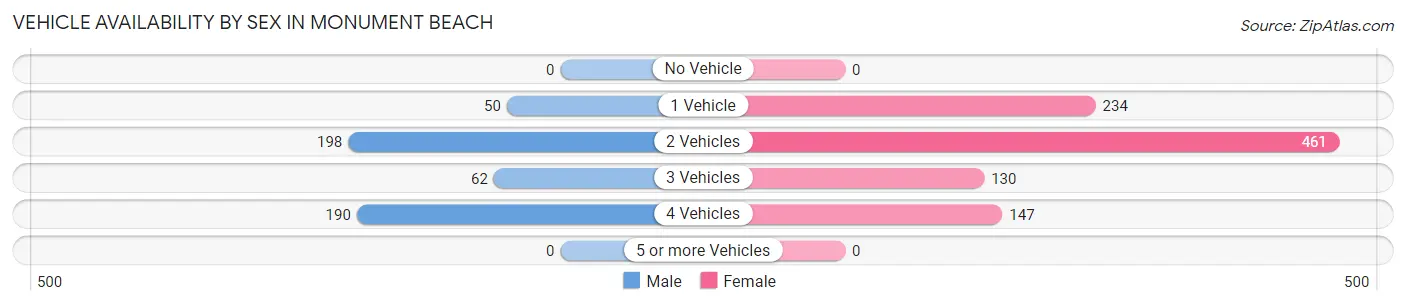
| Vehicles Available | Male | Female |
| No Vehicle | 0 (0.0%) | 0 (0.0%) |
| 1 Vehicle | 50 (10.0%) | 234 (24.1%) |
| 2 Vehicles | 198 (39.6%) | 461 (47.4%) |
| 3 Vehicles | 62 (12.4%) | 130 (13.4%) |
| 4 Vehicles | 190 (38.0%) | 147 (15.1%) |
| 5 or more Vehicles | 0 (0.0%) | 0 (0.0%) |
| Total | 500 (100.0%) | 972 (100.0%) |
Commute Time in Monument Beach
The most frequently occuring commute durations in Monument Beach are 45 to 59 minutes (307 commuters, 22.1%), 20 to 24 minutes (192 commuters, 13.8%), and 10 to 14 minutes (190 commuters, 13.7%).
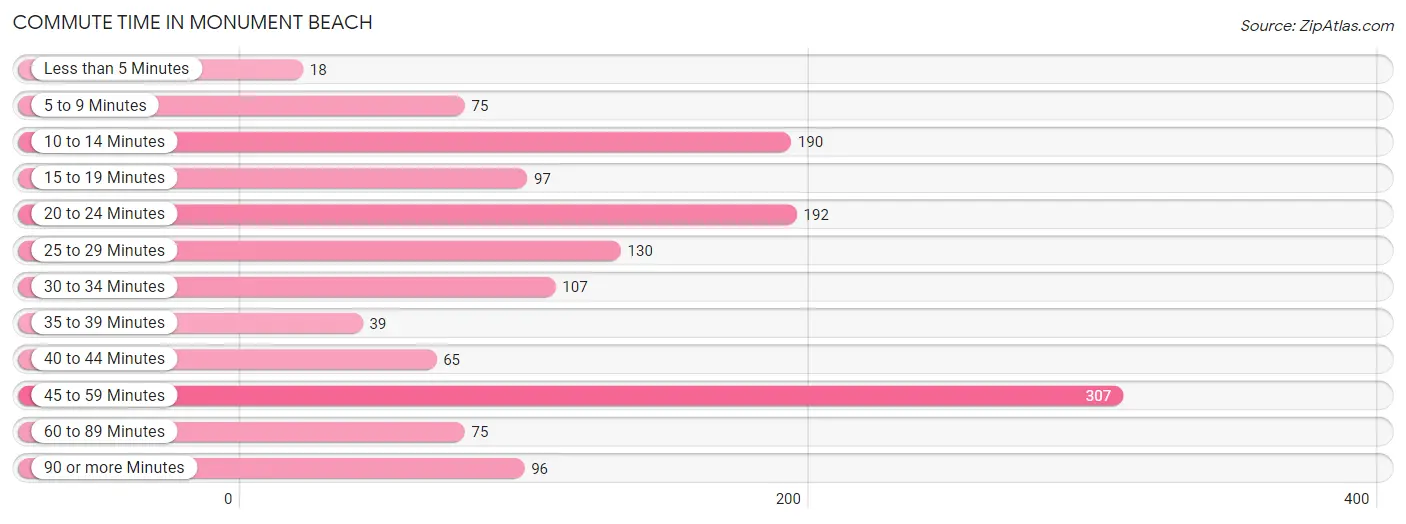
| Commute Time | # Commuters | % Commuters |
| Less than 5 Minutes | 18 | 1.3% |
| 5 to 9 Minutes | 75 | 5.4% |
| 10 to 14 Minutes | 190 | 13.7% |
| 15 to 19 Minutes | 97 | 7.0% |
| 20 to 24 Minutes | 192 | 13.8% |
| 25 to 29 Minutes | 130 | 9.3% |
| 30 to 34 Minutes | 107 | 7.7% |
| 35 to 39 Minutes | 39 | 2.8% |
| 40 to 44 Minutes | 65 | 4.7% |
| 45 to 59 Minutes | 307 | 22.1% |
| 60 to 89 Minutes | 75 | 5.4% |
| 90 or more Minutes | 96 | 6.9% |
Commute Time by Sex in Monument Beach
The most common commute times in Monument Beach are 10 to 14 minutes (128 commuters, 29.4%) for males and 20 to 24 minutes (192 commuters, 20.1%) for females.
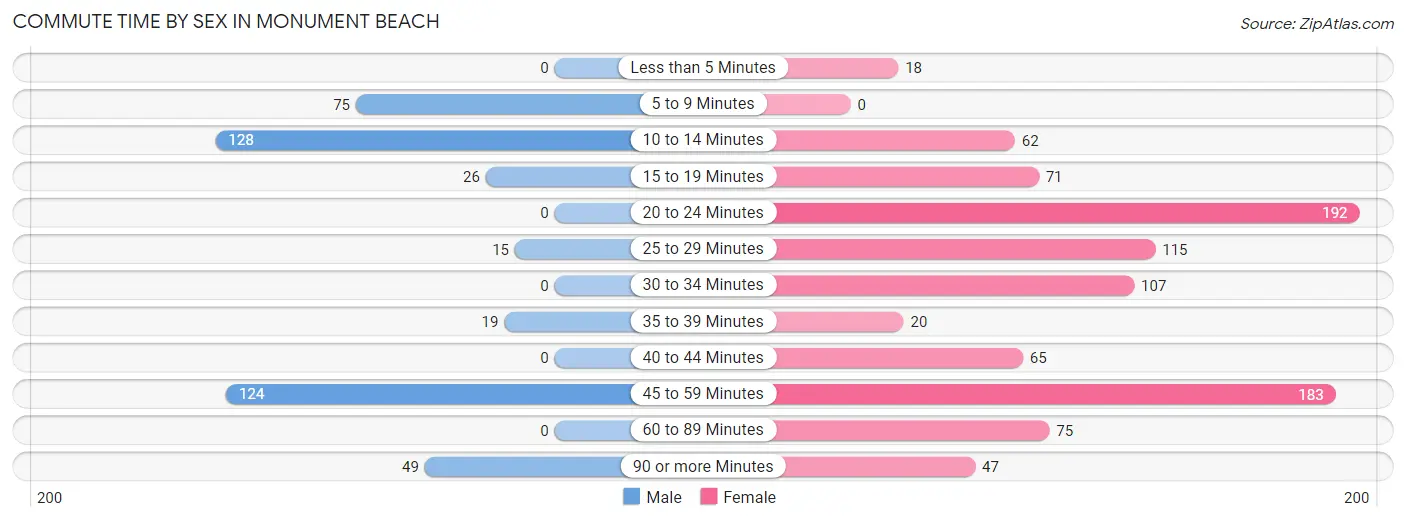
| Commute Time | Male | Female |
| Less than 5 Minutes | 0 (0.0%) | 18 (1.9%) |
| 5 to 9 Minutes | 75 (17.2%) | 0 (0.0%) |
| 10 to 14 Minutes | 128 (29.4%) | 62 (6.5%) |
| 15 to 19 Minutes | 26 (6.0%) | 71 (7.4%) |
| 20 to 24 Minutes | 0 (0.0%) | 192 (20.1%) |
| 25 to 29 Minutes | 15 (3.4%) | 115 (12.0%) |
| 30 to 34 Minutes | 0 (0.0%) | 107 (11.2%) |
| 35 to 39 Minutes | 19 (4.4%) | 20 (2.1%) |
| 40 to 44 Minutes | 0 (0.0%) | 65 (6.8%) |
| 45 to 59 Minutes | 124 (28.4%) | 183 (19.2%) |
| 60 to 89 Minutes | 0 (0.0%) | 75 (7.9%) |
| 90 or more Minutes | 49 (11.2%) | 47 (4.9%) |
Time of Departure to Work by Sex in Monument Beach
The most frequent times of departure to work in Monument Beach are 10:00 AM to 10:59 AM (154, 35.3%) for males and 8:00 AM to 8:29 AM (210, 22.0%) for females.
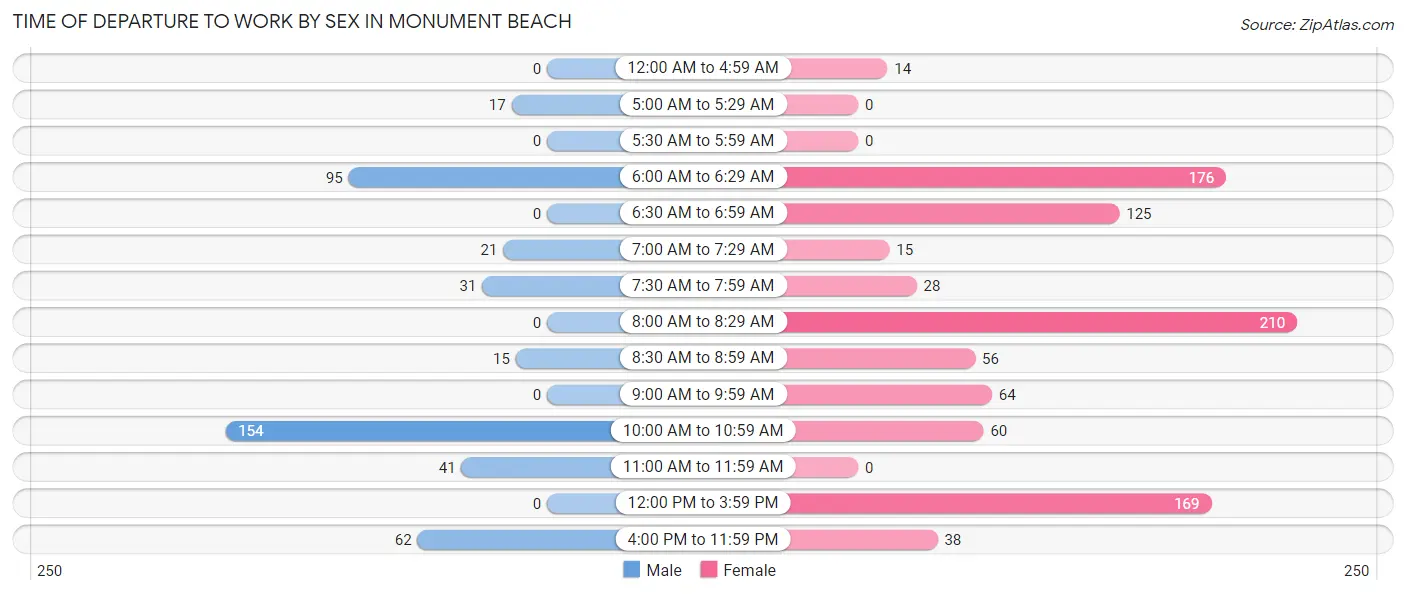
| Time of Departure | Male | Female |
| 12:00 AM to 4:59 AM | 0 (0.0%) | 14 (1.5%) |
| 5:00 AM to 5:29 AM | 17 (3.9%) | 0 (0.0%) |
| 5:30 AM to 5:59 AM | 0 (0.0%) | 0 (0.0%) |
| 6:00 AM to 6:29 AM | 95 (21.8%) | 176 (18.4%) |
| 6:30 AM to 6:59 AM | 0 (0.0%) | 125 (13.1%) |
| 7:00 AM to 7:29 AM | 21 (4.8%) | 15 (1.6%) |
| 7:30 AM to 7:59 AM | 31 (7.1%) | 28 (2.9%) |
| 8:00 AM to 8:29 AM | 0 (0.0%) | 210 (22.0%) |
| 8:30 AM to 8:59 AM | 15 (3.4%) | 56 (5.9%) |
| 9:00 AM to 9:59 AM | 0 (0.0%) | 64 (6.7%) |
| 10:00 AM to 10:59 AM | 154 (35.3%) | 60 (6.3%) |
| 11:00 AM to 11:59 AM | 41 (9.4%) | 0 (0.0%) |
| 12:00 PM to 3:59 PM | 0 (0.0%) | 169 (17.7%) |
| 4:00 PM to 11:59 PM | 62 (14.2%) | 38 (4.0%) |
| Total | 436 (100.0%) | 955 (100.0%) |
Housing Occupancy in Monument Beach
Occupancy by Ownership in Monument Beach
Of the total 1,309 dwellings in Monument Beach, owner-occupied units account for 1,155 (88.2%), while renter-occupied units make up 154 (11.8%).
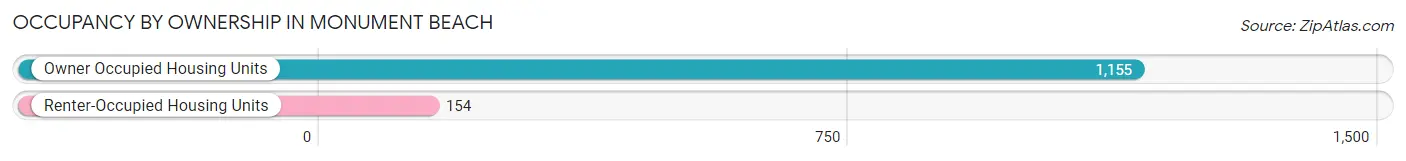
| Occupancy | # Housing Units | % Housing Units |
| Owner Occupied Housing Units | 1,155 | 88.2% |
| Renter-Occupied Housing Units | 154 | 11.8% |
| Total Occupied Housing Units | 1,309 | 100.0% |
Occupancy by Household Size in Monument Beach
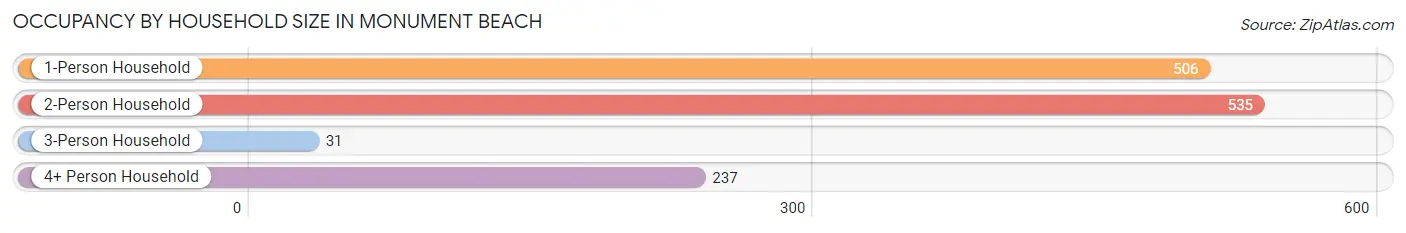
| Household Size | # Housing Units | % Housing Units |
| 1-Person Household | 506 | 38.7% |
| 2-Person Household | 535 | 40.9% |
| 3-Person Household | 31 | 2.4% |
| 4+ Person Household | 237 | 18.1% |
| Total Housing Units | 1,309 | 100.0% |
Occupancy by Ownership by Household Size in Monument Beach
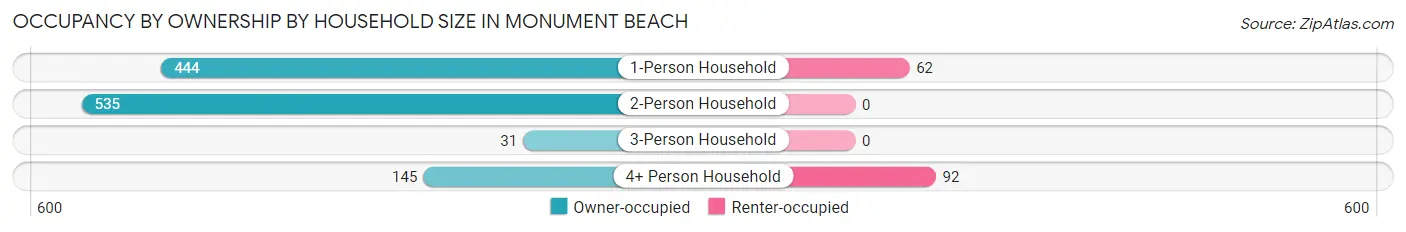
| Household Size | Owner-occupied | Renter-occupied |
| 1-Person Household | 444 (87.7%) | 62 (12.2%) |
| 2-Person Household | 535 (100.0%) | 0 (0.0%) |
| 3-Person Household | 31 (100.0%) | 0 (0.0%) |
| 4+ Person Household | 145 (61.2%) | 92 (38.8%) |
| Total Housing Units | 1,155 (88.2%) | 154 (11.8%) |
Occupancy by Educational Attainment in Monument Beach
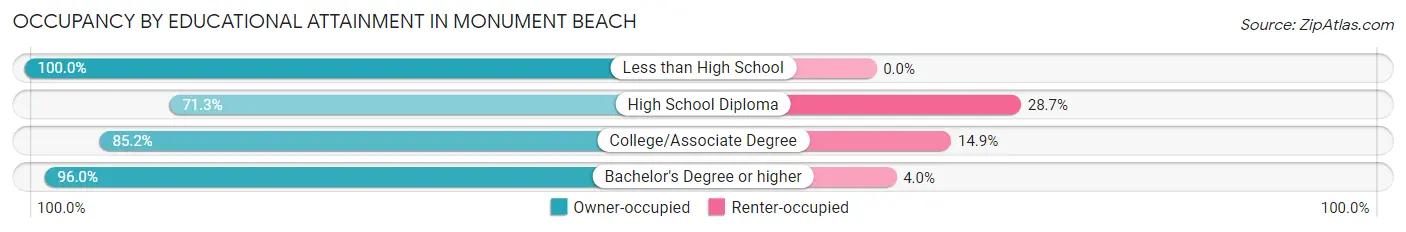
| Household Size | Owner-occupied | Renter-occupied |
| Less than High School | 16 (100.0%) | 0 (0.0%) |
| High School Diploma | 184 (71.3%) | 74 (28.7%) |
| College/Associate Degree | 304 (85.2%) | 53 (14.8%) |
| Bachelor's Degree or higher | 651 (96.0%) | 27 (4.0%) |
Occupancy by Age of Householder in Monument Beach
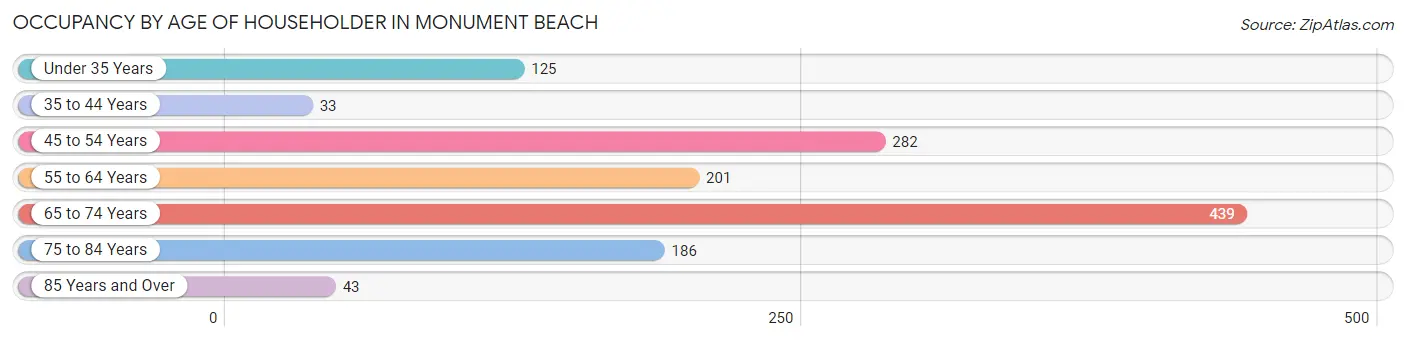
| Age Bracket | # Households | % Households |
| Under 35 Years | 125 | 9.6% |
| 35 to 44 Years | 33 | 2.5% |
| 45 to 54 Years | 282 | 21.5% |
| 55 to 64 Years | 201 | 15.4% |
| 65 to 74 Years | 439 | 33.5% |
| 75 to 84 Years | 186 | 14.2% |
| 85 Years and Over | 43 | 3.3% |
| Total | 1,309 | 100.0% |
Housing Finances in Monument Beach
Median Income by Occupancy in Monument Beach
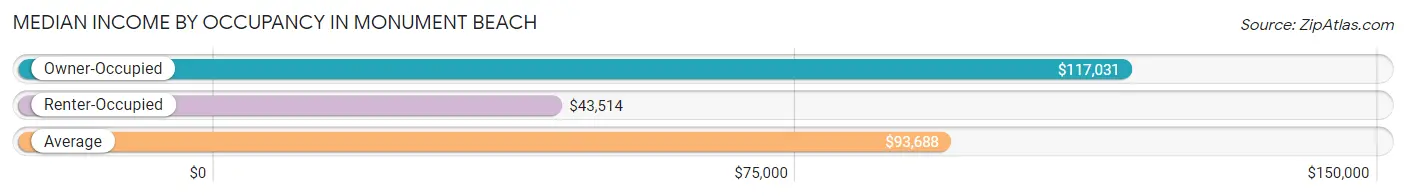
| Occupancy Type | # Households | Median Income |
| Owner-Occupied | 1,155 (88.2%) | $117,031 |
| Renter-Occupied | 154 (11.8%) | $43,514 |
| Average | 1,309 (100.0%) | $93,688 |
Occupancy by Householder Income Bracket in Monument Beach
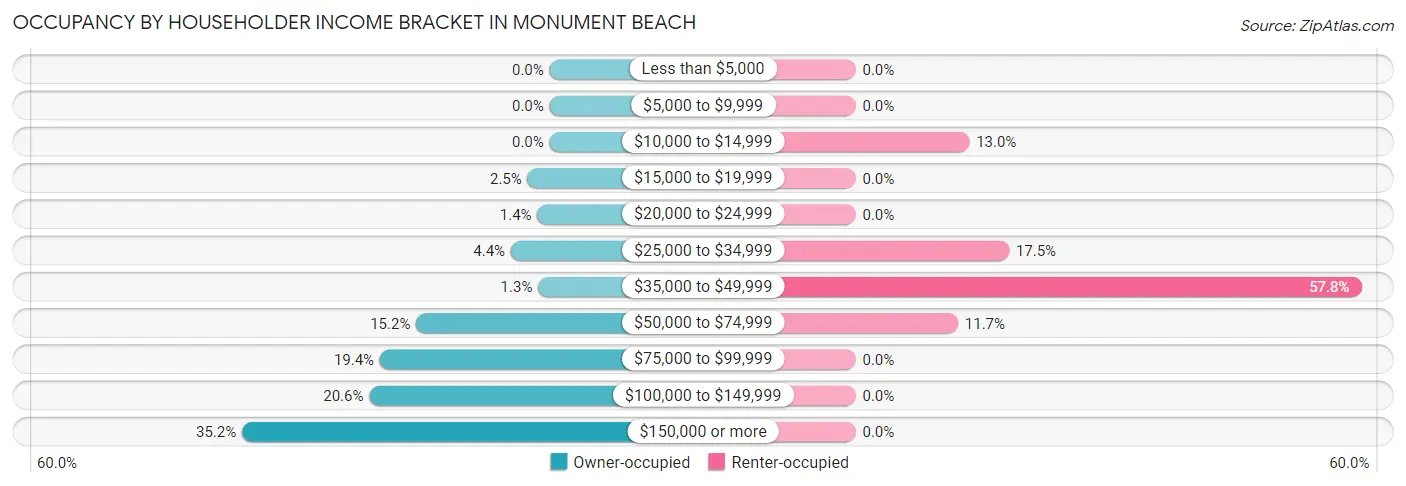
| Income Bracket | Owner-occupied | Renter-occupied |
| Less than $5,000 | 0 (0.0%) | 0 (0.0%) |
| $5,000 to $9,999 | 0 (0.0%) | 0 (0.0%) |
| $10,000 to $14,999 | 0 (0.0%) | 20 (13.0%) |
| $15,000 to $19,999 | 29 (2.5%) | 0 (0.0%) |
| $20,000 to $24,999 | 16 (1.4%) | 0 (0.0%) |
| $25,000 to $34,999 | 51 (4.4%) | 27 (17.5%) |
| $35,000 to $49,999 | 15 (1.3%) | 89 (57.8%) |
| $50,000 to $74,999 | 176 (15.2%) | 18 (11.7%) |
| $75,000 to $99,999 | 224 (19.4%) | 0 (0.0%) |
| $100,000 to $149,999 | 238 (20.6%) | 0 (0.0%) |
| $150,000 or more | 406 (35.1%) | 0 (0.0%) |
| Total | 1,155 (100.0%) | 154 (100.0%) |
Monthly Housing Cost Tiers in Monument Beach
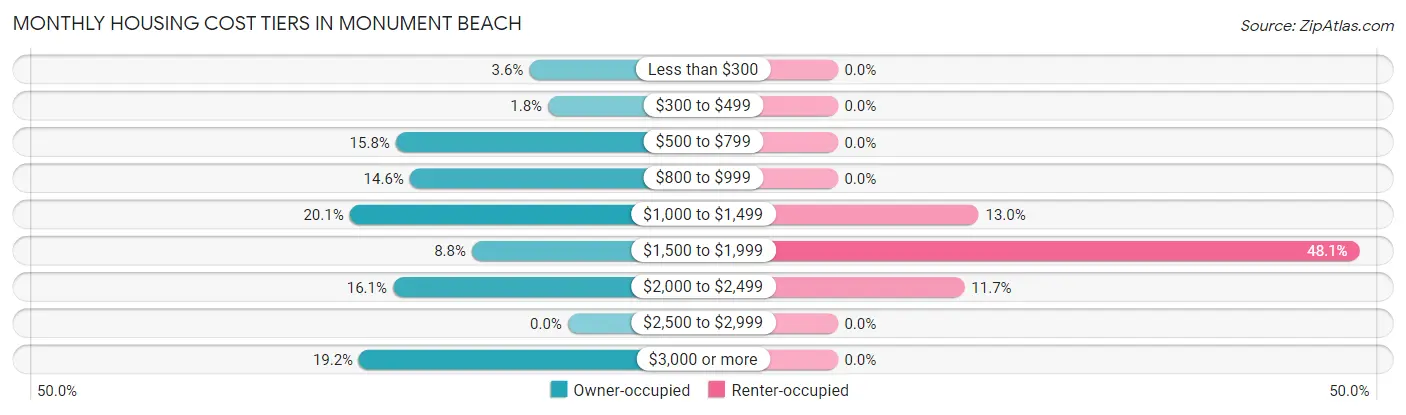
| Monthly Cost | Owner-occupied | Renter-occupied |
| Less than $300 | 41 (3.5%) | 0 (0.0%) |
| $300 to $499 | 21 (1.8%) | 0 (0.0%) |
| $500 to $799 | 183 (15.8%) | 0 (0.0%) |
| $800 to $999 | 168 (14.5%) | 0 (0.0%) |
| $1,000 to $1,499 | 232 (20.1%) | 20 (13.0%) |
| $1,500 to $1,999 | 102 (8.8%) | 74 (48.0%) |
| $2,000 to $2,499 | 186 (16.1%) | 18 (11.7%) |
| $2,500 to $2,999 | 0 (0.0%) | 0 (0.0%) |
| $3,000 or more | 222 (19.2%) | 0 (0.0%) |
| Total | 1,155 (100.0%) | 154 (100.0%) |
Physical Housing Characteristics in Monument Beach
Housing Structures in Monument Beach
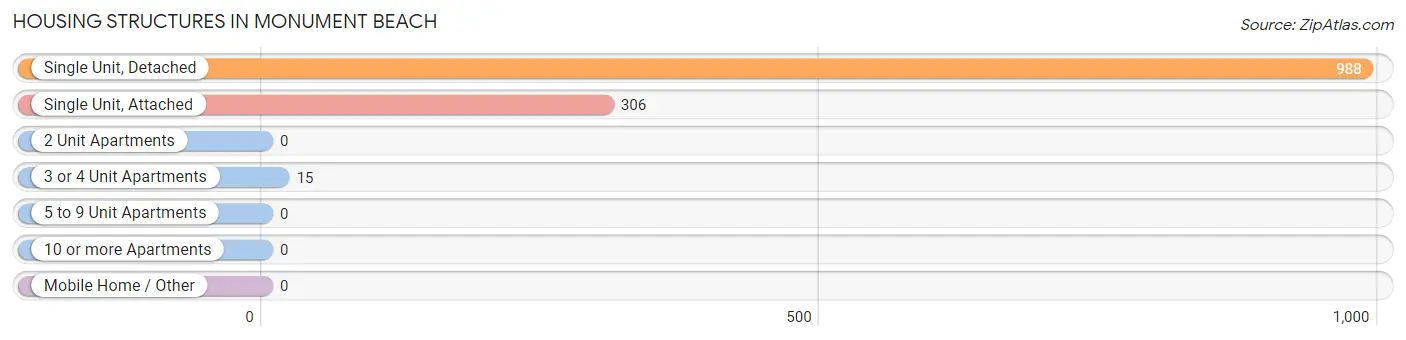
| Structure Type | # Housing Units | % Housing Units |
| Single Unit, Detached | 988 | 75.5% |
| Single Unit, Attached | 306 | 23.4% |
| 2 Unit Apartments | 0 | 0.0% |
| 3 or 4 Unit Apartments | 15 | 1.1% |
| 5 to 9 Unit Apartments | 0 | 0.0% |
| 10 or more Apartments | 0 | 0.0% |
| Mobile Home / Other | 0 | 0.0% |
| Total | 1,309 | 100.0% |
Housing Structures by Occupancy in Monument Beach
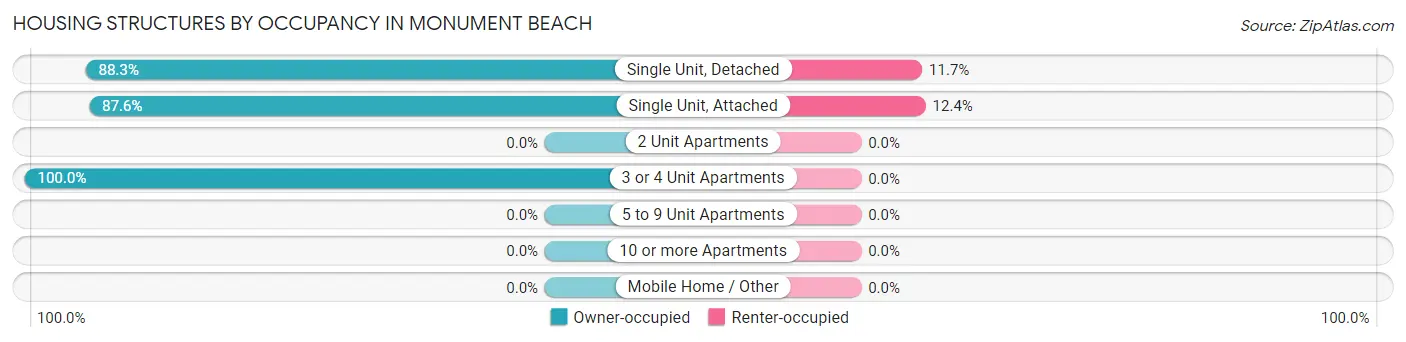
| Structure Type | Owner-occupied | Renter-occupied |
| Single Unit, Detached | 872 (88.3%) | 116 (11.7%) |
| Single Unit, Attached | 268 (87.6%) | 38 (12.4%) |
| 2 Unit Apartments | 0 (0.0%) | 0 (0.0%) |
| 3 or 4 Unit Apartments | 15 (100.0%) | 0 (0.0%) |
| 5 to 9 Unit Apartments | 0 (0.0%) | 0 (0.0%) |
| 10 or more Apartments | 0 (0.0%) | 0 (0.0%) |
| Mobile Home / Other | 0 (0.0%) | 0 (0.0%) |
| Total | 1,155 (88.2%) | 154 (11.8%) |
Housing Structures by Number of Rooms in Monument Beach
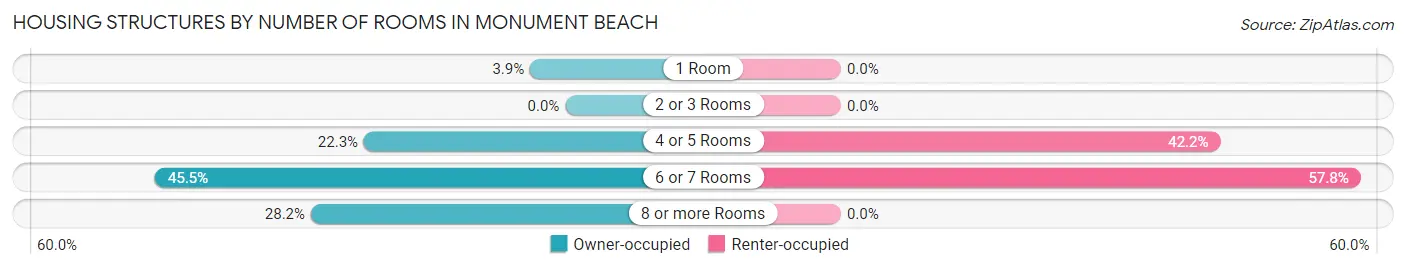
| Number of Rooms | Owner-occupied | Renter-occupied |
| 1 Room | 45 (3.9%) | 0 (0.0%) |
| 2 or 3 Rooms | 0 (0.0%) | 0 (0.0%) |
| 4 or 5 Rooms | 258 (22.3%) | 65 (42.2%) |
| 6 or 7 Rooms | 526 (45.5%) | 89 (57.8%) |
| 8 or more Rooms | 326 (28.2%) | 0 (0.0%) |
| Total | 1,155 (100.0%) | 154 (100.0%) |
Housing Structure by Heating Type in Monument Beach
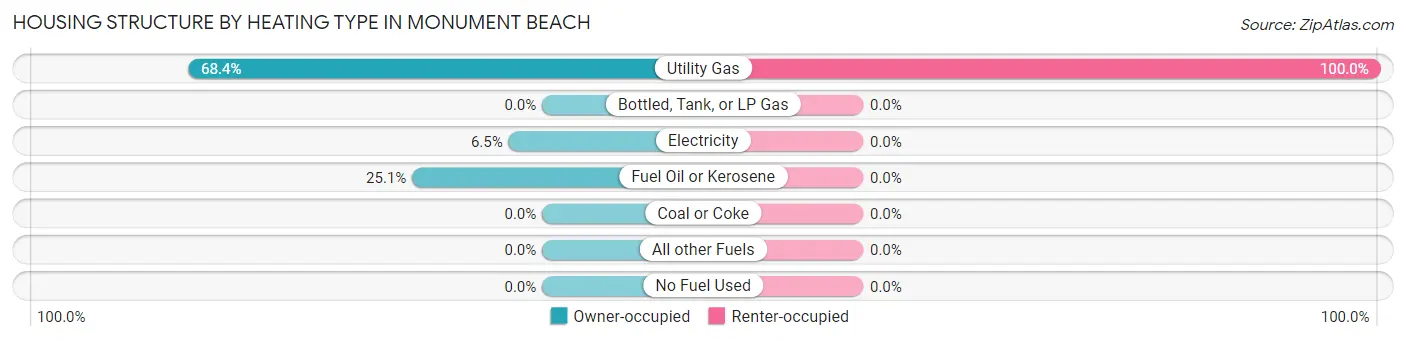
| Heating Type | Owner-occupied | Renter-occupied |
| Utility Gas | 790 (68.4%) | 154 (100.0%) |
| Bottled, Tank, or LP Gas | 0 (0.0%) | 0 (0.0%) |
| Electricity | 75 (6.5%) | 0 (0.0%) |
| Fuel Oil or Kerosene | 290 (25.1%) | 0 (0.0%) |
| Coal or Coke | 0 (0.0%) | 0 (0.0%) |
| All other Fuels | 0 (0.0%) | 0 (0.0%) |
| No Fuel Used | 0 (0.0%) | 0 (0.0%) |
| Total | 1,155 (100.0%) | 154 (100.0%) |
Household Vehicle Usage in Monument Beach
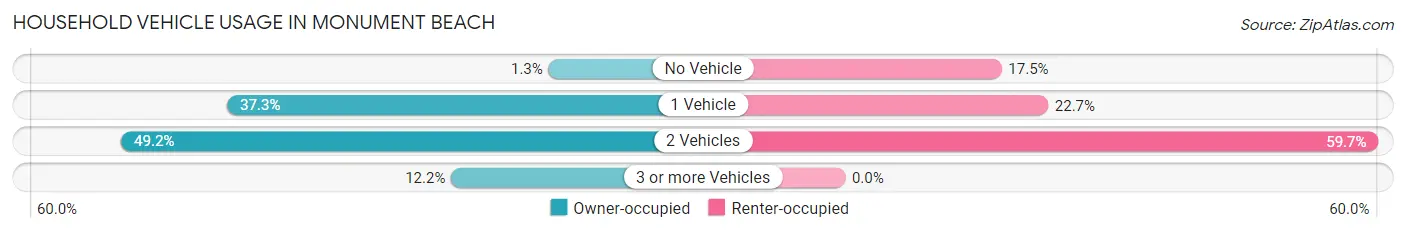
| Vehicles per Household | Owner-occupied | Renter-occupied |
| No Vehicle | 15 (1.3%) | 27 (17.5%) |
| 1 Vehicle | 431 (37.3%) | 35 (22.7%) |
| 2 Vehicles | 568 (49.2%) | 92 (59.7%) |
| 3 or more Vehicles | 141 (12.2%) | 0 (0.0%) |
| Total | 1,155 (100.0%) | 154 (100.0%) |
Real Estate & Mortgages in Monument Beach
Real Estate and Mortgage Overview in Monument Beach
| Characteristic | Without Mortgage | With Mortgage |
| Housing Units | 556 | 599 |
| Median Property Value | $463,800 | $497,300 |
| Median Household Income | $136,394 | $172 |
| Monthly Housing Costs | $835 | $222 |
| Real Estate Taxes | $3,846 | $45 |
Property Value by Mortgage Status in Monument Beach
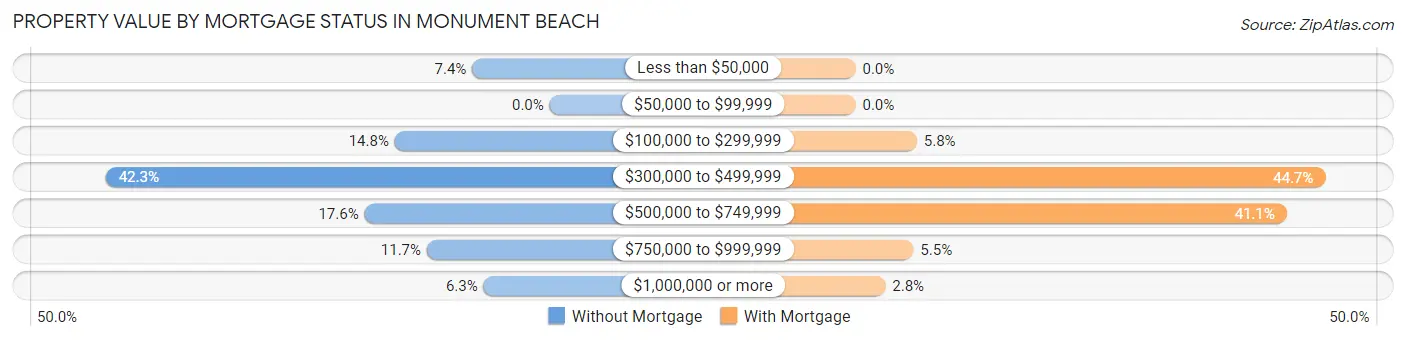
| Property Value | Without Mortgage | With Mortgage |
| Less than $50,000 | 41 (7.4%) | 0 (0.0%) |
| $50,000 to $99,999 | 0 (0.0%) | 0 (0.0%) |
| $100,000 to $299,999 | 82 (14.7%) | 35 (5.8%) |
| $300,000 to $499,999 | 235 (42.3%) | 268 (44.7%) |
| $500,000 to $749,999 | 98 (17.6%) | 246 (41.1%) |
| $750,000 to $999,999 | 65 (11.7%) | 33 (5.5%) |
| $1,000,000 or more | 35 (6.3%) | 17 (2.8%) |
| Total | 556 (100.0%) | 599 (100.0%) |
Household Income by Mortgage Status in Monument Beach
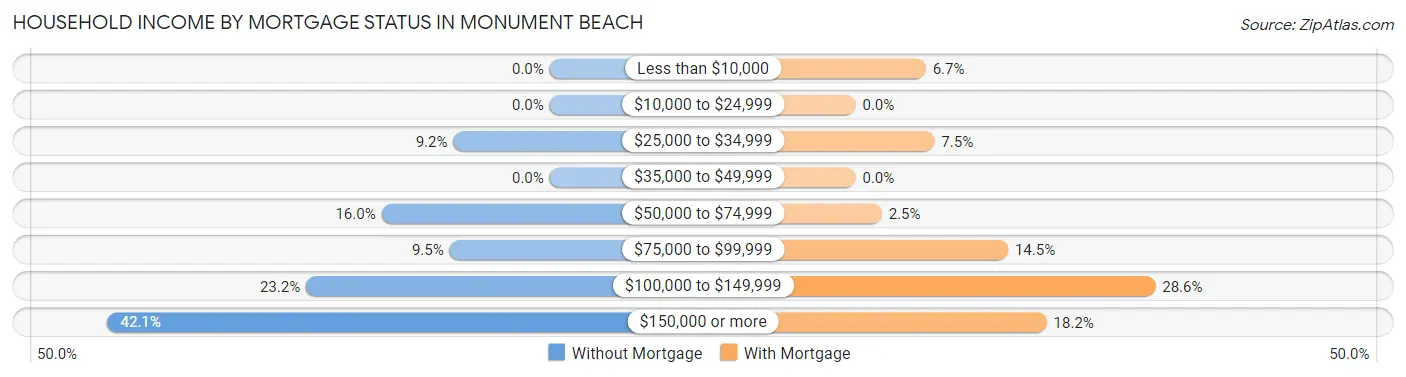
| Household Income | Without Mortgage | With Mortgage |
| Less than $10,000 | 0 (0.0%) | 40 (6.7%) |
| $10,000 to $24,999 | 0 (0.0%) | 0 (0.0%) |
| $25,000 to $34,999 | 51 (9.2%) | 45 (7.5%) |
| $35,000 to $49,999 | 0 (0.0%) | 0 (0.0%) |
| $50,000 to $74,999 | 89 (16.0%) | 15 (2.5%) |
| $75,000 to $99,999 | 53 (9.5%) | 87 (14.5%) |
| $100,000 to $149,999 | 129 (23.2%) | 171 (28.5%) |
| $150,000 or more | 234 (42.1%) | 109 (18.2%) |
| Total | 556 (100.0%) | 599 (100.0%) |
Property Value to Household Income Ratio in Monument Beach
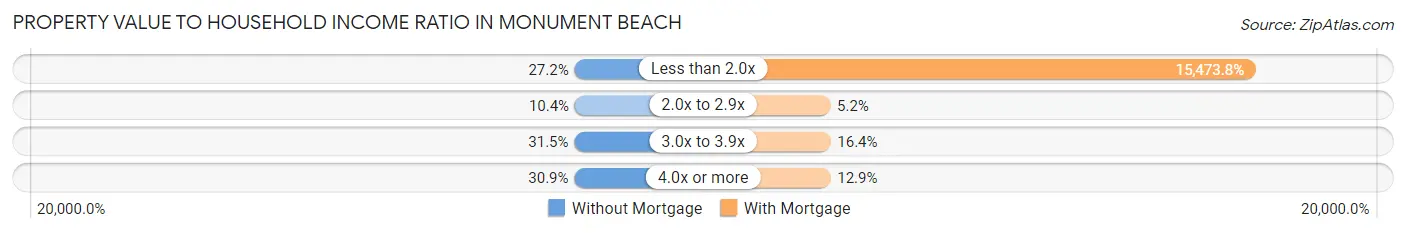
| Value-to-Income Ratio | Without Mortgage | With Mortgage |
| Less than 2.0x | 151 (27.2%) | 92,688 (15,473.8%) |
| 2.0x to 2.9x | 58 (10.4%) | 31 (5.2%) |
| 3.0x to 3.9x | 175 (31.5%) | 98 (16.4%) |
| 4.0x or more | 172 (30.9%) | 77 (12.9%) |
| Total | 556 (100.0%) | 599 (100.0%) |
Real Estate Taxes by Mortgage Status in Monument Beach
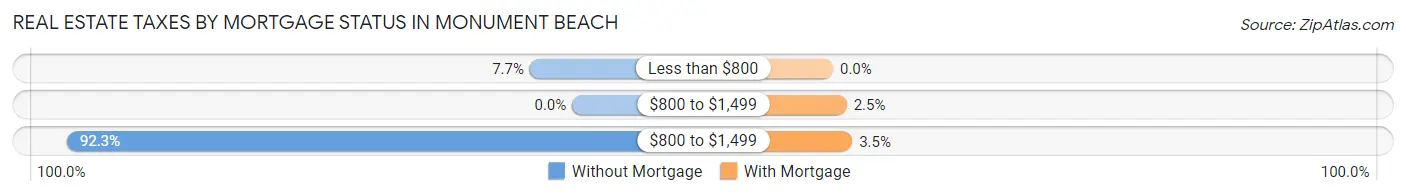
| Property Taxes | Without Mortgage | With Mortgage |
| Less than $800 | 43 (7.7%) | 0 (0.0%) |
| $800 to $1,499 | 0 (0.0%) | 15 (2.5%) |
| $800 to $1,499 | 513 (92.3%) | 21 (3.5%) |
| Total | 556 (100.0%) | 599 (100.0%) |
Health & Disability in Monument Beach
Health Insurance Coverage by Age in Monument Beach
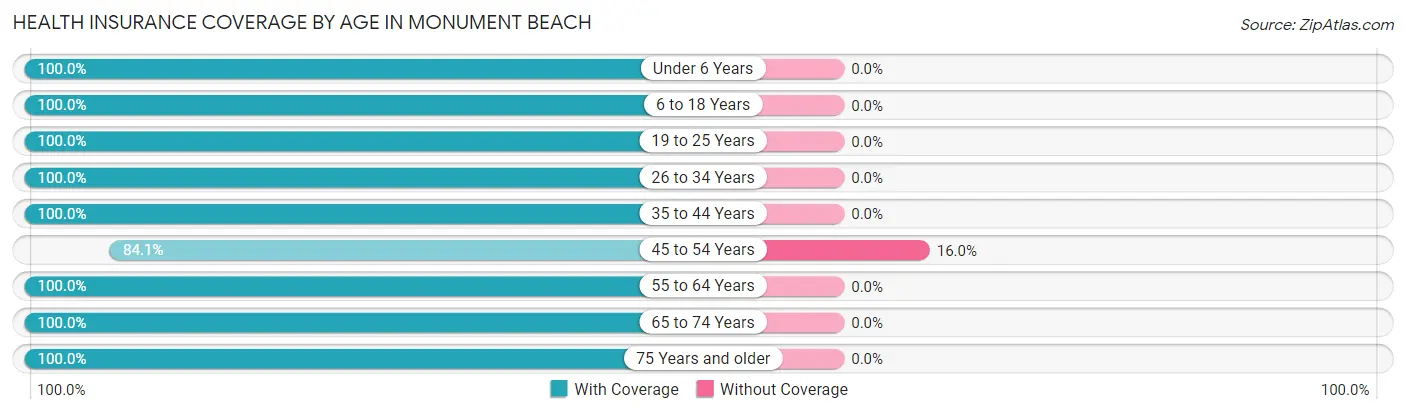
| Age Bracket | With Coverage | Without Coverage |
| Under 6 Years | 173 (100.0%) | 0 (0.0%) |
| 6 to 18 Years | 578 (100.0%) | 0 (0.0%) |
| 19 to 25 Years | 139 (100.0%) | 0 (0.0%) |
| 26 to 34 Years | 262 (100.0%) | 0 (0.0%) |
| 35 to 44 Years | 89 (100.0%) | 0 (0.0%) |
| 45 to 54 Years | 390 (84.1%) | 74 (16.0%) |
| 55 to 64 Years | 305 (100.0%) | 0 (0.0%) |
| 65 to 74 Years | 709 (100.0%) | 0 (0.0%) |
| 75 Years and older | 305 (100.0%) | 0 (0.0%) |
| Total | 2,950 (97.6%) | 74 (2.5%) |
Health Insurance Coverage by Citizenship Status in Monument Beach
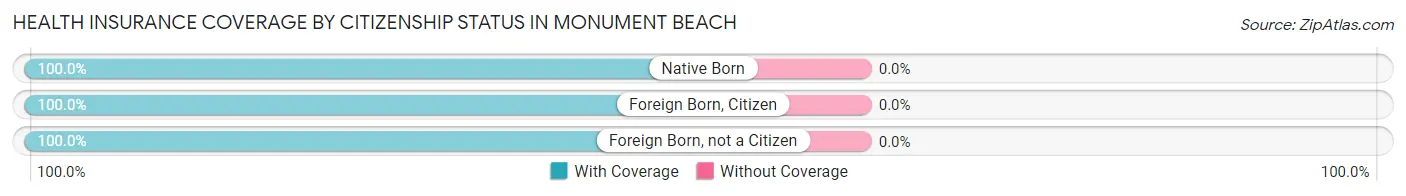
| Citizenship Status | With Coverage | Without Coverage |
| Native Born | 173 (100.0%) | 0 (0.0%) |
| Foreign Born, Citizen | 578 (100.0%) | 0 (0.0%) |
| Foreign Born, not a Citizen | 139 (100.0%) | 0 (0.0%) |
Health Insurance Coverage by Household Income in Monument Beach
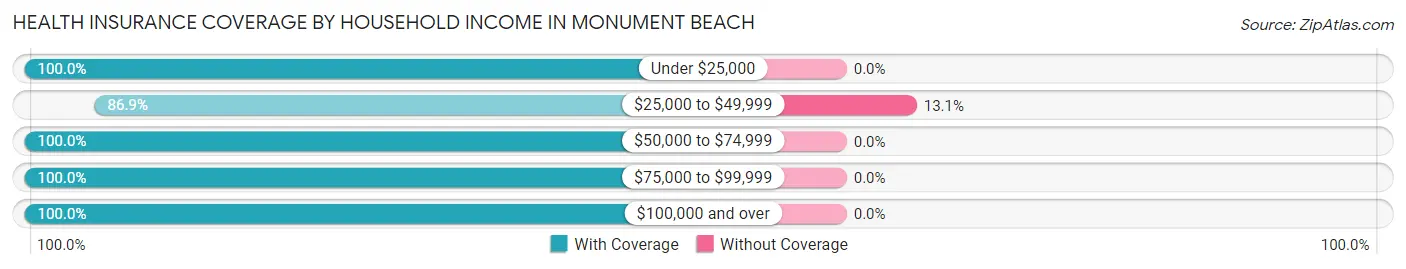
| Household Income | With Coverage | Without Coverage |
| Under $25,000 | 65 (100.0%) | 0 (0.0%) |
| $25,000 to $49,999 | 490 (86.9%) | 74 (13.1%) |
| $50,000 to $74,999 | 437 (100.0%) | 0 (0.0%) |
| $75,000 to $99,999 | 360 (100.0%) | 0 (0.0%) |
| $100,000 and over | 1,598 (100.0%) | 0 (0.0%) |
Public vs Private Health Insurance Coverage by Age in Monument Beach
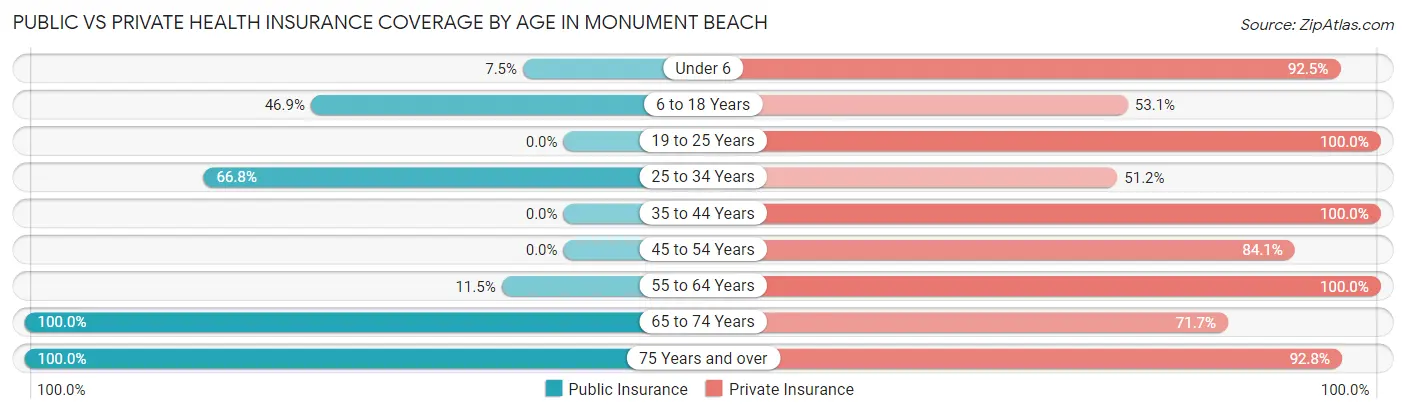
| Age Bracket | Public Insurance | Private Insurance |
| Under 6 | 13 (7.5%) | 160 (92.5%) |
| 6 to 18 Years | 271 (46.9%) | 307 (53.1%) |
| 19 to 25 Years | 0 (0.0%) | 139 (100.0%) |
| 25 to 34 Years | 175 (66.8%) | 134 (51.1%) |
| 35 to 44 Years | 0 (0.0%) | 89 (100.0%) |
| 45 to 54 Years | 0 (0.0%) | 390 (84.1%) |
| 55 to 64 Years | 35 (11.5%) | 305 (100.0%) |
| 65 to 74 Years | 709 (100.0%) | 508 (71.7%) |
| 75 Years and over | 305 (100.0%) | 283 (92.8%) |
| Total | 1,508 (49.9%) | 2,315 (76.5%) |
Disability Status by Sex by Age in Monument Beach
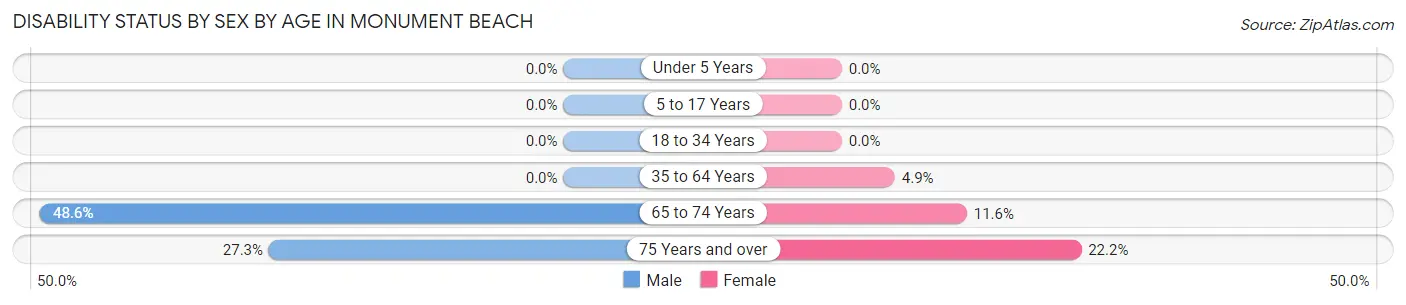
| Age Bracket | Male | Female |
| Under 5 Years | 0 (0.0%) | 0 (0.0%) |
| 5 to 17 Years | 0 (0.0%) | 0 (0.0%) |
| 18 to 34 Years | 0 (0.0%) | 0 (0.0%) |
| 35 to 64 Years | 0 (0.0%) | 28 (4.9%) |
| 65 to 74 Years | 135 (48.6%) | 50 (11.6%) |
| 75 Years and over | 44 (27.3%) | 32 (22.2%) |
Disability Class by Sex by Age in Monument Beach
Disability Class: Hearing Difficulty
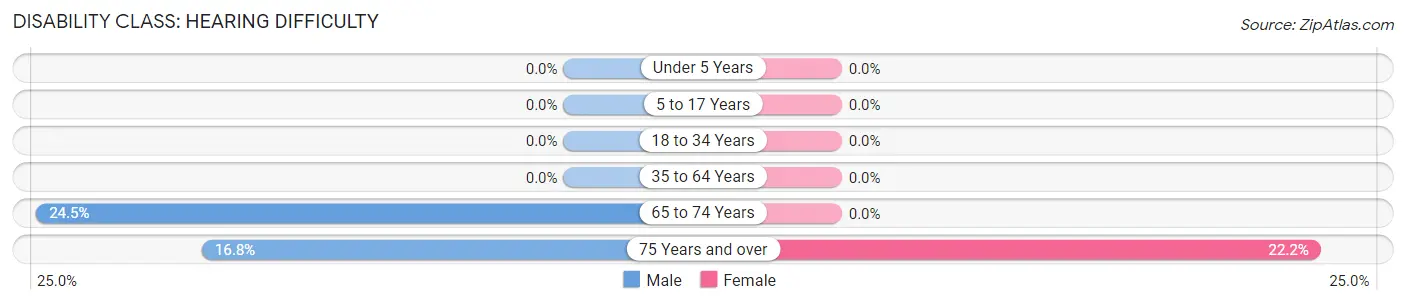
| Age Bracket | Male | Female |
| Under 5 Years | 0 (0.0%) | 0 (0.0%) |
| 5 to 17 Years | 0 (0.0%) | 0 (0.0%) |
| 18 to 34 Years | 0 (0.0%) | 0 (0.0%) |
| 35 to 64 Years | 0 (0.0%) | 0 (0.0%) |
| 65 to 74 Years | 68 (24.5%) | 0 (0.0%) |
| 75 Years and over | 27 (16.8%) | 32 (22.2%) |
Disability Class: Vision Difficulty
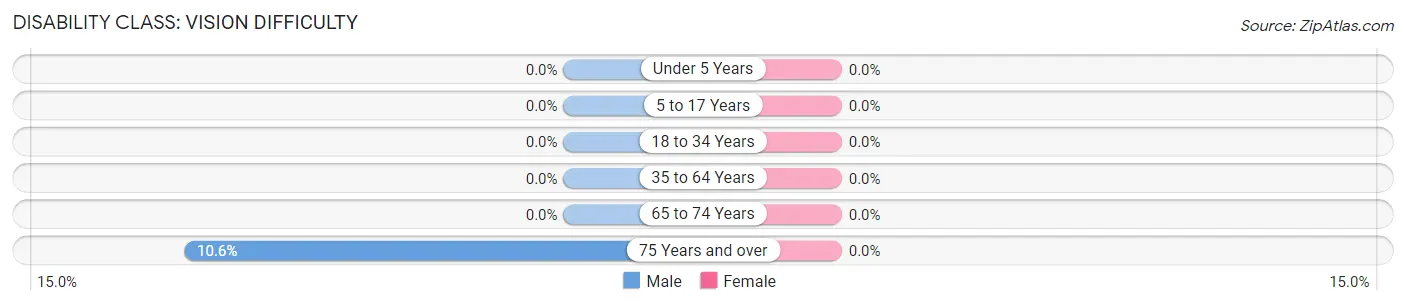
| Age Bracket | Male | Female |
| Under 5 Years | 0 (0.0%) | 0 (0.0%) |
| 5 to 17 Years | 0 (0.0%) | 0 (0.0%) |
| 18 to 34 Years | 0 (0.0%) | 0 (0.0%) |
| 35 to 64 Years | 0 (0.0%) | 0 (0.0%) |
| 65 to 74 Years | 0 (0.0%) | 0 (0.0%) |
| 75 Years and over | 17 (10.6%) | 0 (0.0%) |
Disability Class: Cognitive Difficulty
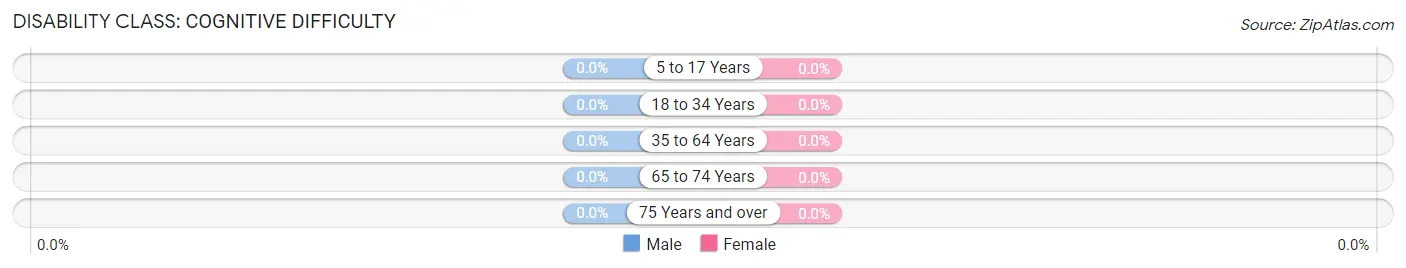
| Age Bracket | Male | Female |
| 5 to 17 Years | 0 (0.0%) | 0 (0.0%) |
| 18 to 34 Years | 0 (0.0%) | 0 (0.0%) |
| 35 to 64 Years | 0 (0.0%) | 0 (0.0%) |
| 65 to 74 Years | 0 (0.0%) | 0 (0.0%) |
| 75 Years and over | 0 (0.0%) | 0 (0.0%) |
Disability Class: Ambulatory Difficulty
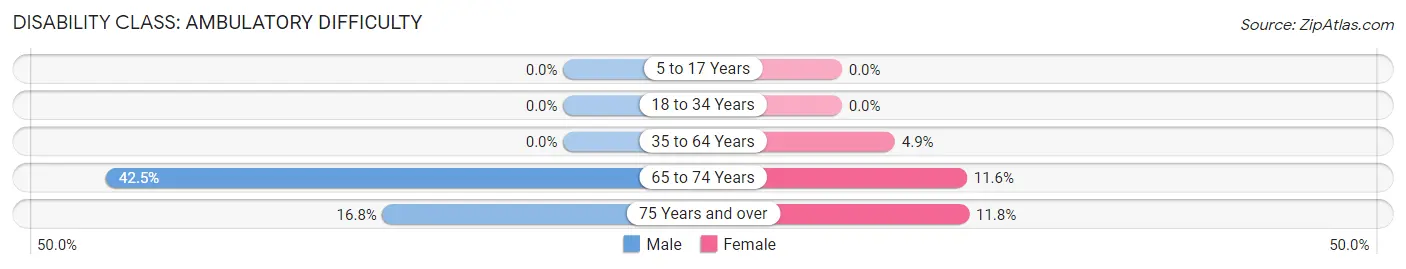
| Age Bracket | Male | Female |
| 5 to 17 Years | 0 (0.0%) | 0 (0.0%) |
| 18 to 34 Years | 0 (0.0%) | 0 (0.0%) |
| 35 to 64 Years | 0 (0.0%) | 28 (4.9%) |
| 65 to 74 Years | 118 (42.4%) | 50 (11.6%) |
| 75 Years and over | 27 (16.8%) | 17 (11.8%) |
Disability Class: Self-Care Difficulty
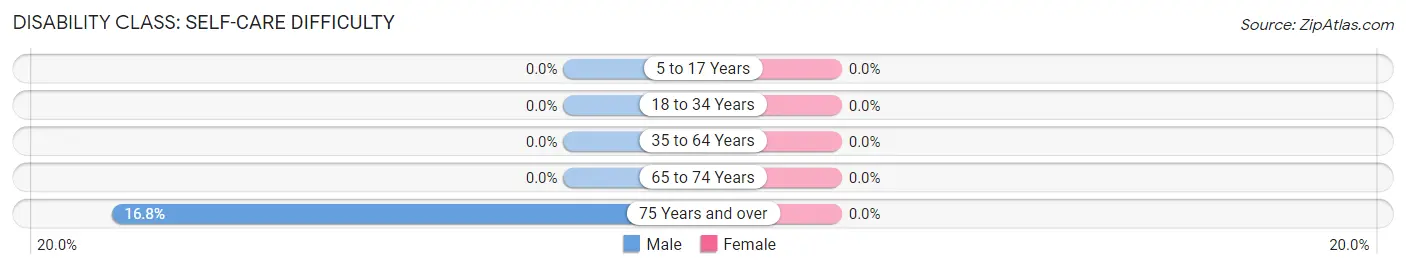
| Age Bracket | Male | Female |
| 5 to 17 Years | 0 (0.0%) | 0 (0.0%) |
| 18 to 34 Years | 0 (0.0%) | 0 (0.0%) |
| 35 to 64 Years | 0 (0.0%) | 0 (0.0%) |
| 65 to 74 Years | 0 (0.0%) | 0 (0.0%) |
| 75 Years and over | 27 (16.8%) | 0 (0.0%) |
Technology Access in Monument Beach
Computing Device Access in Monument Beach
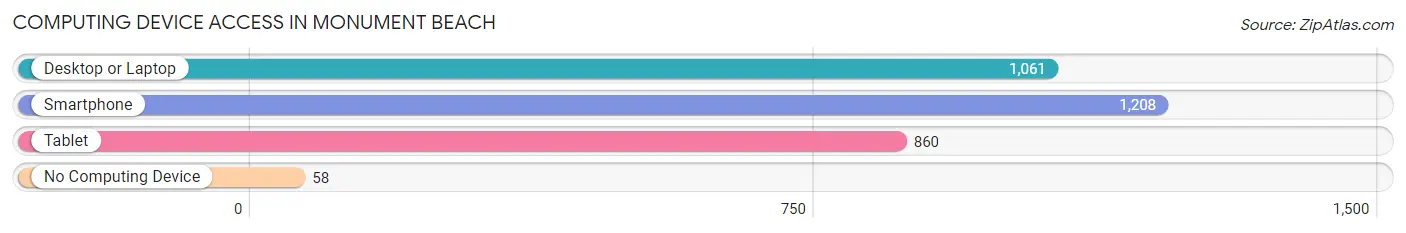
| Device Type | # Households | % Households |
| Desktop or Laptop | 1,061 | 81.0% |
| Smartphone | 1,208 | 92.3% |
| Tablet | 860 | 65.7% |
| No Computing Device | 58 | 4.4% |
| Total | 1,309 | 100.0% |
Internet Access in Monument Beach
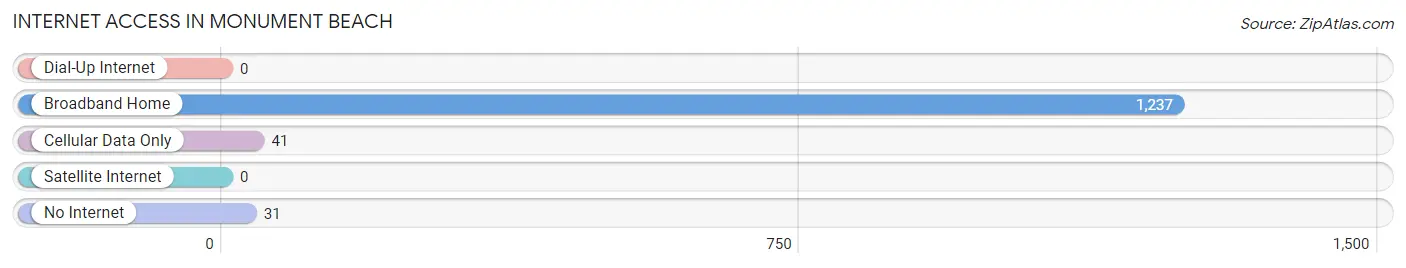
| Internet Type | # Households | % Households |
| Dial-Up Internet | 0 | 0.0% |
| Broadband Home | 1,237 | 94.5% |
| Cellular Data Only | 41 | 3.1% |
| Satellite Internet | 0 | 0.0% |
| No Internet | 31 | 2.4% |
| Total | 1,309 | 100.0% |
Monument Beach Summary
Monument Beach is a small village located in the town of Bourne, Massachusetts, on the south coast of Cape Cod. It is situated on the western side of the Cape Cod Canal, and is bordered by the towns of Sandwich and Mashpee. The village is home to a population of approximately 1,500 people, and is a popular summer destination for tourists and locals alike.
Geography
Monument Beach is located on the western side of the Cape Cod Canal, and is bordered by the towns of Sandwich and Mashpee. The village is situated on a peninsula, with Buzzards Bay to the west and the Cape Cod Canal to the east. The village is home to a number of beaches, including Monument Beach, which is the main beach in the village. The beach is a popular spot for swimming, fishing, and other recreational activities. The village is also home to a number of small businesses, including restaurants, shops, and a marina.
History
Monument Beach was first settled in the early 1700s by the English settlers of the Plymouth Colony. The village was originally known as “Monument Hill”, and was named after a monument that was erected in the area in 1717 to commemorate the landing of the Pilgrims in 1620. The village was incorporated in 1845, and was originally part of the town of Sandwich. In 1884, the village was annexed by the town of Bourne.
Economy
Monument Beach is a popular summer destination for tourists and locals alike. The village is home to a number of small businesses, including restaurants, shops, and a marina. The village is also home to a number of seasonal businesses, such as ice cream stands and beach rental shops. The village is also home to a number of recreational activities, such as fishing, swimming, and boating.
Demographics
As of the 2010 census, the population of Monument Beach was 1,500. The racial makeup of the village was 94.2% White, 1.3% African American, 0.7% Native American, 0.7% Asian, 0.3% from other races, and 2.9% from two or more races. The median household income in the village was $60,000, and the median family income was $68,000. The per capita income in the village was $27,000.
Conclusion
Monument Beach is a small village located in the town of Bourne, Massachusetts, on the south coast of Cape Cod. It is situated on the western side of the Cape Cod Canal, and is bordered by the towns of Sandwich and Mashpee. The village is home to a population of approximately 1,500 people, and is a popular summer destination for tourists and locals alike. The village is home to a number of small businesses, including restaurants, shops, and a marina. The village is also home to a number of recreational activities, such as fishing, swimming, and boating. The village has a diverse population, with a median household income of $60,000 and a median family income of $68,000.
Common Questions
What is Per Capita Income in Monument Beach?
Per Capita income in Monument Beach is $54,527.
What is the Median Family Income in Monument Beach?
Median Family Income in Monument Beach is $137,426.
What is the Median Household income in Monument Beach?
Median Household Income in Monument Beach is $93,688.
What is Inequality or Gini Index in Monument Beach?
Inequality or Gini Index in Monument Beach is 0.35.
What is the Total Population of Monument Beach?
Total Population of Monument Beach is 3,024.
What is the Total Male Population of Monument Beach?
Total Male Population of Monument Beach is 1,167.
What is the Total Female Population of Monument Beach?
Total Female Population of Monument Beach is 1,857.
What is the Ratio of Males per 100 Females in Monument Beach?
There are 62.84 Males per 100 Females in Monument Beach.
What is the Ratio of Females per 100 Males in Monument Beach?
There are 159.13 Females per 100 Males in Monument Beach.
What is the Median Population Age in Monument Beach?
Median Population Age in Monument Beach is 54.1 Years.
What is the Average Family Size in Monument Beach
Average Family Size in Monument Beach is 3.1 People.
What is the Average Household Size in Monument Beach
Average Household Size in Monument Beach is 2.3 People.
How Large is the Labor Force in Monument Beach?
There are 1,575 People in the Labor Forcein in Monument Beach.
What is the Percentage of People in the Labor Force in Monument Beach?
64.8% of People are in the Labor Force in Monument Beach.
What is the Unemployment Rate in Monument Beach?
Unemployment Rate in Monument Beach is 2.2%.