Zip Codes with the Highest Percentage of Population Employed in Food Preparation & Serving in Fall River, MA
RELATED REPORTS & OPTIONS
Food Preparation & Serving
Fall River
Compare Zip Codes
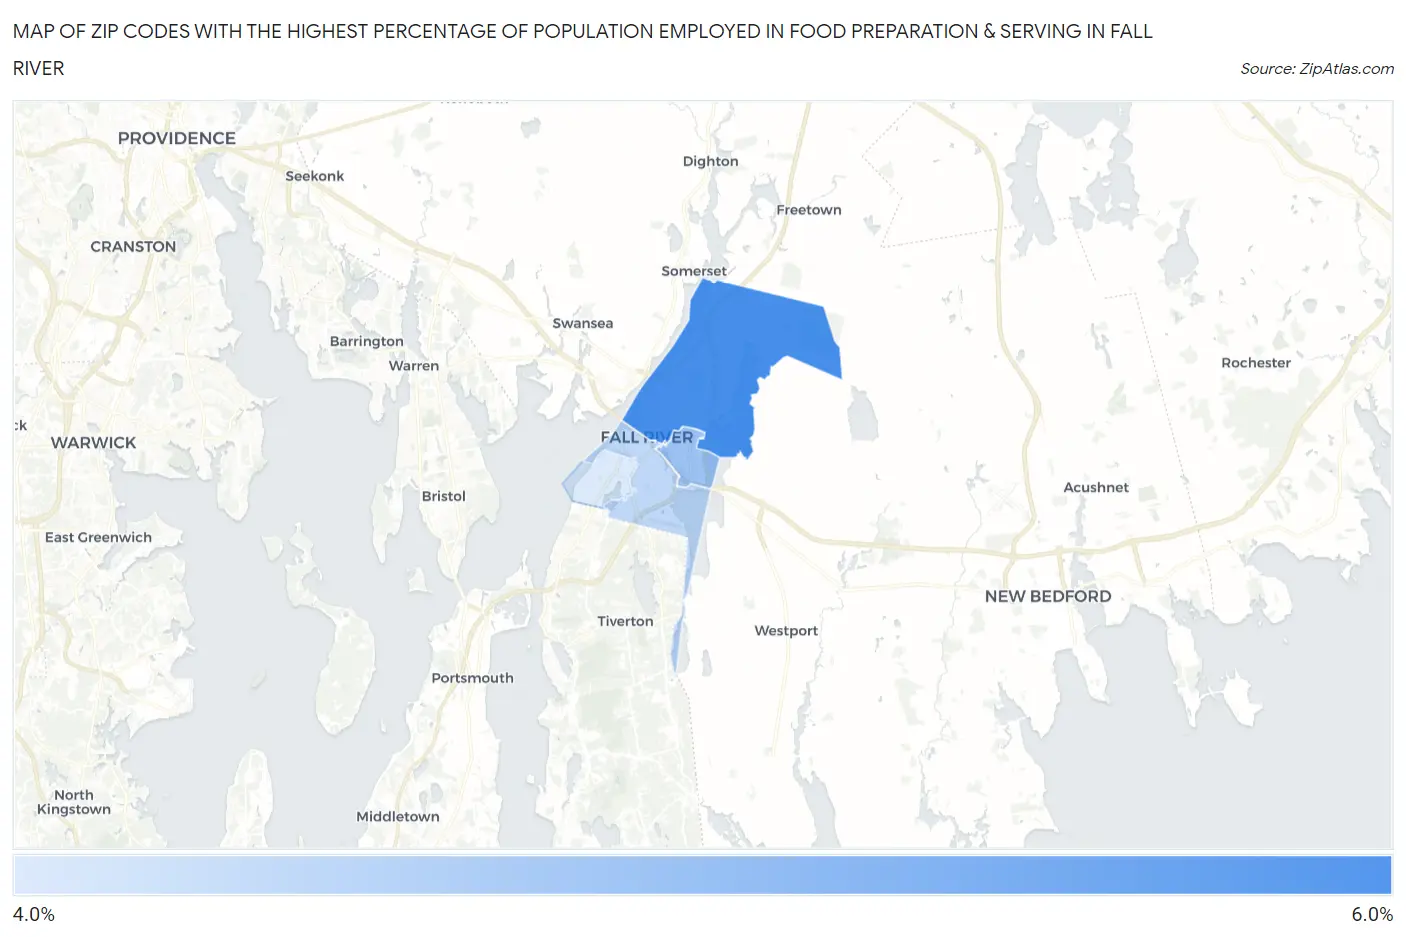
Map of Zip Codes with the Highest Percentage of Population Employed in Food Preparation & Serving in Fall River
4.5%
5.9%
Zip Codes with the Highest Percentage of Population Employed in Food Preparation & Serving in Fall River, MA
| Zip Code | % Employed | vs State | vs National | |
| 1. | 02720 | 5.9% | 4.6%(+1.30)#122 | 5.3%(+0.624)#9,645 |
| 2. | 02723 | 5.1% | 4.6%(+0.491)#169 | 5.3%(-0.184)#12,541 |
| 3. | 02721 | 4.8% | 4.6%(+0.151)#190 | 5.3%(-0.525)#13,917 |
| 4. | 02724 | 4.5% | 4.6%(-0.123)#221 | 5.3%(-0.799)#15,080 |
1
Common Questions
What are the Top 3 Zip Codes with the Highest Percentage of Population Employed in Food Preparation & Serving in Fall River, MA?
Top 3 Zip Codes with the Highest Percentage of Population Employed in Food Preparation & Serving in Fall River, MA are:
What zip code has the Highest Percentage of Population Employed in Food Preparation & Serving in Fall River, MA?
02720 has the Highest Percentage of Population Employed in Food Preparation & Serving in Fall River, MA with 5.9%.
What is the Percentage of Population Employed in Food Preparation & Serving in Fall River, MA?
Percentage of Population Employed in Food Preparation & Serving in Fall River is 5.1%.
What is the Percentage of Population Employed in Food Preparation & Serving in Massachusetts?
Percentage of Population Employed in Food Preparation & Serving in Massachusetts is 4.6%.
What is the Percentage of Population Employed in Food Preparation & Serving in the United States?
Percentage of Population Employed in Food Preparation & Serving in the United States is 5.3%.