Chelsea, MA Map & Demographics
Chelsea Map
Chelsea Overview
$30,454
PER CAPITA INCOME
$70,525
AVG FAMILY INCOME
$71,051
AVG HOUSEHOLD INCOME
15.6%
WAGE / INCOME GAP [ % ]
84.4¢/ $1
WAGE / INCOME GAP [ $ ]
$9,707
FAMILY INCOME DEFICIT
0.45
INEQUALITY / GINI INDEX
39,890
TOTAL POPULATION
20,891
MALE POPULATION
18,999
FEMALE POPULATION
109.96
MALES / 100 FEMALES
90.94
FEMALES / 100 MALES
34.5
MEDIAN AGE
3.8
AVG FAMILY SIZE
2.9
AVG HOUSEHOLD SIZE
21,782
LABOR FORCE [ PEOPLE ]
68.7%
PERCENT IN LABOR FORCE
8.9%
UNEMPLOYMENT RATE
Chelsea Zip Codes
Income in Chelsea
Income Overview in Chelsea
Per Capita Income in Chelsea is $30,454, while median incomes of families and households are $70,525 and $71,051 respectively.
| Characteristic | Number | Measure |
| Per Capita Income | 39,890 | $30,454 |
| Median Family Income | 7,403 | $70,525 |
| Mean Family Income | 7,403 | $92,504 |
| Median Household Income | 13,386 | $71,051 |
| Mean Household Income | 13,386 | $87,148 |
| Income Deficit | 7,403 | $9,707 |
| Wage / Income Gap (%) | 39,890 | 15.57% |
| Wage / Income Gap ($) | 39,890 | 84.43¢ per $1 |
| Gini / Inequality Index | 39,890 | 0.45 |
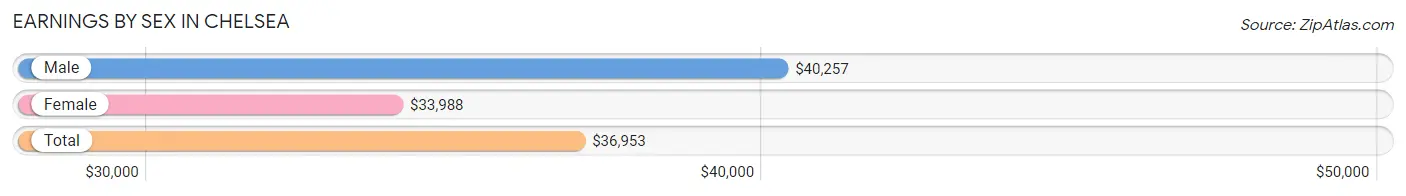
Earnings by Sex in Chelsea
Average Earnings in Chelsea are $36,953, $40,257 for men and $33,988 for women, a difference of 15.6%.
| Sex | Number | Average Earnings |
| Male | 12,723 (57.4%) | $40,257 |
| Female | 9,437 (42.6%) | $33,988 |
| Total | 22,160 (100.0%) | $36,953 |
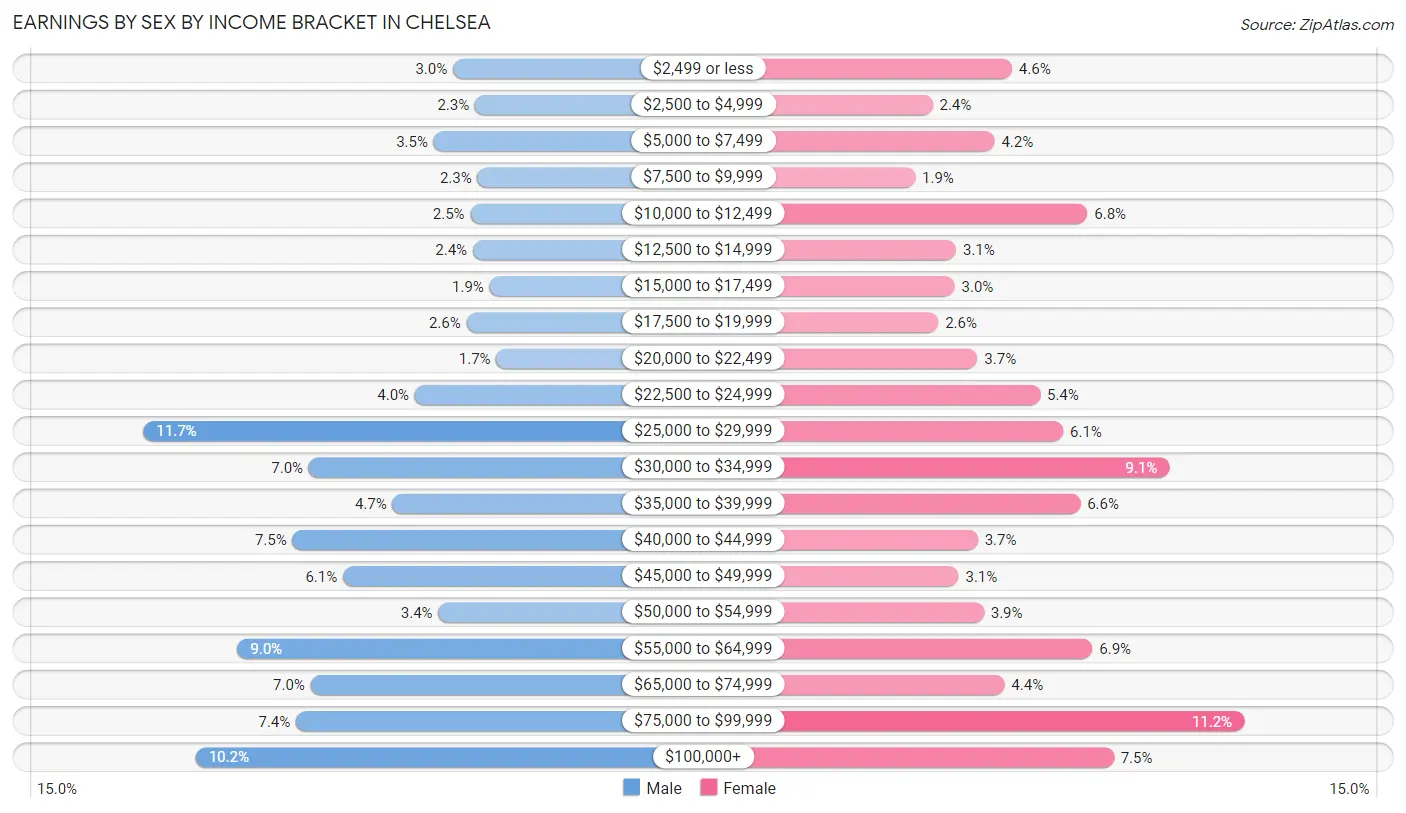
Earnings by Sex by Income Bracket in Chelsea
The most common earnings brackets in Chelsea are $25,000 to $29,999 for men (1,484 | 11.7%) and $75,000 to $99,999 for women (1,053 | 11.2%).
| Income | Male | Female |
| $2,499 or less | 377 (3.0%) | 438 (4.6%) |
| $2,500 to $4,999 | 298 (2.3%) | 227 (2.4%) |
| $5,000 to $7,499 | 445 (3.5%) | 392 (4.2%) |
| $7,500 to $9,999 | 289 (2.3%) | 181 (1.9%) |
| $10,000 to $12,499 | 314 (2.5%) | 638 (6.8%) |
| $12,500 to $14,999 | 305 (2.4%) | 290 (3.1%) |
| $15,000 to $17,499 | 246 (1.9%) | 286 (3.0%) |
| $17,500 to $19,999 | 328 (2.6%) | 243 (2.6%) |
| $20,000 to $22,499 | 221 (1.7%) | 346 (3.7%) |
| $22,500 to $24,999 | 513 (4.0%) | 512 (5.4%) |
| $25,000 to $29,999 | 1,484 (11.7%) | 574 (6.1%) |
| $30,000 to $34,999 | 892 (7.0%) | 855 (9.1%) |
| $35,000 to $39,999 | 593 (4.7%) | 619 (6.6%) |
| $40,000 to $44,999 | 951 (7.5%) | 347 (3.7%) |
| $45,000 to $49,999 | 770 (6.0%) | 296 (3.1%) |
| $50,000 to $54,999 | 429 (3.4%) | 363 (3.8%) |
| $55,000 to $64,999 | 1,148 (9.0%) | 651 (6.9%) |
| $65,000 to $74,999 | 886 (7.0%) | 418 (4.4%) |
| $75,000 to $99,999 | 938 (7.4%) | 1,053 (11.2%) |
| $100,000+ | 1,296 (10.2%) | 708 (7.5%) |
| Total | 12,723 (100.0%) | 9,437 (100.0%) |
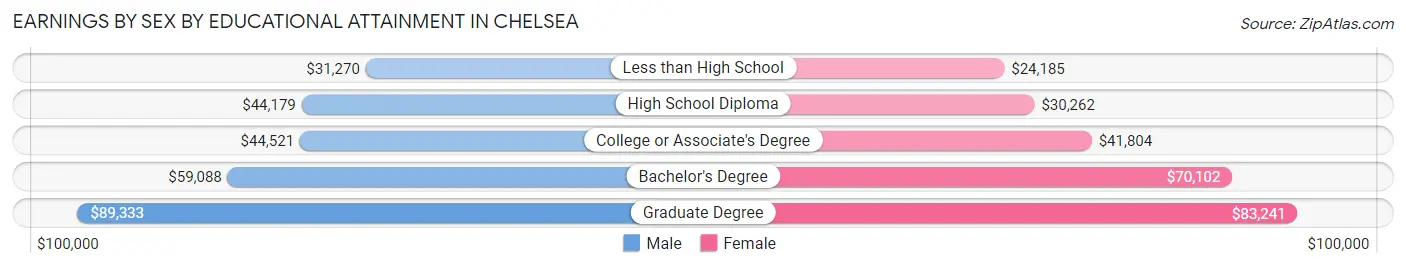
Earnings by Sex by Educational Attainment in Chelsea
Average earnings in Chelsea are $42,721 for men and $34,722 for women, a difference of 18.7%. Men with an educational attainment of graduate degree enjoy the highest average annual earnings of $89,333, while those with less than high school education earn the least with $31,270. Women with an educational attainment of graduate degree earn the most with the average annual earnings of $83,241, while those with less than high school education have the smallest earnings of $24,185.
| Educational Attainment | Male Income | Female Income |
| Less than High School | $31,270 | $24,185 |
| High School Diploma | $44,179 | $30,262 |
| College or Associate's Degree | $44,521 | $41,804 |
| Bachelor's Degree | $59,088 | $70,102 |
| Graduate Degree | $89,333 | $83,241 |
| Total | $42,721 | $34,722 |
Family Income in Chelsea
Family Income Brackets in Chelsea
According to the Chelsea family income data, there are 1,370 families falling into the $100,000 to $149,999 income range, which is the most common income bracket and makes up 18.5% of all families. Conversely, the $10,000 to $14,999 income bracket is the least frequent group with only 296 families (4.0%) belonging to this category.
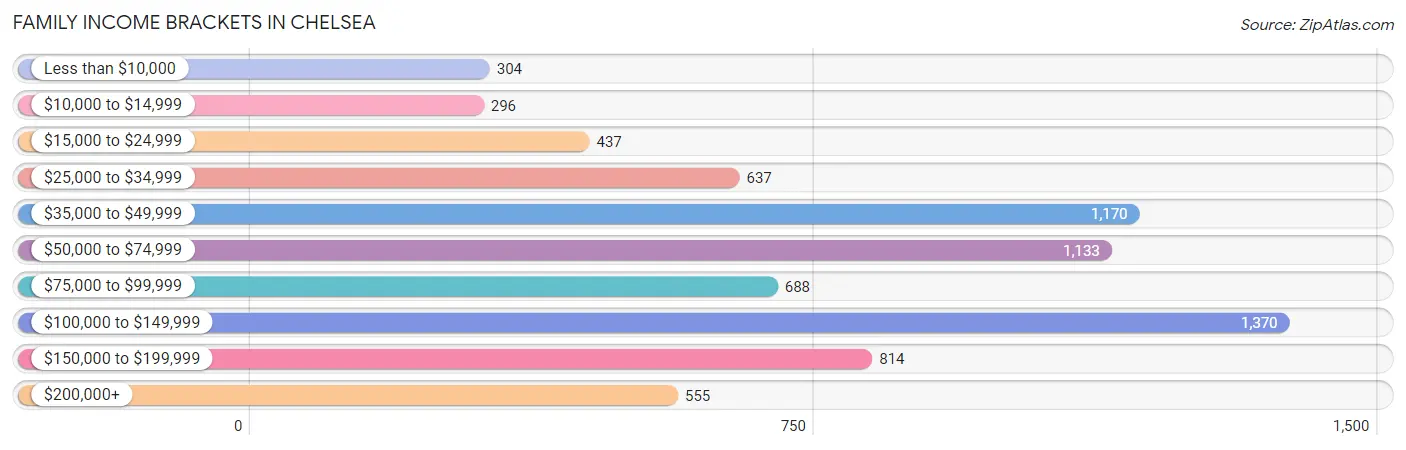
| Income Bracket | # Families | % Families |
| Less than $10,000 | 304 | 4.1% |
| $10,000 to $14,999 | 296 | 4.0% |
| $15,000 to $24,999 | 437 | 5.9% |
| $25,000 to $34,999 | 637 | 8.6% |
| $35,000 to $49,999 | 1,170 | 15.8% |
| $50,000 to $74,999 | 1,133 | 15.3% |
| $75,000 to $99,999 | 688 | 9.3% |
| $100,000 to $149,999 | 1,370 | 18.5% |
| $150,000 to $199,999 | 814 | 11.0% |
| $200,000+ | 555 | 7.5% |
Family Income by Famaliy Size in Chelsea
7+ person families (481 | 6.5%) account for the highest median family income in Chelsea with $151,475 per family, while 2-person families (2,193 | 29.6%) have the highest median income of $33,822 per family member.
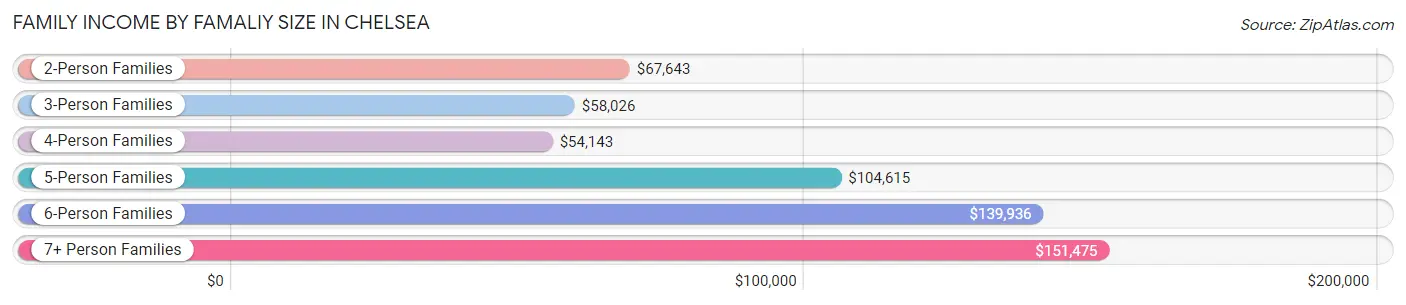
| Income Bracket | # Families | Median Income |
| 2-Person Families | 2,193 (29.6%) | $67,643 |
| 3-Person Families | 1,732 (23.4%) | $58,026 |
| 4-Person Families | 1,734 (23.4%) | $54,143 |
| 5-Person Families | 1,038 (14.0%) | $104,615 |
| 6-Person Families | 225 (3.0%) | $139,936 |
| 7+ Person Families | 481 (6.5%) | $151,475 |
| Total | 7,403 (100.0%) | $70,525 |
Family Income by Number of Earners in Chelsea
The median family income in Chelsea is $70,525, with families comprising 3+ earners (1,774) having the highest median family income of $137,835, while families with no earners (450) have the lowest median family income of $15,461, accounting for 24.0% and 6.1% of families, respectively.
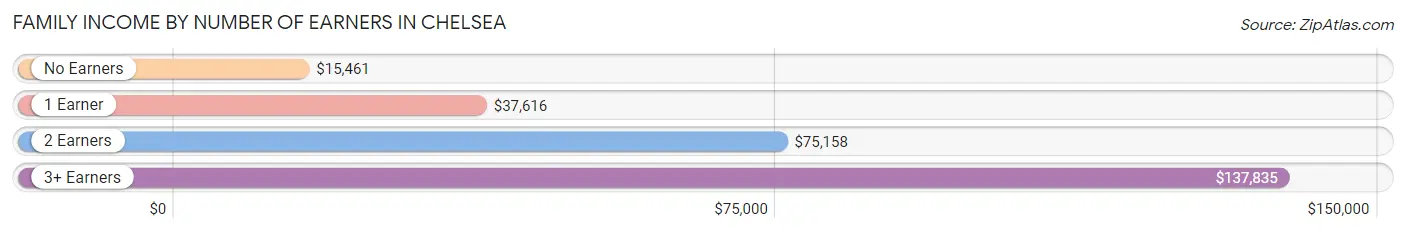
| Number of Earners | # Families | Median Income |
| No Earners | 450 (6.1%) | $15,461 |
| 1 Earner | 2,016 (27.2%) | $37,616 |
| 2 Earners | 3,163 (42.7%) | $75,158 |
| 3+ Earners | 1,774 (24.0%) | $137,835 |
| Total | 7,403 (100.0%) | $70,525 |
Household Income in Chelsea
Household Income Brackets in Chelsea
With 2,691 households falling in the category, the $100,000 to $149,999 income range is the most frequent in Chelsea, accounting for 20.1% of all households. In contrast, only 897 households (6.7%) fall into the $10,000 to $14,999 income bracket, making it the least populous group.
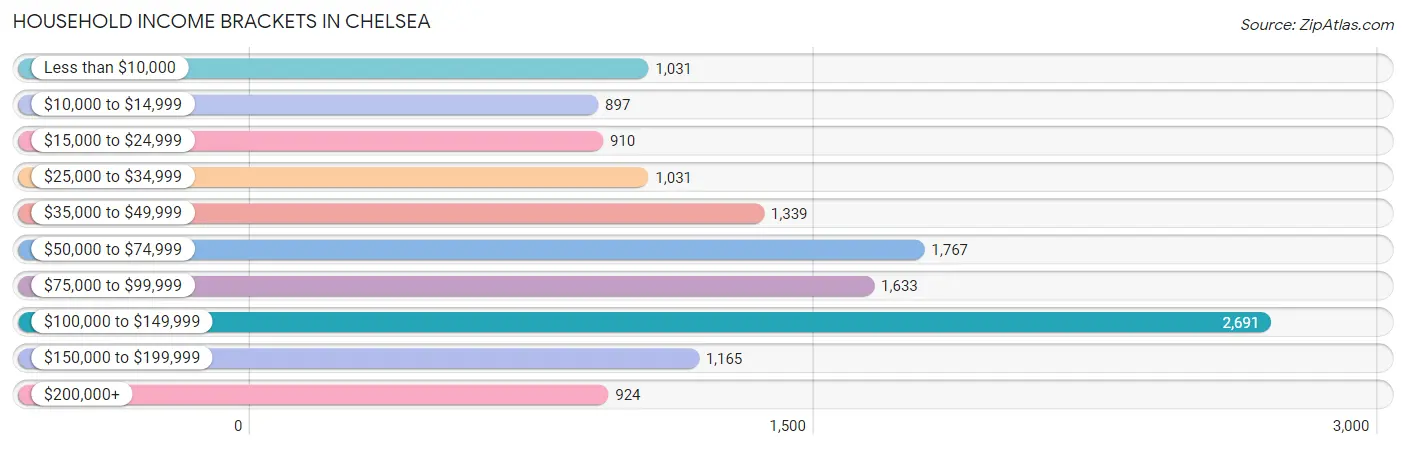
| Income Bracket | # Households | % Households |
| Less than $10,000 | 1,031 | 7.7% |
| $10,000 to $14,999 | 897 | 6.7% |
| $15,000 to $24,999 | 910 | 6.8% |
| $25,000 to $34,999 | 1,031 | 7.7% |
| $35,000 to $49,999 | 1,339 | 10.0% |
| $50,000 to $74,999 | 1,767 | 13.2% |
| $75,000 to $99,999 | 1,633 | 12.2% |
| $100,000 to $149,999 | 2,691 | 20.1% |
| $150,000 to $199,999 | 1,165 | 8.7% |
| $200,000+ | 924 | 6.9% |
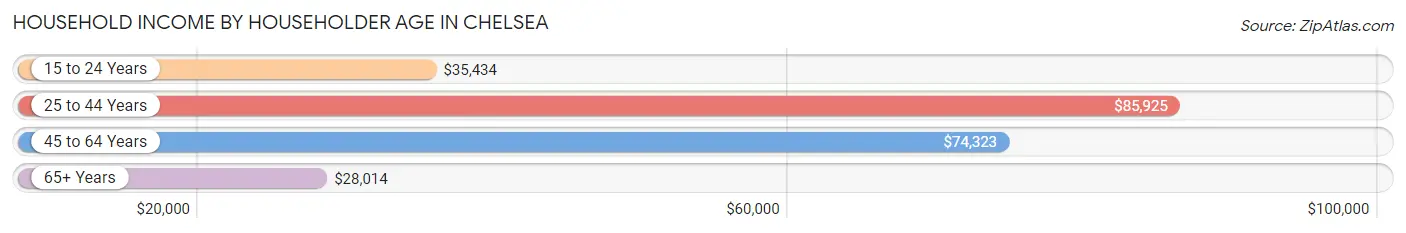
Household Income by Householder Age in Chelsea
The median household income in Chelsea is $71,051, with the highest median household income of $85,925 found in the 25 to 44 years age bracket for the primary householder. A total of 5,798 households (43.3%) fall into this category. Meanwhile, the 65+ years age bracket for the primary householder has the lowest median household income of $28,014, with 2,426 households (18.1%) in this group.
| Income Bracket | # Households | Median Income |
| 15 to 24 Years | 343 (2.6%) | $35,434 |
| 25 to 44 Years | 5,798 (43.3%) | $85,925 |
| 45 to 64 Years | 4,819 (36.0%) | $74,323 |
| 65+ Years | 2,426 (18.1%) | $28,014 |
| Total | 13,386 (100.0%) | $71,051 |
Poverty in Chelsea
Income Below Poverty by Sex and Age in Chelsea
With 19.9% poverty level for males and 23.1% for females among the residents of Chelsea, 15 year old males and 16 and 17 year old females are the most vulnerable to poverty, with 114 males (44.2%) and 230 females (45.7%) in their respective age groups living below the poverty level.
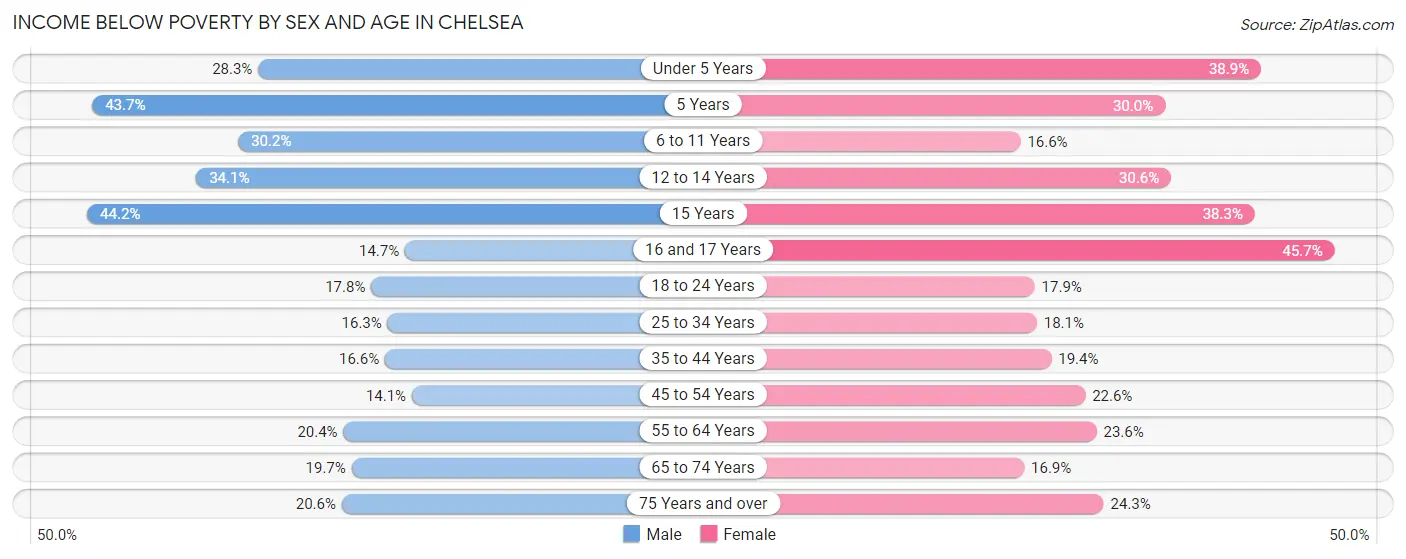
| Age Bracket | Male | Female |
| Under 5 Years | 409 (28.3%) | 592 (38.9%) |
| 5 Years | 101 (43.7%) | 15 (30.0%) |
| 6 to 11 Years | 397 (30.2%) | 167 (16.6%) |
| 12 to 14 Years | 231 (34.1%) | 253 (30.6%) |
| 15 Years | 114 (44.2%) | 151 (38.3%) |
| 16 and 17 Years | 67 (14.7%) | 230 (45.7%) |
| 18 to 24 Years | 326 (17.8%) | 329 (17.9%) |
| 25 to 34 Years | 690 (16.3%) | 582 (18.1%) |
| 35 to 44 Years | 538 (16.6%) | 555 (19.4%) |
| 45 to 54 Years | 390 (14.1%) | 566 (22.6%) |
| 55 to 64 Years | 487 (20.4%) | 412 (23.6%) |
| 65 to 74 Years | 223 (19.7%) | 177 (16.9%) |
| 75 Years and over | 125 (20.6%) | 227 (24.3%) |
| Total | 4,098 (19.9%) | 4,256 (23.1%) |
Income Above Poverty by Sex and Age in Chelsea
According to the poverty statistics in Chelsea, males aged 45 to 54 years and females aged 6 to 11 years are the age groups that are most secure financially, with 86.0% of males and 83.4% of females in these age groups living above the poverty line.
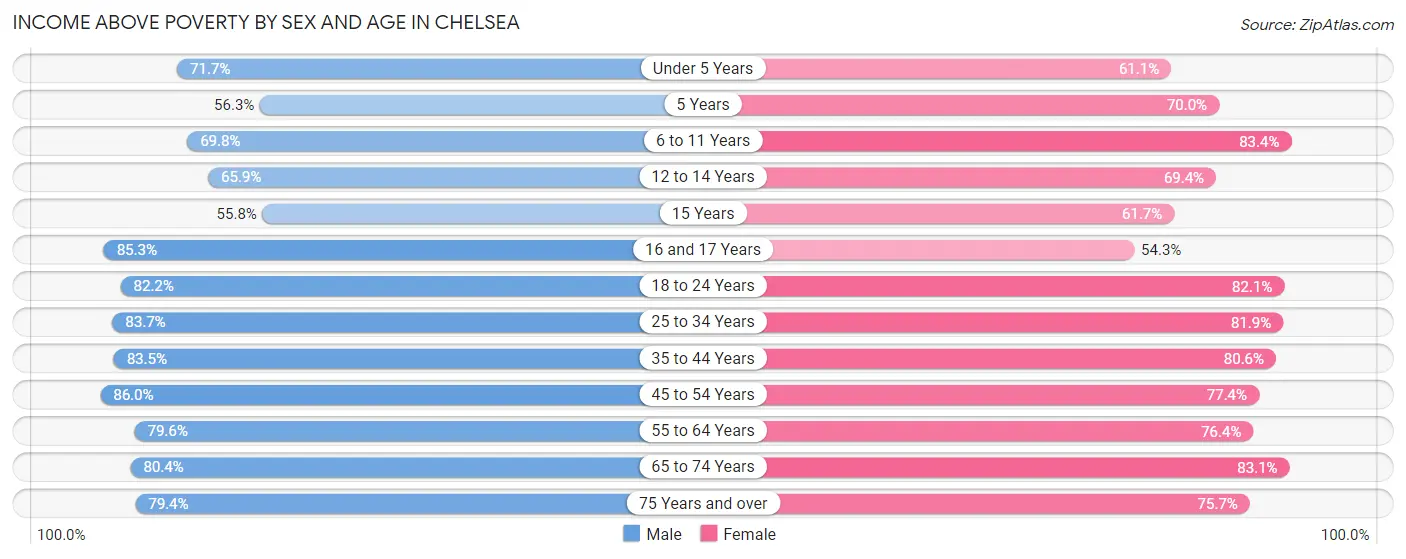
| Age Bracket | Male | Female |
| Under 5 Years | 1,035 (71.7%) | 930 (61.1%) |
| 5 Years | 130 (56.3%) | 35 (70.0%) |
| 6 to 11 Years | 918 (69.8%) | 840 (83.4%) |
| 12 to 14 Years | 447 (65.9%) | 575 (69.4%) |
| 15 Years | 144 (55.8%) | 243 (61.7%) |
| 16 and 17 Years | 389 (85.3%) | 273 (54.3%) |
| 18 to 24 Years | 1,502 (82.2%) | 1,509 (82.1%) |
| 25 to 34 Years | 3,540 (83.7%) | 2,634 (81.9%) |
| 35 to 44 Years | 2,713 (83.5%) | 2,300 (80.6%) |
| 45 to 54 Years | 2,386 (86.0%) | 1,940 (77.4%) |
| 55 to 64 Years | 1,899 (79.6%) | 1,331 (76.4%) |
| 65 to 74 Years | 912 (80.3%) | 869 (83.1%) |
| 75 Years and over | 483 (79.4%) | 707 (75.7%) |
| Total | 16,498 (80.1%) | 14,186 (76.9%) |
Income Below Poverty Among Married-Couple Families in Chelsea
The poverty statistics for married-couple families in Chelsea show that 9.2% or 398 of the total 4,340 families live below the poverty line. Families with 3 or 4 children have the highest poverty rate of 24.7%, comprising of 89 families. On the other hand, families with 5 or more children have the lowest poverty rate of 0.0%, which includes 0 families.
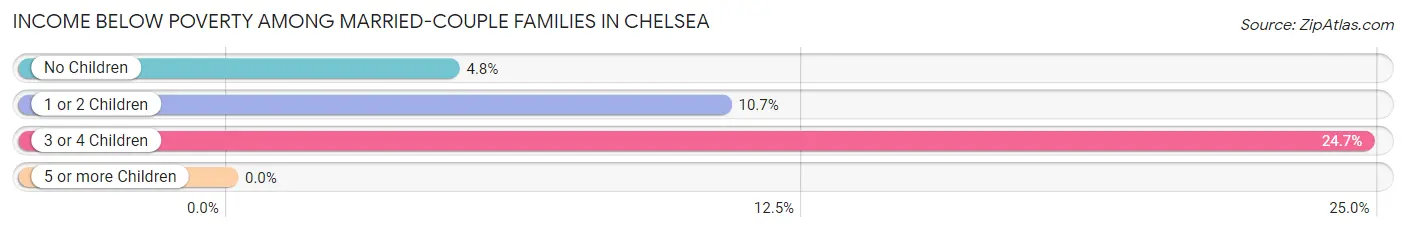
| Children | Above Poverty | Below Poverty |
| No Children | 1,877 (95.2%) | 95 (4.8%) |
| 1 or 2 Children | 1,779 (89.3%) | 214 (10.7%) |
| 3 or 4 Children | 271 (75.3%) | 89 (24.7%) |
| 5 or more Children | 15 (100.0%) | 0 (0.0%) |
| Total | 3,942 (90.8%) | 398 (9.2%) |
Income Below Poverty Among Single-Parent Households in Chelsea
According to the poverty data in Chelsea, 22.8% or 221 single-father households and 31.7% or 663 single-mother households are living below the poverty line. Among single-father households, those with 3 or 4 children have the highest poverty rate, with 85 households (54.5%) experiencing poverty. Likewise, among single-mother households, those with 3 or 4 children have the highest poverty rate, with 142 households (62.6%) falling below the poverty line.
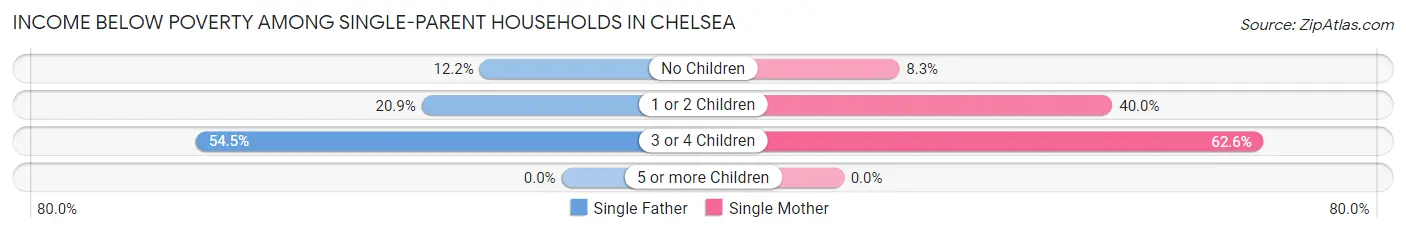
| Children | Single Father | Single Mother |
| No Children | 48 (12.2%) | 59 (8.3%) |
| 1 or 2 Children | 88 (20.8%) | 462 (40.0%) |
| 3 or 4 Children | 85 (54.5%) | 142 (62.6%) |
| 5 or more Children | 0 (0.0%) | 0 (0.0%) |
| Total | 221 (22.8%) | 663 (31.7%) |
Income Below Poverty Among Married-Couple vs Single-Parent Households in Chelsea
The poverty data for Chelsea shows that 398 of the married-couple family households (9.2%) and 884 of the single-parent households (28.9%) are living below the poverty level. Within the married-couple family households, those with 3 or 4 children have the highest poverty rate, with 89 households (24.7%) falling below the poverty line. Among the single-parent households, those with 3 or 4 children have the highest poverty rate, with 227 household (59.3%) living below poverty.
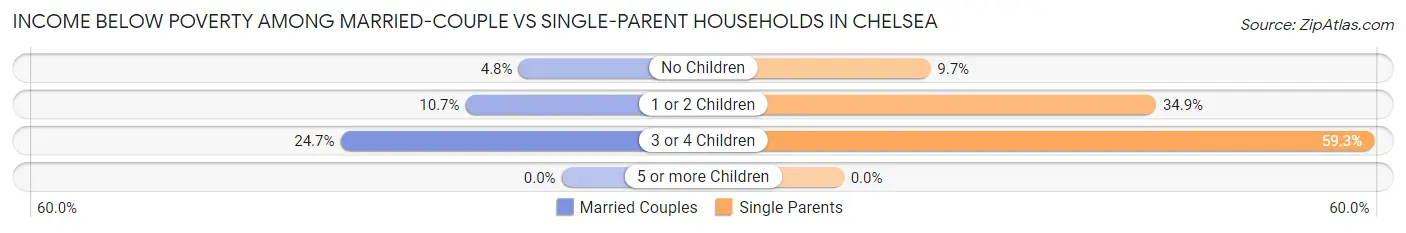
| Children | Married-Couple Families | Single-Parent Households |
| No Children | 95 (4.8%) | 107 (9.7%) |
| 1 or 2 Children | 214 (10.7%) | 550 (34.9%) |
| 3 or 4 Children | 89 (24.7%) | 227 (59.3%) |
| 5 or more Children | 0 (0.0%) | 0 (0.0%) |
| Total | 398 (9.2%) | 884 (28.9%) |
Race in Chelsea
The most populous races in Chelsea are Hispanic or Latino (26,892 | 67.4%), Two or more Races (17,547 | 44.0%), and White / Caucasian (13,536 | 33.9%).
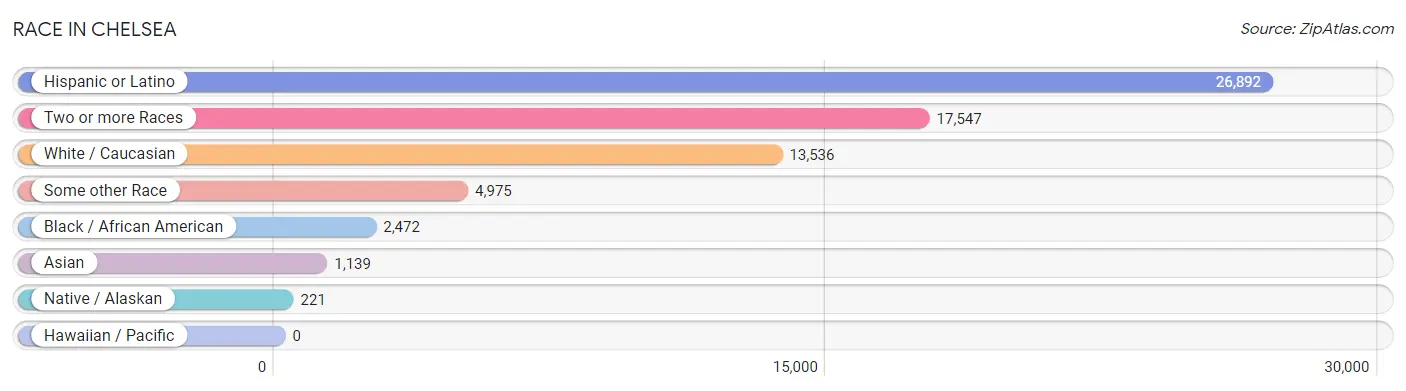
| Race | # Population | % Population |
| Asian | 1,139 | 2.9% |
| Black / African American | 2,472 | 6.2% |
| Hawaiian / Pacific | 0 | 0.0% |
| Hispanic or Latino | 26,892 | 67.4% |
| Native / Alaskan | 221 | 0.5% |
| White / Caucasian | 13,536 | 33.9% |
| Two or more Races | 17,547 | 44.0% |
| Some other Race | 4,975 | 12.5% |
| Total | 39,890 | 100.0% |
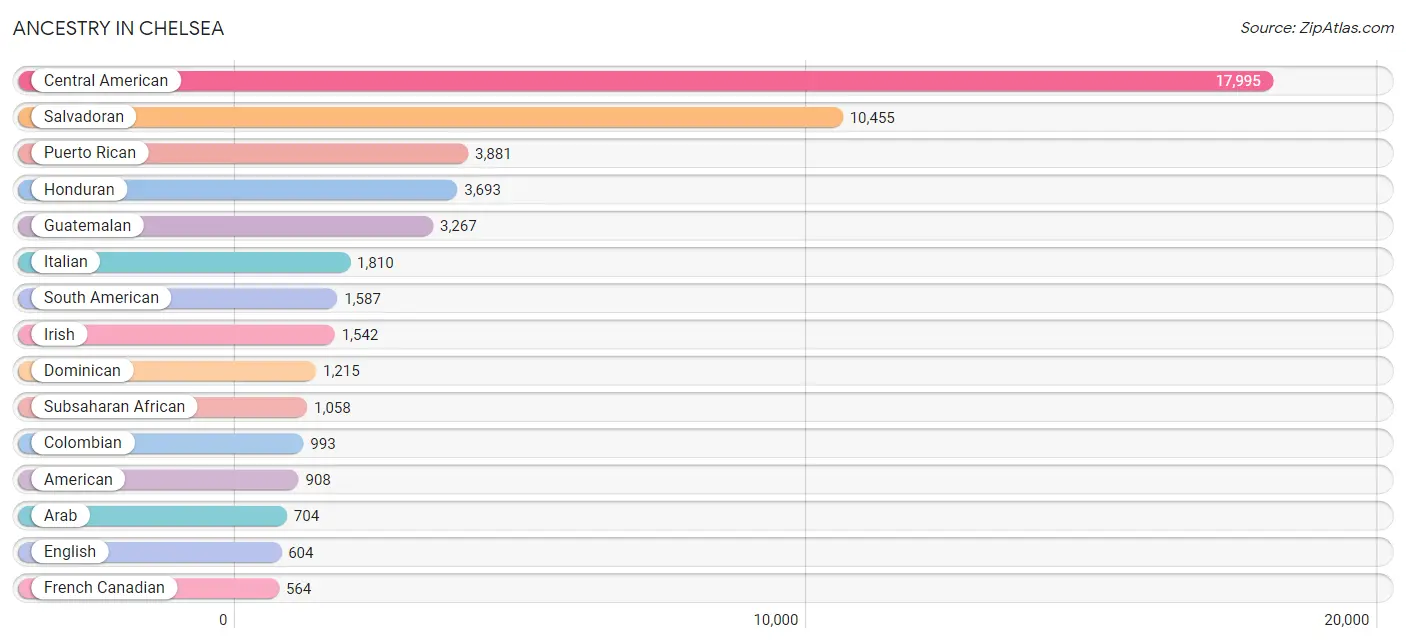
Ancestry in Chelsea
The most populous ancestries reported in Chelsea are Central American (17,995 | 45.1%), Salvadoran (10,455 | 26.2%), Puerto Rican (3,881 | 9.7%), Honduran (3,693 | 9.3%), and Guatemalan (3,267 | 8.2%), together accounting for 98.5% of all Chelsea residents.
| Ancestry | # Population | % Population |
| Afghan | 6 | 0.0% |
| African | 242 | 0.6% |
| Albanian | 79 | 0.2% |
| American | 908 | 2.3% |
| Arab | 704 | 1.8% |
| Argentinean | 5 | 0.0% |
| Armenian | 50 | 0.1% |
| Austrian | 26 | 0.1% |
| Belgian | 28 | 0.1% |
| Bhutanese | 73 | 0.2% |
| Blackfeet | 16 | 0.0% |
| Brazilian | 466 | 1.2% |
| British | 110 | 0.3% |
| Bulgarian | 13 | 0.0% |
| Burmese | 80 | 0.2% |
| Canadian | 82 | 0.2% |
| Cape Verdean | 105 | 0.3% |
| Central American | 17,995 | 45.1% |
| Central American Indian | 217 | 0.5% |
| Chilean | 11 | 0.0% |
| Colombian | 993 | 2.5% |
| Costa Rican | 63 | 0.2% |
| Croatian | 87 | 0.2% |
| Cuban | 89 | 0.2% |
| Czech | 18 | 0.1% |
| Czechoslovakian | 17 | 0.0% |
| Dominican | 1,215 | 3.0% |
| Dutch | 61 | 0.2% |
| Dutch West Indian | 35 | 0.1% |
| Eastern European | 81 | 0.2% |
| Ecuadorian | 129 | 0.3% |
| English | 604 | 1.5% |
| Ethiopian | 380 | 0.9% |
| European | 138 | 0.4% |
| Filipino | 12 | 0.0% |
| Finnish | 10 | 0.0% |
| French | 262 | 0.7% |
| French Canadian | 564 | 1.4% |
| German | 554 | 1.4% |
| Greek | 99 | 0.3% |
| Guatemalan | 3,267 | 8.2% |
| Haitian | 108 | 0.3% |
| Honduran | 3,693 | 9.3% |
| Indian (Asian) | 234 | 0.6% |
| Iranian | 33 | 0.1% |
| Iraqi | 23 | 0.1% |
| Irish | 1,542 | 3.9% |
| Israeli | 24 | 0.1% |
| Italian | 1,810 | 4.5% |
| Jamaican | 111 | 0.3% |
| Japanese | 37 | 0.1% |
| Jordanian | 12 | 0.0% |
| Kenyan | 2 | 0.0% |
| Korean | 35 | 0.1% |
| Lebanese | 72 | 0.2% |
| Liberian | 5 | 0.0% |
| Lithuanian | 49 | 0.1% |
| Mexican | 396 | 1.0% |
| Moroccan | 187 | 0.5% |
| Nicaraguan | 162 | 0.4% |
| Nigerian | 14 | 0.0% |
| Norwegian | 72 | 0.2% |
| Panamanian | 76 | 0.2% |
| Peruvian | 230 | 0.6% |
| Polish | 454 | 1.1% |
| Portuguese | 132 | 0.3% |
| Puerto Rican | 3,881 | 9.7% |
| Romanian | 23 | 0.1% |
| Russian | 165 | 0.4% |
| Salvadoran | 10,455 | 26.2% |
| Scotch-Irish | 21 | 0.1% |
| Scottish | 127 | 0.3% |
| Serbian | 40 | 0.1% |
| Slavic | 12 | 0.0% |
| Slovak | 50 | 0.1% |
| Slovene | 35 | 0.1% |
| Somali | 74 | 0.2% |
| South American | 1,587 | 4.0% |
| Spaniard | 49 | 0.1% |
| Spanish | 14 | 0.0% |
| Sri Lankan | 542 | 1.4% |
| Subsaharan African | 1,058 | 2.6% |
| Sudanese | 138 | 0.4% |
| Swedish | 54 | 0.1% |
| Swiss | 25 | 0.1% |
| Syrian | 9 | 0.0% |
| Thai | 201 | 0.5% |
| Trinidadian and Tobagonian | 42 | 0.1% |
| Turkish | 22 | 0.1% |
| Ugandan | 6 | 0.0% |
| Ukrainian | 33 | 0.1% |
| Venezuelan | 219 | 0.5% |
| West Indian | 14 | 0.0% |
| Yugoslavian | 141 | 0.4% | View All 94 Rows |
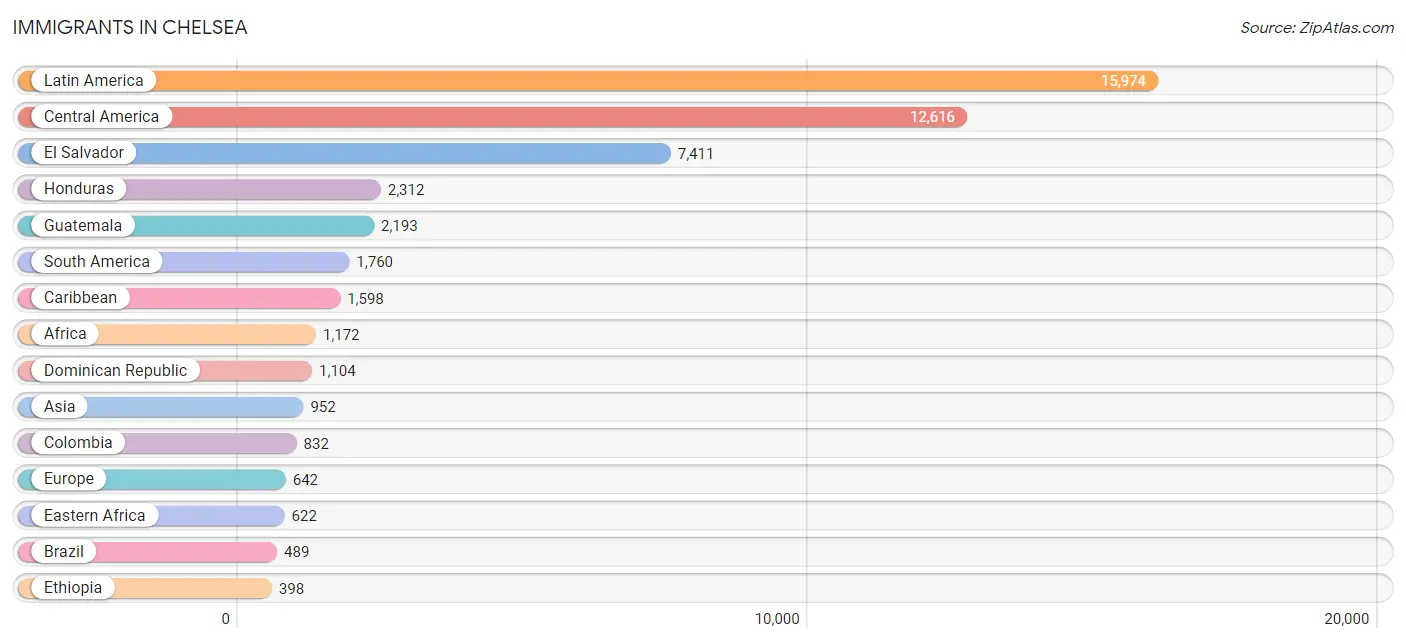
Immigrants in Chelsea
The most numerous immigrant groups reported in Chelsea came from Latin America (15,974 | 40.1%), Central America (12,616 | 31.6%), El Salvador (7,411 | 18.6%), Honduras (2,312 | 5.8%), and Guatemala (2,193 | 5.5%), together accounting for 101.6% of all Chelsea residents.
| Immigration Origin | # Population | % Population |
| Afghanistan | 6 | 0.0% |
| Africa | 1,172 | 2.9% |
| Albania | 78 | 0.2% |
| Asia | 952 | 2.4% |
| Australia | 8 | 0.0% |
| Azores | 38 | 0.1% |
| Bosnia and Herzegovina | 162 | 0.4% |
| Brazil | 489 | 1.2% |
| Bulgaria | 13 | 0.0% |
| Cabo Verde | 57 | 0.1% |
| Cambodia | 10 | 0.0% |
| Cameroon | 110 | 0.3% |
| Canada | 9 | 0.0% |
| Caribbean | 1,598 | 4.0% |
| Central America | 12,616 | 31.6% |
| China | 288 | 0.7% |
| Colombia | 832 | 2.1% |
| Costa Rica | 32 | 0.1% |
| Croatia | 5 | 0.0% |
| Dominican Republic | 1,104 | 2.8% |
| Eastern Africa | 622 | 1.6% |
| Eastern Asia | 342 | 0.9% |
| Eastern Europe | 332 | 0.8% |
| Ecuador | 79 | 0.2% |
| El Salvador | 7,411 | 18.6% |
| England | 12 | 0.0% |
| Eritrea | 39 | 0.1% |
| Ethiopia | 398 | 1.0% |
| Europe | 642 | 1.6% |
| France | 12 | 0.0% |
| Germany | 20 | 0.1% |
| Greece | 28 | 0.1% |
| Guatemala | 2,193 | 5.5% |
| Haiti | 218 | 0.5% |
| Honduras | 2,312 | 5.8% |
| Hong Kong | 77 | 0.2% |
| India | 170 | 0.4% |
| Iran | 12 | 0.0% |
| Iraq | 23 | 0.1% |
| Italy | 49 | 0.1% |
| Jamaica | 89 | 0.2% |
| Japan | 30 | 0.1% |
| Kenya | 2 | 0.0% |
| Korea | 24 | 0.1% |
| Latin America | 15,974 | 40.1% |
| Lebanon | 12 | 0.0% |
| Liberia | 5 | 0.0% |
| Lithuania | 13 | 0.0% |
| Mexico | 203 | 0.5% |
| Middle Africa | 110 | 0.3% |
| Morocco | 184 | 0.5% |
| Nicaragua | 172 | 0.4% |
| Nigeria | 14 | 0.0% |
| Northern Africa | 247 | 0.6% |
| Northern Europe | 38 | 0.1% |
| Oceania | 8 | 0.0% |
| Pakistan | 93 | 0.2% |
| Panama | 37 | 0.1% |
| Peru | 157 | 0.4% |
| Philippines | 22 | 0.1% |
| Poland | 27 | 0.1% |
| Portugal | 49 | 0.1% |
| Russia | 2 | 0.0% |
| Scotland | 6 | 0.0% |
| Serbia | 8 | 0.0% |
| Somalia | 41 | 0.1% |
| South Africa | 11 | 0.0% |
| South America | 1,760 | 4.4% |
| South Central Asia | 288 | 0.7% |
| South Eastern Asia | 244 | 0.6% |
| Southern Europe | 232 | 0.6% |
| Spain | 106 | 0.3% |
| Switzerland | 8 | 0.0% |
| Syria | 21 | 0.1% |
| Thailand | 13 | 0.0% |
| Turkey | 22 | 0.1% |
| Ukraine | 24 | 0.1% |
| Uzbekistan | 7 | 0.0% |
| Venezuela | 203 | 0.5% |
| Vietnam | 199 | 0.5% |
| West Indies | 152 | 0.4% |
| Western Africa | 96 | 0.2% |
| Western Asia | 78 | 0.2% |
| Western Europe | 40 | 0.1% | View All 84 Rows |
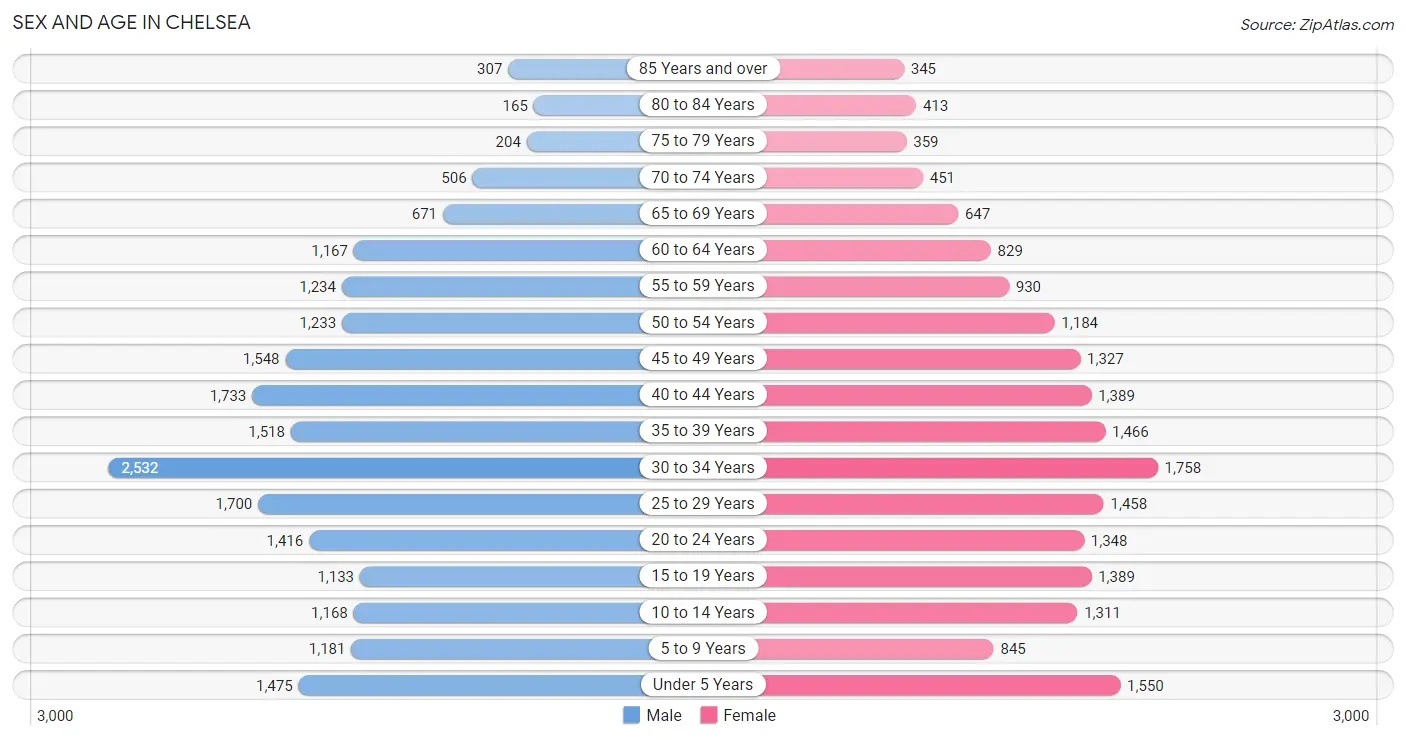
Sex and Age in Chelsea
Sex and Age in Chelsea
The most populous age groups in Chelsea are 30 to 34 Years (2,532 | 12.1%) for men and 30 to 34 Years (1,758 | 9.2%) for women.
| Age Bracket | Male | Female |
| Under 5 Years | 1,475 (7.1%) | 1,550 (8.2%) |
| 5 to 9 Years | 1,181 (5.7%) | 845 (4.4%) |
| 10 to 14 Years | 1,168 (5.6%) | 1,311 (6.9%) |
| 15 to 19 Years | 1,133 (5.4%) | 1,389 (7.3%) |
| 20 to 24 Years | 1,416 (6.8%) | 1,348 (7.1%) |
| 25 to 29 Years | 1,700 (8.1%) | 1,458 (7.7%) |
| 30 to 34 Years | 2,532 (12.1%) | 1,758 (9.2%) |
| 35 to 39 Years | 1,518 (7.3%) | 1,466 (7.7%) |
| 40 to 44 Years | 1,733 (8.3%) | 1,389 (7.3%) |
| 45 to 49 Years | 1,548 (7.4%) | 1,327 (7.0%) |
| 50 to 54 Years | 1,233 (5.9%) | 1,184 (6.2%) |
| 55 to 59 Years | 1,234 (5.9%) | 930 (4.9%) |
| 60 to 64 Years | 1,167 (5.6%) | 829 (4.4%) |
| 65 to 69 Years | 671 (3.2%) | 647 (3.4%) |
| 70 to 74 Years | 506 (2.4%) | 451 (2.4%) |
| 75 to 79 Years | 204 (1.0%) | 359 (1.9%) |
| 80 to 84 Years | 165 (0.8%) | 413 (2.2%) |
| 85 Years and over | 307 (1.5%) | 345 (1.8%) |
| Total | 20,891 (100.0%) | 18,999 (100.0%) |
Families and Households in Chelsea
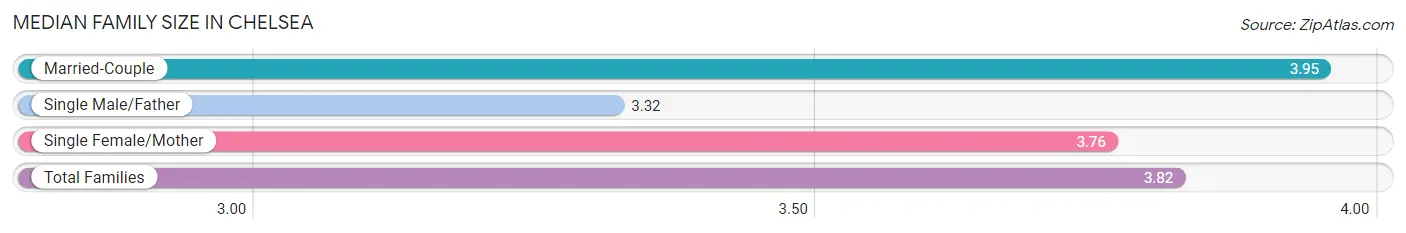
Median Family Size in Chelsea
The median family size in Chelsea is 3.82 persons per family, with married-couple families (4,340 | 58.6%) accounting for the largest median family size of 3.95 persons per family. On the other hand, single male/father families (971 | 13.1%) represent the smallest median family size with 3.32 persons per family.
| Family Type | # Families | Family Size |
| Married-Couple | 4,340 (58.6%) | 3.95 |
| Single Male/Father | 971 (13.1%) | 3.32 |
| Single Female/Mother | 2,092 (28.3%) | 3.76 |
| Total Families | 7,403 (100.0%) | 3.82 |
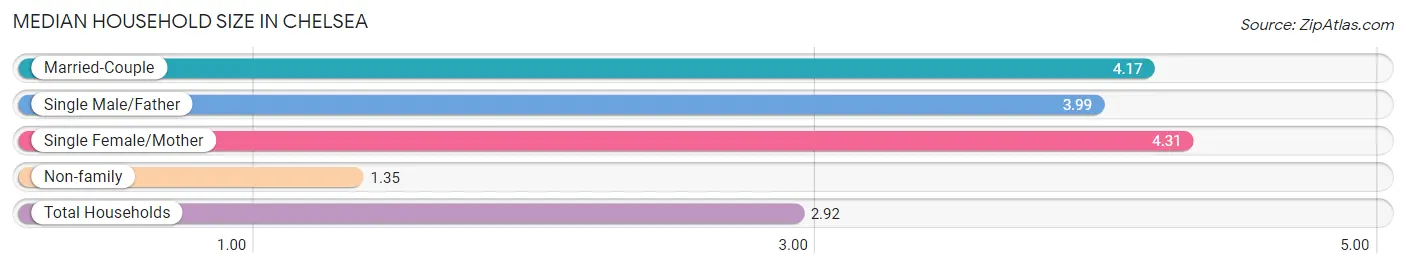
Median Household Size in Chelsea
The median household size in Chelsea is 2.92 persons per household, with single female/mother households (2,092 | 15.6%) accounting for the largest median household size of 4.31 persons per household. non-family households (5,983 | 44.7%) represent the smallest median household size with 1.35 persons per household.
| Household Type | # Households | Household Size |
| Married-Couple | 4,340 (32.4%) | 4.17 |
| Single Male/Father | 971 (7.2%) | 3.99 |
| Single Female/Mother | 2,092 (15.6%) | 4.31 |
| Non-family | 5,983 (44.7%) | 1.35 |
| Total Households | 13,386 (100.0%) | 2.92 |
Household Size by Marriage Status in Chelsea
Out of a total of 13,386 households in Chelsea, 7,403 (55.3%) are family households, while 5,983 (44.7%) are nonfamily households. The most numerous type of family households are 2-person households, comprising 1,769, and the most common type of nonfamily households are 1-person households, comprising 4,566.
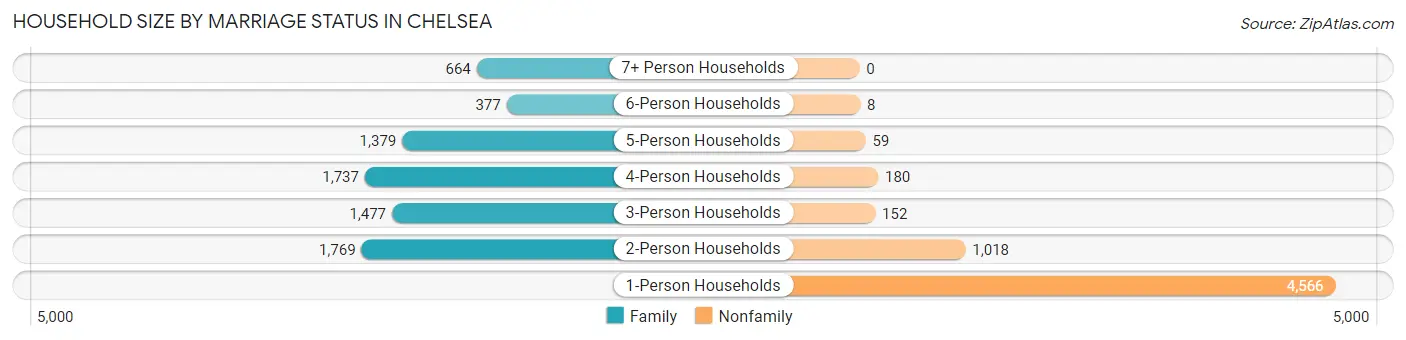
| Household Size | Family Households | Nonfamily Households |
| 1-Person Households | - | 4,566 (34.1%) |
| 2-Person Households | 1,769 (13.2%) | 1,018 (7.6%) |
| 3-Person Households | 1,477 (11.0%) | 152 (1.1%) |
| 4-Person Households | 1,737 (13.0%) | 180 (1.3%) |
| 5-Person Households | 1,379 (10.3%) | 59 (0.4%) |
| 6-Person Households | 377 (2.8%) | 8 (0.1%) |
| 7+ Person Households | 664 (5.0%) | 0 (0.0%) |
| Total | 7,403 (55.3%) | 5,983 (44.7%) |
Female Fertility in Chelsea
Fertility by Age in Chelsea
Average fertility rate in Chelsea is 39.0 births per 1,000 women. Women in the age bracket of 20 to 34 years have the highest fertility rate with 64.0 births per 1,000 women. Women in the age bracket of 20 to 34 years acount for 73.2% of all women with births.
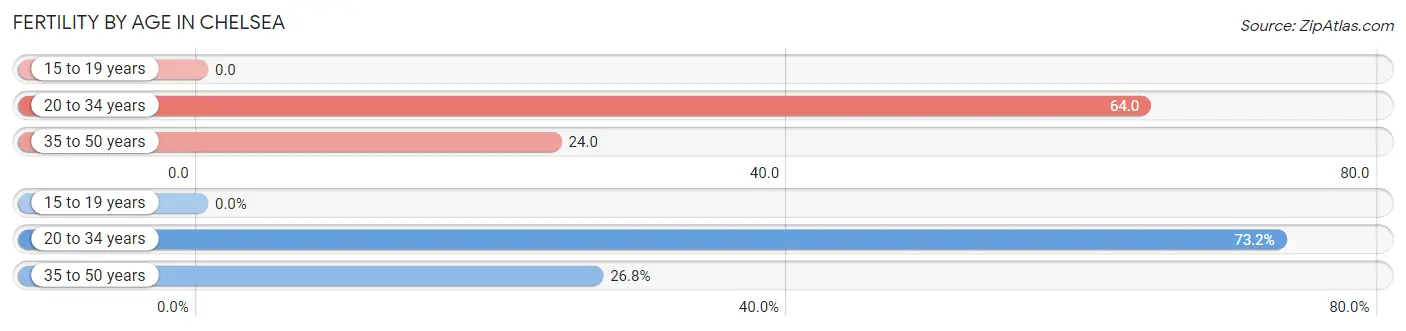
| Age Bracket | Women with Births | Births / 1,000 Women |
| 15 to 19 years | 0 (0.0%) | 0.0 |
| 20 to 34 years | 292 (73.2%) | 64.0 |
| 35 to 50 years | 107 (26.8%) | 24.0 |
| Total | 399 (100.0%) | 39.0 |
Fertility by Age by Marriage Status in Chelsea
50.1% of women with births (399) in Chelsea are married. The highest percentage of unmarried women with births falls into 20 to 34 years age bracket with 65.4% of them unmarried at the time of birth, while the lowest percentage of unmarried women with births belong to 35 to 50 years age bracket with 7.5% of them unmarried.
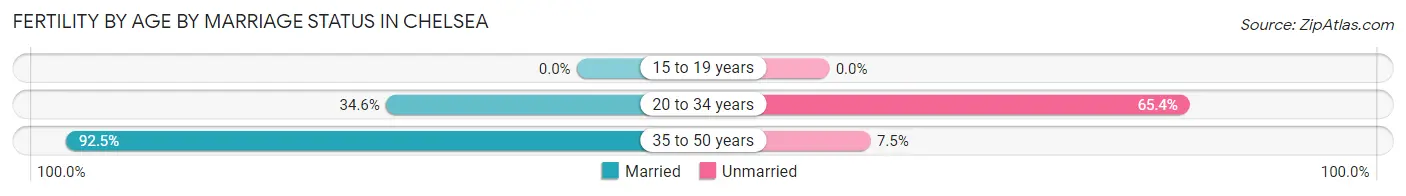
| Age Bracket | Married | Unmarried |
| 15 to 19 years | 0 (0.0%) | 0 (0.0%) |
| 20 to 34 years | 101 (34.6%) | 191 (65.4%) |
| 35 to 50 years | 99 (92.5%) | 8 (7.5%) |
| Total | 200 (50.1%) | 199 (49.9%) |
Fertility by Education in Chelsea
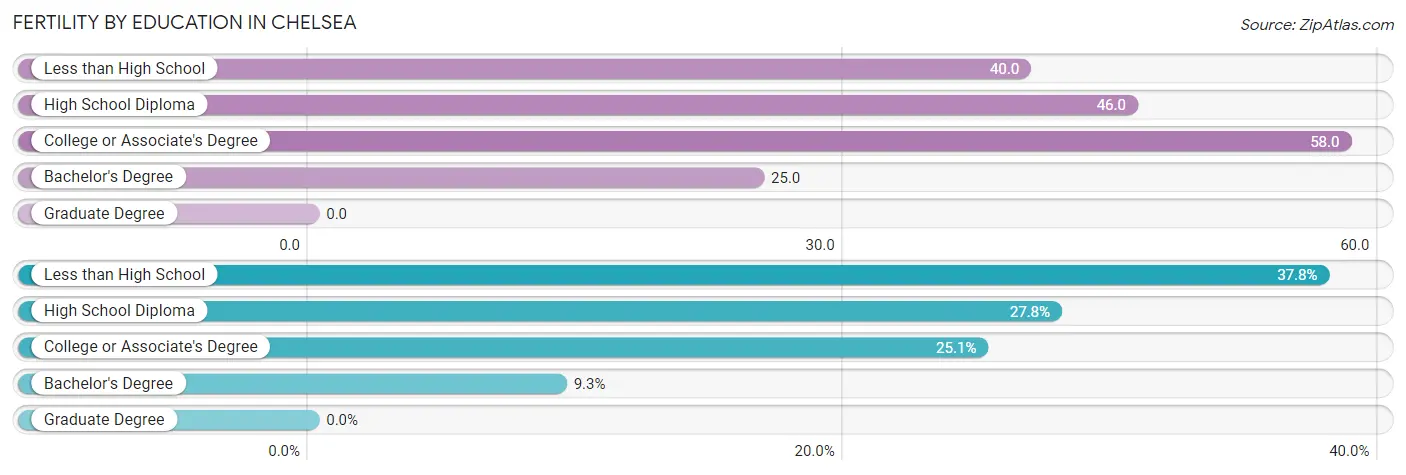
| Educational Attainment | Women with Births | Births / 1,000 Women |
| Less than High School | 151 (37.8%) | 40.0 |
| High School Diploma | 111 (27.8%) | 46.0 |
| College or Associate's Degree | 100 (25.1%) | 58.0 |
| Bachelor's Degree | 37 (9.3%) | 25.0 |
| Graduate Degree | 0 (0.0%) | 0.0 |
| Total | 399 (100.0%) | 39.0 |
Fertility by Education by Marriage Status in Chelsea
49.9% of women with births in Chelsea are unmarried. Women with the educational attainment of bachelor's degree are most likely to be married with 78.4% of them married at childbirth, while women with the educational attainment of college or associate's degree are least likely to be married with 94.0% of them unmarried at childbirth.
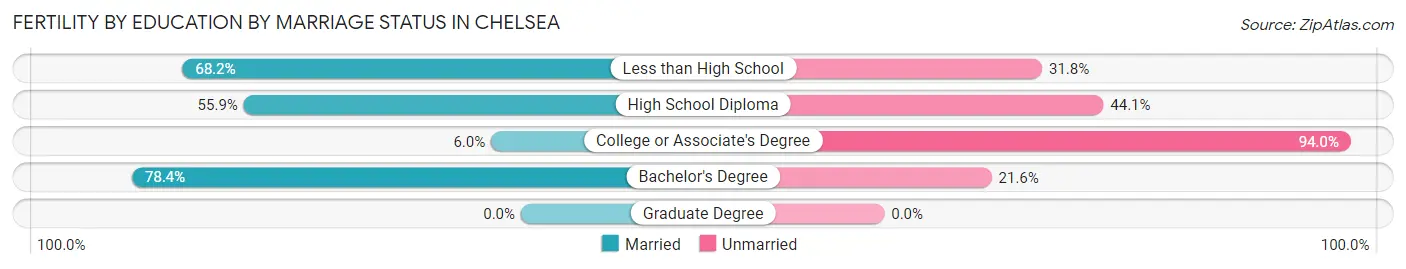
| Educational Attainment | Married | Unmarried |
| Less than High School | 103 (68.2%) | 48 (31.8%) |
| High School Diploma | 62 (55.9%) | 49 (44.1%) |
| College or Associate's Degree | 6 (6.0%) | 94 (94.0%) |
| Bachelor's Degree | 29 (78.4%) | 8 (21.6%) |
| Graduate Degree | 0 (0.0%) | 0 (0.0%) |
| Total | 200 (50.1%) | 199 (49.9%) |
Employment Characteristics in Chelsea
Employment by Class of Employer in Chelsea
Among the 19,408 employed individuals in Chelsea, private company employees (15,019 | 77.4%), not-for-profit organizations (1,272 | 6.6%), and self-employed (not incorporated) (1,062 | 5.5%) make up the most common classes of employment.
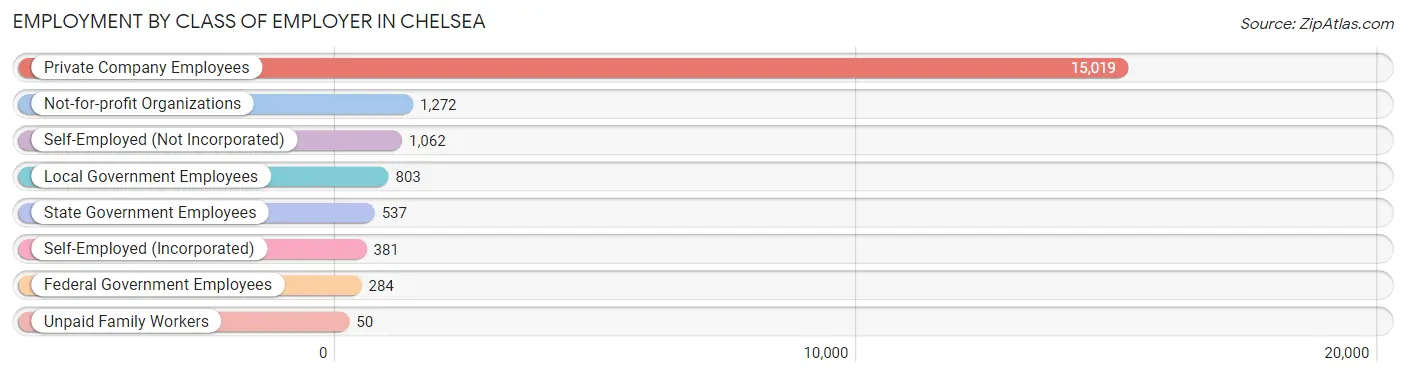
| Employer Class | # Employees | % Employees |
| Private Company Employees | 15,019 | 77.4% |
| Self-Employed (Incorporated) | 381 | 2.0% |
| Self-Employed (Not Incorporated) | 1,062 | 5.5% |
| Not-for-profit Organizations | 1,272 | 6.6% |
| Local Government Employees | 803 | 4.1% |
| State Government Employees | 537 | 2.8% |
| Federal Government Employees | 284 | 1.5% |
| Unpaid Family Workers | 50 | 0.3% |
| Total | 19,408 | 100.0% |
Employment Status by Age in Chelsea
According to the labor force statistics for Chelsea, out of the total population over 16 years of age (31,706), 68.7% or 21,782 individuals are in the labor force, with 8.9% or 1,939 of them unemployed. The age group with the highest labor force participation rate is 30 to 34 years, with 86.8% or 3,724 individuals in the labor force. Within the labor force, the 16 to 19 years age range has the highest percentage of unemployed individuals, with 16.4% or 80 of them being unemployed.
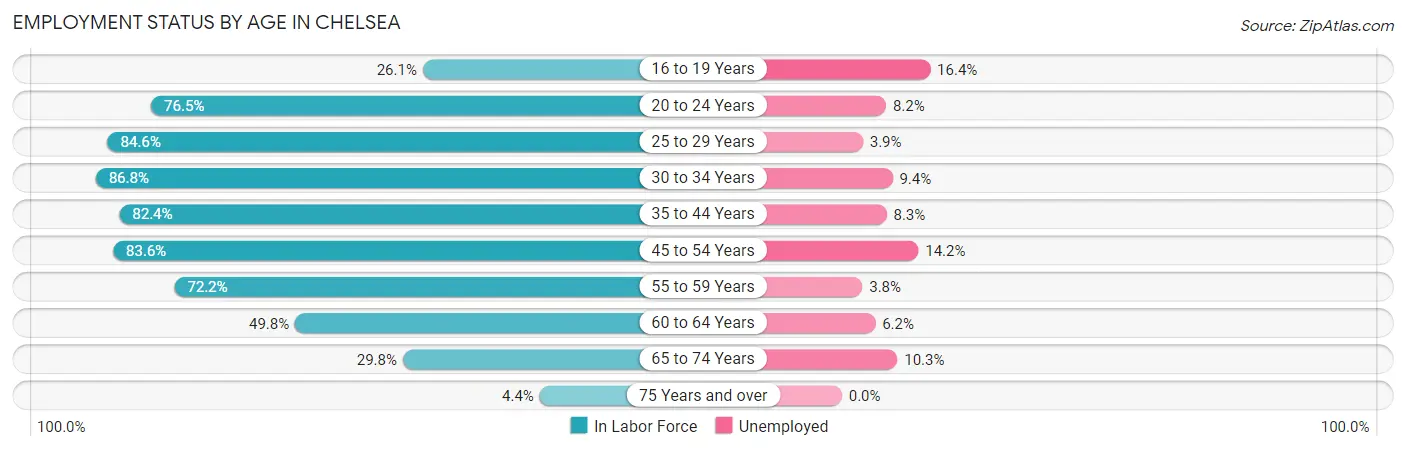
| Age Bracket | In Labor Force | Unemployed |
| 16 to 19 Years | 488 (26.1%) | 80 (16.4%) |
| 20 to 24 Years | 2,114 (76.5%) | 173 (8.2%) |
| 25 to 29 Years | 2,672 (84.6%) | 104 (3.9%) |
| 30 to 34 Years | 3,724 (86.8%) | 350 (9.4%) |
| 35 to 44 Years | 5,031 (82.4%) | 418 (8.3%) |
| 45 to 54 Years | 4,424 (83.6%) | 628 (14.2%) |
| 55 to 59 Years | 1,562 (72.2%) | 59 (3.8%) |
| 60 to 64 Years | 994 (49.8%) | 62 (6.2%) |
| 65 to 74 Years | 678 (29.8%) | 70 (10.3%) |
| 75 Years and over | 79 (4.4%) | 0 (0.0%) |
| Total | 21,782 (68.7%) | 1,939 (8.9%) |
Employment Status by Educational Attainment in Chelsea
According to labor force statistics for Chelsea, 80.0% of individuals (18,405) out of the total population between 25 and 64 years of age (23,006) are in the labor force, with 8.8% or 1,620 of them being unemployed. The group with the highest labor force participation rate are those with the educational attainment of bachelor's degree or higher, with 91.7% or 4,840 individuals in the labor force. Within the labor force, individuals with less than high school education have the highest percentage of unemployment, with 15.7% or 853 of them being unemployed.
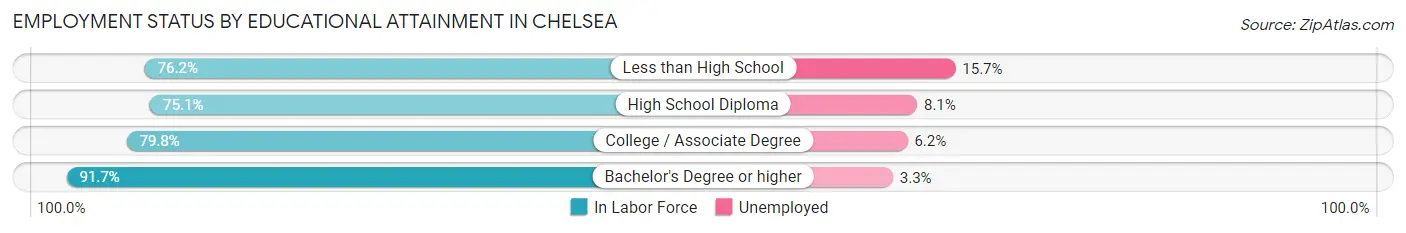
| Educational Attainment | In Labor Force | Unemployed |
| Less than High School | 5,435 (76.2%) | 1,120 (15.7%) |
| High School Diploma | 5,154 (75.1%) | 556 (8.1%) |
| College / Associate Degree | 2,978 (79.8%) | 231 (6.2%) |
| Bachelor's Degree or higher | 4,840 (91.7%) | 174 (3.3%) |
| Total | 18,405 (80.0%) | 2,025 (8.8%) |
Employment Occupations by Sex in Chelsea
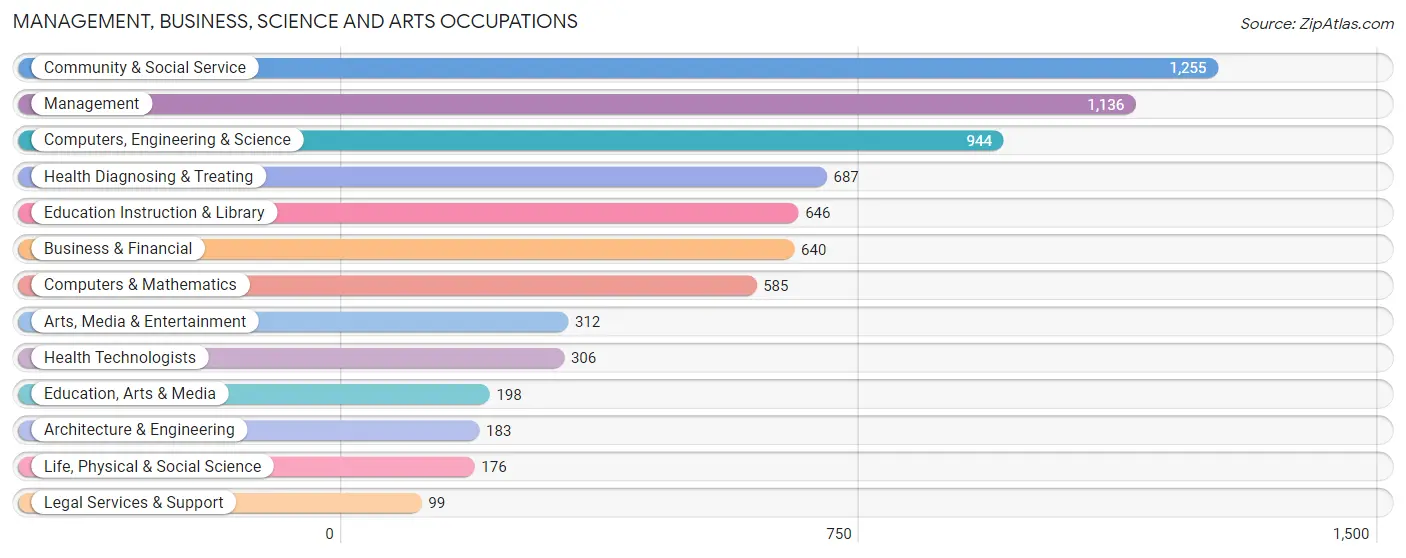
Management, Business, Science and Arts Occupations
The most common Management, Business, Science and Arts occupations in Chelsea are Community & Social Service (1,255 | 6.3%), Management (1,136 | 5.7%), Computers, Engineering & Science (944 | 4.8%), Health Diagnosing & Treating (687 | 3.5%), and Education Instruction & Library (646 | 3.3%).
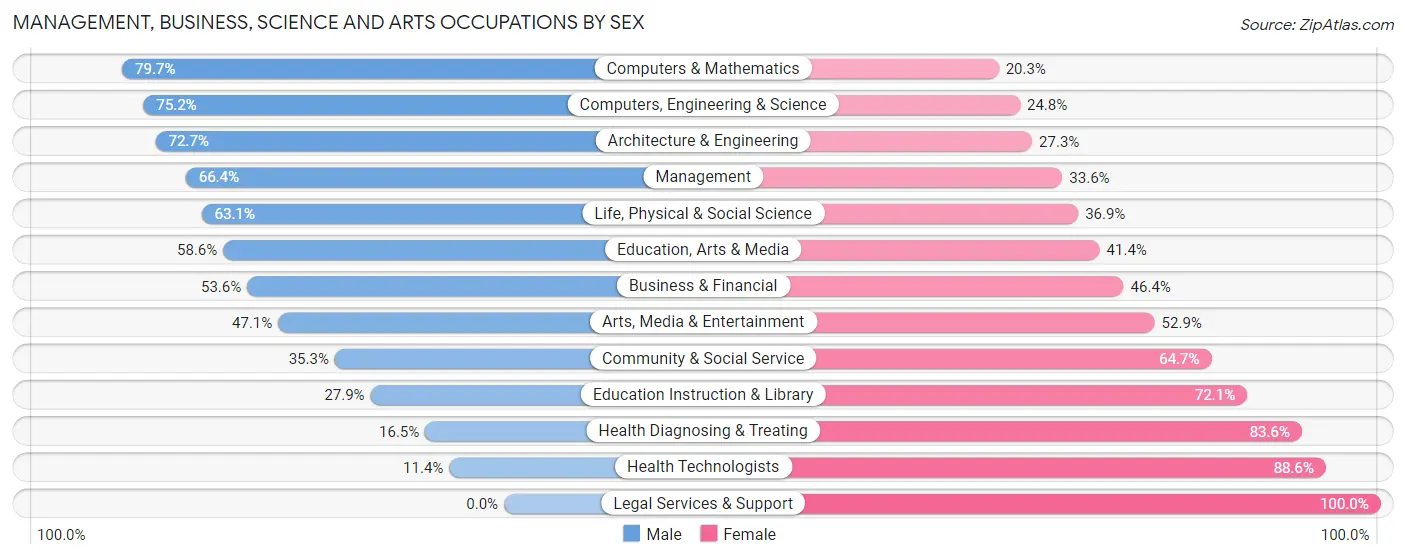
Management, Business, Science and Arts Occupations by Sex
Within the Management, Business, Science and Arts occupations in Chelsea, the most male-oriented occupations are Computers & Mathematics (79.7%), Computers, Engineering & Science (75.2%), and Architecture & Engineering (72.7%), while the most female-oriented occupations are Legal Services & Support (100.0%), Health Technologists (88.6%), and Health Diagnosing & Treating (83.6%).
| Occupation | Male | Female |
| Management | 754 (66.4%) | 382 (33.6%) |
| Business & Financial | 343 (53.6%) | 297 (46.4%) |
| Computers, Engineering & Science | 710 (75.2%) | 234 (24.8%) |
| Computers & Mathematics | 466 (79.7%) | 119 (20.3%) |
| Architecture & Engineering | 133 (72.7%) | 50 (27.3%) |
| Life, Physical & Social Science | 111 (63.1%) | 65 (36.9%) |
| Community & Social Service | 443 (35.3%) | 812 (64.7%) |
| Education, Arts & Media | 116 (58.6%) | 82 (41.4%) |
| Legal Services & Support | 0 (0.0%) | 99 (100.0%) |
| Education Instruction & Library | 180 (27.9%) | 466 (72.1%) |
| Arts, Media & Entertainment | 147 (47.1%) | 165 (52.9%) |
| Health Diagnosing & Treating | 113 (16.5%) | 574 (83.6%) |
| Health Technologists | 35 (11.4%) | 271 (88.6%) |
| Total (Category) | 2,363 (50.7%) | 2,299 (49.3%) |
| Total (Overall) | 11,601 (58.6%) | 8,185 (41.4%) |
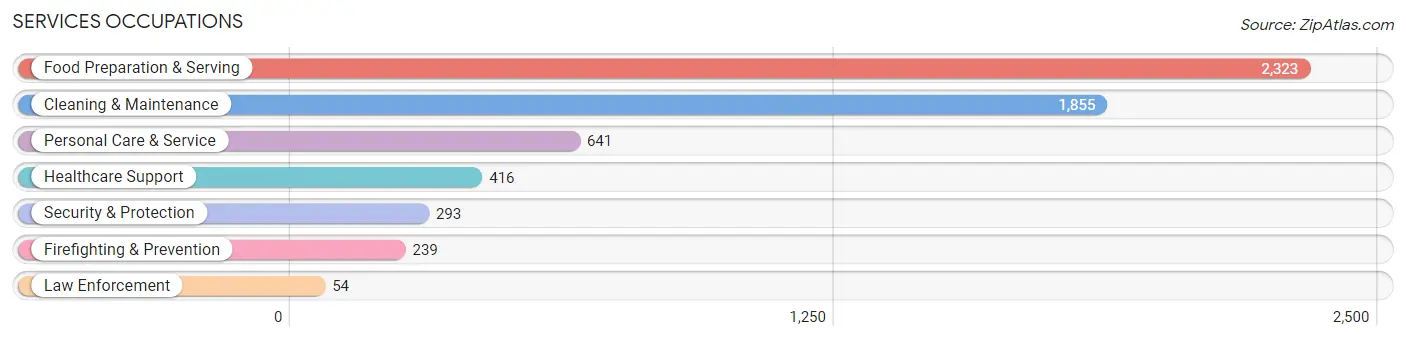
Services Occupations
The most common Services occupations in Chelsea are Food Preparation & Serving (2,323 | 11.7%), Cleaning & Maintenance (1,855 | 9.4%), Personal Care & Service (641 | 3.2%), Healthcare Support (416 | 2.1%), and Security & Protection (293 | 1.5%).
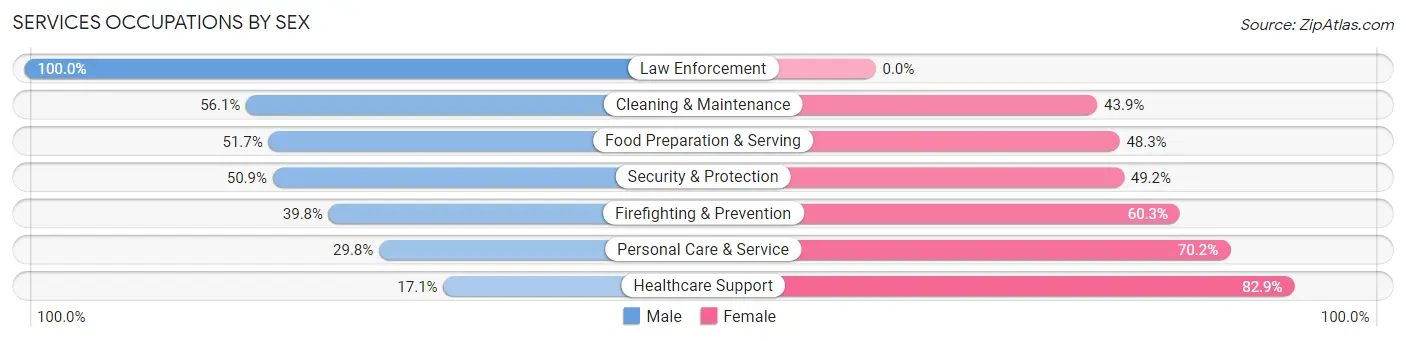
Services Occupations by Sex
Within the Services occupations in Chelsea, the most male-oriented occupations are Law Enforcement (100.0%), Cleaning & Maintenance (56.1%), and Food Preparation & Serving (51.7%), while the most female-oriented occupations are Healthcare Support (82.9%), Personal Care & Service (70.2%), and Firefighting & Prevention (60.3%).
| Occupation | Male | Female |
| Healthcare Support | 71 (17.1%) | 345 (82.9%) |
| Security & Protection | 149 (50.8%) | 144 (49.1%) |
| Firefighting & Prevention | 95 (39.8%) | 144 (60.3%) |
| Law Enforcement | 54 (100.0%) | 0 (0.0%) |
| Food Preparation & Serving | 1,201 (51.7%) | 1,122 (48.3%) |
| Cleaning & Maintenance | 1,041 (56.1%) | 814 (43.9%) |
| Personal Care & Service | 191 (29.8%) | 450 (70.2%) |
| Total (Category) | 2,653 (48.0%) | 2,875 (52.0%) |
| Total (Overall) | 11,601 (58.6%) | 8,185 (41.4%) |
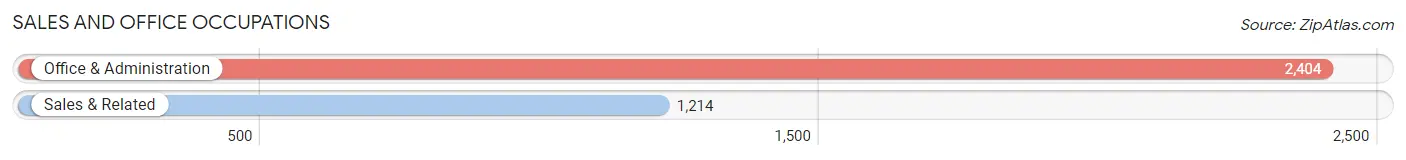
Sales and Office Occupations
The most common Sales and Office occupations in Chelsea are Office & Administration (2,404 | 12.1%), and Sales & Related (1,214 | 6.1%).
Sales and Office Occupations by Sex
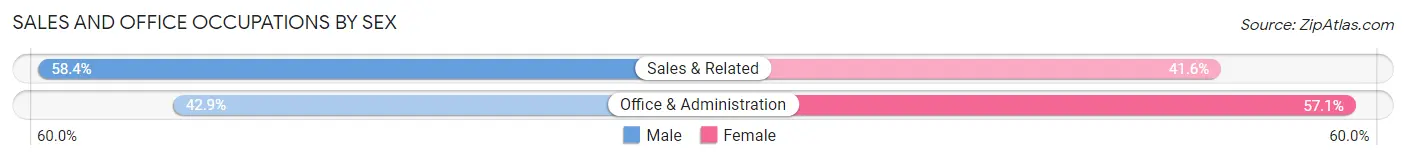
| Occupation | Male | Female |
| Sales & Related | 709 (58.4%) | 505 (41.6%) |
| Office & Administration | 1,031 (42.9%) | 1,373 (57.1%) |
| Total (Category) | 1,740 (48.1%) | 1,878 (51.9%) |
| Total (Overall) | 11,601 (58.6%) | 8,185 (41.4%) |
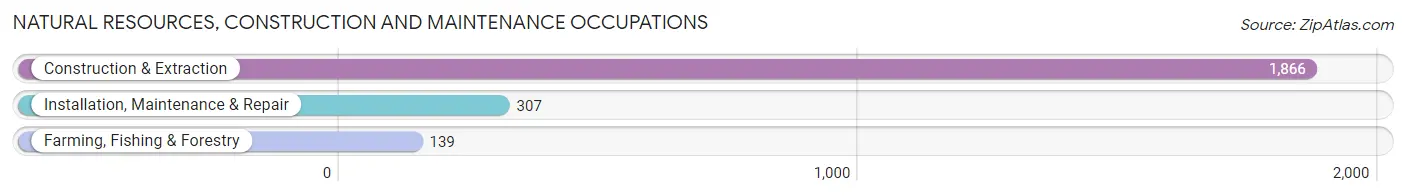
Natural Resources, Construction and Maintenance Occupations
The most common Natural Resources, Construction and Maintenance occupations in Chelsea are Construction & Extraction (1,866 | 9.4%), Installation, Maintenance & Repair (307 | 1.5%), and Farming, Fishing & Forestry (139 | 0.7%).
Natural Resources, Construction and Maintenance Occupations by Sex
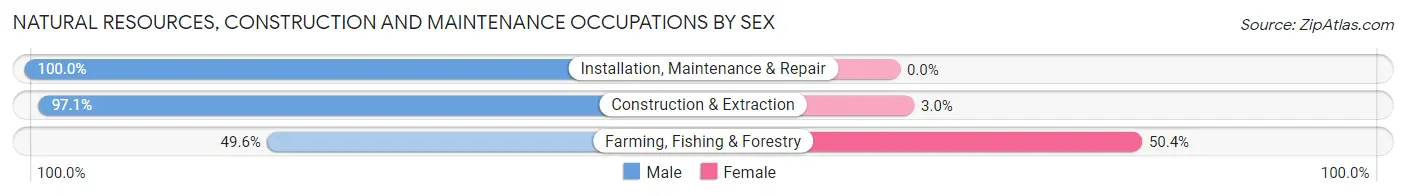
| Occupation | Male | Female |
| Farming, Fishing & Forestry | 69 (49.6%) | 70 (50.4%) |
| Construction & Extraction | 1,811 (97.1%) | 55 (2.9%) |
| Installation, Maintenance & Repair | 307 (100.0%) | 0 (0.0%) |
| Total (Category) | 2,187 (94.6%) | 125 (5.4%) |
| Total (Overall) | 11,601 (58.6%) | 8,185 (41.4%) |
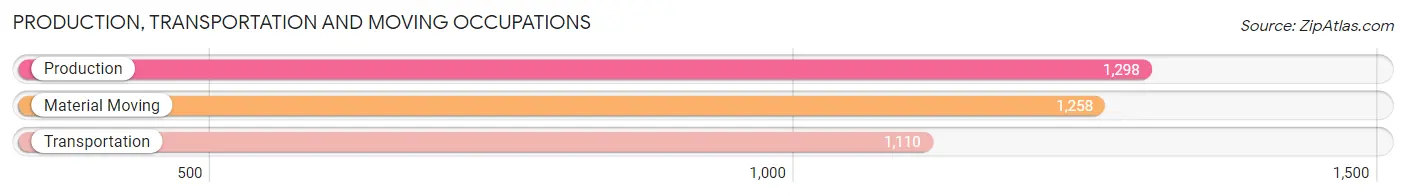
Production, Transportation and Moving Occupations
The most common Production, Transportation and Moving occupations in Chelsea are Production (1,298 | 6.6%), Material Moving (1,258 | 6.4%), and Transportation (1,110 | 5.6%).
Production, Transportation and Moving Occupations by Sex
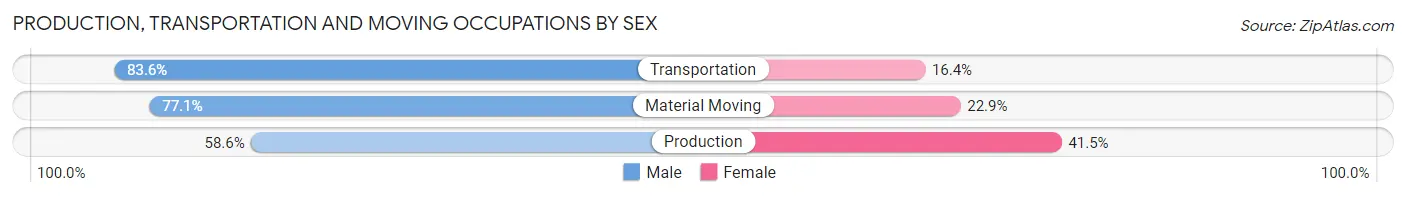
| Occupation | Male | Female |
| Production | 760 (58.6%) | 538 (41.4%) |
| Transportation | 928 (83.6%) | 182 (16.4%) |
| Material Moving | 970 (77.1%) | 288 (22.9%) |
| Total (Category) | 2,658 (72.5%) | 1,008 (27.5%) |
| Total (Overall) | 11,601 (58.6%) | 8,185 (41.4%) |
Employment Industries by Sex in Chelsea
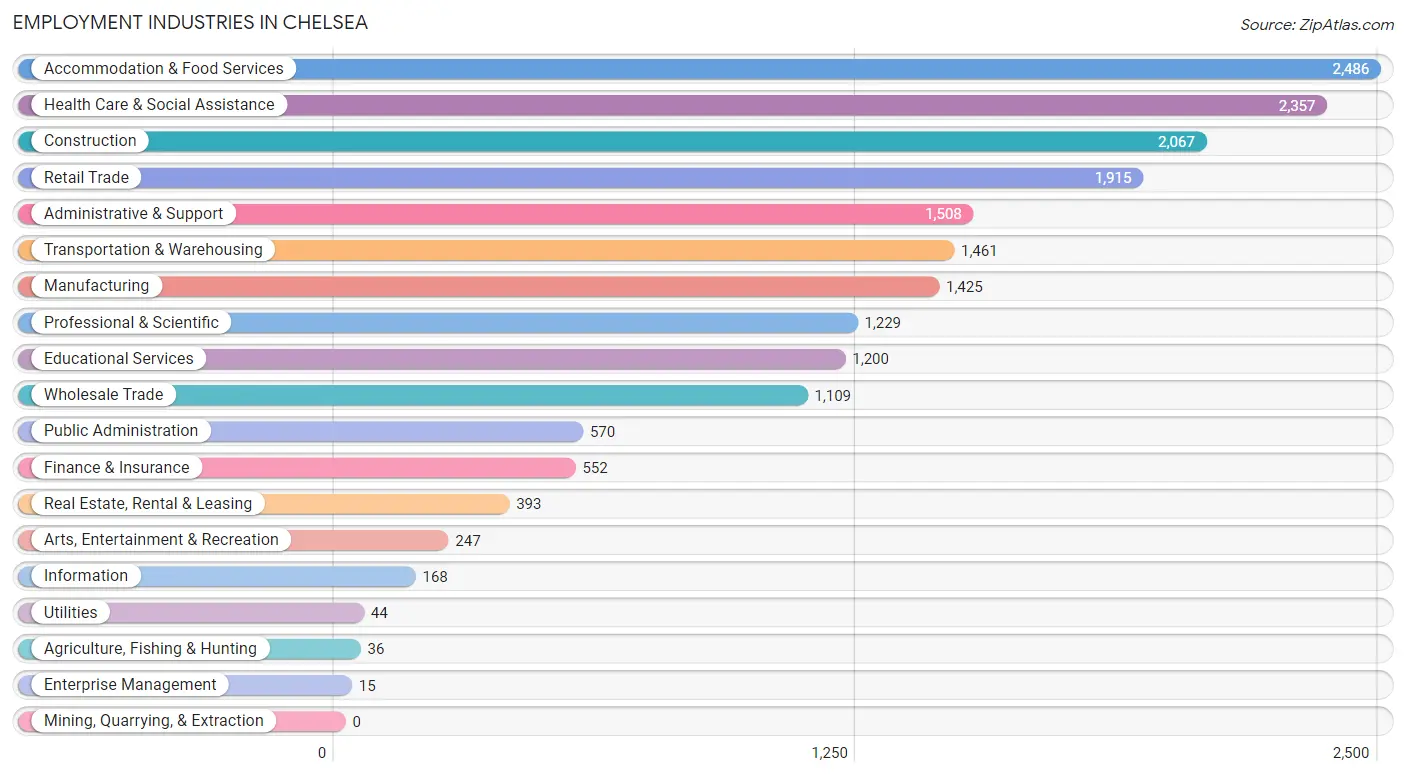
Employment Industries in Chelsea
The major employment industries in Chelsea include Accommodation & Food Services (2,486 | 12.6%), Health Care & Social Assistance (2,357 | 11.9%), Construction (2,067 | 10.4%), Retail Trade (1,915 | 9.7%), and Administrative & Support (1,508 | 7.6%).
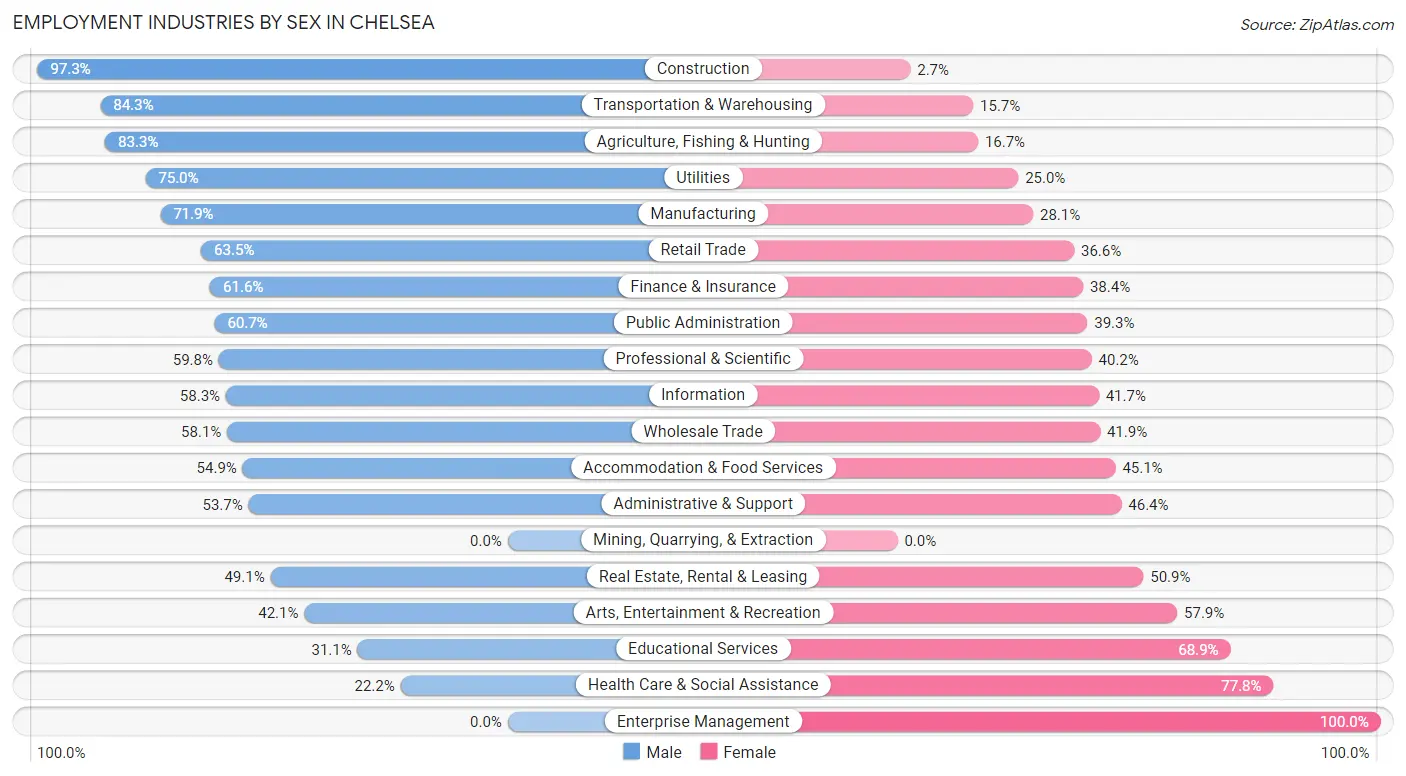
Employment Industries by Sex in Chelsea
The Chelsea industries that see more men than women are Construction (97.3%), Transportation & Warehousing (84.3%), and Agriculture, Fishing & Hunting (83.3%), whereas the industries that tend to have a higher number of women are Enterprise Management (100.0%), Health Care & Social Assistance (77.8%), and Educational Services (68.9%).
| Industry | Male | Female |
| Agriculture, Fishing & Hunting | 30 (83.3%) | 6 (16.7%) |
| Mining, Quarrying, & Extraction | 0 (0.0%) | 0 (0.0%) |
| Construction | 2,012 (97.3%) | 55 (2.7%) |
| Manufacturing | 1,025 (71.9%) | 400 (28.1%) |
| Wholesale Trade | 644 (58.1%) | 465 (41.9%) |
| Retail Trade | 1,215 (63.4%) | 700 (36.5%) |
| Transportation & Warehousing | 1,232 (84.3%) | 229 (15.7%) |
| Utilities | 33 (75.0%) | 11 (25.0%) |
| Information | 98 (58.3%) | 70 (41.7%) |
| Finance & Insurance | 340 (61.6%) | 212 (38.4%) |
| Real Estate, Rental & Leasing | 193 (49.1%) | 200 (50.9%) |
| Professional & Scientific | 735 (59.8%) | 494 (40.2%) |
| Enterprise Management | 0 (0.0%) | 15 (100.0%) |
| Administrative & Support | 809 (53.6%) | 699 (46.4%) |
| Educational Services | 373 (31.1%) | 827 (68.9%) |
| Health Care & Social Assistance | 523 (22.2%) | 1,834 (77.8%) |
| Arts, Entertainment & Recreation | 104 (42.1%) | 143 (57.9%) |
| Accommodation & Food Services | 1,364 (54.9%) | 1,122 (45.1%) |
| Public Administration | 346 (60.7%) | 224 (39.3%) |
| Total | 11,601 (58.6%) | 8,185 (41.4%) |
Education in Chelsea
School Enrollment in Chelsea
The most common levels of schooling among the 8,880 students in Chelsea are middle school (2,165 | 24.4%), high school (2,045 | 23.0%), and elementary school (1,680 | 18.9%).
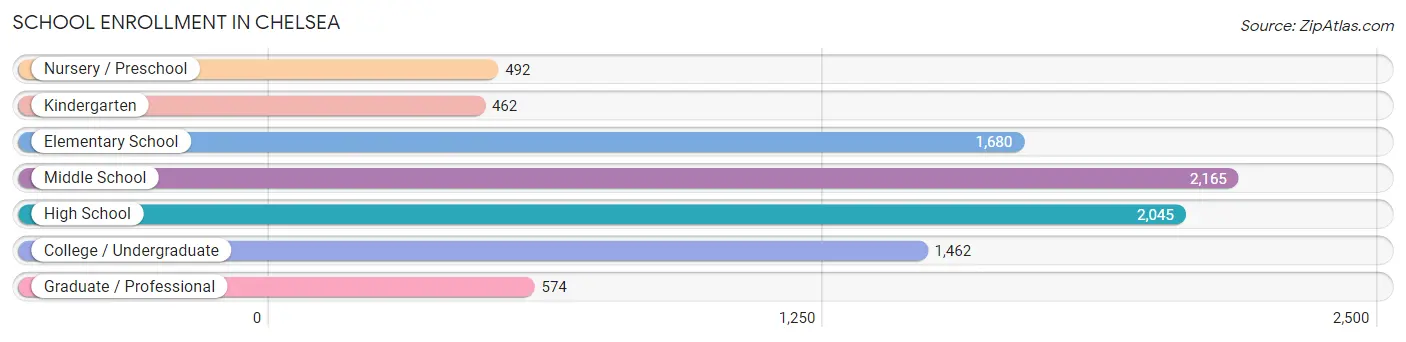
| School Level | # Students | % Students |
| Nursery / Preschool | 492 | 5.5% |
| Kindergarten | 462 | 5.2% |
| Elementary School | 1,680 | 18.9% |
| Middle School | 2,165 | 24.4% |
| High School | 2,045 | 23.0% |
| College / Undergraduate | 1,462 | 16.5% |
| Graduate / Professional | 574 | 6.5% |
| Total | 8,880 | 100.0% |
School Enrollment by Age by Funding Source in Chelsea
Out of a total of 8,880 students who are enrolled in schools in Chelsea, 1,163 (13.1%) attend a private institution, while the remaining 7,717 (86.9%) are enrolled in public schools. The age group of 25 to 34 year olds has the highest likelihood of being enrolled in private schools, with 276 (50.9% in the age bracket) enrolled. Conversely, the age group of 5 to 9 year old has the lowest likelihood of being enrolled in a private school, with 1,773 (95.3% in the age bracket) attending a public institution.
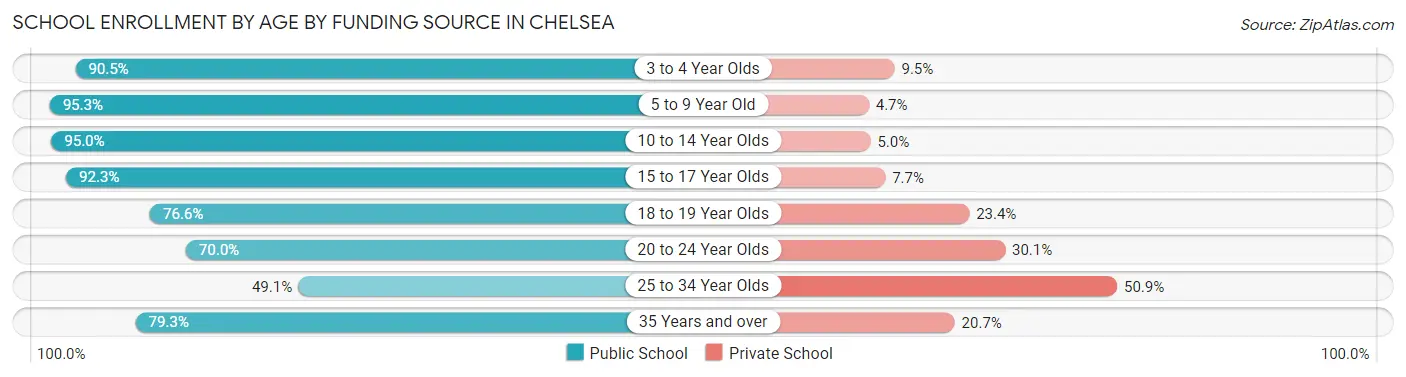
| Age Bracket | Public School | Private School |
| 3 to 4 Year Olds | 420 (90.5%) | 44 (9.5%) |
| 5 to 9 Year Old | 1,773 (95.3%) | 87 (4.7%) |
| 10 to 14 Year Olds | 2,343 (95.0%) | 123 (5.0%) |
| 15 to 17 Year Olds | 1,478 (92.3%) | 124 (7.7%) |
| 18 to 19 Year Olds | 485 (76.6%) | 148 (23.4%) |
| 20 to 24 Year Olds | 668 (70.0%) | 287 (30.0%) |
| 25 to 34 Year Olds | 266 (49.1%) | 276 (50.9%) |
| 35 Years and over | 284 (79.3%) | 74 (20.7%) |
| Total | 7,717 (86.9%) | 1,163 (13.1%) |
Educational Attainment by Field of Study in Chelsea
Business (1,303 | 20.6%), social sciences (592 | 9.4%), science & technology (551 | 8.7%), literature & languages (446 | 7.1%), and bio, nature & agricultural (439 | 7.0%) are the most common fields of study among 6,318 individuals in Chelsea who have obtained a bachelor's degree or higher.
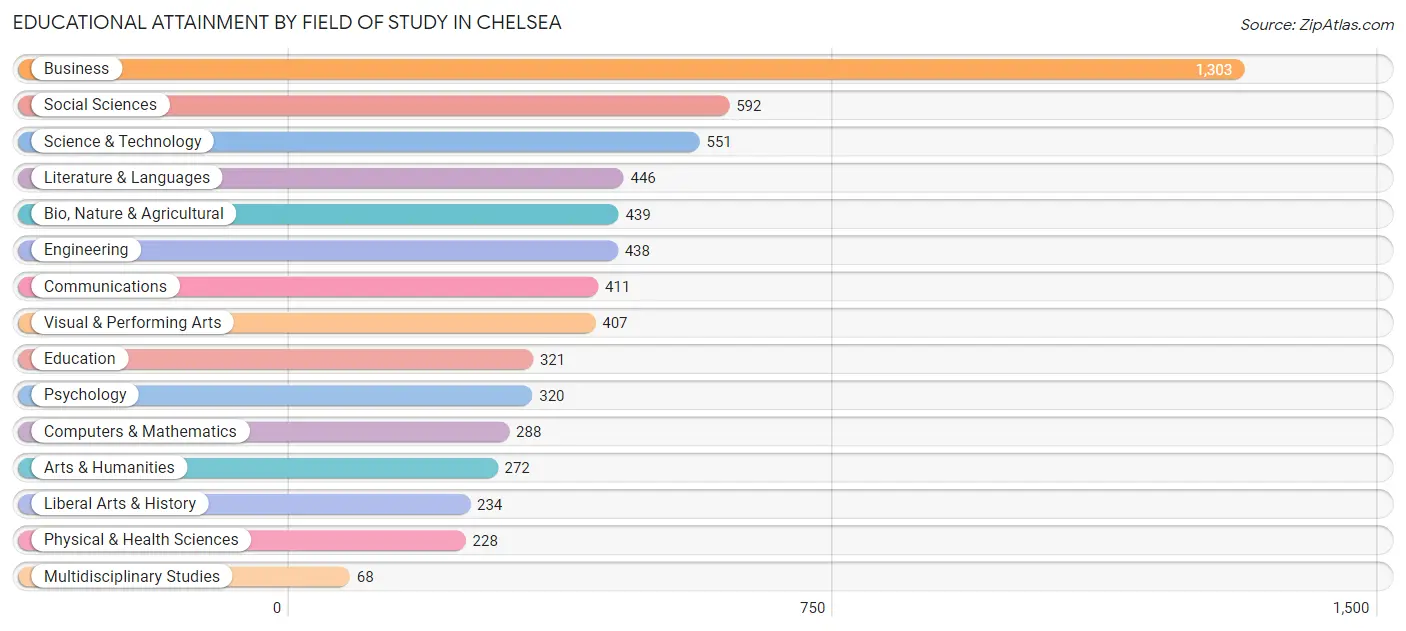
| Field of Study | # Graduates | % Graduates |
| Computers & Mathematics | 288 | 4.6% |
| Bio, Nature & Agricultural | 439 | 7.0% |
| Physical & Health Sciences | 228 | 3.6% |
| Psychology | 320 | 5.1% |
| Social Sciences | 592 | 9.4% |
| Engineering | 438 | 6.9% |
| Multidisciplinary Studies | 68 | 1.1% |
| Science & Technology | 551 | 8.7% |
| Business | 1,303 | 20.6% |
| Education | 321 | 5.1% |
| Literature & Languages | 446 | 7.1% |
| Liberal Arts & History | 234 | 3.7% |
| Visual & Performing Arts | 407 | 6.4% |
| Communications | 411 | 6.5% |
| Arts & Humanities | 272 | 4.3% |
| Total | 6,318 | 100.0% |
Transportation & Commute in Chelsea
Vehicle Availability by Sex in Chelsea
The most prevalent vehicle ownership categories in Chelsea are males with 1 vehicle (4,884, accounting for 42.7%) and females with 1 vehicle (3,341, making up 61.3%).
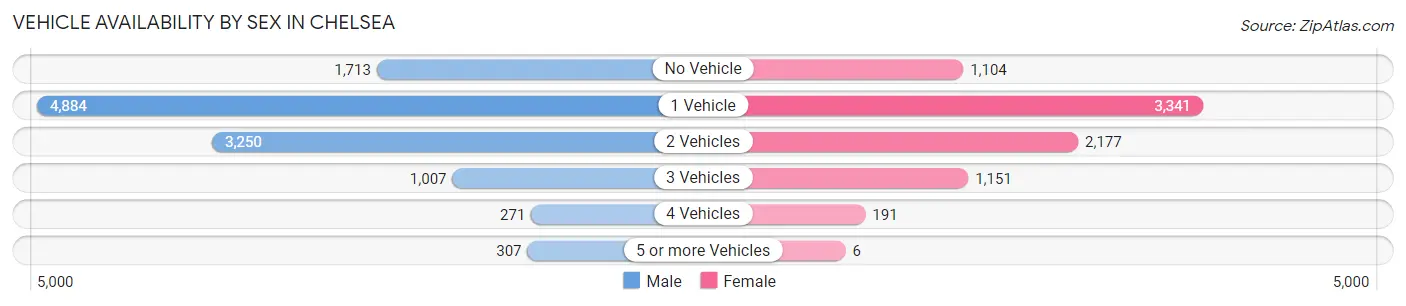
| Vehicles Available | Male | Female |
| No Vehicle | 1,713 (15.0%) | 1,104 (13.9%) |
| 1 Vehicle | 4,884 (42.7%) | 3,341 (41.9%) |
| 2 Vehicles | 3,250 (28.4%) | 2,177 (27.3%) |
| 3 Vehicles | 1,007 (8.8%) | 1,151 (14.4%) |
| 4 Vehicles | 271 (2.4%) | 191 (2.4%) |
| 5 or more Vehicles | 307 (2.7%) | 6 (0.1%) |
| Total | 11,432 (100.0%) | 7,970 (100.0%) |
Commute Time in Chelsea
The most frequently occuring commute durations in Chelsea are 30 to 34 minutes (2,794 commuters, 15.7%), 60 to 89 minutes (2,422 commuters, 13.6%), and 20 to 24 minutes (2,360 commuters, 13.2%).
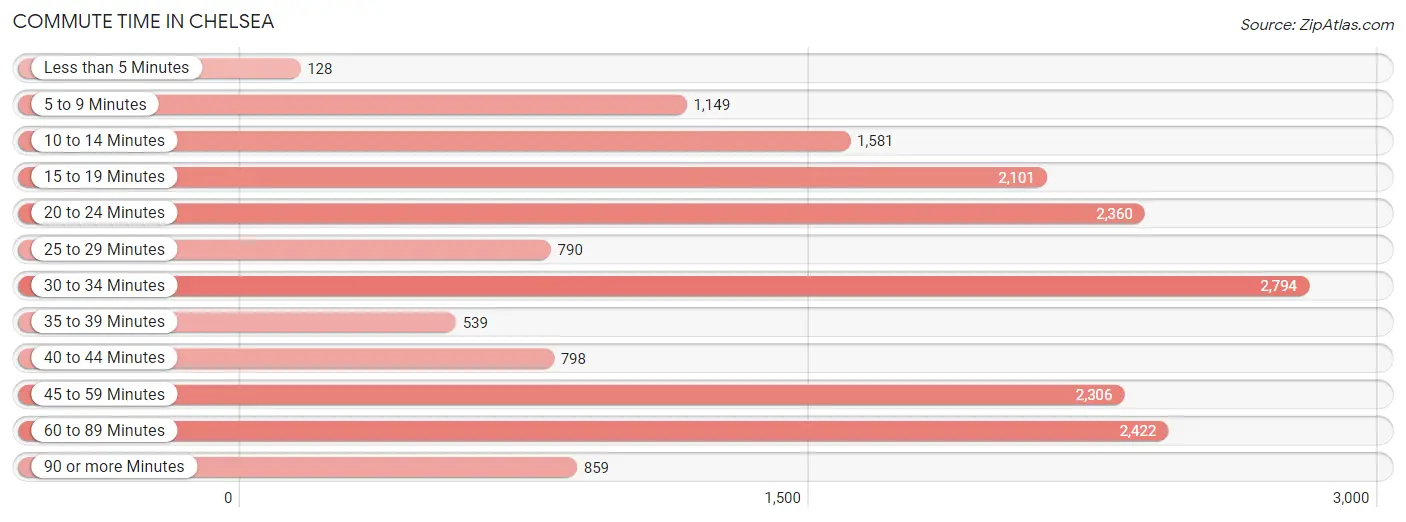
| Commute Time | # Commuters | % Commuters |
| Less than 5 Minutes | 128 | 0.7% |
| 5 to 9 Minutes | 1,149 | 6.5% |
| 10 to 14 Minutes | 1,581 | 8.9% |
| 15 to 19 Minutes | 2,101 | 11.8% |
| 20 to 24 Minutes | 2,360 | 13.2% |
| 25 to 29 Minutes | 790 | 4.4% |
| 30 to 34 Minutes | 2,794 | 15.7% |
| 35 to 39 Minutes | 539 | 3.0% |
| 40 to 44 Minutes | 798 | 4.5% |
| 45 to 59 Minutes | 2,306 | 12.9% |
| 60 to 89 Minutes | 2,422 | 13.6% |
| 90 or more Minutes | 859 | 4.8% |
Commute Time by Sex in Chelsea
The most common commute times in Chelsea are 60 to 89 minutes (1,855 commuters, 17.3%) for males and 45 to 59 minutes (1,271 commuters, 18.0%) for females.
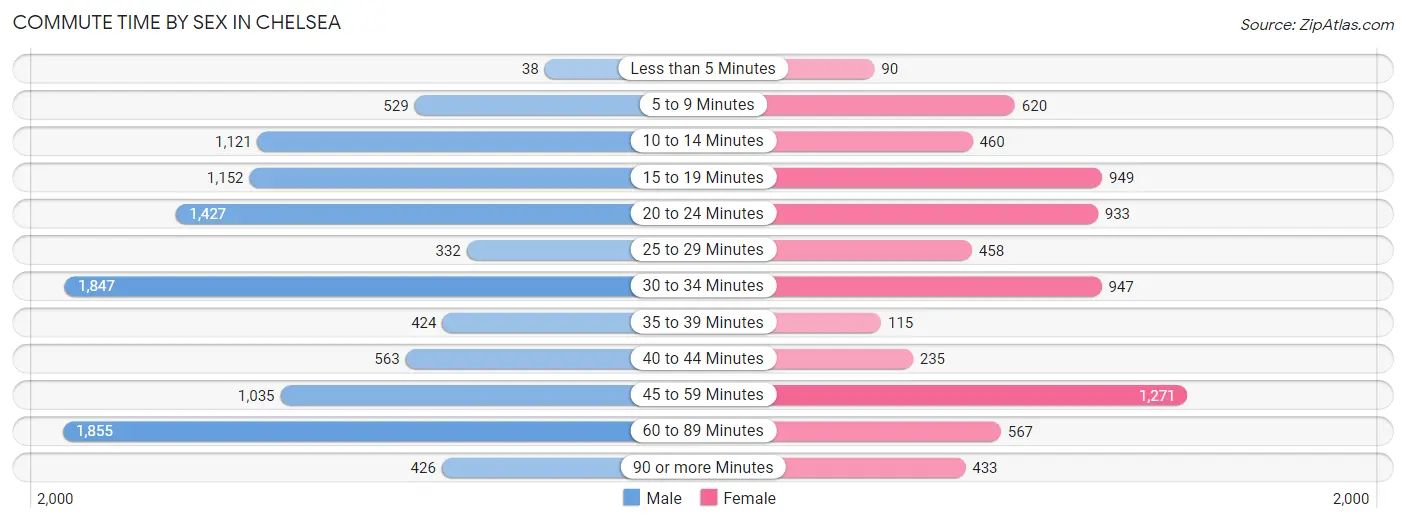
| Commute Time | Male | Female |
| Less than 5 Minutes | 38 (0.4%) | 90 (1.3%) |
| 5 to 9 Minutes | 529 (4.9%) | 620 (8.8%) |
| 10 to 14 Minutes | 1,121 (10.4%) | 460 (6.5%) |
| 15 to 19 Minutes | 1,152 (10.7%) | 949 (13.4%) |
| 20 to 24 Minutes | 1,427 (13.3%) | 933 (13.2%) |
| 25 to 29 Minutes | 332 (3.1%) | 458 (6.5%) |
| 30 to 34 Minutes | 1,847 (17.2%) | 947 (13.4%) |
| 35 to 39 Minutes | 424 (3.9%) | 115 (1.6%) |
| 40 to 44 Minutes | 563 (5.2%) | 235 (3.3%) |
| 45 to 59 Minutes | 1,035 (9.6%) | 1,271 (18.0%) |
| 60 to 89 Minutes | 1,855 (17.3%) | 567 (8.0%) |
| 90 or more Minutes | 426 (4.0%) | 433 (6.1%) |
Time of Departure to Work by Sex in Chelsea
The most frequent times of departure to work in Chelsea are 7:00 AM to 7:29 AM (1,921, 17.9%) for males and 6:30 AM to 6:59 AM (980, 13.9%) for females.
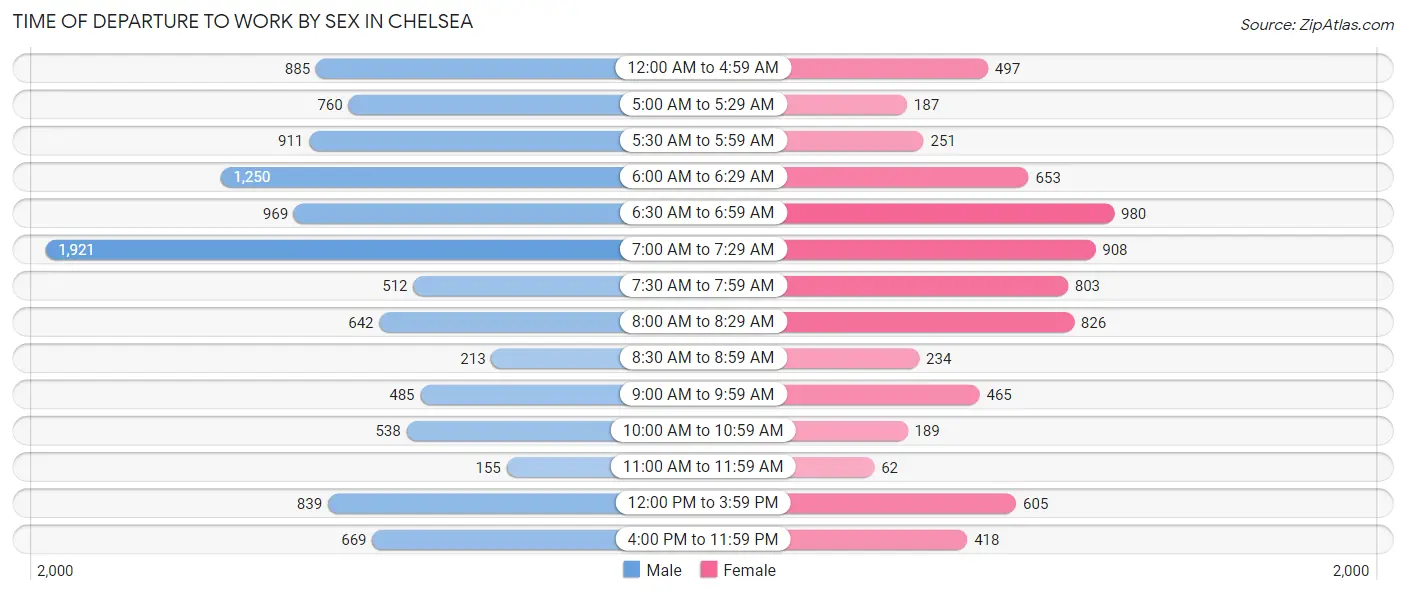
| Time of Departure | Male | Female |
| 12:00 AM to 4:59 AM | 885 (8.2%) | 497 (7.0%) |
| 5:00 AM to 5:29 AM | 760 (7.1%) | 187 (2.6%) |
| 5:30 AM to 5:59 AM | 911 (8.5%) | 251 (3.5%) |
| 6:00 AM to 6:29 AM | 1,250 (11.6%) | 653 (9.2%) |
| 6:30 AM to 6:59 AM | 969 (9.0%) | 980 (13.9%) |
| 7:00 AM to 7:29 AM | 1,921 (17.9%) | 908 (12.8%) |
| 7:30 AM to 7:59 AM | 512 (4.8%) | 803 (11.4%) |
| 8:00 AM to 8:29 AM | 642 (6.0%) | 826 (11.7%) |
| 8:30 AM to 8:59 AM | 213 (2.0%) | 234 (3.3%) |
| 9:00 AM to 9:59 AM | 485 (4.5%) | 465 (6.6%) |
| 10:00 AM to 10:59 AM | 538 (5.0%) | 189 (2.7%) |
| 11:00 AM to 11:59 AM | 155 (1.4%) | 62 (0.9%) |
| 12:00 PM to 3:59 PM | 839 (7.8%) | 605 (8.6%) |
| 4:00 PM to 11:59 PM | 669 (6.2%) | 418 (5.9%) |
| Total | 10,749 (100.0%) | 7,078 (100.0%) |
Housing Occupancy in Chelsea
Occupancy by Ownership in Chelsea
Of the total 13,386 dwellings in Chelsea, owner-occupied units account for 3,738 (27.9%), while renter-occupied units make up 9,648 (72.1%).
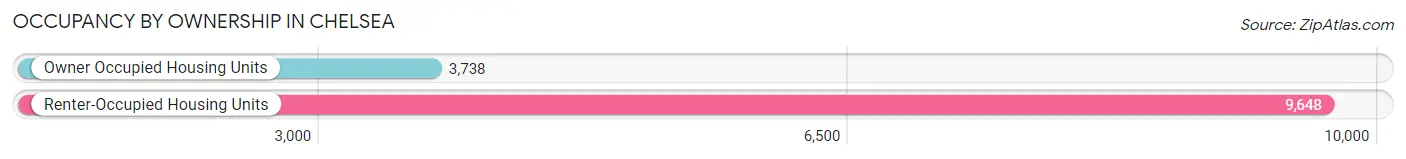
| Occupancy | # Housing Units | % Housing Units |
| Owner Occupied Housing Units | 3,738 | 27.9% |
| Renter-Occupied Housing Units | 9,648 | 72.1% |
| Total Occupied Housing Units | 13,386 | 100.0% |
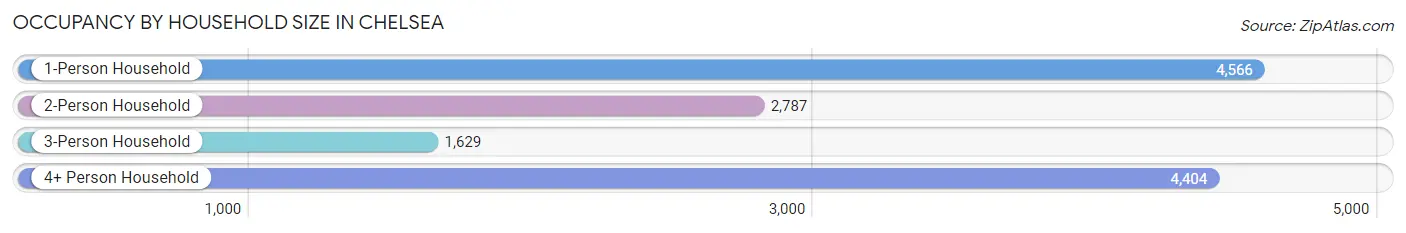
Occupancy by Household Size in Chelsea
| Household Size | # Housing Units | % Housing Units |
| 1-Person Household | 4,566 | 34.1% |
| 2-Person Household | 2,787 | 20.8% |
| 3-Person Household | 1,629 | 12.2% |
| 4+ Person Household | 4,404 | 32.9% |
| Total Housing Units | 13,386 | 100.0% |
Occupancy by Ownership by Household Size in Chelsea
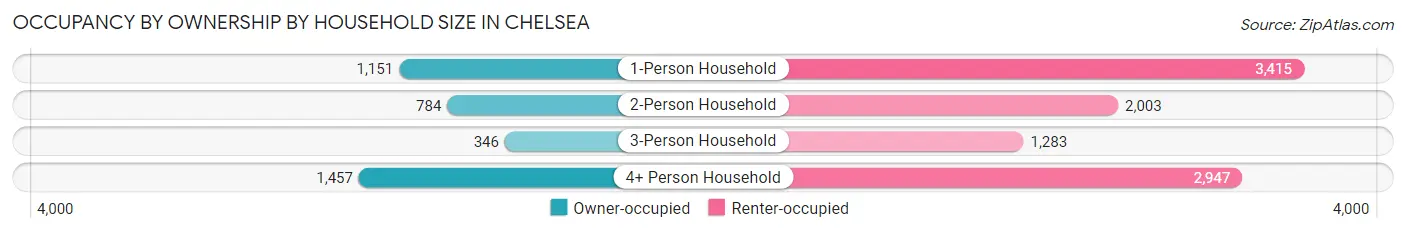
| Household Size | Owner-occupied | Renter-occupied |
| 1-Person Household | 1,151 (25.2%) | 3,415 (74.8%) |
| 2-Person Household | 784 (28.1%) | 2,003 (71.9%) |
| 3-Person Household | 346 (21.2%) | 1,283 (78.8%) |
| 4+ Person Household | 1,457 (33.1%) | 2,947 (66.9%) |
| Total Housing Units | 3,738 (27.9%) | 9,648 (72.1%) |
Occupancy by Educational Attainment in Chelsea
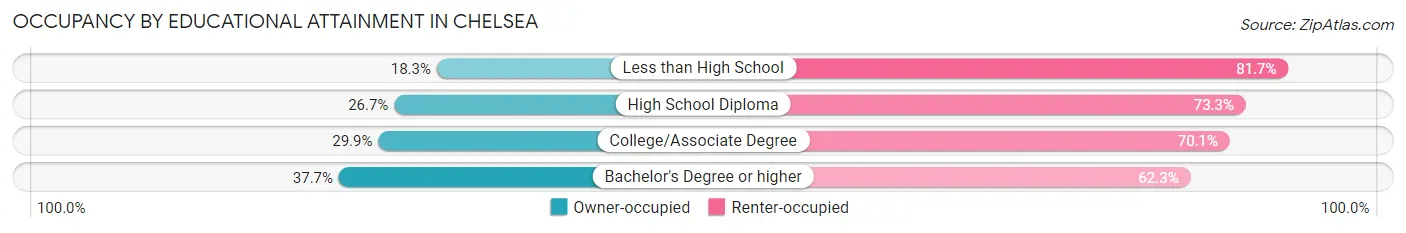
| Household Size | Owner-occupied | Renter-occupied |
| Less than High School | 693 (18.3%) | 3,097 (81.7%) |
| High School Diploma | 996 (26.7%) | 2,732 (73.3%) |
| College/Associate Degree | 622 (29.9%) | 1,460 (70.1%) |
| Bachelor's Degree or higher | 1,427 (37.7%) | 2,359 (62.3%) |
Occupancy by Age of Householder in Chelsea
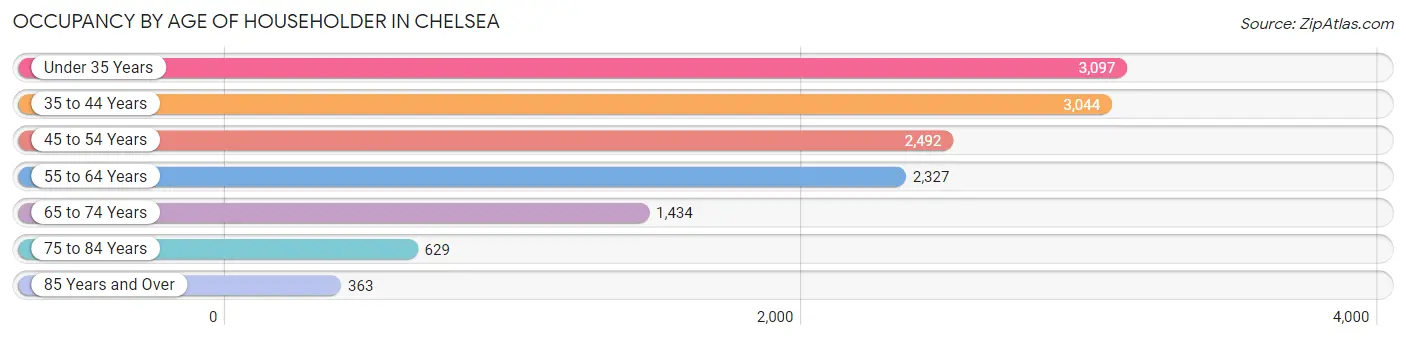
| Age Bracket | # Households | % Households |
| Under 35 Years | 3,097 | 23.1% |
| 35 to 44 Years | 3,044 | 22.7% |
| 45 to 54 Years | 2,492 | 18.6% |
| 55 to 64 Years | 2,327 | 17.4% |
| 65 to 74 Years | 1,434 | 10.7% |
| 75 to 84 Years | 629 | 4.7% |
| 85 Years and Over | 363 | 2.7% |
| Total | 13,386 | 100.0% |
Housing Finances in Chelsea
Median Income by Occupancy in Chelsea
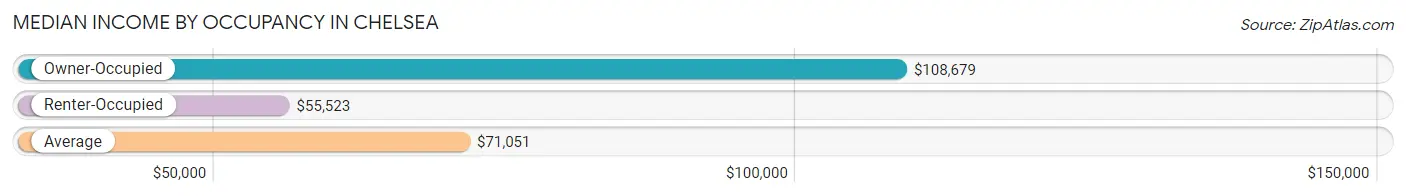
| Occupancy Type | # Households | Median Income |
| Owner-Occupied | 3,738 (27.9%) | $108,679 |
| Renter-Occupied | 9,648 (72.1%) | $55,523 |
| Average | 13,386 (100.0%) | $71,051 |
Occupancy by Householder Income Bracket in Chelsea
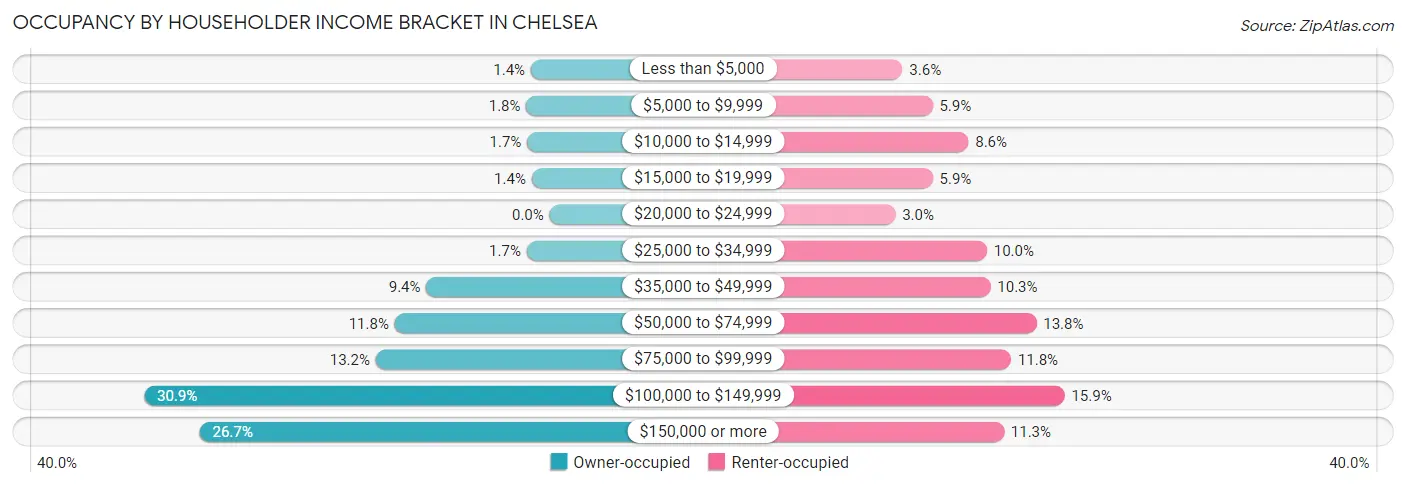
| Income Bracket | Owner-occupied | Renter-occupied |
| Less than $5,000 | 53 (1.4%) | 344 (3.6%) |
| $5,000 to $9,999 | 66 (1.8%) | 565 (5.9%) |
| $10,000 to $14,999 | 64 (1.7%) | 829 (8.6%) |
| $15,000 to $19,999 | 51 (1.4%) | 566 (5.9%) |
| $20,000 to $24,999 | 0 (0.0%) | 291 (3.0%) |
| $25,000 to $34,999 | 65 (1.7%) | 965 (10.0%) |
| $35,000 to $49,999 | 351 (9.4%) | 991 (10.3%) |
| $50,000 to $74,999 | 441 (11.8%) | 1,329 (13.8%) |
| $75,000 to $99,999 | 495 (13.2%) | 1,142 (11.8%) |
| $100,000 to $149,999 | 1,155 (30.9%) | 1,536 (15.9%) |
| $150,000 or more | 997 (26.7%) | 1,090 (11.3%) |
| Total | 3,738 (100.0%) | 9,648 (100.0%) |
Monthly Housing Cost Tiers in Chelsea
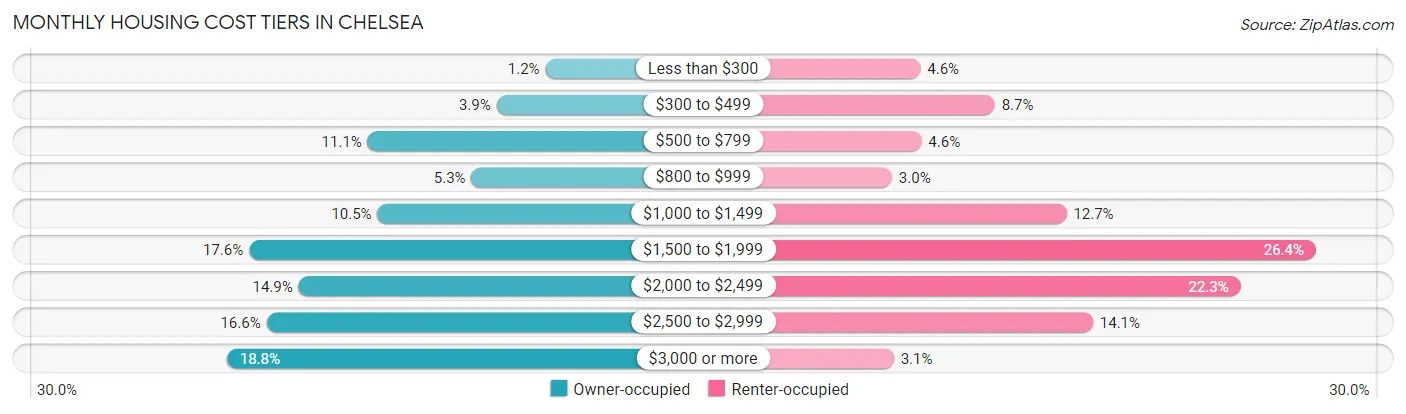
| Monthly Cost | Owner-occupied | Renter-occupied |
| Less than $300 | 46 (1.2%) | 442 (4.6%) |
| $300 to $499 | 147 (3.9%) | 838 (8.7%) |
| $500 to $799 | 413 (11.1%) | 448 (4.6%) |
| $800 to $999 | 199 (5.3%) | 290 (3.0%) |
| $1,000 to $1,499 | 393 (10.5%) | 1,220 (12.7%) |
| $1,500 to $1,999 | 658 (17.6%) | 2,549 (26.4%) |
| $2,000 to $2,499 | 556 (14.9%) | 2,149 (22.3%) |
| $2,500 to $2,999 | 622 (16.6%) | 1,361 (14.1%) |
| $3,000 or more | 704 (18.8%) | 300 (3.1%) |
| Total | 3,738 (100.0%) | 9,648 (100.0%) |
Physical Housing Characteristics in Chelsea
Housing Structures in Chelsea
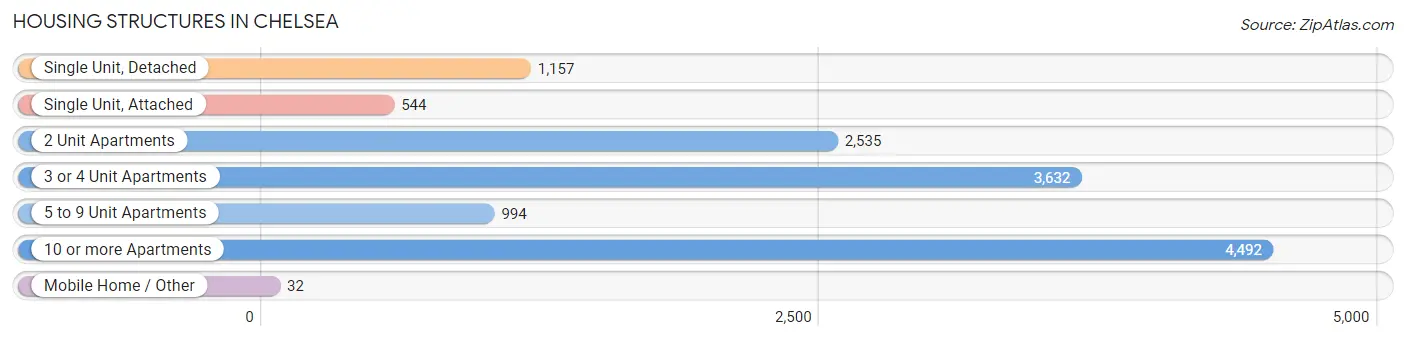
| Structure Type | # Housing Units | % Housing Units |
| Single Unit, Detached | 1,157 | 8.6% |
| Single Unit, Attached | 544 | 4.1% |
| 2 Unit Apartments | 2,535 | 18.9% |
| 3 or 4 Unit Apartments | 3,632 | 27.1% |
| 5 to 9 Unit Apartments | 994 | 7.4% |
| 10 or more Apartments | 4,492 | 33.6% |
| Mobile Home / Other | 32 | 0.2% |
| Total | 13,386 | 100.0% |
Housing Structures by Occupancy in Chelsea
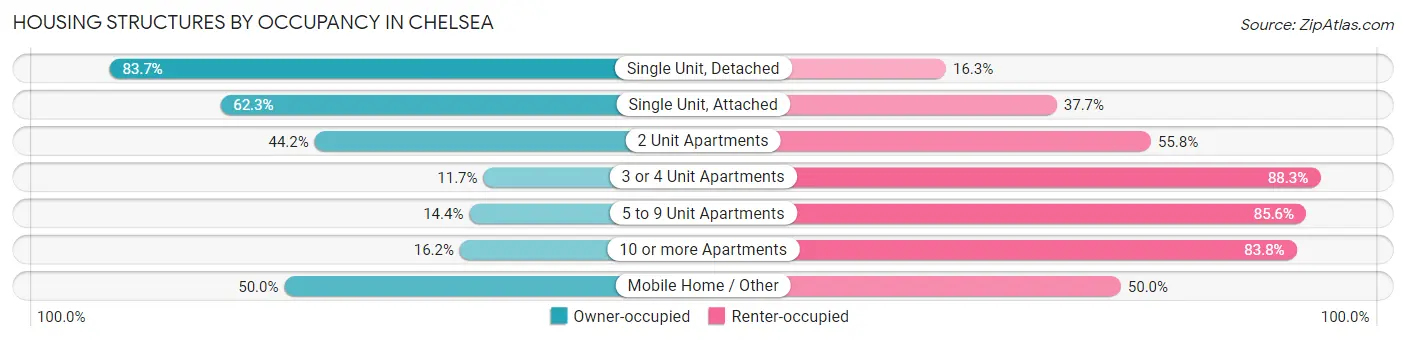
| Structure Type | Owner-occupied | Renter-occupied |
| Single Unit, Detached | 968 (83.7%) | 189 (16.3%) |
| Single Unit, Attached | 339 (62.3%) | 205 (37.7%) |
| 2 Unit Apartments | 1,120 (44.2%) | 1,415 (55.8%) |
| 3 or 4 Unit Apartments | 424 (11.7%) | 3,208 (88.3%) |
| 5 to 9 Unit Apartments | 143 (14.4%) | 851 (85.6%) |
| 10 or more Apartments | 728 (16.2%) | 3,764 (83.8%) |
| Mobile Home / Other | 16 (50.0%) | 16 (50.0%) |
| Total | 3,738 (27.9%) | 9,648 (72.1%) |
Housing Structures by Number of Rooms in Chelsea
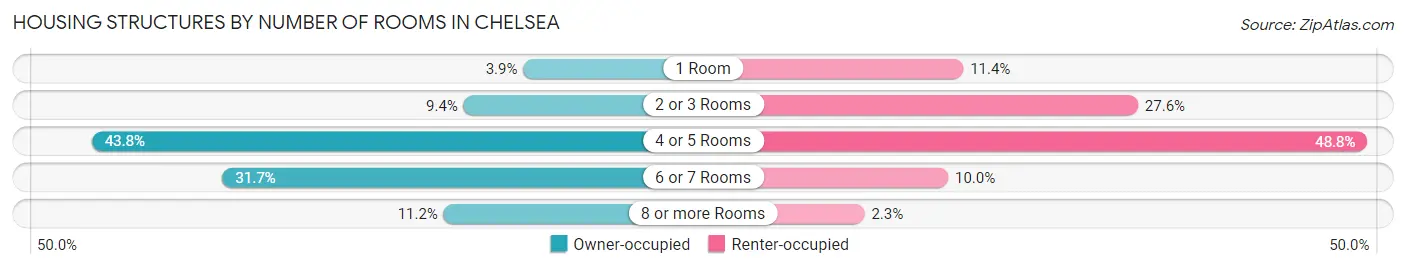
| Number of Rooms | Owner-occupied | Renter-occupied |
| 1 Room | 145 (3.9%) | 1,100 (11.4%) |
| 2 or 3 Rooms | 351 (9.4%) | 2,659 (27.6%) |
| 4 or 5 Rooms | 1,637 (43.8%) | 4,705 (48.8%) |
| 6 or 7 Rooms | 1,185 (31.7%) | 965 (10.0%) |
| 8 or more Rooms | 420 (11.2%) | 219 (2.3%) |
| Total | 3,738 (100.0%) | 9,648 (100.0%) |
Housing Structure by Heating Type in Chelsea
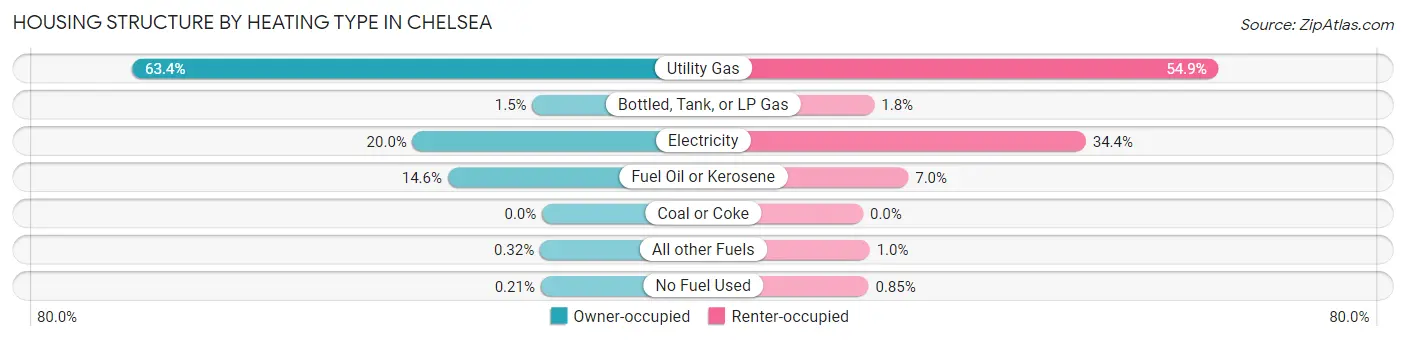
| Heating Type | Owner-occupied | Renter-occupied |
| Utility Gas | 2,369 (63.4%) | 5,301 (54.9%) |
| Bottled, Tank, or LP Gas | 56 (1.5%) | 169 (1.8%) |
| Electricity | 748 (20.0%) | 3,323 (34.4%) |
| Fuel Oil or Kerosene | 545 (14.6%) | 674 (7.0%) |
| Coal or Coke | 0 (0.0%) | 0 (0.0%) |
| All other Fuels | 12 (0.3%) | 99 (1.0%) |
| No Fuel Used | 8 (0.2%) | 82 (0.9%) |
| Total | 3,738 (100.0%) | 9,648 (100.0%) |
Household Vehicle Usage in Chelsea
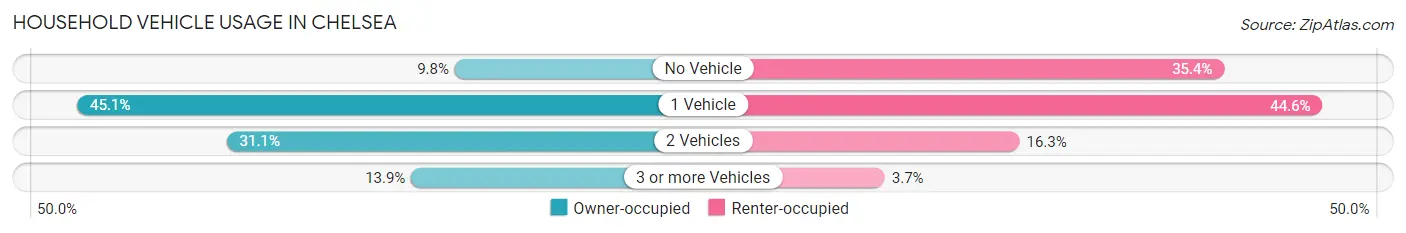
| Vehicles per Household | Owner-occupied | Renter-occupied |
| No Vehicle | 368 (9.8%) | 3,415 (35.4%) |
| 1 Vehicle | 1,686 (45.1%) | 4,300 (44.6%) |
| 2 Vehicles | 1,164 (31.1%) | 1,573 (16.3%) |
| 3 or more Vehicles | 520 (13.9%) | 360 (3.7%) |
| Total | 3,738 (100.0%) | 9,648 (100.0%) |
Real Estate & Mortgages in Chelsea
Real Estate and Mortgage Overview in Chelsea
| Characteristic | Without Mortgage | With Mortgage |
| Housing Units | 1,009 | 2,729 |
| Median Property Value | $439,200 | $455,900 |
| Median Household Income | $69,358 | $830 |
| Monthly Housing Costs | $763 | $704 |
| Real Estate Taxes | $2,737 | $138 |
Property Value by Mortgage Status in Chelsea
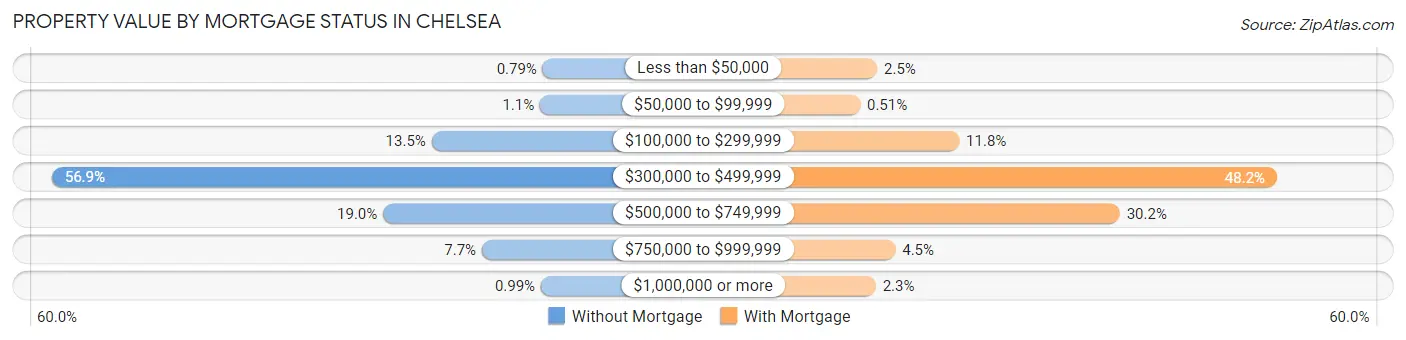
| Property Value | Without Mortgage | With Mortgage |
| Less than $50,000 | 8 (0.8%) | 67 (2.5%) |
| $50,000 to $99,999 | 11 (1.1%) | 14 (0.5%) |
| $100,000 to $299,999 | 136 (13.5%) | 323 (11.8%) |
| $300,000 to $499,999 | 574 (56.9%) | 1,314 (48.1%) |
| $500,000 to $749,999 | 192 (19.0%) | 824 (30.2%) |
| $750,000 to $999,999 | 78 (7.7%) | 124 (4.5%) |
| $1,000,000 or more | 10 (1.0%) | 63 (2.3%) |
| Total | 1,009 (100.0%) | 2,729 (100.0%) |
Household Income by Mortgage Status in Chelsea
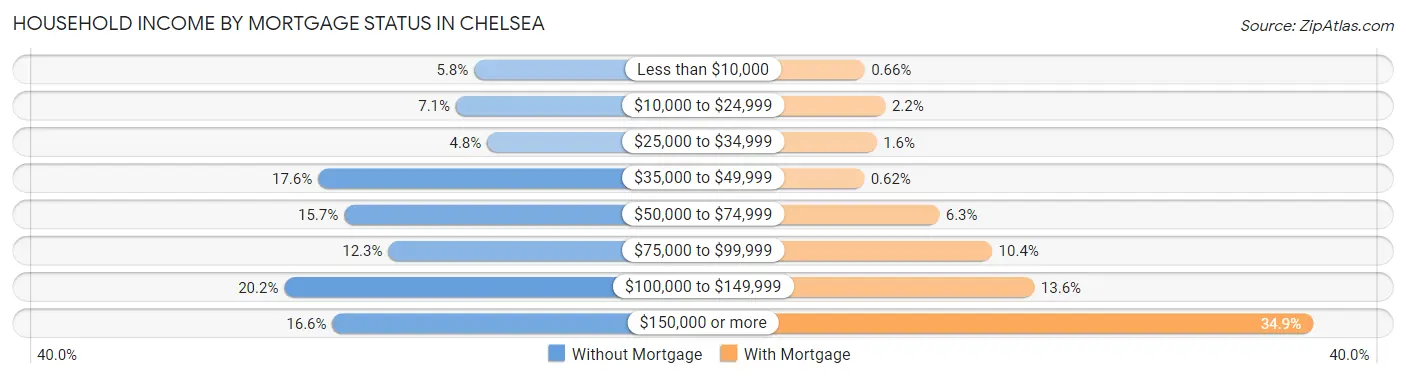
| Household Income | Without Mortgage | With Mortgage |
| Less than $10,000 | 58 (5.8%) | 18 (0.7%) |
| $10,000 to $24,999 | 72 (7.1%) | 61 (2.2%) |
| $25,000 to $34,999 | 48 (4.8%) | 43 (1.6%) |
| $35,000 to $49,999 | 178 (17.6%) | 17 (0.6%) |
| $50,000 to $74,999 | 158 (15.7%) | 173 (6.3%) |
| $75,000 to $99,999 | 124 (12.3%) | 283 (10.4%) |
| $100,000 to $149,999 | 204 (20.2%) | 371 (13.6%) |
| $150,000 or more | 167 (16.6%) | 951 (34.8%) |
| Total | 1,009 (100.0%) | 2,729 (100.0%) |
Property Value to Household Income Ratio in Chelsea
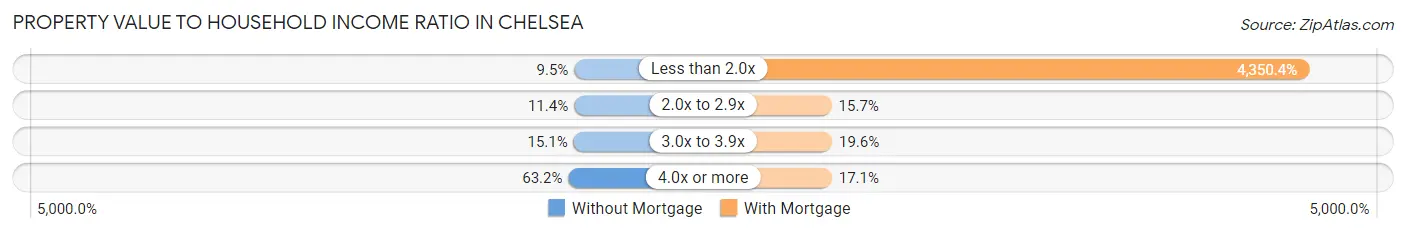
| Value-to-Income Ratio | Without Mortgage | With Mortgage |
| Less than 2.0x | 96 (9.5%) | 118,722 (4,350.4%) |
| 2.0x to 2.9x | 115 (11.4%) | 428 (15.7%) |
| 3.0x to 3.9x | 152 (15.1%) | 536 (19.6%) |
| 4.0x or more | 638 (63.2%) | 467 (17.1%) |
| Total | 1,009 (100.0%) | 2,729 (100.0%) |
Real Estate Taxes by Mortgage Status in Chelsea
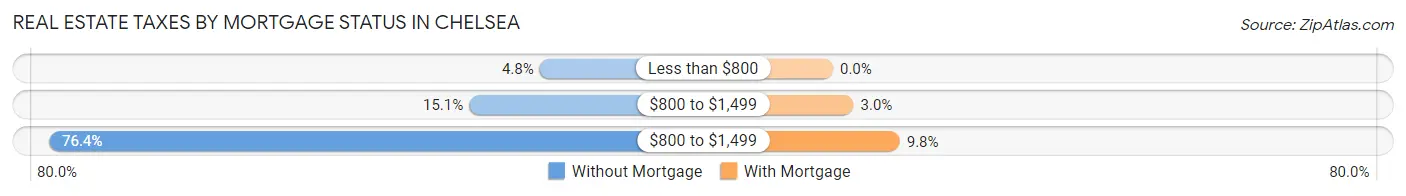
| Property Taxes | Without Mortgage | With Mortgage |
| Less than $800 | 48 (4.8%) | 0 (0.0%) |
| $800 to $1,499 | 152 (15.1%) | 82 (3.0%) |
| $800 to $1,499 | 771 (76.4%) | 266 (9.8%) |
| Total | 1,009 (100.0%) | 2,729 (100.0%) |
Health & Disability in Chelsea
Health Insurance Coverage by Age in Chelsea
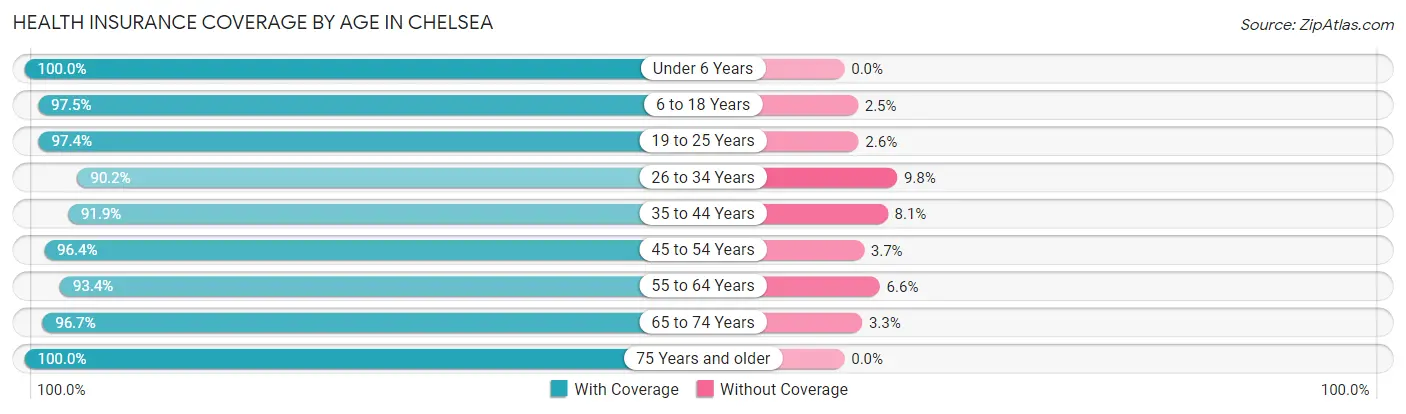
| Age Bracket | With Coverage | Without Coverage |
| Under 6 Years | 3,388 (100.0%) | 0 (0.0%) |
| 6 to 18 Years | 6,020 (97.5%) | 155 (2.5%) |
| 19 to 25 Years | 3,407 (97.4%) | 92 (2.6%) |
| 26 to 34 Years | 6,486 (90.2%) | 707 (9.8%) |
| 35 to 44 Years | 5,574 (91.9%) | 490 (8.1%) |
| 45 to 54 Years | 5,089 (96.4%) | 193 (3.6%) |
| 55 to 64 Years | 3,857 (93.4%) | 272 (6.6%) |
| 65 to 74 Years | 2,109 (96.7%) | 72 (3.3%) |
| 75 Years and older | 1,542 (100.0%) | 0 (0.0%) |
| Total | 37,472 (95.0%) | 1,981 (5.0%) |
Health Insurance Coverage by Citizenship Status in Chelsea
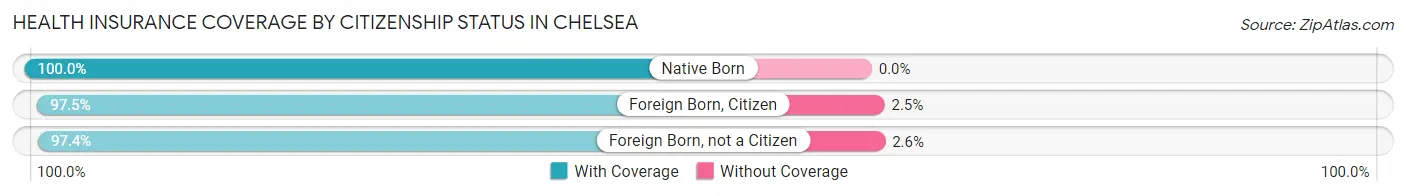
| Citizenship Status | With Coverage | Without Coverage |
| Native Born | 3,388 (100.0%) | 0 (0.0%) |
| Foreign Born, Citizen | 6,020 (97.5%) | 155 (2.5%) |
| Foreign Born, not a Citizen | 3,407 (97.4%) | 92 (2.6%) |
Health Insurance Coverage by Household Income in Chelsea
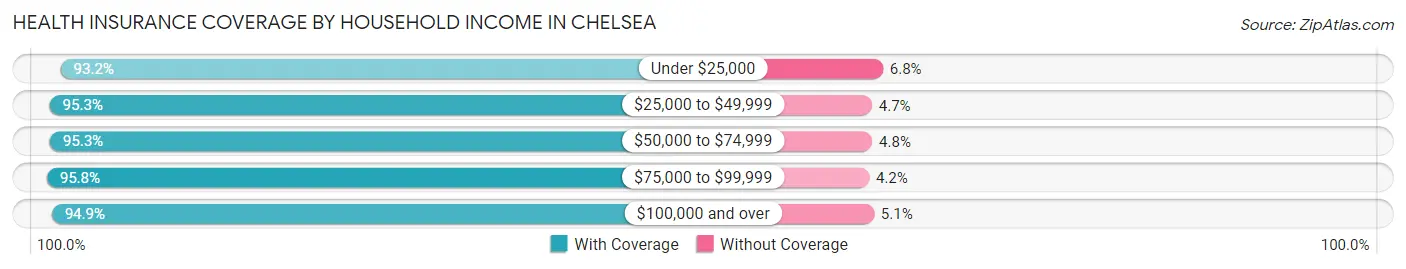
| Household Income | With Coverage | Without Coverage |
| Under $25,000 | 4,416 (93.2%) | 320 (6.8%) |
| $25,000 to $49,999 | 6,652 (95.3%) | 328 (4.7%) |
| $50,000 to $74,999 | 4,374 (95.3%) | 218 (4.8%) |
| $75,000 to $99,999 | 4,317 (95.8%) | 188 (4.2%) |
| $100,000 and over | 17,312 (94.9%) | 927 (5.1%) |
Public vs Private Health Insurance Coverage by Age in Chelsea
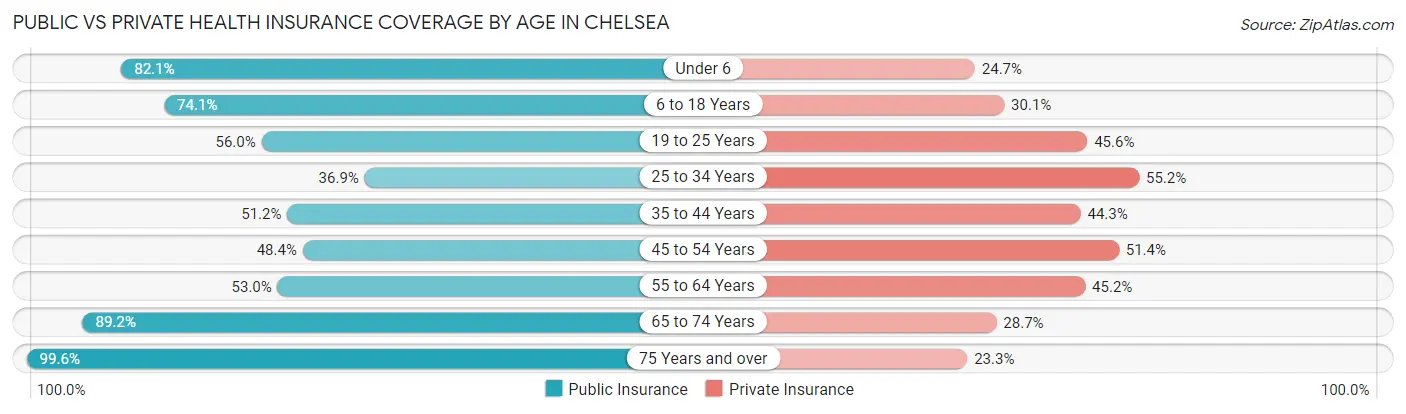
| Age Bracket | Public Insurance | Private Insurance |
| Under 6 | 2,780 (82.1%) | 837 (24.7%) |
| 6 to 18 Years | 4,575 (74.1%) | 1,861 (30.1%) |
| 19 to 25 Years | 1,960 (56.0%) | 1,594 (45.6%) |
| 25 to 34 Years | 2,653 (36.9%) | 3,969 (55.2%) |
| 35 to 44 Years | 3,107 (51.2%) | 2,687 (44.3%) |
| 45 to 54 Years | 2,555 (48.4%) | 2,716 (51.4%) |
| 55 to 64 Years | 2,190 (53.0%) | 1,865 (45.2%) |
| 65 to 74 Years | 1,946 (89.2%) | 626 (28.7%) |
| 75 Years and over | 1,536 (99.6%) | 359 (23.3%) |
| Total | 23,302 (59.1%) | 16,514 (41.9%) |
Disability Status by Sex by Age in Chelsea
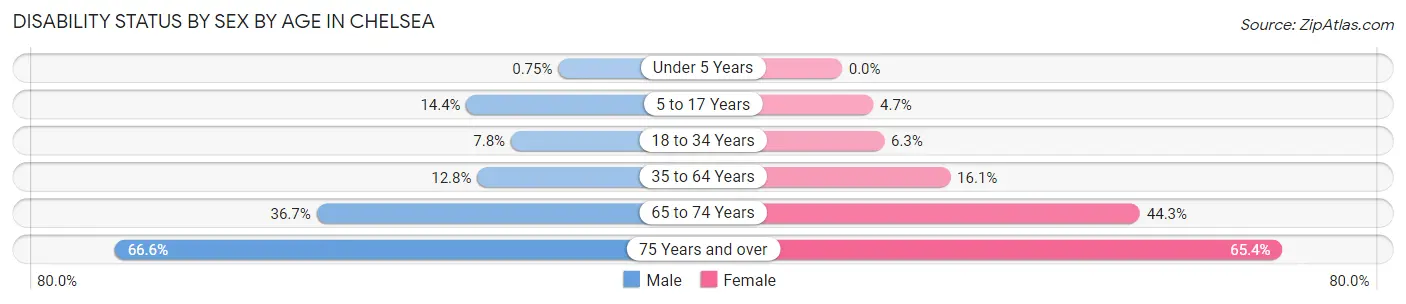
| Age Bracket | Male | Female |
| Under 5 Years | 11 (0.7%) | 0 (0.0%) |
| 5 to 17 Years | 440 (14.4%) | 142 (4.6%) |
| 18 to 34 Years | 472 (7.8%) | 317 (6.3%) |
| 35 to 64 Years | 1,070 (12.8%) | 1,143 (16.1%) |
| 65 to 74 Years | 416 (36.6%) | 463 (44.3%) |
| 75 Years and over | 405 (66.6%) | 611 (65.4%) |
Disability Class by Sex by Age in Chelsea
Disability Class: Hearing Difficulty
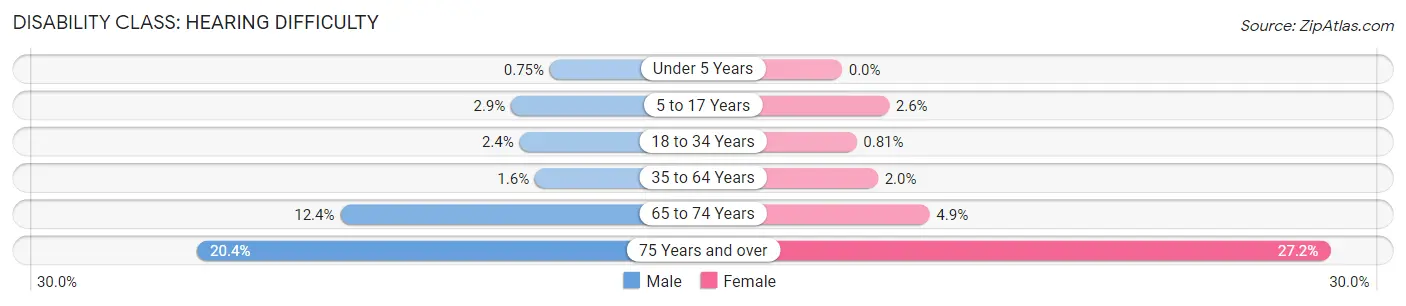
| Age Bracket | Male | Female |
| Under 5 Years | 11 (0.7%) | 0 (0.0%) |
| 5 to 17 Years | 89 (2.9%) | 80 (2.6%) |
| 18 to 34 Years | 148 (2.4%) | 41 (0.8%) |
| 35 to 64 Years | 132 (1.6%) | 142 (2.0%) |
| 65 to 74 Years | 141 (12.4%) | 51 (4.9%) |
| 75 Years and over | 124 (20.4%) | 254 (27.2%) |
Disability Class: Vision Difficulty
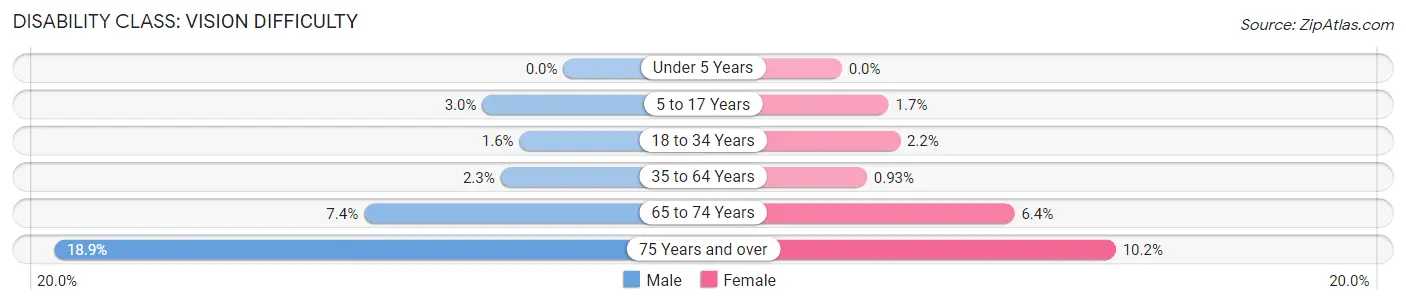
| Age Bracket | Male | Female |
| Under 5 Years | 0 (0.0%) | 0 (0.0%) |
| 5 to 17 Years | 92 (3.0%) | 53 (1.7%) |
| 18 to 34 Years | 99 (1.6%) | 109 (2.2%) |
| 35 to 64 Years | 195 (2.3%) | 66 (0.9%) |
| 65 to 74 Years | 84 (7.4%) | 67 (6.4%) |
| 75 Years and over | 115 (18.9%) | 95 (10.2%) |
Disability Class: Cognitive Difficulty
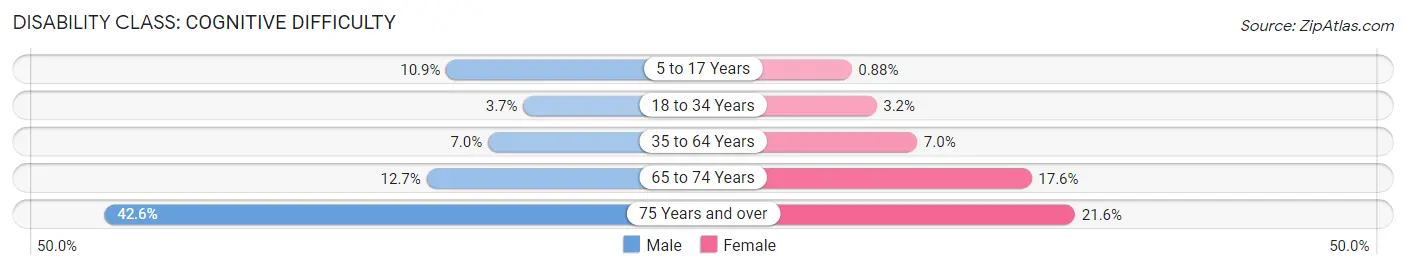
| Age Bracket | Male | Female |
| 5 to 17 Years | 332 (10.9%) | 27 (0.9%) |
| 18 to 34 Years | 225 (3.7%) | 162 (3.2%) |
| 35 to 64 Years | 585 (7.0%) | 495 (7.0%) |
| 65 to 74 Years | 144 (12.7%) | 184 (17.6%) |
| 75 Years and over | 259 (42.6%) | 202 (21.6%) |
Disability Class: Ambulatory Difficulty
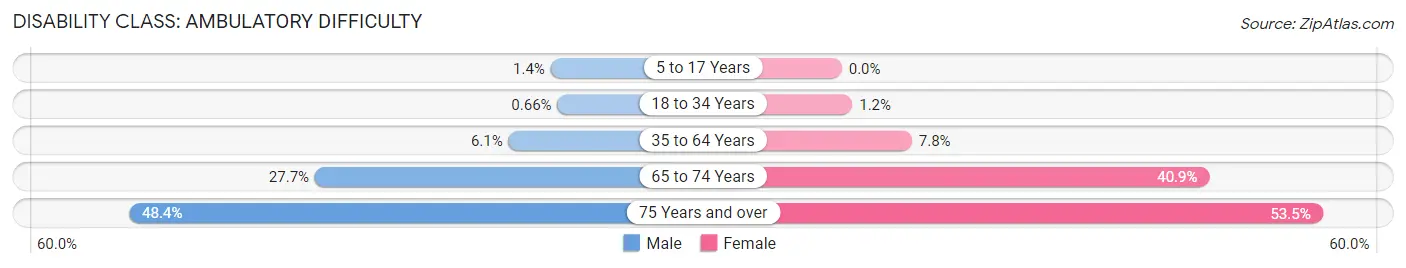
| Age Bracket | Male | Female |
| 5 to 17 Years | 43 (1.4%) | 0 (0.0%) |
| 18 to 34 Years | 40 (0.7%) | 59 (1.2%) |
| 35 to 64 Years | 511 (6.1%) | 554 (7.8%) |
| 65 to 74 Years | 314 (27.7%) | 428 (40.9%) |
| 75 Years and over | 294 (48.4%) | 500 (53.5%) |
Disability Class: Self-Care Difficulty
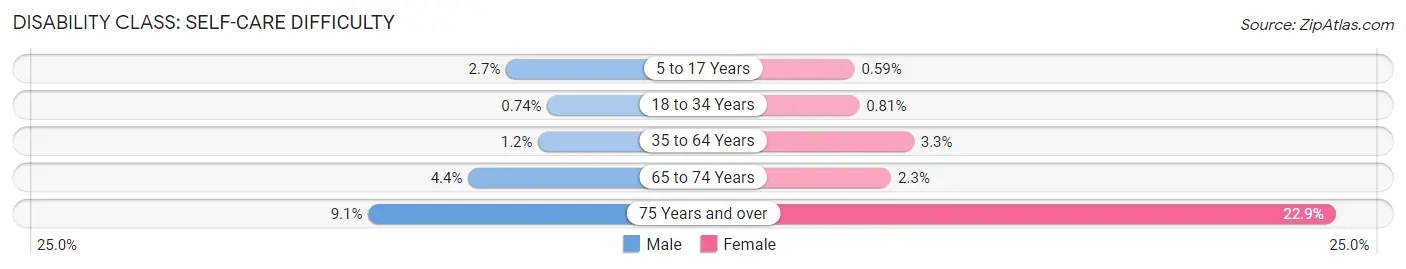
| Age Bracket | Male | Female |
| 5 to 17 Years | 81 (2.6%) | 18 (0.6%) |
| 18 to 34 Years | 45 (0.7%) | 41 (0.8%) |
| 35 to 64 Years | 97 (1.2%) | 237 (3.3%) |
| 65 to 74 Years | 50 (4.4%) | 24 (2.3%) |
| 75 Years and over | 55 (9.0%) | 214 (22.9%) |
Technology Access in Chelsea
Computing Device Access in Chelsea
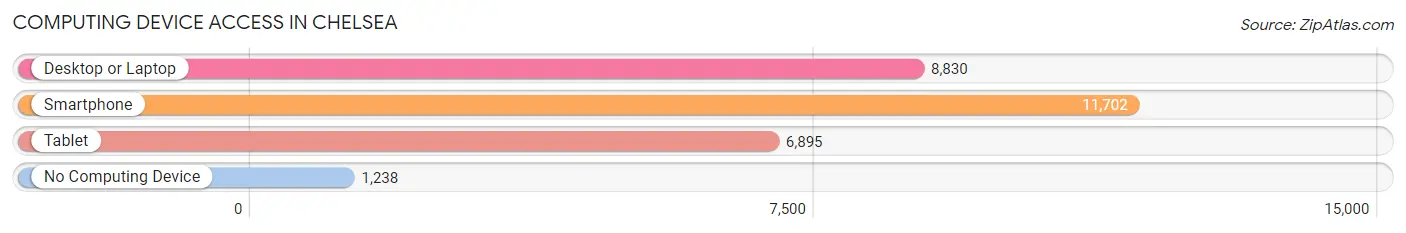
| Device Type | # Households | % Households |
| Desktop or Laptop | 8,830 | 66.0% |
| Smartphone | 11,702 | 87.4% |
| Tablet | 6,895 | 51.5% |
| No Computing Device | 1,238 | 9.2% |
| Total | 13,386 | 100.0% |
Internet Access in Chelsea
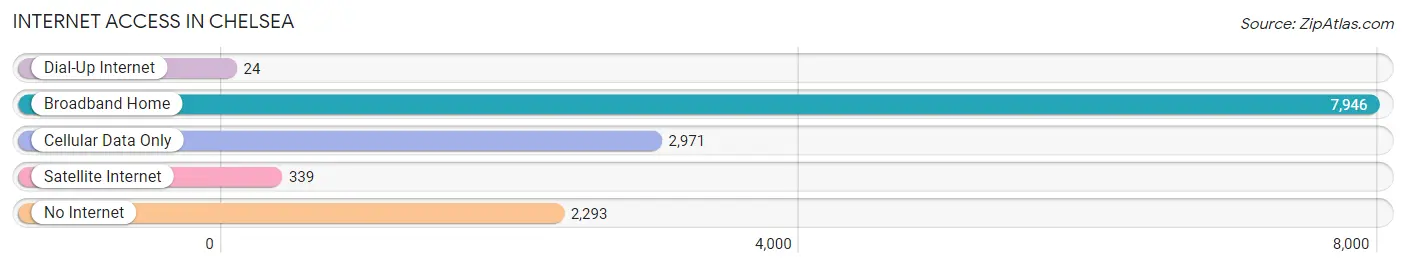
| Internet Type | # Households | % Households |
| Dial-Up Internet | 24 | 0.2% |
| Broadband Home | 7,946 | 59.4% |
| Cellular Data Only | 2,971 | 22.2% |
| Satellite Internet | 339 | 2.5% |
| No Internet | 2,293 | 17.1% |
| Total | 13,386 | 100.0% |
Chelsea Summary
Chelsea is a city located in Suffolk County, Massachusetts, United States, directly across the Mystic River from the city of Boston. As of the 2010 census, Chelsea had a population of 35,177, making it the second most populous city in Suffolk County. Chelsea is one of the most densely populated cities in the United States.
History
The area that is now Chelsea was first settled in 1624 by Samuel Maverick, who was one of the first settlers of Boston. The area was originally part of the town of Winnisimmet, which was later annexed by the city of Boston in 1630. In 1739, the area was separated from Boston and incorporated as the town of Chelsea. The town was named after Chelsea, a borough of London in England.
In the 19th century, Chelsea was a major industrial center, with several factories and shipyards. The Chelsea Naval Hospital was established in 1871 and served as a major medical facility for the U.S. Navy during World War I and World War II. The hospital closed in 1974 and the site is now the Chelsea Soldiers’ Home.
In the late 19th century, Chelsea was a major center of the shoe manufacturing industry. The city was also home to several tanneries and leather goods factories.
Geography
Chelsea is located in eastern Massachusetts, on the north shore of the Mystic River. It is bordered by the cities of Revere to the north, Everett to the west, and Boston to the south. The city has a total area of 2.5 square miles, of which 0.9 square miles is land and 1.6 square miles is water.
Economy
Chelsea’s economy is largely based on service industries, with many residents employed in healthcare, education, and retail. The city is also home to several manufacturing companies, including a major shoe factory and a leather goods factory.
Demographics
As of the 2010 census, there were 35,177 people, 13,845 households, and 8,845 families residing in the city. The population density was 14,845.3 people per square mile. The racial makeup of the city was 57.2% White, 16.3% African American, 0.4% Native American, 8.2% Asian, 0.1% Pacific Islander, 14.3% from other races, and 3.5% from two or more races. Hispanic or Latino of any race were 33.2% of the population.
The median income for a household in the city was $35,872, and the median income for a family was $45,837. Males had a median income of $32,845 versus $30,835 for females. The per capita income for the city was $19,845. About 16.2% of families and 20.2% of the population were below the poverty line, including 28.3% of those under age 18 and 16.2% of those age 65 or over.
Common Questions
What is Per Capita Income in Chelsea?
Per Capita income in Chelsea is $30,454.
What is the Median Family Income in Chelsea?
Median Family Income in Chelsea is $70,525.
What is the Median Household income in Chelsea?
Median Household Income in Chelsea is $71,051.
What is Income or Wage Gap in Chelsea?
Income or Wage Gap in Chelsea is 15.6%.
Women in Chelsea earn 84.4 cents for every dollar earned by a man.
What is Family Income Deficit in Chelsea?
Family Income Deficit in Chelsea is $9,707.
Families that are below poverty line in Chelsea earn $9,707 less on average than the poverty threshold level.
What is Inequality or Gini Index in Chelsea?
Inequality or Gini Index in Chelsea is 0.45.
What is the Total Population of Chelsea?
Total Population of Chelsea is 39,890.
What is the Total Male Population of Chelsea?
Total Male Population of Chelsea is 20,891.
What is the Total Female Population of Chelsea?
Total Female Population of Chelsea is 18,999.
What is the Ratio of Males per 100 Females in Chelsea?
There are 109.96 Males per 100 Females in Chelsea.
What is the Ratio of Females per 100 Males in Chelsea?
There are 90.94 Females per 100 Males in Chelsea.
What is the Median Population Age in Chelsea?
Median Population Age in Chelsea is 34.5 Years.
What is the Average Family Size in Chelsea
Average Family Size in Chelsea is 3.8 People.
What is the Average Household Size in Chelsea
Average Household Size in Chelsea is 2.9 People.
How Large is the Labor Force in Chelsea?
There are 21,782 People in the Labor Forcein in Chelsea.
What is the Percentage of People in the Labor Force in Chelsea?
68.7% of People are in the Labor Force in Chelsea.
What is the Unemployment Rate in Chelsea?
Unemployment Rate in Chelsea is 8.9%.