Lawrence, MA Map & Demographics
Lawrence Map
Lawrence Overview
$25,774
PER CAPITA INCOME
$58,898
AVG FAMILY INCOME
$53,977
AVG HOUSEHOLD INCOME
17.7%
WAGE / INCOME GAP [ % ]
82.3¢/ $1
WAGE / INCOME GAP [ $ ]
$9,066
FAMILY INCOME DEFICIT
0.46
INEQUALITY / GINI INDEX
88,067
TOTAL POPULATION
43,725
MALE POPULATION
44,342
FEMALE POPULATION
98.61
MALES / 100 FEMALES
101.41
FEMALES / 100 MALES
31.5
MEDIAN AGE
3.4
AVG FAMILY SIZE
2.9
AVG HOUSEHOLD SIZE
45,968
LABOR FORCE [ PEOPLE ]
69.0%
PERCENT IN LABOR FORCE
10.4%
UNEMPLOYMENT RATE
Income in Lawrence
Income Overview in Lawrence
Per Capita Income in Lawrence is $25,774, while median incomes of families and households are $58,898 and $53,977 respectively.
| Characteristic | Number | Measure |
| Per Capita Income | 88,067 | $25,774 |
| Median Family Income | 20,841 | $58,898 |
| Mean Family Income | 20,841 | $79,259 |
| Median Household Income | 30,330 | $53,977 |
| Mean Household Income | 30,330 | $73,856 |
| Income Deficit | 20,841 | $9,066 |
| Wage / Income Gap (%) | 88,067 | 17.74% |
| Wage / Income Gap ($) | 88,067 | 82.26¢ per $1 |
| Gini / Inequality Index | 88,067 | 0.46 |
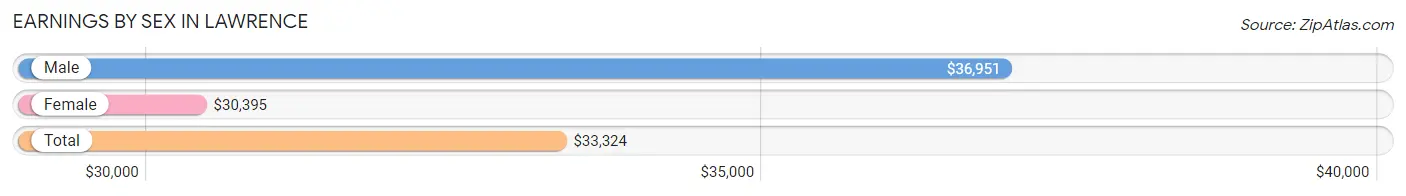
Earnings by Sex in Lawrence
Average Earnings in Lawrence are $33,324, $36,951 for men and $30,395 for women, a difference of 17.7%.
| Sex | Number | Average Earnings |
| Male | 23,629 (51.0%) | $36,951 |
| Female | 22,680 (49.0%) | $30,395 |
| Total | 46,309 (100.0%) | $33,324 |
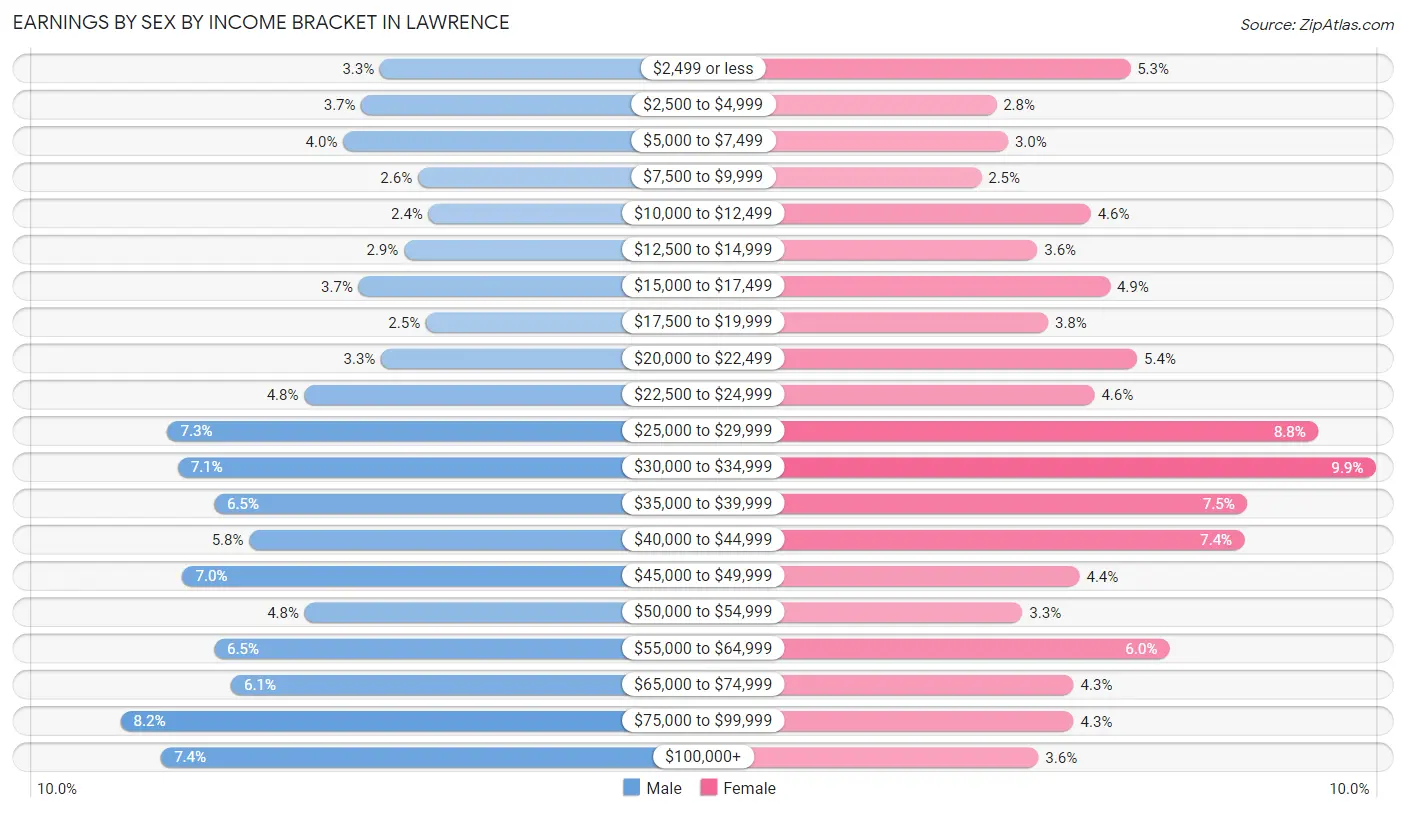
Earnings by Sex by Income Bracket in Lawrence
The most common earnings brackets in Lawrence are $75,000 to $99,999 for men (1,937 | 8.2%) and $30,000 to $34,999 for women (2,246 | 9.9%).
| Income | Male | Female |
| $2,499 or less | 790 (3.3%) | 1,204 (5.3%) |
| $2,500 to $4,999 | 871 (3.7%) | 634 (2.8%) |
| $5,000 to $7,499 | 952 (4.0%) | 685 (3.0%) |
| $7,500 to $9,999 | 621 (2.6%) | 571 (2.5%) |
| $10,000 to $12,499 | 575 (2.4%) | 1,036 (4.6%) |
| $12,500 to $14,999 | 683 (2.9%) | 809 (3.6%) |
| $15,000 to $17,499 | 883 (3.7%) | 1,118 (4.9%) |
| $17,500 to $19,999 | 585 (2.5%) | 854 (3.8%) |
| $20,000 to $22,499 | 785 (3.3%) | 1,234 (5.4%) |
| $22,500 to $24,999 | 1,124 (4.8%) | 1,053 (4.6%) |
| $25,000 to $29,999 | 1,730 (7.3%) | 2,001 (8.8%) |
| $30,000 to $34,999 | 1,684 (7.1%) | 2,246 (9.9%) |
| $35,000 to $39,999 | 1,525 (6.5%) | 1,699 (7.5%) |
| $40,000 to $44,999 | 1,368 (5.8%) | 1,687 (7.4%) |
| $45,000 to $49,999 | 1,664 (7.0%) | 989 (4.4%) |
| $50,000 to $54,999 | 1,122 (4.8%) | 747 (3.3%) |
| $55,000 to $64,999 | 1,524 (6.5%) | 1,369 (6.0%) |
| $65,000 to $74,999 | 1,449 (6.1%) | 965 (4.3%) |
| $75,000 to $99,999 | 1,937 (8.2%) | 965 (4.3%) |
| $100,000+ | 1,757 (7.4%) | 814 (3.6%) |
| Total | 23,629 (100.0%) | 22,680 (100.0%) |
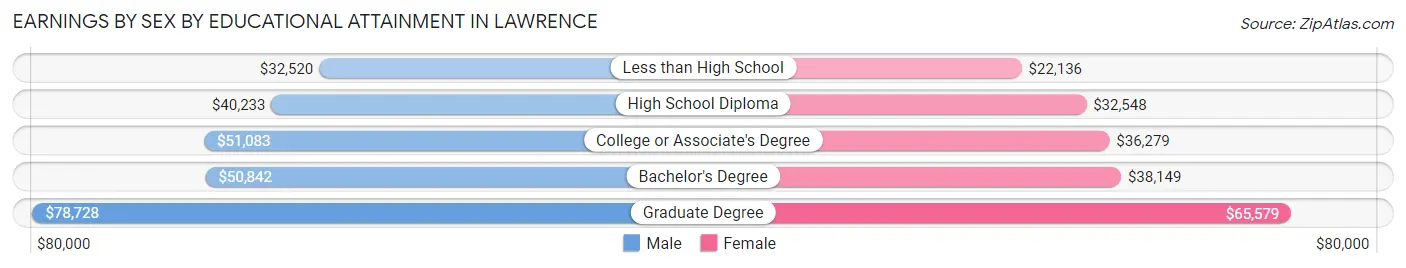
Earnings by Sex by Educational Attainment in Lawrence
Average earnings in Lawrence are $41,390 for men and $33,303 for women, a difference of 19.5%. Men with an educational attainment of graduate degree enjoy the highest average annual earnings of $78,728, while those with less than high school education earn the least with $32,520. Women with an educational attainment of graduate degree earn the most with the average annual earnings of $65,579, while those with less than high school education have the smallest earnings of $22,136.
| Educational Attainment | Male Income | Female Income |
| Less than High School | $32,520 | $22,136 |
| High School Diploma | $40,233 | $32,548 |
| College or Associate's Degree | $51,083 | $36,279 |
| Bachelor's Degree | $50,842 | $38,149 |
| Graduate Degree | $78,728 | $65,579 |
| Total | $41,390 | $33,303 |
Family Income in Lawrence
Family Income Brackets in Lawrence
According to the Lawrence family income data, there are 4,272 families falling into the $50,000 to $74,999 income range, which is the most common income bracket and makes up 20.5% of all families. Conversely, the less than $10,000 income bracket is the least frequent group with only 709 families (3.4%) belonging to this category.
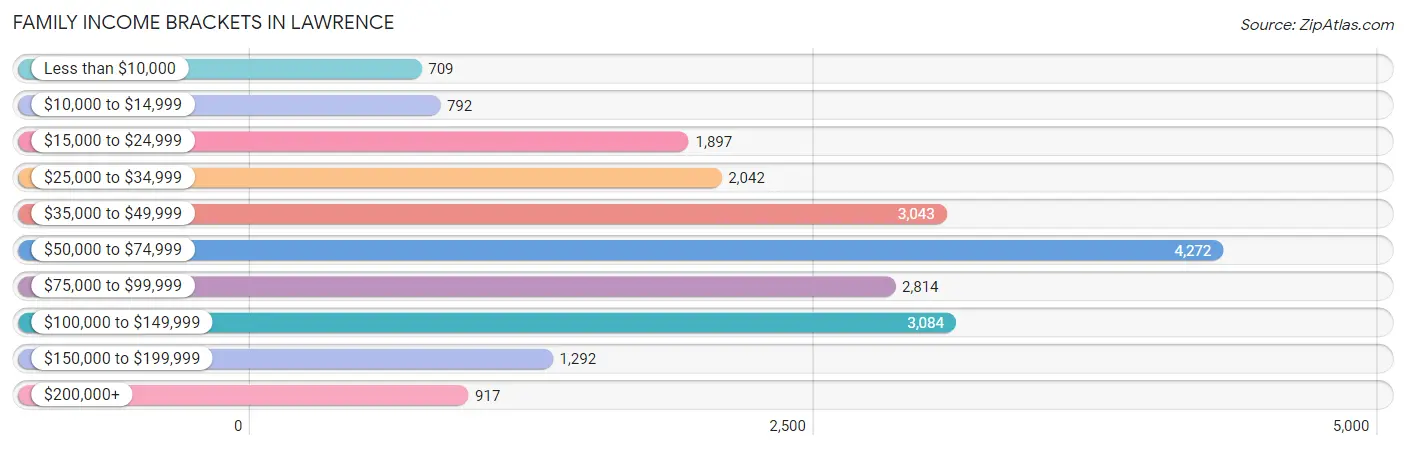
| Income Bracket | # Families | % Families |
| Less than $10,000 | 709 | 3.4% |
| $10,000 to $14,999 | 792 | 3.8% |
| $15,000 to $24,999 | 1,897 | 9.1% |
| $25,000 to $34,999 | 2,042 | 9.8% |
| $35,000 to $49,999 | 3,043 | 14.6% |
| $50,000 to $74,999 | 4,272 | 20.5% |
| $75,000 to $99,999 | 2,814 | 13.5% |
| $100,000 to $149,999 | 3,084 | 14.8% |
| $150,000 to $199,999 | 1,292 | 6.2% |
| $200,000+ | 917 | 4.4% |
Family Income by Famaliy Size in Lawrence
7+ person families (666 | 3.2%) account for the highest median family income in Lawrence with $106,000 per family, while 2-person families (6,778 | 32.5%) have the highest median income of $25,522 per family member.
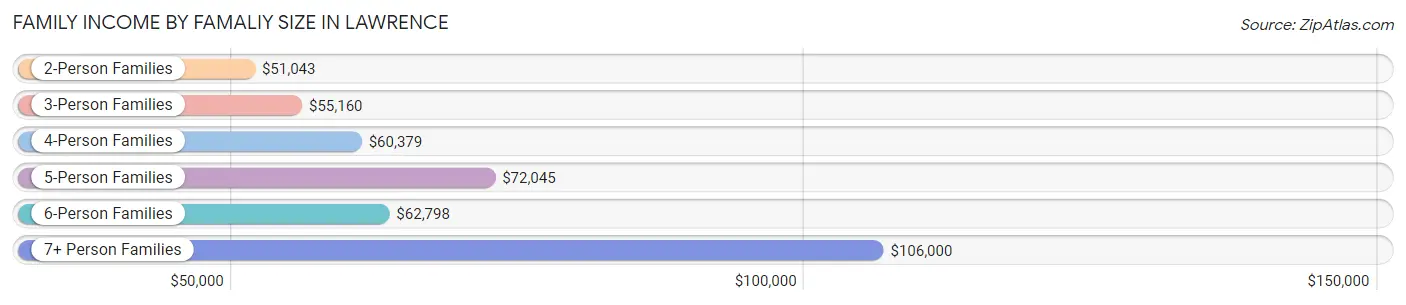
| Income Bracket | # Families | Median Income |
| 2-Person Families | 6,778 (32.5%) | $51,043 |
| 3-Person Families | 5,540 (26.6%) | $55,160 |
| 4-Person Families | 4,354 (20.9%) | $60,379 |
| 5-Person Families | 2,616 (12.6%) | $72,045 |
| 6-Person Families | 887 (4.3%) | $62,798 |
| 7+ Person Families | 666 (3.2%) | $106,000 |
| Total | 20,841 (100.0%) | $58,898 |
Family Income by Number of Earners in Lawrence
The median family income in Lawrence is $58,898, with families comprising 3+ earners (3,946) having the highest median family income of $113,133, while families with no earners (1,795) have the lowest median family income of $20,154, accounting for 18.9% and 8.6% of families, respectively.
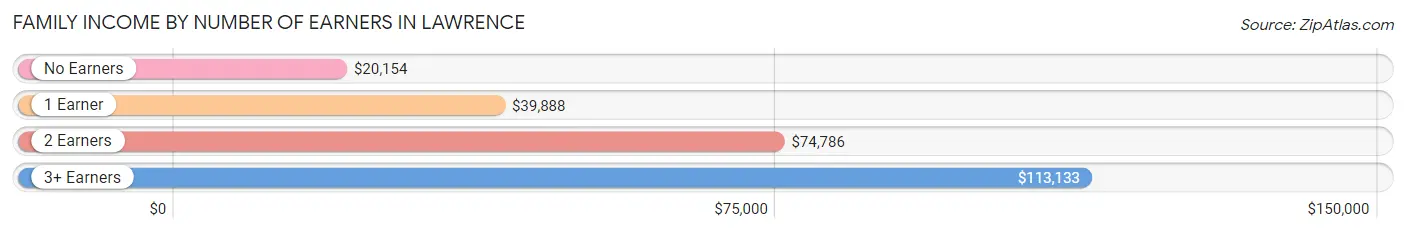
| Number of Earners | # Families | Median Income |
| No Earners | 1,795 (8.6%) | $20,154 |
| 1 Earner | 7,677 (36.8%) | $39,888 |
| 2 Earners | 7,423 (35.6%) | $74,786 |
| 3+ Earners | 3,946 (18.9%) | $113,133 |
| Total | 20,841 (100.0%) | $58,898 |
Household Income in Lawrence
Household Income Brackets in Lawrence
With 5,611 households falling in the category, the $50,000 to $74,999 income range is the most frequent in Lawrence, accounting for 18.5% of all households. In contrast, only 1,244 households (4.1%) fall into the $200,000+ income bracket, making it the least populous group.
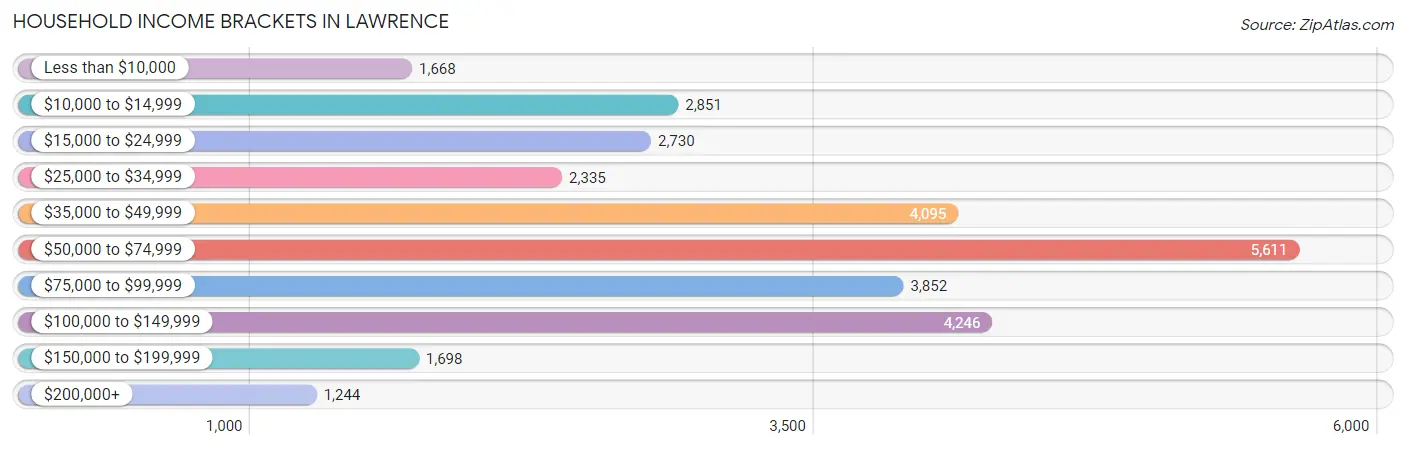
| Income Bracket | # Households | % Households |
| Less than $10,000 | 1,668 | 5.5% |
| $10,000 to $14,999 | 2,851 | 9.4% |
| $15,000 to $24,999 | 2,730 | 9.0% |
| $25,000 to $34,999 | 2,335 | 7.7% |
| $35,000 to $49,999 | 4,095 | 13.5% |
| $50,000 to $74,999 | 5,611 | 18.5% |
| $75,000 to $99,999 | 3,852 | 12.7% |
| $100,000 to $149,999 | 4,246 | 14.0% |
| $150,000 to $199,999 | 1,698 | 5.6% |
| $200,000+ | 1,244 | 4.1% |
Household Income by Householder Age in Lawrence
The median household income in Lawrence is $53,977, with the highest median household income of $62,446 found in the 15 to 24 years age bracket for the primary householder. A total of 1,670 households (5.5%) fall into this category. Meanwhile, the 65+ years age bracket for the primary householder has the lowest median household income of $23,775, with 5,035 households (16.6%) in this group.
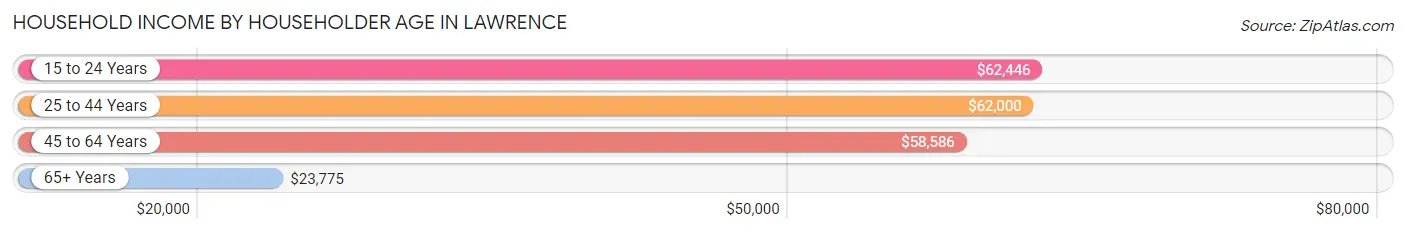
| Income Bracket | # Households | Median Income |
| 15 to 24 Years | 1,670 (5.5%) | $62,446 |
| 25 to 44 Years | 12,174 (40.1%) | $62,000 |
| 45 to 64 Years | 11,451 (37.8%) | $58,586 |
| 65+ Years | 5,035 (16.6%) | $23,775 |
| Total | 30,330 (100.0%) | $53,977 |
Poverty in Lawrence
Income Below Poverty by Sex and Age in Lawrence
With 18.1% poverty level for males and 20.7% for females among the residents of Lawrence, 12 to 14 year old males and 15 year old females are the most vulnerable to poverty, with 996 males (39.4%) and 286 females (43.9%) in their respective age groups living below the poverty level.
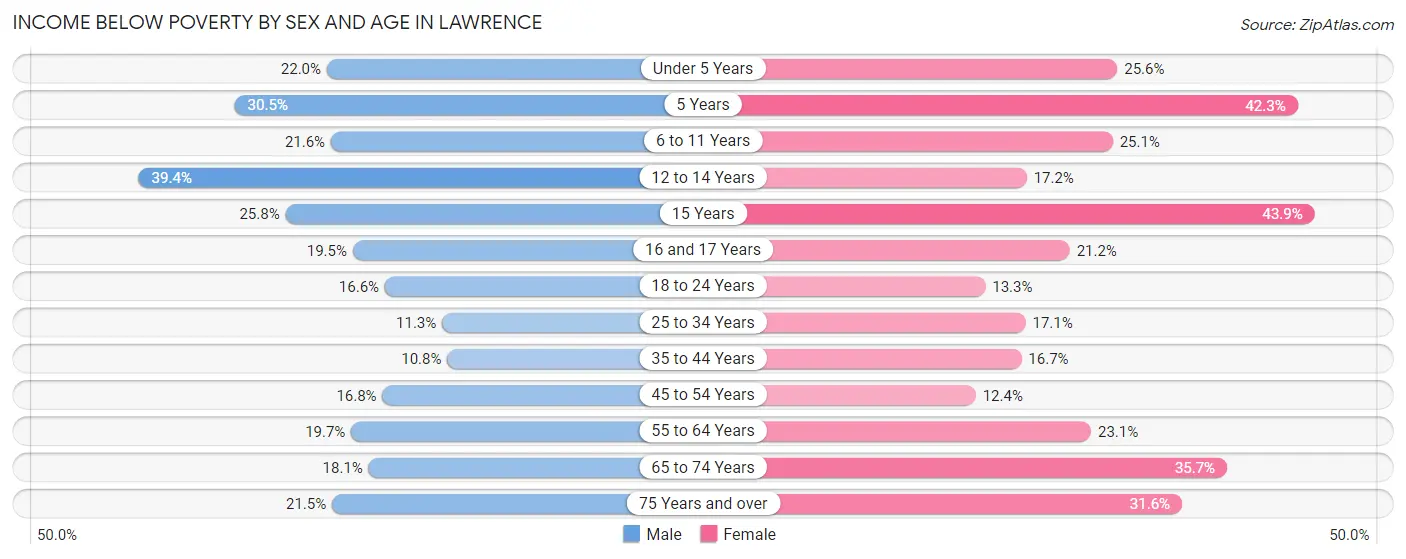
| Age Bracket | Male | Female |
| Under 5 Years | 670 (22.0%) | 940 (25.6%) |
| 5 Years | 190 (30.5%) | 299 (42.3%) |
| 6 to 11 Years | 931 (21.6%) | 790 (25.1%) |
| 12 to 14 Years | 996 (39.4%) | 330 (17.2%) |
| 15 Years | 114 (25.8%) | 286 (43.9%) |
| 16 and 17 Years | 240 (19.5%) | 257 (21.1%) |
| 18 to 24 Years | 884 (16.6%) | 655 (13.3%) |
| 25 to 34 Years | 839 (11.3%) | 1,165 (17.1%) |
| 35 to 44 Years | 587 (10.8%) | 980 (16.7%) |
| 45 to 54 Years | 789 (16.8%) | 669 (12.4%) |
| 55 to 64 Years | 886 (19.7%) | 1,144 (23.1%) |
| 65 to 74 Years | 382 (18.1%) | 984 (35.7%) |
| 75 Years and over | 271 (21.5%) | 623 (31.6%) |
| Total | 7,779 (18.1%) | 9,122 (20.7%) |
Income Above Poverty by Sex and Age in Lawrence
According to the poverty statistics in Lawrence, males aged 35 to 44 years and females aged 45 to 54 years are the age groups that are most secure financially, with 89.2% of males and 87.6% of females in these age groups living above the poverty line.
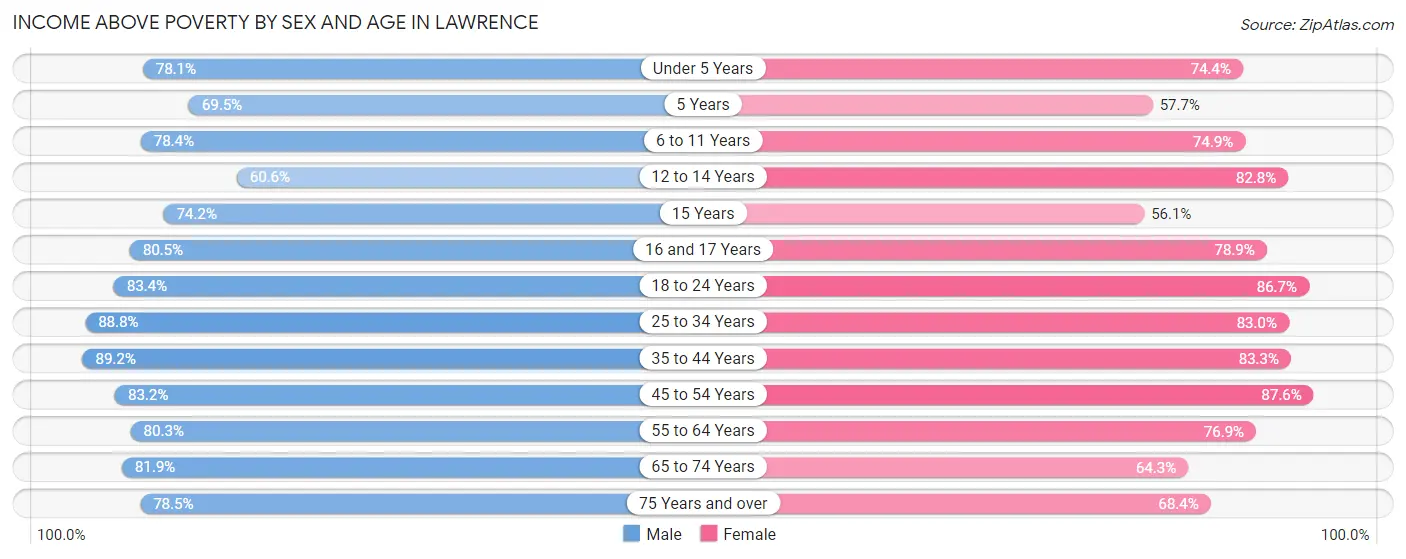
| Age Bracket | Male | Female |
| Under 5 Years | 2,382 (78.0%) | 2,736 (74.4%) |
| 5 Years | 433 (69.5%) | 408 (57.7%) |
| 6 to 11 Years | 3,386 (78.4%) | 2,352 (74.9%) |
| 12 to 14 Years | 1,531 (60.6%) | 1,593 (82.8%) |
| 15 Years | 328 (74.2%) | 366 (56.1%) |
| 16 and 17 Years | 988 (80.5%) | 958 (78.8%) |
| 18 to 24 Years | 4,454 (83.4%) | 4,264 (86.7%) |
| 25 to 34 Years | 6,622 (88.7%) | 5,666 (83.0%) |
| 35 to 44 Years | 4,862 (89.2%) | 4,900 (83.3%) |
| 45 to 54 Years | 3,910 (83.2%) | 4,714 (87.6%) |
| 55 to 64 Years | 3,614 (80.3%) | 3,801 (76.9%) |
| 65 to 74 Years | 1,732 (81.9%) | 1,769 (64.3%) |
| 75 Years and over | 991 (78.5%) | 1,351 (68.4%) |
| Total | 35,233 (81.9%) | 34,878 (79.3%) |
Income Below Poverty Among Married-Couple Families in Lawrence
The poverty statistics for married-couple families in Lawrence show that 9.1% or 824 of the total 9,098 families live below the poverty line. Families with 3 or 4 children have the highest poverty rate of 11.9%, comprising of 158 families. On the other hand, families with 5 or more children have the lowest poverty rate of 7.1%, which includes 10 families.
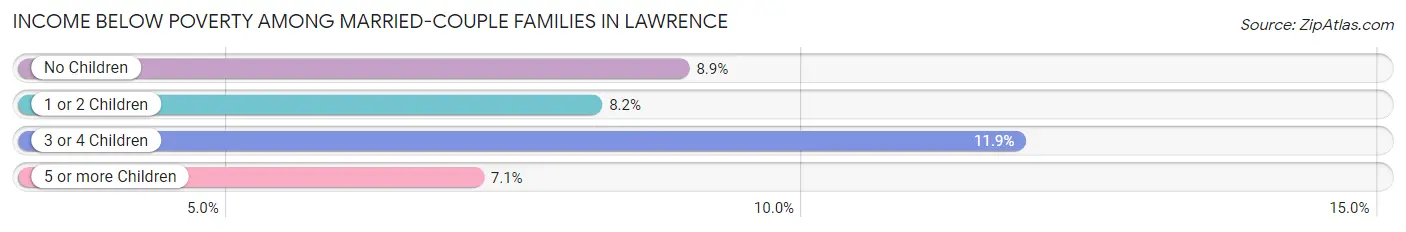
| Children | Above Poverty | Below Poverty |
| No Children | 3,957 (91.1%) | 388 (8.9%) |
| 1 or 2 Children | 3,013 (91.8%) | 268 (8.2%) |
| 3 or 4 Children | 1,174 (88.1%) | 158 (11.9%) |
| 5 or more Children | 130 (92.9%) | 10 (7.1%) |
| Total | 8,274 (90.9%) | 824 (9.1%) |
Income Below Poverty Among Single-Parent Households in Lawrence
According to the poverty data in Lawrence, 20.6% or 719 single-father households and 22.2% or 1,828 single-mother households are living below the poverty line. Among single-father households, those with 5 or more children have the highest poverty rate, with 30 households (100.0%) experiencing poverty. Likewise, among single-mother households, those with 3 or 4 children have the highest poverty rate, with 432 households (50.3%) falling below the poverty line.
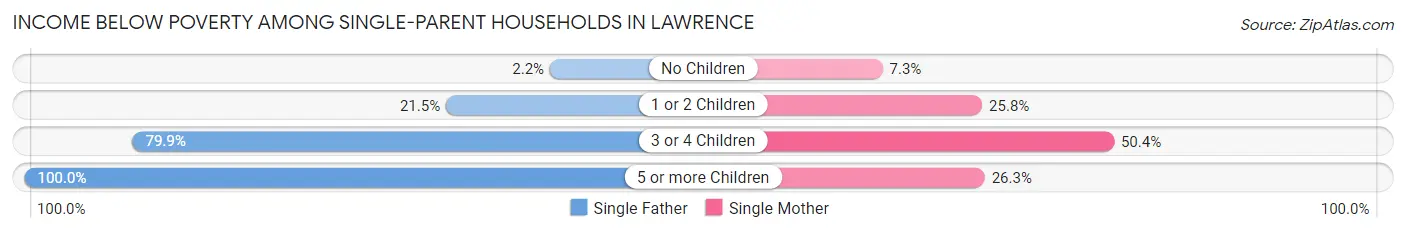
| Children | Single Father | Single Mother |
| No Children | 29 (2.1%) | 200 (7.2%) |
| 1 or 2 Children | 378 (21.5%) | 1,165 (25.8%) |
| 3 or 4 Children | 282 (79.9%) | 432 (50.3%) |
| 5 or more Children | 30 (100.0%) | 31 (26.3%) |
| Total | 719 (20.6%) | 1,828 (22.2%) |
Income Below Poverty Among Married-Couple vs Single-Parent Households in Lawrence
The poverty data for Lawrence shows that 824 of the married-couple family households (9.1%) and 2,547 of the single-parent households (21.7%) are living below the poverty level. Within the married-couple family households, those with 3 or 4 children have the highest poverty rate, with 158 households (11.9%) falling below the poverty line. Among the single-parent households, those with 3 or 4 children have the highest poverty rate, with 714 household (59.0%) living below poverty.
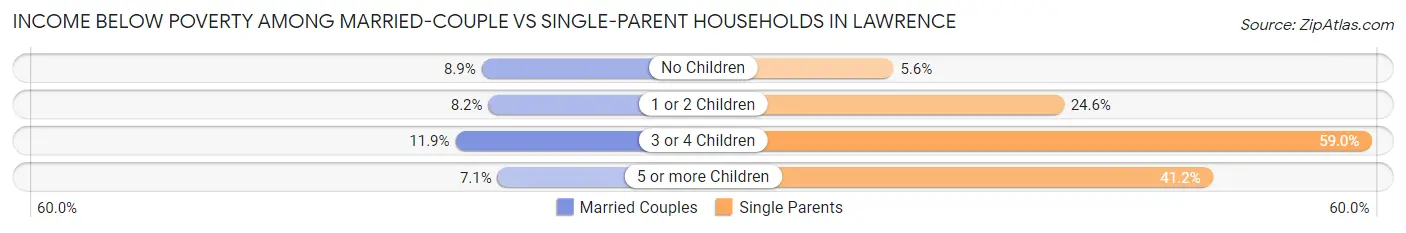
| Children | Married-Couple Families | Single-Parent Households |
| No Children | 388 (8.9%) | 229 (5.6%) |
| 1 or 2 Children | 268 (8.2%) | 1,543 (24.6%) |
| 3 or 4 Children | 158 (11.9%) | 714 (59.0%) |
| 5 or more Children | 10 (7.1%) | 61 (41.2%) |
| Total | 824 (9.1%) | 2,547 (21.7%) |
Race in Lawrence
The most populous races in Lawrence are Hispanic or Latino (72,179 | 82.0%), Some other Race (45,192 | 51.3%), and White / Caucasian (22,956 | 26.1%).
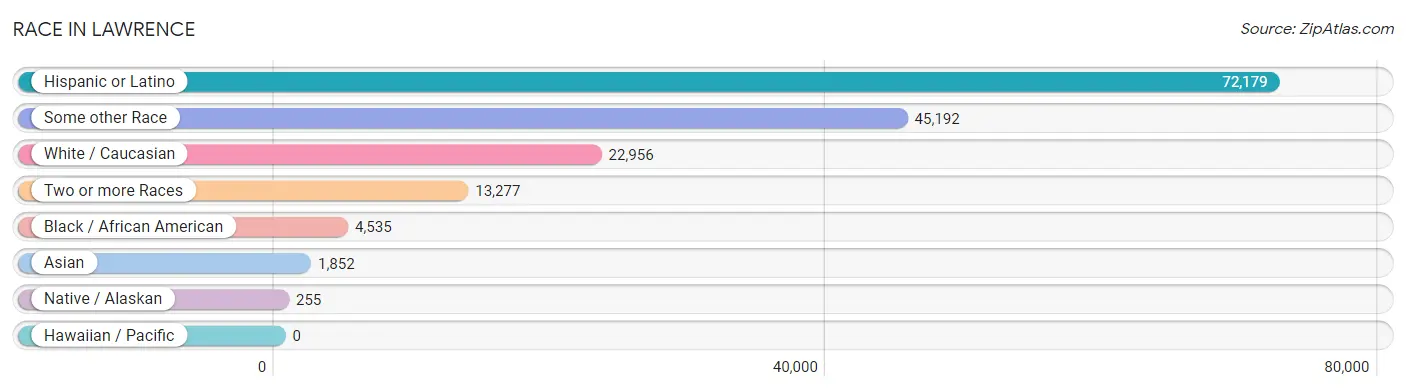
| Race | # Population | % Population |
| Asian | 1,852 | 2.1% |
| Black / African American | 4,535 | 5.1% |
| Hawaiian / Pacific | 0 | 0.0% |
| Hispanic or Latino | 72,179 | 82.0% |
| Native / Alaskan | 255 | 0.3% |
| White / Caucasian | 22,956 | 26.1% |
| Two or more Races | 13,277 | 15.1% |
| Some other Race | 45,192 | 51.3% |
| Total | 88,067 | 100.0% |
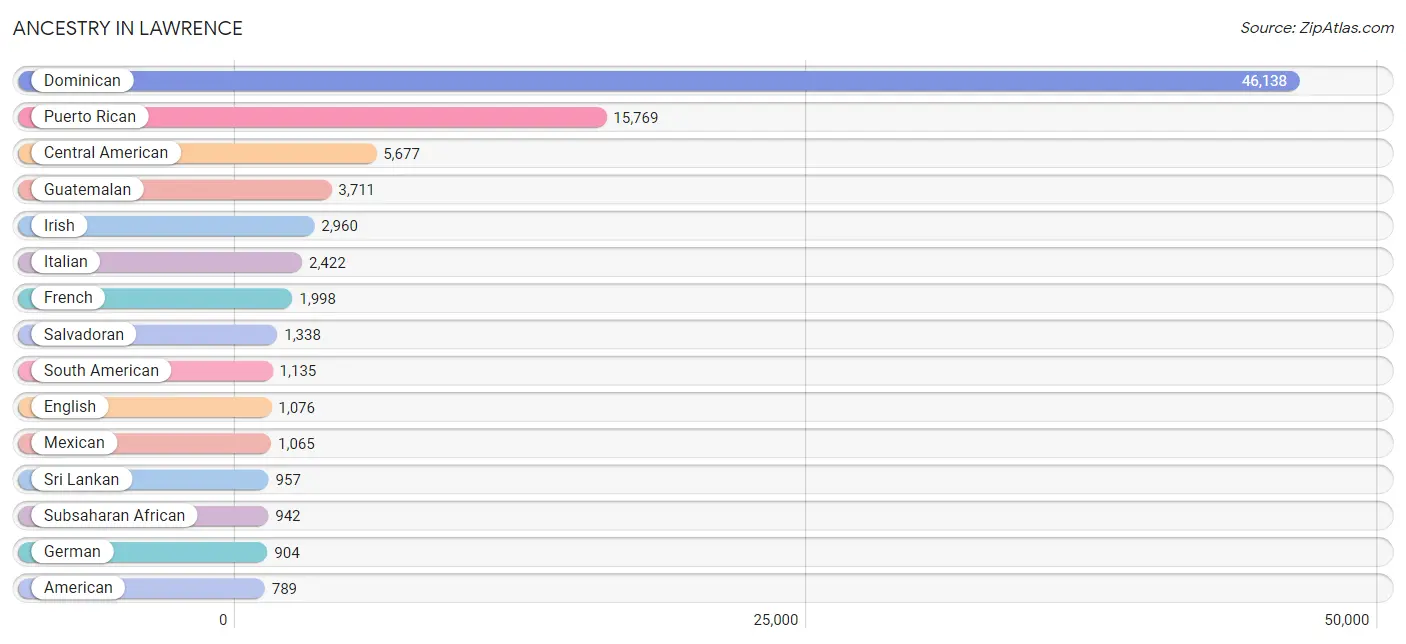
Ancestry in Lawrence
The most populous ancestries reported in Lawrence are Dominican (46,138 | 52.4%), Puerto Rican (15,769 | 17.9%), Central American (5,677 | 6.5%), Guatemalan (3,711 | 4.2%), and Irish (2,960 | 3.4%), together accounting for 84.3% of all Lawrence residents.
| Ancestry | # Population | % Population |
| African | 228 | 0.3% |
| American | 789 | 0.9% |
| Arab | 683 | 0.8% |
| Argentinean | 32 | 0.0% |
| Armenian | 52 | 0.1% |
| Austrian | 11 | 0.0% |
| Belizean | 51 | 0.1% |
| Bolivian | 82 | 0.1% |
| Brazilian | 218 | 0.3% |
| British | 22 | 0.0% |
| British West Indian | 117 | 0.1% |
| Canadian | 77 | 0.1% |
| Cape Verdean | 188 | 0.2% |
| Central American | 5,677 | 6.5% |
| Central American Indian | 276 | 0.3% |
| Cherokee | 59 | 0.1% |
| Chilean | 8 | 0.0% |
| Colombian | 156 | 0.2% |
| Costa Rican | 49 | 0.1% |
| Cuban | 167 | 0.2% |
| Czechoslovakian | 1 | 0.0% |
| Danish | 2 | 0.0% |
| Dominican | 46,138 | 52.4% |
| Dutch | 73 | 0.1% |
| Eastern European | 36 | 0.0% |
| Ecuadorian | 485 | 0.5% |
| English | 1,076 | 1.2% |
| Ethiopian | 14 | 0.0% |
| European | 167 | 0.2% |
| Finnish | 9 | 0.0% |
| French | 1,998 | 2.3% |
| French Canadian | 739 | 0.8% |
| German | 904 | 1.0% |
| Ghanaian | 15 | 0.0% |
| Greek | 61 | 0.1% |
| Guatemalan | 3,711 | 4.2% |
| Haitian | 173 | 0.2% |
| Honduran | 564 | 0.6% |
| Indian (Asian) | 367 | 0.4% |
| Iranian | 9 | 0.0% |
| Irish | 2,960 | 3.4% |
| Italian | 2,422 | 2.8% |
| Jamaican | 225 | 0.3% |
| Japanese | 474 | 0.5% |
| Kenyan | 303 | 0.3% |
| Korean | 53 | 0.1% |
| Lebanese | 672 | 0.8% |
| Lithuanian | 140 | 0.2% |
| Mexican | 1,065 | 1.2% |
| Native Hawaiian | 1 | 0.0% |
| Navajo | 15 | 0.0% |
| Nicaraguan | 12 | 0.0% |
| Norwegian | 28 | 0.0% |
| Panamanian | 3 | 0.0% |
| Peruvian | 343 | 0.4% |
| Polish | 661 | 0.7% |
| Portuguese | 608 | 0.7% |
| Puerto Rican | 15,769 | 17.9% |
| Russian | 16 | 0.0% |
| Salvadoran | 1,338 | 1.5% |
| Scotch-Irish | 57 | 0.1% |
| Scottish | 251 | 0.3% |
| South American | 1,135 | 1.3% |
| South American Indian | 28 | 0.0% |
| Spaniard | 120 | 0.1% |
| Spanish | 240 | 0.3% |
| Sri Lankan | 957 | 1.1% |
| Subsaharan African | 942 | 1.1% |
| Swedish | 55 | 0.1% |
| Syrian | 11 | 0.0% |
| Thai | 230 | 0.3% |
| Trinidadian and Tobagonian | 22 | 0.0% |
| Ugandan | 23 | 0.0% |
| Ukrainian | 42 | 0.1% |
| Uruguayan | 18 | 0.0% |
| Venezuelan | 11 | 0.0% |
| West Indian | 85 | 0.1% | View All 77 Rows |
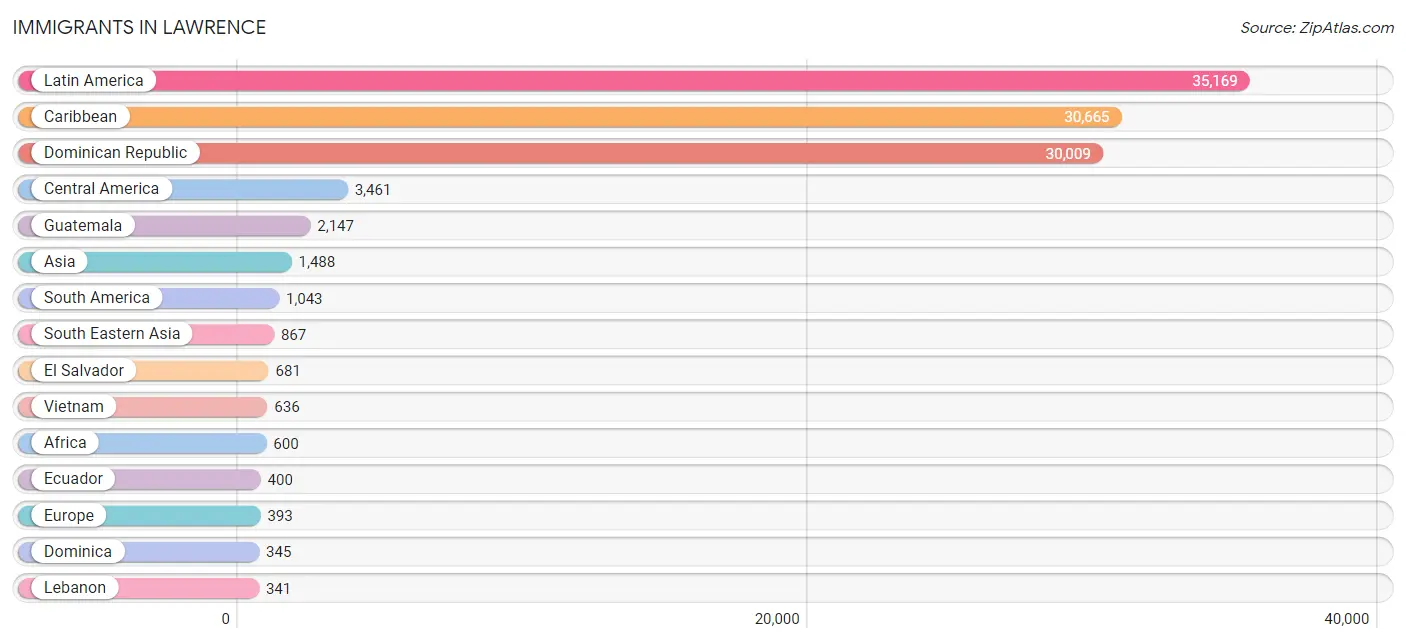
Immigrants in Lawrence
The most numerous immigrant groups reported in Lawrence came from Latin America (35,169 | 39.9%), Caribbean (30,665 | 34.8%), Dominican Republic (30,009 | 34.1%), Central America (3,461 | 3.9%), and Guatemala (2,147 | 2.4%), together accounting for 115.2% of all Lawrence residents.
| Immigration Origin | # Population | % Population |
| Africa | 600 | 0.7% |
| Argentina | 27 | 0.0% |
| Asia | 1,488 | 1.7% |
| Azores | 73 | 0.1% |
| Belarus | 15 | 0.0% |
| Belize | 51 | 0.1% |
| Bolivia | 83 | 0.1% |
| Brazil | 135 | 0.2% |
| Cabo Verde | 37 | 0.0% |
| Cambodia | 213 | 0.2% |
| Cameroon | 182 | 0.2% |
| Canada | 241 | 0.3% |
| Caribbean | 30,665 | 34.8% |
| Central America | 3,461 | 3.9% |
| Chile | 29 | 0.0% |
| China | 82 | 0.1% |
| Colombia | 121 | 0.1% |
| Costa Rica | 49 | 0.1% |
| Cuba | 34 | 0.0% |
| Dominica | 345 | 0.4% |
| Dominican Republic | 30,009 | 34.1% |
| Eastern Africa | 330 | 0.4% |
| Eastern Asia | 82 | 0.1% |
| Eastern Europe | 63 | 0.1% |
| Ecuador | 400 | 0.4% |
| El Salvador | 681 | 0.8% |
| England | 22 | 0.0% |
| Ethiopia | 14 | 0.0% |
| Europe | 393 | 0.4% |
| Ghana | 15 | 0.0% |
| Guatemala | 2,147 | 2.4% |
| Haiti | 112 | 0.1% |
| Honduras | 192 | 0.2% |
| Hong Kong | 10 | 0.0% |
| India | 181 | 0.2% |
| Iran | 9 | 0.0% |
| Ireland | 17 | 0.0% |
| Italy | 80 | 0.1% |
| Jamaica | 106 | 0.1% |
| Kenya | 293 | 0.3% |
| Latin America | 35,169 | 39.9% |
| Lebanon | 341 | 0.4% |
| Mexico | 335 | 0.4% |
| Middle Africa | 218 | 0.3% |
| Netherlands | 20 | 0.0% |
| Nicaragua | 6 | 0.0% |
| Northern Europe | 39 | 0.0% |
| Pakistan | 8 | 0.0% |
| Peru | 224 | 0.3% |
| Philippines | 18 | 0.0% |
| Poland | 48 | 0.1% |
| Portugal | 157 | 0.2% |
| South America | 1,043 | 1.2% |
| South Central Asia | 198 | 0.2% |
| South Eastern Asia | 867 | 1.0% |
| Southern Europe | 271 | 0.3% |
| Spain | 34 | 0.0% |
| Uganda | 23 | 0.0% |
| Uruguay | 10 | 0.0% |
| Venezuela | 14 | 0.0% |
| Vietnam | 636 | 0.7% |
| West Indies | 20 | 0.0% |
| Western Africa | 52 | 0.1% |
| Western Asia | 341 | 0.4% |
| Western Europe | 20 | 0.0% |
| Zaire | 13 | 0.0% | View All 66 Rows |
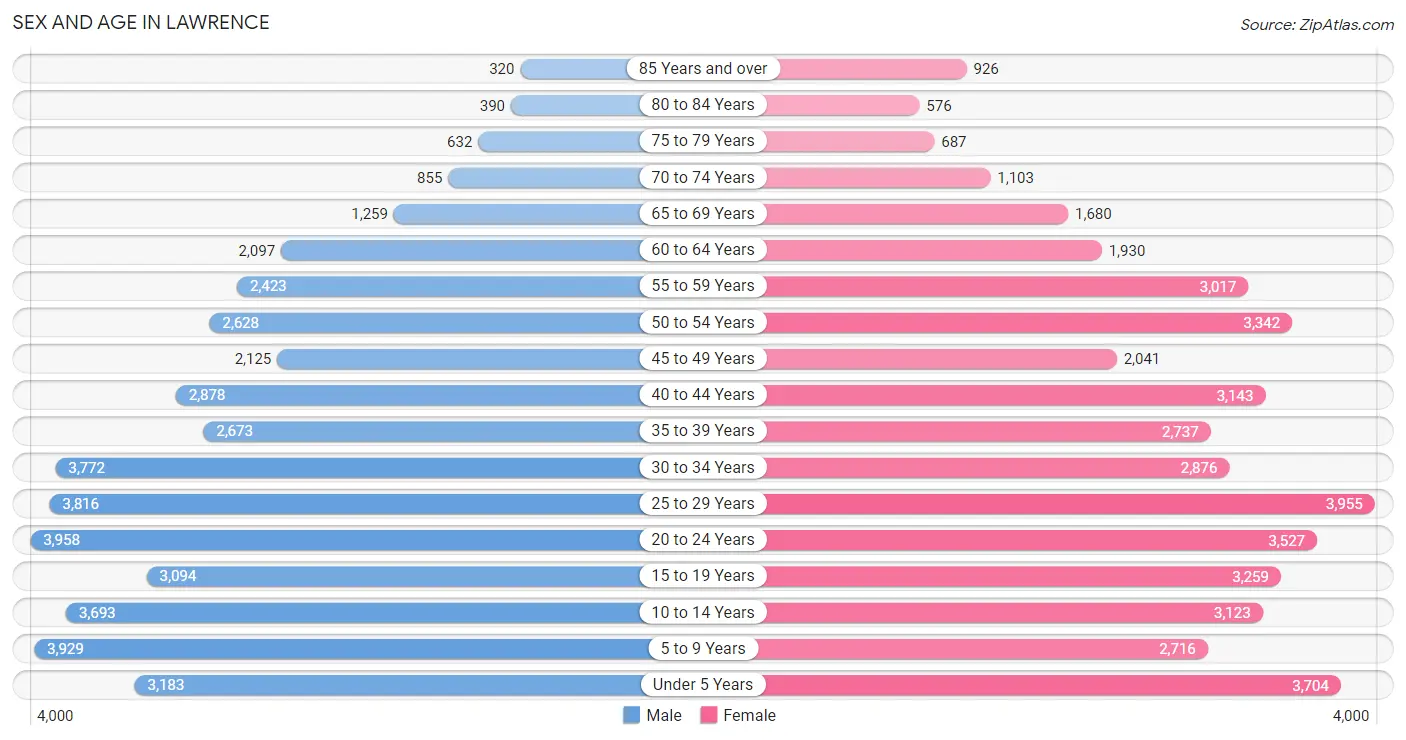
Sex and Age in Lawrence
Sex and Age in Lawrence
The most populous age groups in Lawrence are 20 to 24 Years (3,958 | 9.0%) for men and 25 to 29 Years (3,955 | 8.9%) for women.
| Age Bracket | Male | Female |
| Under 5 Years | 3,183 (7.3%) | 3,704 (8.4%) |
| 5 to 9 Years | 3,929 (9.0%) | 2,716 (6.1%) |
| 10 to 14 Years | 3,693 (8.5%) | 3,123 (7.0%) |
| 15 to 19 Years | 3,094 (7.1%) | 3,259 (7.3%) |
| 20 to 24 Years | 3,958 (9.0%) | 3,527 (8.0%) |
| 25 to 29 Years | 3,816 (8.7%) | 3,955 (8.9%) |
| 30 to 34 Years | 3,772 (8.6%) | 2,876 (6.5%) |
| 35 to 39 Years | 2,673 (6.1%) | 2,737 (6.2%) |
| 40 to 44 Years | 2,878 (6.6%) | 3,143 (7.1%) |
| 45 to 49 Years | 2,125 (4.9%) | 2,041 (4.6%) |
| 50 to 54 Years | 2,628 (6.0%) | 3,342 (7.5%) |
| 55 to 59 Years | 2,423 (5.5%) | 3,017 (6.8%) |
| 60 to 64 Years | 2,097 (4.8%) | 1,930 (4.3%) |
| 65 to 69 Years | 1,259 (2.9%) | 1,680 (3.8%) |
| 70 to 74 Years | 855 (2.0%) | 1,103 (2.5%) |
| 75 to 79 Years | 632 (1.5%) | 687 (1.5%) |
| 80 to 84 Years | 390 (0.9%) | 576 (1.3%) |
| 85 Years and over | 320 (0.7%) | 926 (2.1%) |
| Total | 43,725 (100.0%) | 44,342 (100.0%) |
Families and Households in Lawrence
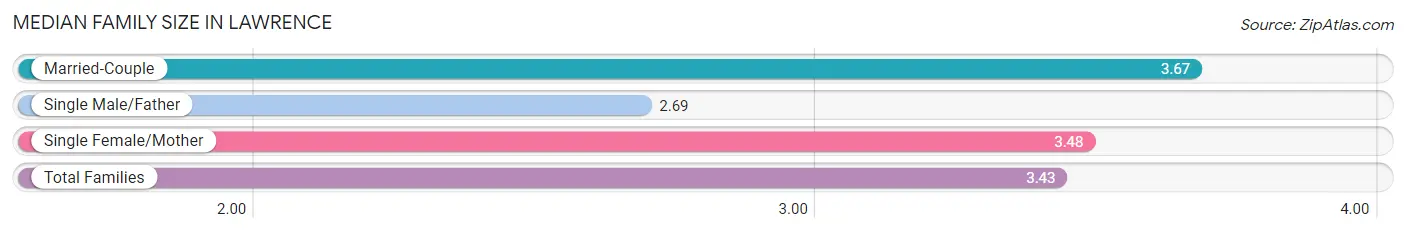
Median Family Size in Lawrence
The median family size in Lawrence is 3.43 persons per family, with married-couple families (9,098 | 43.6%) accounting for the largest median family size of 3.67 persons per family. On the other hand, single male/father families (3,490 | 16.8%) represent the smallest median family size with 2.69 persons per family.
| Family Type | # Families | Family Size |
| Married-Couple | 9,098 (43.6%) | 3.67 |
| Single Male/Father | 3,490 (16.8%) | 2.69 |
| Single Female/Mother | 8,253 (39.6%) | 3.48 |
| Total Families | 20,841 (100.0%) | 3.43 |
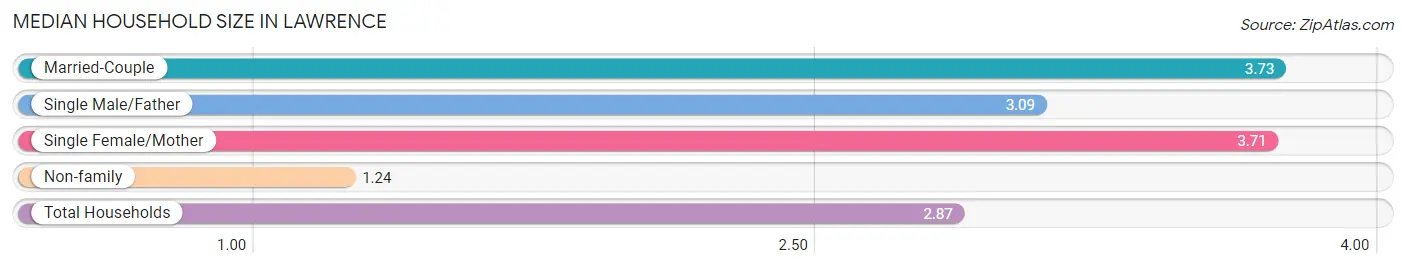
Median Household Size in Lawrence
The median household size in Lawrence is 2.87 persons per household, with married-couple households (9,098 | 30.0%) accounting for the largest median household size of 3.73 persons per household. non-family households (9,489 | 31.3%) represent the smallest median household size with 1.24 persons per household.
| Household Type | # Households | Household Size |
| Married-Couple | 9,098 (30.0%) | 3.73 |
| Single Male/Father | 3,490 (11.5%) | 3.09 |
| Single Female/Mother | 8,253 (27.2%) | 3.71 |
| Non-family | 9,489 (31.3%) | 1.24 |
| Total Households | 30,330 (100.0%) | 2.87 |
Household Size by Marriage Status in Lawrence
Out of a total of 30,330 households in Lawrence, 20,841 (68.7%) are family households, while 9,489 (31.3%) are nonfamily households. The most numerous type of family households are 2-person households, comprising 5,669, and the most common type of nonfamily households are 1-person households, comprising 7,729.
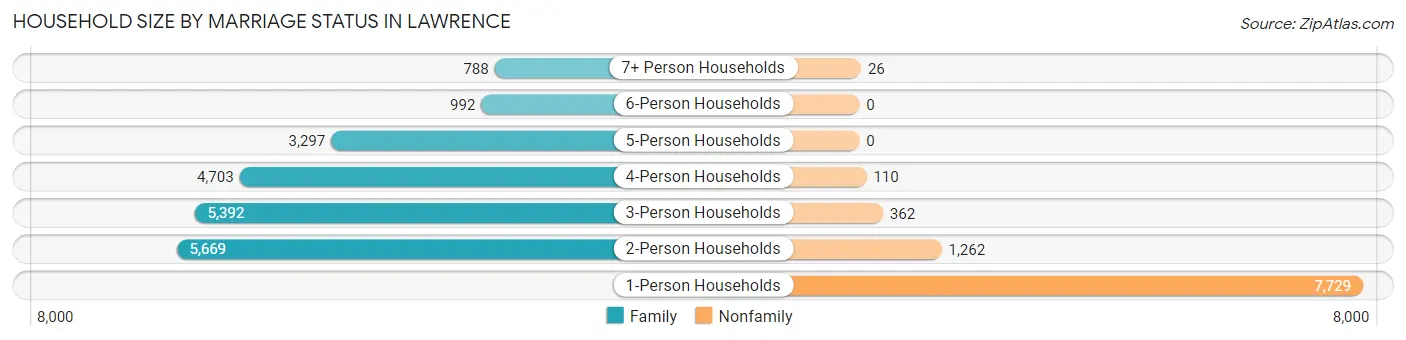
| Household Size | Family Households | Nonfamily Households |
| 1-Person Households | - | 7,729 (25.5%) |
| 2-Person Households | 5,669 (18.7%) | 1,262 (4.2%) |
| 3-Person Households | 5,392 (17.8%) | 362 (1.2%) |
| 4-Person Households | 4,703 (15.5%) | 110 (0.4%) |
| 5-Person Households | 3,297 (10.9%) | 0 (0.0%) |
| 6-Person Households | 992 (3.3%) | 0 (0.0%) |
| 7+ Person Households | 788 (2.6%) | 26 (0.1%) |
| Total | 20,841 (68.7%) | 9,489 (31.3%) |
Female Fertility in Lawrence
Fertility by Age in Lawrence
Average fertility rate in Lawrence is 59.0 births per 1,000 women. Women in the age bracket of 20 to 34 years have the highest fertility rate with 106.0 births per 1,000 women. Women in the age bracket of 20 to 34 years acount for 83.4% of all women with births.
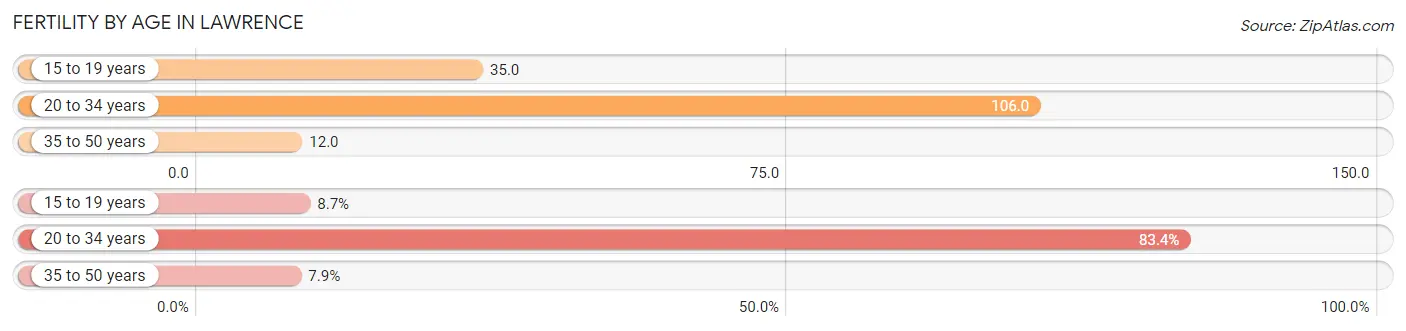
| Age Bracket | Women with Births | Births / 1,000 Women |
| 15 to 19 years | 114 (8.7%) | 35.0 |
| 20 to 34 years | 1,095 (83.4%) | 106.0 |
| 35 to 50 years | 104 (7.9%) | 12.0 |
| Total | 1,313 (100.0%) | 59.0 |
Fertility by Age by Marriage Status in Lawrence
48.7% of women with births (1,313) in Lawrence are married. The highest percentage of unmarried women with births falls into 15 to 19 years age bracket with 100.0% of them unmarried at the time of birth, while the lowest percentage of unmarried women with births belong to 35 to 50 years age bracket with 26.9% of them unmarried.
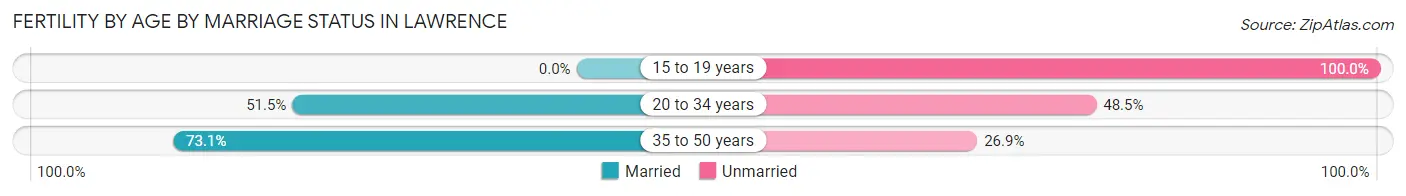
| Age Bracket | Married | Unmarried |
| 15 to 19 years | 0 (0.0%) | 114 (100.0%) |
| 20 to 34 years | 564 (51.5%) | 531 (48.5%) |
| 35 to 50 years | 76 (73.1%) | 28 (26.9%) |
| Total | 639 (48.7%) | 674 (51.3%) |
Fertility by Education in Lawrence
Average fertility rate in Lawrence is 59.0 births per 1,000 women. Women with the education attainment of bachelor's degree have the highest fertility rate of 96.0 births per 1,000 women, while women with the education attainment of graduate degree have the lowest fertility at 34.0 births per 1,000 women. Women with the education attainment of college or associate's degree represent 33.1% of all women with births.
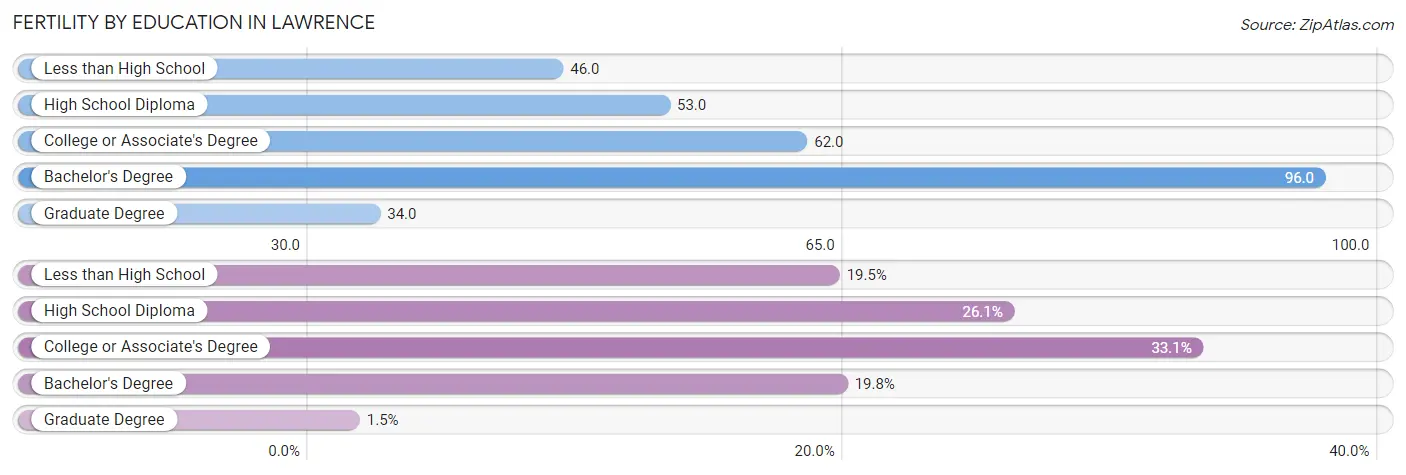
| Educational Attainment | Women with Births | Births / 1,000 Women |
| Less than High School | 256 (19.5%) | 46.0 |
| High School Diploma | 342 (26.1%) | 53.0 |
| College or Associate's Degree | 435 (33.1%) | 62.0 |
| Bachelor's Degree | 260 (19.8%) | 96.0 |
| Graduate Degree | 20 (1.5%) | 34.0 |
| Total | 1,313 (100.0%) | 59.0 |
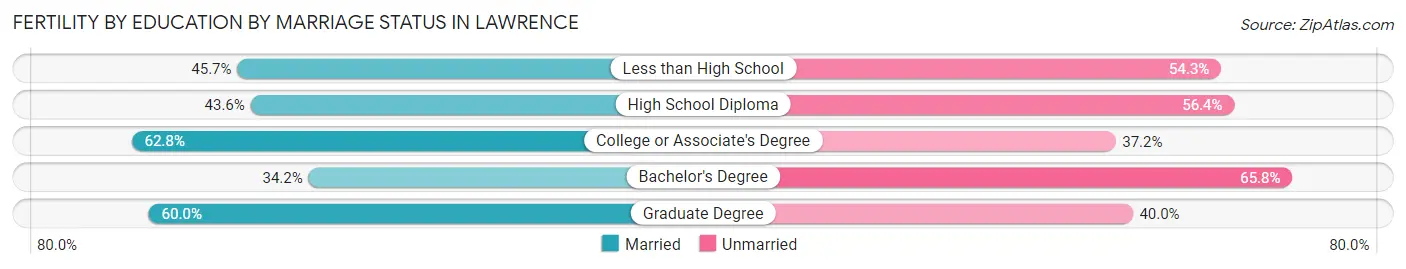
Fertility by Education by Marriage Status in Lawrence
51.3% of women with births in Lawrence are unmarried. Women with the educational attainment of college or associate's degree are most likely to be married with 62.8% of them married at childbirth, while women with the educational attainment of bachelor's degree are least likely to be married with 65.8% of them unmarried at childbirth.
| Educational Attainment | Married | Unmarried |
| Less than High School | 117 (45.7%) | 139 (54.3%) |
| High School Diploma | 149 (43.6%) | 193 (56.4%) |
| College or Associate's Degree | 273 (62.8%) | 162 (37.2%) |
| Bachelor's Degree | 89 (34.2%) | 171 (65.8%) |
| Graduate Degree | 12 (60.0%) | 8 (40.0%) |
| Total | 639 (48.7%) | 674 (51.3%) |
Employment Characteristics in Lawrence
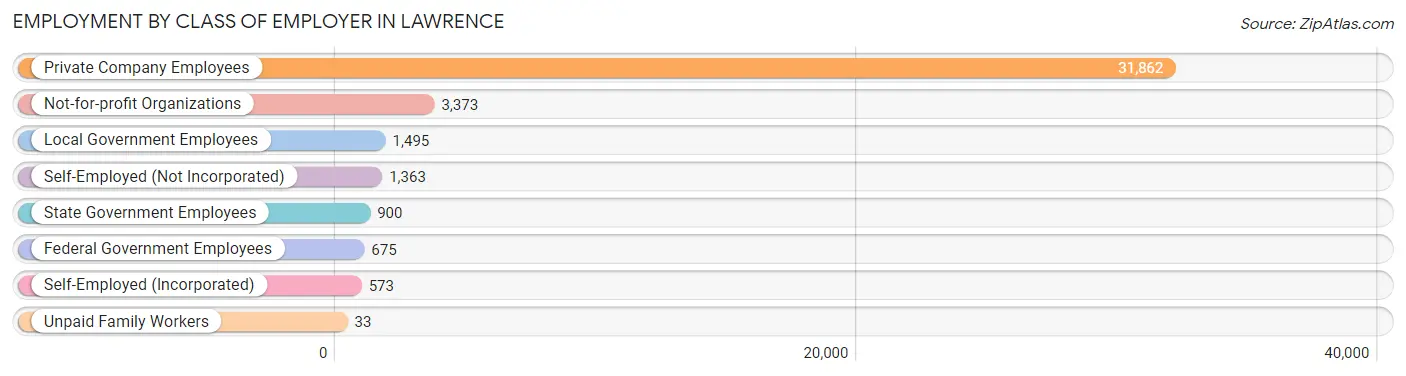
Employment by Class of Employer in Lawrence
Among the 40,274 employed individuals in Lawrence, private company employees (31,862 | 79.1%), not-for-profit organizations (3,373 | 8.4%), and local government employees (1,495 | 3.7%) make up the most common classes of employment.
| Employer Class | # Employees | % Employees |
| Private Company Employees | 31,862 | 79.1% |
| Self-Employed (Incorporated) | 573 | 1.4% |
| Self-Employed (Not Incorporated) | 1,363 | 3.4% |
| Not-for-profit Organizations | 3,373 | 8.4% |
| Local Government Employees | 1,495 | 3.7% |
| State Government Employees | 900 | 2.2% |
| Federal Government Employees | 675 | 1.7% |
| Unpaid Family Workers | 33 | 0.1% |
| Total | 40,274 | 100.0% |
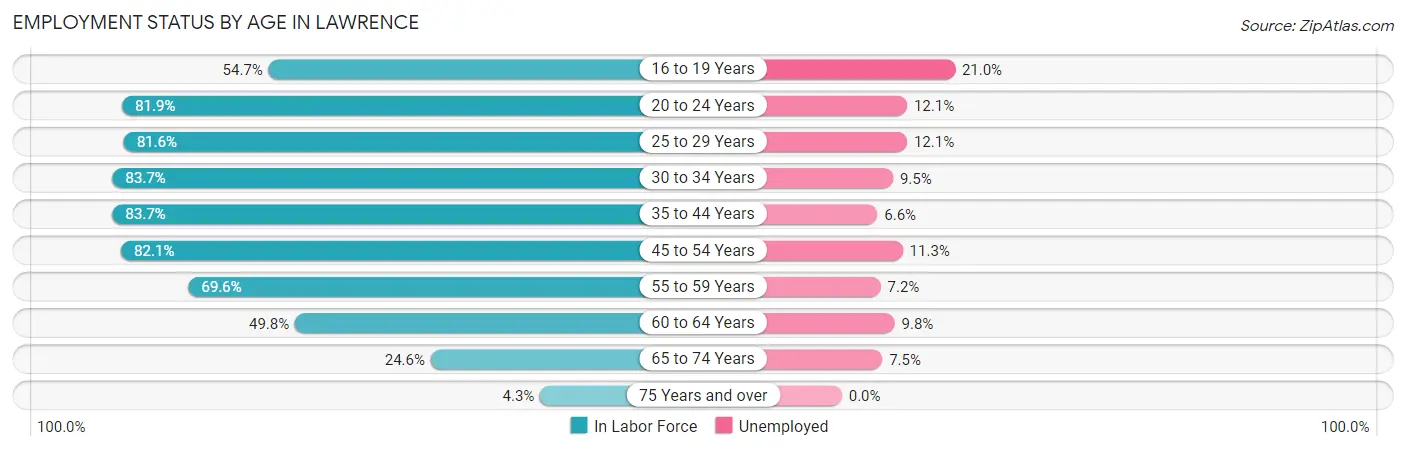
Employment Status by Age in Lawrence
According to the labor force statistics for Lawrence, out of the total population over 16 years of age (66,621), 69.0% or 45,968 individuals are in the labor force, with 10.4% or 4,781 of them unemployed. The age group with the highest labor force participation rate is 30 to 34 years, with 83.7% or 5,564 individuals in the labor force. Within the labor force, the 16 to 19 years age range has the highest percentage of unemployed individuals, with 21.0% or 604 of them being unemployed.
| Age Bracket | In Labor Force | Unemployed |
| 16 to 19 Years | 2,874 (54.7%) | 604 (21.0%) |
| 20 to 24 Years | 6,130 (81.9%) | 742 (12.1%) |
| 25 to 29 Years | 6,341 (81.6%) | 767 (12.1%) |
| 30 to 34 Years | 5,564 (83.7%) | 529 (9.5%) |
| 35 to 44 Years | 9,568 (83.7%) | 631 (6.6%) |
| 45 to 54 Years | 8,322 (82.1%) | 940 (11.3%) |
| 55 to 59 Years | 3,786 (69.6%) | 273 (7.2%) |
| 60 to 64 Years | 2,005 (49.8%) | 196 (9.8%) |
| 65 to 74 Years | 1,205 (24.6%) | 90 (7.5%) |
| 75 Years and over | 152 (4.3%) | 0 (0.0%) |
| Total | 45,968 (69.0%) | 4,781 (10.4%) |
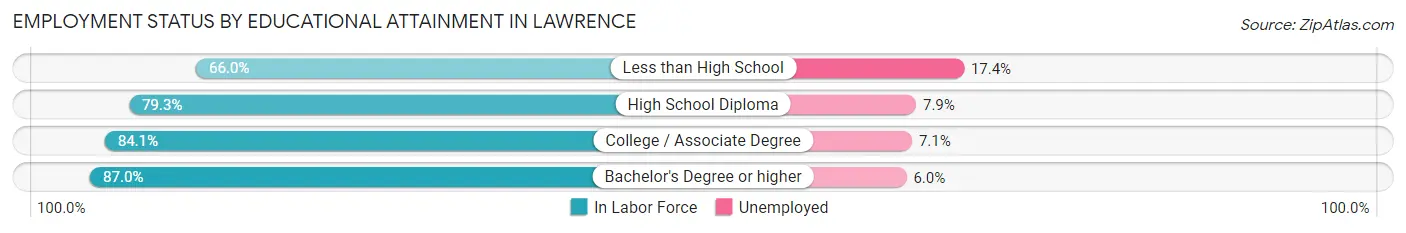
Employment Status by Educational Attainment in Lawrence
According to labor force statistics for Lawrence, 78.3% of individuals (35,590) out of the total population between 25 and 64 years of age (45,453) are in the labor force, with 9.4% or 3,345 of them being unemployed. The group with the highest labor force participation rate are those with the educational attainment of bachelor's degree or higher, with 87.0% or 6,134 individuals in the labor force. Within the labor force, individuals with less than high school education have the highest percentage of unemployment, with 17.4% or 1,322 of them being unemployed.
| Educational Attainment | In Labor Force | Unemployed |
| Less than High School | 7,599 (66.0%) | 2,003 (17.4%) |
| High School Diploma | 12,442 (79.3%) | 1,240 (7.9%) |
| College / Associate Degree | 9,419 (84.1%) | 795 (7.1%) |
| Bachelor's Degree or higher | 6,134 (87.0%) | 423 (6.0%) |
| Total | 35,590 (78.3%) | 4,273 (9.4%) |
Employment Occupations by Sex in Lawrence
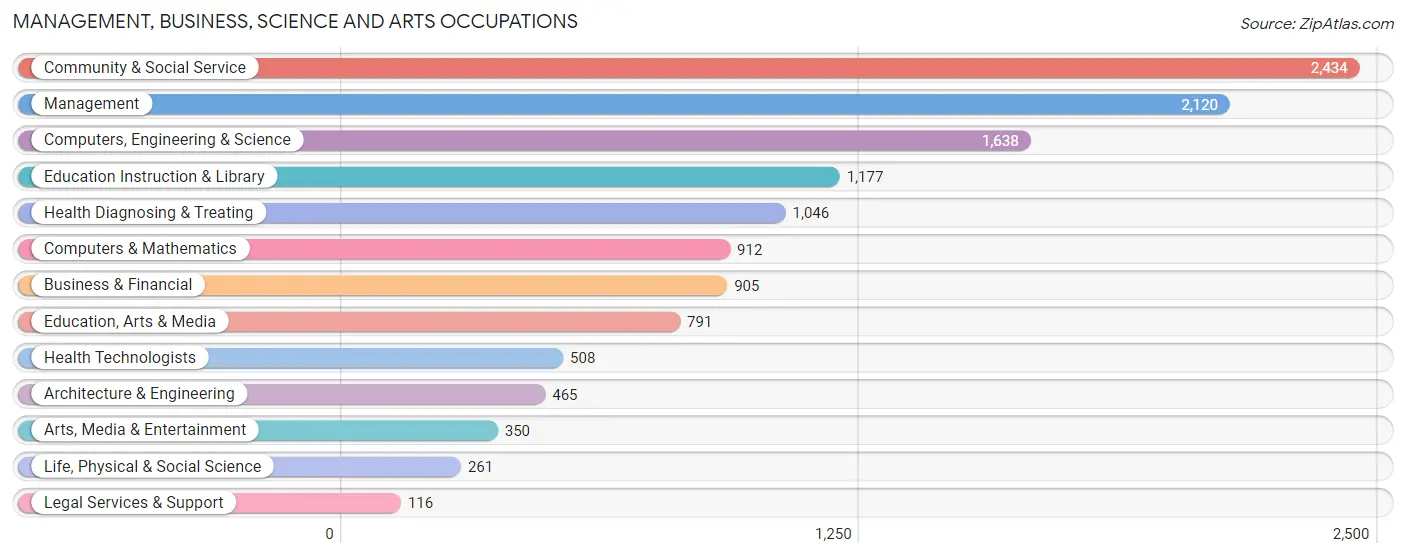
Management, Business, Science and Arts Occupations
The most common Management, Business, Science and Arts occupations in Lawrence are Community & Social Service (2,434 | 5.9%), Management (2,120 | 5.1%), Computers, Engineering & Science (1,638 | 4.0%), Education Instruction & Library (1,177 | 2.9%), and Health Diagnosing & Treating (1,046 | 2.5%).
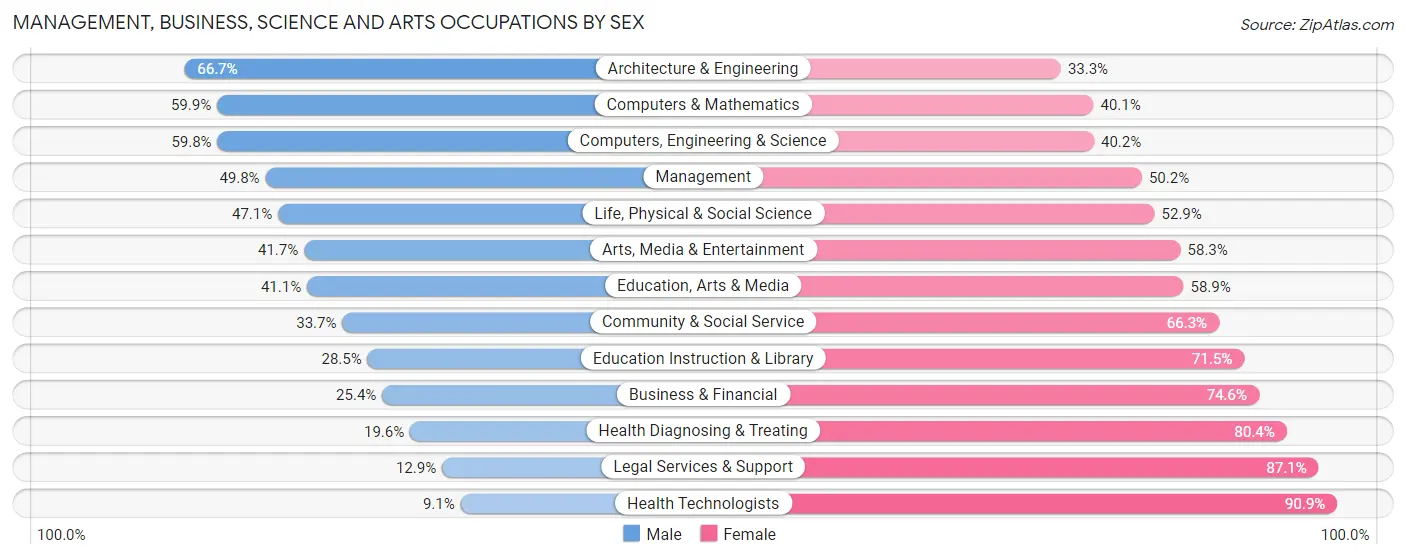
Management, Business, Science and Arts Occupations by Sex
Within the Management, Business, Science and Arts occupations in Lawrence, the most male-oriented occupations are Architecture & Engineering (66.7%), Computers & Mathematics (59.9%), and Computers, Engineering & Science (59.8%), while the most female-oriented occupations are Health Technologists (90.9%), Legal Services & Support (87.1%), and Health Diagnosing & Treating (80.4%).
| Occupation | Male | Female |
| Management | 1,055 (49.8%) | 1,065 (50.2%) |
| Business & Financial | 230 (25.4%) | 675 (74.6%) |
| Computers, Engineering & Science | 979 (59.8%) | 659 (40.2%) |
| Computers & Mathematics | 546 (59.9%) | 366 (40.1%) |
| Architecture & Engineering | 310 (66.7%) | 155 (33.3%) |
| Life, Physical & Social Science | 123 (47.1%) | 138 (52.9%) |
| Community & Social Service | 821 (33.7%) | 1,613 (66.3%) |
| Education, Arts & Media | 325 (41.1%) | 466 (58.9%) |
| Legal Services & Support | 15 (12.9%) | 101 (87.1%) |
| Education Instruction & Library | 335 (28.5%) | 842 (71.5%) |
| Arts, Media & Entertainment | 146 (41.7%) | 204 (58.3%) |
| Health Diagnosing & Treating | 205 (19.6%) | 841 (80.4%) |
| Health Technologists | 46 (9.1%) | 462 (90.9%) |
| Total (Category) | 3,290 (40.4%) | 4,853 (59.6%) |
| Total (Overall) | 20,617 (50.1%) | 20,530 (49.9%) |
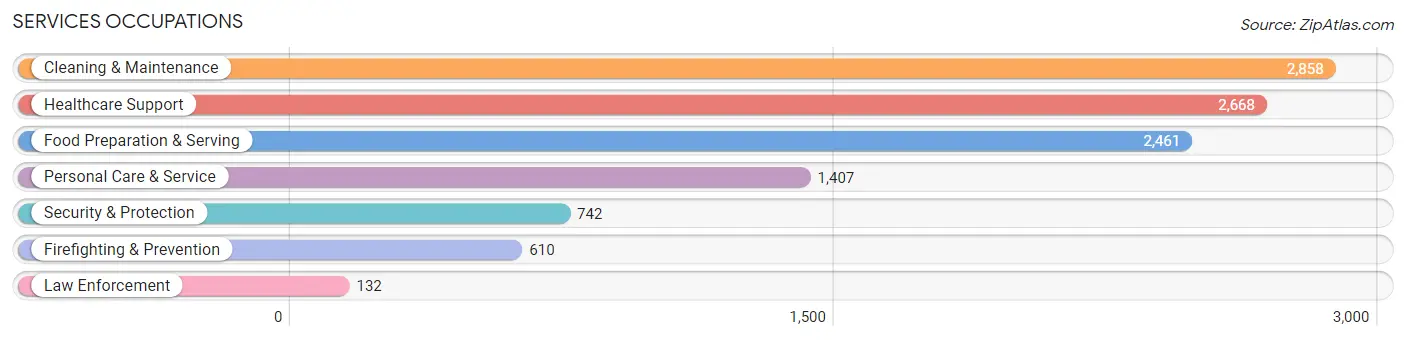
Services Occupations
The most common Services occupations in Lawrence are Cleaning & Maintenance (2,858 | 7.0%), Healthcare Support (2,668 | 6.5%), Food Preparation & Serving (2,461 | 6.0%), Personal Care & Service (1,407 | 3.4%), and Security & Protection (742 | 1.8%).
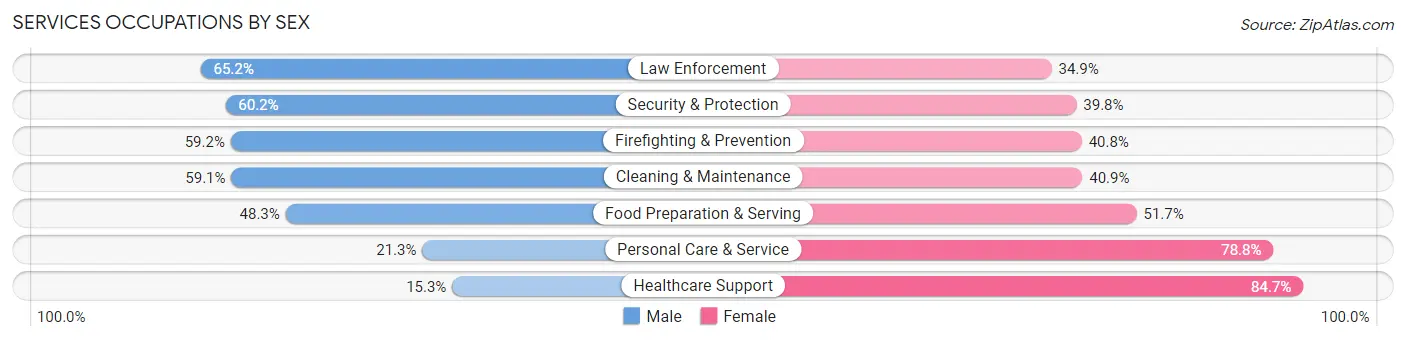
Services Occupations by Sex
Within the Services occupations in Lawrence, the most male-oriented occupations are Law Enforcement (65.1%), Security & Protection (60.2%), and Firefighting & Prevention (59.2%), while the most female-oriented occupations are Healthcare Support (84.7%), Personal Care & Service (78.7%), and Food Preparation & Serving (51.7%).
| Occupation | Male | Female |
| Healthcare Support | 409 (15.3%) | 2,259 (84.7%) |
| Security & Protection | 447 (60.2%) | 295 (39.8%) |
| Firefighting & Prevention | 361 (59.2%) | 249 (40.8%) |
| Law Enforcement | 86 (65.1%) | 46 (34.8%) |
| Food Preparation & Serving | 1,189 (48.3%) | 1,272 (51.7%) |
| Cleaning & Maintenance | 1,688 (59.1%) | 1,170 (40.9%) |
| Personal Care & Service | 299 (21.2%) | 1,108 (78.7%) |
| Total (Category) | 4,032 (39.8%) | 6,104 (60.2%) |
| Total (Overall) | 20,617 (50.1%) | 20,530 (49.9%) |
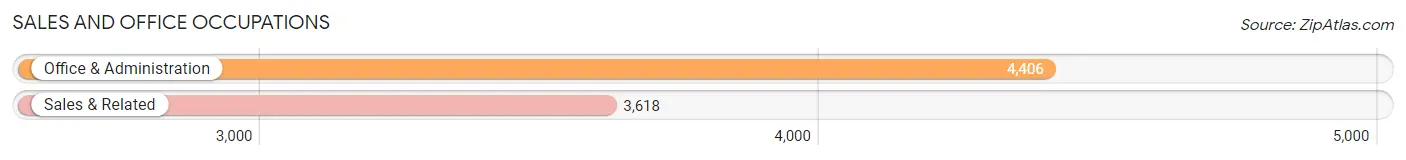
Sales and Office Occupations
The most common Sales and Office occupations in Lawrence are Office & Administration (4,406 | 10.7%), and Sales & Related (3,618 | 8.8%).
Sales and Office Occupations by Sex
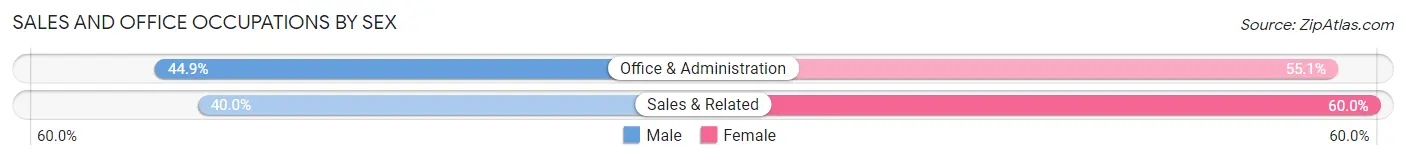
| Occupation | Male | Female |
| Sales & Related | 1,448 (40.0%) | 2,170 (60.0%) |
| Office & Administration | 1,980 (44.9%) | 2,426 (55.1%) |
| Total (Category) | 3,428 (42.7%) | 4,596 (57.3%) |
| Total (Overall) | 20,617 (50.1%) | 20,530 (49.9%) |
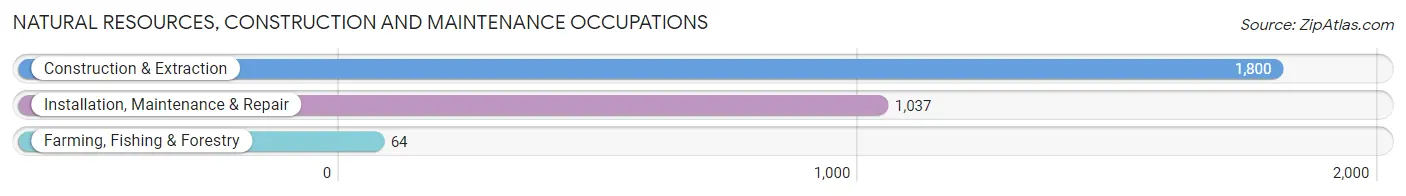
Natural Resources, Construction and Maintenance Occupations
The most common Natural Resources, Construction and Maintenance occupations in Lawrence are Construction & Extraction (1,800 | 4.4%), Installation, Maintenance & Repair (1,037 | 2.5%), and Farming, Fishing & Forestry (64 | 0.2%).
Natural Resources, Construction and Maintenance Occupations by Sex
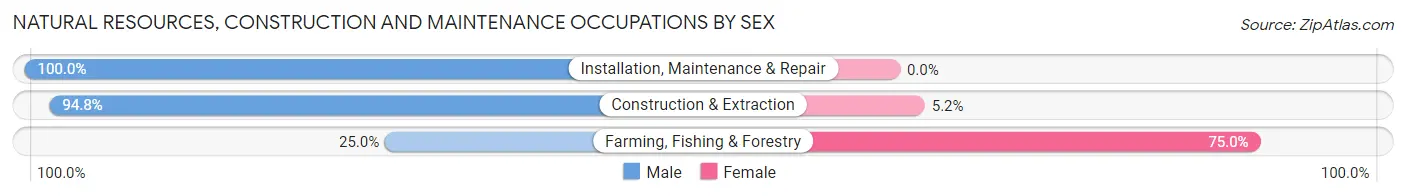
| Occupation | Male | Female |
| Farming, Fishing & Forestry | 16 (25.0%) | 48 (75.0%) |
| Construction & Extraction | 1,707 (94.8%) | 93 (5.2%) |
| Installation, Maintenance & Repair | 1,037 (100.0%) | 0 (0.0%) |
| Total (Category) | 2,760 (95.1%) | 141 (4.9%) |
| Total (Overall) | 20,617 (50.1%) | 20,530 (49.9%) |
Production, Transportation and Moving Occupations
The most common Production, Transportation and Moving occupations in Lawrence are Production (5,581 | 13.6%), Material Moving (3,377 | 8.2%), and Transportation (2,985 | 7.2%).
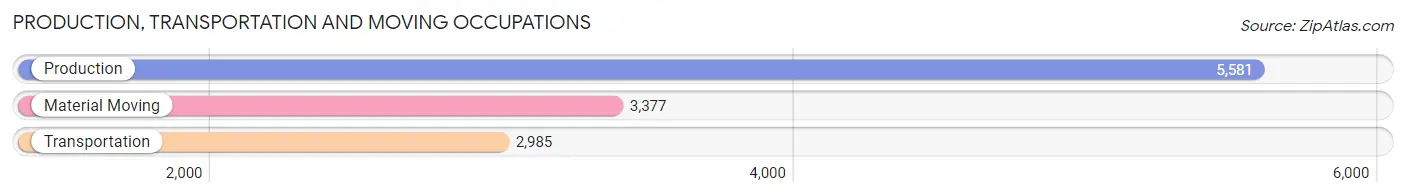
Production, Transportation and Moving Occupations by Sex
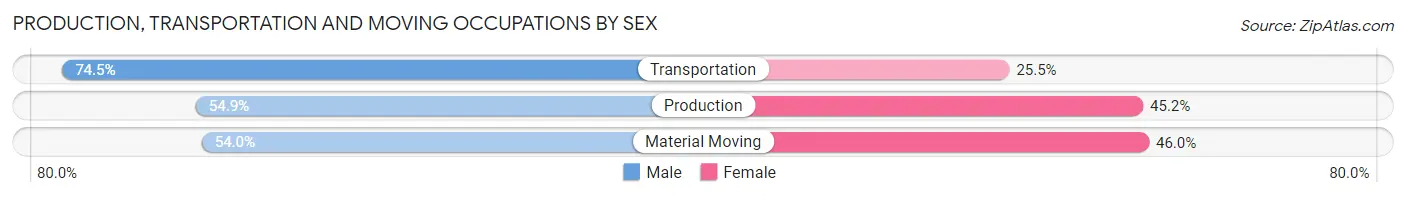
| Occupation | Male | Female |
| Production | 3,061 (54.8%) | 2,520 (45.2%) |
| Transportation | 2,223 (74.5%) | 762 (25.5%) |
| Material Moving | 1,823 (54.0%) | 1,554 (46.0%) |
| Total (Category) | 7,107 (59.5%) | 4,836 (40.5%) |
| Total (Overall) | 20,617 (50.1%) | 20,530 (49.9%) |
Employment Industries by Sex in Lawrence
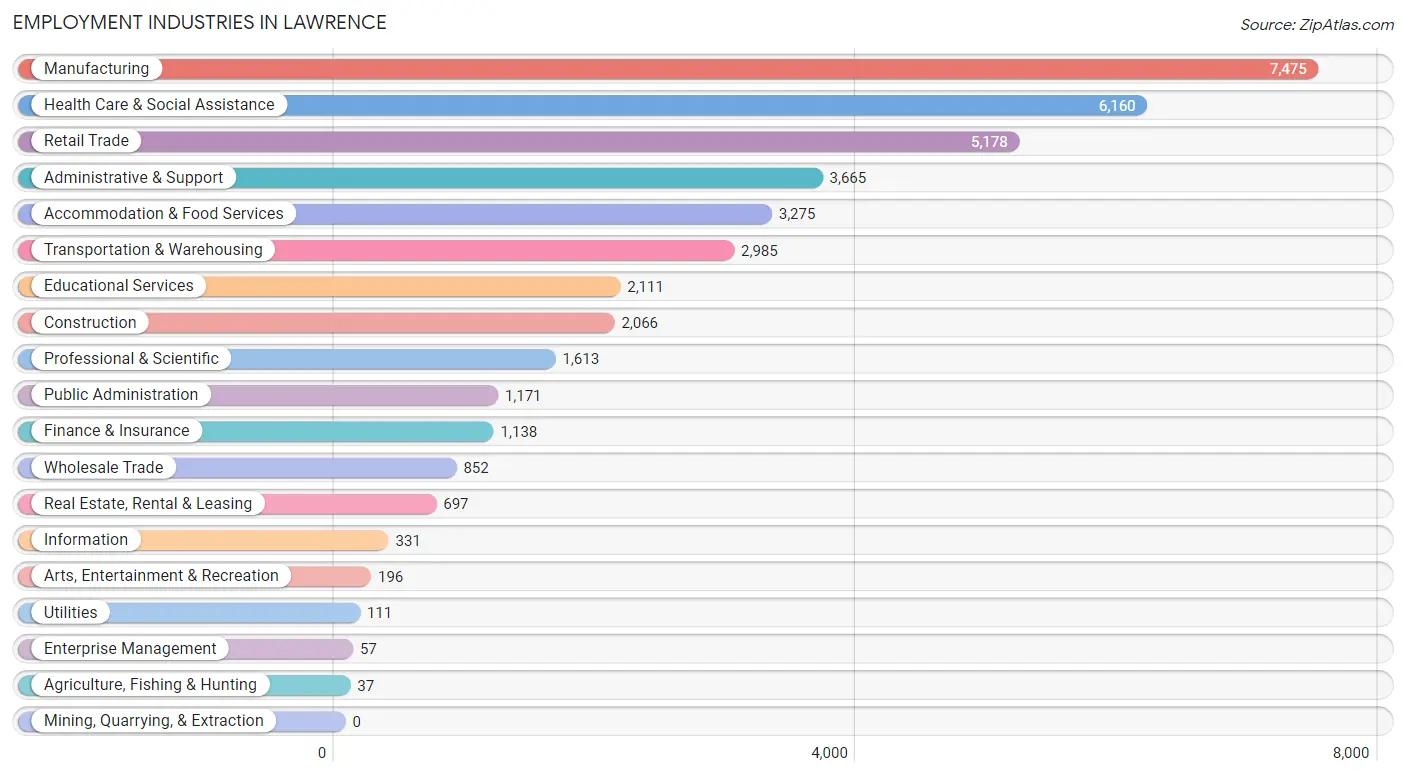
Employment Industries in Lawrence
The major employment industries in Lawrence include Manufacturing (7,475 | 18.2%), Health Care & Social Assistance (6,160 | 15.0%), Retail Trade (5,178 | 12.6%), Administrative & Support (3,665 | 8.9%), and Accommodation & Food Services (3,275 | 8.0%).
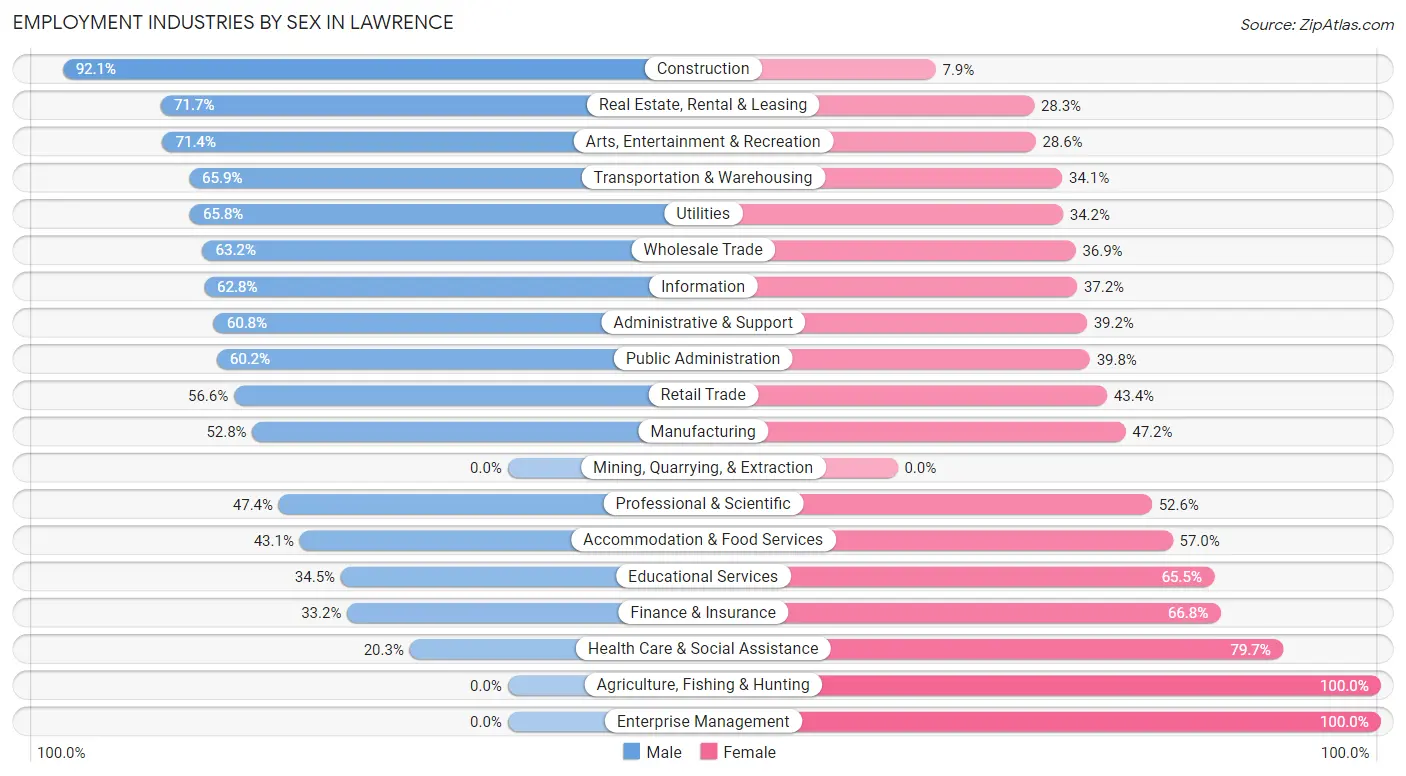
Employment Industries by Sex in Lawrence
The Lawrence industries that see more men than women are Construction (92.1%), Real Estate, Rental & Leasing (71.7%), and Arts, Entertainment & Recreation (71.4%), whereas the industries that tend to have a higher number of women are Agriculture, Fishing & Hunting (100.0%), Enterprise Management (100.0%), and Health Care & Social Assistance (79.7%).
| Industry | Male | Female |
| Agriculture, Fishing & Hunting | 0 (0.0%) | 37 (100.0%) |
| Mining, Quarrying, & Extraction | 0 (0.0%) | 0 (0.0%) |
| Construction | 1,903 (92.1%) | 163 (7.9%) |
| Manufacturing | 3,950 (52.8%) | 3,525 (47.2%) |
| Wholesale Trade | 538 (63.1%) | 314 (36.8%) |
| Retail Trade | 2,933 (56.6%) | 2,245 (43.4%) |
| Transportation & Warehousing | 1,968 (65.9%) | 1,017 (34.1%) |
| Utilities | 73 (65.8%) | 38 (34.2%) |
| Information | 208 (62.8%) | 123 (37.2%) |
| Finance & Insurance | 378 (33.2%) | 760 (66.8%) |
| Real Estate, Rental & Leasing | 500 (71.7%) | 197 (28.3%) |
| Professional & Scientific | 764 (47.4%) | 849 (52.6%) |
| Enterprise Management | 0 (0.0%) | 57 (100.0%) |
| Administrative & Support | 2,229 (60.8%) | 1,436 (39.2%) |
| Educational Services | 729 (34.5%) | 1,382 (65.5%) |
| Health Care & Social Assistance | 1,249 (20.3%) | 4,911 (79.7%) |
| Arts, Entertainment & Recreation | 140 (71.4%) | 56 (28.6%) |
| Accommodation & Food Services | 1,410 (43.0%) | 1,865 (57.0%) |
| Public Administration | 705 (60.2%) | 466 (39.8%) |
| Total | 20,617 (50.1%) | 20,530 (49.9%) |
Education in Lawrence
School Enrollment in Lawrence
The most common levels of schooling among the 23,957 students in Lawrence are middle school (5,507 | 23.0%), high school (5,176 | 21.6%), and elementary school (5,013 | 20.9%).
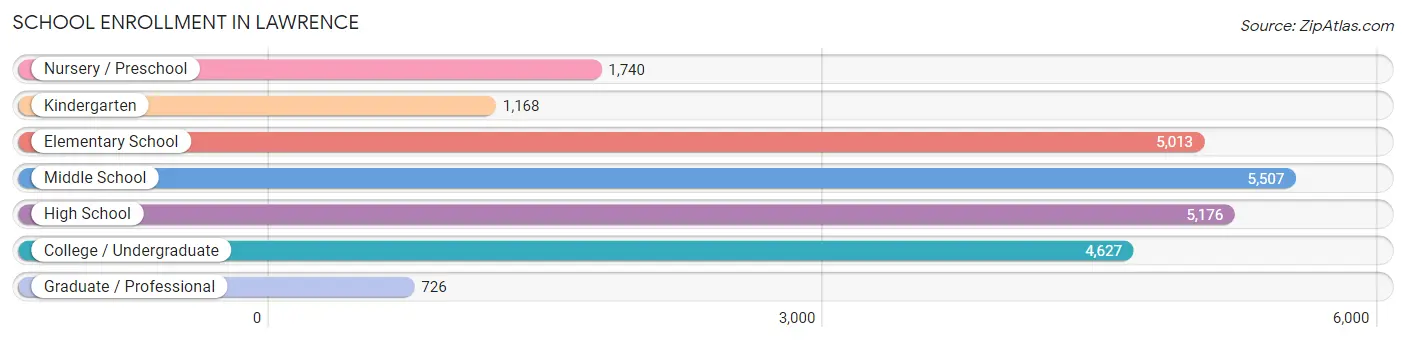
| School Level | # Students | % Students |
| Nursery / Preschool | 1,740 | 7.3% |
| Kindergarten | 1,168 | 4.9% |
| Elementary School | 5,013 | 20.9% |
| Middle School | 5,507 | 23.0% |
| High School | 5,176 | 21.6% |
| College / Undergraduate | 4,627 | 19.3% |
| Graduate / Professional | 726 | 3.0% |
| Total | 23,957 | 100.0% |
School Enrollment by Age by Funding Source in Lawrence
Out of a total of 23,957 students who are enrolled in schools in Lawrence, 2,731 (11.4%) attend a private institution, while the remaining 21,226 (88.6%) are enrolled in public schools. The age group of 35 years and over has the highest likelihood of being enrolled in private schools, with 377 (30.4% in the age bracket) enrolled. Conversely, the age group of 5 to 9 year old has the lowest likelihood of being enrolled in a private school, with 6,029 (95.6% in the age bracket) attending a public institution.
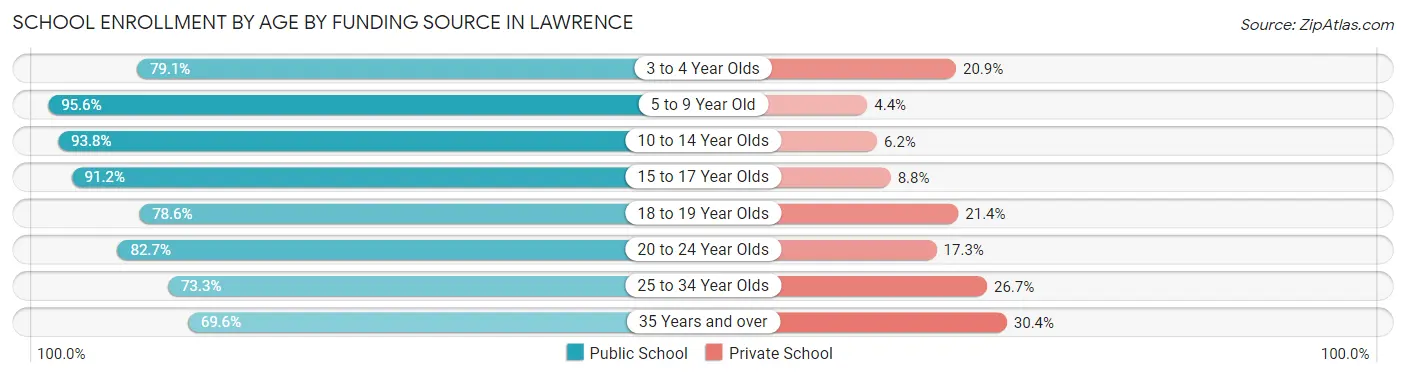
| Age Bracket | Public School | Private School |
| 3 to 4 Year Olds | 846 (79.1%) | 224 (20.9%) |
| 5 to 9 Year Old | 6,029 (95.6%) | 278 (4.4%) |
| 10 to 14 Year Olds | 6,259 (93.8%) | 416 (6.2%) |
| 15 to 17 Year Olds | 3,094 (91.2%) | 297 (8.8%) |
| 18 to 19 Year Olds | 1,200 (78.6%) | 326 (21.4%) |
| 20 to 24 Year Olds | 1,718 (82.7%) | 360 (17.3%) |
| 25 to 34 Year Olds | 1,224 (73.3%) | 446 (26.7%) |
| 35 Years and over | 863 (69.6%) | 377 (30.4%) |
| Total | 21,226 (88.6%) | 2,731 (11.4%) |
Educational Attainment by Field of Study in Lawrence
Business (1,814 | 21.1%), education (966 | 11.3%), arts & humanities (835 | 9.7%), psychology (655 | 7.6%), and social sciences (608 | 7.1%) are the most common fields of study among 8,579 individuals in Lawrence who have obtained a bachelor's degree or higher.
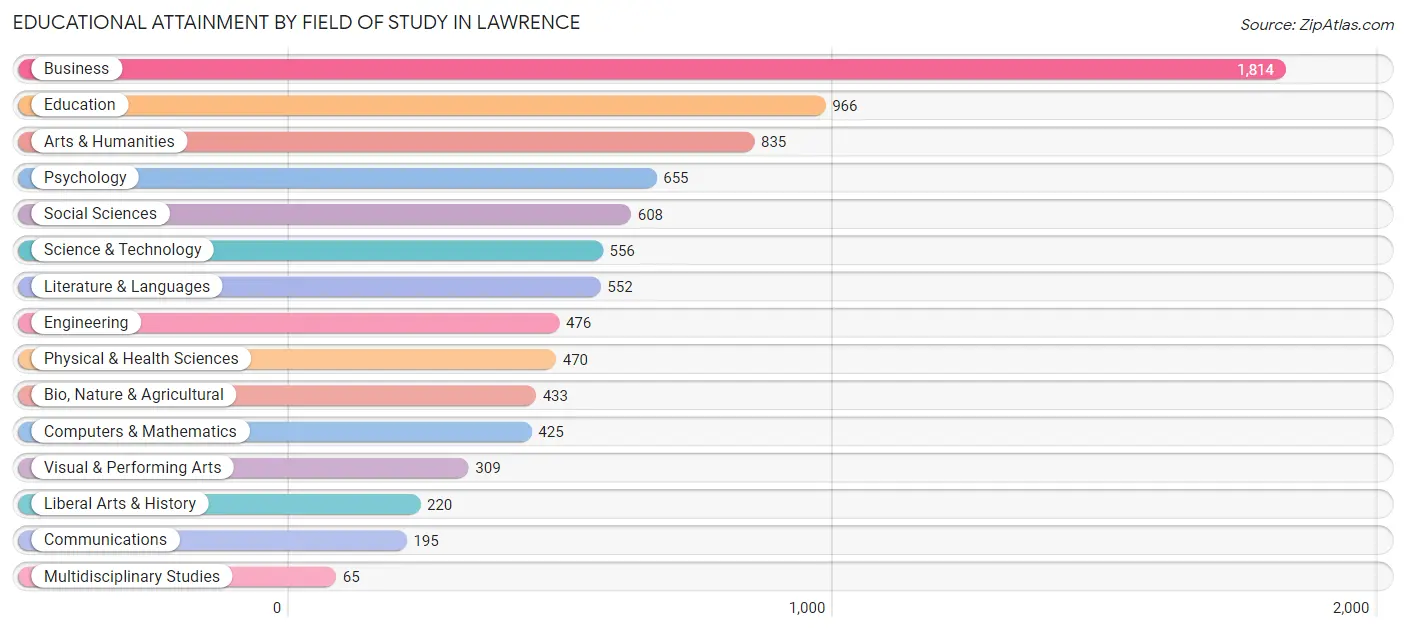
| Field of Study | # Graduates | % Graduates |
| Computers & Mathematics | 425 | 5.0% |
| Bio, Nature & Agricultural | 433 | 5.1% |
| Physical & Health Sciences | 470 | 5.5% |
| Psychology | 655 | 7.6% |
| Social Sciences | 608 | 7.1% |
| Engineering | 476 | 5.6% |
| Multidisciplinary Studies | 65 | 0.8% |
| Science & Technology | 556 | 6.5% |
| Business | 1,814 | 21.1% |
| Education | 966 | 11.3% |
| Literature & Languages | 552 | 6.4% |
| Liberal Arts & History | 220 | 2.6% |
| Visual & Performing Arts | 309 | 3.6% |
| Communications | 195 | 2.3% |
| Arts & Humanities | 835 | 9.7% |
| Total | 8,579 | 100.0% |
Transportation & Commute in Lawrence
Vehicle Availability by Sex in Lawrence
The most prevalent vehicle ownership categories in Lawrence are males with 2 vehicles (7,157, accounting for 35.5%) and females with 2 vehicles (6,105, making up 35.7%).
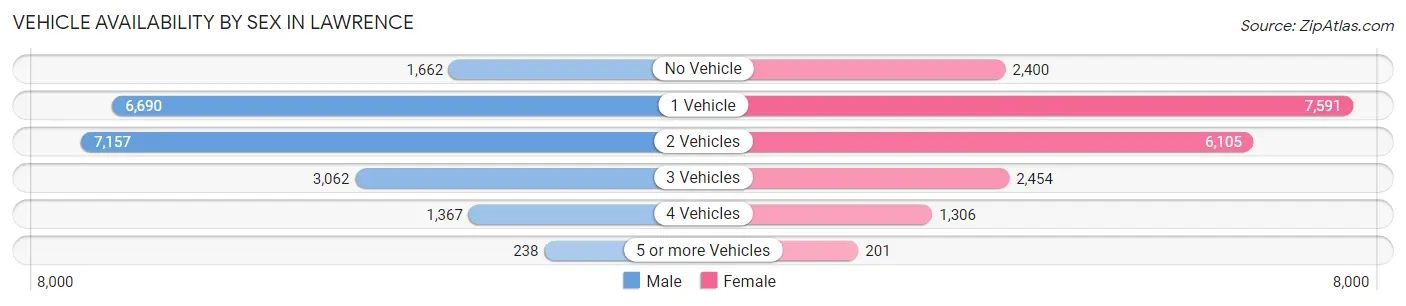
| Vehicles Available | Male | Female |
| No Vehicle | 1,662 (8.2%) | 2,400 (12.0%) |
| 1 Vehicle | 6,690 (33.2%) | 7,591 (37.9%) |
| 2 Vehicles | 7,157 (35.5%) | 6,105 (30.4%) |
| 3 Vehicles | 3,062 (15.2%) | 2,454 (12.2%) |
| 4 Vehicles | 1,367 (6.8%) | 1,306 (6.5%) |
| 5 or more Vehicles | 238 (1.2%) | 201 (1.0%) |
| Total | 20,176 (100.0%) | 20,057 (100.0%) |
Commute Time in Lawrence
The most frequently occuring commute durations in Lawrence are 10 to 14 minutes (8,144 commuters, 21.1%), 15 to 19 minutes (7,050 commuters, 18.3%), and 20 to 24 minutes (5,563 commuters, 14.4%).
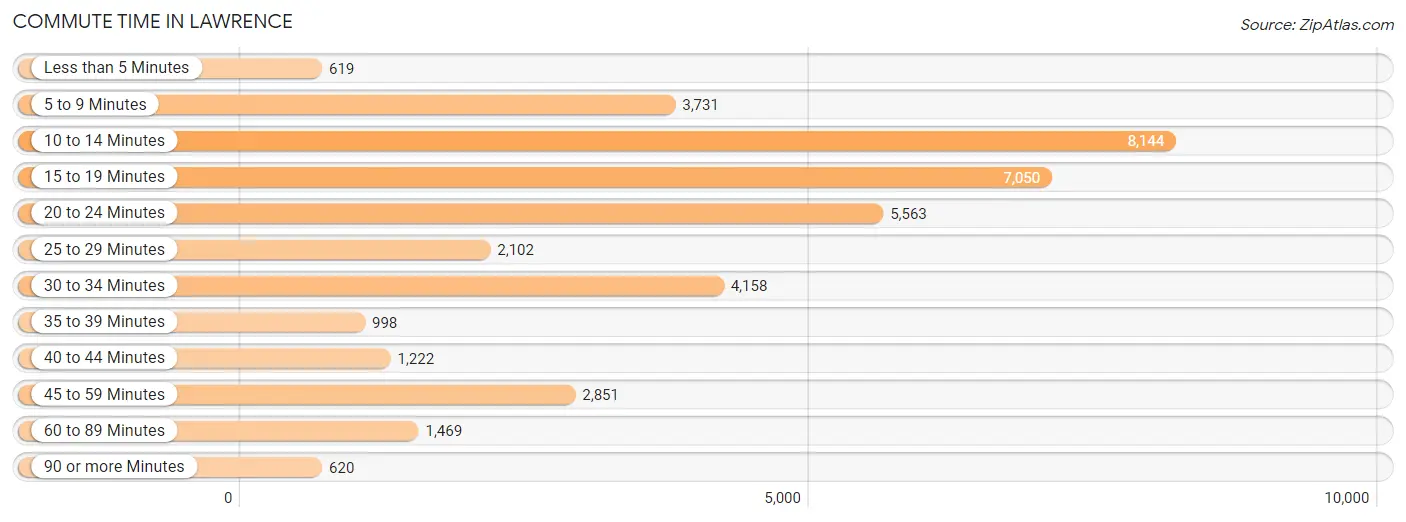
| Commute Time | # Commuters | % Commuters |
| Less than 5 Minutes | 619 | 1.6% |
| 5 to 9 Minutes | 3,731 | 9.7% |
| 10 to 14 Minutes | 8,144 | 21.1% |
| 15 to 19 Minutes | 7,050 | 18.3% |
| 20 to 24 Minutes | 5,563 | 14.4% |
| 25 to 29 Minutes | 2,102 | 5.5% |
| 30 to 34 Minutes | 4,158 | 10.8% |
| 35 to 39 Minutes | 998 | 2.6% |
| 40 to 44 Minutes | 1,222 | 3.2% |
| 45 to 59 Minutes | 2,851 | 7.4% |
| 60 to 89 Minutes | 1,469 | 3.8% |
| 90 or more Minutes | 620 | 1.6% |
Commute Time by Sex in Lawrence
The most common commute times in Lawrence are 10 to 14 minutes (4,145 commuters, 21.1%) for males and 10 to 14 minutes (3,999 commuters, 21.2%) for females.
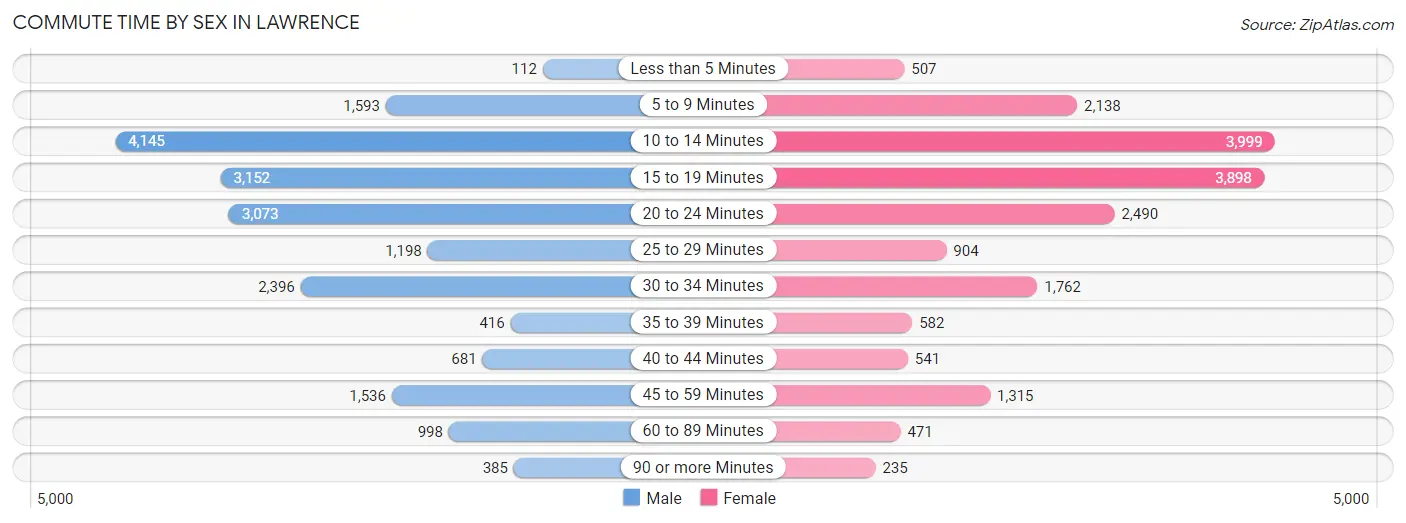
| Commute Time | Male | Female |
| Less than 5 Minutes | 112 (0.6%) | 507 (2.7%) |
| 5 to 9 Minutes | 1,593 (8.1%) | 2,138 (11.4%) |
| 10 to 14 Minutes | 4,145 (21.1%) | 3,999 (21.2%) |
| 15 to 19 Minutes | 3,152 (16.0%) | 3,898 (20.7%) |
| 20 to 24 Minutes | 3,073 (15.6%) | 2,490 (13.2%) |
| 25 to 29 Minutes | 1,198 (6.1%) | 904 (4.8%) |
| 30 to 34 Minutes | 2,396 (12.2%) | 1,762 (9.3%) |
| 35 to 39 Minutes | 416 (2.1%) | 582 (3.1%) |
| 40 to 44 Minutes | 681 (3.5%) | 541 (2.9%) |
| 45 to 59 Minutes | 1,536 (7.8%) | 1,315 (7.0%) |
| 60 to 89 Minutes | 998 (5.1%) | 471 (2.5%) |
| 90 or more Minutes | 385 (2.0%) | 235 (1.3%) |
Time of Departure to Work by Sex in Lawrence
The most frequent times of departure to work in Lawrence are 12:00 PM to 3:59 PM (2,415, 12.3%) for males and 7:00 AM to 7:29 AM (2,312, 12.3%) for females.
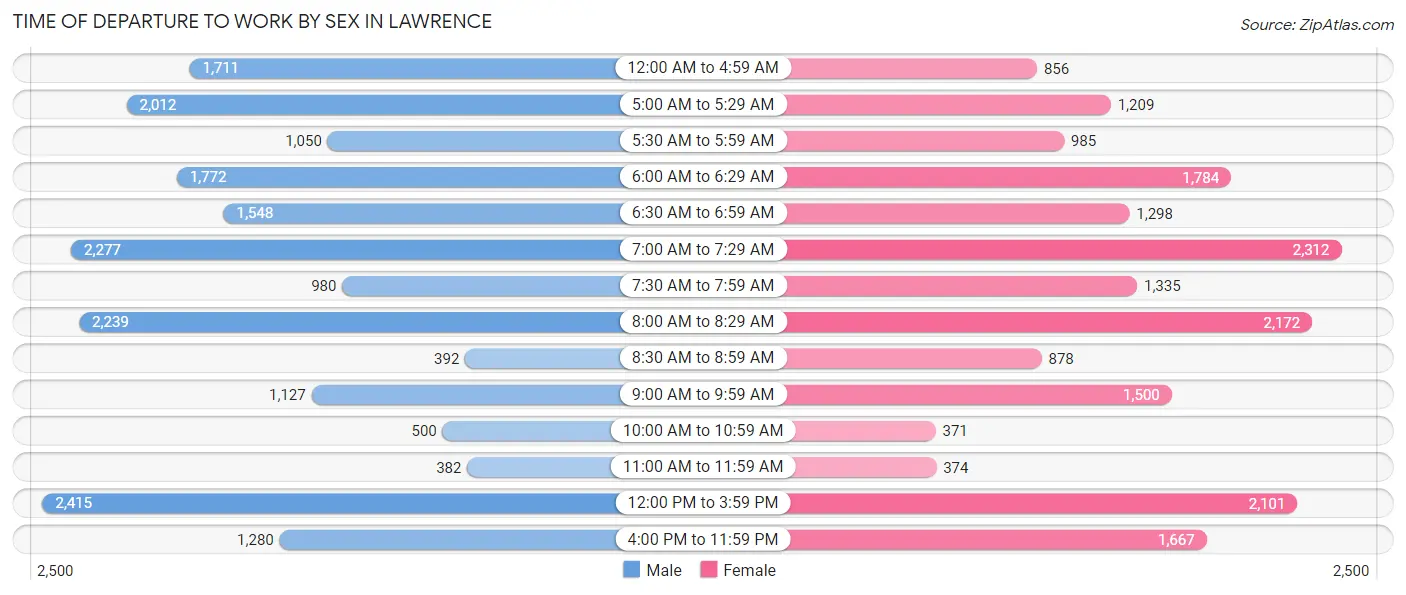
| Time of Departure | Male | Female |
| 12:00 AM to 4:59 AM | 1,711 (8.7%) | 856 (4.5%) |
| 5:00 AM to 5:29 AM | 2,012 (10.2%) | 1,209 (6.4%) |
| 5:30 AM to 5:59 AM | 1,050 (5.3%) | 985 (5.2%) |
| 6:00 AM to 6:29 AM | 1,772 (9.0%) | 1,784 (9.5%) |
| 6:30 AM to 6:59 AM | 1,548 (7.9%) | 1,298 (6.9%) |
| 7:00 AM to 7:29 AM | 2,277 (11.6%) | 2,312 (12.3%) |
| 7:30 AM to 7:59 AM | 980 (5.0%) | 1,335 (7.1%) |
| 8:00 AM to 8:29 AM | 2,239 (11.4%) | 2,172 (11.5%) |
| 8:30 AM to 8:59 AM | 392 (2.0%) | 878 (4.7%) |
| 9:00 AM to 9:59 AM | 1,127 (5.7%) | 1,500 (8.0%) |
| 10:00 AM to 10:59 AM | 500 (2.5%) | 371 (2.0%) |
| 11:00 AM to 11:59 AM | 382 (1.9%) | 374 (2.0%) |
| 12:00 PM to 3:59 PM | 2,415 (12.3%) | 2,101 (11.2%) |
| 4:00 PM to 11:59 PM | 1,280 (6.5%) | 1,667 (8.8%) |
| Total | 19,685 (100.0%) | 18,842 (100.0%) |
Housing Occupancy in Lawrence
Occupancy by Ownership in Lawrence
Of the total 30,330 dwellings in Lawrence, owner-occupied units account for 9,063 (29.9%), while renter-occupied units make up 21,267 (70.1%).
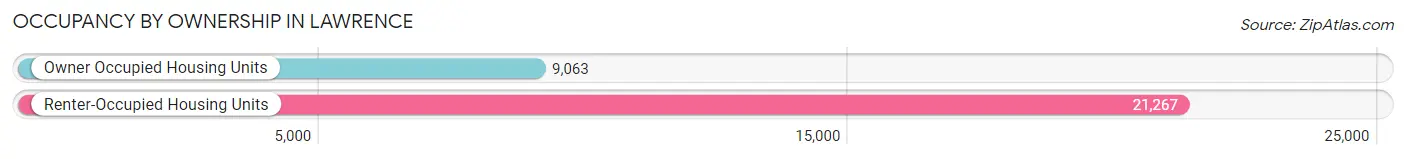
| Occupancy | # Housing Units | % Housing Units |
| Owner Occupied Housing Units | 9,063 | 29.9% |
| Renter-Occupied Housing Units | 21,267 | 70.1% |
| Total Occupied Housing Units | 30,330 | 100.0% |
Occupancy by Household Size in Lawrence
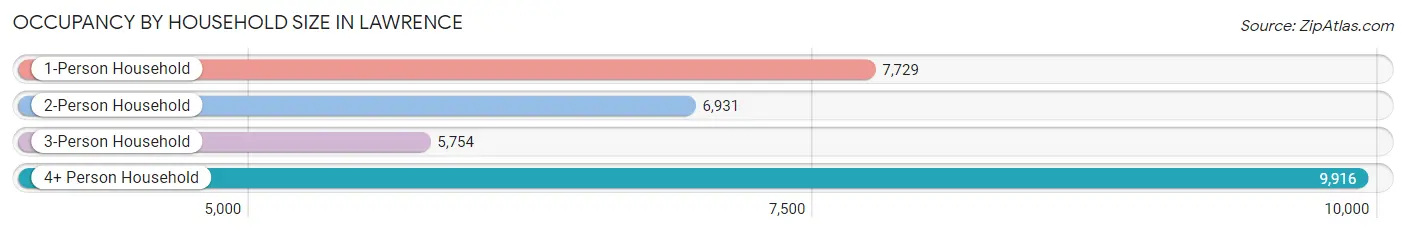
| Household Size | # Housing Units | % Housing Units |
| 1-Person Household | 7,729 | 25.5% |
| 2-Person Household | 6,931 | 22.9% |
| 3-Person Household | 5,754 | 19.0% |
| 4+ Person Household | 9,916 | 32.7% |
| Total Housing Units | 30,330 | 100.0% |
Occupancy by Ownership by Household Size in Lawrence
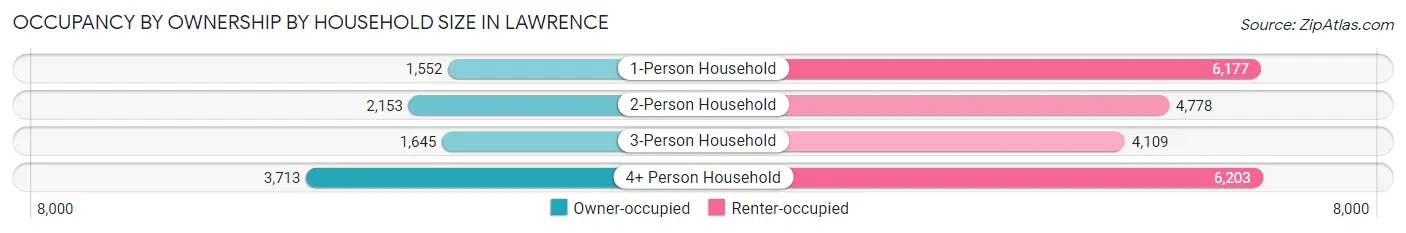
| Household Size | Owner-occupied | Renter-occupied |
| 1-Person Household | 1,552 (20.1%) | 6,177 (79.9%) |
| 2-Person Household | 2,153 (31.1%) | 4,778 (68.9%) |
| 3-Person Household | 1,645 (28.6%) | 4,109 (71.4%) |
| 4+ Person Household | 3,713 (37.4%) | 6,203 (62.6%) |
| Total Housing Units | 9,063 (29.9%) | 21,267 (70.1%) |
Occupancy by Educational Attainment in Lawrence
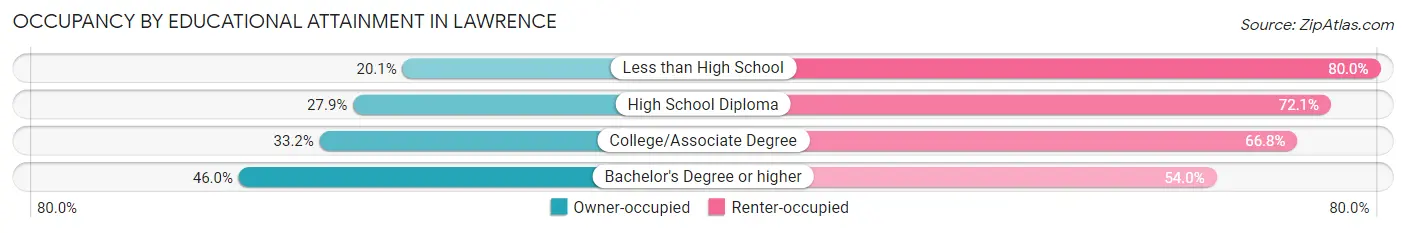
| Household Size | Owner-occupied | Renter-occupied |
| Less than High School | 1,767 (20.1%) | 7,045 (79.9%) |
| High School Diploma | 2,514 (27.9%) | 6,501 (72.1%) |
| College/Associate Degree | 2,521 (33.2%) | 5,070 (66.8%) |
| Bachelor's Degree or higher | 2,261 (46.0%) | 2,651 (54.0%) |
Occupancy by Age of Householder in Lawrence
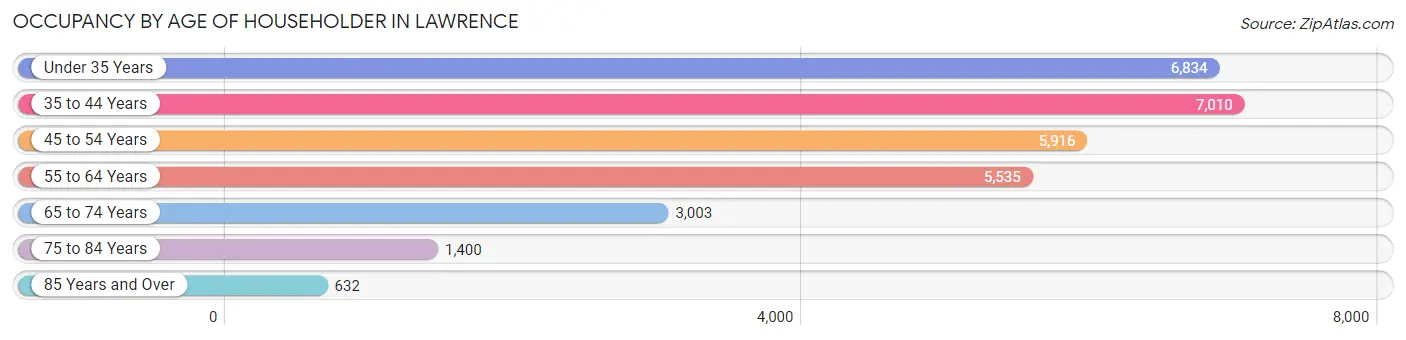
| Age Bracket | # Households | % Households |
| Under 35 Years | 6,834 | 22.5% |
| 35 to 44 Years | 7,010 | 23.1% |
| 45 to 54 Years | 5,916 | 19.5% |
| 55 to 64 Years | 5,535 | 18.2% |
| 65 to 74 Years | 3,003 | 9.9% |
| 75 to 84 Years | 1,400 | 4.6% |
| 85 Years and Over | 632 | 2.1% |
| Total | 30,330 | 100.0% |
Housing Finances in Lawrence
Median Income by Occupancy in Lawrence
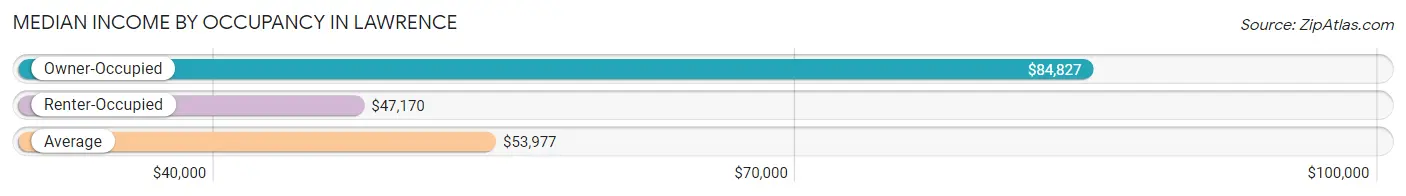
| Occupancy Type | # Households | Median Income |
| Owner-Occupied | 9,063 (29.9%) | $84,827 |
| Renter-Occupied | 21,267 (70.1%) | $47,170 |
| Average | 30,330 (100.0%) | $53,977 |
Occupancy by Householder Income Bracket in Lawrence
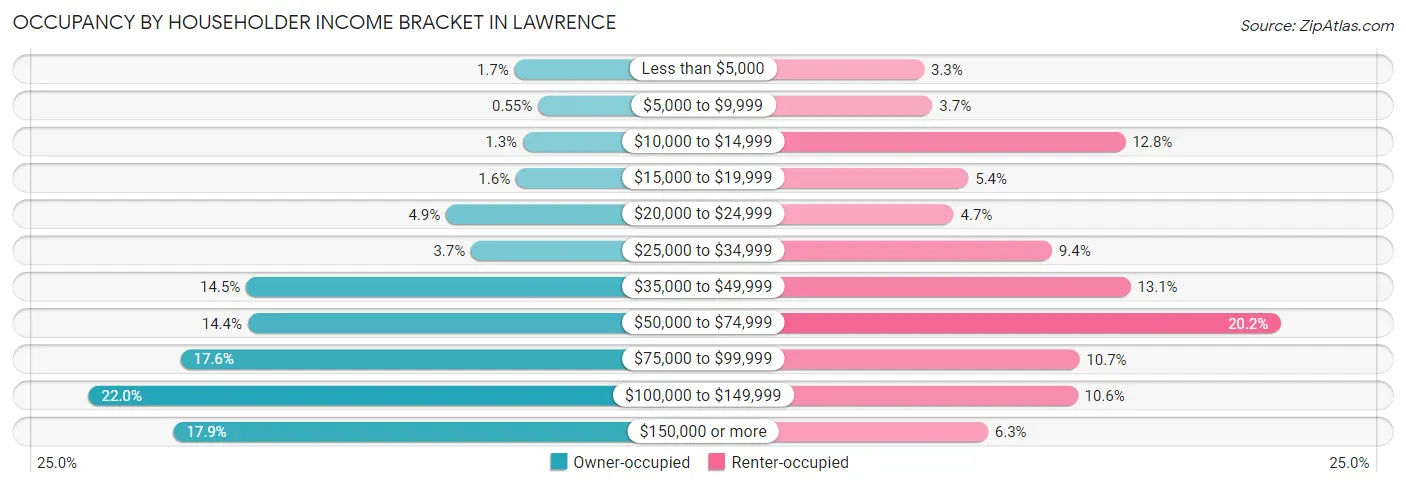
| Income Bracket | Owner-occupied | Renter-occupied |
| Less than $5,000 | 151 (1.7%) | 694 (3.3%) |
| $5,000 to $9,999 | 50 (0.5%) | 779 (3.7%) |
| $10,000 to $14,999 | 115 (1.3%) | 2,731 (12.8%) |
| $15,000 to $19,999 | 145 (1.6%) | 1,142 (5.4%) |
| $20,000 to $24,999 | 447 (4.9%) | 993 (4.7%) |
| $25,000 to $34,999 | 339 (3.7%) | 1,989 (9.3%) |
| $35,000 to $49,999 | 1,310 (14.4%) | 2,784 (13.1%) |
| $50,000 to $74,999 | 1,302 (14.4%) | 4,301 (20.2%) |
| $75,000 to $99,999 | 1,592 (17.6%) | 2,266 (10.7%) |
| $100,000 to $149,999 | 1,989 (22.0%) | 2,248 (10.6%) |
| $150,000 or more | 1,623 (17.9%) | 1,340 (6.3%) |
| Total | 9,063 (100.0%) | 21,267 (100.0%) |
Monthly Housing Cost Tiers in Lawrence
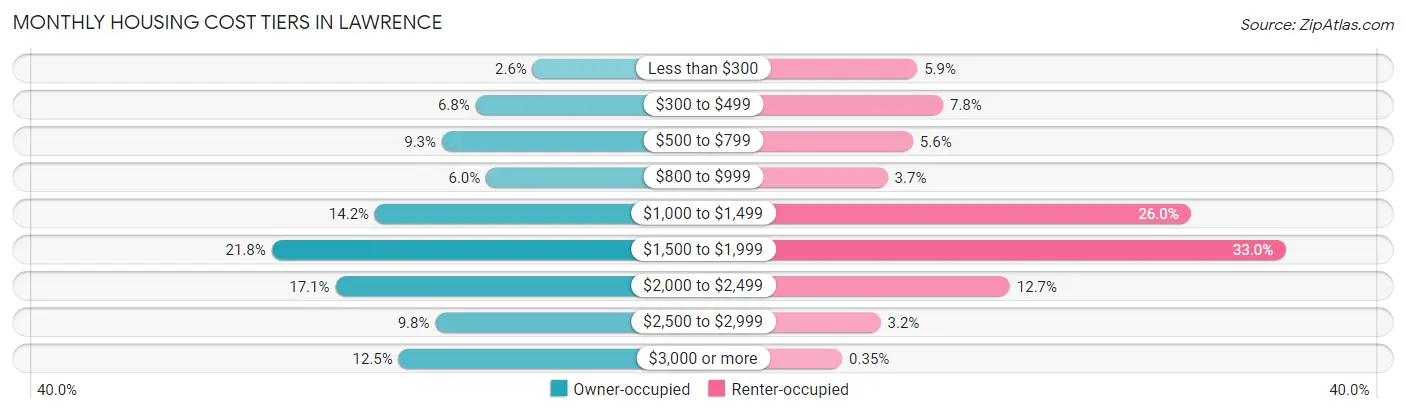
| Monthly Cost | Owner-occupied | Renter-occupied |
| Less than $300 | 234 (2.6%) | 1,251 (5.9%) |
| $300 to $499 | 615 (6.8%) | 1,655 (7.8%) |
| $500 to $799 | 840 (9.3%) | 1,183 (5.6%) |
| $800 to $999 | 545 (6.0%) | 787 (3.7%) |
| $1,000 to $1,499 | 1,287 (14.2%) | 5,529 (26.0%) |
| $1,500 to $1,999 | 1,977 (21.8%) | 7,012 (33.0%) |
| $2,000 to $2,499 | 1,552 (17.1%) | 2,700 (12.7%) |
| $2,500 to $2,999 | 884 (9.8%) | 676 (3.2%) |
| $3,000 or more | 1,129 (12.5%) | 75 (0.4%) |
| Total | 9,063 (100.0%) | 21,267 (100.0%) |
Physical Housing Characteristics in Lawrence
Housing Structures in Lawrence
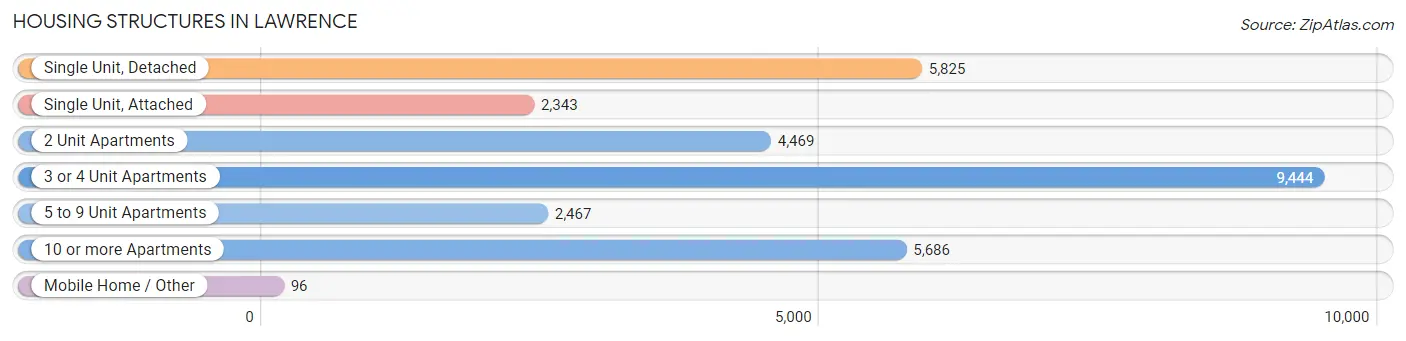
| Structure Type | # Housing Units | % Housing Units |
| Single Unit, Detached | 5,825 | 19.2% |
| Single Unit, Attached | 2,343 | 7.7% |
| 2 Unit Apartments | 4,469 | 14.7% |
| 3 or 4 Unit Apartments | 9,444 | 31.1% |
| 5 to 9 Unit Apartments | 2,467 | 8.1% |
| 10 or more Apartments | 5,686 | 18.8% |
| Mobile Home / Other | 96 | 0.3% |
| Total | 30,330 | 100.0% |
Housing Structures by Occupancy in Lawrence
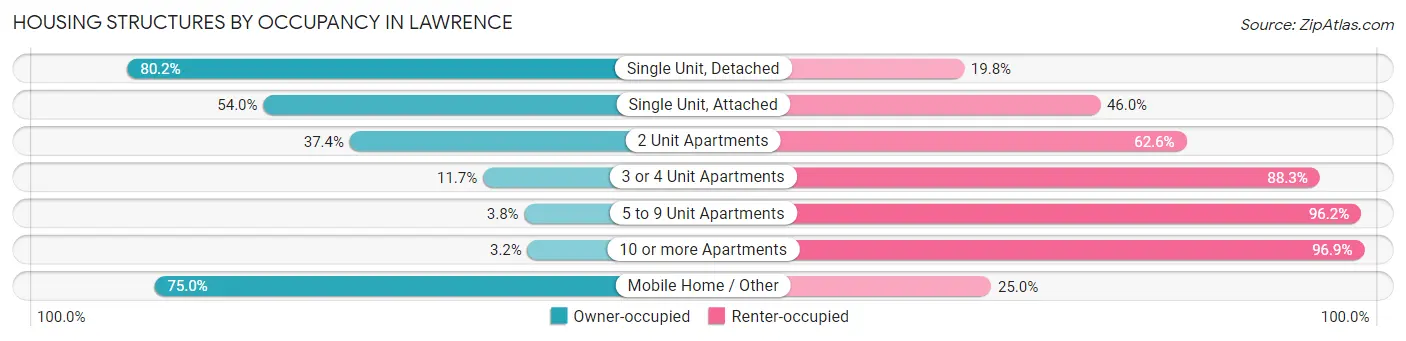
| Structure Type | Owner-occupied | Renter-occupied |
| Single Unit, Detached | 4,673 (80.2%) | 1,152 (19.8%) |
| Single Unit, Attached | 1,266 (54.0%) | 1,077 (46.0%) |
| 2 Unit Apartments | 1,671 (37.4%) | 2,798 (62.6%) |
| 3 or 4 Unit Apartments | 1,109 (11.7%) | 8,335 (88.3%) |
| 5 to 9 Unit Apartments | 93 (3.8%) | 2,374 (96.2%) |
| 10 or more Apartments | 179 (3.2%) | 5,507 (96.9%) |
| Mobile Home / Other | 72 (75.0%) | 24 (25.0%) |
| Total | 9,063 (29.9%) | 21,267 (70.1%) |
Housing Structures by Number of Rooms in Lawrence
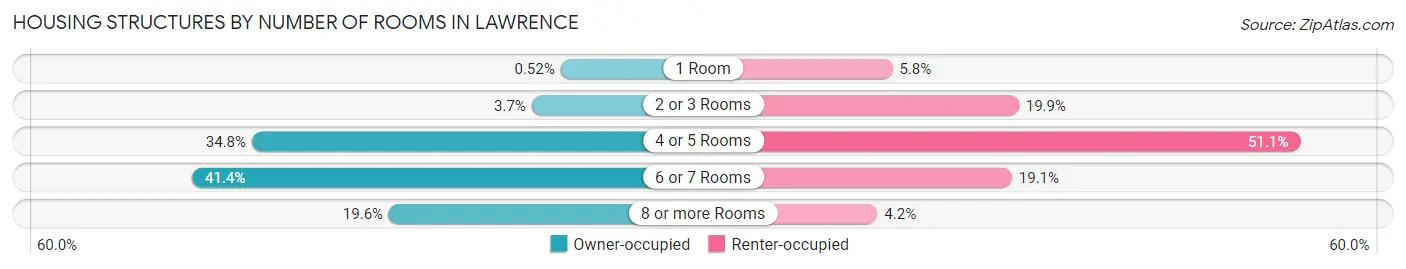
| Number of Rooms | Owner-occupied | Renter-occupied |
| 1 Room | 47 (0.5%) | 1,243 (5.8%) |
| 2 or 3 Rooms | 337 (3.7%) | 4,221 (19.9%) |
| 4 or 5 Rooms | 3,152 (34.8%) | 10,862 (51.1%) |
| 6 or 7 Rooms | 3,753 (41.4%) | 4,057 (19.1%) |
| 8 or more Rooms | 1,774 (19.6%) | 884 (4.2%) |
| Total | 9,063 (100.0%) | 21,267 (100.0%) |
Housing Structure by Heating Type in Lawrence
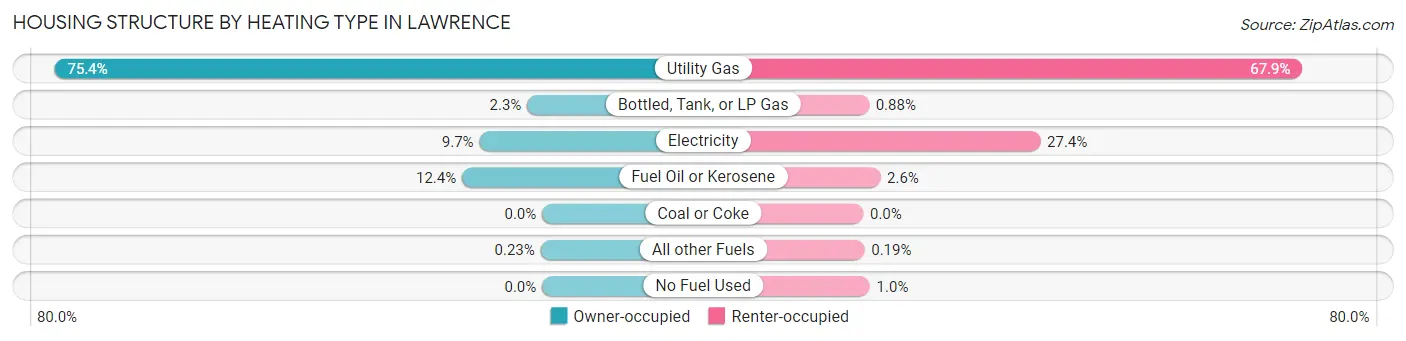
| Heating Type | Owner-occupied | Renter-occupied |
| Utility Gas | 6,833 (75.4%) | 14,440 (67.9%) |
| Bottled, Tank, or LP Gas | 209 (2.3%) | 188 (0.9%) |
| Electricity | 878 (9.7%) | 5,821 (27.4%) |
| Fuel Oil or Kerosene | 1,122 (12.4%) | 561 (2.6%) |
| Coal or Coke | 0 (0.0%) | 0 (0.0%) |
| All other Fuels | 21 (0.2%) | 40 (0.2%) |
| No Fuel Used | 0 (0.0%) | 217 (1.0%) |
| Total | 9,063 (100.0%) | 21,267 (100.0%) |
Household Vehicle Usage in Lawrence

| Vehicles per Household | Owner-occupied | Renter-occupied |
| No Vehicle | 693 (7.6%) | 6,212 (29.2%) |
| 1 Vehicle | 2,654 (29.3%) | 9,711 (45.7%) |
| 2 Vehicles | 3,733 (41.2%) | 4,181 (19.7%) |
| 3 or more Vehicles | 1,983 (21.9%) | 1,163 (5.5%) |
| Total | 9,063 (100.0%) | 21,267 (100.0%) |
Real Estate & Mortgages in Lawrence
Real Estate and Mortgage Overview in Lawrence
| Characteristic | Without Mortgage | With Mortgage |
| Housing Units | 2,541 | 6,522 |
| Median Property Value | $331,500 | $385,100 |
| Median Household Income | $59,708 | $1,221 |
| Monthly Housing Costs | $674 | $1,129 |
| Real Estate Taxes | $3,079 | $184 |
Property Value by Mortgage Status in Lawrence
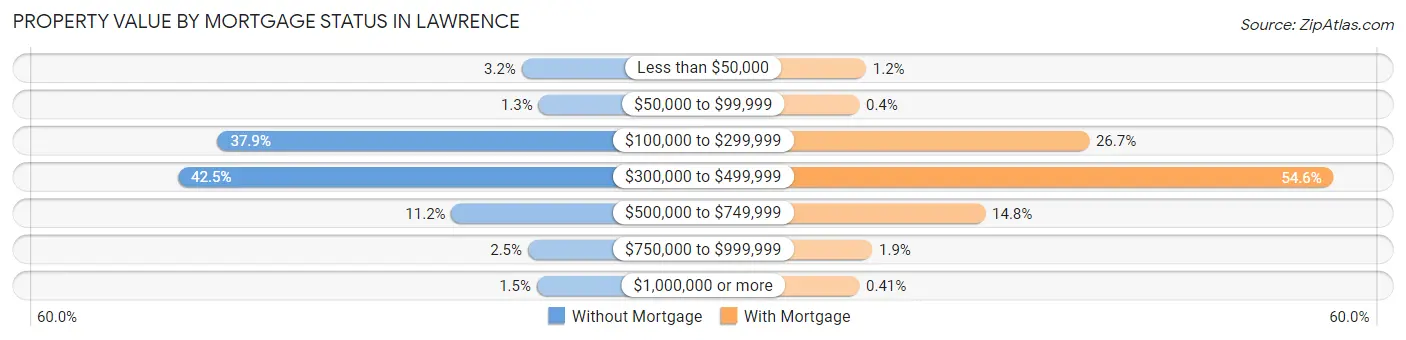
| Property Value | Without Mortgage | With Mortgage |
| Less than $50,000 | 81 (3.2%) | 77 (1.2%) |
| $50,000 to $99,999 | 32 (1.3%) | 26 (0.4%) |
| $100,000 to $299,999 | 964 (37.9%) | 1,740 (26.7%) |
| $300,000 to $499,999 | 1,079 (42.5%) | 3,563 (54.6%) |
| $500,000 to $749,999 | 285 (11.2%) | 966 (14.8%) |
| $750,000 to $999,999 | 63 (2.5%) | 123 (1.9%) |
| $1,000,000 or more | 37 (1.5%) | 27 (0.4%) |
| Total | 2,541 (100.0%) | 6,522 (100.0%) |
Household Income by Mortgage Status in Lawrence
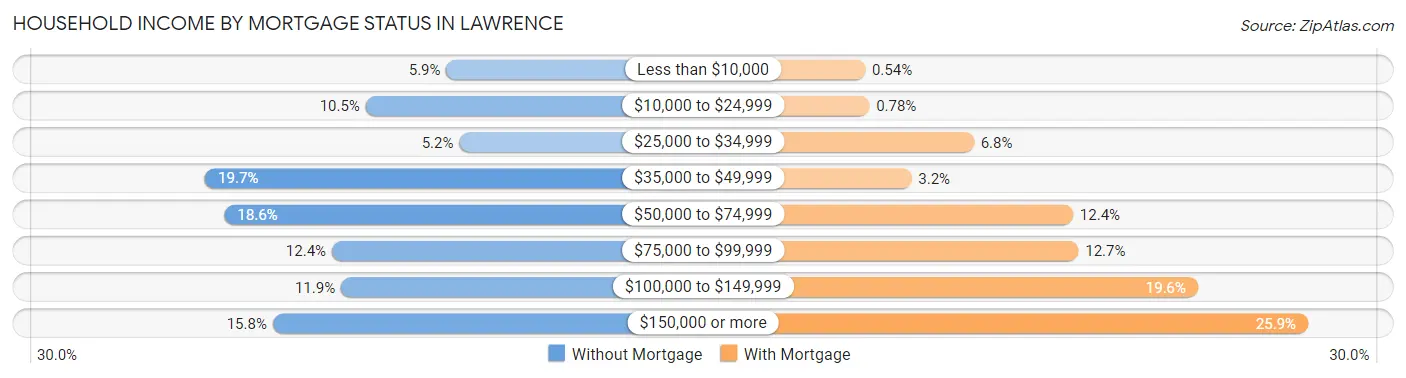
| Household Income | Without Mortgage | With Mortgage |
| Less than $10,000 | 150 (5.9%) | 35 (0.5%) |
| $10,000 to $24,999 | 267 (10.5%) | 51 (0.8%) |
| $25,000 to $34,999 | 131 (5.2%) | 440 (6.8%) |
| $35,000 to $49,999 | 500 (19.7%) | 208 (3.2%) |
| $50,000 to $74,999 | 472 (18.6%) | 810 (12.4%) |
| $75,000 to $99,999 | 316 (12.4%) | 830 (12.7%) |
| $100,000 to $149,999 | 303 (11.9%) | 1,276 (19.6%) |
| $150,000 or more | 402 (15.8%) | 1,686 (25.9%) |
| Total | 2,541 (100.0%) | 6,522 (100.0%) |
Property Value to Household Income Ratio in Lawrence
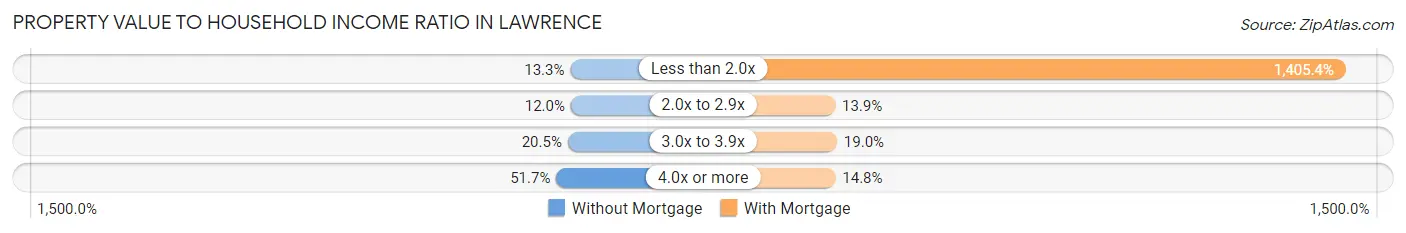
| Value-to-Income Ratio | Without Mortgage | With Mortgage |
| Less than 2.0x | 339 (13.3%) | 91,660 (1,405.4%) |
| 2.0x to 2.9x | 306 (12.0%) | 904 (13.9%) |
| 3.0x to 3.9x | 520 (20.5%) | 1,241 (19.0%) |
| 4.0x or more | 1,314 (51.7%) | 967 (14.8%) |
| Total | 2,541 (100.0%) | 6,522 (100.0%) |
Real Estate Taxes by Mortgage Status in Lawrence
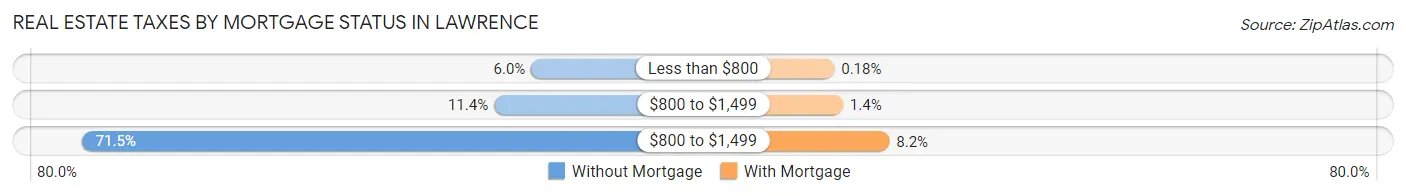
| Property Taxes | Without Mortgage | With Mortgage |
| Less than $800 | 152 (6.0%) | 12 (0.2%) |
| $800 to $1,499 | 290 (11.4%) | 94 (1.4%) |
| $800 to $1,499 | 1,817 (71.5%) | 537 (8.2%) |
| Total | 2,541 (100.0%) | 6,522 (100.0%) |
Health & Disability in Lawrence
Health Insurance Coverage by Age in Lawrence
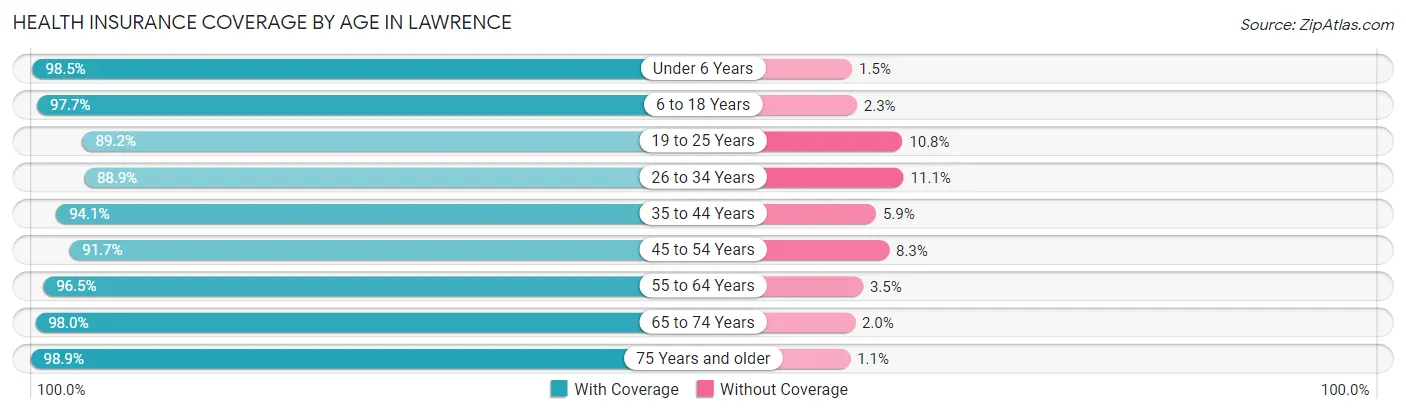
| Age Bracket | With Coverage | Without Coverage |
| Under 6 Years | 8,128 (98.5%) | 121 (1.5%) |
| 6 to 18 Years | 16,788 (97.7%) | 403 (2.3%) |
| 19 to 25 Years | 9,348 (89.2%) | 1,135 (10.8%) |
| 26 to 34 Years | 11,075 (88.9%) | 1,379 (11.1%) |
| 35 to 44 Years | 10,659 (94.1%) | 670 (5.9%) |
| 45 to 54 Years | 9,241 (91.7%) | 841 (8.3%) |
| 55 to 64 Years | 9,116 (96.5%) | 329 (3.5%) |
| 65 to 74 Years | 4,770 (98.0%) | 97 (2.0%) |
| 75 Years and older | 3,200 (98.9%) | 36 (1.1%) |
| Total | 82,325 (94.3%) | 5,011 (5.7%) |
Health Insurance Coverage by Citizenship Status in Lawrence
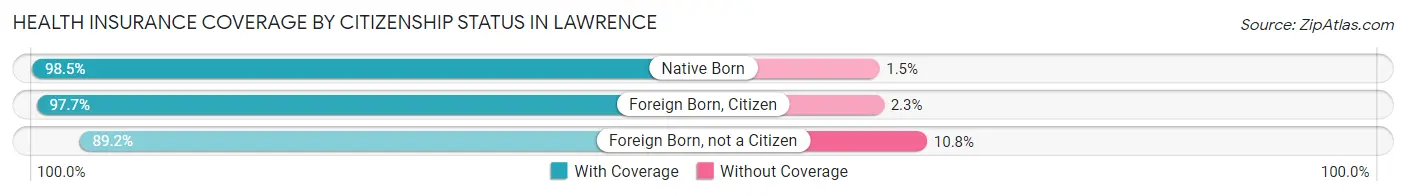
| Citizenship Status | With Coverage | Without Coverage |
| Native Born | 8,128 (98.5%) | 121 (1.5%) |
| Foreign Born, Citizen | 16,788 (97.7%) | 403 (2.3%) |
| Foreign Born, not a Citizen | 9,348 (89.2%) | 1,135 (10.8%) |
Health Insurance Coverage by Household Income in Lawrence
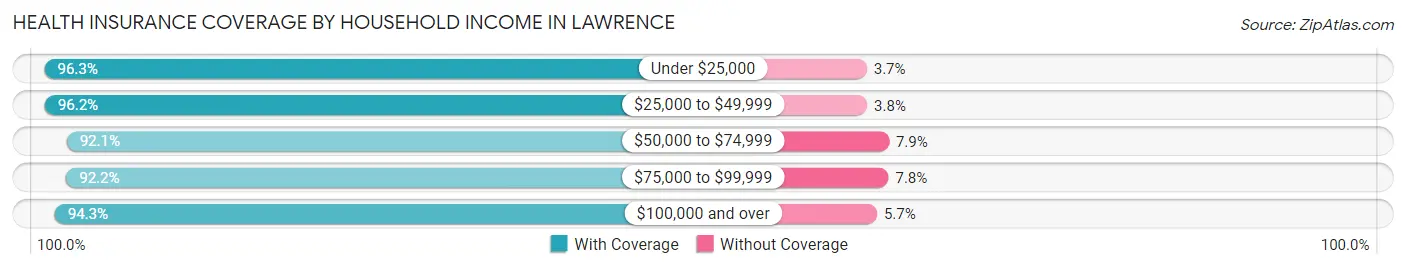
| Household Income | With Coverage | Without Coverage |
| Under $25,000 | 12,964 (96.3%) | 503 (3.7%) |
| $25,000 to $49,999 | 16,608 (96.2%) | 658 (3.8%) |
| $50,000 to $74,999 | 15,709 (92.1%) | 1,347 (7.9%) |
| $75,000 to $99,999 | 11,886 (92.2%) | 1,009 (7.8%) |
| $100,000 and over | 24,884 (94.3%) | 1,494 (5.7%) |
Public vs Private Health Insurance Coverage by Age in Lawrence
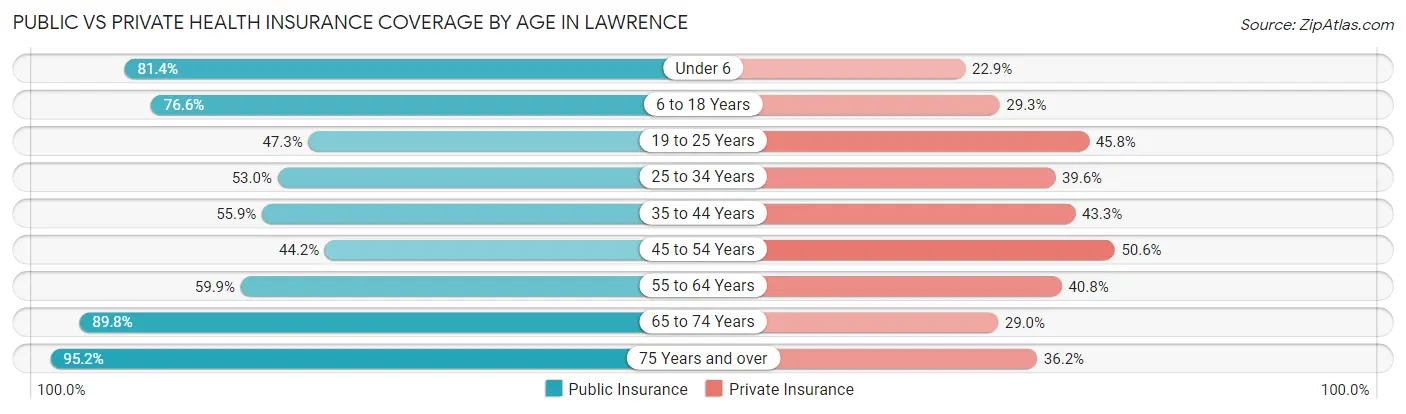
| Age Bracket | Public Insurance | Private Insurance |
| Under 6 | 6,718 (81.4%) | 1,888 (22.9%) |
| 6 to 18 Years | 13,160 (76.5%) | 5,029 (29.2%) |
| 19 to 25 Years | 4,959 (47.3%) | 4,804 (45.8%) |
| 25 to 34 Years | 6,602 (53.0%) | 4,927 (39.6%) |
| 35 to 44 Years | 6,333 (55.9%) | 4,906 (43.3%) |
| 45 to 54 Years | 4,458 (44.2%) | 5,103 (50.6%) |
| 55 to 64 Years | 5,654 (59.9%) | 3,852 (40.8%) |
| 65 to 74 Years | 4,372 (89.8%) | 1,410 (29.0%) |
| 75 Years and over | 3,081 (95.2%) | 1,172 (36.2%) |
| Total | 55,337 (63.4%) | 33,091 (37.9%) |
Disability Status by Sex by Age in Lawrence
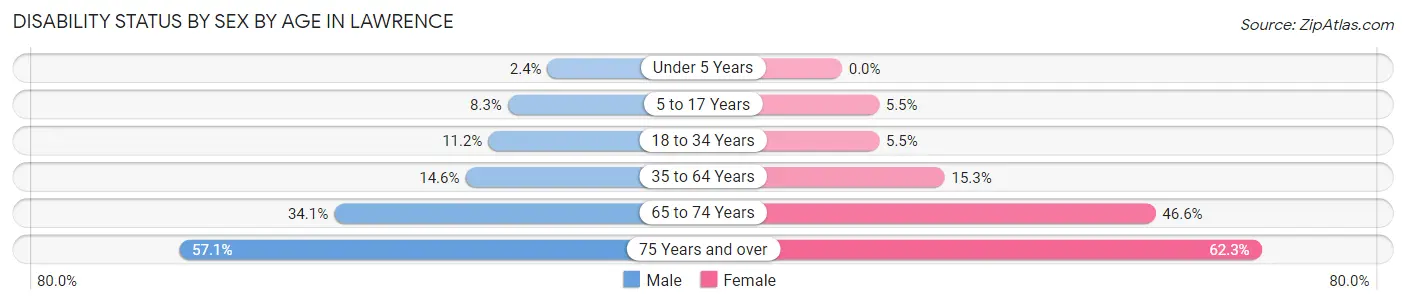
| Age Bracket | Male | Female |
| Under 5 Years | 75 (2.4%) | 0 (0.0%) |
| 5 to 17 Years | 766 (8.3%) | 423 (5.5%) |
| 18 to 34 Years | 1,425 (11.2%) | 650 (5.5%) |
| 35 to 64 Years | 2,133 (14.6%) | 2,473 (15.3%) |
| 65 to 74 Years | 720 (34.1%) | 1,282 (46.6%) |
| 75 Years and over | 720 (57.1%) | 1,230 (62.3%) |
Disability Class by Sex by Age in Lawrence
Disability Class: Hearing Difficulty
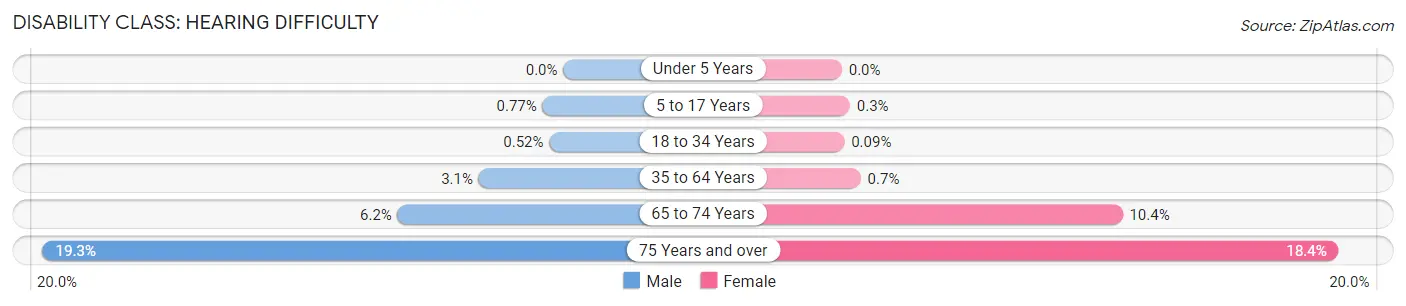
| Age Bracket | Male | Female |
| Under 5 Years | 0 (0.0%) | 0 (0.0%) |
| 5 to 17 Years | 71 (0.8%) | 23 (0.3%) |
| 18 to 34 Years | 67 (0.5%) | 10 (0.1%) |
| 35 to 64 Years | 460 (3.1%) | 113 (0.7%) |
| 65 to 74 Years | 130 (6.1%) | 287 (10.4%) |
| 75 Years and over | 244 (19.3%) | 364 (18.4%) |
Disability Class: Vision Difficulty
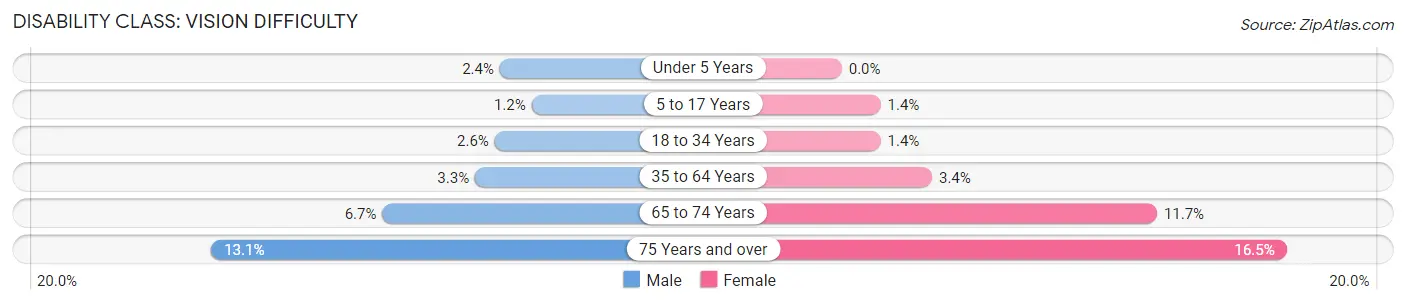
| Age Bracket | Male | Female |
| Under 5 Years | 75 (2.4%) | 0 (0.0%) |
| 5 to 17 Years | 109 (1.2%) | 111 (1.4%) |
| 18 to 34 Years | 325 (2.5%) | 169 (1.4%) |
| 35 to 64 Years | 481 (3.3%) | 543 (3.4%) |
| 65 to 74 Years | 142 (6.7%) | 322 (11.7%) |
| 75 Years and over | 165 (13.1%) | 326 (16.5%) |
Disability Class: Cognitive Difficulty
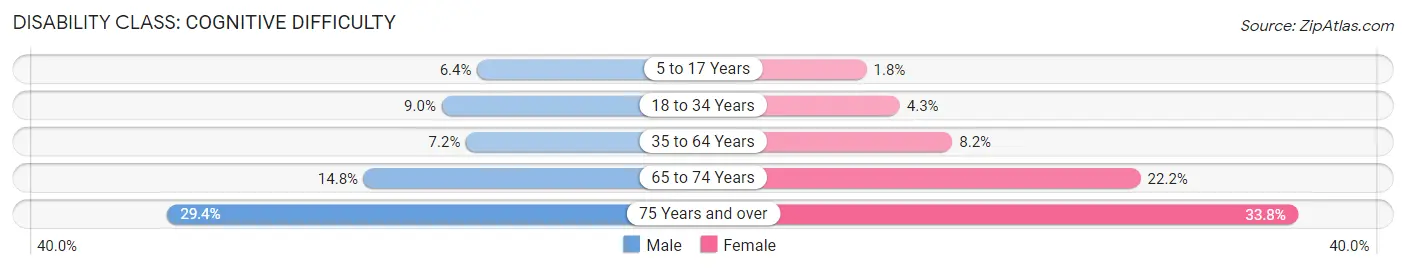
| Age Bracket | Male | Female |
| 5 to 17 Years | 592 (6.4%) | 142 (1.8%) |
| 18 to 34 Years | 1,153 (9.0%) | 507 (4.3%) |
| 35 to 64 Years | 1,056 (7.2%) | 1,331 (8.2%) |
| 65 to 74 Years | 313 (14.8%) | 611 (22.2%) |
| 75 Years and over | 371 (29.4%) | 668 (33.8%) |
Disability Class: Ambulatory Difficulty
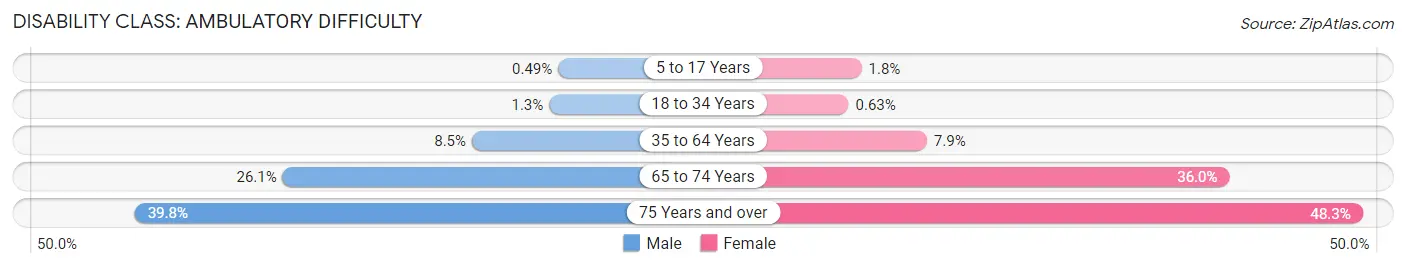
| Age Bracket | Male | Female |
| 5 to 17 Years | 45 (0.5%) | 142 (1.8%) |
| 18 to 34 Years | 168 (1.3%) | 74 (0.6%) |
| 35 to 64 Years | 1,244 (8.5%) | 1,281 (7.9%) |
| 65 to 74 Years | 551 (26.1%) | 990 (36.0%) |
| 75 Years and over | 502 (39.8%) | 954 (48.3%) |
Disability Class: Self-Care Difficulty
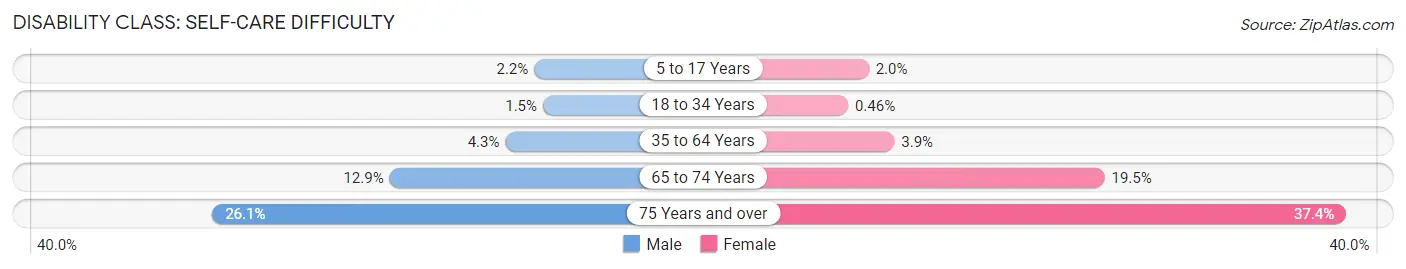
| Age Bracket | Male | Female |
| 5 to 17 Years | 201 (2.2%) | 154 (2.0%) |
| 18 to 34 Years | 194 (1.5%) | 54 (0.5%) |
| 35 to 64 Years | 632 (4.3%) | 632 (3.9%) |
| 65 to 74 Years | 273 (12.9%) | 537 (19.5%) |
| 75 Years and over | 329 (26.1%) | 739 (37.4%) |
Technology Access in Lawrence
Computing Device Access in Lawrence
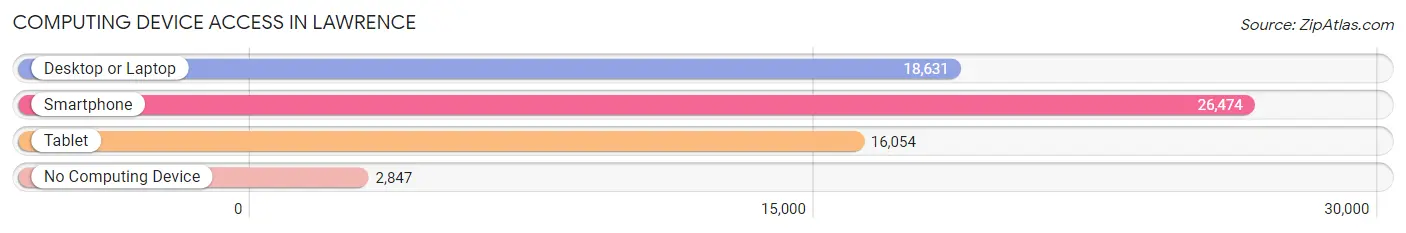
| Device Type | # Households | % Households |
| Desktop or Laptop | 18,631 | 61.4% |
| Smartphone | 26,474 | 87.3% |
| Tablet | 16,054 | 52.9% |
| No Computing Device | 2,847 | 9.4% |
| Total | 30,330 | 100.0% |
Internet Access in Lawrence
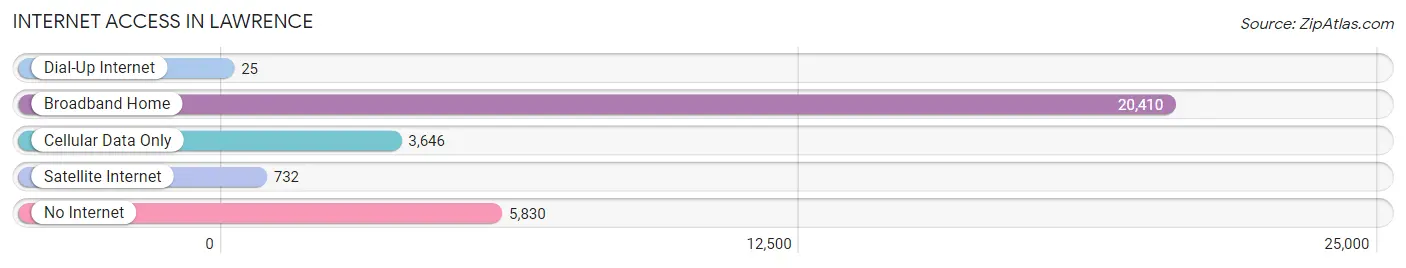
| Internet Type | # Households | % Households |
| Dial-Up Internet | 25 | 0.1% |
| Broadband Home | 20,410 | 67.3% |
| Cellular Data Only | 3,646 | 12.0% |
| Satellite Internet | 732 | 2.4% |
| No Internet | 5,830 | 19.2% |
| Total | 30,330 | 100.0% |
Lawrence Summary
Lawrence, Massachusetts is a city located in Essex County, Massachusetts, United States. It is situated along the Merrimack River, which forms the county’s northern border. The city is bordered by Methuen to the north, Andover to the west, North Andover to the southwest, and Haverhill to the southeast. As of the 2010 census, the city had a population of 76,377, making it the eighth-largest city in the state.
Geography
Lawrence is located at 42°42′N 71°10′W (42.7, -71.17). According to the United States Census Bureau, the city has a total area of 10.5 square miles (27.2 km2), of which 10.2 square miles (26.4 km2) is land and 0.3 square miles (0.8 km2) (2.90%) is water.
The city is located on the Merrimack River, which forms the county’s northern border. The city is bordered by Methuen to the north, Andover to the west, North Andover to the southwest, and Haverhill to the southeast.
History
Lawrence was founded in 1655 as a farming community and was incorporated as a city in 1853. The city was named after the industrialist Amos Lawrence, who was a major investor in the city’s early development.
The city was a major center of the Industrial Revolution in the 19th century, and was home to the first integrated textile mill in the United States. The city was also a major center of the labor movement in the early 20th century, and was the site of the Bread and Roses Strike of 1912.
Economy
Lawrence is a major industrial center, with a diverse economy. The city is home to a number of large companies, including General Electric, Raytheon, and Textron. The city is also home to a number of smaller businesses, including a number of technology companies.
The city is also home to a number of educational institutions, including the University of Massachusetts Lowell, Northern Essex Community College, and Merrimack College.
Demographics
As of the 2010 census, the city had a population of 76,377. The racial makeup of the city was 73.2% White, 8.3% African American, 0.4% Native American, 5.2% Asian, 0.1% Pacific Islander, 8.7% from other races, and 3.1% from two or more races. Hispanic or Latino of any race were 20.2% of the population.
The median income for a household in the city was $37,837, and the median income for a family was $45,837. The per capita income for the city was $20,837. About 17.2% of families and 20.7% of the population were below the poverty line, including 28.3% of those under age 18 and 14.2% of those age 65 or over.
Conclusion
Lawrence, Massachusetts is a city located in Essex County, Massachusetts, United States. It is situated along the Merrimack River, which forms the county’s northern border. The city is bordered by Methuen to the north, Andover to the west, North Andover to the southwest, and Haverhill to the southeast. As of the 2010 census, the city had a population of 76,377, making it the eighth-largest city in the state. Lawrence is a major industrial center, with a diverse economy. The city is home to a number of large companies, including General Electric, Raytheon, and Textron. The city is also home to a number of educational institutions, including the University of Massachusetts Lowell, Northern Essex Community College, and Merrimack College. The racial makeup of the city was 73.2% White, 8.3% African American, 0.4% Native American, 5.2% Asian, 0.1% Pacific Islander, 8.7% from other races, and 3.1% from two or more races. Hispanic or Latino of any race were 20.2% of the population. The median income for a household in the city was $37,837, and the median income for a family was $45,837. The per capita income for the city was $20,837. About 17.2% of families and 20.7% of the population were below the poverty line, including 28.3% of those under age 18 and 14.2% of those age 65 or over.
Common Questions
What is Per Capita Income in Lawrence?
Per Capita income in Lawrence is $25,774.
What is the Median Family Income in Lawrence?
Median Family Income in Lawrence is $58,898.
What is the Median Household income in Lawrence?
Median Household Income in Lawrence is $53,977.
What is Income or Wage Gap in Lawrence?
Income or Wage Gap in Lawrence is 17.7%.
Women in Lawrence earn 82.3 cents for every dollar earned by a man.
What is Family Income Deficit in Lawrence?
Family Income Deficit in Lawrence is $9,066.
Families that are below poverty line in Lawrence earn $9,066 less on average than the poverty threshold level.
What is Inequality or Gini Index in Lawrence?
Inequality or Gini Index in Lawrence is 0.46.
What is the Total Population of Lawrence?
Total Population of Lawrence is 88,067.
What is the Total Male Population of Lawrence?
Total Male Population of Lawrence is 43,725.
What is the Total Female Population of Lawrence?
Total Female Population of Lawrence is 44,342.
What is the Ratio of Males per 100 Females in Lawrence?
There are 98.61 Males per 100 Females in Lawrence.
What is the Ratio of Females per 100 Males in Lawrence?
There are 101.41 Females per 100 Males in Lawrence.
What is the Median Population Age in Lawrence?
Median Population Age in Lawrence is 31.5 Years.
What is the Average Family Size in Lawrence
Average Family Size in Lawrence is 3.4 People.
What is the Average Household Size in Lawrence
Average Household Size in Lawrence is 2.9 People.
How Large is the Labor Force in Lawrence?
There are 45,968 People in the Labor Forcein in Lawrence.
What is the Percentage of People in the Labor Force in Lawrence?
69.0% of People are in the Labor Force in Lawrence.
What is the Unemployment Rate in Lawrence?
Unemployment Rate in Lawrence is 10.4%.