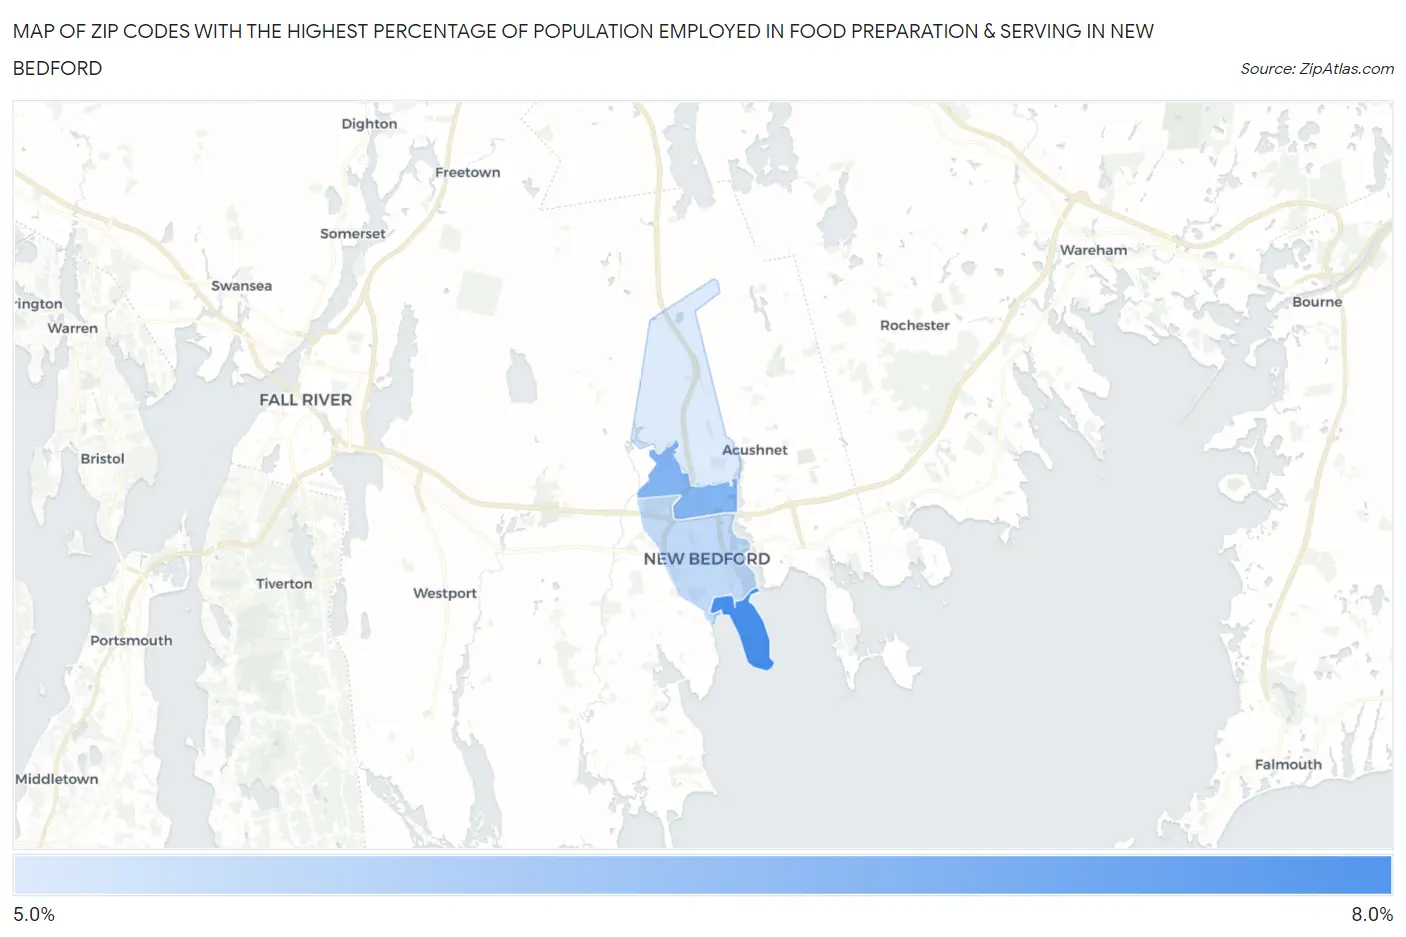
Zip Codes with the Highest Percentage of Population Employed in Food Preparation & Serving in New Bedford, MA
RELATED REPORTS & OPTIONS
Food Preparation & Serving
New Bedford
Compare Zip Codes
Map of Zip Codes with the Highest Percentage of Population Employed in Food Preparation & Serving in New Bedford
5.7%
7.9%
Zip Codes with the Highest Percentage of Population Employed in Food Preparation & Serving in New Bedford, MA
| Zip Code | % Employed | vs State | vs National | |
| 1. | 02744 | 7.9% | 4.6%(+3.31)#49 | 5.3%(+2.63)#4,858 |
| 2. | 02746 | 7.0% | 4.6%(+2.39)#70 | 5.3%(+1.72)#6,552 |
| 3. | 02740 | 6.1% | 4.6%(+1.45)#109 | 5.3%(+0.774)#9,147 |
| 4. | 02745 | 5.7% | 4.6%(+1.05)#138 | 5.3%(+0.378)#10,472 |
1
Common Questions
What are the Top 3 Zip Codes with the Highest Percentage of Population Employed in Food Preparation & Serving in New Bedford, MA?
Top 3 Zip Codes with the Highest Percentage of Population Employed in Food Preparation & Serving in New Bedford, MA are:
What zip code has the Highest Percentage of Population Employed in Food Preparation & Serving in New Bedford, MA?
02744 has the Highest Percentage of Population Employed in Food Preparation & Serving in New Bedford, MA with 7.9%.
What is the Percentage of Population Employed in Food Preparation & Serving in New Bedford, MA?
Percentage of Population Employed in Food Preparation & Serving in New Bedford is 6.3%.
What is the Percentage of Population Employed in Food Preparation & Serving in Massachusetts?
Percentage of Population Employed in Food Preparation & Serving in Massachusetts is 4.6%.
What is the Percentage of Population Employed in Food Preparation & Serving in the United States?
Percentage of Population Employed in Food Preparation & Serving in the United States is 5.3%.