White Island Shores, MA Map & Demographics
White Island Shores Map
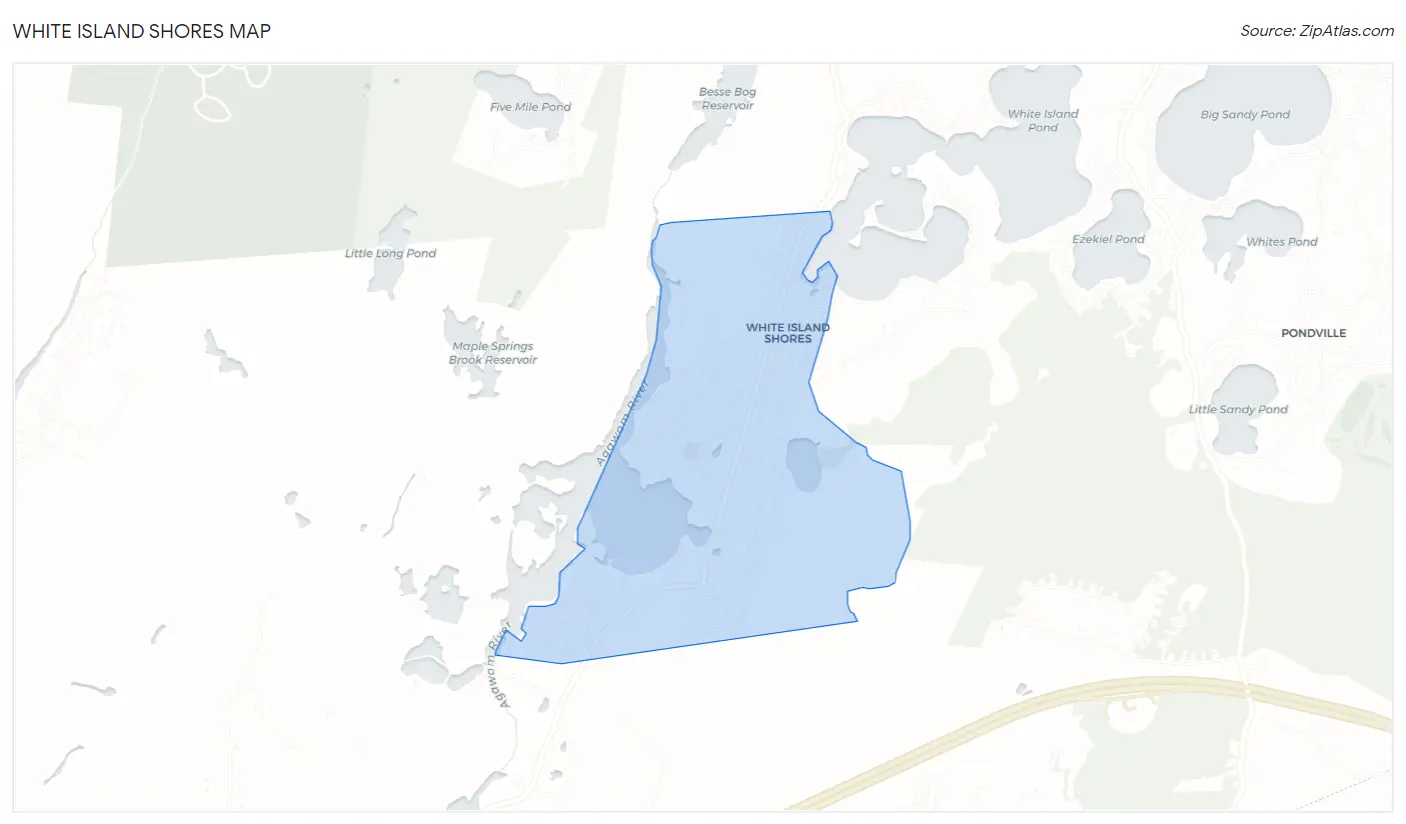
White Island Shores Overview
$38,069
PER CAPITA INCOME
$94,167
AVG FAMILY INCOME
$103,372
AVG HOUSEHOLD INCOME
0.26
INEQUALITY / GINI INDEX
2,223
TOTAL POPULATION
1,119
MALE POPULATION
1,104
FEMALE POPULATION
101.36
MALES / 100 FEMALES
98.66
FEMALES / 100 MALES
39.3
MEDIAN AGE
3.2
AVG FAMILY SIZE
2.9
AVG HOUSEHOLD SIZE
1,184
LABOR FORCE [ PEOPLE ]
64.8%
PERCENT IN LABOR FORCE
5.4%
UNEMPLOYMENT RATE
Income in White Island Shores
Income Overview in White Island Shores
Per Capita Income in White Island Shores is $38,069, while median incomes of families and households are $94,167 and $103,372 respectively.
| Characteristic | Number | Measure |
| Per Capita Income | 2,223 | $38,069 |
| Median Family Income | 606 | $94,167 |
| Mean Family Income | 606 | $101,552 |
| Median Household Income | 764 | $103,372 |
| Mean Household Income | 764 | $106,744 |
| Income Deficit | 606 | $0 |
| Wage / Income Gap (%) | 2,223 | 0.00% |
| Wage / Income Gap ($) | 2,223 | 100.00¢ per $1 |
| Gini / Inequality Index | 2,223 | 0.26 |
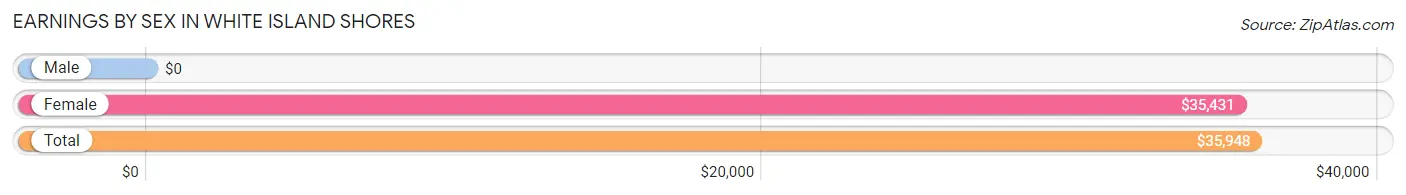
Earnings by Sex in White Island Shores
| Sex | Number | Average Earnings |
| Male | 752 (56.6%) | $0 |
| Female | 576 (43.4%) | $35,431 |
| Total | 1,328 (100.0%) | $35,948 |
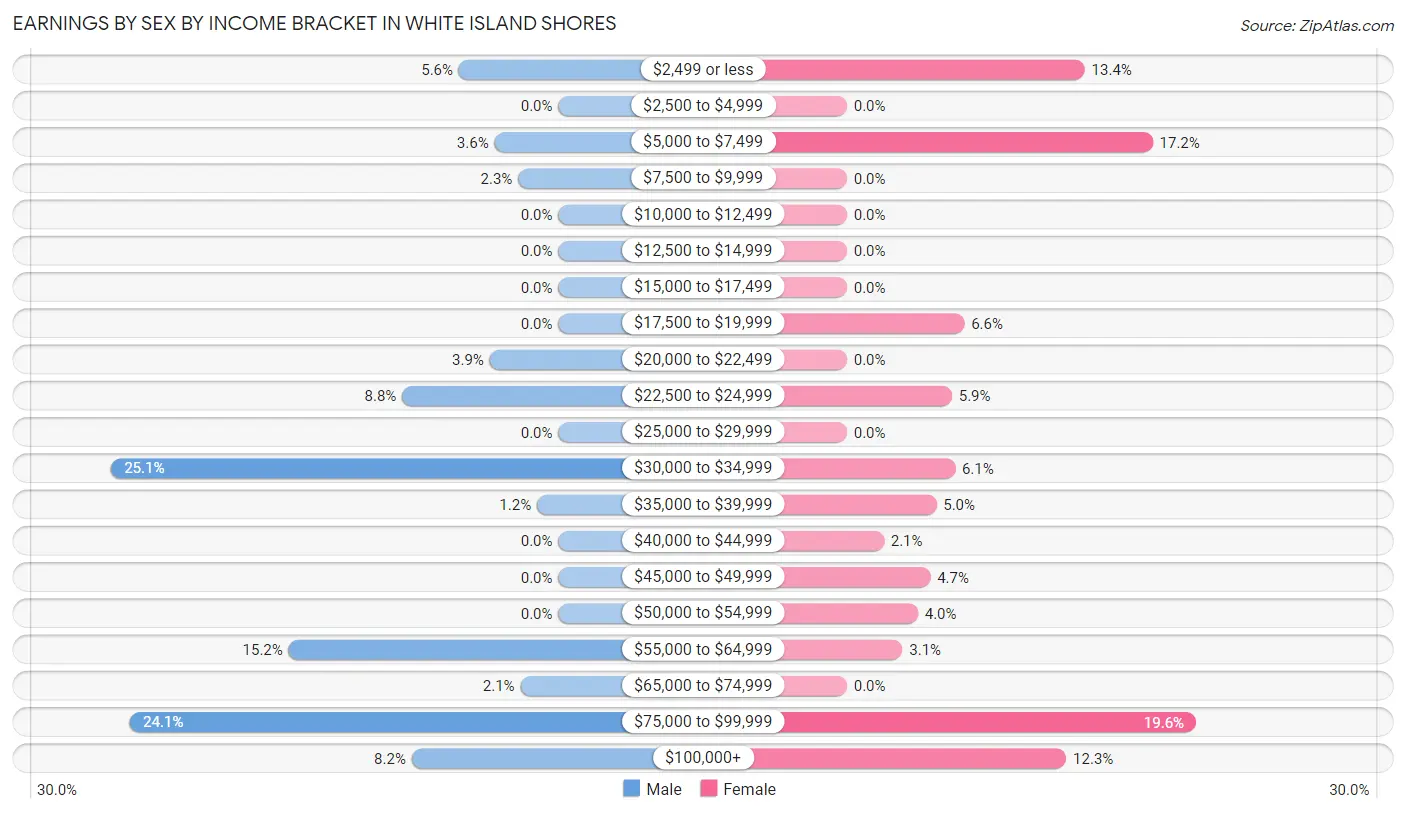
Earnings by Sex by Income Bracket in White Island Shores
The most common earnings brackets in White Island Shores are $30,000 to $34,999 for men (189 | 25.1%) and $75,000 to $99,999 for women (113 | 19.6%).
| Income | Male | Female |
| $2,499 or less | 42 (5.6%) | 77 (13.4%) |
| $2,500 to $4,999 | 0 (0.0%) | 0 (0.0%) |
| $5,000 to $7,499 | 27 (3.6%) | 99 (17.2%) |
| $7,500 to $9,999 | 17 (2.3%) | 0 (0.0%) |
| $10,000 to $12,499 | 0 (0.0%) | 0 (0.0%) |
| $12,500 to $14,999 | 0 (0.0%) | 0 (0.0%) |
| $15,000 to $17,499 | 0 (0.0%) | 0 (0.0%) |
| $17,500 to $19,999 | 0 (0.0%) | 38 (6.6%) |
| $20,000 to $22,499 | 29 (3.9%) | 0 (0.0%) |
| $22,500 to $24,999 | 66 (8.8%) | 34 (5.9%) |
| $25,000 to $29,999 | 0 (0.0%) | 0 (0.0%) |
| $30,000 to $34,999 | 189 (25.1%) | 35 (6.1%) |
| $35,000 to $39,999 | 9 (1.2%) | 29 (5.0%) |
| $40,000 to $44,999 | 0 (0.0%) | 12 (2.1%) |
| $45,000 to $49,999 | 0 (0.0%) | 27 (4.7%) |
| $50,000 to $54,999 | 0 (0.0%) | 23 (4.0%) |
| $55,000 to $64,999 | 114 (15.2%) | 18 (3.1%) |
| $65,000 to $74,999 | 16 (2.1%) | 0 (0.0%) |
| $75,000 to $99,999 | 181 (24.1%) | 113 (19.6%) |
| $100,000+ | 62 (8.2%) | 71 (12.3%) |
| Total | 752 (100.0%) | 576 (100.0%) |
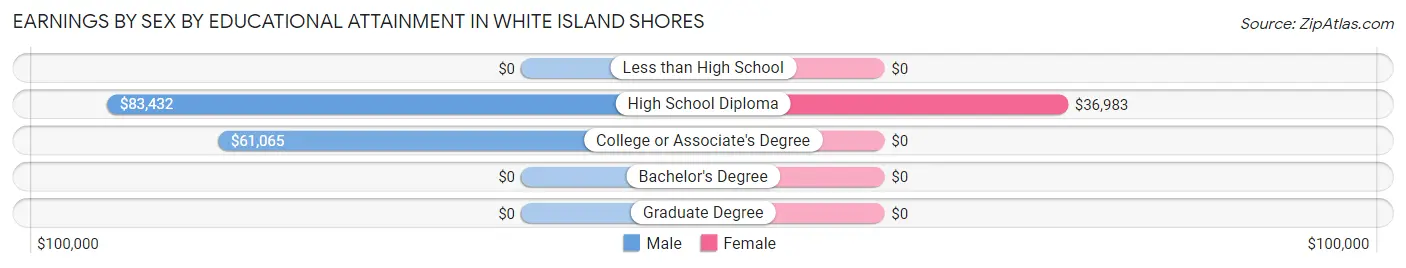
Earnings by Sex by Educational Attainment in White Island Shores
Average earnings in White Island Shores are $61,548 for men and $45,139 for women, a difference of 26.7%. Men with an educational attainment of high school diploma enjoy the highest average annual earnings of $83,432, while those with college or associate's degree education earn the least with $61,065. Women with an educational attainment of high school diploma earn the most with the average annual earnings of $36,983, while those with high school diploma education have the smallest earnings of $36,983.
| Educational Attainment | Male Income | Female Income |
| Less than High School | - | - |
| High School Diploma | $83,432 | $36,983 |
| College or Associate's Degree | $61,065 | $0 |
| Bachelor's Degree | - | - |
| Graduate Degree | - | - |
| Total | $61,548 | $45,139 |
Family Income in White Island Shores
Family Income Brackets in White Island Shores
According to the White Island Shores family income data, there are 149 families falling into the $50,000 to $74,999 income range, which is the most common income bracket and makes up 24.6% of all families.
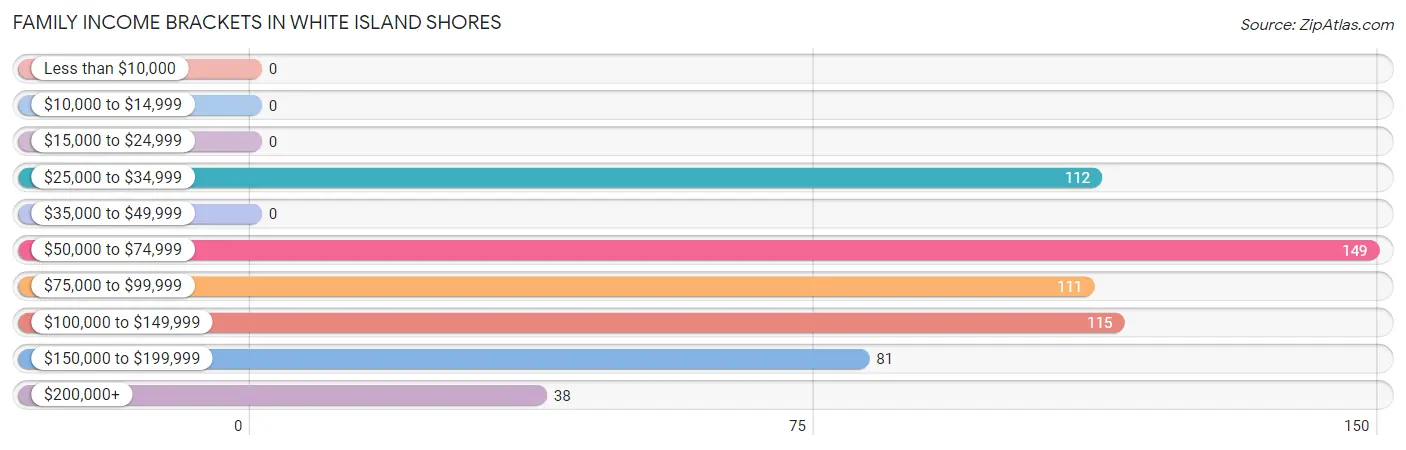
| Income Bracket | # Families | % Families |
| Less than $10,000 | 0 | 0.0% |
| $10,000 to $14,999 | 0 | 0.0% |
| $15,000 to $24,999 | 0 | 0.0% |
| $25,000 to $34,999 | 112 | 18.5% |
| $35,000 to $49,999 | 0 | 0.0% |
| $50,000 to $74,999 | 149 | 24.6% |
| $75,000 to $99,999 | 111 | 18.3% |
| $100,000 to $149,999 | 115 | 19.0% |
| $150,000 to $199,999 | 81 | 13.4% |
| $200,000+ | 38 | 6.3% |
Family Income by Famaliy Size in White Island Shores
2-person families (260 | 42.9%) account for the highest median family income in White Island Shores with $96,563 per family, while 2-person families (260 | 42.9%) have the highest median income of $48,282 per family member.
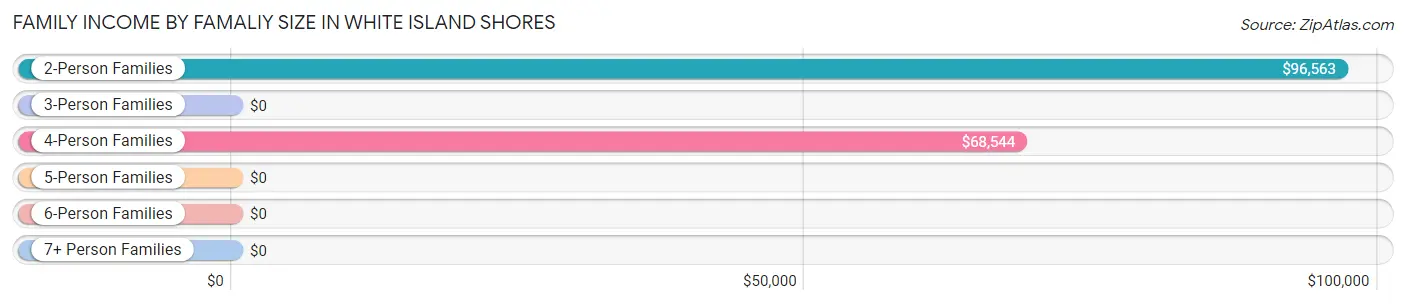
| Income Bracket | # Families | Median Income |
| 2-Person Families | 260 (42.9%) | $96,563 |
| 3-Person Families | 122 (20.1%) | $0 |
| 4-Person Families | 144 (23.8%) | $68,544 |
| 5-Person Families | 62 (10.2%) | $0 |
| 6-Person Families | 18 (3.0%) | $0 |
| 7+ Person Families | 0 (0.0%) | $0 |
| Total | 606 (100.0%) | $94,167 |
Family Income by Number of Earners in White Island Shores
The median family income in White Island Shores is $94,167, with families comprising no earners (63) having the highest median family income of $141,033, while families with 1 earner (228) have the lowest median family income of $55,278, accounting for 10.4% and 37.6% of families, respectively.
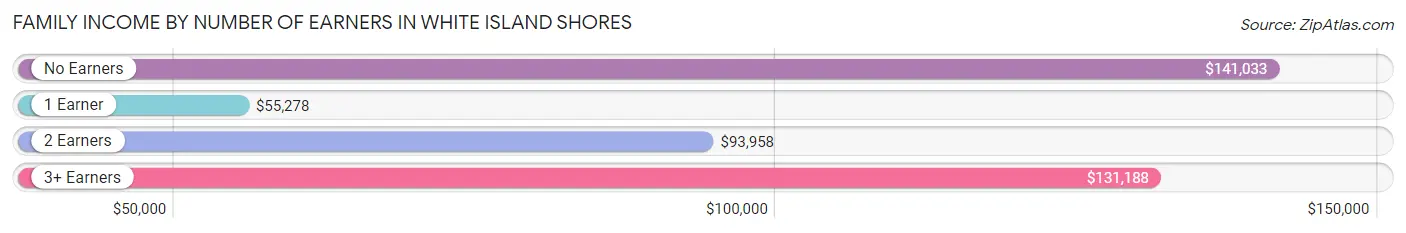
| Number of Earners | # Families | Median Income |
| No Earners | 63 (10.4%) | $141,033 |
| 1 Earner | 228 (37.6%) | $55,278 |
| 2 Earners | 187 (30.9%) | $93,958 |
| 3+ Earners | 128 (21.1%) | $131,188 |
| Total | 606 (100.0%) | $94,167 |
Household Income in White Island Shores
Household Income Brackets in White Island Shores
With 278 households falling in the category, the $100,000 to $149,999 income range is the most frequent in White Island Shores, accounting for 36.4% of all households.
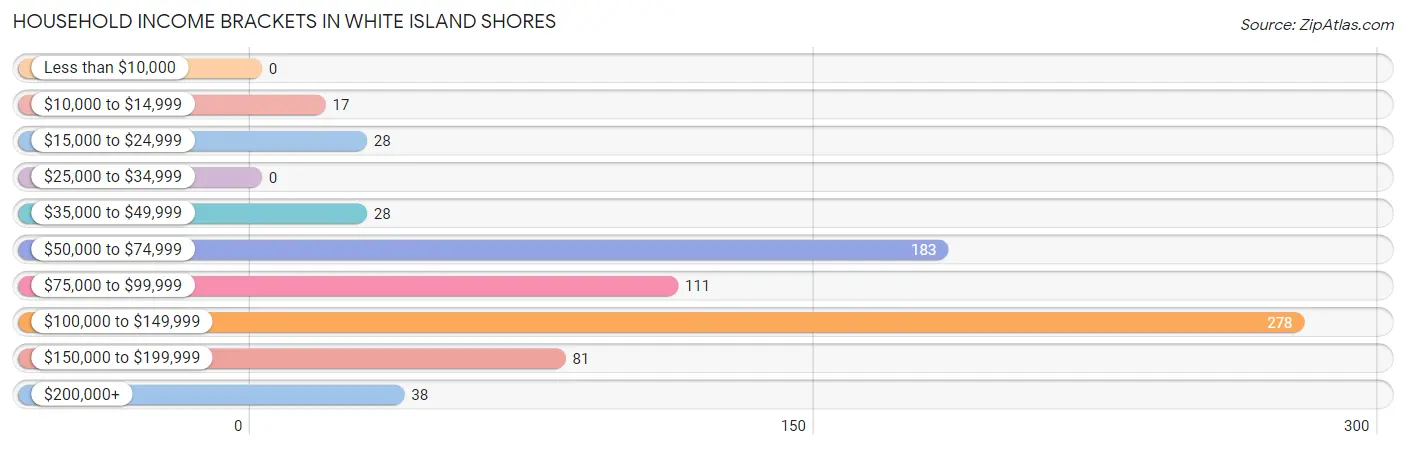
| Income Bracket | # Households | % Households |
| Less than $10,000 | 0 | 0.0% |
| $10,000 to $14,999 | 17 | 2.2% |
| $15,000 to $24,999 | 28 | 3.7% |
| $25,000 to $34,999 | 0 | 0.0% |
| $35,000 to $49,999 | 28 | 3.7% |
| $50,000 to $74,999 | 183 | 24.0% |
| $75,000 to $99,999 | 111 | 14.5% |
| $100,000 to $149,999 | 278 | 36.4% |
| $150,000 to $199,999 | 81 | 10.6% |
| $200,000+ | 38 | 5.0% |
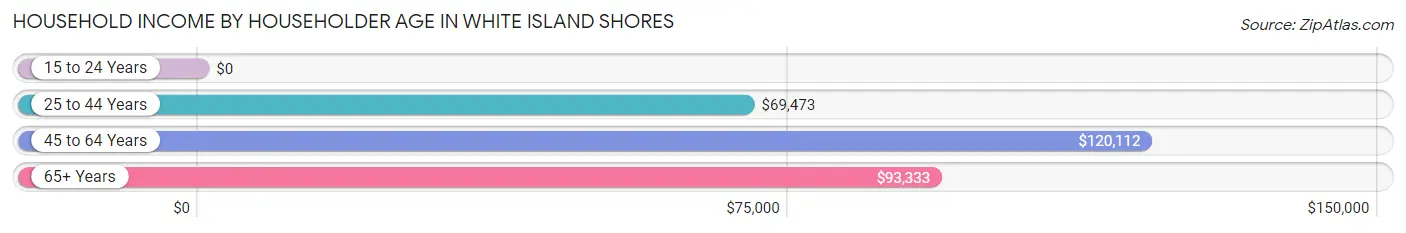
Household Income by Householder Age in White Island Shores
The median household income in White Island Shores is $103,372, with the highest median household income of $120,112 found in the 45 to 64 years age bracket for the primary householder. A total of 417 households (54.6%) fall into this category.
| Income Bracket | # Households | Median Income |
| 15 to 24 Years | 0 (0.0%) | $0 |
| 25 to 44 Years | 197 (25.8%) | $69,473 |
| 45 to 64 Years | 417 (54.6%) | $120,112 |
| 65+ Years | 150 (19.6%) | $93,333 |
| Total | 764 (100.0%) | $103,372 |
Poverty in White Island Shores
Income Below Poverty by Sex and Age in White Island Shores
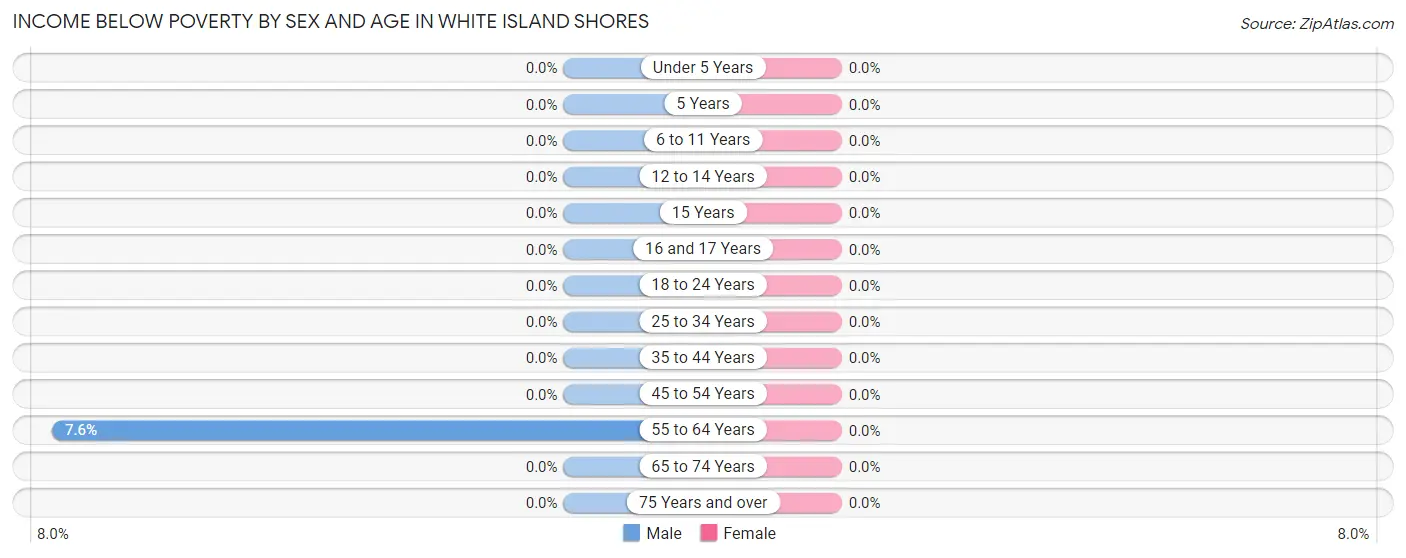
| Age Bracket | Male | Female |
| Under 5 Years | 0 (0.0%) | 0 (0.0%) |
| 5 Years | 0 (0.0%) | 0 (0.0%) |
| 6 to 11 Years | 0 (0.0%) | 0 (0.0%) |
| 12 to 14 Years | 0 (0.0%) | 0 (0.0%) |
| 15 Years | 0 (0.0%) | 0 (0.0%) |
| 16 and 17 Years | 0 (0.0%) | 0 (0.0%) |
| 18 to 24 Years | 0 (0.0%) | 0 (0.0%) |
| 25 to 34 Years | 0 (0.0%) | 0 (0.0%) |
| 35 to 44 Years | 0 (0.0%) | 0 (0.0%) |
| 45 to 54 Years | 0 (0.0%) | 0 (0.0%) |
| 55 to 64 Years | 17 (7.6%) | 0 (0.0%) |
| 65 to 74 Years | 0 (0.0%) | 0 (0.0%) |
| 75 Years and over | 0 (0.0%) | 0 (0.0%) |
| Total | 17 (1.5%) | 0 (0.0%) |
Income Above Poverty by Sex and Age in White Island Shores
According to the poverty statistics in White Island Shores, males aged under 5 years and females aged under 5 years are the age groups that are most secure financially, with 100.0% of males and 100.0% of females in these age groups living above the poverty line.
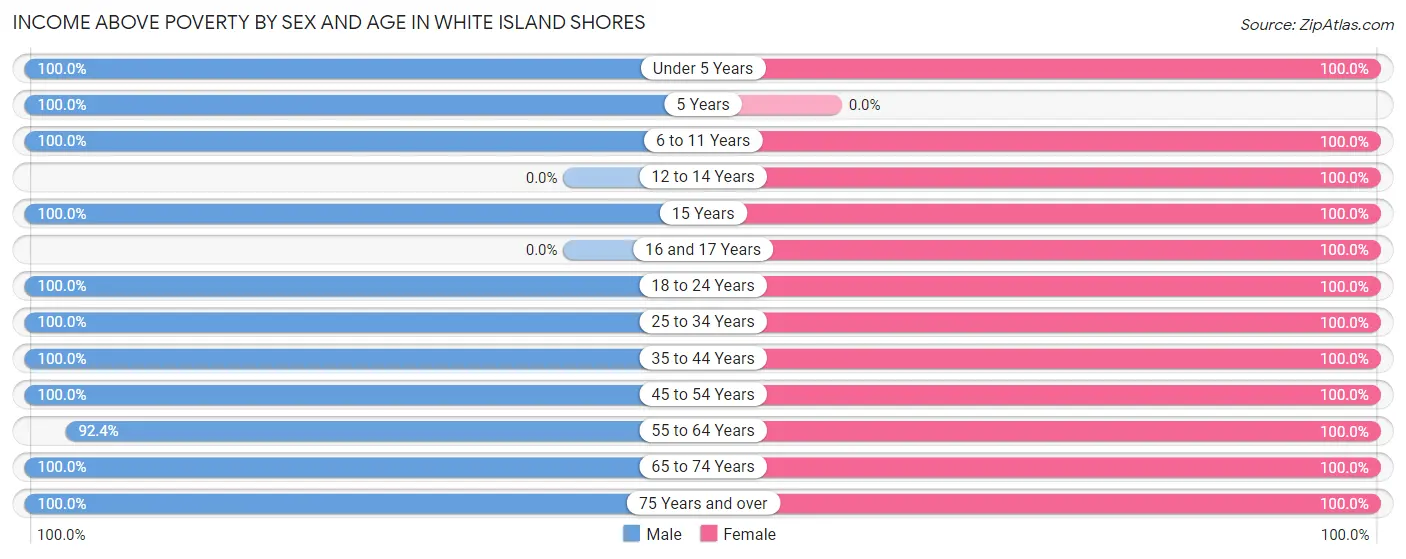
| Age Bracket | Male | Female |
| Under 5 Years | 67 (100.0%) | 26 (100.0%) |
| 5 Years | 31 (100.0%) | 0 (0.0%) |
| 6 to 11 Years | 43 (100.0%) | 96 (100.0%) |
| 12 to 14 Years | 0 (0.0%) | 66 (100.0%) |
| 15 Years | 42 (100.0%) | 25 (100.0%) |
| 16 and 17 Years | 0 (0.0%) | 37 (100.0%) |
| 18 to 24 Years | 167 (100.0%) | 38 (100.0%) |
| 25 to 34 Years | 90 (100.0%) | 213 (100.0%) |
| 35 to 44 Years | 132 (100.0%) | 81 (100.0%) |
| 45 to 54 Years | 184 (100.0%) | 155 (100.0%) |
| 55 to 64 Years | 207 (92.4%) | 245 (100.0%) |
| 65 to 74 Years | 75 (100.0%) | 51 (100.0%) |
| 75 Years and over | 64 (100.0%) | 71 (100.0%) |
| Total | 1,102 (98.5%) | 1,104 (100.0%) |
Income Below Poverty Among Married-Couple Families in White Island Shores
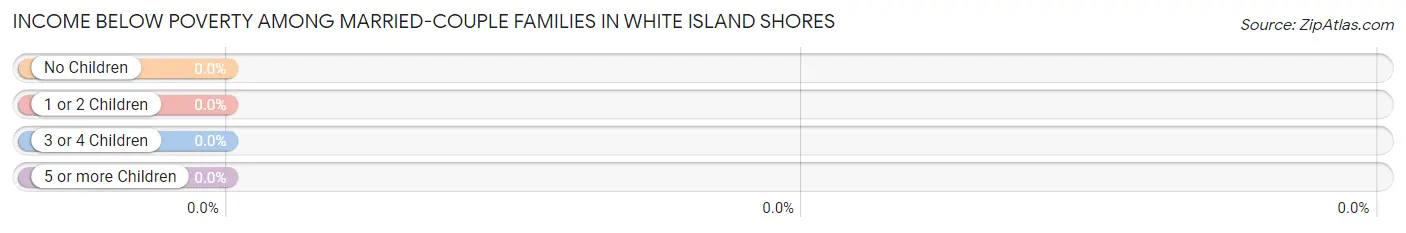
| Children | Above Poverty | Below Poverty |
| No Children | 243 (100.0%) | 0 (0.0%) |
| 1 or 2 Children | 137 (100.0%) | 0 (0.0%) |
| 3 or 4 Children | 38 (100.0%) | 0 (0.0%) |
| 5 or more Children | 0 (0.0%) | 0 (0.0%) |
| Total | 418 (100.0%) | 0 (0.0%) |
Income Below Poverty Among Single-Parent Households in White Island Shores
| Children | Single Father | Single Mother |
| No Children | 0 (0.0%) | 0 (0.0%) |
| 1 or 2 Children | 0 (0.0%) | 0 (0.0%) |
| 3 or 4 Children | 0 (0.0%) | 0 (0.0%) |
| 5 or more Children | 0 (0.0%) | 0 (0.0%) |
| Total | 0 (0.0%) | 0 (0.0%) |
Income Below Poverty Among Married-Couple vs Single-Parent Households in White Island Shores
| Children | Married-Couple Families | Single-Parent Households |
| No Children | 0 (0.0%) | 0 (0.0%) |
| 1 or 2 Children | 0 (0.0%) | 0 (0.0%) |
| 3 or 4 Children | 0 (0.0%) | 0 (0.0%) |
| 5 or more Children | 0 (0.0%) | 0 (0.0%) |
| Total | 0 (0.0%) | 0 (0.0%) |
Race in White Island Shores
The most populous races in White Island Shores are White / Caucasian (1,885 | 84.8%), Hispanic or Latino (187 | 8.4%), and Native / Alaskan (173 | 7.8%).
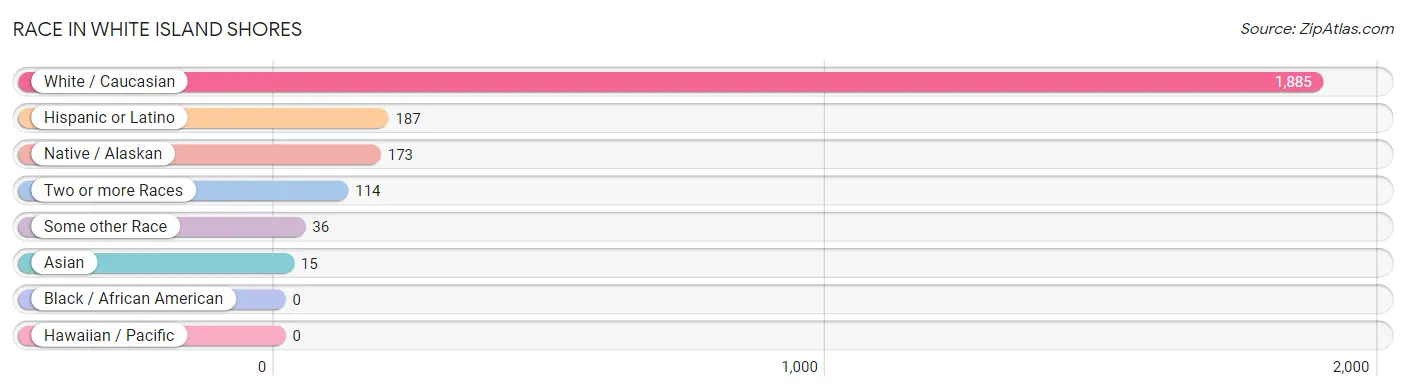
| Race | # Population | % Population |
| Asian | 15 | 0.7% |
| Black / African American | 0 | 0.0% |
| Hawaiian / Pacific | 0 | 0.0% |
| Hispanic or Latino | 187 | 8.4% |
| Native / Alaskan | 173 | 7.8% |
| White / Caucasian | 1,885 | 84.8% |
| Two or more Races | 114 | 5.1% |
| Some other Race | 36 | 1.6% |
| Total | 2,223 | 100.0% |
Ancestry in White Island Shores
The most populous ancestries reported in White Island Shores are English (619 | 27.9%), Irish (612 | 27.5%), Italian (305 | 13.7%), American (201 | 9.0%), and Puerto Rican (187 | 8.4%), together accounting for 86.6% of all White Island Shores residents.
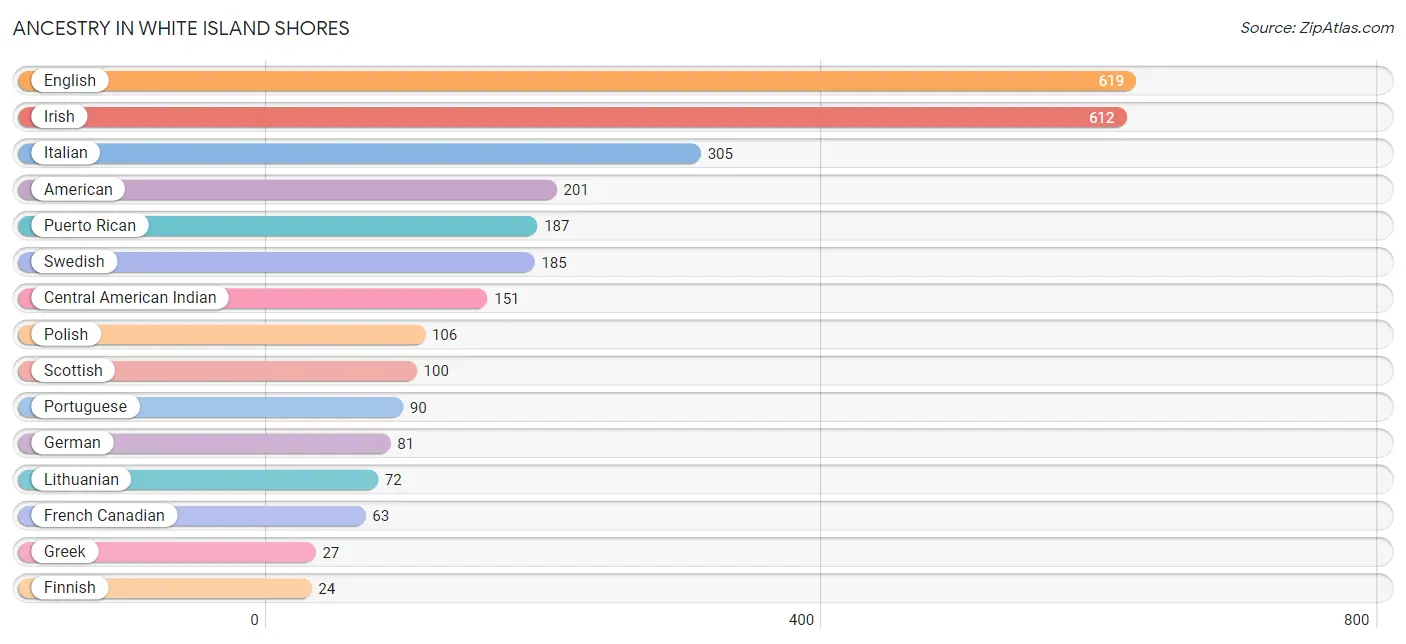
| Ancestry | # Population | % Population |
| American | 201 | 9.0% |
| Arab | 17 | 0.8% |
| Cape Verdean | 4 | 0.2% |
| Central American Indian | 151 | 6.8% |
| English | 619 | 27.9% |
| Finnish | 24 | 1.1% |
| French | 23 | 1.0% |
| French Canadian | 63 | 2.8% |
| German | 81 | 3.6% |
| Greek | 27 | 1.2% |
| Indian (Asian) | 15 | 0.7% |
| Irish | 612 | 27.5% |
| Italian | 305 | 13.7% |
| Lebanese | 17 | 0.8% |
| Lithuanian | 72 | 3.2% |
| Northern European | 22 | 1.0% |
| Polish | 106 | 4.8% |
| Portuguese | 90 | 4.1% |
| Puerto Rican | 187 | 8.4% |
| Scottish | 100 | 4.5% |
| Subsaharan African | 4 | 0.2% |
| Swedish | 185 | 8.3% |
| Ukrainian | 17 | 0.8% | View All 23 Rows |
Immigrants in White Island Shores
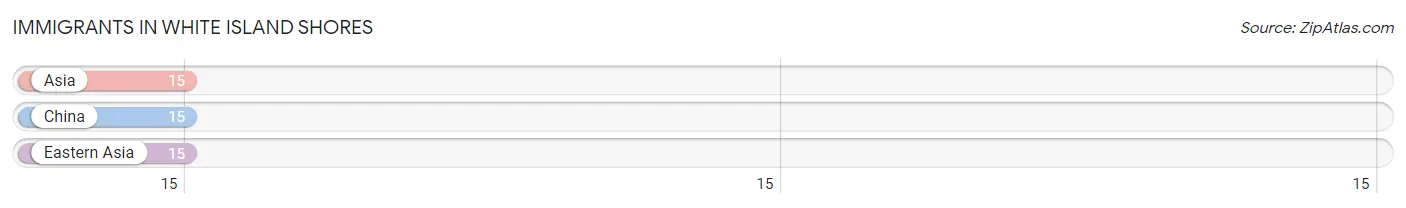
The most numerous immigrant groups reported in White Island Shores came from Asia (15 | 0.7%), China (15 | 0.7%), and Eastern Asia (15 | 0.7%), together accounting for 2.0% of all White Island Shores residents.
| Immigration Origin | # Population | % Population |
| Asia | 15 | 0.7% |
| China | 15 | 0.7% |
| Eastern Asia | 15 | 0.7% | View All 3 Rows |
Sex and Age in White Island Shores
Sex and Age in White Island Shores
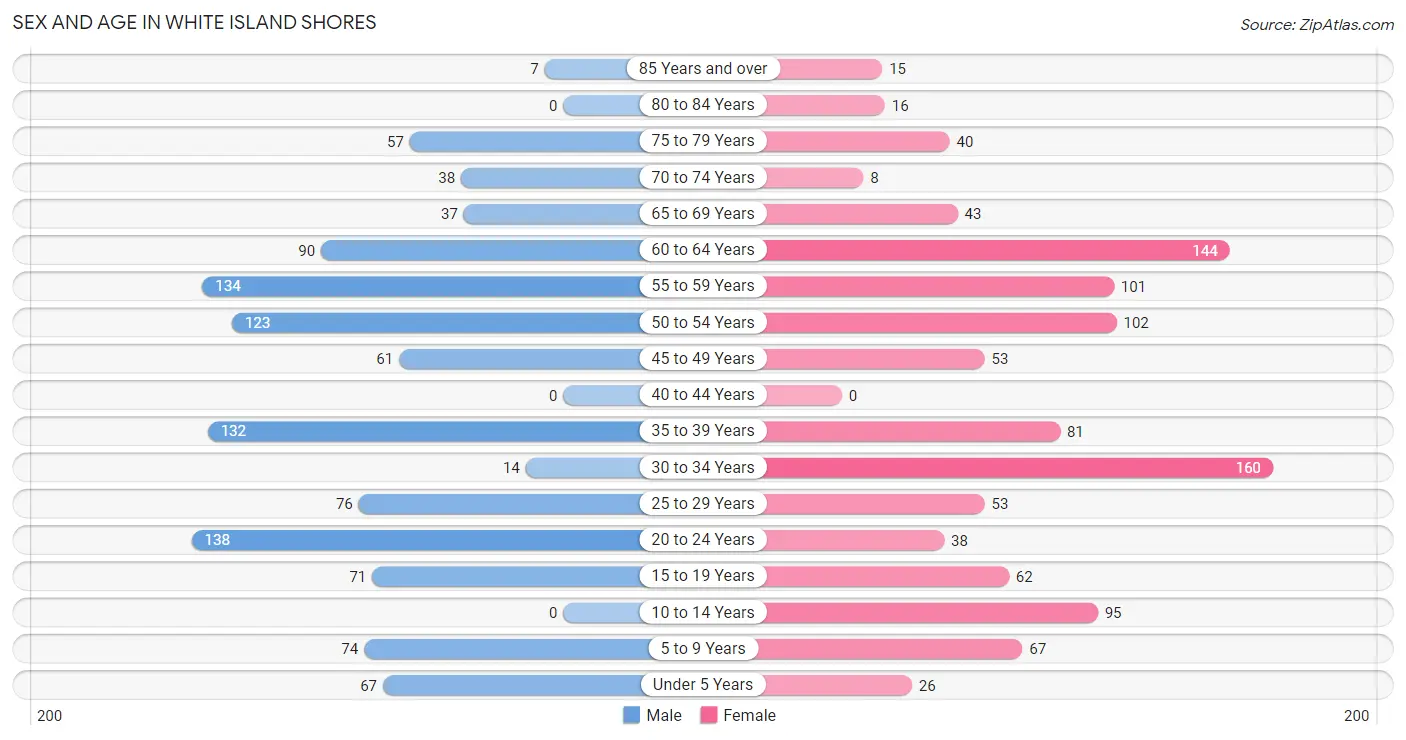
The most populous age groups in White Island Shores are 20 to 24 Years (138 | 12.3%) for men and 30 to 34 Years (160 | 14.5%) for women.
| Age Bracket | Male | Female |
| Under 5 Years | 67 (6.0%) | 26 (2.4%) |
| 5 to 9 Years | 74 (6.6%) | 67 (6.1%) |
| 10 to 14 Years | 0 (0.0%) | 95 (8.6%) |
| 15 to 19 Years | 71 (6.3%) | 62 (5.6%) |
| 20 to 24 Years | 138 (12.3%) | 38 (3.4%) |
| 25 to 29 Years | 76 (6.8%) | 53 (4.8%) |
| 30 to 34 Years | 14 (1.3%) | 160 (14.5%) |
| 35 to 39 Years | 132 (11.8%) | 81 (7.3%) |
| 40 to 44 Years | 0 (0.0%) | 0 (0.0%) |
| 45 to 49 Years | 61 (5.4%) | 53 (4.8%) |
| 50 to 54 Years | 123 (11.0%) | 102 (9.2%) |
| 55 to 59 Years | 134 (12.0%) | 101 (9.1%) |
| 60 to 64 Years | 90 (8.0%) | 144 (13.0%) |
| 65 to 69 Years | 37 (3.3%) | 43 (3.9%) |
| 70 to 74 Years | 38 (3.4%) | 8 (0.7%) |
| 75 to 79 Years | 57 (5.1%) | 40 (3.6%) |
| 80 to 84 Years | 0 (0.0%) | 16 (1.5%) |
| 85 Years and over | 7 (0.6%) | 15 (1.4%) |
| Total | 1,119 (100.0%) | 1,104 (100.0%) |
Families and Households in White Island Shores
Median Family Size in White Island Shores
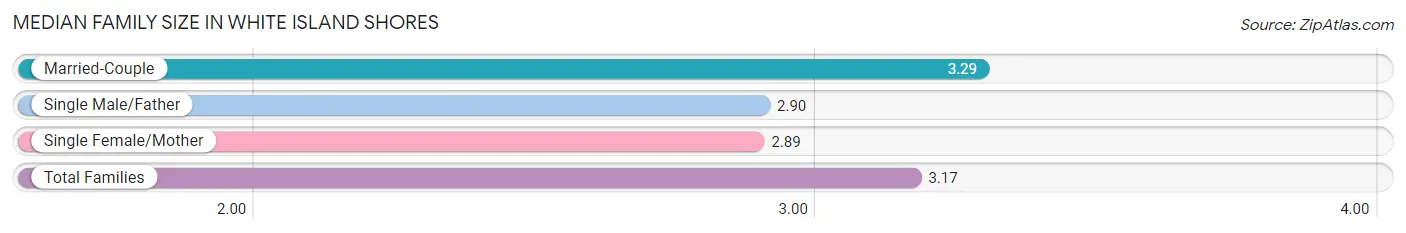
The median family size in White Island Shores is 3.17 persons per family, with married-couple families (418 | 69.0%) accounting for the largest median family size of 3.29 persons per family. On the other hand, single female/mother families (116 | 19.1%) represent the smallest median family size with 2.89 persons per family.
| Family Type | # Families | Family Size |
| Married-Couple | 418 (69.0%) | 3.29 |
| Single Male/Father | 72 (11.9%) | 2.90 |
| Single Female/Mother | 116 (19.1%) | 2.89 |
| Total Families | 606 (100.0%) | 3.17 |
Median Household Size in White Island Shores
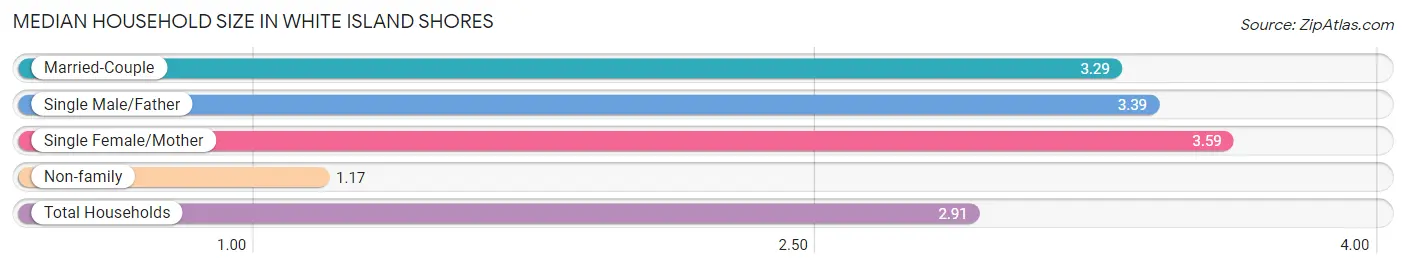
The median household size in White Island Shores is 2.91 persons per household, with single female/mother households (116 | 15.2%) accounting for the largest median household size of 3.59 persons per household. non-family households (158 | 20.7%) represent the smallest median household size with 1.17 persons per household.
| Household Type | # Households | Household Size |
| Married-Couple | 418 (54.7%) | 3.29 |
| Single Male/Father | 72 (9.4%) | 3.39 |
| Single Female/Mother | 116 (15.2%) | 3.59 |
| Non-family | 158 (20.7%) | 1.17 |
| Total Households | 764 (100.0%) | 2.91 |
Household Size by Marriage Status in White Island Shores
Out of a total of 764 households in White Island Shores, 606 (79.3%) are family households, while 158 (20.7%) are nonfamily households. The most numerous type of family households are 2-person households, comprising 260, and the most common type of nonfamily households are 1-person households, comprising 131.
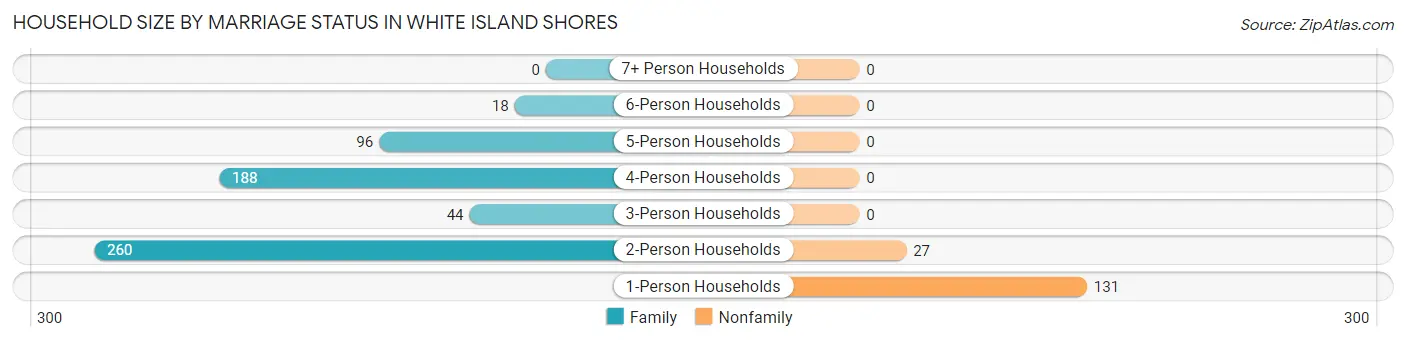
| Household Size | Family Households | Nonfamily Households |
| 1-Person Households | - | 131 (17.2%) |
| 2-Person Households | 260 (34.0%) | 27 (3.5%) |
| 3-Person Households | 44 (5.8%) | 0 (0.0%) |
| 4-Person Households | 188 (24.6%) | 0 (0.0%) |
| 5-Person Households | 96 (12.6%) | 0 (0.0%) |
| 6-Person Households | 18 (2.4%) | 0 (0.0%) |
| 7+ Person Households | 0 (0.0%) | 0 (0.0%) |
| Total | 606 (79.3%) | 158 (20.7%) |
Female Fertility in White Island Shores
Fertility by Age in White Island Shores
| Age Bracket | Women with Births | Births / 1,000 Women |
| 15 to 19 years | 0 (0.0%) | 0.0 |
| 20 to 34 years | 0 (0.0%) | 0.0 |
| 35 to 50 years | 0 (0.0%) | 0.0 |
| Total | 0 (0.0%) | 0.0 |
Fertility by Age by Marriage Status in White Island Shores
| Age Bracket | Married | Unmarried |
| 15 to 19 years | 0 (0.0%) | 0 (0.0%) |
| 20 to 34 years | 0 (0.0%) | 0 (0.0%) |
| 35 to 50 years | 0 (0.0%) | 0 (0.0%) |
| Total | 0 (0.0%) | 0 (0.0%) |
Fertility by Education in White Island Shores
| Educational Attainment | Women with Births | Births / 1,000 Women |
| Less than High School | 0 (0.0%) | 0.0 |
| High School Diploma | 0 (0.0%) | 0.0 |
| College or Associate's Degree | 0 (0.0%) | 0.0 |
| Bachelor's Degree | 0 (0.0%) | 0.0 |
| Graduate Degree | 0 (0.0%) | 0.0 |
| Total | 0 (0.0%) | 0.0 |
Fertility by Education by Marriage Status in White Island Shores
| Educational Attainment | Married | Unmarried |
| Less than High School | 0 (0.0%) | 0 (0.0%) |
| High School Diploma | 0 (0.0%) | 0 (0.0%) |
| College or Associate's Degree | 0 (0.0%) | 0 (0.0%) |
| Bachelor's Degree | 0 (0.0%) | 0 (0.0%) |
| Graduate Degree | 0 (0.0%) | 0 (0.0%) |
| Total | 0 (0.0%) | 0 (0.0%) |
Employment Characteristics in White Island Shores
Employment by Class of Employer in White Island Shores
Among the 1,076 employed individuals in White Island Shores, private company employees (795 | 73.9%), not-for-profit organizations (73 | 6.8%), and federal government employees (68 | 6.3%) make up the most common classes of employment.
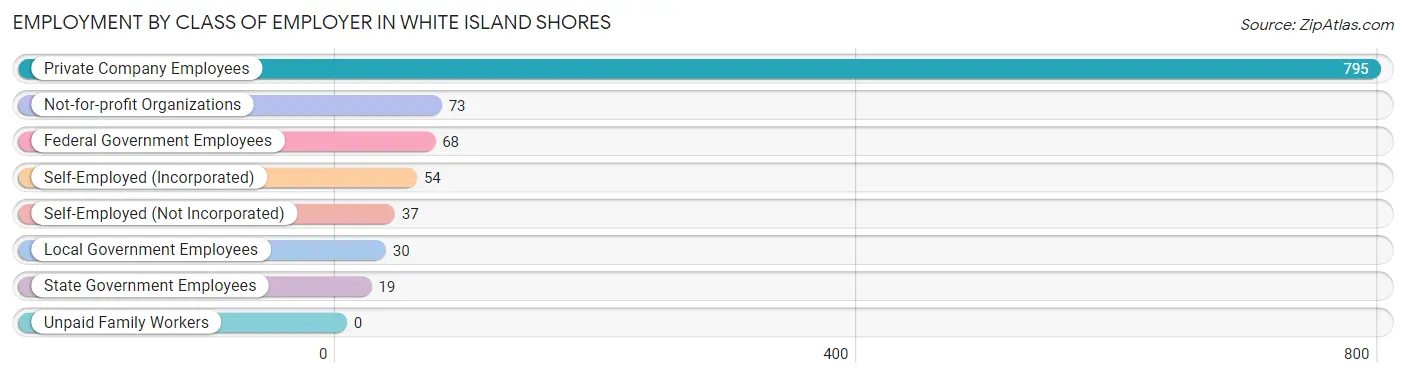
| Employer Class | # Employees | % Employees |
| Private Company Employees | 795 | 73.9% |
| Self-Employed (Incorporated) | 54 | 5.0% |
| Self-Employed (Not Incorporated) | 37 | 3.4% |
| Not-for-profit Organizations | 73 | 6.8% |
| Local Government Employees | 30 | 2.8% |
| State Government Employees | 19 | 1.8% |
| Federal Government Employees | 68 | 6.3% |
| Unpaid Family Workers | 0 | 0.0% |
| Total | 1,076 | 100.0% |
Employment Status by Age in White Island Shores
According to the labor force statistics for White Island Shores, out of the total population over 16 years of age (1,827), 64.8% or 1,184 individuals are in the labor force, with 5.4% or 64 of them unemployed. The age group with the highest labor force participation rate is 20 to 24 years, with 100.0% or 176 individuals in the labor force. Within the labor force, the 30 to 34 years age range has the highest percentage of unemployed individuals, with 35.0% or 56 of them being unemployed.
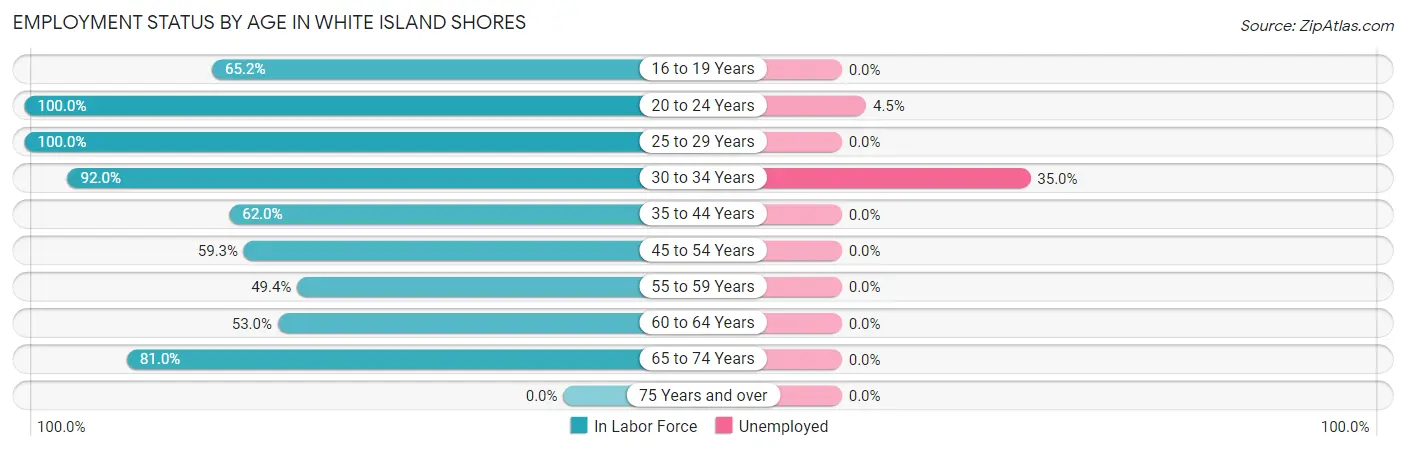
| Age Bracket | In Labor Force | Unemployed |
| 16 to 19 Years | 43 (65.2%) | 0 (0.0%) |
| 20 to 24 Years | 176 (100.0%) | 8 (4.5%) |
| 25 to 29 Years | 129 (100.0%) | 0 (0.0%) |
| 30 to 34 Years | 160 (92.0%) | 56 (35.0%) |
| 35 to 44 Years | 132 (62.0%) | 0 (0.0%) |
| 45 to 54 Years | 201 (59.3%) | 0 (0.0%) |
| 55 to 59 Years | 116 (49.4%) | 0 (0.0%) |
| 60 to 64 Years | 124 (53.0%) | 0 (0.0%) |
| 65 to 74 Years | 102 (81.0%) | 0 (0.0%) |
| 75 Years and over | 0 (0.0%) | 0 (0.0%) |
| Total | 1,184 (64.8%) | 64 (5.4%) |
Employment Status by Educational Attainment in White Island Shores
According to labor force statistics for White Island Shores, 65.1% of individuals (862) out of the total population between 25 and 64 years of age (1,324) are in the labor force, with 6.5% or 56 of them being unemployed. The group with the highest labor force participation rate are those with the educational attainment of less than high school, with 77.0% or 57 individuals in the labor force. Within the labor force, individuals with college / associate degree education have the highest percentage of unemployment, with 13.3% or 56 of them being unemployed.
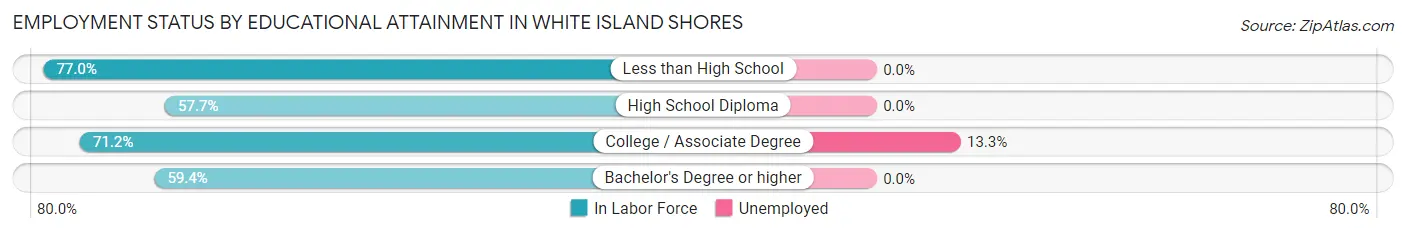
| Educational Attainment | In Labor Force | Unemployed |
| Less than High School | 57 (77.0%) | 0 (0.0%) |
| High School Diploma | 255 (57.7%) | 0 (0.0%) |
| College / Associate Degree | 421 (71.2%) | 79 (13.3%) |
| Bachelor's Degree or higher | 129 (59.4%) | 0 (0.0%) |
| Total | 862 (65.1%) | 86 (6.5%) |
Employment Occupations by Sex in White Island Shores
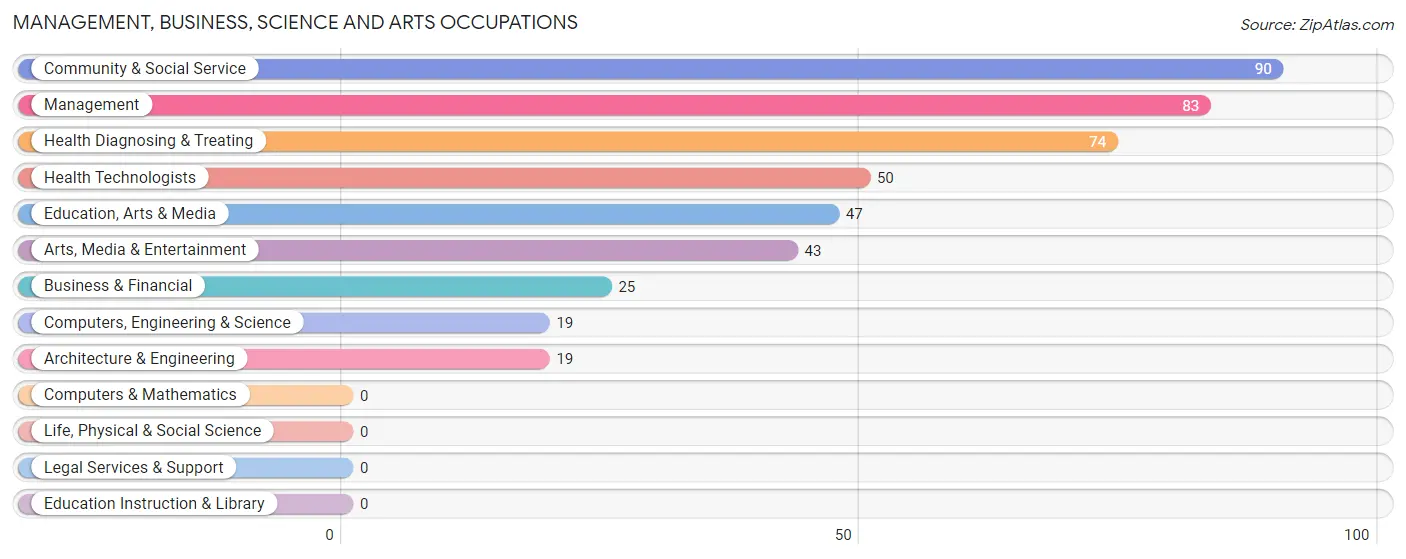
Management, Business, Science and Arts Occupations
The most common Management, Business, Science and Arts occupations in White Island Shores are Community & Social Service (90 | 8.0%), Management (83 | 7.4%), Health Diagnosing & Treating (74 | 6.6%), Health Technologists (50 | 4.5%), and Education, Arts & Media (47 | 4.2%).
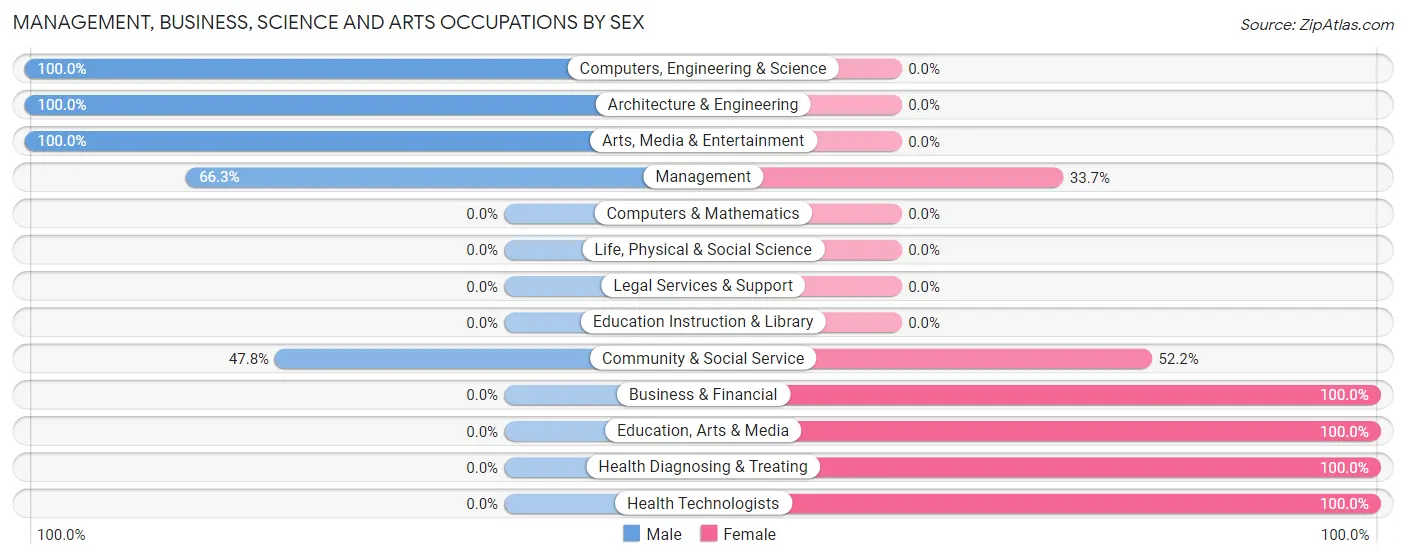
Management, Business, Science and Arts Occupations by Sex
Within the Management, Business, Science and Arts occupations in White Island Shores, the most male-oriented occupations are Computers, Engineering & Science (100.0%), Architecture & Engineering (100.0%), and Arts, Media & Entertainment (100.0%), while the most female-oriented occupations are Business & Financial (100.0%), Education, Arts & Media (100.0%), and Health Diagnosing & Treating (100.0%).
| Occupation | Male | Female |
| Management | 55 (66.3%) | 28 (33.7%) |
| Business & Financial | 0 (0.0%) | 25 (100.0%) |
| Computers, Engineering & Science | 19 (100.0%) | 0 (0.0%) |
| Computers & Mathematics | 0 (0.0%) | 0 (0.0%) |
| Architecture & Engineering | 19 (100.0%) | 0 (0.0%) |
| Life, Physical & Social Science | 0 (0.0%) | 0 (0.0%) |
| Community & Social Service | 43 (47.8%) | 47 (52.2%) |
| Education, Arts & Media | 0 (0.0%) | 47 (100.0%) |
| Legal Services & Support | 0 (0.0%) | 0 (0.0%) |
| Education Instruction & Library | 0 (0.0%) | 0 (0.0%) |
| Arts, Media & Entertainment | 43 (100.0%) | 0 (0.0%) |
| Health Diagnosing & Treating | 0 (0.0%) | 74 (100.0%) |
| Health Technologists | 0 (0.0%) | 50 (100.0%) |
| Total (Category) | 117 (40.2%) | 174 (59.8%) |
| Total (Overall) | 662 (59.2%) | 457 (40.8%) |
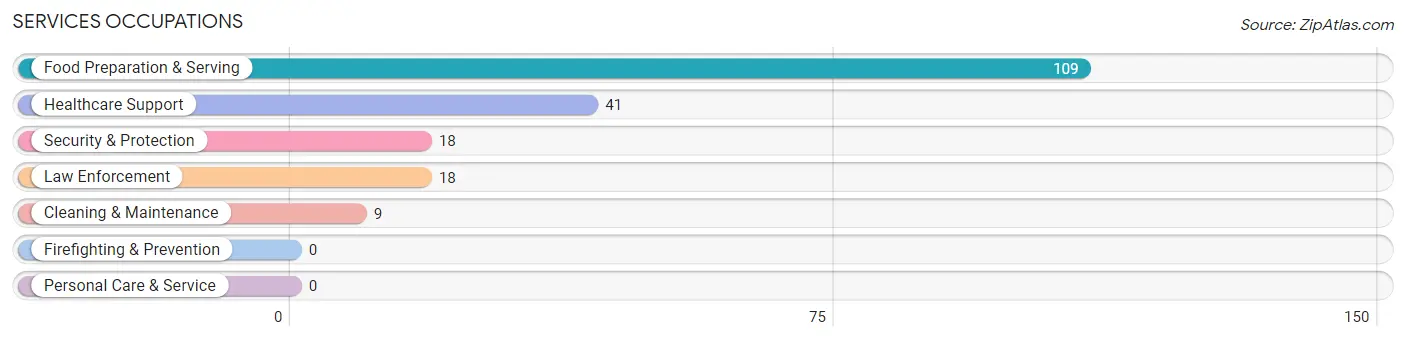
Services Occupations
The most common Services occupations in White Island Shores are Food Preparation & Serving (109 | 9.7%), Healthcare Support (41 | 3.7%), Security & Protection (18 | 1.6%), Law Enforcement (18 | 1.6%), and Cleaning & Maintenance (9 | 0.8%).
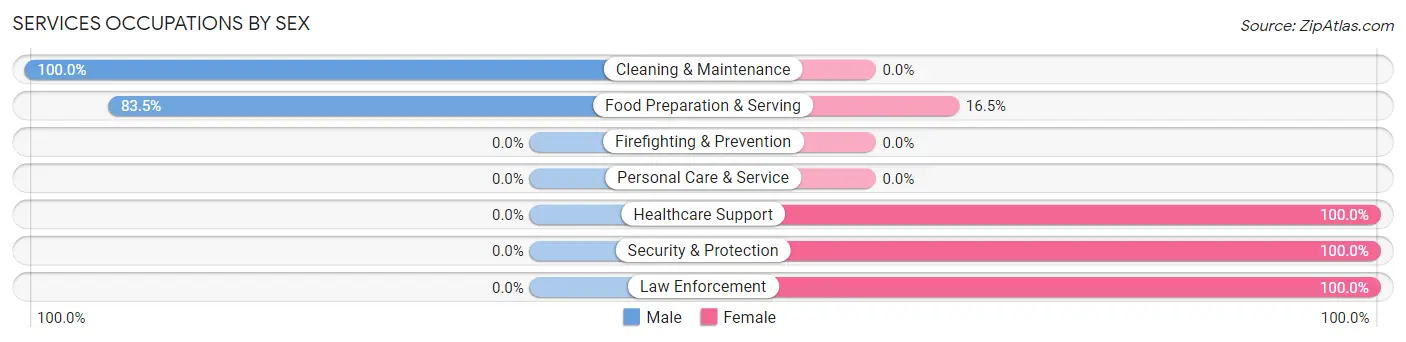
Services Occupations by Sex
Within the Services occupations in White Island Shores, the most male-oriented occupations are Cleaning & Maintenance (100.0%), and Food Preparation & Serving (83.5%), while the most female-oriented occupations are Healthcare Support (100.0%), Security & Protection (100.0%), and Law Enforcement (100.0%).
| Occupation | Male | Female |
| Healthcare Support | 0 (0.0%) | 41 (100.0%) |
| Security & Protection | 0 (0.0%) | 18 (100.0%) |
| Firefighting & Prevention | 0 (0.0%) | 0 (0.0%) |
| Law Enforcement | 0 (0.0%) | 18 (100.0%) |
| Food Preparation & Serving | 91 (83.5%) | 18 (16.5%) |
| Cleaning & Maintenance | 9 (100.0%) | 0 (0.0%) |
| Personal Care & Service | 0 (0.0%) | 0 (0.0%) |
| Total (Category) | 100 (56.5%) | 77 (43.5%) |
| Total (Overall) | 662 (59.2%) | 457 (40.8%) |
Sales and Office Occupations
The most common Sales and Office occupations in White Island Shores are Office & Administration (158 | 14.1%), and Sales & Related (113 | 10.1%).
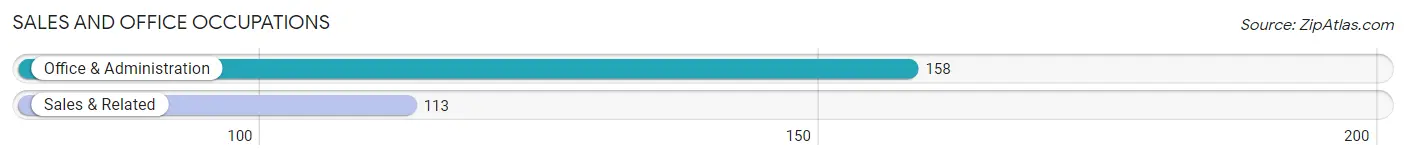
Sales and Office Occupations by Sex
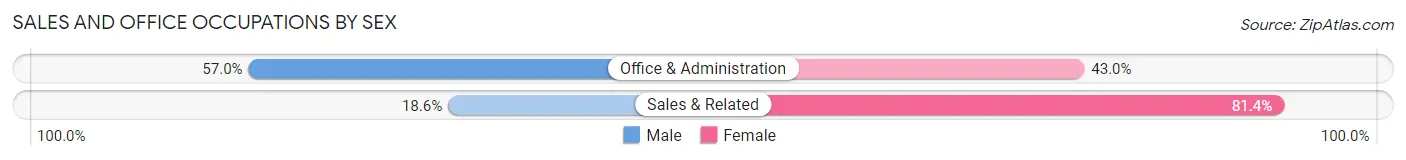
| Occupation | Male | Female |
| Sales & Related | 21 (18.6%) | 92 (81.4%) |
| Office & Administration | 90 (57.0%) | 68 (43.0%) |
| Total (Category) | 111 (41.0%) | 160 (59.0%) |
| Total (Overall) | 662 (59.2%) | 457 (40.8%) |
Natural Resources, Construction and Maintenance Occupations
The most common Natural Resources, Construction and Maintenance occupations in White Island Shores are Installation, Maintenance & Repair (95 | 8.5%), and Construction & Extraction (22 | 2.0%).
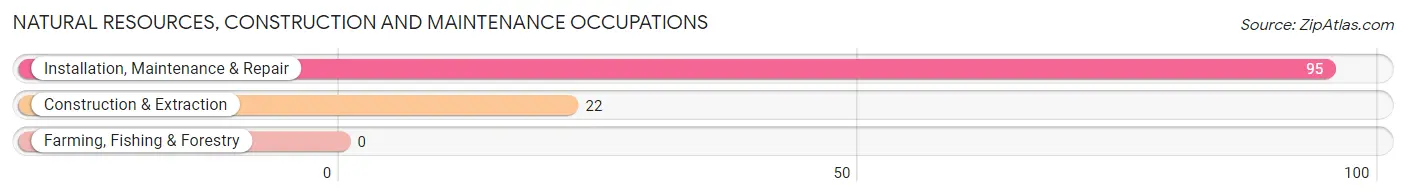
Natural Resources, Construction and Maintenance Occupations by Sex
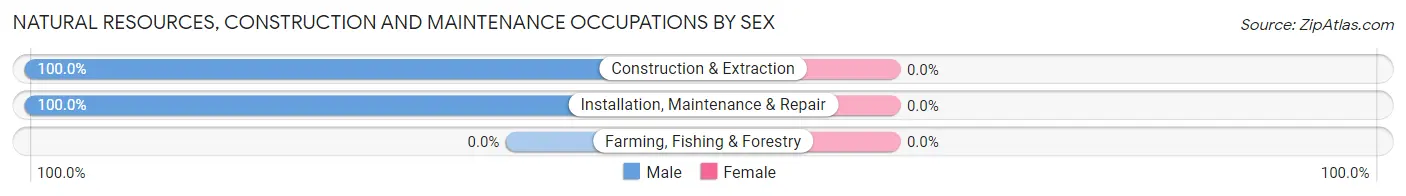
| Occupation | Male | Female |
| Farming, Fishing & Forestry | 0 (0.0%) | 0 (0.0%) |
| Construction & Extraction | 22 (100.0%) | 0 (0.0%) |
| Installation, Maintenance & Repair | 95 (100.0%) | 0 (0.0%) |
| Total (Category) | 117 (100.0%) | 0 (0.0%) |
| Total (Overall) | 662 (59.2%) | 457 (40.8%) |
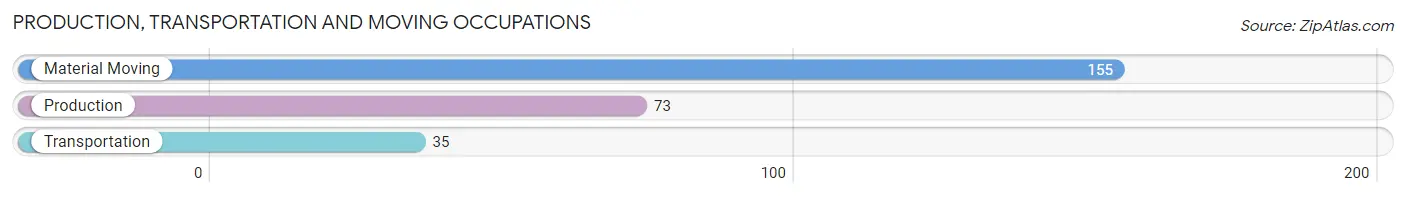
Production, Transportation and Moving Occupations
The most common Production, Transportation and Moving occupations in White Island Shores are Material Moving (155 | 13.9%), Production (73 | 6.5%), and Transportation (35 | 3.1%).
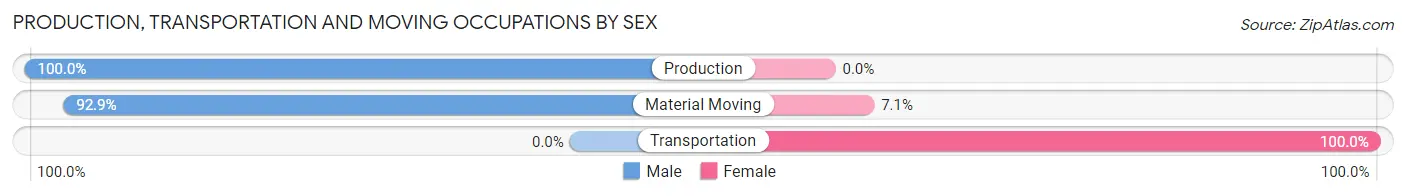
Production, Transportation and Moving Occupations by Sex
| Occupation | Male | Female |
| Production | 73 (100.0%) | 0 (0.0%) |
| Transportation | 0 (0.0%) | 35 (100.0%) |
| Material Moving | 144 (92.9%) | 11 (7.1%) |
| Total (Category) | 217 (82.5%) | 46 (17.5%) |
| Total (Overall) | 662 (59.2%) | 457 (40.8%) |
Employment Industries by Sex in White Island Shores
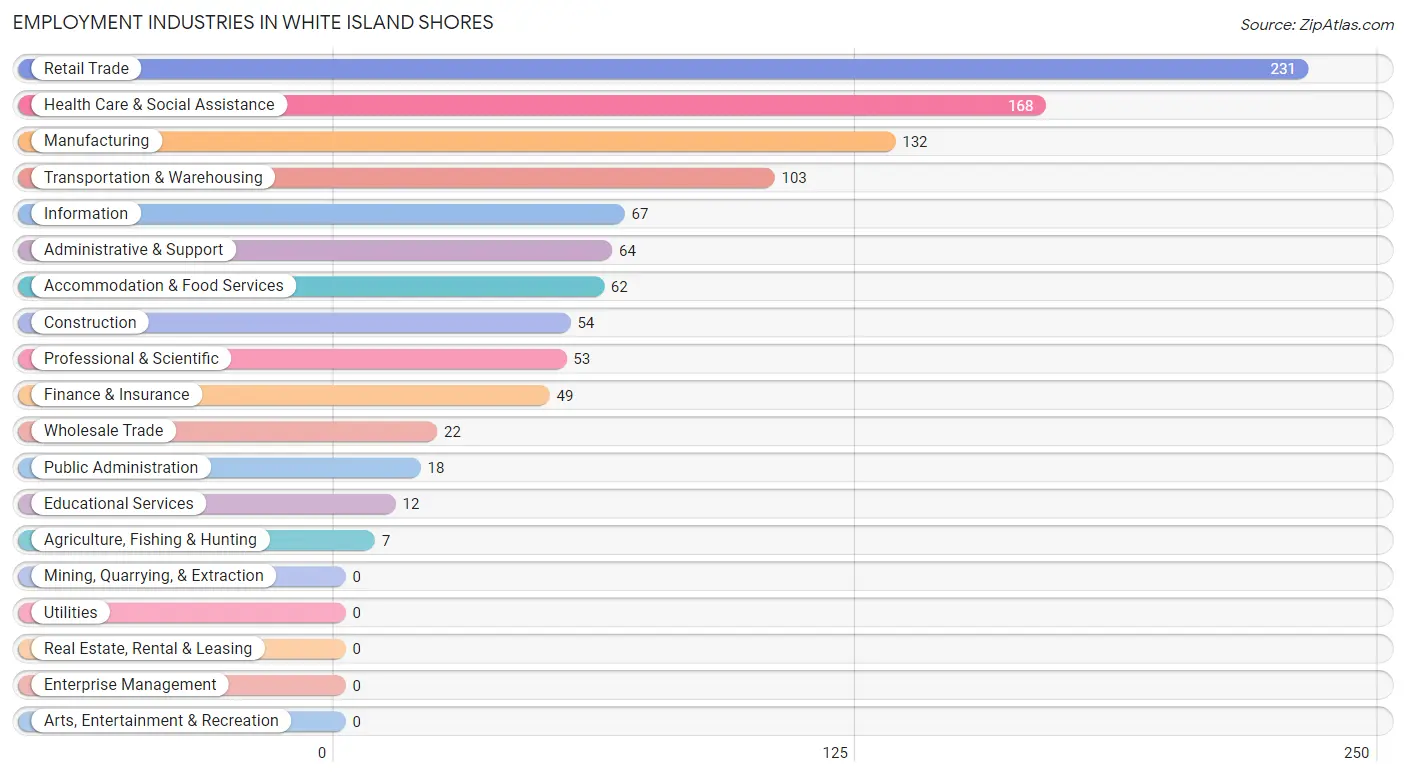
Employment Industries in White Island Shores
The major employment industries in White Island Shores include Retail Trade (231 | 20.6%), Health Care & Social Assistance (168 | 15.0%), Manufacturing (132 | 11.8%), Transportation & Warehousing (103 | 9.2%), and Information (67 | 6.0%).
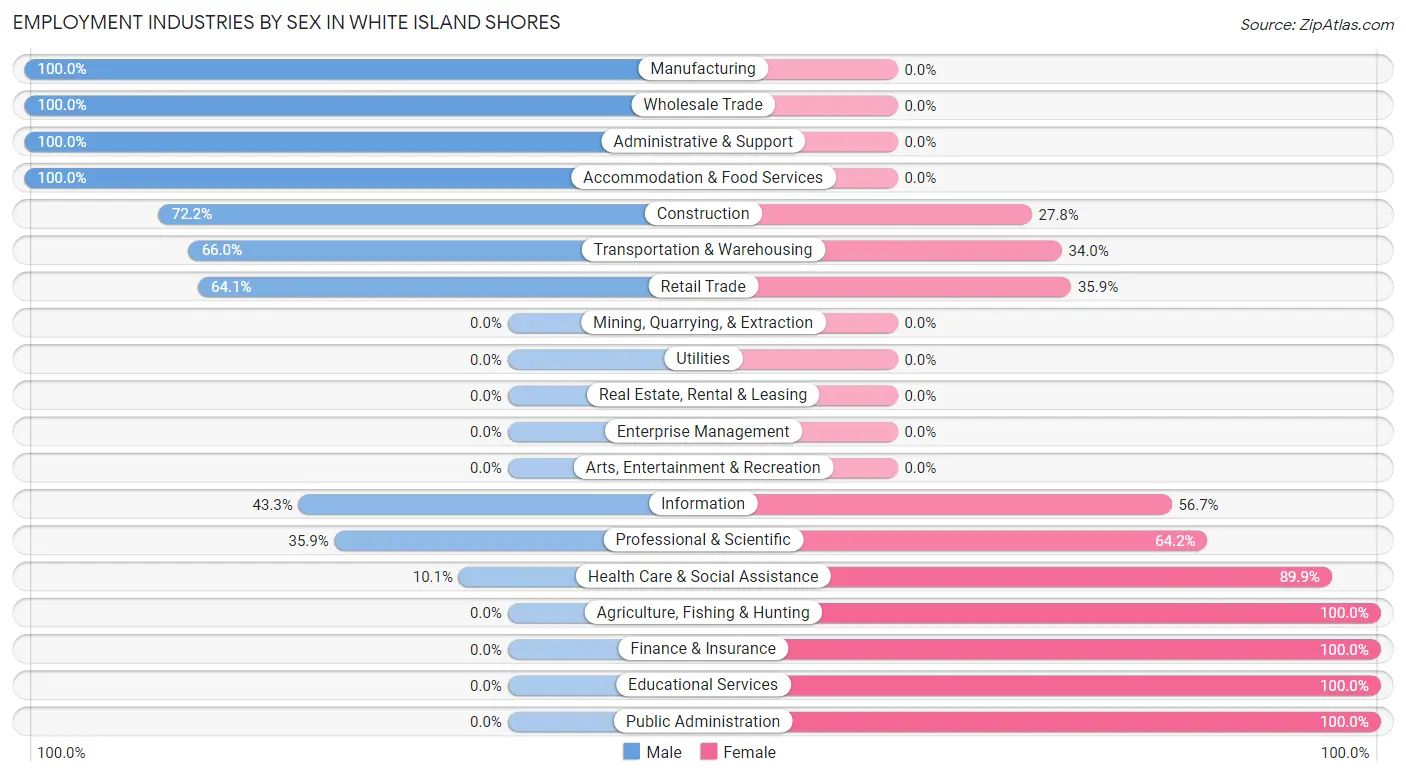
Employment Industries by Sex in White Island Shores
The White Island Shores industries that see more men than women are Manufacturing (100.0%), Wholesale Trade (100.0%), and Administrative & Support (100.0%), whereas the industries that tend to have a higher number of women are Agriculture, Fishing & Hunting (100.0%), Finance & Insurance (100.0%), and Educational Services (100.0%).
| Industry | Male | Female |
| Agriculture, Fishing & Hunting | 0 (0.0%) | 7 (100.0%) |
| Mining, Quarrying, & Extraction | 0 (0.0%) | 0 (0.0%) |
| Construction | 39 (72.2%) | 15 (27.8%) |
| Manufacturing | 132 (100.0%) | 0 (0.0%) |
| Wholesale Trade | 22 (100.0%) | 0 (0.0%) |
| Retail Trade | 148 (64.1%) | 83 (35.9%) |
| Transportation & Warehousing | 68 (66.0%) | 35 (34.0%) |
| Utilities | 0 (0.0%) | 0 (0.0%) |
| Information | 29 (43.3%) | 38 (56.7%) |
| Finance & Insurance | 0 (0.0%) | 49 (100.0%) |
| Real Estate, Rental & Leasing | 0 (0.0%) | 0 (0.0%) |
| Professional & Scientific | 19 (35.8%) | 34 (64.1%) |
| Enterprise Management | 0 (0.0%) | 0 (0.0%) |
| Administrative & Support | 64 (100.0%) | 0 (0.0%) |
| Educational Services | 0 (0.0%) | 12 (100.0%) |
| Health Care & Social Assistance | 17 (10.1%) | 151 (89.9%) |
| Arts, Entertainment & Recreation | 0 (0.0%) | 0 (0.0%) |
| Accommodation & Food Services | 62 (100.0%) | 0 (0.0%) |
| Public Administration | 0 (0.0%) | 18 (100.0%) |
| Total | 662 (59.2%) | 457 (40.8%) |
Education in White Island Shores
School Enrollment in White Island Shores
The most common levels of schooling among the 494 students in White Island Shores are elementary school (110 | 22.3%), high school (104 | 21.0%), and middle school (95 | 19.2%).
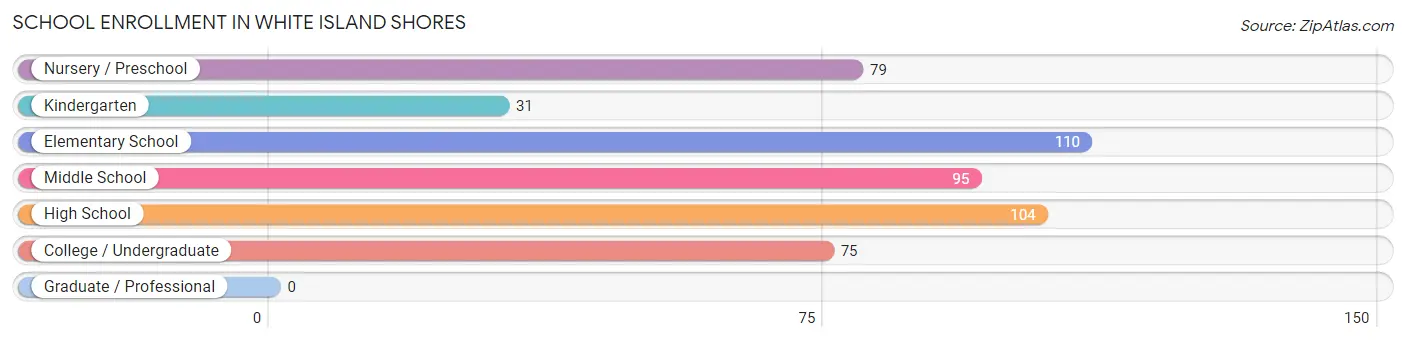
| School Level | # Students | % Students |
| Nursery / Preschool | 79 | 16.0% |
| Kindergarten | 31 | 6.3% |
| Elementary School | 110 | 22.3% |
| Middle School | 95 | 19.2% |
| High School | 104 | 21.0% |
| College / Undergraduate | 75 | 15.2% |
| Graduate / Professional | 0 | 0.0% |
| Total | 494 | 100.0% |
School Enrollment by Age by Funding Source in White Island Shores
Out of a total of 494 students who are enrolled in schools in White Island Shores, 112 (22.7%) attend a private institution, while the remaining 382 (77.3%) are enrolled in public schools. The age group of 3 to 4 year olds has the highest likelihood of being enrolled in private schools, with 79 (100.0% in the age bracket) enrolled. Conversely, the age group of 5 to 9 year old has the lowest likelihood of being enrolled in a private school, with 141 (100.0% in the age bracket) attending a public institution.
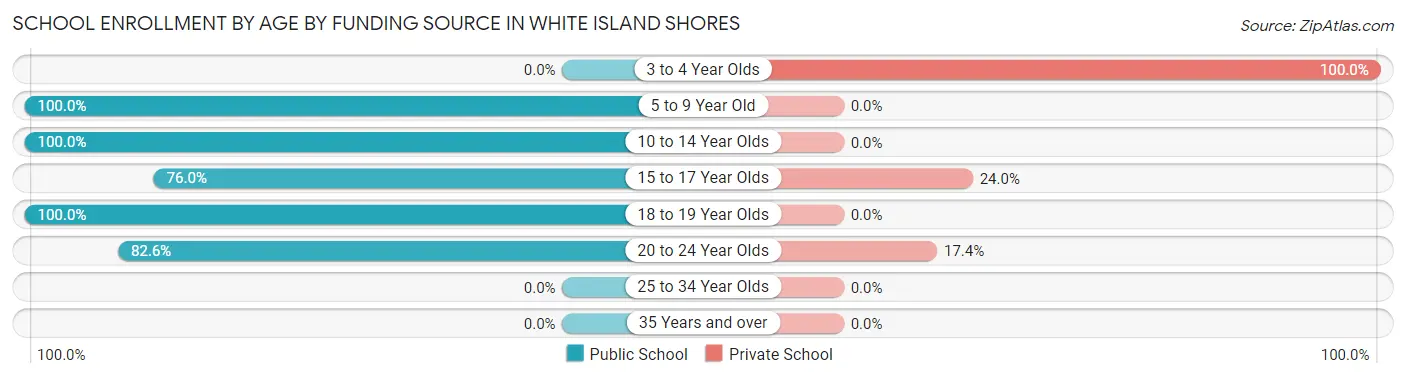
| Age Bracket | Public School | Private School |
| 3 to 4 Year Olds | 0 (0.0%) | 79 (100.0%) |
| 5 to 9 Year Old | 141 (100.0%) | 0 (0.0%) |
| 10 to 14 Year Olds | 95 (100.0%) | 0 (0.0%) |
| 15 to 17 Year Olds | 79 (76.0%) | 25 (24.0%) |
| 18 to 19 Year Olds | 29 (100.0%) | 0 (0.0%) |
| 20 to 24 Year Olds | 38 (82.6%) | 8 (17.4%) |
| 25 to 34 Year Olds | 0 (0.0%) | 0 (0.0%) |
| 35 Years and over | 0 (0.0%) | 0 (0.0%) |
| Total | 382 (77.3%) | 112 (22.7%) |
Educational Attainment by Field of Study in White Island Shores
Science & technology (47 | 15.7%), computers & mathematics (44 | 14.7%), bio, nature & agricultural (43 | 14.3%), literature & languages (33 | 11.0%), and engineering (32 | 10.7%) are the most common fields of study among 300 individuals in White Island Shores who have obtained a bachelor's degree or higher.
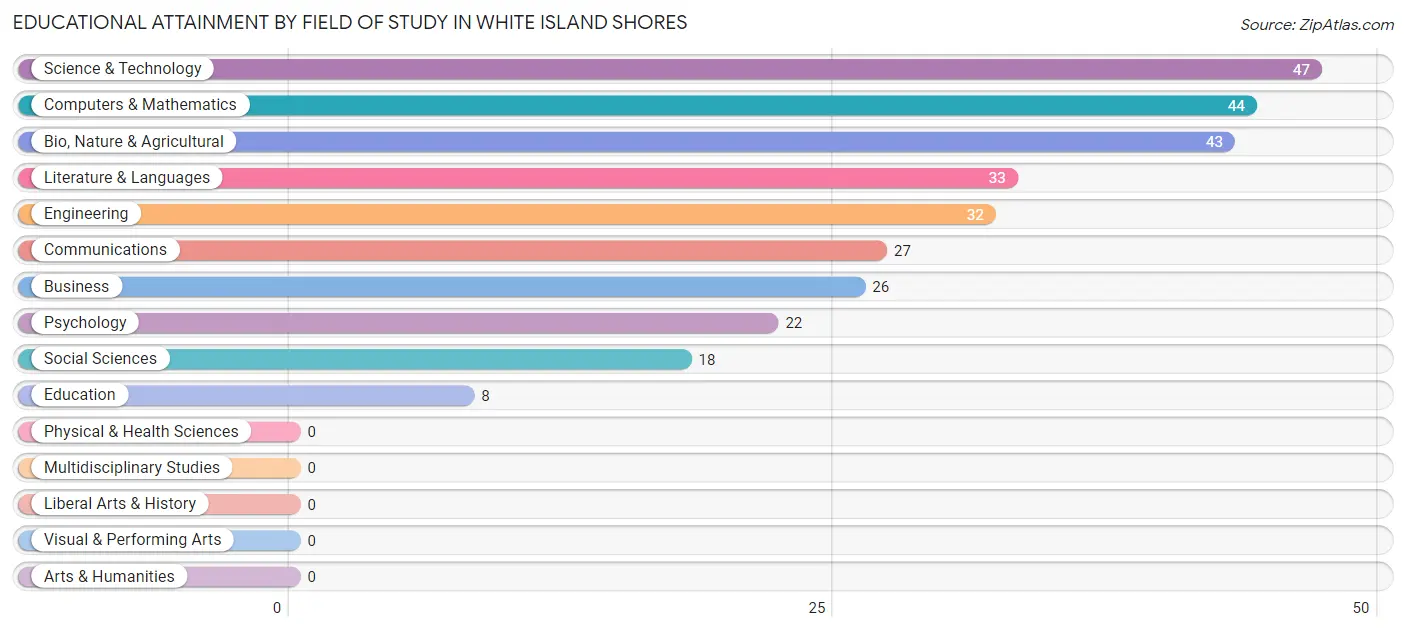
| Field of Study | # Graduates | % Graduates |
| Computers & Mathematics | 44 | 14.7% |
| Bio, Nature & Agricultural | 43 | 14.3% |
| Physical & Health Sciences | 0 | 0.0% |
| Psychology | 22 | 7.3% |
| Social Sciences | 18 | 6.0% |
| Engineering | 32 | 10.7% |
| Multidisciplinary Studies | 0 | 0.0% |
| Science & Technology | 47 | 15.7% |
| Business | 26 | 8.7% |
| Education | 8 | 2.7% |
| Literature & Languages | 33 | 11.0% |
| Liberal Arts & History | 0 | 0.0% |
| Visual & Performing Arts | 0 | 0.0% |
| Communications | 27 | 9.0% |
| Arts & Humanities | 0 | 0.0% |
| Total | 300 | 100.0% |
Transportation & Commute in White Island Shores
Vehicle Availability by Sex in White Island Shores
The most prevalent vehicle ownership categories in White Island Shores are males with 2 vehicles (301, accounting for 48.6%) and females with 2 vehicles (236, making up 65.9%).
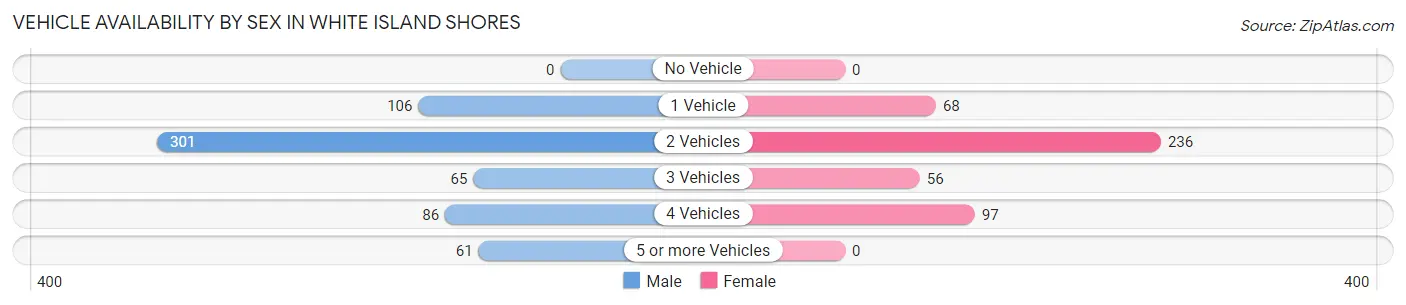
| Vehicles Available | Male | Female |
| No Vehicle | 0 (0.0%) | 0 (0.0%) |
| 1 Vehicle | 106 (17.1%) | 68 (14.9%) |
| 2 Vehicles | 301 (48.6%) | 236 (51.6%) |
| 3 Vehicles | 65 (10.5%) | 56 (12.2%) |
| 4 Vehicles | 86 (13.9%) | 97 (21.2%) |
| 5 or more Vehicles | 61 (9.9%) | 0 (0.0%) |
| Total | 619 (100.0%) | 457 (100.0%) |
Commute Time in White Island Shores
The most frequently occuring commute durations in White Island Shores are 30 to 34 minutes (249 commuters, 23.5%), 10 to 14 minutes (173 commuters, 16.3%), and 35 to 39 minutes (131 commuters, 12.3%).
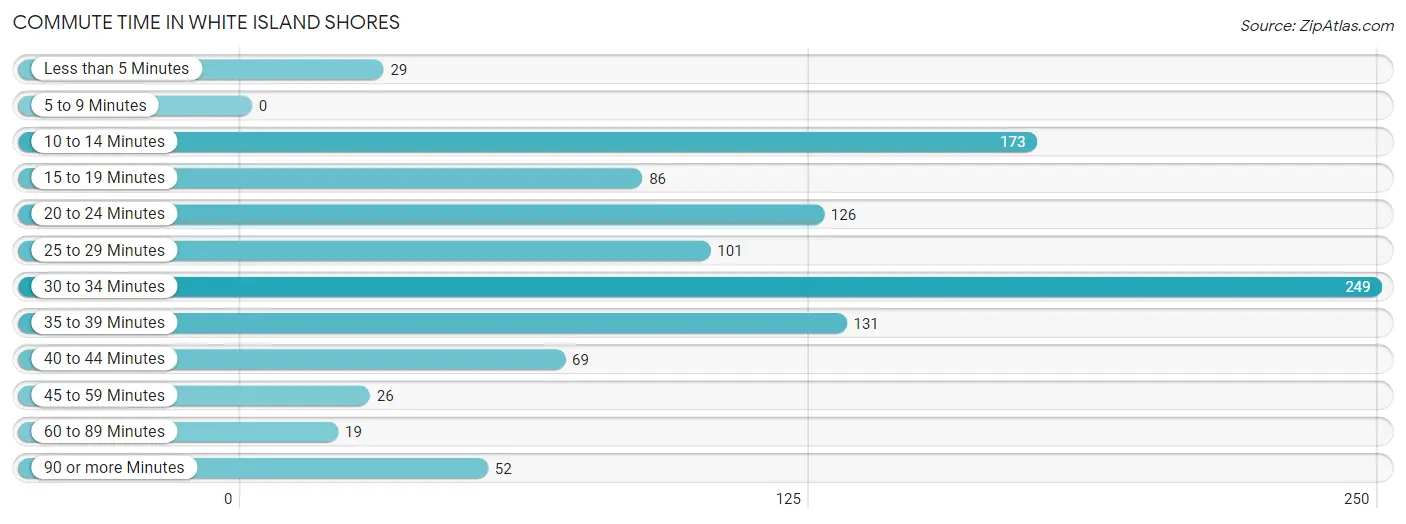
| Commute Time | # Commuters | % Commuters |
| Less than 5 Minutes | 29 | 2.7% |
| 5 to 9 Minutes | 0 | 0.0% |
| 10 to 14 Minutes | 173 | 16.3% |
| 15 to 19 Minutes | 86 | 8.1% |
| 20 to 24 Minutes | 126 | 11.9% |
| 25 to 29 Minutes | 101 | 9.5% |
| 30 to 34 Minutes | 249 | 23.5% |
| 35 to 39 Minutes | 131 | 12.3% |
| 40 to 44 Minutes | 69 | 6.5% |
| 45 to 59 Minutes | 26 | 2.5% |
| 60 to 89 Minutes | 19 | 1.8% |
| 90 or more Minutes | 52 | 4.9% |
Commute Time by Sex in White Island Shores
The most common commute times in White Island Shores are 30 to 34 minutes (163 commuters, 26.3%) for males and 30 to 34 minutes (86 commuters, 19.5%) for females.
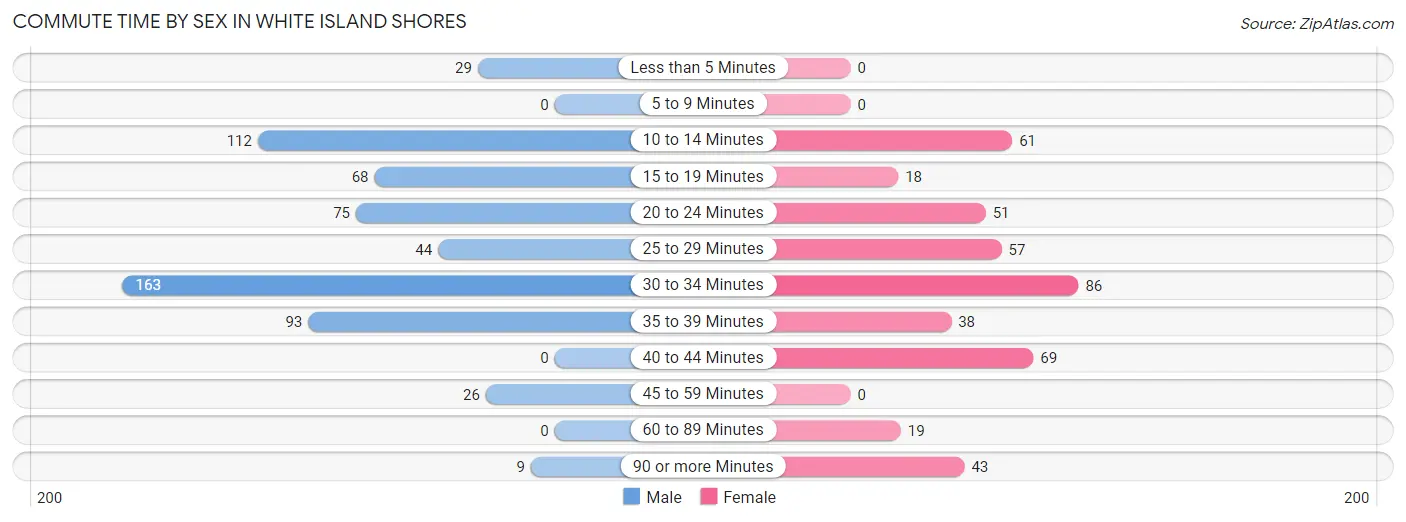
| Commute Time | Male | Female |
| Less than 5 Minutes | 29 (4.7%) | 0 (0.0%) |
| 5 to 9 Minutes | 0 (0.0%) | 0 (0.0%) |
| 10 to 14 Minutes | 112 (18.1%) | 61 (13.8%) |
| 15 to 19 Minutes | 68 (11.0%) | 18 (4.1%) |
| 20 to 24 Minutes | 75 (12.1%) | 51 (11.5%) |
| 25 to 29 Minutes | 44 (7.1%) | 57 (12.9%) |
| 30 to 34 Minutes | 163 (26.3%) | 86 (19.5%) |
| 35 to 39 Minutes | 93 (15.0%) | 38 (8.6%) |
| 40 to 44 Minutes | 0 (0.0%) | 69 (15.6%) |
| 45 to 59 Minutes | 26 (4.2%) | 0 (0.0%) |
| 60 to 89 Minutes | 0 (0.0%) | 19 (4.3%) |
| 90 or more Minutes | 9 (1.5%) | 43 (9.7%) |
Time of Departure to Work by Sex in White Island Shores
The most frequent times of departure to work in White Island Shores are 6:00 AM to 6:29 AM (187, 30.2%) for males and 6:30 AM to 6:59 AM (123, 27.8%) for females.
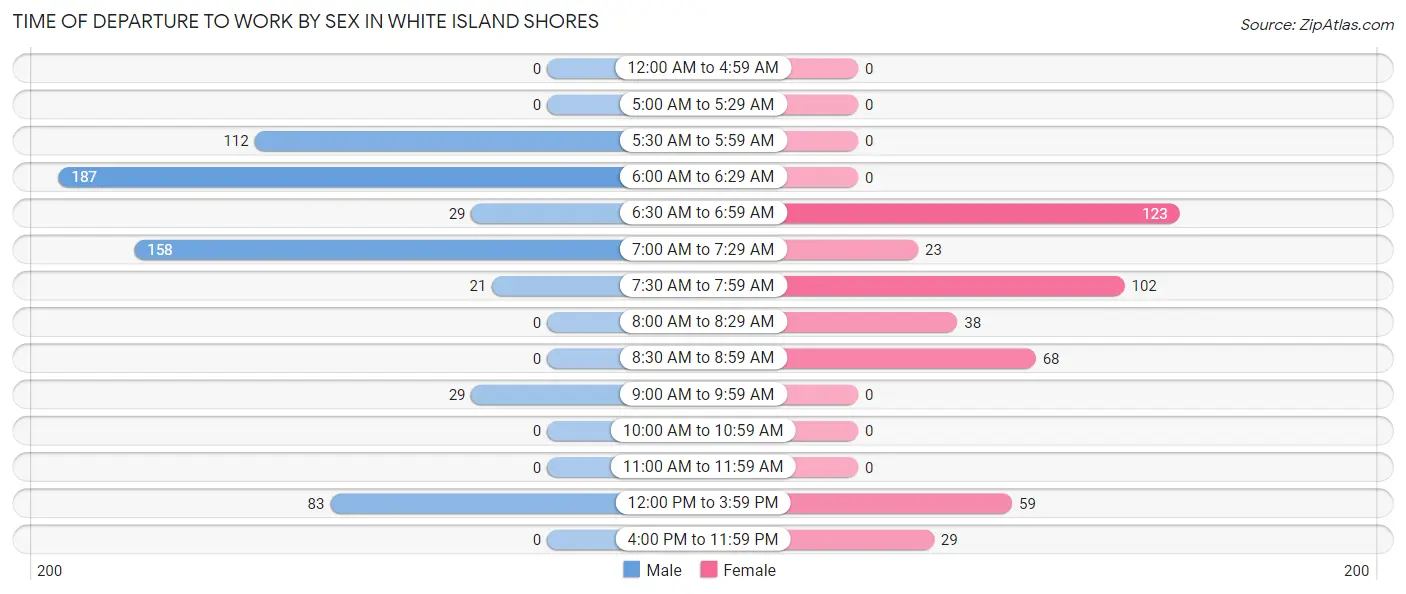
| Time of Departure | Male | Female |
| 12:00 AM to 4:59 AM | 0 (0.0%) | 0 (0.0%) |
| 5:00 AM to 5:29 AM | 0 (0.0%) | 0 (0.0%) |
| 5:30 AM to 5:59 AM | 112 (18.1%) | 0 (0.0%) |
| 6:00 AM to 6:29 AM | 187 (30.2%) | 0 (0.0%) |
| 6:30 AM to 6:59 AM | 29 (4.7%) | 123 (27.8%) |
| 7:00 AM to 7:29 AM | 158 (25.5%) | 23 (5.2%) |
| 7:30 AM to 7:59 AM | 21 (3.4%) | 102 (23.1%) |
| 8:00 AM to 8:29 AM | 0 (0.0%) | 38 (8.6%) |
| 8:30 AM to 8:59 AM | 0 (0.0%) | 68 (15.4%) |
| 9:00 AM to 9:59 AM | 29 (4.7%) | 0 (0.0%) |
| 10:00 AM to 10:59 AM | 0 (0.0%) | 0 (0.0%) |
| 11:00 AM to 11:59 AM | 0 (0.0%) | 0 (0.0%) |
| 12:00 PM to 3:59 PM | 83 (13.4%) | 59 (13.4%) |
| 4:00 PM to 11:59 PM | 0 (0.0%) | 29 (6.6%) |
| Total | 619 (100.0%) | 442 (100.0%) |
Housing Occupancy in White Island Shores
Occupancy by Ownership in White Island Shores
Of the total 764 dwellings in White Island Shores, owner-occupied units account for 633 (82.9%), while renter-occupied units make up 131 (17.2%).
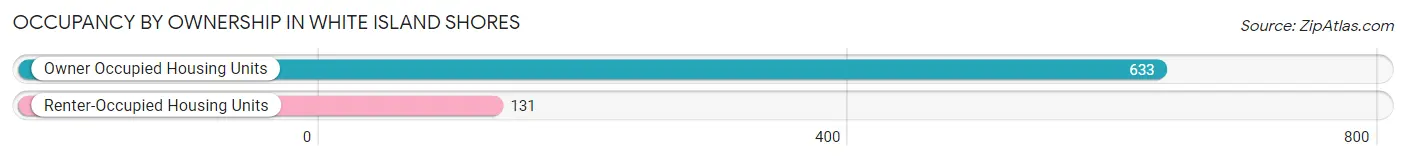
| Occupancy | # Housing Units | % Housing Units |
| Owner Occupied Housing Units | 633 | 82.9% |
| Renter-Occupied Housing Units | 131 | 17.2% |
| Total Occupied Housing Units | 764 | 100.0% |
Occupancy by Household Size in White Island Shores
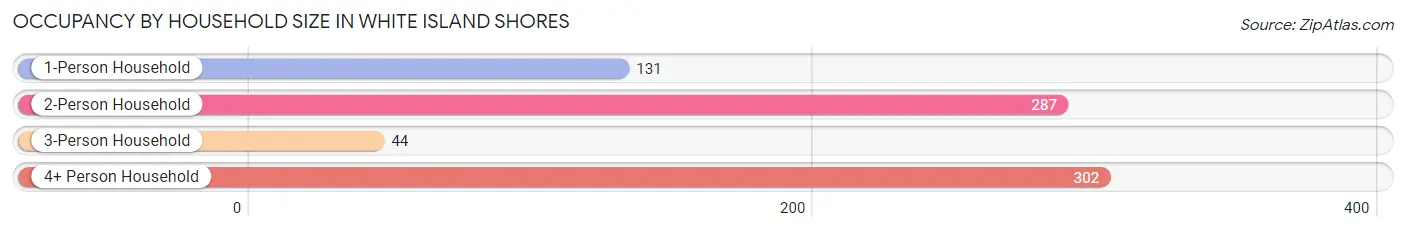
| Household Size | # Housing Units | % Housing Units |
| 1-Person Household | 131 | 17.2% |
| 2-Person Household | 287 | 37.6% |
| 3-Person Household | 44 | 5.8% |
| 4+ Person Household | 302 | 39.5% |
| Total Housing Units | 764 | 100.0% |
Occupancy by Ownership by Household Size in White Island Shores
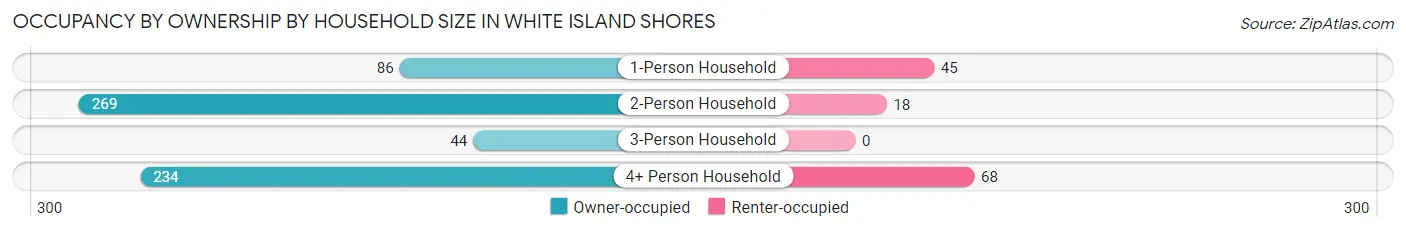
| Household Size | Owner-occupied | Renter-occupied |
| 1-Person Household | 86 (65.6%) | 45 (34.4%) |
| 2-Person Household | 269 (93.7%) | 18 (6.3%) |
| 3-Person Household | 44 (100.0%) | 0 (0.0%) |
| 4+ Person Household | 234 (77.5%) | 68 (22.5%) |
| Total Housing Units | 633 (82.9%) | 131 (17.2%) |
Occupancy by Educational Attainment in White Island Shores
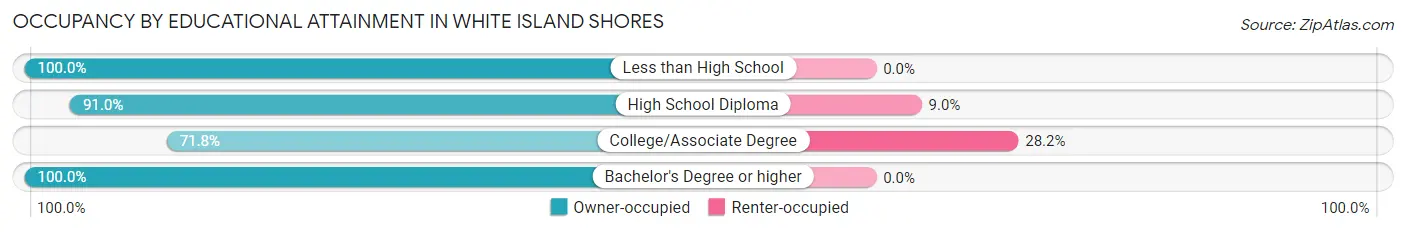
| Household Size | Owner-occupied | Renter-occupied |
| Less than High School | 15 (100.0%) | 0 (0.0%) |
| High School Diploma | 182 (91.0%) | 18 (9.0%) |
| College/Associate Degree | 288 (71.8%) | 113 (28.2%) |
| Bachelor's Degree or higher | 148 (100.0%) | 0 (0.0%) |
Occupancy by Age of Householder in White Island Shores
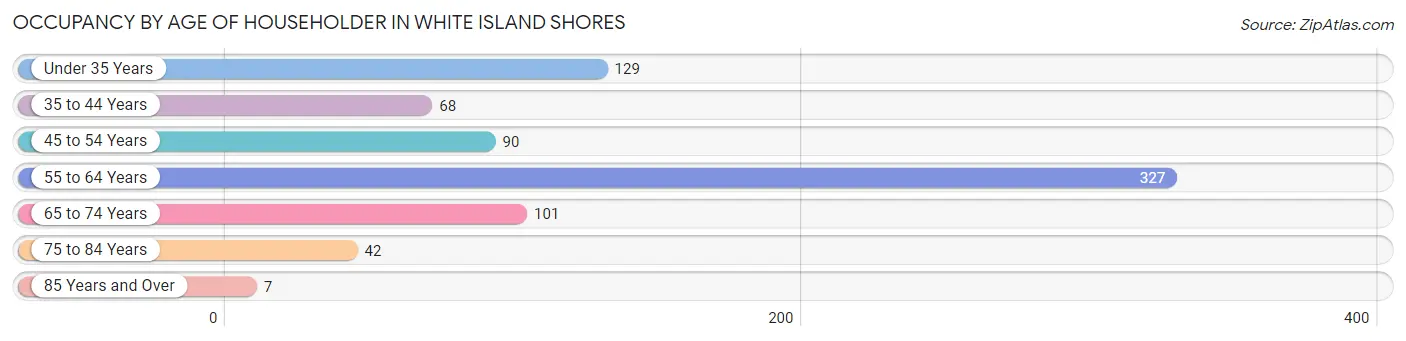
| Age Bracket | # Households | % Households |
| Under 35 Years | 129 | 16.9% |
| 35 to 44 Years | 68 | 8.9% |
| 45 to 54 Years | 90 | 11.8% |
| 55 to 64 Years | 327 | 42.8% |
| 65 to 74 Years | 101 | 13.2% |
| 75 to 84 Years | 42 | 5.5% |
| 85 Years and Over | 7 | 0.9% |
| Total | 764 | 100.0% |
Housing Finances in White Island Shores
Median Income by Occupancy in White Island Shores
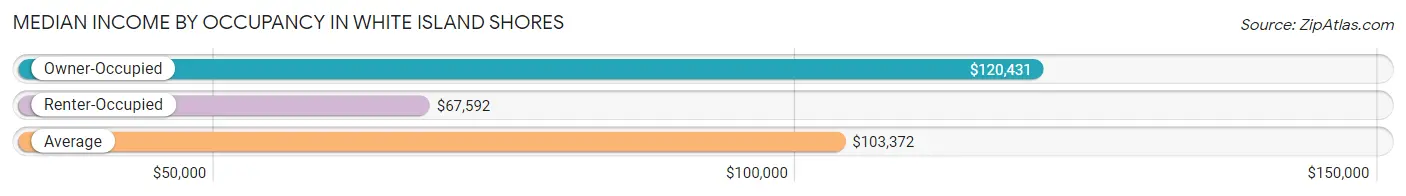
| Occupancy Type | # Households | Median Income |
| Owner-Occupied | 633 (82.9%) | $120,431 |
| Renter-Occupied | 131 (17.2%) | $67,592 |
| Average | 764 (100.0%) | $103,372 |
Occupancy by Householder Income Bracket in White Island Shores
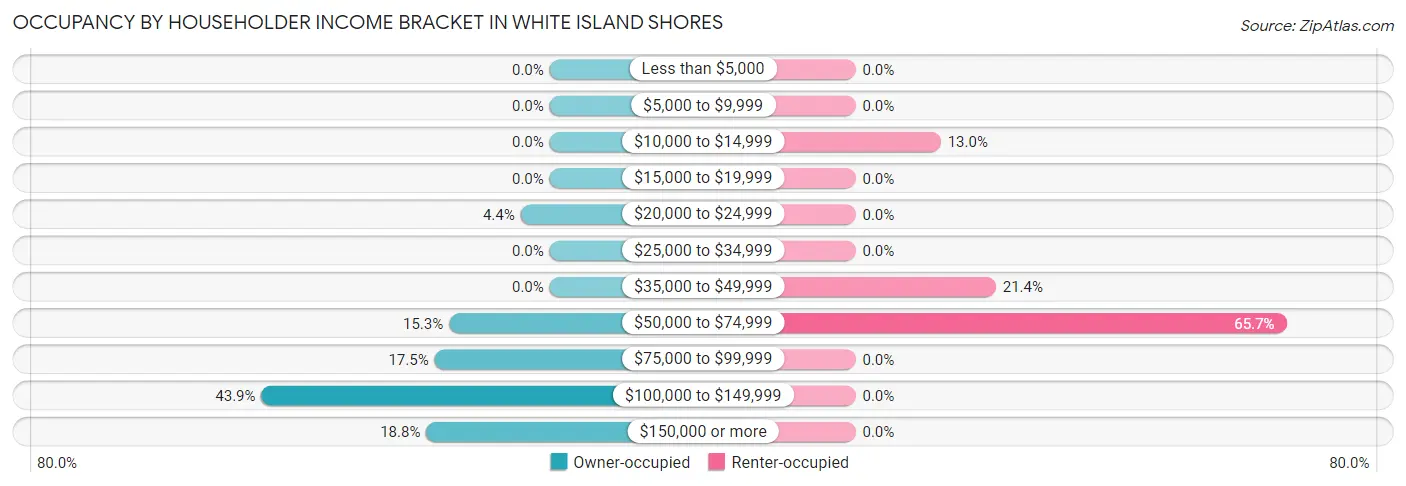
| Income Bracket | Owner-occupied | Renter-occupied |
| Less than $5,000 | 0 (0.0%) | 0 (0.0%) |
| $5,000 to $9,999 | 0 (0.0%) | 0 (0.0%) |
| $10,000 to $14,999 | 0 (0.0%) | 17 (13.0%) |
| $15,000 to $19,999 | 0 (0.0%) | 0 (0.0%) |
| $20,000 to $24,999 | 28 (4.4%) | 0 (0.0%) |
| $25,000 to $34,999 | 0 (0.0%) | 0 (0.0%) |
| $35,000 to $49,999 | 0 (0.0%) | 28 (21.4%) |
| $50,000 to $74,999 | 97 (15.3%) | 86 (65.6%) |
| $75,000 to $99,999 | 111 (17.5%) | 0 (0.0%) |
| $100,000 to $149,999 | 278 (43.9%) | 0 (0.0%) |
| $150,000 or more | 119 (18.8%) | 0 (0.0%) |
| Total | 633 (100.0%) | 131 (100.0%) |
Monthly Housing Cost Tiers in White Island Shores
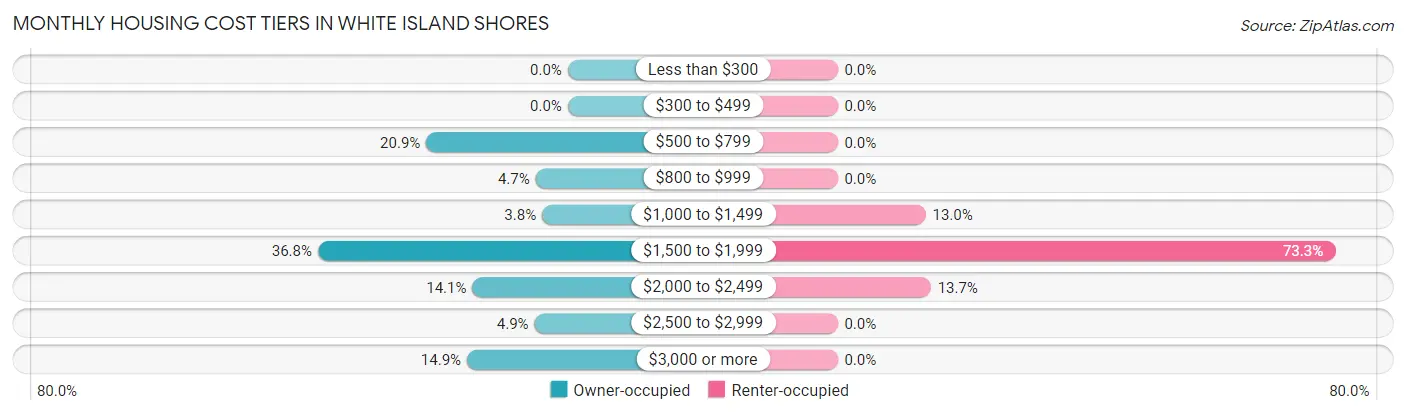
| Monthly Cost | Owner-occupied | Renter-occupied |
| Less than $300 | 0 (0.0%) | 0 (0.0%) |
| $300 to $499 | 0 (0.0%) | 0 (0.0%) |
| $500 to $799 | 132 (20.8%) | 0 (0.0%) |
| $800 to $999 | 30 (4.7%) | 0 (0.0%) |
| $1,000 to $1,499 | 24 (3.8%) | 17 (13.0%) |
| $1,500 to $1,999 | 233 (36.8%) | 96 (73.3%) |
| $2,000 to $2,499 | 89 (14.1%) | 18 (13.7%) |
| $2,500 to $2,999 | 31 (4.9%) | 0 (0.0%) |
| $3,000 or more | 94 (14.8%) | 0 (0.0%) |
| Total | 633 (100.0%) | 131 (100.0%) |
Physical Housing Characteristics in White Island Shores
Housing Structures in White Island Shores
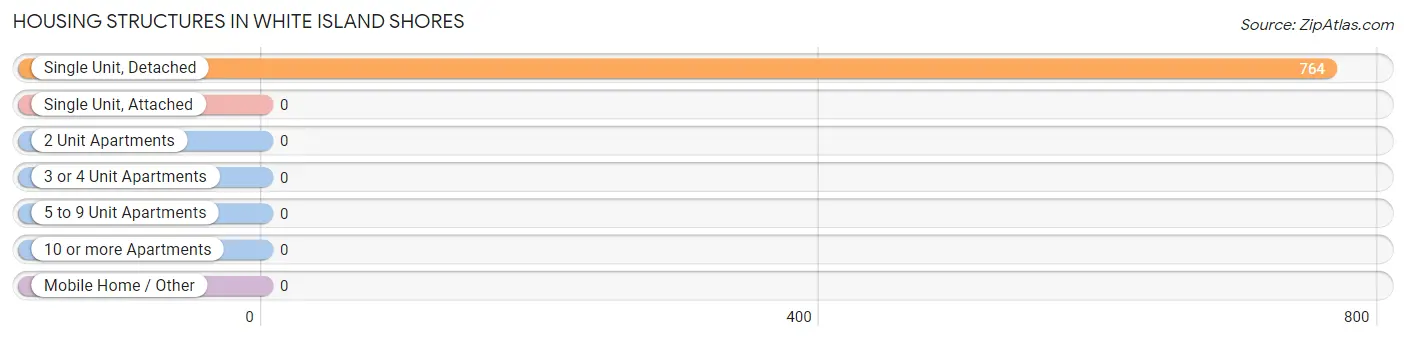
| Structure Type | # Housing Units | % Housing Units |
| Single Unit, Detached | 764 | 100.0% |
| Single Unit, Attached | 0 | 0.0% |
| 2 Unit Apartments | 0 | 0.0% |
| 3 or 4 Unit Apartments | 0 | 0.0% |
| 5 to 9 Unit Apartments | 0 | 0.0% |
| 10 or more Apartments | 0 | 0.0% |
| Mobile Home / Other | 0 | 0.0% |
| Total | 764 | 100.0% |
Housing Structures by Occupancy in White Island Shores
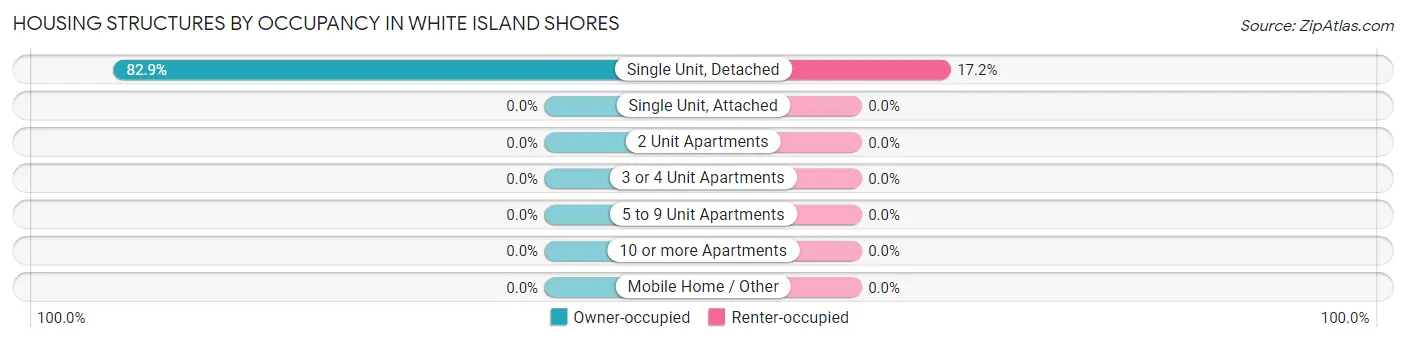
| Structure Type | Owner-occupied | Renter-occupied |
| Single Unit, Detached | 633 (82.9%) | 131 (17.2%) |
| Single Unit, Attached | 0 (0.0%) | 0 (0.0%) |
| 2 Unit Apartments | 0 (0.0%) | 0 (0.0%) |
| 3 or 4 Unit Apartments | 0 (0.0%) | 0 (0.0%) |
| 5 to 9 Unit Apartments | 0 (0.0%) | 0 (0.0%) |
| 10 or more Apartments | 0 (0.0%) | 0 (0.0%) |
| Mobile Home / Other | 0 (0.0%) | 0 (0.0%) |
| Total | 633 (82.9%) | 131 (17.2%) |
Housing Structures by Number of Rooms in White Island Shores
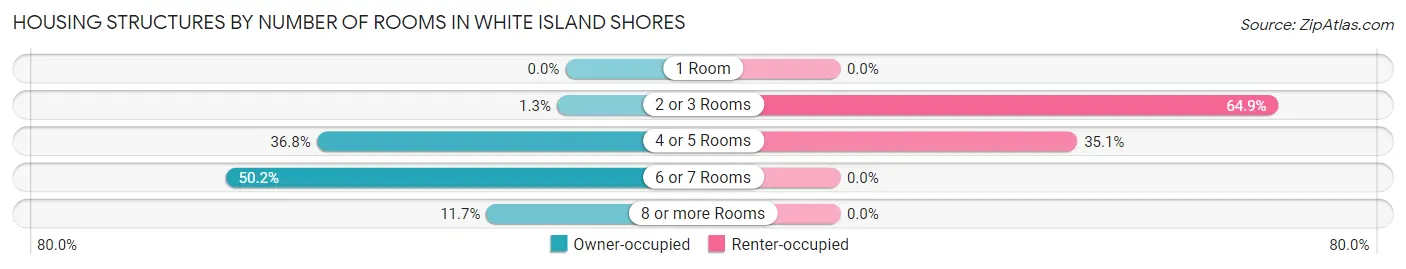
| Number of Rooms | Owner-occupied | Renter-occupied |
| 1 Room | 0 (0.0%) | 0 (0.0%) |
| 2 or 3 Rooms | 8 (1.3%) | 85 (64.9%) |
| 4 or 5 Rooms | 233 (36.8%) | 46 (35.1%) |
| 6 or 7 Rooms | 318 (50.2%) | 0 (0.0%) |
| 8 or more Rooms | 74 (11.7%) | 0 (0.0%) |
| Total | 633 (100.0%) | 131 (100.0%) |
Housing Structure by Heating Type in White Island Shores
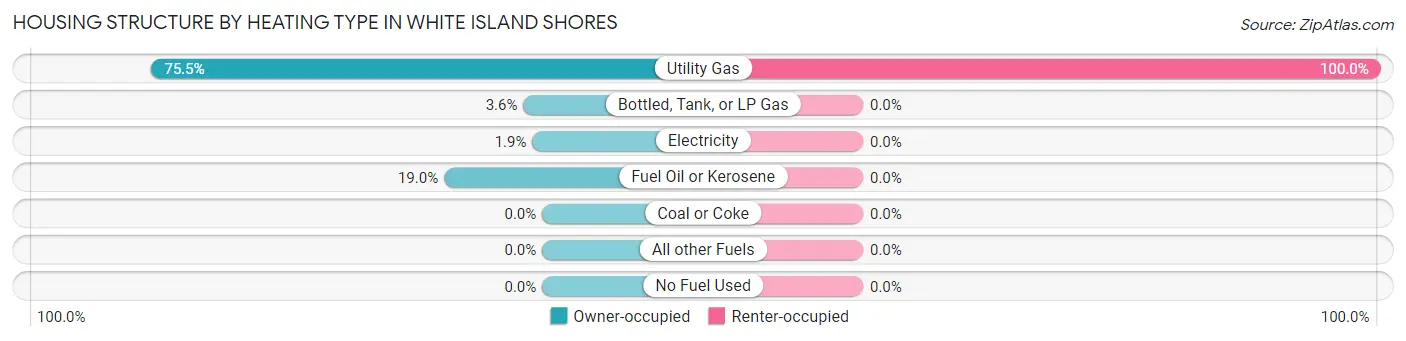
| Heating Type | Owner-occupied | Renter-occupied |
| Utility Gas | 478 (75.5%) | 131 (100.0%) |
| Bottled, Tank, or LP Gas | 23 (3.6%) | 0 (0.0%) |
| Electricity | 12 (1.9%) | 0 (0.0%) |
| Fuel Oil or Kerosene | 120 (19.0%) | 0 (0.0%) |
| Coal or Coke | 0 (0.0%) | 0 (0.0%) |
| All other Fuels | 0 (0.0%) | 0 (0.0%) |
| No Fuel Used | 0 (0.0%) | 0 (0.0%) |
| Total | 633 (100.0%) | 131 (100.0%) |
Household Vehicle Usage in White Island Shores
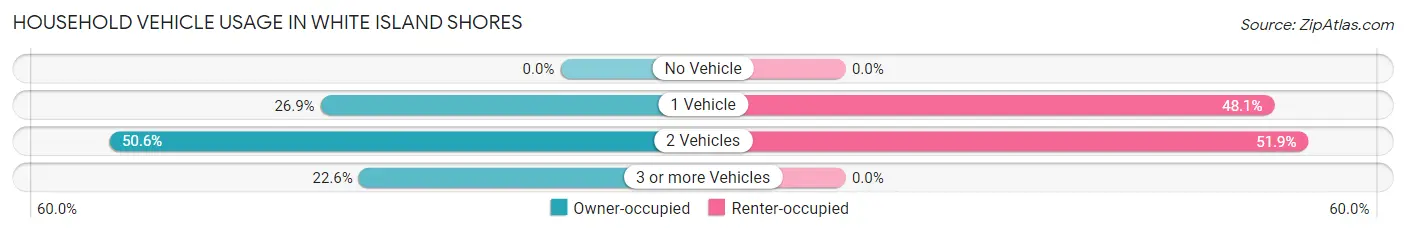
| Vehicles per Household | Owner-occupied | Renter-occupied |
| No Vehicle | 0 (0.0%) | 0 (0.0%) |
| 1 Vehicle | 170 (26.9%) | 63 (48.1%) |
| 2 Vehicles | 320 (50.5%) | 68 (51.9%) |
| 3 or more Vehicles | 143 (22.6%) | 0 (0.0%) |
| Total | 633 (100.0%) | 131 (100.0%) |
Real Estate & Mortgages in White Island Shores
Real Estate and Mortgage Overview in White Island Shores
| Characteristic | Without Mortgage | With Mortgage |
| Housing Units | 162 | 471 |
| Median Property Value | $352,800 | $337,900 |
| Median Household Income | $120,889 | $119 |
| Monthly Housing Costs | $673 | $94 |
| Real Estate Taxes | $3,575 | $0 |
Property Value by Mortgage Status in White Island Shores
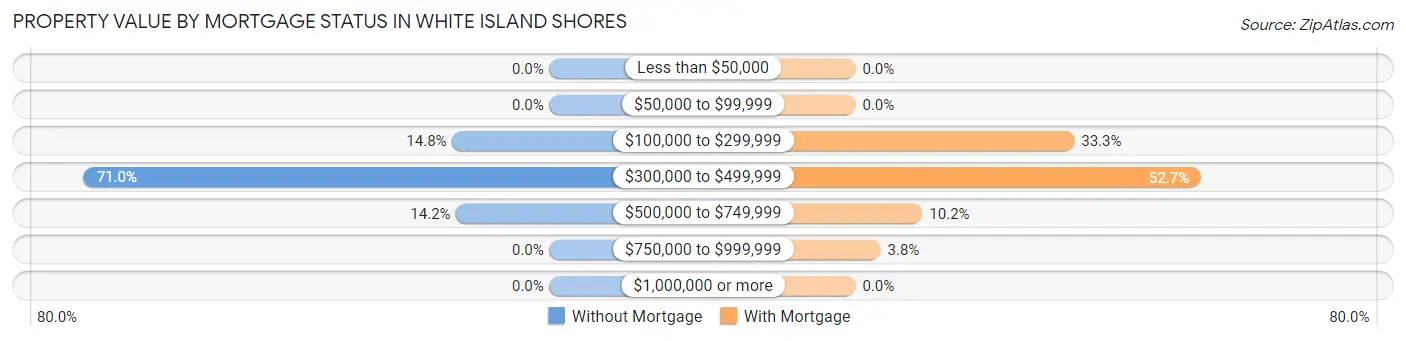
| Property Value | Without Mortgage | With Mortgage |
| Less than $50,000 | 0 (0.0%) | 0 (0.0%) |
| $50,000 to $99,999 | 0 (0.0%) | 0 (0.0%) |
| $100,000 to $299,999 | 24 (14.8%) | 157 (33.3%) |
| $300,000 to $499,999 | 115 (71.0%) | 248 (52.6%) |
| $500,000 to $749,999 | 23 (14.2%) | 48 (10.2%) |
| $750,000 to $999,999 | 0 (0.0%) | 18 (3.8%) |
| $1,000,000 or more | 0 (0.0%) | 0 (0.0%) |
| Total | 162 (100.0%) | 471 (100.0%) |
Household Income by Mortgage Status in White Island Shores
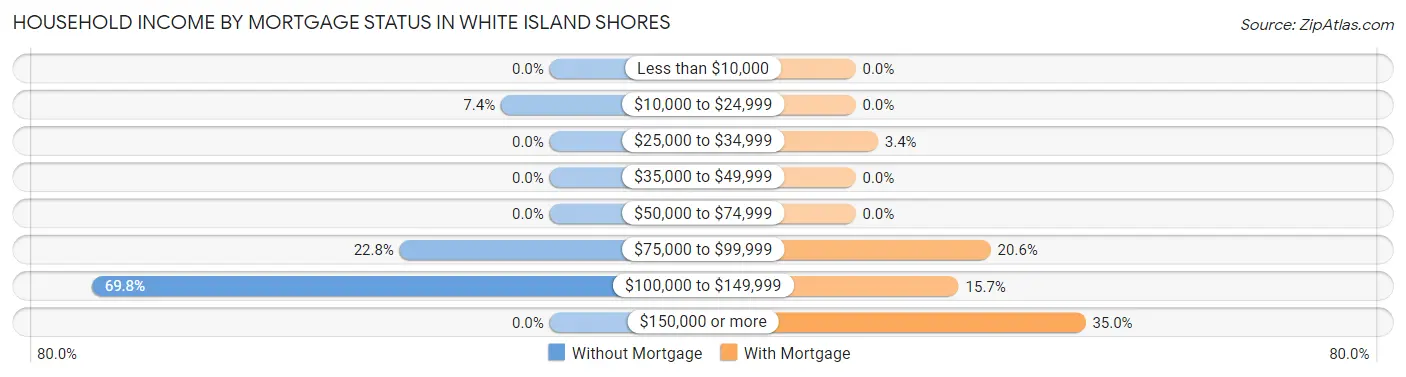
| Household Income | Without Mortgage | With Mortgage |
| Less than $10,000 | 0 (0.0%) | 0 (0.0%) |
| $10,000 to $24,999 | 12 (7.4%) | 0 (0.0%) |
| $25,000 to $34,999 | 0 (0.0%) | 16 (3.4%) |
| $35,000 to $49,999 | 0 (0.0%) | 0 (0.0%) |
| $50,000 to $74,999 | 0 (0.0%) | 0 (0.0%) |
| $75,000 to $99,999 | 37 (22.8%) | 97 (20.6%) |
| $100,000 to $149,999 | 113 (69.8%) | 74 (15.7%) |
| $150,000 or more | 0 (0.0%) | 165 (35.0%) |
| Total | 162 (100.0%) | 471 (100.0%) |
Property Value to Household Income Ratio in White Island Shores
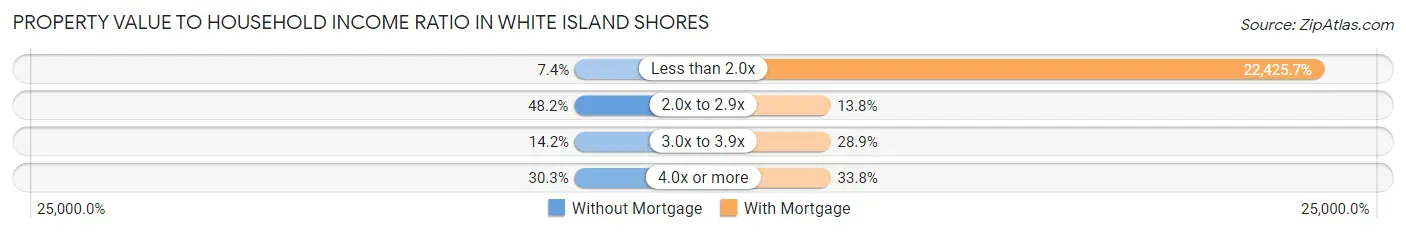
| Value-to-Income Ratio | Without Mortgage | With Mortgage |
| Less than 2.0x | 12 (7.4%) | 105,625 (22,425.7%) |
| 2.0x to 2.9x | 78 (48.1%) | 65 (13.8%) |
| 3.0x to 3.9x | 23 (14.2%) | 136 (28.9%) |
| 4.0x or more | 49 (30.2%) | 159 (33.8%) |
| Total | 162 (100.0%) | 471 (100.0%) |
Real Estate Taxes by Mortgage Status in White Island Shores
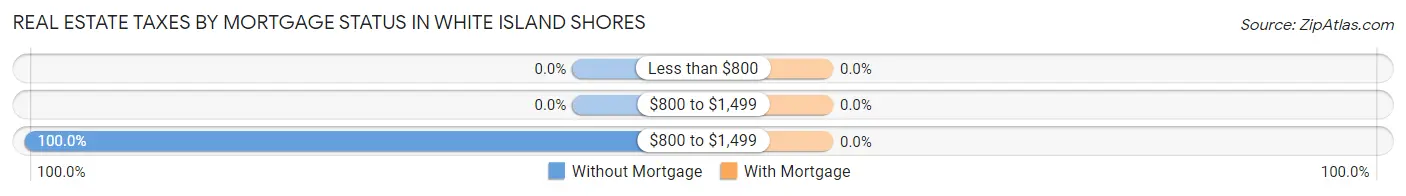
| Property Taxes | Without Mortgage | With Mortgage |
| Less than $800 | 0 (0.0%) | 0 (0.0%) |
| $800 to $1,499 | 0 (0.0%) | 0 (0.0%) |
| $800 to $1,499 | 162 (100.0%) | 0 (0.0%) |
| Total | 162 (100.0%) | 471 (100.0%) |
Health & Disability in White Island Shores
Health Insurance Coverage by Age in White Island Shores
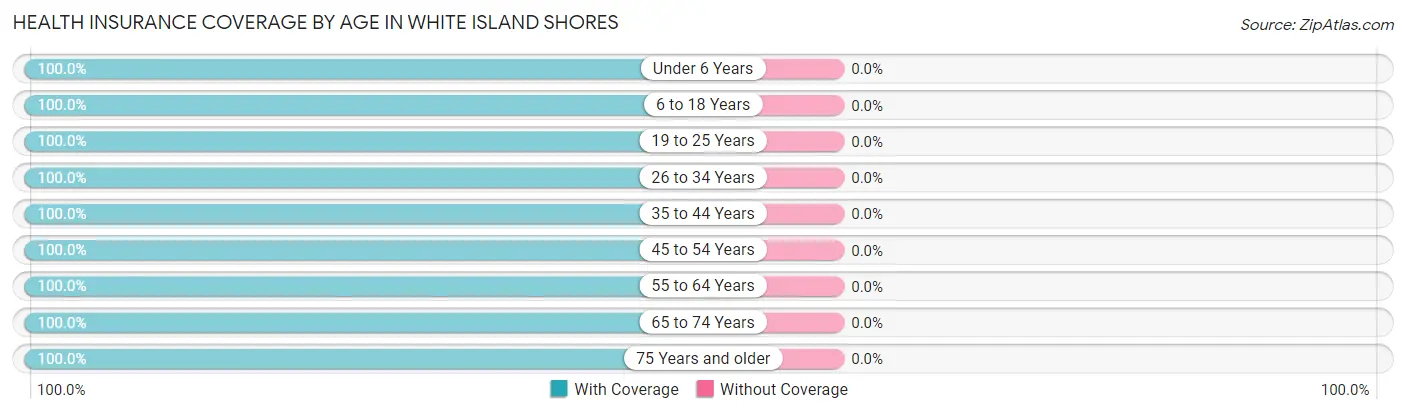
| Age Bracket | With Coverage | Without Coverage |
| Under 6 Years | 124 (100.0%) | 0 (0.0%) |
| 6 to 18 Years | 309 (100.0%) | 0 (0.0%) |
| 19 to 25 Years | 240 (100.0%) | 0 (0.0%) |
| 26 to 34 Years | 268 (100.0%) | 0 (0.0%) |
| 35 to 44 Years | 213 (100.0%) | 0 (0.0%) |
| 45 to 54 Years | 339 (100.0%) | 0 (0.0%) |
| 55 to 64 Years | 469 (100.0%) | 0 (0.0%) |
| 65 to 74 Years | 126 (100.0%) | 0 (0.0%) |
| 75 Years and older | 135 (100.0%) | 0 (0.0%) |
| Total | 2,223 (100.0%) | 0 (0.0%) |
Health Insurance Coverage by Citizenship Status in White Island Shores
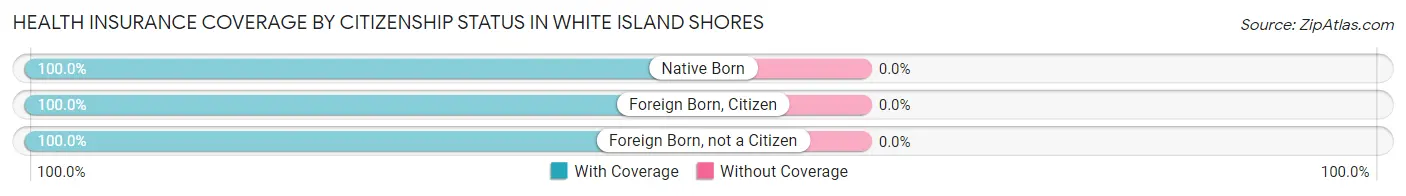
| Citizenship Status | With Coverage | Without Coverage |
| Native Born | 124 (100.0%) | 0 (0.0%) |
| Foreign Born, Citizen | 309 (100.0%) | 0 (0.0%) |
| Foreign Born, not a Citizen | 240 (100.0%) | 0 (0.0%) |
Health Insurance Coverage by Household Income in White Island Shores
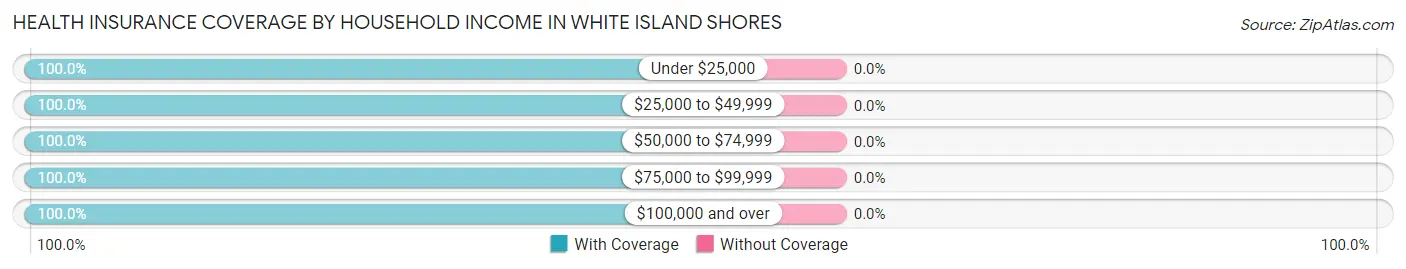
| Household Income | With Coverage | Without Coverage |
| Under $25,000 | 45 (100.0%) | 0 (0.0%) |
| $25,000 to $49,999 | 28 (100.0%) | 0 (0.0%) |
| $50,000 to $74,999 | 593 (100.0%) | 0 (0.0%) |
| $75,000 to $99,999 | 238 (100.0%) | 0 (0.0%) |
| $100,000 and over | 1,319 (100.0%) | 0 (0.0%) |
Public vs Private Health Insurance Coverage by Age in White Island Shores
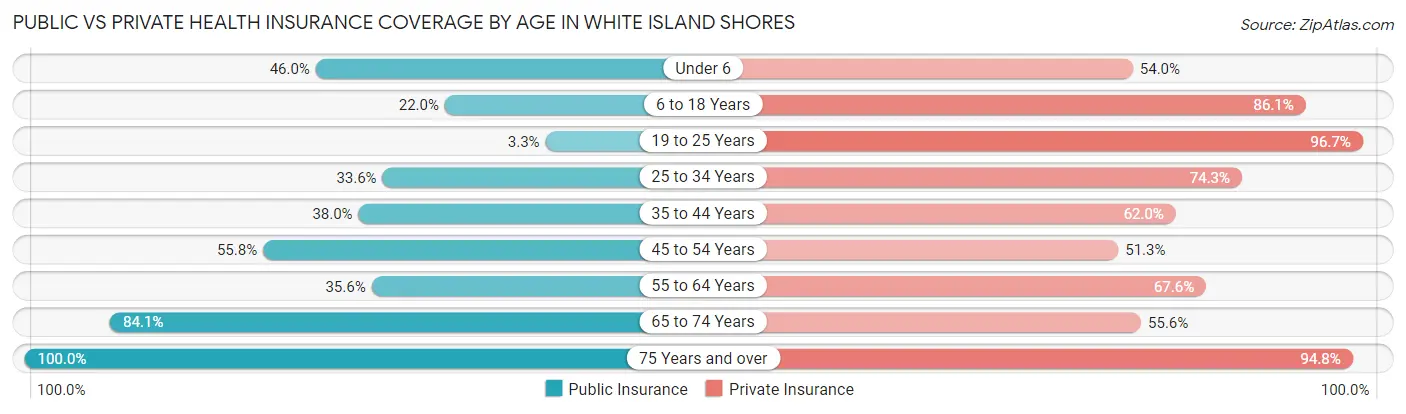
| Age Bracket | Public Insurance | Private Insurance |
| Under 6 | 57 (46.0%) | 67 (54.0%) |
| 6 to 18 Years | 68 (22.0%) | 266 (86.1%) |
| 19 to 25 Years | 8 (3.3%) | 232 (96.7%) |
| 25 to 34 Years | 90 (33.6%) | 199 (74.3%) |
| 35 to 44 Years | 81 (38.0%) | 132 (62.0%) |
| 45 to 54 Years | 189 (55.7%) | 174 (51.3%) |
| 55 to 64 Years | 167 (35.6%) | 317 (67.6%) |
| 65 to 74 Years | 106 (84.1%) | 70 (55.6%) |
| 75 Years and over | 135 (100.0%) | 128 (94.8%) |
| Total | 901 (40.5%) | 1,585 (71.3%) |
Disability Status by Sex by Age in White Island Shores
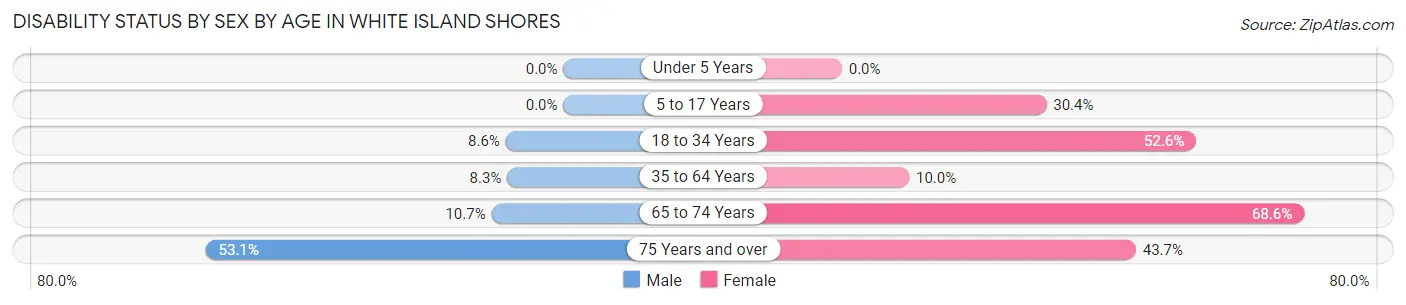
| Age Bracket | Male | Female |
| Under 5 Years | 0 (0.0%) | 0 (0.0%) |
| 5 to 17 Years | 0 (0.0%) | 68 (30.4%) |
| 18 to 34 Years | 22 (8.6%) | 132 (52.6%) |
| 35 to 64 Years | 45 (8.3%) | 48 (10.0%) |
| 65 to 74 Years | 8 (10.7%) | 35 (68.6%) |
| 75 Years and over | 34 (53.1%) | 31 (43.7%) |
Disability Class by Sex by Age in White Island Shores
Disability Class: Hearing Difficulty
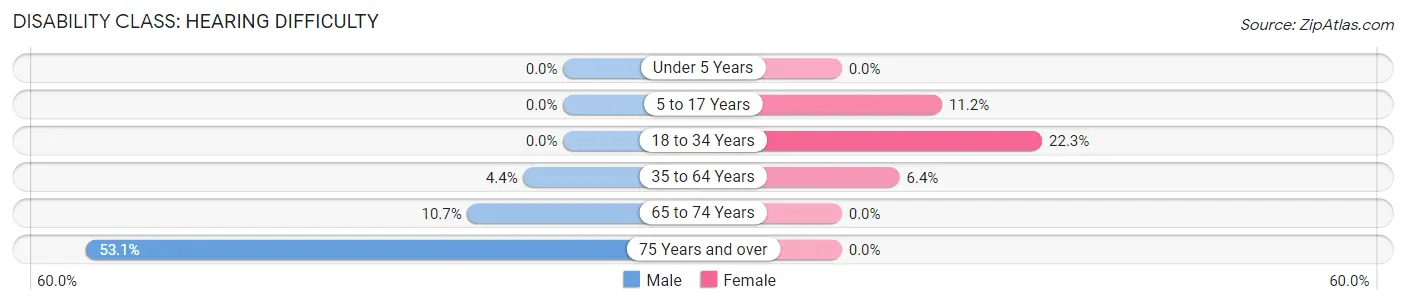
| Age Bracket | Male | Female |
| Under 5 Years | 0 (0.0%) | 0 (0.0%) |
| 5 to 17 Years | 0 (0.0%) | 25 (11.2%) |
| 18 to 34 Years | 0 (0.0%) | 56 (22.3%) |
| 35 to 64 Years | 24 (4.4%) | 31 (6.4%) |
| 65 to 74 Years | 8 (10.7%) | 0 (0.0%) |
| 75 Years and over | 34 (53.1%) | 0 (0.0%) |
Disability Class: Vision Difficulty
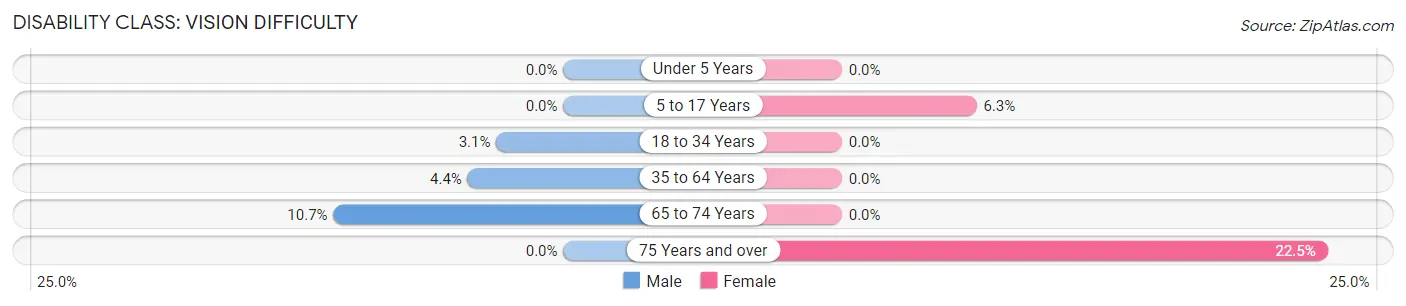
| Age Bracket | Male | Female |
| Under 5 Years | 0 (0.0%) | 0 (0.0%) |
| 5 to 17 Years | 0 (0.0%) | 14 (6.2%) |
| 18 to 34 Years | 8 (3.1%) | 0 (0.0%) |
| 35 to 64 Years | 24 (4.4%) | 0 (0.0%) |
| 65 to 74 Years | 8 (10.7%) | 0 (0.0%) |
| 75 Years and over | 0 (0.0%) | 16 (22.5%) |
Disability Class: Cognitive Difficulty
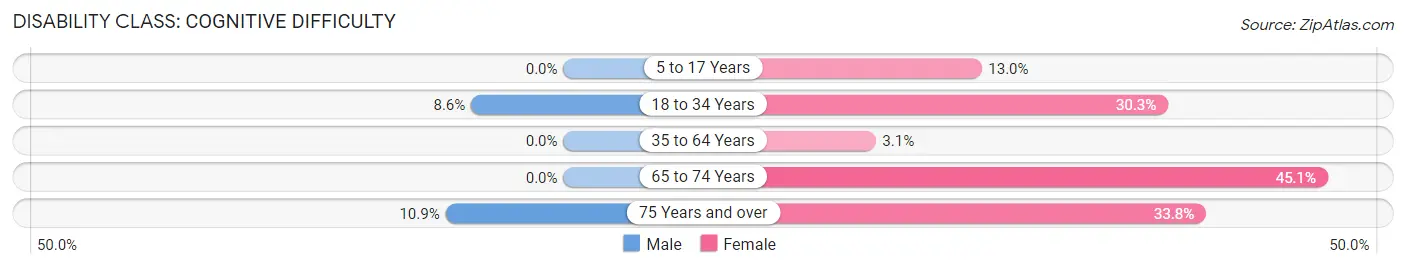
| Age Bracket | Male | Female |
| 5 to 17 Years | 0 (0.0%) | 29 (13.0%) |
| 18 to 34 Years | 22 (8.6%) | 76 (30.3%) |
| 35 to 64 Years | 0 (0.0%) | 15 (3.1%) |
| 65 to 74 Years | 0 (0.0%) | 23 (45.1%) |
| 75 Years and over | 7 (10.9%) | 24 (33.8%) |
Disability Class: Ambulatory Difficulty
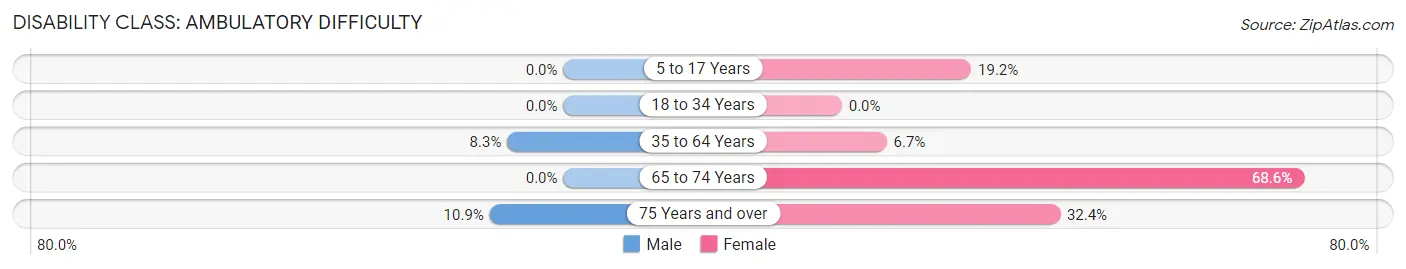
| Age Bracket | Male | Female |
| 5 to 17 Years | 0 (0.0%) | 43 (19.2%) |
| 18 to 34 Years | 0 (0.0%) | 0 (0.0%) |
| 35 to 64 Years | 45 (8.3%) | 32 (6.7%) |
| 65 to 74 Years | 0 (0.0%) | 35 (68.6%) |
| 75 Years and over | 7 (10.9%) | 23 (32.4%) |
Disability Class: Self-Care Difficulty
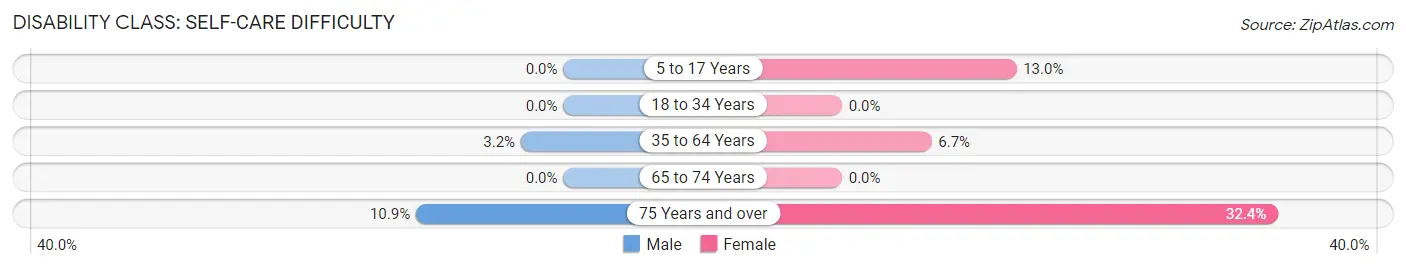
| Age Bracket | Male | Female |
| 5 to 17 Years | 0 (0.0%) | 29 (13.0%) |
| 18 to 34 Years | 0 (0.0%) | 0 (0.0%) |
| 35 to 64 Years | 17 (3.2%) | 32 (6.7%) |
| 65 to 74 Years | 0 (0.0%) | 0 (0.0%) |
| 75 Years and over | 7 (10.9%) | 23 (32.4%) |
Technology Access in White Island Shores
Computing Device Access in White Island Shores
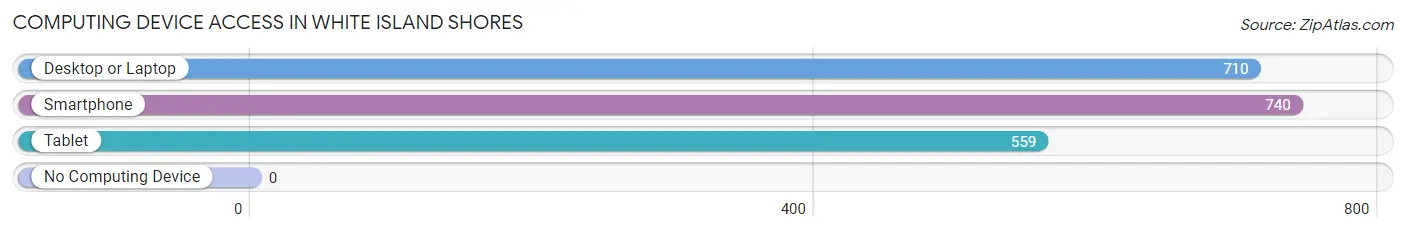
| Device Type | # Households | % Households |
| Desktop or Laptop | 710 | 92.9% |
| Smartphone | 740 | 96.9% |
| Tablet | 559 | 73.2% |
| No Computing Device | 0 | 0.0% |
| Total | 764 | 100.0% |
Internet Access in White Island Shores
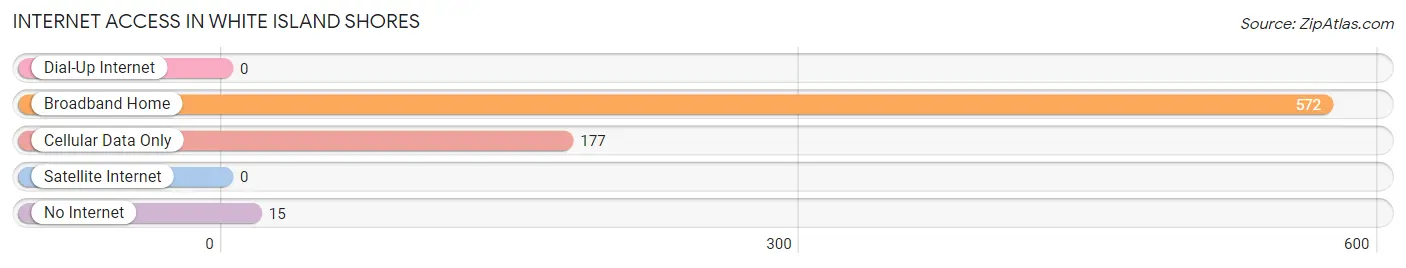
| Internet Type | # Households | % Households |
| Dial-Up Internet | 0 | 0.0% |
| Broadband Home | 572 | 74.9% |
| Cellular Data Only | 177 | 23.2% |
| Satellite Internet | 0 | 0.0% |
| No Internet | 15 | 2.0% |
| Total | 764 | 100.0% |
White Island Shores Summary
White Island Shores is a small town located in the state of Massachusetts, United States. It is situated on the south shore of Cape Cod, approximately 40 miles south of Boston. The town has a population of approximately 1,500 people and is a popular tourist destination due to its beautiful beaches and quaint atmosphere.
History
White Island Shores was first settled in the early 1700s by English settlers. The town was originally known as “White Island” due to the white sand beaches that line the shore. The town was officially incorporated in 1790 and was named after the white sand beaches.
In the late 1800s, the town began to attract tourists due to its beautiful beaches and quaint atmosphere. The town was also known for its fishing industry, which provided a livelihood for many of the town’s residents.
In the early 1900s, the town began to experience a decline in its fishing industry due to overfishing and pollution. This led to a decrease in the town’s population and economy. However, the town was able to rebound in the mid-1900s due to the influx of tourists.
Geography
White Island Shores is located on the south shore of Cape Cod, approximately 40 miles south of Boston. The town is bordered by the towns of Barnstable, Yarmouth, and Dennis. The town is situated on a peninsula, with the Atlantic Ocean to the east and Nantucket Sound to the west.
The town has a total area of 4.2 square miles, of which 0.2 square miles is water. The town is home to several beaches, including White Island Beach, Nantucket Beach, and South Beach.
Economy
The economy of White Island Shores is largely driven by tourism. The town is home to several hotels, restaurants, and shops that cater to tourists. The town also has a thriving fishing industry, which provides a livelihood for many of the town’s residents.
Demographics
As of the 2010 census, the population of White Island Shores was 1,500. The town has a median household income of $50,000 and a median home value of $400,000. The town is predominantly white (94.7%) and the majority of the population is over the age of 65 (44.7%).
Conclusion
White Island Shores is a small town located in the state of Massachusetts, United States. It is situated on the south shore of Cape Cod, approximately 40 miles south of Boston. The town has a population of approximately 1,500 people and is a popular tourist destination due to its beautiful beaches and quaint atmosphere. The economy of White Island Shores is largely driven by tourism and the town also has a thriving fishing industry. The town is predominantly white and the majority of the population is over the age of 65.
Common Questions
What is Per Capita Income in White Island Shores?
Per Capita income in White Island Shores is $38,069.
What is the Median Family Income in White Island Shores?
Median Family Income in White Island Shores is $94,167.
What is the Median Household income in White Island Shores?
Median Household Income in White Island Shores is $103,372.
What is Inequality or Gini Index in White Island Shores?
Inequality or Gini Index in White Island Shores is 0.26.
What is the Total Population of White Island Shores?
Total Population of White Island Shores is 2,223.
What is the Total Male Population of White Island Shores?
Total Male Population of White Island Shores is 1,119.
What is the Total Female Population of White Island Shores?
Total Female Population of White Island Shores is 1,104.
What is the Ratio of Males per 100 Females in White Island Shores?
There are 101.36 Males per 100 Females in White Island Shores.
What is the Ratio of Females per 100 Males in White Island Shores?
There are 98.66 Females per 100 Males in White Island Shores.
What is the Median Population Age in White Island Shores?
Median Population Age in White Island Shores is 39.3 Years.
What is the Average Family Size in White Island Shores
Average Family Size in White Island Shores is 3.2 People.
What is the Average Household Size in White Island Shores
Average Household Size in White Island Shores is 2.9 People.
How Large is the Labor Force in White Island Shores?
There are 1,184 People in the Labor Forcein in White Island Shores.
What is the Percentage of People in the Labor Force in White Island Shores?
64.8% of People are in the Labor Force in White Island Shores.
What is the Unemployment Rate in White Island Shores?
Unemployment Rate in White Island Shores is 5.4%.